
ROI Analysis for Test Coverage Using NCover White Paper
13
ROI Analysis for Test Coverage Using NCover NCover P.O. Box 9298 Greenville, SC 29601 T 864.990.3717 F 864.341.8312 [email protected] www.ncover.com NCOVER
Transcript of ROI Analysis for Test Coverage Using NCover White Paper

ROI Analysis for Test Coverage Using NCover
NCover P.O. Box 9298 Greenville, SC 29601 T 864.990.3717 F 864.341.8312 [email protected] www.ncover.com
NCOVER

Table of Contents
Executive Summary 2
Cost Analysis 4Section 1: Direct Acquisition Costs 4
Section 2: Indirect Acquisition Cost 4
Section 3: Direct Operating Costs 5
Section 4: Indirect Operating Costs 5
Benefit Analysis 6Section 5: Direct External Benefits 6
Section 6: Indirect External Benefits 6
Section 7: Direct Internal Benefits 6
Software Defects 7
Sales and Marketing 8
Developer Productivity 8
Project Success 9
Profit 10
Section 8: Indirect Internal Benefits 10
Performance Visibility and Risk Management 10
Continuous Improvement 11
Project Control 11
NCover
ROI Analysis for Test Coverage Using NCover 1

Executive Summary
Code quality is a critical success factor for any organization that relies on software development as a strategic driver of competitive advantage, and sustained profitability, and risk management. Code coverage analysis, which indicates sections of code that have been tested by the developer, provides objective measurements that can increase the overall quality of software produced and in turn reduce cost and risk while also increasing productivity and profit. Code coverage tools provide valuable and immediate feedback to developers and project managers, allowing them to improve code quality within necessary time and cost constraints.
Often a code coverage percentage is viewed as “just a number,” but this limited perspective ignores the breadth and depth of benefits that thorough code quality management can provide to the cost aware, risk averse organization. NCover delivers a holistic enterprise solution that allows an organization to turn its business goals into performance metrics and support application lifecycle management initiatives. NCover then empowers development and quality assurance teams to quickly and effectively improve their code to consistently deliver higher quality software and meet the defined business objectives.
This report is intended to help key stakeholders review and assess the potential net impact from an NCover deployment from the team level through the entire development organization. To fully assess possible ROI outcomes, both indirect and direct costs associated with the acquisition and operation of NCover are included and help provide a view of the total cost of ownership. Just as important, both indirect and direct benefits for external and internal stakeholders are included. Together, the costs and benefits reviewed provide a foundation for NCover implementation decisions.
The end result of this analysis is that the NCover code coverage platform provides a very high ROI using even conservative estimates.
NCover Return on InvestmentNCover Return on InvestmentNCover Return on InvestmentNCover Return on InvestmentNCover Return on InvestmentNCover Return on InvestmentNCover Return on InvestmentNCover Return on InvestmentNCover Return on Investment
ConservativeConservative RealisticRealistic AggressiveAggressive
1 Year 3 Years 1 Year 3 Years 1 Year 3 Years
License and Training ($1,378) ($1,736) ($1,378) ($1,736) ($1,378) ($1,736)
Bad Check-in Savings $2,640 $7,920 $7,920 $23,760 $13,200 $39,600
Bug Find Savings $600 $1,800 $6,000 $18,000 $30,000 $90,000
Savings per License $1,862 $7,984 $12,542 $40,024 $41,822 $127,864
ROI 135.1% 459.9% 910.2% 2,305.5% 3,035% 7,365.4%
Payback Period in Months 8.88 2.61 1.32 0.52 0.4 0.16
NCover
ROI Analysis for Test Coverage Using NCover 2

The structure of the report can be seen in the matrix below as it maps the basic costs and benefits used to determine ROI. The report follows a logical flow starting with costs and then moving to benefits. Use this symbol as a reference for each cost and benefit component to help you understand the context for the analysis.
CostsCostsDirect Indirect
Acquisition.. Licensing per user or build machine
See Section 1 below
Time impact from: • Procurement • Licensing • Installation • Integration • Training
See Section 2 below
Operations.. Subscription per developer: • 8x5 support • Incremental upgrades • Next version
See Section 3 below
Time impact from: • Running NCover • Adjusting tests
See Section 4 below
BenefitsBenefitsDirect Indirect
External.. Customer impact: • Reduce failed interactions
See Section 5 below
Customer Impact: • Improved customer satisfaction • Improved customer retention
See Section 6 below
Internal.. Subscription per developer: • Priority support • Incremental upgrades • Next version
See Section 7 below
Increase: •Performance visibility • Project risk visibility • Communication among team • Control
See Section 8 below
NCover
ROI Analysis for Test Coverage Using NCover 3
cost
benefit

Cost Analysis
Section 1: Direct Acquisition CostsNCover Complete $479
Licensing costs are the only direct acquisition costs of NCover. NCover is licensed per user. This could be a developer, tester, or manager. Additionally, each build server or virtual machine requires a separate license. Combined together, these desktop and server installations are the foundation of the NCover platform and drive significant ROI.
Besides the cost of the software, an organization can expect to incur indirect costs associated with acquisition, set up and training. While these costs may not be immediately apparent, they should be factored into a robust return-on-investment analysis.
Section 2: Indirect Acquisition CostIndirect costs of acquisition come from time spent on procurement, installation, integration, configuration, and training. While NCover can be easily deployed and training (if needed) can be delivered via customized web training modules, ultimately these costs are all determined by the client’s specific needs and goals. As the client deploys efficient lifecycle processes, the NCover team works closely with team members to ensure fast, effective, and sustainable adoption of the NCover Complete test coverage platform.
The table provides an estimate of the indirect acquisition costs per developer using basic assumptions about the hourly rate of a developer and excessive estimates for training and set up. The training and set up times listed below are high in order to help define a maximum cost level estimate for the indirect acquisition costs per user. Actual time required is typically much less.
Training & Setup CostTraining & Setup Cost
Average hourly rate per developer (fully loaded) $60
Average number of hours training developers on product 8
Total Training Cost/Developer $480
Average number of hours setting up each license 4
Total Cost per License set up $240
Training & Setup Cost $720
NCover
ROI Analysis for Test Coverage Using NCover 4
cost
benefit
cost
benefit
Section 3: Direct Operating CostsNCover Complete Subscription $179
The direct operating costs related to NCover come simply from the ongoing Subscription costs. Subscriptions are purchased in 1 year increments per user or per machine. Subscriptions include NCover business hours support, bug fixes, all minor version updates, as well as the next major version release (i.e. version 3 to version 4).
Section 4: Indirect Operating CostsOrganizations often overlook the time required to actually use newly deployed software and how that may impact their overall development efficiency. Time is spent running NCover, identifying code risks, prioritizing code risks, writing new unit tests, and then running the new tests with NCover again to review progress. While this iterative process does take time, NCover has been optimized to make finding problems and prioritizing work fast and effective. These time costs are significantly outweighed by the benefits of finding bugs earlier and faster at the desktop level, as explained below in Section 7- Direct Internal Benefits. In addition, the immediate feedback at the desktop level allows the developer to quickly see their own code writing and testing skills and thus improve future performance, reducing indirect operating costs over time.
NCover
ROI Analysis for Test Coverage Using NCover 5
cost
benefit
cost
benefit

Benefit Analysis
Section 5: Direct External BenefitsThe primary goal of code coverage is to reduce failed customer interactions (FCIs) when a customer encounters a “bug” in your software. Reducing these software defects translates into a direct benefit for your customers.
While FCIs have different values for different organizations, FCIs pose one of the largest risks to organizational success. External (and internal) customers demand a flawless experience with your software. Your software represents your company. This is especially important in industry sectors such a banking, health care, and government contracting that rely on the stability of mission critical systems to deliver their primary customer value. In a typical scenario, unanticipated problems balloon into consequential outcomes where revenues from a potential or existing customer is not captured or costs exceed budget.
NCover provides metrics to help reduce losses from failed customer interactions by helping teams identify and correct problematic code early in the development lifecycle. When deployed as a holistic solution, NCover has a significant impact on mitigating such risk. By allowing development teams to visually analyze code covered by tests and in turn improve tests to further reduce the risk of bugs, NCover is the key tool needed to mitigate negative customer interactions from software defects. Ongoing trend analysis and historical metrics provide guidelines for improving code quality even further.
Section 6: Indirect External BenefitsImproving software quality and reducing failed customer interactions may directly affect a specific transaction, but these improvements provide important long term benefits. FCIs damage both community trust and business development budgeting. Usually additional marketing and sales dollars are needed to encourage customer re-engagement. It makes sound financial sense for an organization to implement smart solutions to mitigate this risk. Reducing FCIs by catching bugs before they are exposed to prospects or existing customers improves customer satisfaction, retention, brand, and competitive position, which lowers sales and marketing costs as noted in the next section. These factors may be difficult to quantify but nonetheless represent critical indirect benefits. As such, these key business factors have different values for different organizations.
Section 7: Direct Internal BenefitsWhile the reduction of bugs reduces FCIs and improves customer retention and satisfaction, the most significant and quantifiable benefits of using NCover are realized internally by the organization using NCover. The direct internal benefits areas noted here are:
NCover
ROI Analysis for Test Coverage Using NCover 6
cost
benefit
cost
benefit
cost
benefit
• Reduced costs from fixing software defects
• Reduced costs from sales and marketing
• Increased developer productivity
• Increased project success
• Increased profit
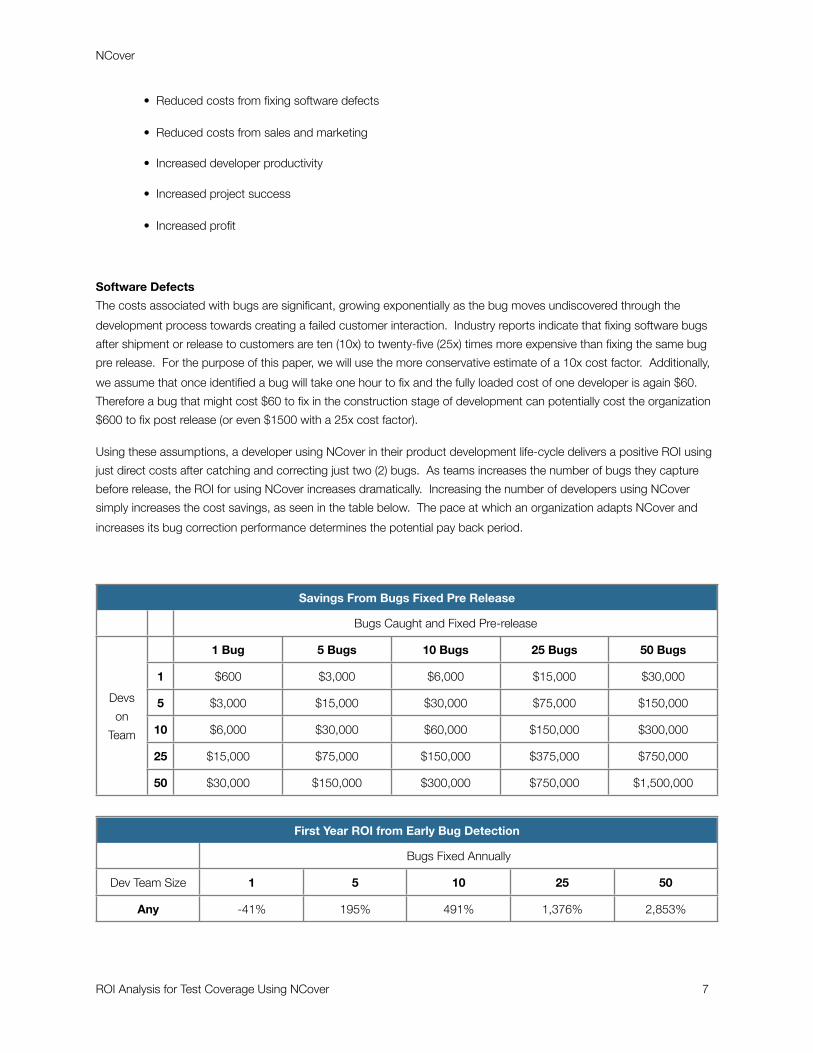
Software DefectsThe costs associated with bugs are significant, growing exponentially as the bug moves undiscovered through the development process towards creating a failed customer interaction. Industry reports indicate that fixing software bugs after shipment or release to customers are ten (10x) to twenty-five (25x) times more expensive than fixing the same bug pre release. For the purpose of this paper, we will use the more conservative estimate of a 10x cost factor. Additionally, we assume that once identified a bug will take one hour to fix and the fully loaded cost of one developer is again $60. Therefore a bug that might cost $60 to fix in the construction stage of development can potentially cost the organization $600 to fix post release (or even $1500 with a 25x cost factor).
Using these assumptions, a developer using NCover in their product development life-cycle delivers a positive ROI using just direct costs after catching and correcting just two (2) bugs. As teams increases the number of bugs they capture before release, the ROI for using NCover increases dramatically. Increasing the number of developers using NCover simply increases the cost savings, as seen in the table below. The pace at which an organization adapts NCover and increases its bug correction performance determines the potential pay back period.
Savings From Bugs Fixed Pre ReleaseSavings From Bugs Fixed Pre ReleaseSavings From Bugs Fixed Pre ReleaseSavings From Bugs Fixed Pre ReleaseSavings From Bugs Fixed Pre ReleaseSavings From Bugs Fixed Pre ReleaseSavings From Bugs Fixed Pre Release
Bugs Caught and Fixed Pre-releaseBugs Caught and Fixed Pre-releaseBugs Caught and Fixed Pre-releaseBugs Caught and Fixed Pre-releaseBugs Caught and Fixed Pre-release
Devs on
Team
1 Bug 5 Bugs 10 Bugs 25 Bugs 50 Bugs
Devs on
Team
1 $600 $3,000 $6,000 $15,000 $30,000Devs on
Team
5 $3,000 $15,000 $30,000 $75,000 $150,000Devs on
Team 10 $6,000 $30,000 $60,000 $150,000 $300,000
Devs on
Team25 $15,000 $75,000 $150,000 $375,000 $750,000
Devs on
Team
50 $30,000 $150,000 $300,000 $750,000 $1,500,000
First Year ROI from Early Bug DetectionFirst Year ROI from Early Bug DetectionFirst Year ROI from Early Bug DetectionFirst Year ROI from Early Bug DetectionFirst Year ROI from Early Bug DetectionFirst Year ROI from Early Bug Detection
Bugs Fixed AnnuallyBugs Fixed AnnuallyBugs Fixed AnnuallyBugs Fixed AnnuallyBugs Fixed Annually
Dev Team Size 1 5 10 25 50
Any -41% 195% 491% 1,376% 2,853%
NCover
ROI Analysis for Test Coverage Using NCover 7

Sales and MarketingAs noted in the previous section, reducing FCIs by catching bugs before they are visible to prospects or customers improves customer satisfaction, retention, brand, and competitive position. Improving these indirect external factors in turn may lower sales and marketing costs and thus improve profitability per customer.
Developer ProductivityBeyond the reductions in bug fix costs and customer retention costs, NCover enabled organizations can expect to see a significant increase in developer productivity. This is where NCover adds the most value to teams that implement code coverage strategies. We review three main areas of developer productivity.
First, the development teams using continuous integration and NCover on the desktop will reduce time lost as teams wait for corrections to the build for bad code check-ins. Each member of the team runs tests and coverage analysis on their desktop prior to submitting their code for integration. Additionally, NCover provides multiple adjustable thresholds, which can represent 1) minimum quality levels to pass a build and 2) target quality levels to achieve specific enterprise business goals. These sliding-scale thresholds give software architects and team leaders a vehicle to communicate enterprise metrics objectives directly to the developer’s desktop.
Annual Cost of Broken BuildsAnnual Cost of Broken BuildsAnnual Cost of Broken BuildsAnnual Cost of Broken BuildsAnnual Cost of Broken BuildsAnnual Cost of Broken BuildsAnnual Cost of Broken Builds
Minutes Lost per Day on Broken BuildsMinutes Lost per Day on Broken BuildsMinutes Lost per Day on Broken BuildsMinutes Lost per Day on Broken BuildsMinutes Lost per Day on Broken Builds
Devs on
Team
10 min 20 min 30 min 40 min 50 min
Devs on
Team
1 $2,640 $5,280 $7,920 $10,560 $13,200Devs on
Team
5 $13,200 $26,400 $39,600 $52,800 $66,000Devs on
Team 10 $26,400 $52,800 $79,200 $105,600 $132,000
Devs on
Team25 $66,000 $132,000 $198,000 $264,000 $330,000
Devs on
Team
50 $132,000 $264,000 $396,000 $528,000 $660,000
Annual ROI from Build Wait ReductionsAnnual ROI from Build Wait ReductionsAnnual ROI from Build Wait ReductionsAnnual ROI from Build Wait ReductionsAnnual ROI from Build Wait ReductionsAnnual ROI from Build Wait Reductions
Minutes Lost per Day on Broken BuildsMinutes Lost per Day on Broken BuildsMinutes Lost per Day on Broken BuildsMinutes Lost per Day on Broken BuildsMinutes Lost per Day on Broken Builds
Dev Team Size 10 min 20 min 30 min 40 min 50 min
Any 160% 420% 680% 939% 1,199%
In addition to reducing extra waits to repair broken builds, the second component of developer productivity comes from the instant feedback the developer receives from NC on the desktop. This aspect of NCover’s benefits is subtle but very powerful, and shows why viewing code coverage as “just a number” misses major opportunities for improving each developer’s productivity and quality of output.
Recent research from Microsoft Labs explains that code coverage utilized simply as ratio may be misleading if not altogether confusing. Further, the results of their ongoing research point to the need for contextual complexity scoring of source code alongside raw coverage metrics. This is exactly the additional context that NCover provides.
NCover
ROI Analysis for Test Coverage Using NCover 8
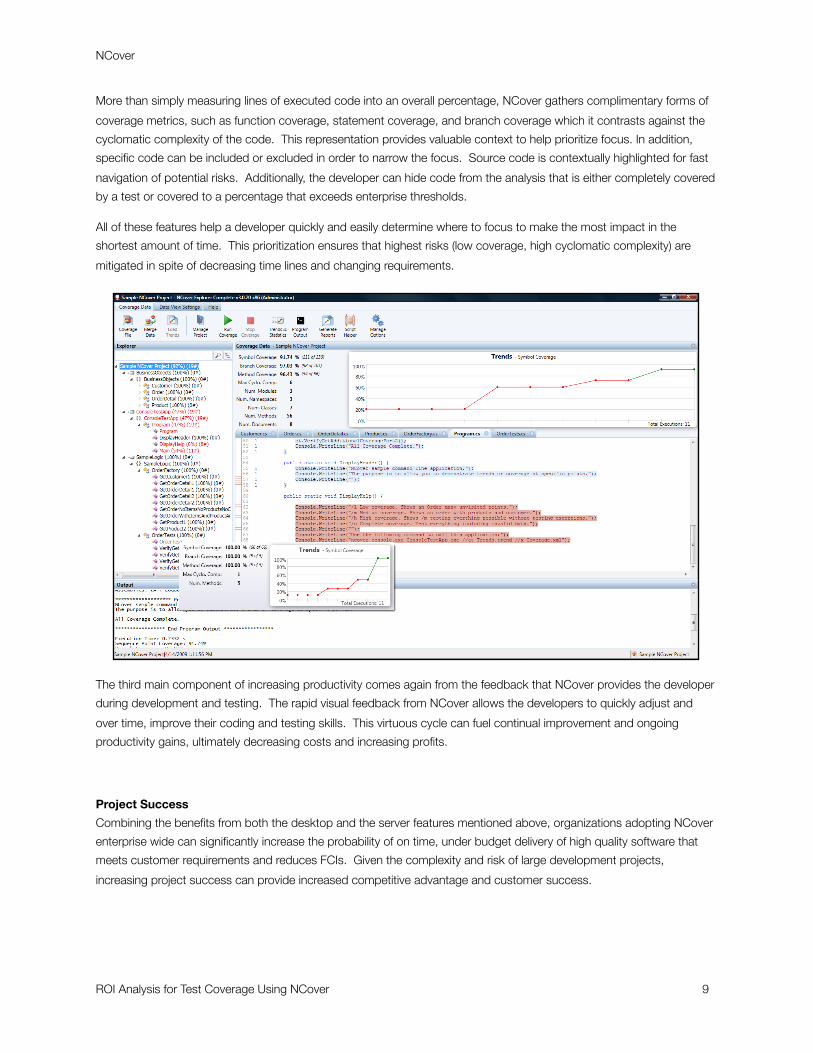
More than simply measuring lines of executed code into an overall percentage, NCover gathers complimentary forms of coverage metrics, such as function coverage, statement coverage, and branch coverage which it contrasts against the cyclomatic complexity of the code. This representation provides valuable context to help prioritize focus. In addition, specific code can be included or excluded in order to narrow the focus. Source code is contextually highlighted for fast navigation of potential risks. Additionally, the developer can hide code from the analysis that is either completely covered by a test or covered to a percentage that exceeds enterprise thresholds.
All of these features help a developer quickly and easily determine where to focus to make the most impact in the shortest amount of time. This prioritization ensures that highest risks (low coverage, high cyclomatic complexity) are mitigated in spite of decreasing time lines and changing requirements.
The third main component of increasing productivity comes again from the feedback that NCover provides the developer during development and testing. The rapid visual feedback from NCover allows the developers to quickly adjust and over time, improve their coding and testing skills. This virtuous cycle can fuel continual improvement and ongoing productivity gains, ultimately decreasing costs and increasing profits.
Project SuccessCombining the benefits from both the desktop and the server features mentioned above, organizations adopting NCover enterprise wide can significantly increase the probability of on time, under budget delivery of high quality software that meets customer requirements and reduces FCIs. Given the complexity and risk of large development projects, increasing project success can provide increased competitive advantage and customer success.
NCover
ROI Analysis for Test Coverage Using NCover 9

ProfitAll businesses must manage revenues and expenses to maintain and increase profit where possible. Shareholders demand nothing less. Profit maximization should be the ultimate benchmark of any tool deployed enterprise wide. NCover increases help organizations increase revenue while reducing costs. NCover’s ability to help reduce FCIs, increase customer satisfaction, retention, and brand loyalty all help increase revenue. On the cost side, NCover helps reduce the huge costs of fixing software bugs after release, in addition to helping reduce the cost of sales and marketing from improved customer experiences, while increasing developer productivity. Together these benefits provide greater project and company profitability.
Section 8: Indirect Internal BenefitsWhile the direct internal benefits at the developer or server level may be easier to quantify, indirect benefits, despite being more difficult to quantify, are arguably the most important building blocks needed to create and sustain a lasting competitive advantage. While many smart organizations seek increased project visibility, risk reduction, enhanced communication among teams, and continuous improvement, many struggle to find tools and processes that actually help. NCover goes beyond developer level coverage analysis to provide detailed reporting that integrates all test coverage aspects of a project into a holistic view that empowers top level executives to monitor and manage multiple aspects of development performance. With the ability to fine tune coverage goals, executives can also translate business objectives into performance metrics and drive ongoing quality improvements.
Performance Visibility and Risk ManagementNCover has redefined code coverage to introduce the power of test coverage analysis as a pointedly holistic process. This allows an organization to benefit from added insight into overall development efficiencies that generally are not available in current environments. From an operational perspective, this facilitates better planning and process prediction, which typically translates into unique cost savings.
NCover provides analysis of the entire application development lifecycle – from development, through the build process, to quality assurance. Single developer unit test coverage data can be assimilated across multiple teams, projects, or divisions in an almost unlimited number of options.
In many organizations, data is usually segmented and comprehensive analysis is painful or impossible to access. NCover’s easy access to configurable data streams fills a gap in the current development lifecycle. Instead of waiting until a problem has cost the organization a significant productivity delay, NCover provides ongoing trend analysis and assimilates valuable data together that allows problems to be fixed before significant loss can occur.
Working simultaneous to the development process, software testers can measure test coverage for all of their different test workflows – even across purposes and testing types. This means that general regression, functional, data-driven or integration tests can be assimilated together with more targeted user-acceptance and security test coverage analytics. Since test coverage density is a powerful risk mitigation metric, the reports NCover presents contribute considerably to bottom-line improvements throughout the organization.
NCover also allows complimentary development and quality assurance test data to be merged together at any point in the development lifecycle. Not only does this provide a superior view of overall solution testing and increase communication between teams, it also helps define the reality of the organization’s current quality risks.
NCover
ROI Analysis for Test Coverage Using NCover 10
cost
benefit

Given this reporting capability, NCover uniquely provides enhanced risk management for .NET software development across an enterprise. With the ability to assimilate data across multiple projects, division, and job role, NCover ties together the development and quality assurance roles at the desktop level with continuous integration metrics at the server level. By integrating reports, project managers can identify and respond to problem areas before they become major liabilities. The financial return-on-investment of a holistic implementation should not be under valued. Potential gaps in risk evaluation are significantly reduced by wrapping the entire application development process with NCover code coverage. Two of the many reports available are shown below.
Continuous ImprovementNCover enhances the entire application development lifecycle without introducing processes that disrupt established efficiencies. Since NCover already works with the .NET tools you currently use, there is no need to introduce dramatic changes to existing processes. This is especially important as enterprise deployments introduce the risk of potential delay to existing time lines. By simply monitoring and improving existing tools, NCover allows an organization to realize all the rewards of higher quality software while minimizing potential impact on process efficiencies.
Multiple comprehensive studies into benchmarking all indicate that an organization gains significant benefit from measuring and improving performance. While most organizations aspire to such continuous improvement, they lack the clear metrics and holistic analysis to create a credible benchmark from which to gauge and focus their improvement.
NCover provides both the initial benchmark analysis and the ongoing trend data to actually make process improvement a possibility. Through an almost unlimited configuration of data mining, joining, and reporting, NCover brings significant insight to every level of the software development process.
A significant part of benchmarking and process improvement is the idea of building a holistic framework to achieve comprehensive risk management structure. Managing risk effectively demands that current risk be clearly understood. NCover not only provides that clarity, but it effectively exposes potential roadblocks to ongoing transparency.
Project ControlBy increasing performance visibility and risk management, promoting communication among teams, and providing metrics for continuous improvement, NCover increases project control and ultimately project success.
NCover
ROI Analysis for Test Coverage Using NCover 11

Summary: Putting it All Together
Organizations considering an enterprise wide deployment of NCover don’t need specific numbers in all categories to confirm that NCover provides a significant ROI. In fact, a significant ROI can be recognized by the organization without knowing the value the client places on failed customer interactions, increasing customer satisfaction and retention, or the value placed on strategic levers such as increased project visibility and control, increased communication among teams, or establishing competitive differentiation through higher quality customer experiences.
The table below aggregates the low, middle, and high values provided previously in the report to show ROI and payback estimates for one and three year time horizons. The three year values include two additional years of subscription costs along with an additional two years of time to recognize the return on the investment.
The ROI numbers – excluding the large indirect net benefits and using conservative estimates -- overwhelmingly indicate that code coverage analysis using NCover provides tangible bottom line value while risk.
NCover Return on InvestmentNCover Return on InvestmentNCover Return on InvestmentNCover Return on InvestmentNCover Return on InvestmentNCover Return on InvestmentNCover Return on InvestmentNCover Return on InvestmentNCover Return on Investment
ConservativeConservative RealisticRealistic AggressiveAggressive
1 Year 3 Years 1 Year 3 Years 1 Year 3 Years
License and Training ($1,378) ($1,736) ($1,378) ($1,736) ($1,378) ($1,736)
Bad Check-in Savings $2,640 $7,920 $7,920 $23,760 $13,200 $39,600
Bug Find Savings $600 $1,800 $6,000 $18,000 $30,000 $90,000
Savings per License $1,862 $7,984 $12,542 $40,024 $41,822 $127,864
ROI 135.1% 459.9% 910.2% 2,305.5% 3,035% 7,365.4%
Payback Period in Months 8.88 2.61 1.32 0.52 0.4 0.16
NCover
ROI Analysis for Test Coverage Using NCover 12


![[INFOGRAPHIC] ROI](https://static.fdocuments.us/doc/165x107/5400af278d7f728b408b49aa/infographic-roi.jpg)


