Rofin-Sinar · Price / Book: 1.5 x 79 % Coherent plans to take over Rofin-Sinar We downgrade...
12
Rofin-Sinar (CDAX, Technology) C OMMENT Published 21.03.2016 1 Analyst Eggert Kuls [email protected] +49 40 309537 - 256 Value Indicators: EUR Share data: Description: DCF: 24.00 FCF-Value Potential 17e: 27.90 Bloomberg: RSI GR Reuters: RSTI ISIN: US7750431022 Rofin-Sinar is one of two world- leading manufacturers of industrial laser equipment Market Snapshot: EUR m Shareholders: Risk Profile (WRe): 2015/16e Hold (Buy) EUR 25.90 Price EUR 27.75 Downside -6.7 % Market cap: 791 No. of shares (m): 29 EV: 646 Freefloat MC: 791 Ø Trad. Vol. (30d): 14.80 m Freefloat 100.0 % Beta: 1.1 Price / Book: 1.5 x Equity Ratio: 79 % Coherent plans to take over Rofin-Sinar We downgrade Rofin-Sinar from Buy to Hold as the share price has exceeded our target price following the announcement that Coherent has entered into an agreement to acquire Rofin-Sinar in an all-cash transaction worth USD 942m or USD 32.50 per share which is equivalent to a premium of 42% to the closing price on the day before the announcement. The transaction is expected to be closed within six to nine months, subject to the approval of Rofin-Sinar shareholders, regulatory bodies etc. Rofin`s board of directors is supporting the intended takeover. We think the transaction makes sense for Coherent when looking at defined potential synergies of USD 30m p.a. (some 2% of combined turnover) and the access to Rofin`s new developments in the fields of high-power fibre and ultra-short pulse laser. Furthermore, Rofin had cash on hand of USD 177m as of the end of December 2015. For Rofin-Sinar shareholders our recommendation is to hold rather than sell the shares as the current share price in USD is some 3.5% below the intended bid of USD 32.50 which is expected to be paid by the end of this year at latest. Due to strong competition in the industrial laser sector we do not expect cartel authorities to express concern. However, Rofin-Sinar and Coherent are competing in several fields of activity such as laser for material processing and for microelectronics. In contrast, we see no overlap in the scientific business which is run by Coherent. In the fast-growing fibre laser segment, IPG Photonics is the dominant player and even a combination of Rofin and Coherent in this field would be much smaller. Hence, there could be some antitrust conditions but we do not expect the deal to be prohibited as a whole. Activist shareholder SilverArrow acquired a share of more than 9% in Rofin-Sinar last year and intended to increase its stake to some 15%. SilverArrow aims to bring three people to Rofin`s board of directors in order to improve the company`s performance going forward. Rofin-Sinar however has said that only one of the proposed persons is qualified to enter Rofin`s board and to help develop the business. Elections would have taken place at the AGM on March, 17. However, following the Coherent announcement, Rofin-Sinar has postponed its AGM in order to combine the AGM with the special shareholders meeting to approve the proposed combination with Coherent. No new date has been set so far. Also, SilverArrow has not yet made a statement on whether it welcomes the agreement with Coherent or not. Rofins`s share price was under strong pressure over the last months following weak order intake and a lowering of FY guidance. However, the outlook is more promising due to new product developments in the fields of high-power fibre und ultra-short pulse laser which are expected to contribute to a better H2. Nevertheless, due to the weak start to fiscal 2015/16 we were expecting the company to only meet the lower end of its guidance range. Rel. Performance vs CDAX: 1 month: 34.3 % 6 months: 21.0 % Year to date: 19.8 % Trailing 12 months: 40.7 % Company events: 05.05.16 Q2 04.08.16 Q3 10.11.16 Prel. FY 2015/16 29.11.16 FY 2015/16 FY End: 30.9. in USD m CAGR (14/15-17/18e) 2011/12 2012/13 2013/14 2014/15 2015/16e 2016/17e 2017/18e Sales 0.6 % 540 560 530 520 499 514 529 Change Sales yoy -9.6 % 3.7 % -5.3 % -2.0 % -4.0 % 3.0 % 3.0 % Gross profit margin 36.4 % 35.1 % 35.6 % 37.8 % 38.1 % 38.6 % 39.1 % EBITDA 4.1 % 64 67 54 75 75 80 85 Margin 11.9 % 12.0 % 10.2 % 14.5 % 15.0 % 15.5 % 16.0 % EBIT 5.3 % 50 49 34 56 56 60 65 Margin 9.3 % 8.8 % 6.4 % 10.8 % 11.2 % 11.8 % 12.3 % Net income 5.6 % 35 35 25 41 39 45 49 EPS 5.3 % 1.20 1.22 0.89 1.46 1.36 1.58 1.70 EPS adj. 5.3 % 1.20 1.22 0.89 1.46 1.36 1.58 1.70 DPS - 0.00 0.00 0.00 0.00 0.00 0.00 0.00 Dividend Yield n.a. n.a. n.a. n.a. n.a. n.a. n.a. FCFPS -0.62 1.47 0.40 1.47 1.14 0.97 1.07 FCF / Market cap -0.8 % 6.0 % 3.7 % 4.7 % 3.6 % 3.1 % 3.4 % EV / Sales 1.1 x 1.1 x 1.1 x 1.2 x 1.5 x 1.4 x 1.3 x EV / EBITDA 9.2 x 8.8 x 10.6 x 8.0 x 9.8 x 8.8 x 7.9 x EV / EBIT 11.7 x 12.0 x 16.9 x 10.7 x 13.1 x 11.6 x 10.3 x P / E 18.8 x 19.5 x 26.8 x 17.7 x 23.1 x 19.8 x 18.4 x P / E adj. 18.8 x 19.5 x 26.8 x 17.7 x 23.1 x 19.8 x 18.4 x FCF Yield Potential 6.0 % 6.6 % 5.6 % 7.9 % 6.2 % 7.3 % 8.2 % Net Debt -58 -94 -101 -134 -168 -198 -230 ROCE (NOPAT) 8.1 % 7.8 % 5.2 % 9.4 % 9.6 % 10.1 % 10.6 % Guidance: 2015/16: Sales USD 495-525m, Net-margin 8% at mid-point of sales guidance
Transcript of Rofin-Sinar · Price / Book: 1.5 x 79 % Coherent plans to take over Rofin-Sinar We downgrade...

Rofin-Sinar (CDAX, Technology)
CO M M E N T Publ ished 21 .03 .2016 1
A n a l y s t
Eggert Kuls [email protected]
+49 40 309537-256
Value Indicators: EUR Share data: Description:
DCF: 24.00
FCF-Value Potential 17e: 27.90
Bloomberg: RSI GR
Reuters: RSTI
ISIN: US7750431022
Rofin-Sinar is one of two world-leading manufacturers of industrial laser equipment
Market Snapshot: EUR m Shareholders: Risk Profile (WRe): 2015/16e
Hold (Buy)
EUR 25.90
Price EUR 27.75
Downside -6.7 %
Market cap: 791
No. of shares (m): 29
EV: 646
Freefloat MC: 791
Ø Trad. Vol. (30d): 14.80 m
Freefloat 100.0 %
Beta: 1.1
Price / Book: 1.5 x
Equity Ratio: 79 %
Coherent plans to take over Rofin-Sinar
We downgrade Rofin-Sinar from Buy to Hold as the share price has exceeded our target price following the announcement that Coherent has
entered into an agreement to acquire Rofin-Sinar in an all-cash transaction worth USD 942m or USD 32.50 per share which is equivalent to a
premium of 42% to the closing price on the day before the announcement. The transaction is expected to be closed within six to nine months,
subject to the approval of Rofin-Sinar shareholders, regulatory bodies etc. Rofin`s board of directors is supporting the intended takeover.
We think the transaction makes sense for Coherent when looking at defined potential synergies of USD 30m p.a. (some 2% of combined
turnover) and the access to Rofin`s new developments in the fields of high-power fibre and ultra-short pulse laser. Furthermore, Rofin had cash
on hand of USD 177m as of the end of December 2015. For Rofin-Sinar shareholders our recommendation is to hold rather than sell the
shares as the current share price in USD is some 3.5% below the intended bid of USD 32.50 which is expected to be paid by the end of this
year at latest.
Due to strong competition in the industrial laser sector we do not expect cartel authorities to express concern. However, Rofin-Sinar and
Coherent are competing in several fields of activity such as laser for material processing and for microelectronics. In contrast, we see no
overlap in the scientific business which is run by Coherent. In the fast-growing fibre laser segment, IPG Photonics is the dominant player and
even a combination of Rofin and Coherent in this field would be much smaller. Hence, there could be some antitrust conditions but we do not
expect the deal to be prohibited as a whole.
Activist shareholder SilverArrow acquired a share of more than 9% in Rofin-Sinar last year and intended to increase its stake to some 15%.
SilverArrow aims to bring three people to Rofin`s board of directors in order to improve the company`s performance going forward. Rofin-Sinar
however has said that only one of the proposed persons is qualified to enter Rofin`s board and to help develop the business. Elections would
have taken place at the AGM on March, 17. However, following the Coherent announcement, Rofin-Sinar has postponed its AGM in order to
combine the AGM with the special shareholders meeting to approve the proposed combination with Coherent. No new date has been set so
far. Also, SilverArrow has not yet made a statement on whether it welcomes the agreement with Coherent or not.
Rofins`s share price was under strong pressure over the last months following weak order intake and a lowering of FY guidance. However, the
outlook is more promising due to new product developments in the fields of high-power fibre und ultra-short pulse laser which are expected to
contribute to a better H2. Nevertheless, due to the weak start to fiscal 2015/16 we were expecting the company to only meet the lower end of
its guidance range.
Rel. Performance vs CDAX:
1 month: 34.3 %
6 months: 21.0 %
Year to date: 19.8 %
Trailing 12 months: 40.7 %
Company events:
05.05.16 Q2
04.08.16 Q3
10.11.16 Prel. FY 2015/16
29.11.16 FY 2015/16
FY End: 30.9. in USD m
CAGR (14/15-17/18e) 2011/12 2012/13 2013/14 2014/15 2015/16e 2016/17e 2017/18e
Sales 0.6 % 540 560 530 520 499 514 529
Change Sales yoy -9.6 % 3.7 % -5.3 % -2.0 % -4.0 % 3.0 % 3.0 %
Gross profit margin 36.4 % 35.1 % 35.6 % 37.8 % 38.1 % 38.6 % 39.1 %
EBITDA 4.1 % 64 67 54 75 75 80 85
Margin 11.9 % 12.0 % 10.2 % 14.5 % 15.0 % 15.5 % 16.0 %
EBIT 5.3 % 50 49 34 56 56 60 65
Margin 9.3 % 8.8 % 6.4 % 10.8 % 11.2 % 11.8 % 12.3 %
Net income 5.6 % 35 35 25 41 39 45 49
EPS 5.3 % 1.20 1.22 0.89 1.46 1.36 1.58 1.70
EPS adj. 5.3 % 1.20 1.22 0.89 1.46 1.36 1.58 1.70
DPS - 0.00 0.00 0.00 0.00 0.00 0.00 0.00
Dividend Yield n.a. n.a. n.a. n.a. n.a. n.a. n.a.
FCFPS -0.62 1.47 0.40 1.47 1.14 0.97 1.07
FCF / Market cap -0.8 % 6.0 % 3.7 % 4.7 % 3.6 % 3.1 % 3.4 %
EV / Sales 1.1 x 1.1 x 1.1 x 1.2 x 1.5 x 1.4 x 1.3 x
EV / EBITDA 9.2 x 8.8 x 10.6 x 8.0 x 9.8 x 8.8 x 7.9 x
EV / EBIT 11.7 x 12.0 x 16.9 x 10.7 x 13.1 x 11.6 x 10.3 x
P / E 18.8 x 19.5 x 26.8 x 17.7 x 23.1 x 19.8 x 18.4 x
P / E adj. 18.8 x 19.5 x 26.8 x 17.7 x 23.1 x 19.8 x 18.4 x
FCF Yield Potential 6.0 % 6.6 % 5.6 % 7.9 % 6.2 % 7.3 % 8.2 %
Net Debt -58 -94 -101 -134 -168 -198 -230
ROCE (NOPAT) 8.1 % 7.8 % 5.2 % 9.4 % 9.6 % 10.1 % 10.6 % Guidance: 2015/16: Sales USD 495-525m, Net-margin 8% at mid-point of sales guidance
Rofin-Sinar
CO M M E N T Publ ished 21 .03 .2016 2
Sales development in EUR m
Source: Warburg Research
Sales by regions 2014; in %
Source: Warburg Research
EBIT development in EUR m
Source: Warburg Research
Company Background
� Laser technology company Rofin-Sinar was founded in 1975. In 1996 the company was listed on the American technology stock
exchange, Nasdaq, as the first 100% spin-off of Siemens AG.
� The company has production sites in the USA, Germany, UK, Finland, Sweden, Spain, Singapore and China. The two operating
headquarters are based in Plymouth (Michigan, USA) and Hamburg.
� Rofin-Sinar develops and produces laser sources and laser-based system solutions. The technology basis includes CO2 laser, lamp
and diode-pumped solid-state lasers as well as fibre and diode lasers.
� In addition to its main customer industries, automotive, machine tools as well as semiconductors and electronics, Rofin-Sinar supplies
various other industries.
Competitive Quality
� With a world market share of ca. 23% Rofin-Sinar is the clear world market leader in industrial lasers together with the non-listed
Trumpf (Germany).
� The most important competitors in macro applications are Trumpf, Fanuc, Coherent and Synrad for CO2 lasers and Laserline and
Jenoptik for diode lasers.
� In the Micro and Marking segments the main competitors are Trumpf, GSI Group, Unitek Miyachi, Lasag, IPG and Control Laser.
� IPG Photonics is market leader in the field of fibre lasers. This technology in part has advantages over the common laser technologies
such as improved energy efficiency. Rofin-Sinar is the No. 2 here.
� In the past the sector generally grew by ca. 10% p.a. and more over an economic cycle. Growth in the laser industry benefits from a
continuous expansion of the application possibilities.
EBT development in EUR m
Source: Warburg Research
Sales by segments 2014; in %
Source: Warburg Research
Net income development in EUR m
Source: Warburg Research
Rofin-Sinar
CO M M E N T Publ ished 21 .03 .2016 3
DCF model
Detailed forecast period Transitional period Term. Value
Figures in USD m 15/16e 16/17e 17/18e 18/19e 19/20e 20/21e 21/22e 22/23e 23/24e 24/25e 25/26e 26/27e 27/28e
Sales 499 514 529 550 572 595 619 644 670 696 724 753 783
Sales change -4.0 % 3.0 % 3.0 % 4.0 % 4.0 % 4.0 % 4.0 % 4.0 % 4.0 % 4.0 % 4.0 % 4.0 % 4.0 % 1.0 %
EBIT 56 60 65 72 74 77 80 77 80 84 87 90 94
EBIT-margin 11.2 % 11.8 % 12.3 % 13.0 % 13.0 % 13.0 % 13.0 % 12.0 % 12.0 % 12.0 % 12.0 % 12.0 % 12.0 %
Tax rate (EBT) 28.0 % 28.0 % 28.0 % 30.0 % 30.0 % 30.0 % 30.0 % 30.0 % 30.0 % 30.0 % 30.0 % 30.0 % 30.0 %
NOPAT 40 44 47 50 52 54 56 54 56 59 61 63 66
Depreciation 19 19 20 22 23 24 25 26 27 28 29 17 18
in % of Sales 3.8 % 3.8 % 3.7 % 4.0 % 4.0 % 4.0 % 4.0 % 4.0 % 4.0 % 4.0 % 4.0 % 2.3 % 2.3 %
Changes in provisions 0 1 1 1 1 1 1 1 1 1 1 1 2
Change in Liquidity from
- Working Capital -3 8 8 19 11 12 12 13 13 14 14 15 16
- Capex 25 26 27 25 26 27 28 29 30 31 33 23 24
Capex in % of Sales 5.0 % 5.1 % 5.1 % 4.5 % 4.5 % 4.5 % 4.5 % 4.5 % 4.5 % 4.5 % 4.5 % 3.0 % 3.0 %
Other 0 0 0 0 0 0 0 0 0 0 0 0 0
Free Cash Flow (WACC Model)
37 29 32 28 39 40 42 39 41 42 44 44 46 52
PV of FCF 35 26 27 22 28 27 26 23 22 21 20 19 19 318 share of PVs 13.95 % 35.80 % 50.25 %
Model parameter Valuation (m)
Derivation of WACC: Derivation of Beta: Present values 2027/28e 315
Terminal Value 318
Debt ratio 5.00 % Financial Strength 1.00 Financial liabilities 23
Cost of debt (after tax) 2.8 % Liquidity (share) 1.00 Pension liabilities 26
Market return 7.00 % Cyclicality 1.50 Hybrid capital 0
Risk free rate 1.50 % Transparency 1.00 Minority interest 9
Others 1.20 Market val. of investments 0
Liquidity 183 No. of shares (m) 28.2
WACC 7.52 % Beta 1.14 Equity Value 758 Value per share (USD) 26.88
Sensitivity Value per Share (USD)
Terminal Growth Delta EBIT-margin
Beta WACC 0.25 % 0.50 % 0.75 % 1.00 % 1.25 % 1.50 % 1.75 % Beta WACC -1.5 pp -1.0 pp -0.5 pp +0.0 pp +0.5 pp +1.0 pp +1.5 pp
1.33 8.5 % 22.92 23.16 23.43 23.71 24.01 24.33 24.67 1.33 8.5 % 20.52 21.58 22.64 23.71 24.77 25.83 26.90
1.24 8.0 % 24.22 24.52 24.84 25.18 25.54 25.94 26.36 1.24 8.0 % 21.75 22.89 24.03 25.18 26.32 27.46 28.61
1.19 7.8 % 24.94 25.27 25.62 26.00 26.40 26.84 27.31 1.19 7.8 % 22.43 23.62 24.81 26.00 27.19 28.37 29.56
1.14 7.5 % 25.72 26.08 26.47 26.88 27.33 27.82 28.35 1.14 7.5 % 23.17 24.41 25.65 26.88 28.12 29.35 30.59
1.09 7.3 % 26.55 26.95 27.38 27.84 28.34 28.89 29.48 1.09 7.3 % 23.98 25.26 26.55 27.84 29.13 30.41 31.70
1.04 7.0 % 27.44 27.88 28.36 28.88 29.44 30.05 30.72 1.04 7.0 % 24.85 26.19 27.53 28.88 30.22 31.56 32.91
0.95 6.5 % 29.45 30.00 30.59 31.24 31.95 32.74 33.60 0.95 6.5 % 26.83 28.30 29.77 31.24 32.71 34.19 35.66
� The industrial laser sector has grown by some 10% p.a. over a cycle in the last decades.
� We expect CAGR of 8% over the next 10 years due to the higher basis reached meanwhile
� Capex at below 3% of sales is due to low vertical integration for an engineering company
Rofin-Sinar
CO M M E N T Publ ished 21 .03 .2016 4
Free Cash Flow Value Potential Warburg Research's valuation tool "FCF Value Potential" reflects the ability of the company to generate sustainable free cash flows. It is based on the "FCF potential" - a FCF "ex growth" figure - which assumes unchanged working capital and pure maintenance capex. A value indication is derived via the perpetuity of a given year’s “FCF potential” with consideration of the weighted costs of capital. The fluctuating value indications over time add a timing element to the DCF model (our preferred valuation tool). in USD m 2011/12 2012/13 2013/14 2014/15 2015/16e 2016/17e 2017/18e
Net Income before minorities 35 35 25 41 39 45 48
+ Depreciation + Amortisation 14 18 20 19 19 19 20
- Net Interest Income 0 0 0 0 0 0 0
- Maintenance Capex 14 14 13 13 12 13 13
+ Other 0 0 0 0 0 0 0
= Free Cash Flow Potential 36 39 32 47 45 51 55
Free Cash Flow Yield Potential 6.0 % 6.6 % 5.6 % 7.9 % 6.2 % 7.3 % 8.2 %
WACC 7.52 % 7.52 % 7.52 % 7.52 % 7.52 % 7.52 % 7.52 %
= Enterprise Value (EV) 589 588 577 601 729 701 672 = Fair Enterprise Value 474 517 427 631 601 683 729
- Net Debt (Cash) -160 -160 -160 -160 -194 -224 -257
- Pension Liabilities 26 26 26 26 26 27 27
- Other 0 0 0 0 0 0 0
- Market value of minorities 5 5 5 5 5 6 8
+ Market value of investments 0 0 0 0 0 0 0
= Fair Market Capitalisation 603 646 556 760 765 875 952
No. of shares (total) (m) 29 28 28 28 29 29 29
= Fair value per share (USD) 21.15 22.75 19.70 26.89 26.83 30.70 33.39
premium (-) / discount (+) in % -14.3 % -2.0 % 6.4 %
Sensitivity Fair value per Share (USD)
10.52 % 16.70 17.81 15.51 20.72 21.19 24.29 26.56
9.52 % 17.97 19.19 16.65 22.41 22.81 26.13 28.51
8.52 % 19.54 20.90 18.07 24.50 24.80 28.39 30.93
WACC 7.52 % 21.53 23.07 19.86 27.15 27.31 31.25 33.98
6.52 % 24.12 25.90 22.20 30.61 30.61 34.99 37.97
5.52 % 27.65 29.76 25.38 35.32 35.09 40.09 43.41
4.52 % 32.75 35.32 29.98 42.11 41.56 47.44 51.26
� FCF value potential going forward is mainly driven by the expectation of rising results
� Maintenance capex is expected to be at 1.5% p.a. only due to a low vertical integration and thus fixed asset base
Rofin-Sinar
CO M M E N T Publ ished 21 .03 .2016 5
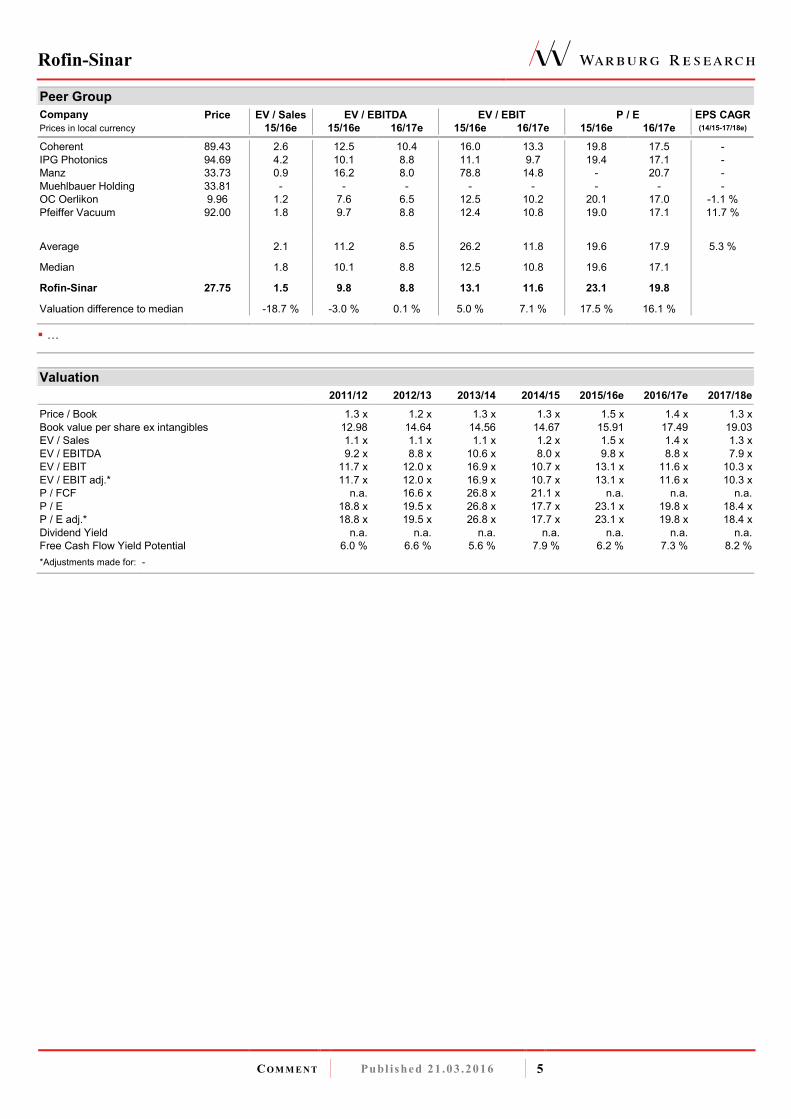
Peer Group
Company
Price EV / Sales EV / EBITDA EV / EBIT P / E EPS CAGR
Prices in local currency 15/16e 15/16e 16/17e 15/16e 16/17e 15/16e 16/17e (14/15-17/18e)
Coherent 89.43 2.6 12.5 10.4 16.0 13.3 19.8 17.5 -
IPG Photonics 94.69 4.2 10.1 8.8 11.1 9.7 19.4 17.1 -
Manz 33.73 0.9 16.2 8.0 78.8 14.8 - 20.7 -
Muehlbauer Holding 33.81 - - - - - - - -
OC Oerlikon 9.96 1.2 7.6 6.5 12.5 10.2 20.1 17.0 -1.1 %
Pfeiffer Vacuum 92.00 1.8 9.7 8.8 12.4 10.8 19.0 17.1 11.7 %
Average 2.1 11.2 8.5 26.2 11.8 19.6 17.9 5.3 %
Median 1.8 10.1 8.8 12.5 10.8 19.6 17.1
Rofin-Sinar 27.75 1.5 9.8 8.8 13.1 11.6 23.1 19.8
Valuation difference to median -18.7 % -3.0 % 0.1 % 5.0 % 7.1 % 17.5 % 16.1 %
� O
Valuation
2011/12 2012/13 2013/14 2014/15 2015/16e 2016/17e 2017/18e
Price / Book 1.3 x 1.2 x 1.3 x 1.3 x 1.5 x 1.4 x 1.3 x
Book value per share ex intangibles 12.98 14.64 14.56 14.67 15.91 17.49 19.03
EV / Sales 1.1 x 1.1 x 1.1 x 1.2 x 1.5 x 1.4 x 1.3 x
EV / EBITDA 9.2 x 8.8 x 10.6 x 8.0 x 9.8 x 8.8 x 7.9 x
EV / EBIT 11.7 x 12.0 x 16.9 x 10.7 x 13.1 x 11.6 x 10.3 x
EV / EBIT adj.* 11.7 x 12.0 x 16.9 x 10.7 x 13.1 x 11.6 x 10.3 x
P / FCF n.a. 16.6 x 26.8 x 21.1 x n.a. n.a. n.a.
P / E 18.8 x 19.5 x 26.8 x 17.7 x 23.1 x 19.8 x 18.4 x
P / E adj.* 18.8 x 19.5 x 26.8 x 17.7 x 23.1 x 19.8 x 18.4 x
Dividend Yield n.a. n.a. n.a. n.a. n.a. n.a. n.a.
Free Cash Flow Yield Potential 6.0 % 6.6 % 5.6 % 7.9 % 6.2 % 7.3 % 8.2 %
*Adjustments made for: -

Rofin-Sinar
CO M M E N T Publ ished 21 .03 .2016 6
Consolidated profit and loss In USD m 2011/12 2012/13 2013/14 2014/15 2015/16e 2016/17e 2017/18e
Sales 540 560 530 520 499 514 529
Change Sales yoy -9.6 % 3.7 % -5.3 % -2.0 % -4.0 % 3.0 % 3.0 %
COGS 344 364 341 323 309 315 322
Gross profit 196 197 189 196 190 198 207
Gross margin 36.4 % 35.1 % 35.6 % 37.8 % 38.1 % 38.6 % 39.1 %
Research and development 43 43 46 40 38 39 40
Sales and marketing 0 0 0 0 0 0 0
Administration expenses 101 102 106 97 94 96 98
Other operating expenses 0 0 0 0 0 0 0
Other operating income 0 0 0 0 0 0 0
Unfrequent items 0 0 0 0 0 0 0
EBITDA 64 67 54 75 75 80 85
Margin 11.9 % 12.0 % 10.2 % 14.5 % 15.0 % 15.5 % 16.0 %
Depreciation of fixed assets 12 15 17 16 16 16 17
EBITA n.a. n.a. n.a. n.a. n.a. n.a. n.a.
Amortisation of intangible fixed assets 2 3 3 3 3 3 3
Goodwill amortization 0 0 0 0 0 0 0
EBIT 50 49 34 56 56 60 65
Margin 9.3 % 8.8 % 6.4 % 10.8 % 11.2 % 11.8 % 12.3 %
EBIT adj. 50 49 34 56 56 60 65
Interest income n.a. n.a. n.a. n.a. n.a. n.a. n.a.
Interest expenses n.a. n.a. n.a. n.a. n.a. n.a. n.a.
Other financial income (loss) 2 0 3 1 -2 2 2
EBT 52 49 37 57 54 62 67
Margin 9.6 % 8.7 % 6.9 % 11.0 % 10.8 % 12.2 % 12.7 %
Total taxes 17 14 12 16 15 17 19
Net income from continuing operations 35 35 25 41 39 45 48
Income from discontinued operations (net of tax) 0 0 0 0 0 0 0
Net income before minorities 35 35 25 41 39 45 48
Minority interest -1 0 0 0 0 0 0
Net income 35 35 25 41 39 45 49
Margin 6.4 % 6.2 % 4.7 % 7.9 % 7.8 % 8.8 % 9.2 %
Number of shares, average 29 28 28 28 29 29 29
EPS 1.20 1.22 0.89 1.46 1.36 1.58 1.70
EPS adj. 1.20 1.22 0.89 1.46 1.36 1.58 1.70
*Adjustments made for:
Guidance: 2015/16: Sales USD 495-525m, Net-margin 8% at mid-point of sales guidance
Financial Ratios 2011/12 2012/13 2013/14 2014/15 2015/16e 2016/17e 2017/18e
Total Operating Costs / Sales n.a. n.a. n.a. n.a. n.a. n.a. n.a.
Operating Leverage 4.1 x -0.6 x 5.8 x -32.7 x 0.1 x 2.8 x 2.7 x
EBITDA / Interest expenses n.a. n.a. n.a. n.a. n.a. n.a. n.a.
Tax rate (EBT) 33.2 % 28.9 % 31.4 % 27.6 % 28.0 % 28.0 % 28.0 %
Dividend Payout Ratio 0.0 % 0.0 % 0.0 % 0.0 % 0.0 % 0.0 % 0.0 %
Sales per Employee 244,067 247,271 233,532 232,919 223,703 229,385 235,217
Sales, EBITDA in EUR m
Source: Warburg Research
Operating Performance in %
Source: Warburg Research
Performance per Share
Source: Warburg Research

Rofin-Sinar
CO M M E N T Publ ished 21 .03 .2016 7
Consolidated balance sheet In USD m 2011/12 2012/13 2013/14 2014/15 2015/16e 2016/17e 2017/18e
Assets
Goodwill and other intangible assets 128 128 128 128 128 128 128
thereof other intangible assets 25 25 25 25 25 25 25
thereof Goodwill 103 103 103 103 103 103 103
Property, plant and equipment 80 80 81 92 101 111 121
Financial assets -1 -1 -1 -1 -1 -1 -1
Other long-term assets 7 12 7 -1 -6 -6 -11
Fixed assets 213 219 215 218 222 231 237
Inventories 202 198 190 181 178 184 189
Accounts receivable 108 111 108 96 93 96 99
Liquid assets 101 137 142 183 218 248 280
Other short-term assets 28 35 34 29 38 39 40
Current assets 440 481 474 489 526 566 608
Total Assets 653 700 689 706 748 797 845
Liabilities and shareholders' equity
Subscribed capital 0 0 0 0 0 0 0
Capital reserve 218 221 224 226 228 231 233
Retained earnings 428 463 488 529 568 568 568
Other equity components -149 -166 -173 -178 -178 -178 -178
Shareholders' equity 498 543 539 543 581 626 670
Minority interest 5 6 8 9 9 9 9
Total equity 502 549 546 552 590 635 679
Provisions 99 94 89 94 99 105 105
thereof provisions for pensions and similar obligations 21 24 26 26 26 27 27
Financial liabilities (total) 23 19 15 23 23 23 23
thereof short-term financial liabilities 17 4 3 5 5 5 5
Accounts payable 27 25 23 23 20 21 21
Other liabilities 10 19 18 23 24 22 25
Liabilities 159 156 144 164 167 171 175
Total liabilities and shareholders' equity 653 700 689 706 748 797 845
Financial Ratios 2011/12 2012/13 2013/14 2014/15 2015/16e 2016/17e 2017/18e
Efficiency of Capital Employment
Operating Assets Turnover n.a. n.a. n.a. n.a. n.a. n.a. n.a.
Capital Employed Turnover 1.2 x 1.2 x 1.2 x 1.2 x 1.2 x 1.2 x 1.2 x
ROA 16.2 % 15.9 % 11.7 % 18.9 % 17.4 % 19.5 % 20.5 %
Return on Capital
ROCE (NOPAT) 8.1 % 7.8 % 5.2 % 9.4 % 9.6 % 10.1 % 10.6 %
ROE 7.1 % 6.7 % 4.7 % 7.6 % 6.9 % 7.5 % 7.5 %
Adj. ROE 7.1 % 6.7 % 4.7 % 7.6 % 6.9 % 7.5 % 7.5 %
Balance sheet quality
Net Debt -58 -94 -101 -134 -168 -198 -230
Net Financial Debt -79 -118 -127 -160 -194 -224 -257
Net Gearing -11.5 % -17.2 % -18.5 % -24.2 % -28.5 % -31.1 % -33.9 %
Net Fin. Debt / EBITDA n.a. n.a. n.a. n.a. n.a. n.a. n.a.
Book Value / Share 17.5 19.1 19.1 19.2 20.4 22.0 23.5
Book value per share ex intangibles 13.0 14.6 14.6 14.7 15.9 17.5 19.0
ROCE Development
Source: Warburg Research
Net debt in EUR m
Source: Warburg Research
Book Value per Share in EUR
Source: Warburg Research

Rofin-Sinar
CO M M E N T Publ ished 21 .03 .2016 8
Consolidated cash flow statement In USD m 2011/12 2012/13 2013/14 2014/15 2015/16e 2016/17e 2017/18e
Net income 35 35 25 41 39 45 48
Depreciation of fixed assets 12 15 17 16 16 16 17
Amortisation of goodwill 0 0 0 0 0 0 0
Amortisation of intangible assets 2 3 3 3 3 3 3
Increase/decrease in long-term provisions -2 -5 -5 5 5 6 1
Other non-cash income and expenses -23 8 -16 -11 0 0 0
Cash Flow 24 56 24 55 63 70 69
Increase / decrease in inventory -13 4 8 9 3 -6 -6
Increase / decrease in accounts receivable 11 -3 3 12 3 -3 -3
Increase / decrease in accounts payable 0 -2 -2 1 -3 1 1
Increase / decrease in other working capital positions 0 0 0 0 0 0 0
Increase / decrease in working capital (total) -2 -1 9 22 3 -8 -8
Net cash provided by operating activities 22 57 36 69 57 53 57
Investments in intangible assets 0 0 0 0 0 0 0
Investments in property, plant and equipment 27 16 10 34 25 26 27
Payments for acquisitions 13 0 6 0 0 0 0
Financial investments -1 -1 8 -7 10 10 10
Income from asset disposals 0 0 0 1 10 10 10
Net cash provided by investing activities 39 16 24 27 25 26 27
Change in financial liabilities 0 -4 -2 11 0 0 0
Dividends paid 0 0 0 0 0 0 0
Purchase of own shares -11 -4 -6 0 0 0 0
Capital measures 0 3 2 2 3 3 3
Other 0 -4 -5 -1 0 0 0
Net cash provided by financing activities -9 -9 -11 12 3 3 3
Change in liquid funds -27 32 1 53 35 30 33
Effects of exchange-rate changes on cash -2 3 -6 -12 0 0 0
Cash and cash equivalent at end of period 101 137 142 183 218 248 280
Financial Ratios 2011/12 2012/13 2013/14 2014/15 2015/16e 2016/17e 2017/18e
Cash Flow
FCF -17 42 11 42 32 27 30
Free Cash Flow / Sales -1.0 % 7.3 % 4.7 % 6.7 % 6.5 % 5.3 % 5.7 %
Free Cash Flow Potential 36 39 32 47 45 51 55
Free Cash Flow / Net Profit -15.4 % 117.6 % 99.9 % 83.8 % 83.6 % 60.8 % 62.2 %
Interest Received / Avg. Cash n.a. n.a. n.a. n.a. n.a. n.a. n.a.
Interest Paid / Avg. Debt n.a. n.a. n.a. n.a. n.a. n.a. n.a.
Management of Funds
Investment ratio 5.1 % 2.9 % 2.0 % 6.5 % 5.0 % 5.1 % 5.1 %
Maint. Capex / Sales 2.5 % 2.5 % 2.5 % 2.5 % 2.5 % 2.5 % 2.5 %
Capex / Dep 195.9 % 90.5 % 51.4 % 176.6 % 131.6 % 134.7 % 137.8 %
Avg. Working Capital / Sales n.a. n.a. n.a. n.a. n.a. n.a. n.a.
Trade Debtors / Trade Creditors 405.1 % 449.9 % 475.8 % 409.9 % 465.0 % 466.0 % 467.0 %
Inventory Turnover 1.7 x 1.8 x 1.8 x 1.8 x 1.7 x 1.7 x 1.7 x
Receivables collection period (days) 73 72 74 67 68 68 68
Payables payment period (days) 28 25 24 26 24 24 24
Cash conversion cycle (Days) n.a. n.a. n.a. n.a. n.a. n.a. n.a.
CAPEX and Cash Flow in EUR m
Source: Warburg Research
Free Cash Flow Generation
Source: Warburg Research

Rofin-Sinar
CO M M E N T Publ ished 21 .03 .2016 9
LEGAL DISCLAIMER
This research report was prepared by the Warburg Research GmbH, a fully owned subsidiary of the M.M.Warburg & CO (AG & Co.) KGaA and is
passed on by the M.M.Warburg & CO (AG & Co.) KGaA. It contains selected information and does not purport to be complete. The report is based on
publicly available information and data ("the information") believed to be accurate and complete. Warburg Research GmbH neither does examine the
information to be accurate and complete, nor guarantees its accuracy and completeness. Possible errors or incompleteness of the information do not
constitute grounds for liability of M.M.Warburg & CO (AG & Co.) KGaA or Warburg Research GmbH for damages of any kind whatsoever, and
M.M.Warburg & CO (AG & Co.) KGaA and Warburg Research GmbH are not liable for indirect and/or direct and/or consequential damages. In
particular, neither M.M.Warburg & CO (AG & Co.) KGaA nor Warburg Research GmbH are liable for the statements, plans or other details contained in
these analyses concerning the examined companies, their affiliated companies, strategies, economic situations, market and competitive situations,
regulatory environment, etc. Although due care has been taken in compiling this research report, it cannot be excluded that it is incomplete or contains
errors. M.M.Warburg & CO (AG & Co.) KGaA and Warburg Research GmbH, their shareholders and employees are not liable for the accuracy and
completeness of the statements, estimations and the conclusions derived from the information contained in this document. Provided a research report
is being transmitted in connection with an existing contractual relationship, i.e. financial advisory or similar services, the liability of M.M.Warburg & CO
(AG & Co.) KGaA and Warburg Research GmbH shall be restricted to gross negligence and wilful misconduct. In case of failure in essential tasks,
M.M.Warburg & CO (AG & Co.) KGaA and Warburg Research GmbH are liable for normal negligence. In any case, the liability of M.M.Warburg & CO
(AG & Co.) KGaA and Warburg Research GmbH is limited to typical, expectable damages. This research report does not constitute an offer or a
solicitation of an offer for the purchase or sale of any security. Partners, directors or employees of M.M.Warburg & CO (AG & Co.) KGaA, Warburg
Research GmbH or affiliated companies may serve in a position of responsibility, i.e. on the board of directors of companies mentioned in the report.
Opinions expressed in this report are subject to change without notice. All rights reserved.
COPYRIGHT NOTICE
This work including all its parts is protected by copyright. Any use beyond the limits provided by copyright law without permission is prohibited and
punishable. This applies, in particular, to reproductions, translations, microfilming, and storage and processing on electronic media of the entire content
or parts thereof.
DISCLOSURE ACCORDING TO §34B (1) OF THE GERMAN SECURITIES TRADING ACT (WHPG) AND THE ORDINANCE ON THE ANALYSIS OF FINANCIAL INSTRUMENTS (FINANV)
The valuation underlying the investment recommendation for the company analysed here is based on generally accepted and widely used methods of
fundamental analysis, such as e.g. DCF Model, Free Cash Flow Potential, Peer Group Comparison or Sum of the Parts Model. The result of this
fundamental valuation is modified to take into consideration the analyst’s assessment as regards the expected development of investor sentiment and
its impact on the share price.
Independent of the applied valuation methods, there is the risk that the price target will not be met, for instance because of unforeseen changes in
demand for the company’s products, changes in management, technology, economic development, interest rate development, operating and/or
material costs, competitive pressure, supervisory law, exchange rate, tax rate etc. For investments in foreign markets and instruments there are further
risks, generally based on exchange rate changes or changes in political and social conditions.
This commentary reflects the opinion of the relevant author at the point in time of its compilation. A change in the fundamental factors underlying the
valuation can mean that the valuation is subsequently no longer accurate. Whether, or in what time frame, an update of this commentary follows is not
determined in advance.
In accordance with § 5 (4) of the Ordinance on the Analysis of Financial Instruments (FinAnV) Warburg Research GmbH has implemented additional
internal and organisational arrangements to prevent or to deal with conflicts of interest. Among these are the spatial separation of Warburg Research
GmbH from M.M.Warburg & CO (AG & Co.) KGaA and the creation of areas of confidentiality. This prevents the exchange of information, which could
form the basis of conflicts of interest for Warburg Research in terms of the analysed issuers or their financial instruments.
The analysts of Warburg Research GmbH do not receive a gratuity – directly or indirectly – from the investment banking activities of M.M.Warburg &
CO (AG & Co.) KGaA or of any company within the Warburg Group.
All prices of financial instruments given in this financial analysis are the closing prices on the last stock-market trading day before the publication date
stated, unless another point in time is explicitly stated.
M.M.Warburg & CO (AG & Co.) KGaA and Warburg Research GmbH are subject to the supervision of the Federal Financial Supervisory Authority,
BaFin.
SOURCES
All data and consensus estimates have been obtained from FactSet except where stated otherwise.

Rofin-Sinar
CO M M E N T Publ ished 21 .03 .2016 10
Additional information for clients in the United States
1. This research report (the “Report”) is a product of Warburg Research GmbH, Germany, a fully owned subsidiary of M.M.Warburg & CO (AG & Co.)
KGaA, Germany (in the following collectively “Warburg”). Warburg is the employer of the research analyst(s), who have prepared the Report. The
research analyst(s) reside outside the United States and are not associated persons of any U.S. regulated broker-dealer and therefore are not subject
to the supervision of any U.S. regulated broker-dealer.
2. The Report is provided in the United States for distribution solely to "major U.S. institutional investors" under Rule 15a-6 of the U.S. Securities
Exchange Act of 1934.
3. Any recipient of the Report should effect transactions in the securities discussed in the Report only through J.P.P. Euro-Securities, Inc., Delaware.
4. J.P.P. Euro-Securities, Inc. does not accept or receive any compensation of any kind for the dissemination of the research reports from Warburg.
Reference in accordance with section 34b of the German Securities Trading Act (WpHG) and the Ordinance on the Analysis of Financial Instruments (FinAnV) regarding possible conflicts of interest with the analysed company:
-1- Warburg Research, or an affiliated company, or an employee of one of these companies responsible for the compilation of the
research, hold a share of more than 5% of the equity capital of the analysed company.
-2-
Warburg Research, or an affiliated company, within the last twelve months participated in the management of a consortium
for an issue in the course of a public offering of such financial instruments, which are, or the issuer of which is, the subject of the
financial analysis.
-3- Companies affiliated with Warburg Research manage financial instruments, which are, or the issuers of which are, subject of
the financial analysis, in a market based on the provision of buy or sell contracts
-4-
Warburg Research, or an affiliated company, were in the last twelve months bound by a service agreement with the issuers,
who are themselves or their financial instruments are, subject of the financial analysis, in connection with investment banking
business for which a service or a promise of a service emanated.
-5- The company compiling the analysis or an affiliated company had reached an agreement on the compilation of the financial
analysis with the analysed company.
-6- Companies affiliated with Warburg Research regularly trade financial instruments of the analysed company or derivatives of
these.
-7- The company preparing the analysis as well as its affiliated companies and employees have other important interests in
relation to the analysed company, such as, for example, the exercising of mandates at analysed companies.
Company Disclosure Link to the historical price targets and rating changes (last 12 months)
Rofin-Sinar 3, 6 http://www.mmwarburg.com/disclaimer/disclaimer_en/US7750431022.htm
Rofin-Sinar
CO M M E N T Publ ished 21 .03 .2016 11
INVESTMENT RECOMMENDATION
Investment recommendation: expected direction of the share price development of the financial instrument up to the given price target in the opinion of
the analyst who covers this financial instrument.
-B- Buy: The price of the analysed financial instrument is expected to rise over the next 12 months.
-H- Hold: The price of the analysed financial instrument is expected to remain mostly flat over the next 12
months.
-S- Sell: The price of the analysed financial instrument is expected to fall over the next 12 months.
“-“ Rating suspended: The available information currently does not permit an evaluation of the company.
WARBURG RESEARCH GMBH – RESEARCH UNIVERSE BY RATING
Rating Number of stocks % of Universe
Buy 124 65
Hold 57 30
Sell 5 3
Rating suspended 4 2
Total 190 100
WARBURG RESEARCH GMBH – ANALYSED RESEARCH UNIVERSE BY RATING I
I taking into account only those companies which were provided with major investment banking services in the last twelve
months.
Rating Number of stocks % of Universe
Buy 25 81
Hold 4 13
Sell 1 3
Rating suspended 1 3
Total 31 100
PRICE AND RATING HISTORY ROFIN-SINAR AS OF 21.03.2016
The chart has markings if Warburg Research GmbH changed its
rating in the last 12 months. Every marking represents the date
and closing price on the day of the rating change.
Rofin-Sinar
CO M M E N T Publ ished 21 .03 .2016 12
EQUITIES Roland Rapelius +49 40 3282-2673 Head of Equities [email protected] RESEARCH Michael Heider +49 40 309537-280 Andreas Pläsier +49 40 309537-246 Head of Research [email protected] Banks, Financial Services [email protected]
Henner Rüschmeier +49 40 309537-270 Malte Räther +49 40 309537-185 Head of Research [email protected] Telco, Internet, Media [email protected]
Lucas Boventer +49 40 309537-290 Jochen Reichert +49 40 309537-130 Renewables, Internet, Media [email protected] Telco, Internet, Media [email protected]
Christian Cohrs +49 40 309537-175 J. Moritz Rieser +49 40 309537-260 Engineering, Logistics [email protected] Real Estate [email protected]
Felix Ellmann +49 40 309537-120 Arash Roshan Zamir +49 40 309537-155 Software, IT [email protected] Cap. Goods, Renewables [email protected]
Jörg Philipp Frey +49 40 309537-258 Malte Schaumann +49 40 309537-170 Retail, Consumer Goods [email protected] Technology [email protected]
Harald Hof +49 40 309537-125 Oliver Schwarz +49 40 309537-250 Medtech [email protected] Chemicals, Agriculture [email protected]
Ulrich Huwald +49 40 309537-255 Marc-René Tonn +49 40 309537-259 Health Care, Pharma [email protected] Automobiles, Car Suppliers [email protected]
Thilo Kleibauer +49 40 309537-257 Björn Voss +49 40 309537-254 Retail, Consumer Goods [email protected] Steel, Car Suppliers [email protected]
Eggert Kuls +49 40 309537-256 Andreas Wolf +49 40 309537-140 Engineering [email protected] Software, IT [email protected] INSTITUTIONAL EQUITY SALES Holger Nass +49 40 3282-2669 Marie-Therese Grübner +49 40 3282-2630 Head of Equity Sales, USA [email protected] France, Switzerland [email protected]
Klaus Schilling +49 40 3282-2664 Michael Kriszun +49 40 3282-2695 Dep. Head of Equity Sales, GER [email protected] United Kingdom [email protected]
Tim Beckmann +49 40 3282-2665 Marc Niemann +49 40 3282-2660 United Kingdom [email protected] Germany [email protected]
Lyubka Bogdanova +49 69 5050-7411 Fabian Roggemann +49 40 3282-2667 United Kingdom, Australia [email protected] USA [email protected]
Jens Buchmüller +49 69 5050-7415 Sanjay Oberoi +49 69 5050-7410 Scandinavia, Austria [email protected] United Kingdom [email protected]
Paul Dontenwill +49 40 3282-2666 Juliane Willenbruch +49 40 3282-2694 USA [email protected] Roadshow/Marketing [email protected]
Matthias Fritsch +49 40 3282-2696 United Kingdom [email protected]
SALES TRADING Oliver Merckel +49 40 3282-2634 Jörg Treptow +49 40 3262-2658 Head of Sales Trading [email protected] Sales Trading [email protected] Michael Ilgenstein +49 40 3282-2700 Jan Walter +49 40 3262-2662 Sales Trading [email protected] Sales Trading [email protected] Bastian Quast +49 40 3282-2701 Sales Trading [email protected] MACRO RESEARCH Carsten Klude +49 40 3282-2572 Dr. Christian Jasperneite +49 40 3282-2439 Macro Research [email protected] Investment Strategy [email protected] Matthias Thiel +49 40 3282-2401 Macro Research [email protected]
Our research can be found under: Warburg Research research.mmwarburg.com/en/index.html Thomson www.thomson.com Bloomberg MMWA GO Reuters www.knowledge.reuters.com FactSet www.factset.com Capital IQ www.capitaliq.com For access please contact:
Andrea Schaper +49 40 3282-2632 Kerstin Muthig +49 40 3282-2703 Sales Assistance [email protected] Sales Assistance [email protected]


![DPSSLs: Status and Prospects for Materials Processing/67531/metadc... · Rofin-Sinar Nd:YAG DPSSL [7] Using a maximum pump power of -3.5 kW, a maximum output power of 1.15 kW is obtained,](https://static.fdocuments.us/doc/165x107/5f1776f211100e363569158c/dpssls-status-and-prospects-for-materials-processing-67531metadc-rofin-sinar.jpg)