Rocky Mountain Vegetative Structural Stage Description … · Rocky Mountain – Vegetative...
50
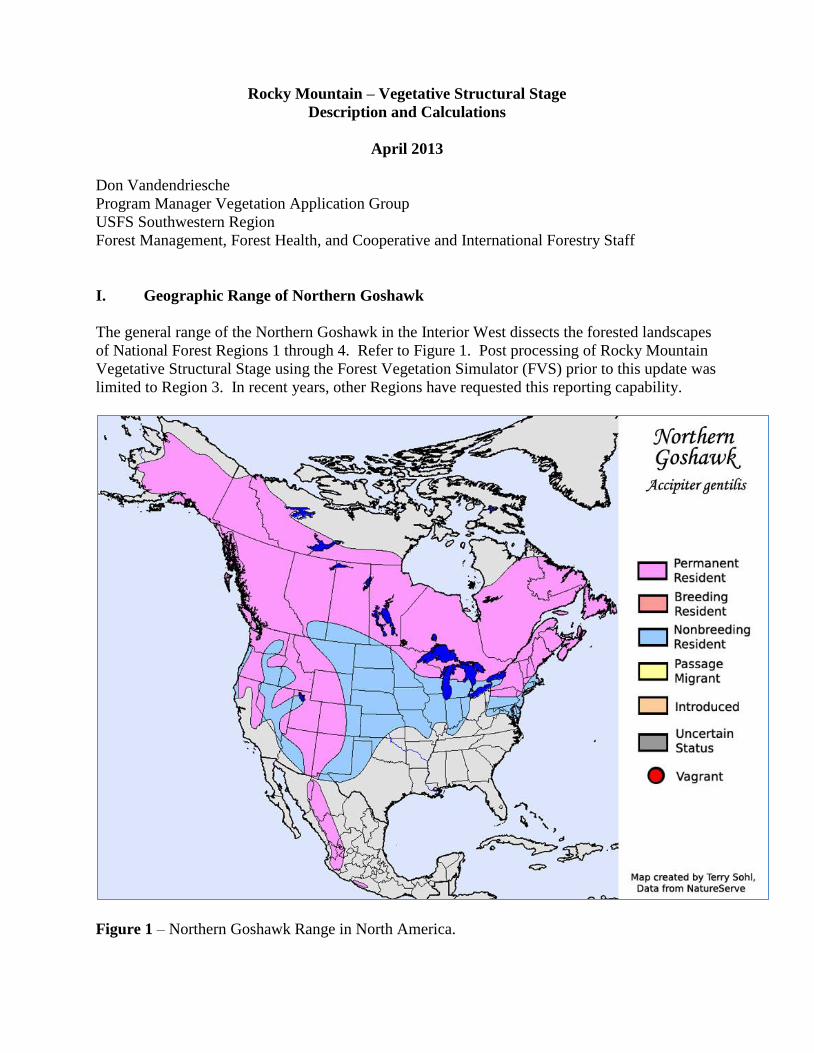
Rocky Mountain – Vegetative Structural Stage Description and Calculations April 2013 Don Vandendriesche Program Manager Vegetation Application Group USFS Southwestern Region Forest Management, Forest Health, and Cooperative and International Forestry Staff I. Geographic Range of Northern Goshawk The general range of the Northern Goshawk in the Interior West dissects the forested landscapes of National Forest Regions 1 through 4. Refer to Figure 1. Post processing of Rocky Mountain Vegetative Structural Stage using the Forest Vegetation Simulator (FVS) prior to this update was limited to Region 3. In recent years, other Regions have requested this reporting capability. Figure 1 – Northern Goshawk Range in North America.
-
Upload
vuongquynh -
Category
Documents
-
view
220 -
download
0
Transcript of Rocky Mountain Vegetative Structural Stage Description … · Rocky Mountain – Vegetative...
Rocky Mountain – Vegetative Structural Stage
Description and Calculations
April 2013
Don Vandendriesche
Program Manager Vegetation Application Group
USFS Southwestern Region
Forest Management, Forest Health, and Cooperative and International Forestry Staff
I. Geographic Range of Northern Goshawk
The general range of the Northern Goshawk in the Interior West dissects the forested landscapes
of National Forest Regions 1 through 4. Refer to Figure 1. Post processing of Rocky Mountain
Vegetative Structural Stage using the Forest Vegetation Simulator (FVS) prior to this update was
limited to Region 3. In recent years, other Regions have requested this reporting capability.
Figure 1 – Northern Goshawk Range in North America.
II. Accounting for NFS Regions and FVS Geographic Variants
Table 1 contains a list of National Forest Regions and associated Forest Vegetation Simulator
geographic variants within the Interior West.
Table 1 – NFS Region and FVS Variants in the Interior West.
III. Accounting for FVS Tree Species by Geographic Variant for each NFS Region
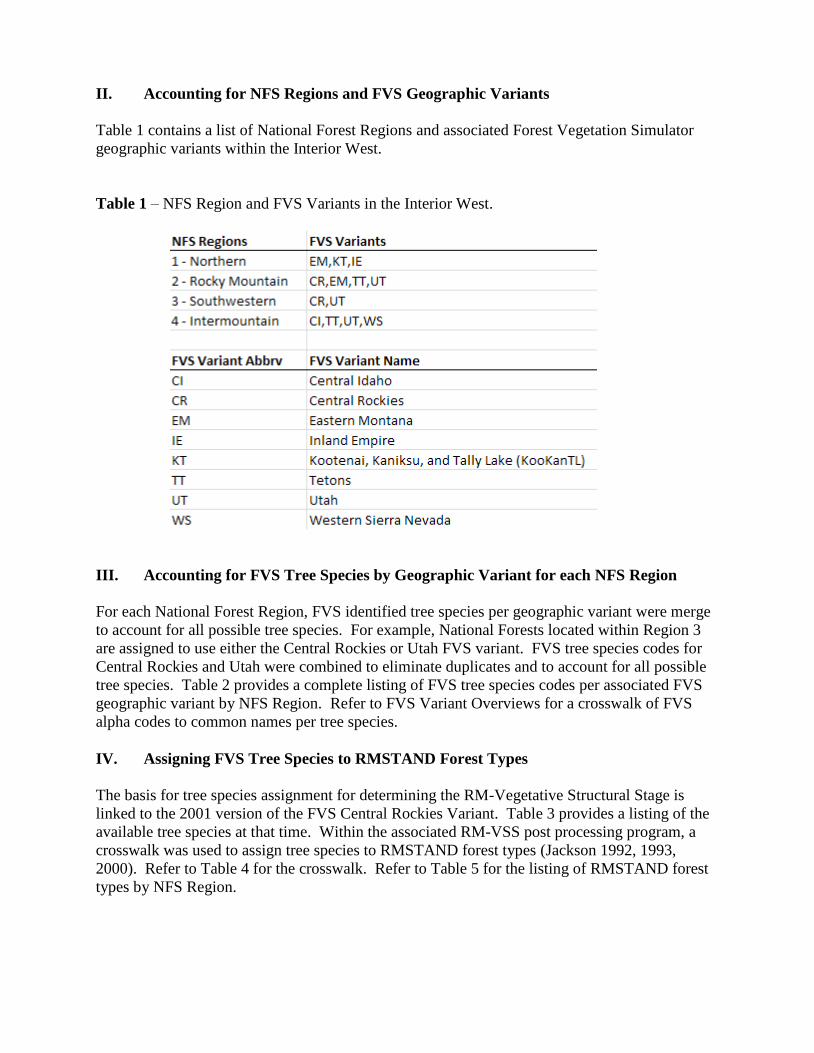
For each National Forest Region, FVS identified tree species per geographic variant were merge
to account for all possible tree species. For example, National Forests located within Region 3
are assigned to use either the Central Rockies or Utah FVS variant. FVS tree species codes for
Central Rockies and Utah were combined to eliminate duplicates and to account for all possible
tree species. Table 2 provides a complete listing of FVS tree species codes per associated FVS
geographic variant by NFS Region. Refer to FVS Variant Overviews for a crosswalk of FVS
alpha codes to common names per tree species.
IV. Assigning FVS Tree Species to RMSTAND Forest Types
The basis for tree species assignment for determining the RM-Vegetative Structural Stage is
linked to the 2001 version of the FVS Central Rockies Variant. Table 3 provides a listing of the
available tree species at that time. Within the associated RM-VSS post processing program, a
crosswalk was used to assign tree species to RMSTAND forest types (Jackson 1992, 1993,
2000). Refer to Table 4 for the crosswalk. Refer to Table 5 for the listing of RMSTAND forest
types by NFS Region.
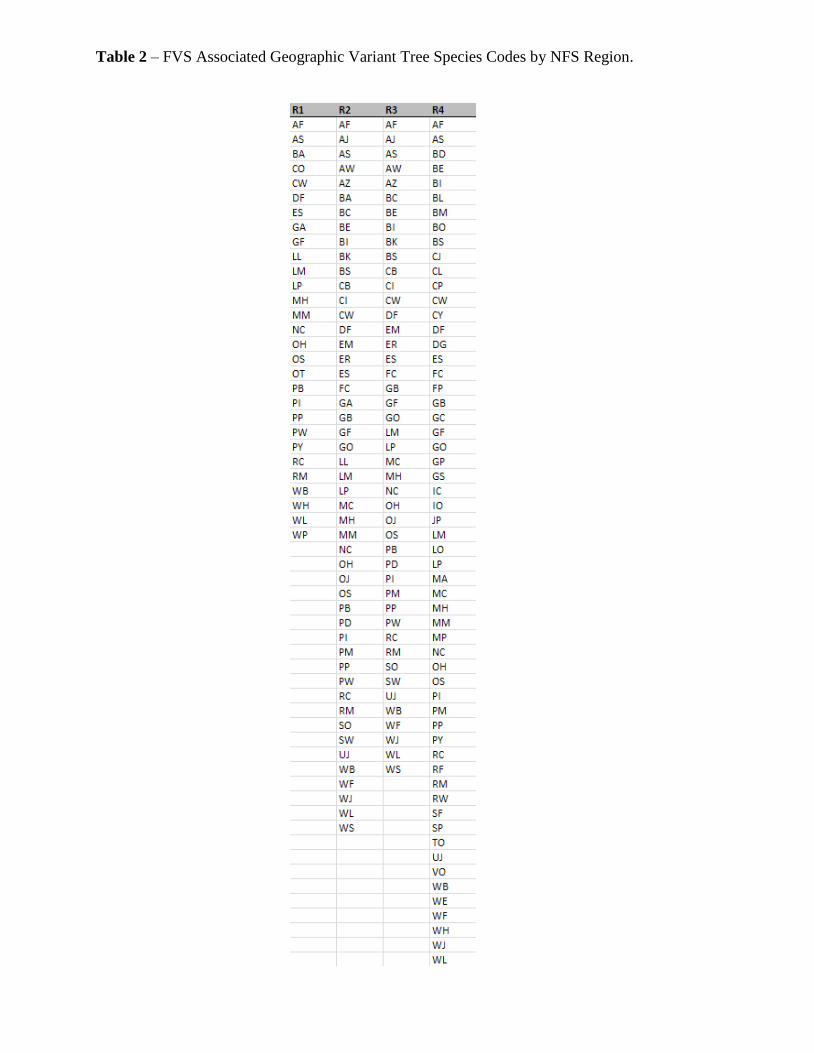
Table 2 – FVS Associated Geographic Variant Tree Species Codes by NFS Region.
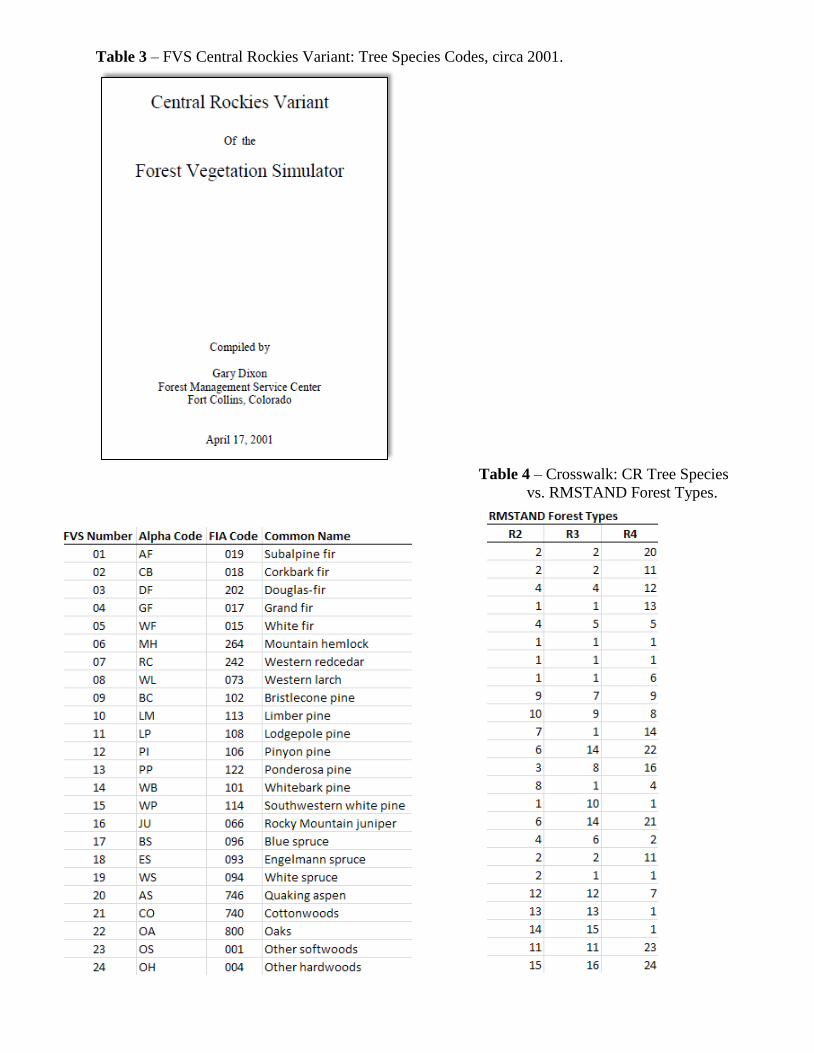
Table 3 – FVS Central Rockies Variant: Tree Species Codes, circa 2001.
Table 4 – Crosswalk: CR Tree Species
vs. RMSTAND Forest Types.
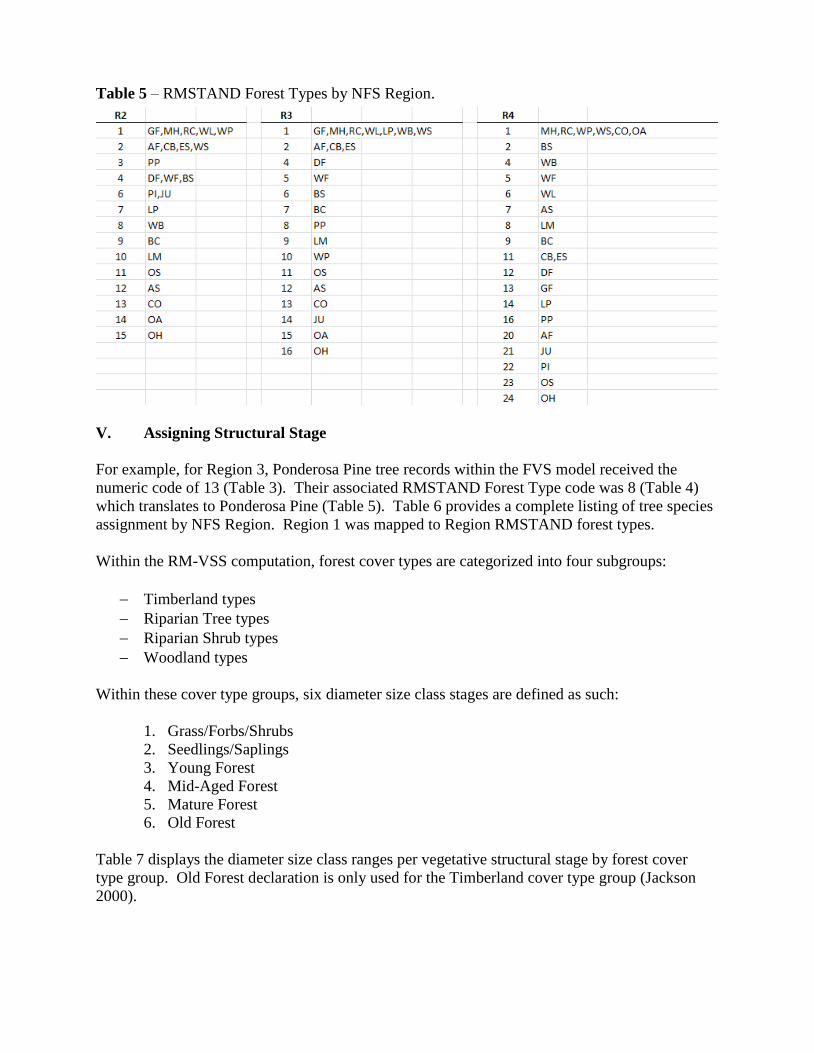
Table 5 – RMSTAND Forest Types by NFS Region.
V. Assigning Structural Stage
For example, for Region 3, Ponderosa Pine tree records within the FVS model received the
numeric code of 13 (Table 3). Their associated RMSTAND Forest Type code was 8 (Table 4)
which translates to Ponderosa Pine (Table 5). Table 6 provides a complete listing of tree species
assignment by NFS Region. Region 1 was mapped to Region RMSTAND forest types.
Within the RM-VSS computation, forest cover types are categorized into four subgroups:
Timberland types
Riparian Tree types
Riparian Shrub types
Woodland types
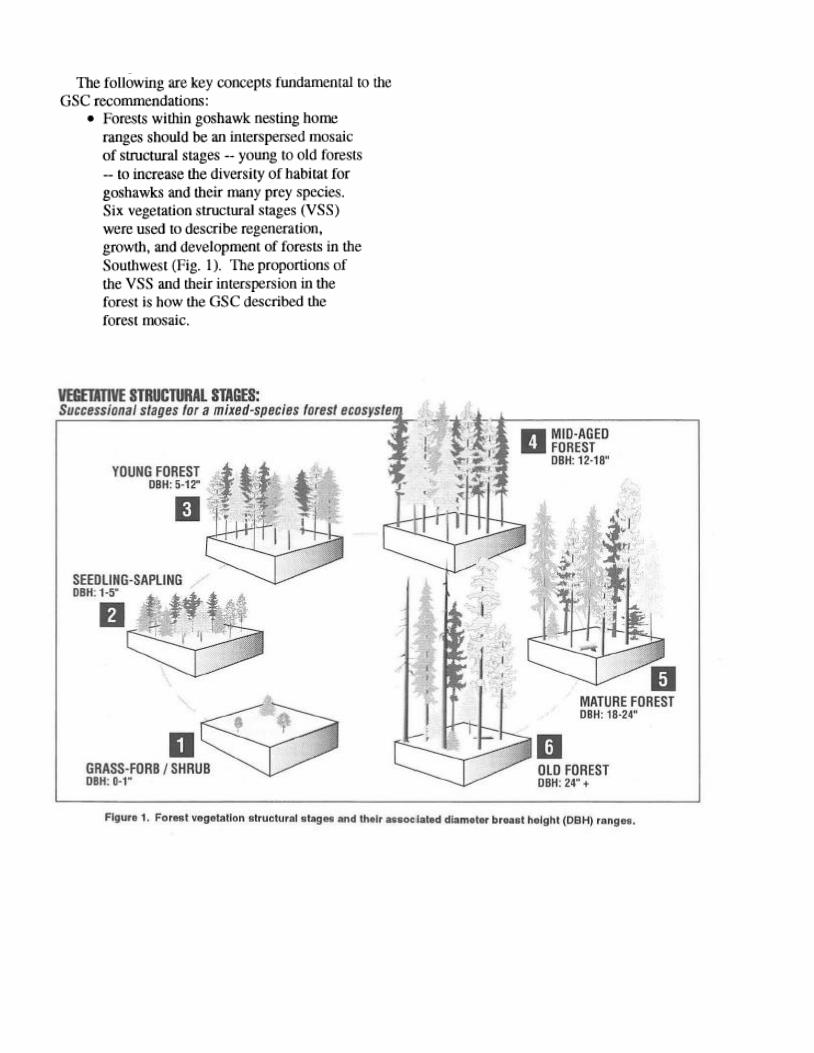
Within these cover type groups, six diameter size class stages are defined as such:
1. Grass/Forbs/Shrubs
2. Seedlings/Saplings
3. Young Forest
4. Mid-Aged Forest
5. Mature Forest
6. Old Forest
Table 7 displays the diameter size class ranges per vegetative structural stage by forest cover
type group. Old Forest declaration is only used for the Timberland cover type group (Jackson
2000).
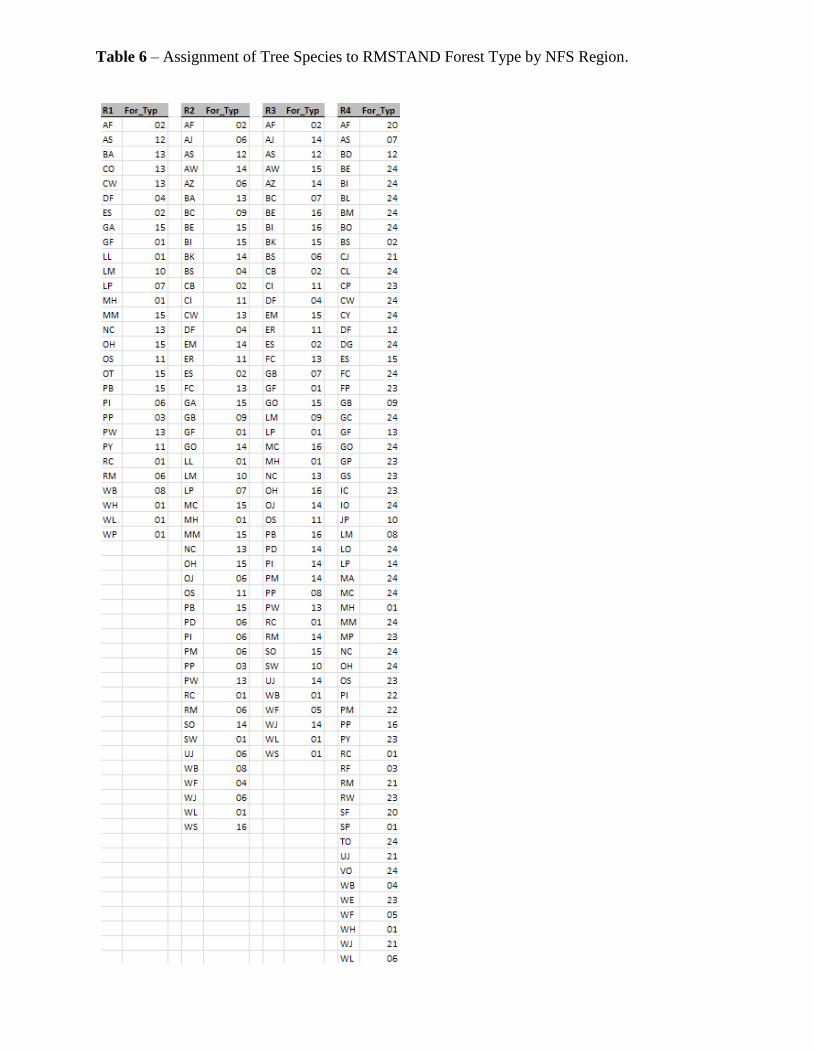
Table 6 – Assignment of Tree Species to RMSTAND Forest Type by NFS Region.
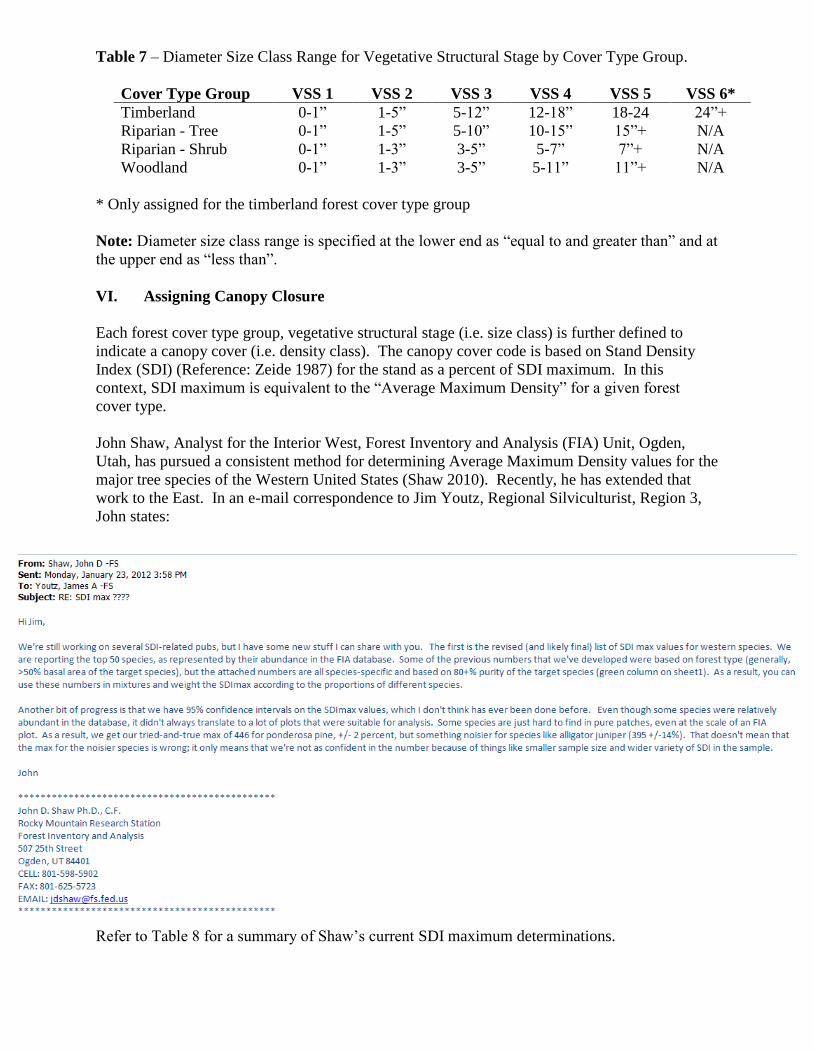
Table 7 – Diameter Size Class Range for Vegetative Structural Stage by Cover Type Group.
Cover Type Group VSS 1 VSS 2 VSS 3 VSS 4 VSS 5 VSS 6*
Timberland 0-1” 1-5” 5-12” 12-18” 18-24 24”+
Riparian - Tree 0-1” 1-5” 5-10” 10-15” 15”+ N/A
Riparian - Shrub 0-1” 1-3” 3-5” 5-7” 7”+ N/A
Woodland 0-1” 1-3” 3-5” 5-11” 11”+ N/A
* Only assigned for the timberland forest cover type group
Note: Diameter size class range is specified at the lower end as “equal to and greater than” and at
the upper end as “less than”.
VI. Assigning Canopy Closure
Each forest cover type group, vegetative structural stage (i.e. size class) is further defined to
indicate a canopy cover (i.e. density class). The canopy cover code is based on Stand Density
Index (SDI) (Reference: Zeide 1987) for the stand as a percent of SDI maximum. In this
context, SDI maximum is equivalent to the “Average Maximum Density” for a given forest
cover type.
John Shaw, Analyst for the Interior West, Forest Inventory and Analysis (FIA) Unit, Ogden,
Utah, has pursued a consistent method for determining Average Maximum Density values for the
major tree species of the Western United States (Shaw 2010). Recently, he has extended that
work to the East. In an e-mail correspondence to Jim Youtz, Regional Silviculturist, Region 3,
John states:
Refer to Table 8 for a summary of Shaw’s current SDI maximum determinations.
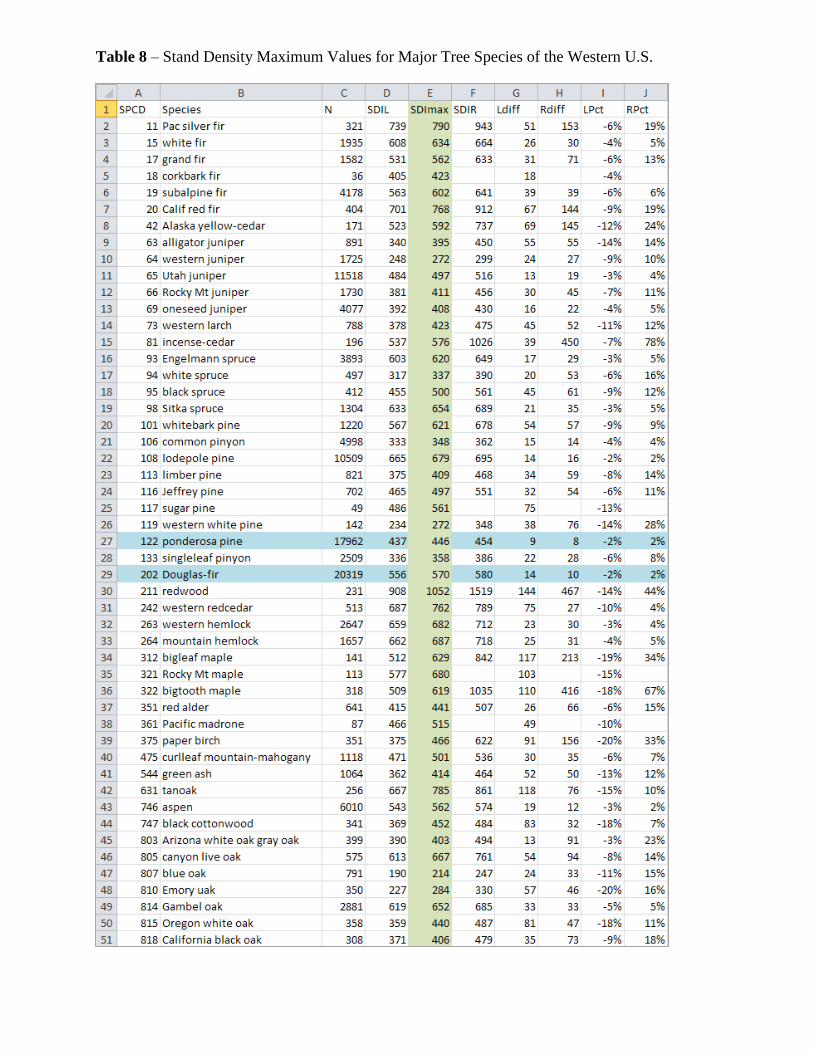
Table 8 – Stand Density Maximum Values for Major Tree Species of the Western U.S.
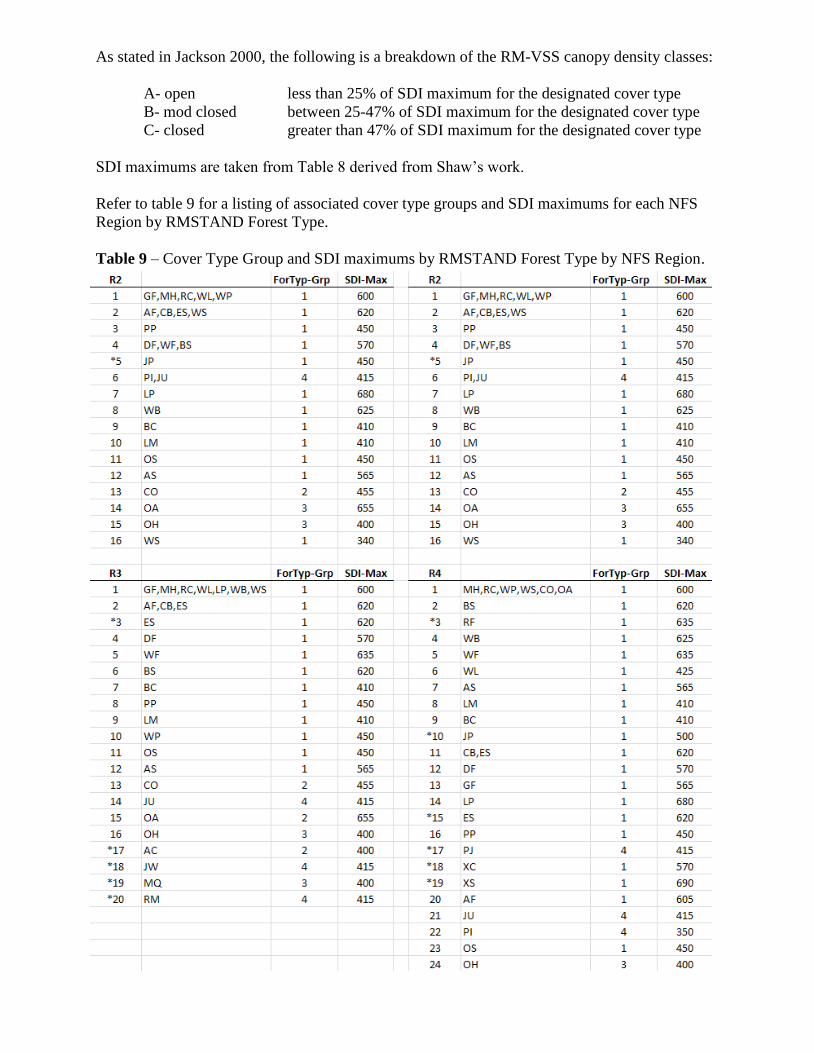
As stated in Jackson 2000, the following is a breakdown of the RM-VSS canopy density classes:
A- open less than 25% of SDI maximum for the designated cover type
B- mod closed between 25-47% of SDI maximum for the designated cover type
C- closed greater than 47% of SDI maximum for the designated cover type
SDI maximums are taken from Table 8 derived from Shaw’s work.
Refer to table 9 for a listing of associated cover type groups and SDI maximums for each NFS
Region by RMSTAND Forest Type.
Table 9 – Cover Type Group and SDI maximums by RMSTAND Forest Type by NFS Region.
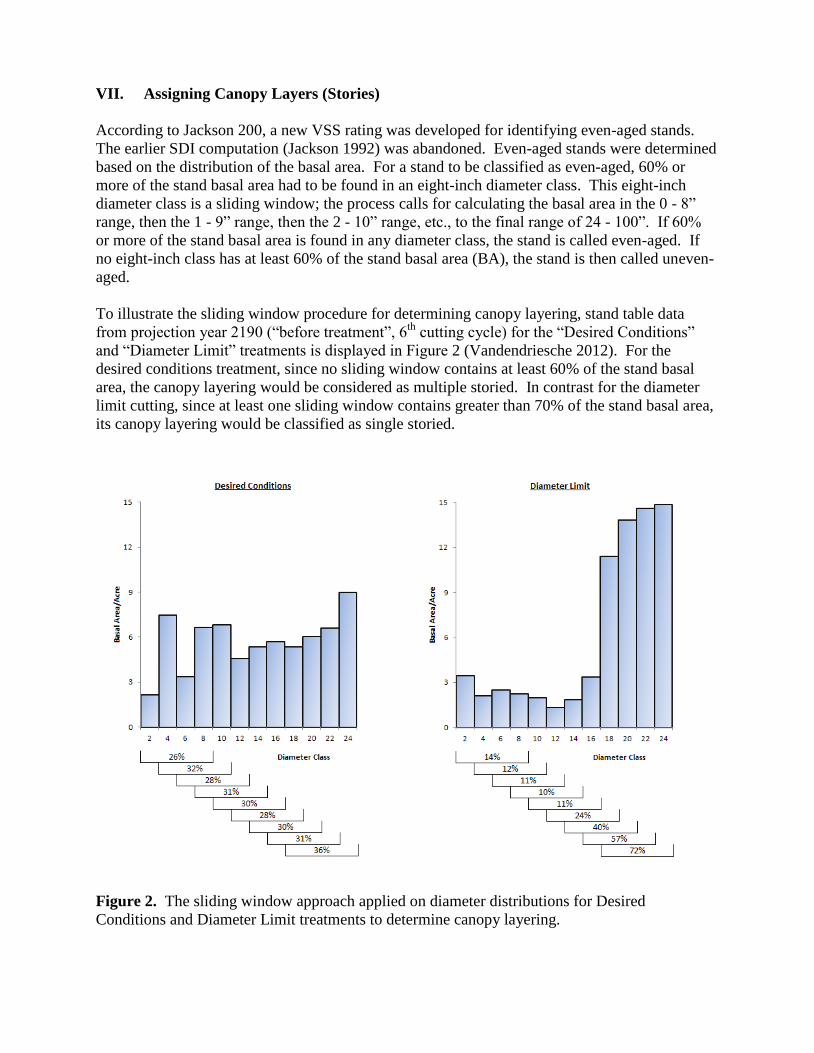
VII. Assigning Canopy Layers (Stories)
According to Jackson 200, a new VSS rating was developed for identifying even-aged stands.
The earlier SDI computation (Jackson 1992) was abandoned. Even-aged stands were determined
based on the distribution of the basal area. For a stand to be classified as even-aged, 60% or
more of the stand basal area had to be found in an eight-inch diameter class. This eight-inch
diameter class is a sliding window; the process calls for calculating the basal area in the 0 - 8”
range, then the 1 - 9” range, then the 2 - 10” range, etc., to the final range of 24 - 100”. If 60%
or more of the stand basal area is found in any diameter class, the stand is called even-aged. If
no eight-inch class has at least 60% of the stand basal area (BA), the stand is then called uneven-
aged.
To illustrate the sliding window procedure for determining canopy layering, stand table data
from projection year 2190 (“before treatment”, 6th
cutting cycle) for the “Desired Conditions”
and “Diameter Limit” treatments is displayed in Figure 2 (Vandendriesche 2012). For the
desired conditions treatment, since no sliding window contains at least 60% of the stand basal
area, the canopy layering would be considered as multiple storied. In contrast for the diameter
limit cutting, since at least one sliding window contains greater than 70% of the stand basal area,
its canopy layering would be classified as single storied.
Figure 2. The sliding window approach applied on diameter distributions for Desired
Conditions and Diameter Limit treatments to determine canopy layering.
Note: In 2010, while examining the canopy layering algorithm in support of forest plan revision
efforts, it was discovered that the 60% BA threshold provided a good benchmark for uneven-
aged stands (i.e. three or more storied stands). The VDDT models that were constructed for
forest planning identified either “single” or “multiple” storied stands. In this case, multiple
storied stands were defined as two or more storied stands. After further investigation of
supporting data, it was determined that increasing the threshold from 60% BA to 70% BA
enabled isolating single storied from two or more storied stands. Basal area favors larger
diameter trees. The lower limit threshold of 60% BA allowed bigger trees to dominant this
algorithm and classifies most stands as even-aged. Increasing the basal area threshold tightened
the requirement for single storied stands (>=70% BA). Thus, two storied (>=60% BA - <70%
BA) can now be distinguished as well as multiple storied stands (<60% BA).
VIII. Putting It All Together
Refer to the template on the following page for the composite attributing of the Rocky Mountain
– Vegetative Structural Stage.
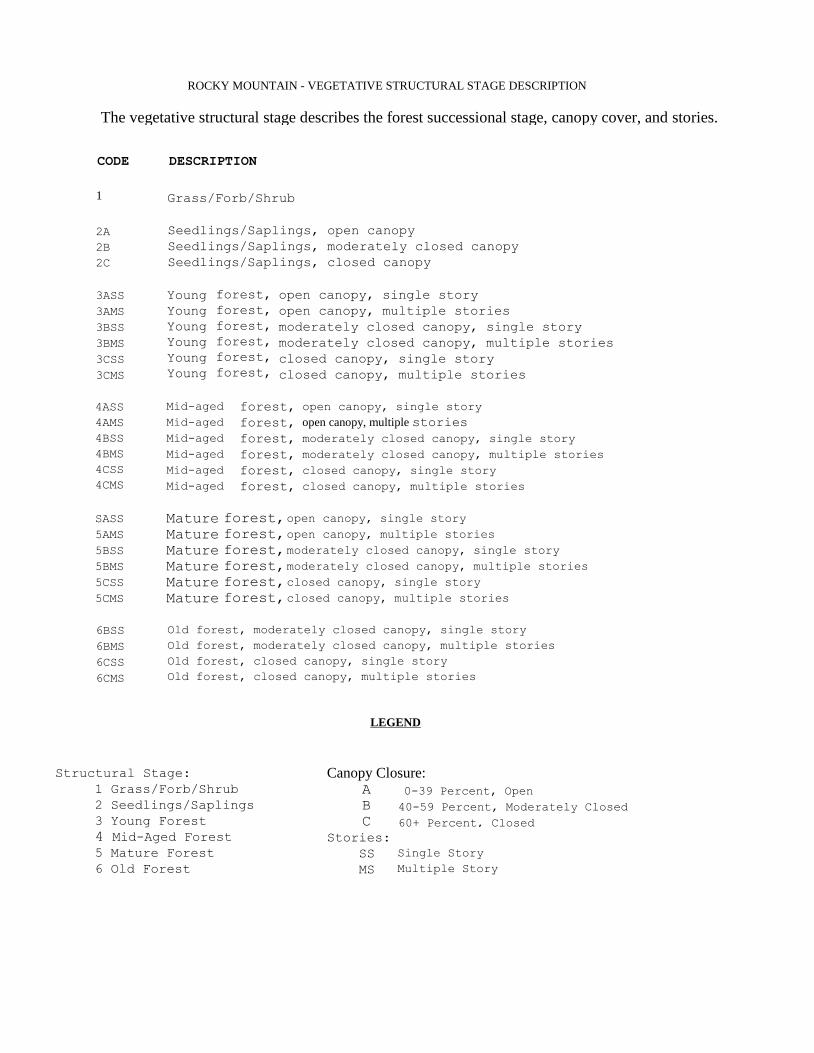
ROCKY MOUNTAIN - VEGETATIVE STRUCTURAL STAGE DESCRIPTION
CODE DESCRIPTION
1
2A
2B
2C
3ASS
3AMS
3BSS
3BMS
3CSS
3CMS
4ASS
4AMS
4BSS
4BMS
4CSS
4CMS
SASS
5AMS
5BSS
5BMS
5CSS
5CMS "
6BSS
6BMS
6CSS
6CMS
Grass/Forb/Shrub
Seedlings/Saplings, open canopy
Seedlings/Saplings, moderately closed canopy
Seedlings/Saplings, closed canopy
Young
Young
Young
Young
Young
Young
forest,
forest,
forest,
forest,
forest,
forest,
open canopy, single story
open canopy, multiple stories
moderately closed canopy, single story
moderately closed canopy, multiple stories
closed canopy, single story
closed canopy, multiple stories
Mid-aged
Mid-aged
Mid-aged
Mid-aged
Mid-aged
Mid-aged
forest,
forest,
forest,
forest,
forest,
forest,
open canopy, single story
open canopy, multiple stories
moderately closed canopy, single story
moderately closed canopy, multiple stories
closed canopy, single story
closed canopy, multiple stories
Mature
Mature
Mature
Mature
Mature
Mature
forest,
forest,
forest,
forest,
forest,
forest,
open canopy, single story
open canopy, multiple stories
moderately closed canopy, single story
moderately closed canopy, multiple stories
closed canopy, single story
closed canopy, multiple stories
Old forest, moderately closed canopy, single story
Old forest, moderately closed canopy, multiple stories
Old forest, closed canopy, single story
Old forest, closed canopy, multiple stories
LEGEND
Structural Stage:
1 Grass/Forb/Shrub
2 Seedlings/Saplings
3 Young Forest
4 Mid-Aged Forest
5 Mature Forest
6 Old Forest
Canopy Closure: A
B
C
Stories:
SS
MS
Single Story
Multiple Story
The vegetative structural stage describes the forest successional stage, canopy cover, and stories.
0-39 Percent, Open
40-59 Percent, Moderately Closed
60+ Percent, Closed
References:
1. Shaw, John D. 2010. Consistent Definition and Application of Reineke’s Stand Density
Index in Silviculture and Stand Projection. In: Jain, Theresa B.; Graham, Russell T.; and
Sandquist, Jonathan, tech eds. 2010. Integrated management of carbon sequestration and
biomass utilization opportunities in a changing climate: Proceedings of the 2009 National
Silviculture Workshop; 2009 June 15-18; Boise ID. Proceedings RMRS-P-61. Fort Collins,
CO: U.S. Department of Agriculture, Forest Service, Rocky Mountain Research Station. 199-
209.
2. Vandendriesche, Don. 2012. Desired Conditions vs. Diameter Limit Treatment, Forest
Vegetation Simulator Analysis. ”. U.S. Department of Agriculture – Southwestern Region
Forest Service, Internal publication.
3. Zeide, Boris. 1987. Analysis of the 3/2 Power Law of Self-Thinning. Forest Science 33(2):
517
Documentation Chronology:
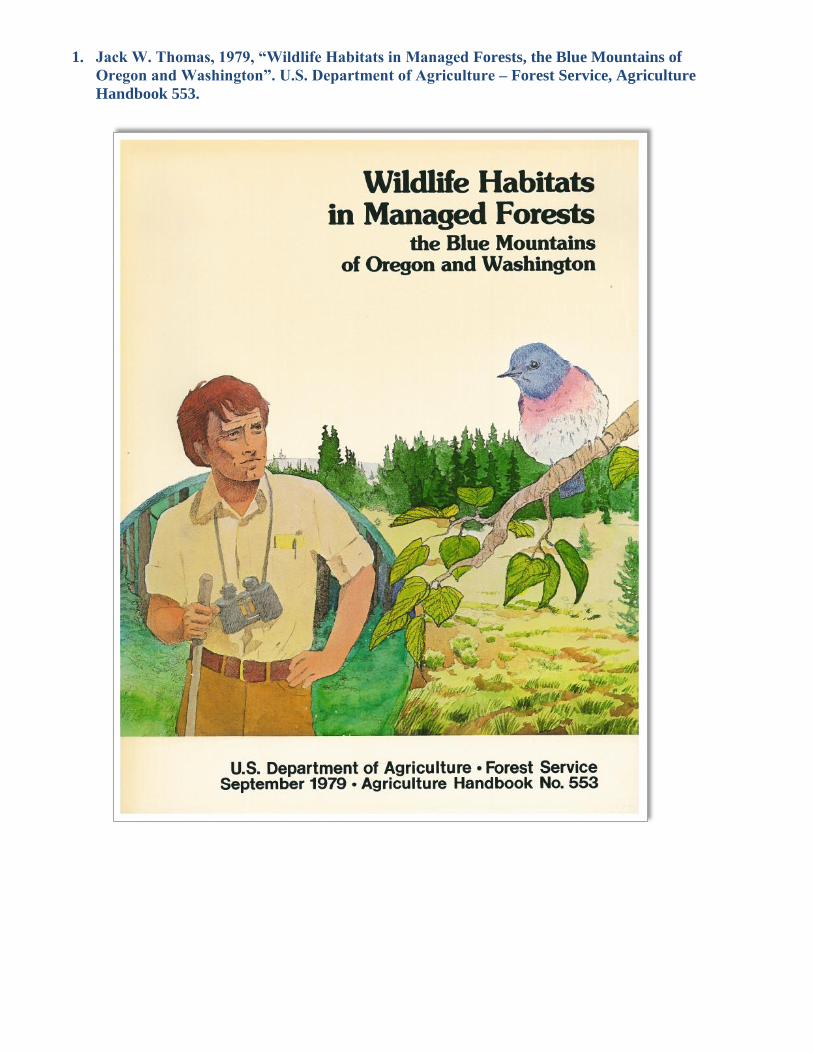
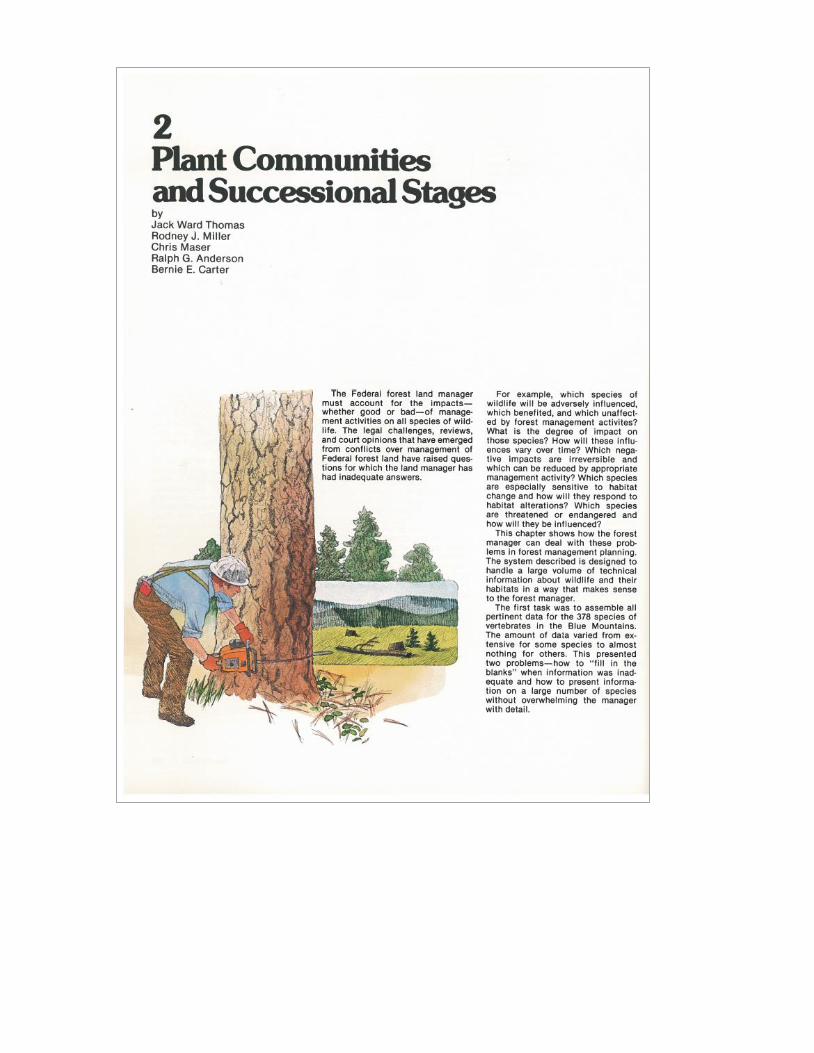
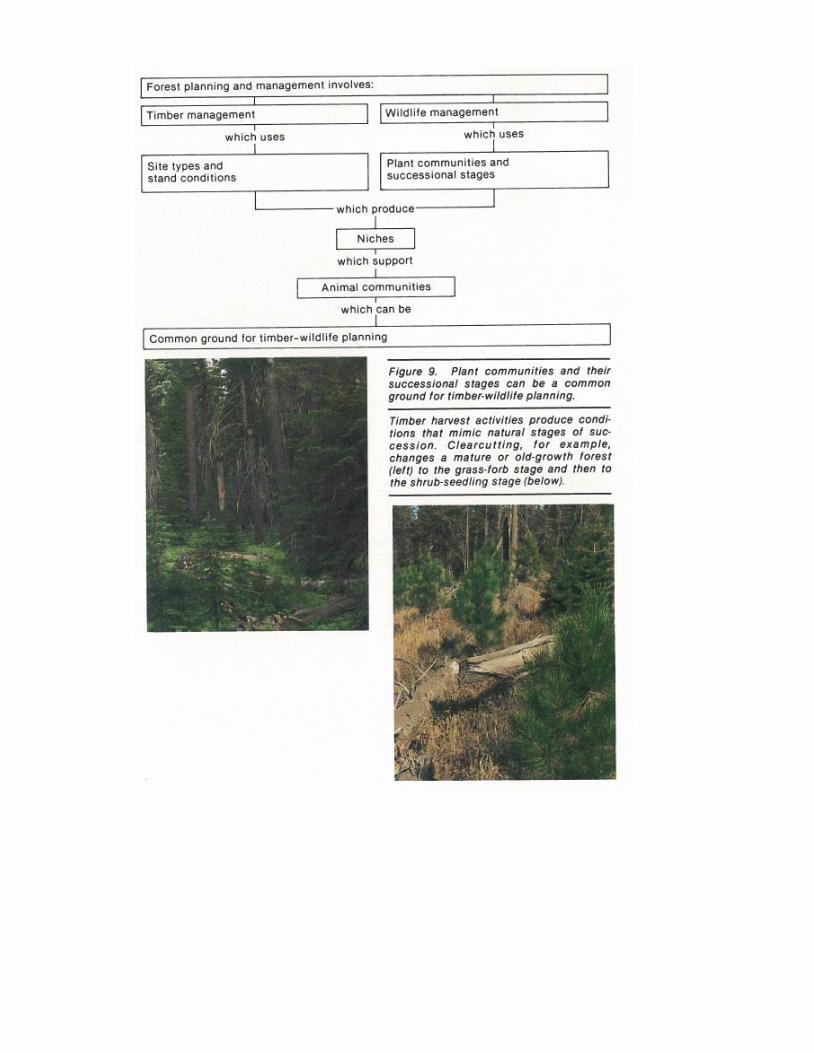
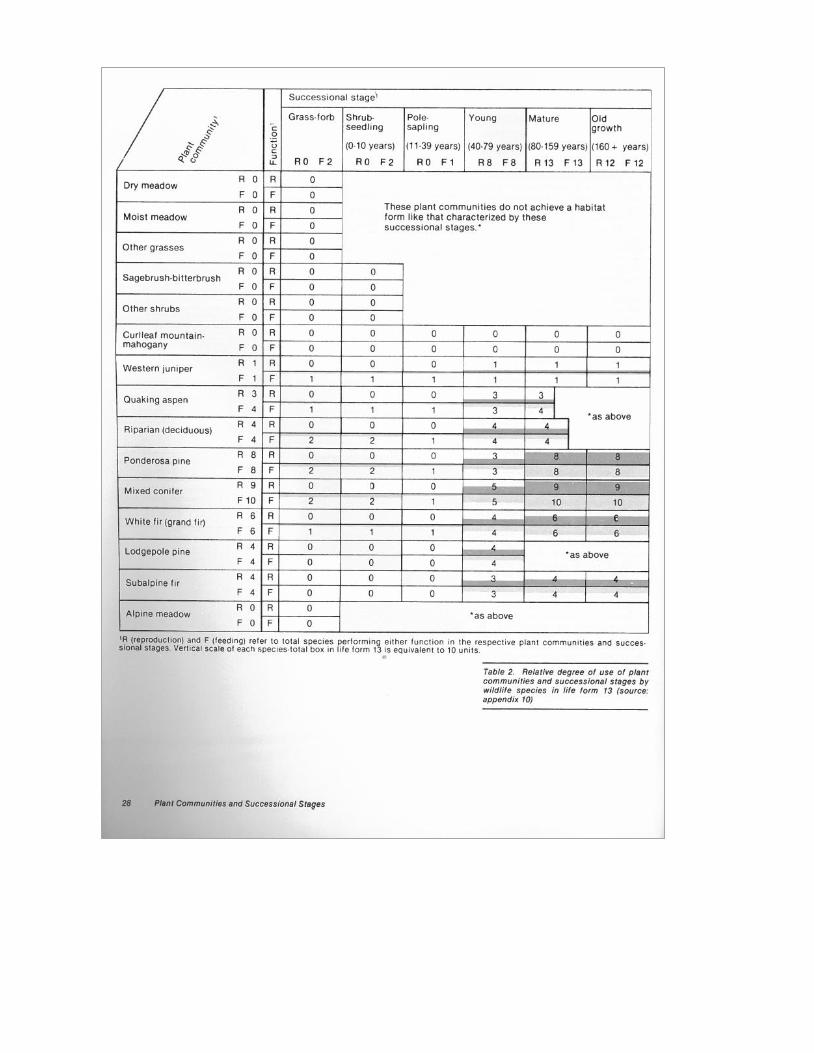
1. Jack W. Thomas, 1979, “Wildlife Habitats in Managed Forests, the Blue Mountains of
Oregon and Washington”. U.S. Department of Agriculture – Forest Service, Agriculture
Handbook 553.
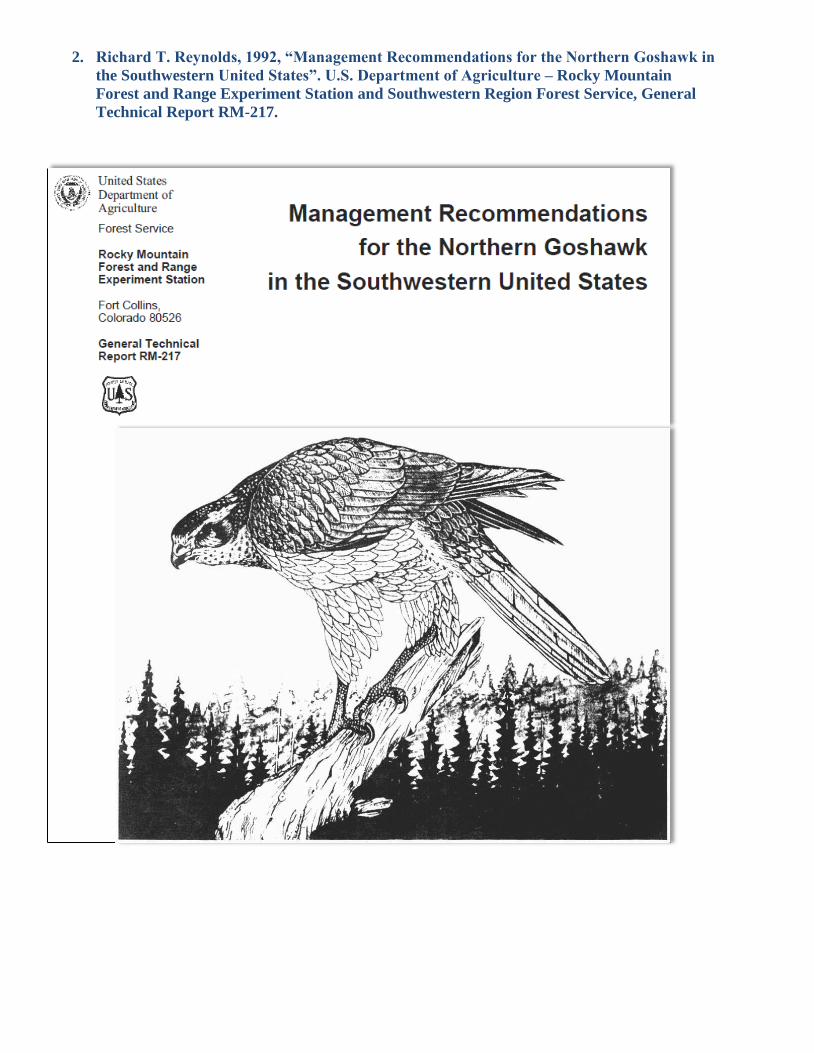
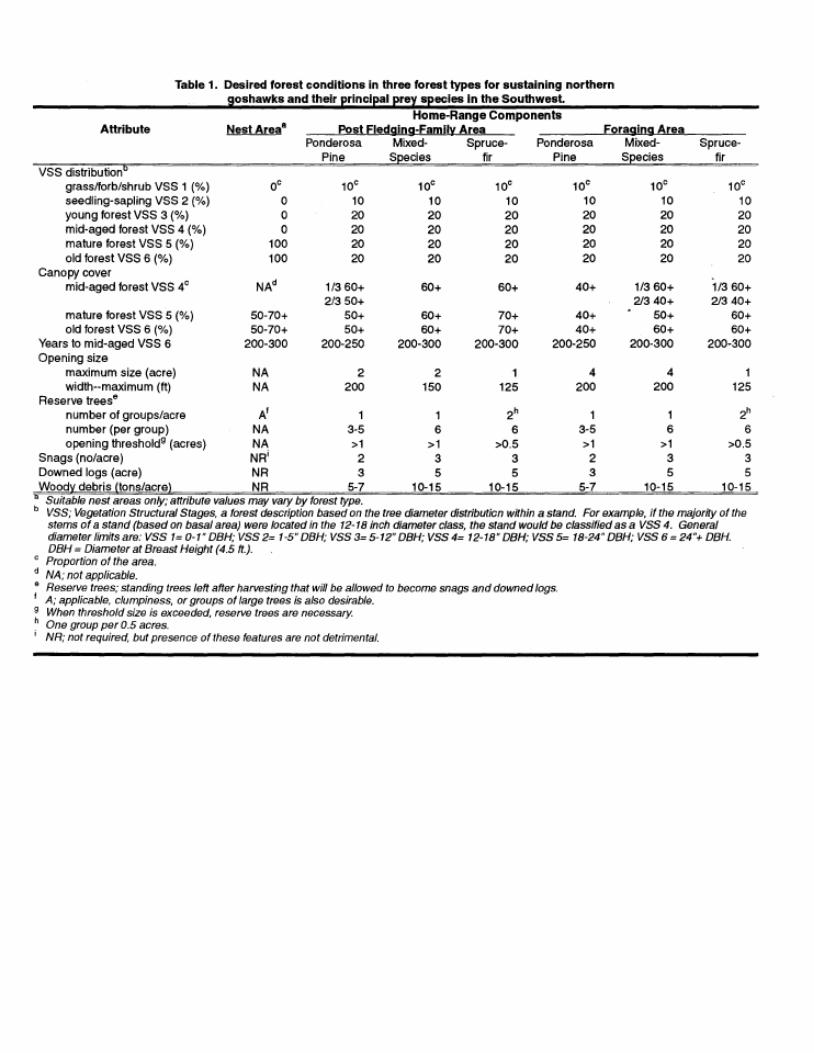
2. Richard T. Reynolds, 1992, “Management Recommendations for the Northern Goshawk in
the Southwestern United States”. U.S. Department of Agriculture – Rocky Mountain Forest
and Range Experiment Station and Southwestern Region Forest Service, General Technical
Report RM-217.
3. Patrick D. Jackson, 1992, “Vegetative Structural Stages, Description and Calculations,
Southwestern Region”. U.S. Department of Agriculture – Southwestern Region Forest
Service, Internal publication.
4. Patrick D. Jackson, 1993, “RMSTAND – Chapter 60: Data Processing and Interpretation”.
U.S. Department of Agriculture – Southwestern Region Forest Service, Internal publication.
5. Patrick D. Jackson, 2000, “Vegetative Structural Stages Calculations as Calculated by
RMSTAND”. U.S. Department of Agriculture – Southwestern Region Forest Service,
Internal publication.
6. Stephanie A. Rebain, 2009, “FVS VSS post processor”. U.S. Department of Agriculture –
Forest Management Service Center, Forest Vegetation Simulator, E-mail correspondence.
7. Stephanie A. Rebain, 2010, “VSS calculations”. U.S. Department of Agriculture – Forest
Management Service Center, Forest Vegetation Simulator, E-mail correspondence.
1. Jack W. Thomas, 1979, “Wildlife Habitats in Managed Forests, the Blue Mountains of
Oregon and Washington”. U.S. Department of Agriculture – Forest Service, Agriculture
Handbook 553.
2. Richard T. Reynolds, 1992, “Management Recommendations for the Northern Goshawk in
the Southwestern United States”. U.S. Department of Agriculture – Rocky Mountain
Forest and Range Experiment Station and Southwestern Region Forest Service, General
Technical Report RM-217.
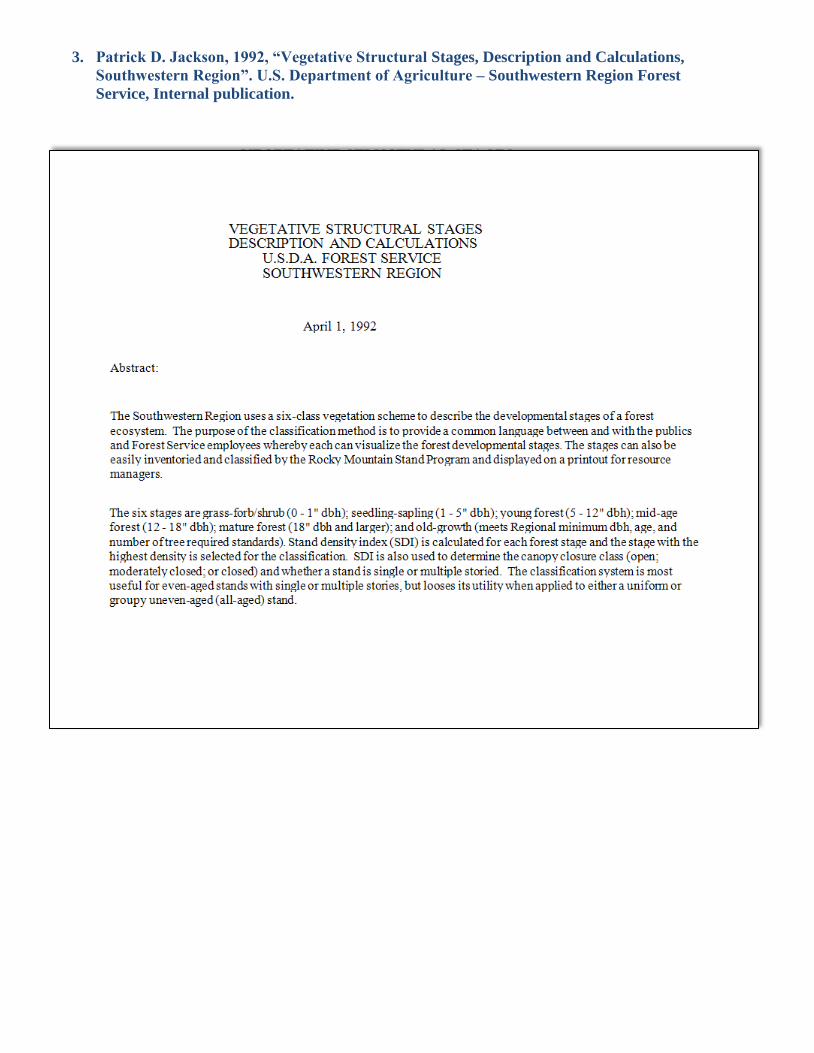
3. Patrick D. Jackson, 1992, “Vegetative Structural Stages, Description and Calculations,
Southwestern Region”. U.S. Department of Agriculture – Southwestern Region Forest
Service, Internal publication.
VEGETATIVE STRUCTURAL STAGES DESCRIPTION AND CALCULATIONS
U.S.D.A. FOREST SERVICE SOUTHWESTERN REGION
April 1, 1992
Abstract:
The Southwestern Region uses a six-class vegetation scheme to describe the developmental stages of a forest
ecosystem. The purpose of the classification method is to provide a common language between and with the publics
and Forest Service employees whereby each can visualize the forest developmental stages. The stages can also be
easily inventoried and classified by the Rocky Mountain Stand Program and displayed on a printout for resource
managers.
The six stages are grass-forb/shrub (0 - 1" dbh); seedling-sapling (1 - 5" dbh); young forest (5 - 12" dbh); mid-age
forest (12 - 18" dbh); mature forest (18" dbh and larger); and old-growth (meets Regional minimum dbh, age, and
number of tree required standards). Stand density index (SDI) is calculated for each forest stage and the stage with the
highest density is selected for the classification. SDI is also used to determine the canopy closure class (open;
moderately closed; or closed) and whether a stand is single or multiple storied. The classification system is most
useful for even-aged stands with single or multiple stories, but looses its utility when applied to either a uniform or
groupy uneven-aged (all-aged) stand.
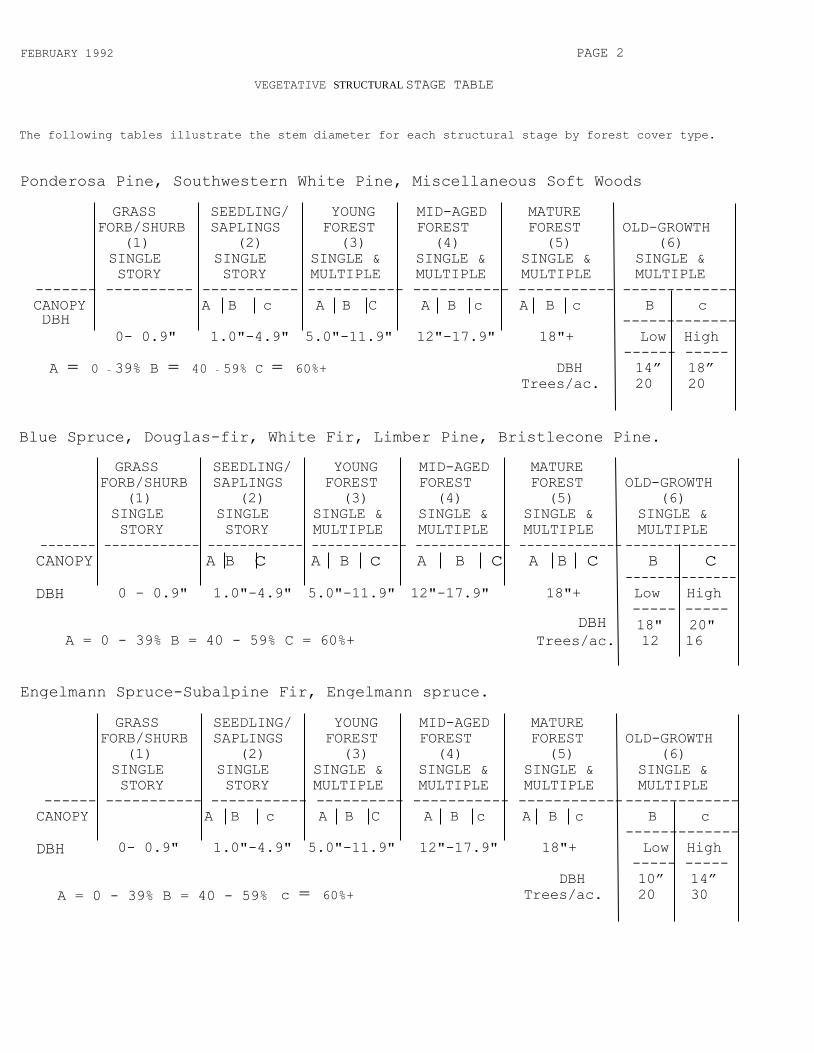
FEBRUARY 1992 PAGE 2
VEGETATIVE STRUCTURAL STAGE TABLE
The following tables illustrate the stem diameter for each structural stage by forest cover type.
Ponderosa Pine, Southwestern White Pine, Miscellaneous Soft Woods
A = 0 - 39% B = 40 - 59% C = 60%+
GRASS SEEDLING/ YOUNG MID-AGED MATURE
FORB/SHURB SAPLINGS FOREST FOREST FOREST OLD-GROWTH
(1) (2) (3) (4) (5) (6)
SINGLE SINGLE SINGLE & SINGLE & SINGLE & SINGLE &
STORY STORY MULTIPLE MULTIPLE MULTIPLE MULTIPLE
------- ---------- ----------- ----------- ----------- ----------- -------------
CANOPY A B c A B C A B c A B c B c
-------------
0- 0.9" 1.0"-4.9" 5.0"-11.9" 12"-17.9" 18"+ Low High
------ -----
DBH 14” 18”
Trees/ac. 20 20
DBH
Blue Spruce, Douglas-fir, White Fir, Limber Pine, Bristlecone Pine.
A = 0 - 39% B = 40 - 59% C = 60%+
GRASS SEEDLING/ YOUNG MID-AGED MATURE
FORB/SHURB SAPLINGS FOREST FOREST FOREST OLD-GROWTH
(1) (2) (3) (4) (5) (6)
SINGLE SINGLE SINGLE & SINGLE & SINGLE & SINGLE &
STORY STORY MULTIPLE MULTIPLE MULTIPLE MULTIPLE
------- ------------ ------------ ------------ ------------ ------------- --------------
CANOPY A B c A B c A B c A B c B c
--------------
0 - 0.9" 1.0"-4.9" 5.0"-11.9" 12"-17.9" 18"+ Low High
----- -----
18" 20"
Trees/ac. 12 16
DBH
DBH
Engelmann Spruce-Subalpine Fir, Engelmann spruce.
A = 0 - 39% B = 40 - 59%
GRASS SEEDLING/ YOUNG MID-AGED MATURE
FORB/SHURB SAPLINGS FOREST FOREST FOREST OLD-GROWTH
(1) (2) (3) (4) (5) (6)
SINGLE SINGLE SINGLE & SINGLE & SINGLE & SINGLE &
STORY STORY MULTIPLE MULTIPLE MULTIPLE MULTIPLE
------ ----------- ----------- ---------- ----------- ------------ -------------
CANOPY A B c A B C A B c A B c B c
-------------
0- 0.9" 1.0"-4.9" 5.0"-11.9" 12"-17.9" 18"+ Low High
----- -----
DBH 10” 14”
Trees/ac. 20 30
DBH
c = 60%+
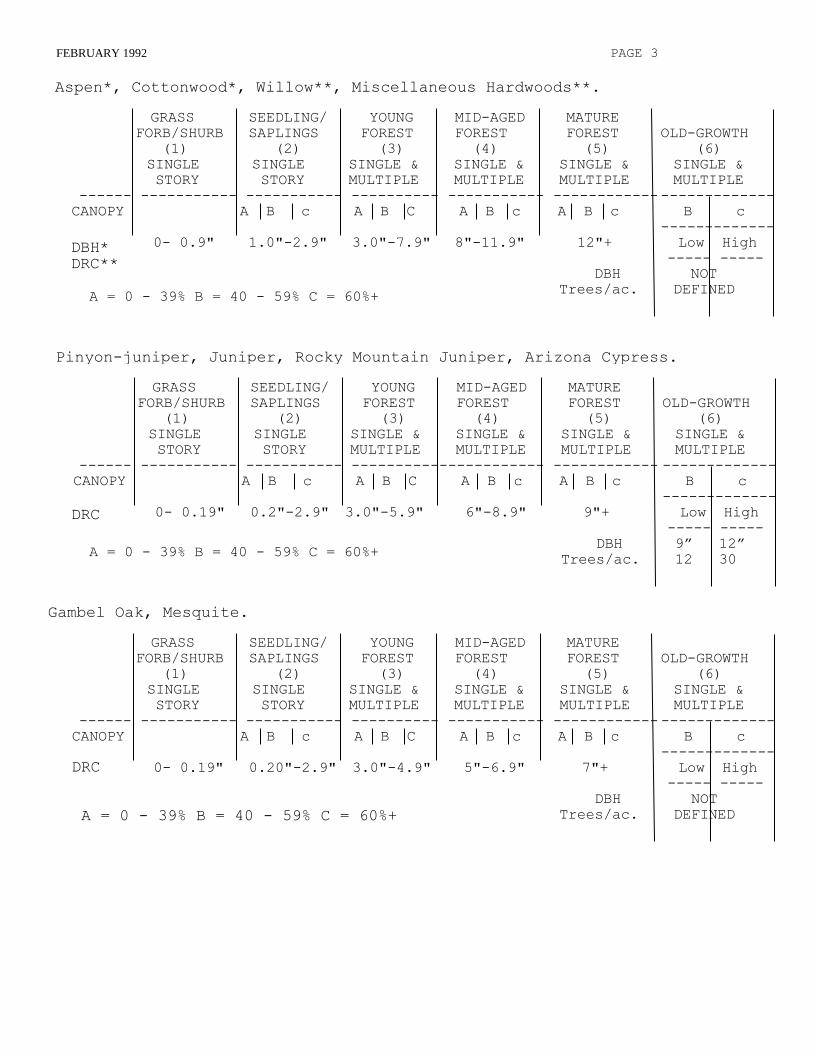
FEBRUARY 1992 PAGE 3
Aspen*, Cottonwood*, Willow**, Miscellaneous Hardwoods**.
A = 0 - 39% B = 40 - 59% C = 60%+
GRASS SEEDLING/ YOUNG MID-AGED MATURE
FORB/SHURB SAPLINGS FOREST FOREST FOREST OLD-GROWTH
(1) (2) (3) (4) (5) (6)
SINGLE SINGLE SINGLE & SINGLE & SINGLE & SINGLE &
STORY STORY MULTIPLE MULTIPLE MULTIPLE MULTIPLE
------ ----------- ----------- ---------- ----------- ------------ -------------
CANOPY A B c A B C A B c A B c B c
-------------
0- 0.9" 1.0"-2.9" 3.0"-7.9" 8"-11.9" 12"+ Low High
----- -----
DBH NOT
Trees/ac. DEFINED
DBH*
DRC**
Pinyon-juniper, Juniper, Rocky Mountain Juniper, Arizona Cypress.
A = 0 - 39% B = 40 - 59% C = 60%+
GRASS SEEDLING/ YOUNG MID-AGED MATURE
FORB/SHURB SAPLINGS FOREST FOREST FOREST OLD-GROWTH
(1) (2) (3) (4) (5) (6)
SINGLE SINGLE SINGLE & SINGLE & SINGLE & SINGLE &
STORY STORY MULTIPLE MULTIPLE MULTIPLE MULTIPLE
------ ----------- ----------- ---------------------- ------------ -------------
CANOPY A B c A B C A B c A B c B c
-------------
0- 0.19" 0.2"-2.9" 3.0"-5.9" 6"-8.9" 9"+ Low High
----- -----
DBH 9” 12”
Trees/ac. 12 30
DRC
Gambel Oak, Mesquite.
A = 0 - 39% B = 40 - 59% C = 60%+
GRASS SEEDLING/ YOUNG MID-AGED MATURE
FORB/SHURB SAPLINGS FOREST FOREST FOREST OLD-GROWTH
(1) (2) (3) (4) (5) (6)
SINGLE SINGLE SINGLE & SINGLE & SINGLE & SINGLE &
STORY STORY MULTIPLE MULTIPLE MULTIPLE MULTIPLE
------ ----------- ----------- ---------- ----------- ------------ -------------
CANOPY A B c A B C A B c A B c B c
-------------
0- 0.19" 0.20"-2.9" 3.0"-4.9" 5"-6.9" 7"+ Low High
----- -----
DBH NOT
Trees/ac. DEFINED
DRC
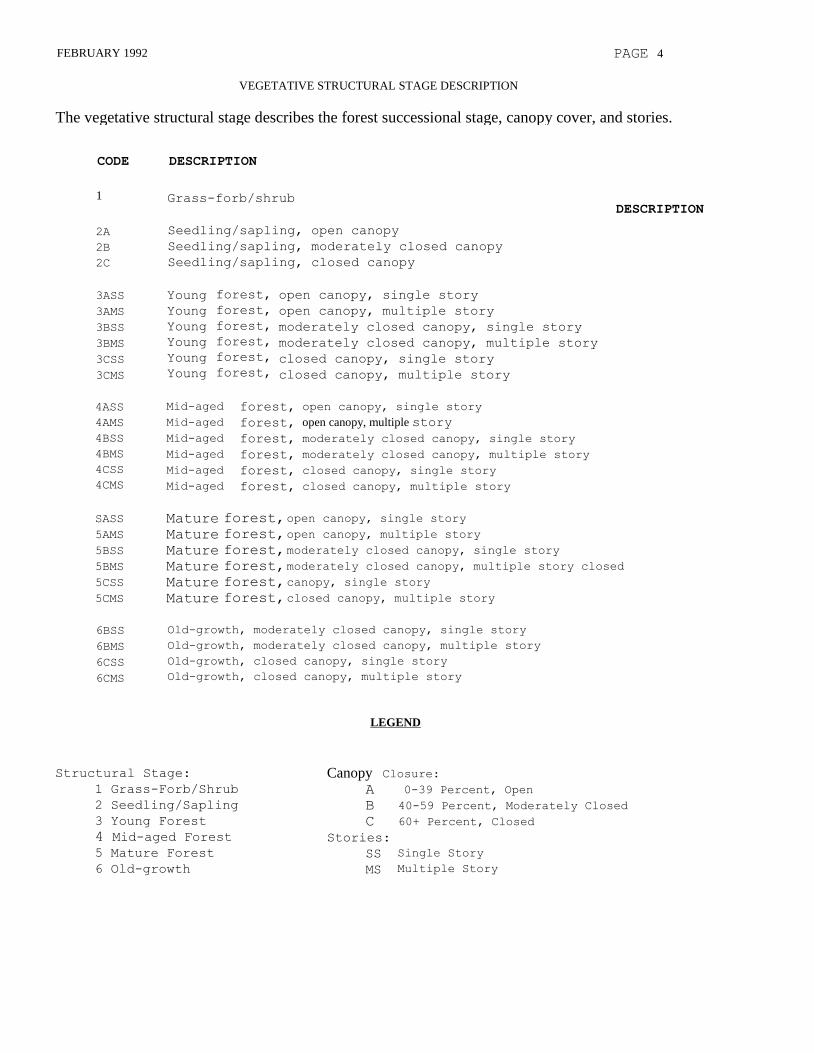
FEBRUARY 1992 PAGE 4
VEGETATIVE STRUCTURAL STAGE DESCRIPTION
The vegetative structural stage describes the forest successional stage, canopy cover, and stories.
CODE DESCRIPTION
1
2A
2B
2C
3ASS
3AMS
3BSS
3BMS
3CSS
3CMS
4ASS
4AMS
4BSS
4BMS
4CSS
4CMS
SASS
5AMS
5BSS
5BMS
5CSS
5CMS "
6BSS
6BMS
6CSS
6CMS
DESCRIPTION Grass-forb/shrub
Seedling/sapling, open canopy
Seedling/sapling, moderately closed canopy
Seedling/sapling, closed canopy
Young
Young
Young
Young
Young
Young
forest,
forest,
forest,
forest,
forest,
forest,
open canopy, single story
open canopy, multiple story
moderately closed canopy, single story
moderately closed canopy, multiple story
closed canopy, single story
closed canopy, multiple story
Mid-aged
Mid-aged
Mid-aged
Mid-aged
Mid-aged
Mid-aged
forest,
forest,
forest,
forest,
forest,
forest,
open canopy, single story
open canopy, multiple story
moderately closed canopy, single story
moderately closed canopy, multiple story
closed canopy, single story
closed canopy, multiple story
Mature
Mature
Mature
Mature
Mature
Mature
forest,
forest,
forest,
forest,
forest,
forest,
open canopy, single story
open canopy, multiple story
moderately closed canopy, single story
moderately closed canopy, multiple story closed
canopy, single story
closed canopy, multiple story
Old-growth, moderately closed canopy, single story
Old-growth, moderately closed canopy, multiple story
Old-growth, closed canopy, single story
Old-growth, closed canopy, multiple story
LEGEND
Structural Stage:
1 Grass-Forb/Shrub
2 Seedling/Sapling
3 Young Forest
4 Mid-aged Forest
5 Mature Forest
6 Old-growth
Closure:
0-39 Percent, Open
40-59 Percent, Moderately Closed
60+ Percent, Closed
Canopy A
B
C
Stories:
SS
MS
Single Story
Multiple Story
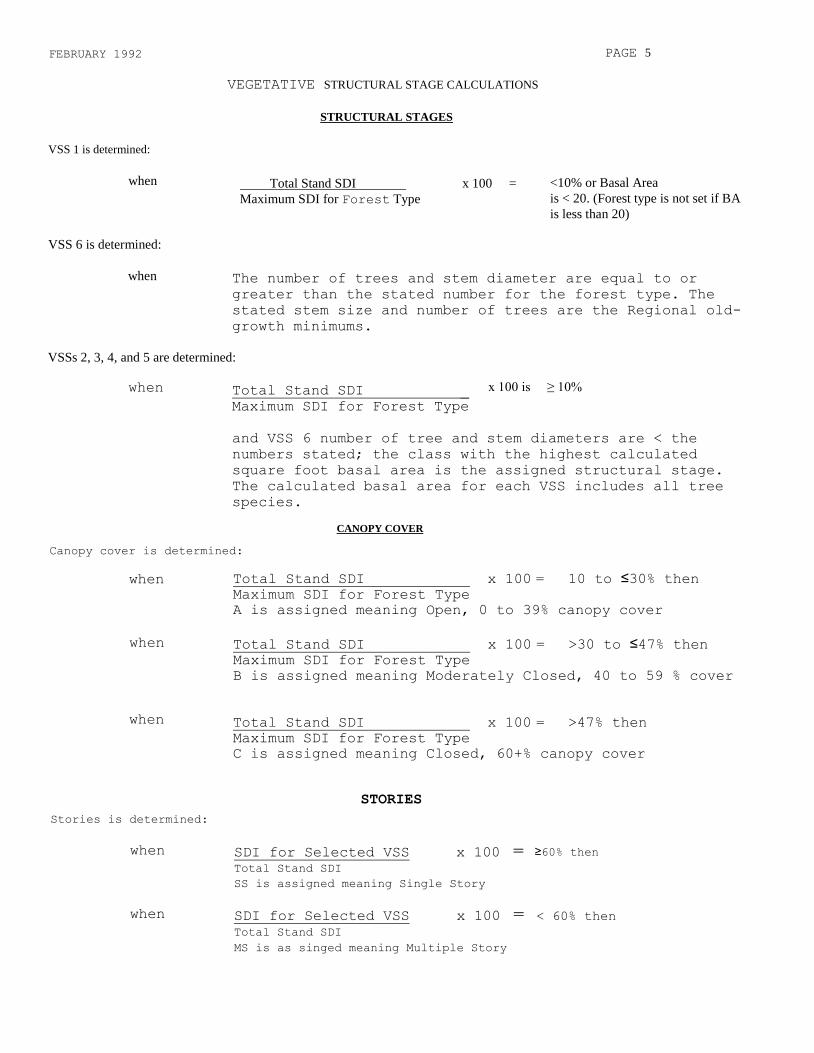
FEBRUARY 1992 PAGE 5
VEGETATIVE STRUCTURAL STAGE CALCULATIONS
STRUCTURAL STAGES
VSS 1 is determined:
when Total Stand SDI x 100 =
Maximum SDI for Forest Type
= <10% or Basal Area
is < 20. (Forest type is not set if BA
is less than 20)
VSS 6 is determined:
when The number of trees and stem diameter are equal to or
greater than the stated number for the forest type. The
stated stem size and number of trees are the Regional old-
growth minimums.
VSSs 2, 3, 4, and 5 are determined:
when Total Stand SDI _
Maximum SDI for Forest Type
and VSS 6 number of tree and stem diameters are < the
numbers stated; the class with the highest calculated
square foot basal area is the assigned structural stage.
The calculated basal area for each VSS includes all tree
species.
x 100 is ≥ 10%
CANOPY COVER
Canopy cover is determined:
when Total Stand SDI x 100 = 10 to ≤30% then Maximum SDI for Forest Type
A is assigned meaning Open, 0 to 39% canopy cover
when Total Stand SDI x 100 = >30 to ≤47% then Maximum SDI for Forest Type
B is assigned meaning Moderately Closed, 40 to 59 % cover
when Total Stand SDI x 100 = >47% then
Maximum SDI for Forest Type
C is assigned meaning Closed, 60+% canopy cover
STORIES
Stories is determined:
when SDI for Selected VSS x 100 = Total Stand SDI
SS is assigned meaning Single Story
≥60% then
when SDI for Selected VSS x 100 = < 60% then Total Stand SDI
MS is as singed meaning Multiple Story
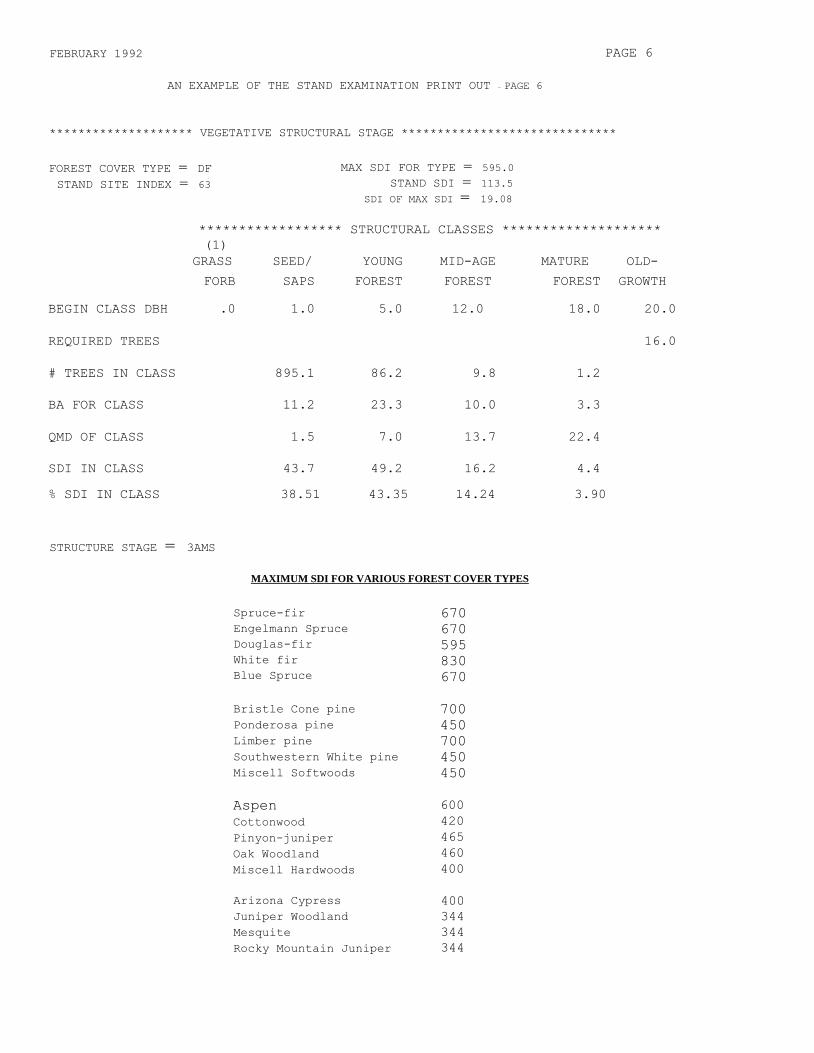
FEBRUARY 1992 PAGE 6
AN EXAMPLE OF THE STAND EXAMINATION PRINT OUT - PAGE 6
******************** VEGETATIVE STRUCTURAL STAGE ******************************
FOREST COVER TYPE = DF STAND SITE INDEX = 63
MAX SDI FOR TYPE = 595.0 STAND SDI = 113.5 SDI OF MAX SDI = 19.08
****************** STRUCTURAL CLASSES ********************
(1)
GRASS SEED/ YOUNG MID-AGE MATURE OLD-
FORB SAPS FOREST FOREST FOREST GROWTH
BEGIN CLASS DBH .0 1.0 5.0 12.0 18.0 20.0
REQUIRED TREES 16.0
# TREES IN CLASS 895.1 86.2 9.8 1.2
BA FOR CLASS 11.2 23.3 10.0 3.3
QMD OF CLASS 1.5 7.0 13.7 22.4
SDI IN CLASS 43.7 49.2 16.2 4.4
% SDI IN CLASS 38.51 43.35 14.24 3.90
STRUCTURE STAGE = 3AMS
MAXIMUM SDI FOR VARIOUS FOREST COVER TYPES
Spruce-fir
Engelmann Spruce
Douglas-fir
White fir
Blue Spruce
Bristle Cone pine
Ponderosa pine
Limber pine
Southwestern White pine
Miscell Softwoods
Aspen
Cottonwood
Pinyon-juniper
Oak Woodland
Miscell Hardwoods
Arizona Cypress
Juniper Woodland
Mesquite
Rocky Mountain Juniper
670
670
595
830
670
700
450
700
450
450
600
420
465
460
400
400
344
344
344
FEBRUARY 1992 PAGE 7
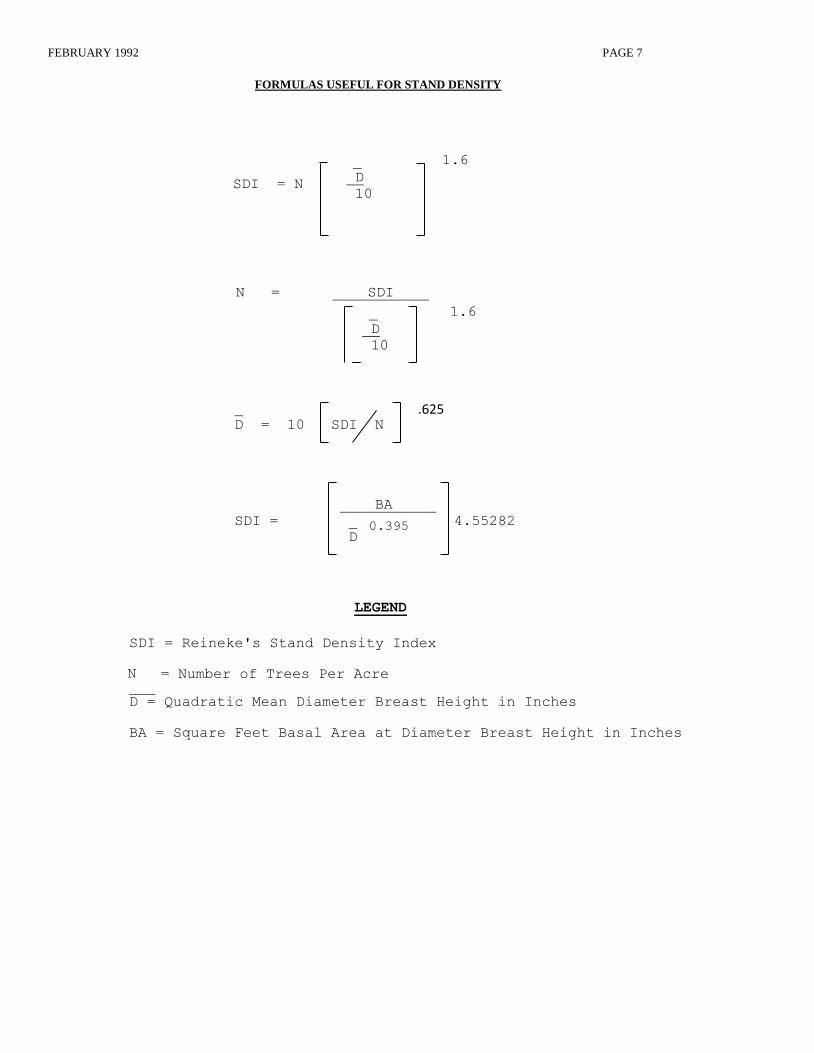
FORMULAS USEFUL FOR STAND DENSITY
SDI = N
SDI = Reineke's Stand Density Index
N = Number of Trees Per Acre __
D = Quadratic Mean Diameter Breast Height in Inches
BA = Square Feet Basal Area at Diameter Breast Height in Inches
_ D
10
1.6
N = ____SDI____
_ D
10
1.6
_
D = 10 SDI N
.625
____BA_____
SDI = _ 4.55282
D
LEGEND
0.395
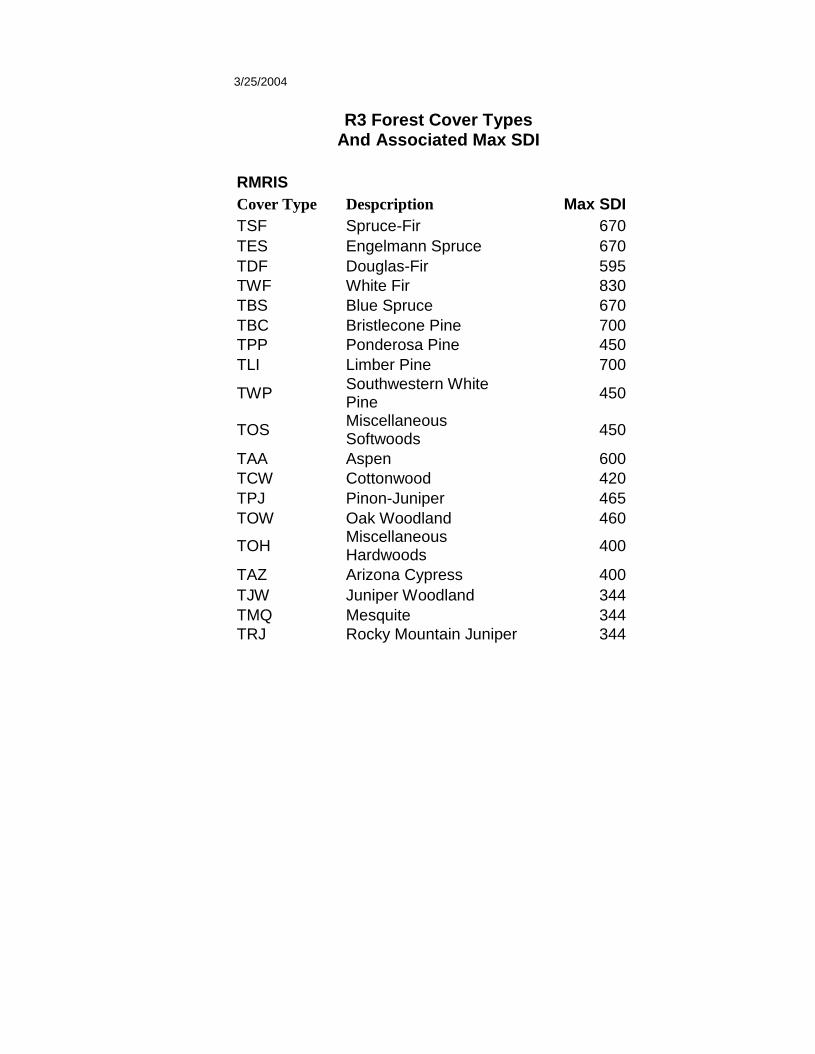
3/25/2004
R3 Forest Cover Types And Associated Max SDI
RMRIS
Cover Type Despcription Max SDI
TSF Spruce-Fir 670
TES Engelmann Spruce 670
TDF Douglas-Fir 595
TWF White Fir 830
TBS Blue Spruce 670
TBC Bristlecone Pine 700
TPP Ponderosa Pine 450
TLI Limber Pine 700
TWP Southwestern White Pine
450
TOS Miscellaneous Softwoods
450
TAA Aspen 600
TCW Cottonwood 420
TPJ Pinon-Juniper 465
TOW Oak Woodland 460
TOH Miscellaneous Hardwoods
400
TAZ Arizona Cypress 400
TJW Juniper Woodland 344
TMQ Mesquite 344
TRJ Rocky Mountain Juniper 344
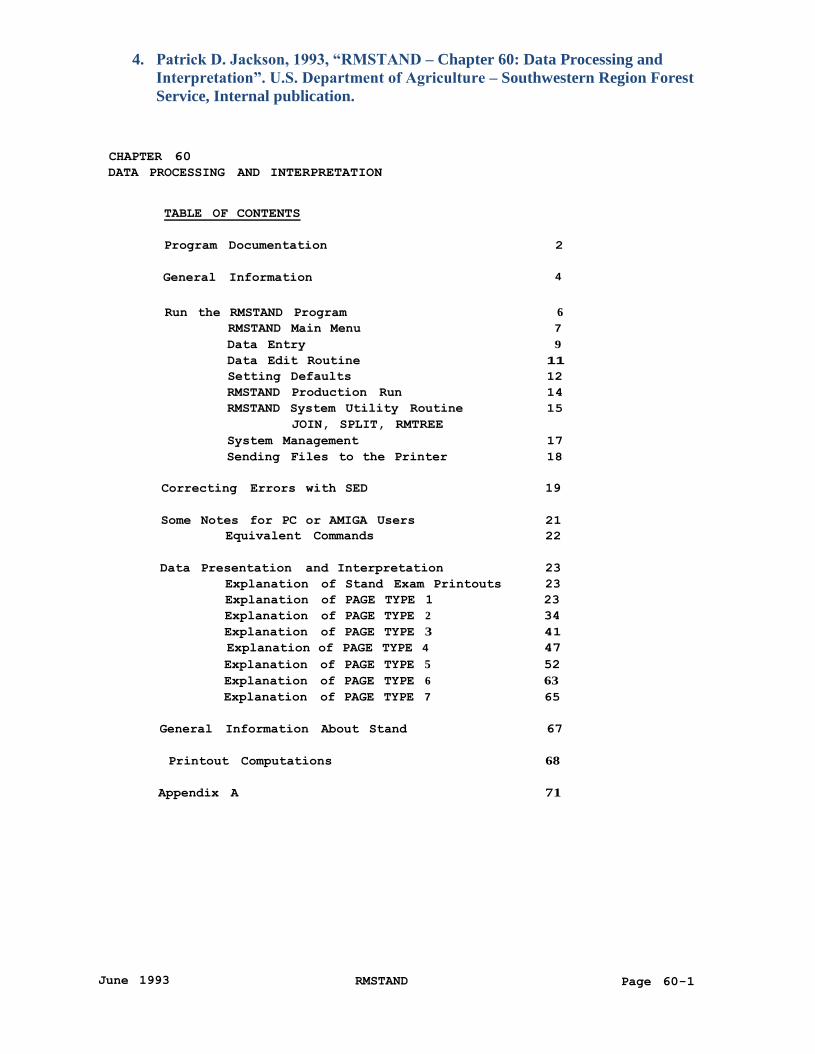
4. Patrick D. Jackson, 1993, “RMSTAND – Chapter 60: Data Processing and
Interpretation”. U.S. Department of Agriculture – Southwestern Region Forest
Service, Internal publication.
CHAPTER 60
DATA PROCESSING AND INTERPRETATION
TABLE OF CONTENTS
Program Documentation 2
General Information 4
Run the RMSTAND Program 6
RMSTAND Main Menu 7
Data Entry 9
Data Edit Routine 11
Setting Defaults 12
RMSTAND Production Run 14
RMSTAND System Utility Routine 15
JOIN, SPLIT, RMTREE
System Management 17
Sending Files to the Printer 18
Correcting Errors with SED 19
Some Notes for PC or AMIGA Users 21
Equivalent Commands 22
Data Presentation and Interpretation 23
Explanation of Stand Exam Printouts 23
Explanation of PAGE TYPE 1 23
Explanation of PAGE TYPE 2 34
Explanation of PAGE TYPE 3 41
Explanation of PAGE TYPE 4 47
Explanation of PAGE TYPE 5 52
Explanation of PAGE TYPE 6 63
Explanation of PAGE TYPE 7 65
General Information About Stand 67
Printout Computations 68
Appendix A 71
June 1993 RMSTAND Page 60-1
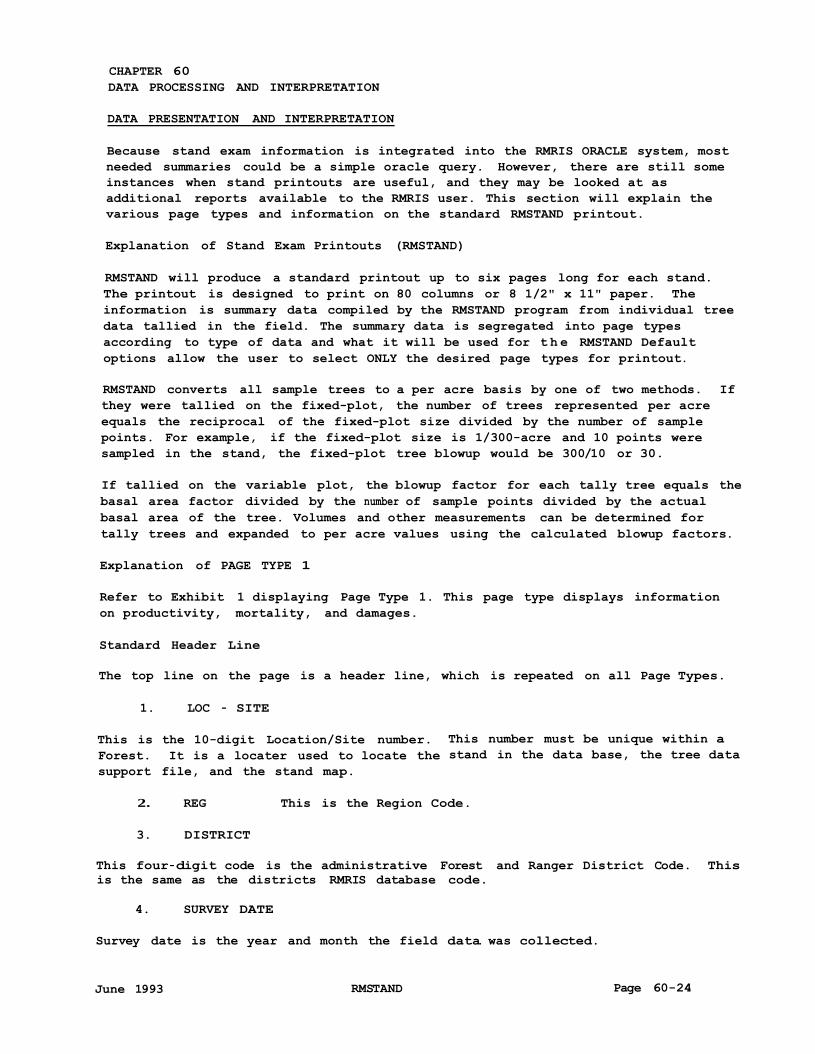
CHAPTER 60
DATA PROCESSING AND INTERPRETATION
DATA PRESENTATION AND INTERPRETATION
Because stand exam information is integrated into the RMRIS ORACLE system, most
needed summaries could be a simple oracle query. However, there are still some
instances when stand printouts are useful, and they may be looked at as
additional reports available to the RMRIS user. This section will explain the
various page types and information on the standard RMSTAND printout.
Explanation of Stand Exam Printouts (RMSTAND)
RMSTAND will produce a standard printout up to six pages long for each stand.
The printout is designed to print on 80 columns or 8 1/2" x 11" paper. The
information is summary data compiled by the RMSTAND program from individual tree
data tallied in the field. The summary data is segregated into page types
according to type of data and what it will be used for t h e RMSTAND Default
options allow the user to select ONLY the desired page types for printout.
RMSTAND converts all sample trees to a per acre basis by one of two methods. If
they were tallied on the fixed-plot, the number of trees represented per acre
equals the reciprocal of the fixed-plot size divided by the number of sample
points. For example, if the fixed-plot size is 1/300-acre and 10 points were
sampled in the stand, the fixed-plot tree blowup would be 300/10 or 30.
If tallied on the variable plot, the blowup factor for each tally tree equals the
basal area factor divided by the number of sample points divided by the actual
basal area of the tree. Volumes and other measurements can be determined for
tally trees and expanded to per acre values using the calculated blowup factors.
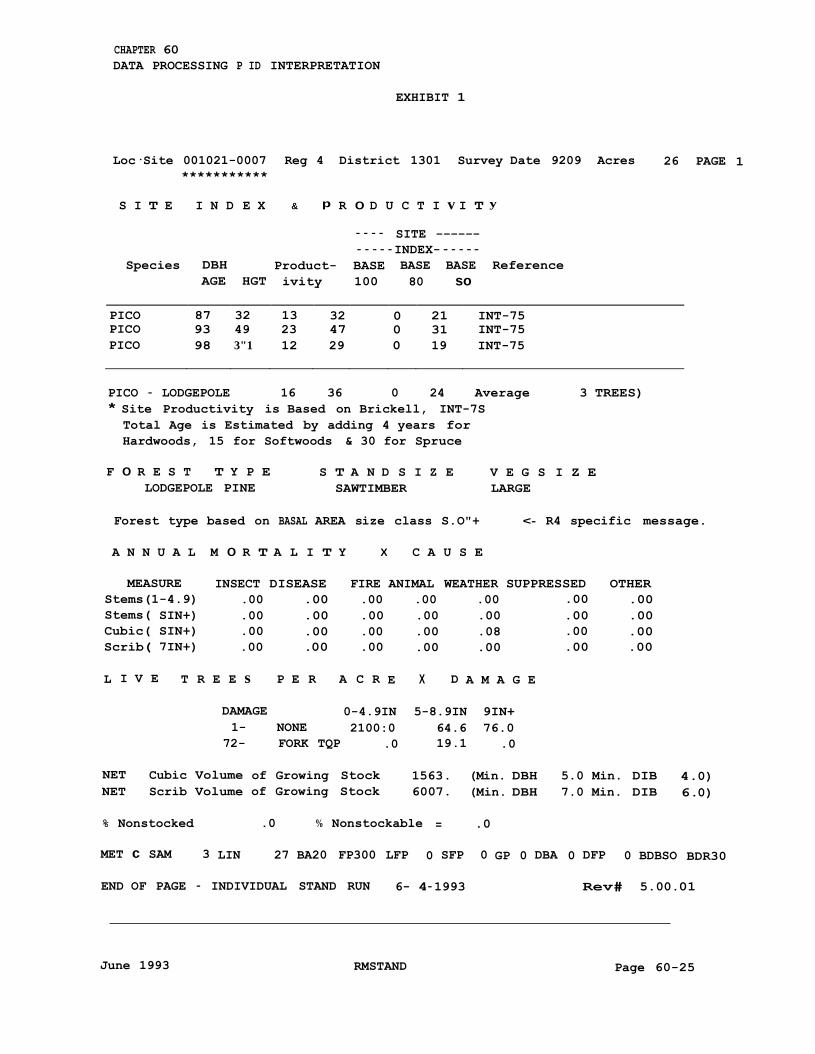
Explanation of PAGE TYPE 1
Refer to Exhibit 1 displaying Page Type 1. This page type displays information
on productivity, mortality, and damages.
Standard Header Line
The top line on the page is a header line, which is repeated on all Page Types.
1. LOC - SITE
This is the 10-digit Location/Site number.
Forest. It is a locater used to locate the
support file, and the stand map.
This number must be unique within a
stand in the data base, the tree data
2. REG This is the Region Code.
3. DISTRICT
This four-digit code is the administrative Forest and Ranger District Code. This
is the same as the districts RMRIS database code.
4. SURVEY DATE
Survey date is the year and month the field data. was collected.
June 1993 RMSTAND Page 60-24
CHAPTER 60
DATA PROCESSING P ID INTERPRETATION
EXHIBIT 1
Loc·Site 001021-0007 Reg 4 District 1301 Survey Date 9209 Acres 26 PAGE 1
***********
S I T E I N D E X & p R 0 D U C T I v I T y
- - - - SITE ------
- - - - -INDEX- - - - - -
Species DBH Product- BASE BASE BASE Reference
AGE HGT ivity 100 80 so
PICO 87 32 13 32 0 21 INT-75
PICO 93 49 23 47 0 31 INT-75
PICO 98 3"1 12 29 0 19 INT-75
PICO - LODGEPOLE 16 36 0 24 Average
* Site Productivity is Based on Brickell, INT-7S
Total Age is Estimated by adding 4 years for
Hardwoods, 15 for Softwoods & 30 for Spruce
3 TREES)
F 0 R E S T T Y P E
LODGEPOLE PINE
S T A N D S I Z E
SAWTIMBER
V E G S I Z E
LARGE
Forest type based on BASAL AREA size class S.O"+ <- R4 specific message.
A N N U A L M 0 R T A L I T Y X C A U S E
MEASURE INSECT DISEASE FIRE ANIMAL WEATHER SUPPRESSED OTHER
Stems(1-4.9) .00 .00 .00 .00 .00 .00 .00
Stems( SIN+) .00 .00 .00 .00 .00 .00 .00
Cubic( SIN+) .00 .00 .00 .00 .08 .00 .00
Scrib( 7IN+) .00 .00 .00 .00 .00 .00 .00
L I V E T R E E s P E R A C R E X D A M A G E
DAMAGE 0-4.9IN 5-8.9IN 9IN+
1- NONE 2100:0 64.6 76.0
72- FORK TQP .0 19.1 .0
NET Cubic Volume of Growing Stock 1563. (Min. DBH 5.0 Min. DIB
4.0)
NET Scrib Volume of Growing Stock 6007. (Min. DBH 7.0 Min. DIB 6.0)
% Nonstocked .0 % Nonstockable = .0
MET c SAM 3 LIN 27 BA20 FP300 LFP 0 SFP 0 GP 0 DBA 0 DFP 0 BDBSO BDR30
END OF PAGE - INDIVIDUAL STAND RUN 6- 4-1993 Rev# 5.00.01
June 1993 RMSTAND Page 60-25
CHAPTER 60
DATA PROCESSING AND INTERPRETATION
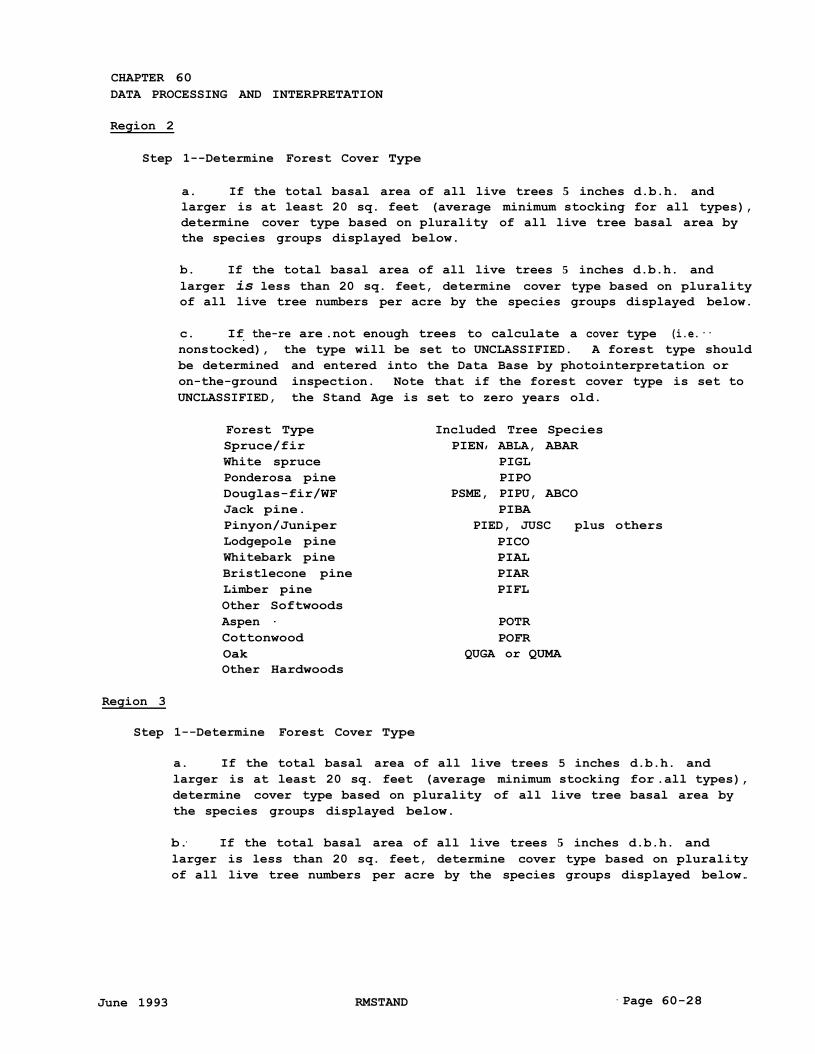
Region 2
Step 1--Determine Forest Cover Type
a. If the total basal area of all live trees 5 inches d.b.h. and
larger is at least 20 sq. feet (average minimum stocking for all types),
determine cover type based on plurality of all live tree basal area by
the species groups displayed below.
b. If the total basal area of all live trees 5 inches d.b.h. and
larger is less than 20 sq. feet, determine cover type based on plurality
of all live tree numbers per acre by the species groups displayed below.
c. If_ the-re are .not enough trees to calculate a cover type (i.e.··
nonstocked), the type will be set to UNCLASSIFIED. A forest type should
be determined and entered into the Data Base by photointerpretation or
on-the-ground inspection. Note that if the forest cover type is set to
UNCLASSIFIED, the Stand Age is set to zero years old.
Forest Type
Spruce/fir
White spruce
Ponderosa pine
Douglas-fir/WF
Jack pine.
Pinyon/Juniper
Lodgepole pine
Whitebark pine
Bristlecone pine
Limber pine
Other Softwoods
Aspen -
Cottonwood
Oak
Other Hardwoods
Included Tree Species
PIEN I ABLA, ABAR
PIGL
PIPO
PSME, PIPU, ABCO
PIBA
PIED, JUSC plus others
PICO
PIAL
PIAR
PIFL
POTR
POFR
QUGA or QUMA
Region 3
Step 1--Determine Forest Cover Type
a. If the total basal area of all live trees 5 inches d.b.h. and
larger is at least 20 sq. feet (average minimum stocking for .all types),
determine cover type based on plurality of all live tree basal area by
the species groups displayed below.
b.· If the total basal area of all live trees 5 inches d.b.h. and
larger is less than 20 sq. feet, determine cover type based on plurality
of all live tree numbers per acre by the species groups displayed below..
June 1993 RMSTAND · Page 60-28
CHAPTER 60
DATA PROCESSING AND INTERPRETATION
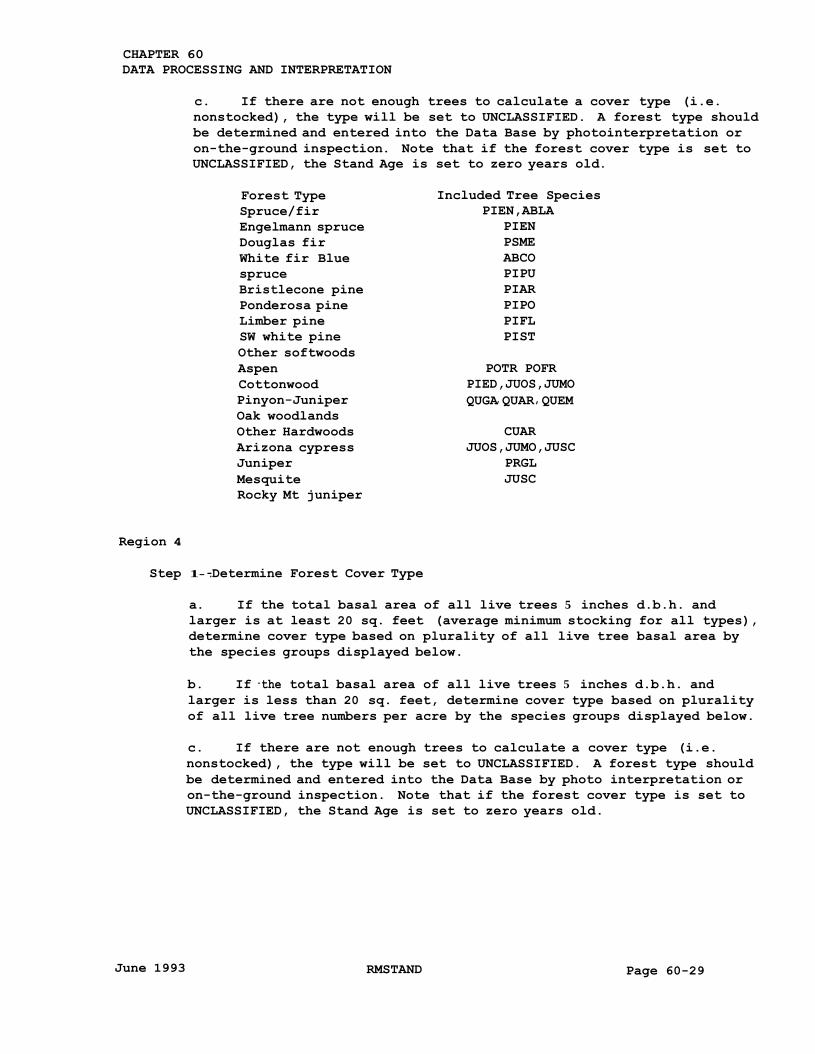
c. If there are not enough trees to calculate a cover type (i.e.
nonstocked), the type will be set to UNCLASSIFIED. A forest type should
be determined and entered into the Data Base by photointerpretation or
on-the-ground inspection. Note that if the forest cover type is set to
UNCLASSIFIED, the Stand Age is set to zero years old.
Forest Type
Spruce/fir
Engelmann spruce
Douglas fir
White fir Blue
spruce
Bristlecone pine
Ponderosa pine
Limber pine
SW white pine
Other softwoods
Aspen
Cottonwood
Pinyon-Juniper
Oak woodlands
Other Hardwoods
Arizona cypress
Juniper
Mesquite
Rocky Mt juniper
Included Tree Species
PIEN,ABLA
PIEN
PSME
ABCO
PIPU
PIAR
PIPO
PIFL
PIST
POTR POFR
PIED,JUOS,JUMO
QUGAI QUAR I QUEM
CUAR
JUOS,JUMO,JUSC
PRGL
JUSC
Region 4
Step 1- -.Determine Forest Cover Type
a. If the total basal area of all live trees 5 inches d.b.h. and
larger is at least 20 sq. feet (average minimum stocking for all types),
determine cover type based on plurality of all live tree basal area by
the species groups displayed below.
b. If ·the total basal area of all live trees 5 inches d.b.h. and
larger is less than 20 sq. feet, determine cover type based on plurality
of all live tree numbers per acre by the species groups displayed below.
c. If there are not enough trees to calculate a cover type (i.e.
nonstocked), the type will be set to UNCLASSIFIED. A forest type should
be determined and entered into the Data Base by photo interpretation or
on-the-ground inspection. Note that if the forest cover type is set to
UNCLASSIFIED, the Stand Age is set to zero years old.
June 1993 RMSTAND Page 60-29
CHAPTER 60
DATA PROCESSING AND INTERPRETATION
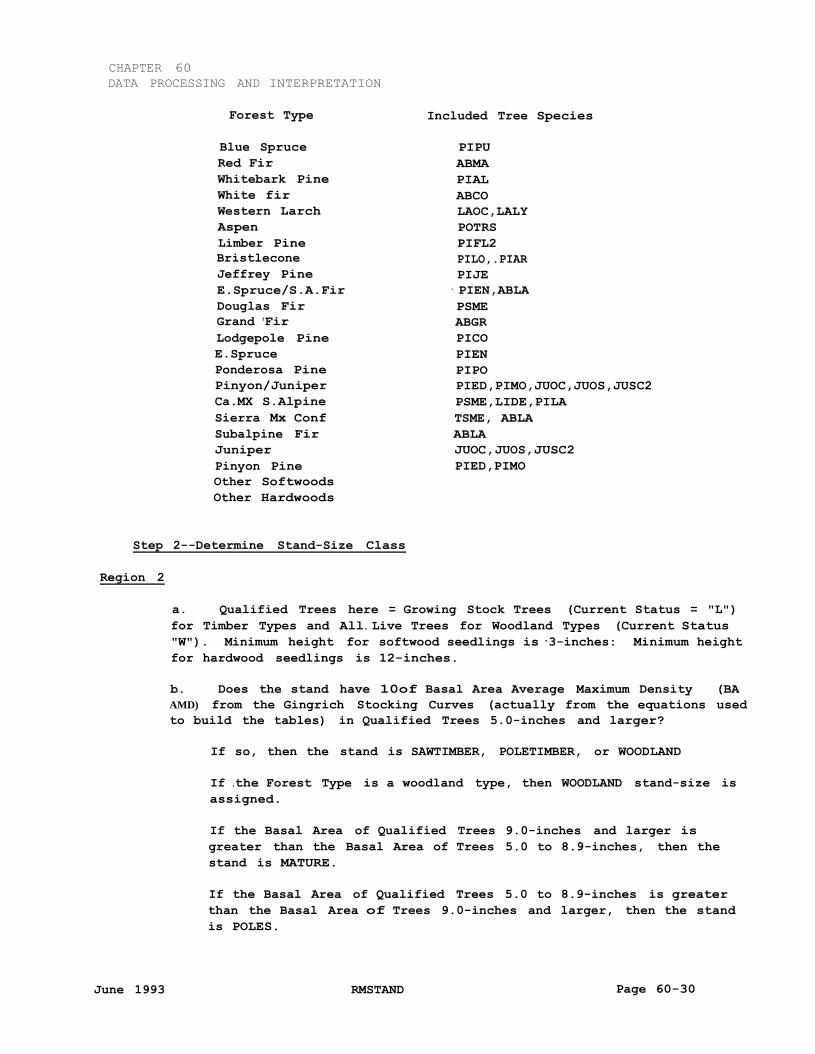
Forest Type Included Tree Species
Blue Spruce
Red Fir
Whitebark Pine
White fir
Western Larch
Aspen
Limber Pine
Bristlecone
Jeffrey Pine
E.Spruce/S.A.Fir
Douglas Fir
Grand 'Fir
Lodgepole Pine
E.Spruce
Ponderosa Pine
Pinyon/Juniper
Ca.MX S.Alpine
Sierra Mx Conf
Subalpine Fir
Juniper
Pinyon Pine
Other Softwoods
Other Hardwoods
PIPU
ABMA
PIAL
ABCO
LAOC,LALY
POTRS
PIFL2
PILO,.PIAR
PIJE
· PIEN,ABLA
PSME
ABGR
PICO
PIEN
PIPO
PIED,PIMO,JUOC,JUOS,JUSC2
PSME,LIDE,PILA
TSME, ABLA
ABLA
JUOC,JUOS,JUSC2
PIED,PIMO
Step 2--Determine Stand-Size Class
Region 2
a. Qualified Trees here = Growing Stock Trees (Current Status = "L")
for Timber Types and All. Live Trees for Woodland Types (Current Status
"W"). Minimum height for softwood seedlings is ·3-inches: Minimum height
for hardwood seedlings is 12-inches.
b. Does the stand have 10of Basal Area Average Maximum Density (BA
AMD) from the Gingrich Stocking Curves (actually from the equations used
to build the tables) in Qualified Trees 5.0-inches and larger?
If so, then the stand is SAWTIMBER, POLETIMBER, or WOODLAND
If .the Forest Type is a woodland type, then WOODLAND stand-size is
assigned.
If the Basal Area of Qualified Trees 9.0-inches and larger is
greater than the Basal Area of Trees 5.0 to 8.9-inches, then the
stand is MATURE.
If the Basal Area of Qualified Trees 5.0 to 8.9-inches is greater
than the Basal Area of Trees 9.0-inches and larger, then the stand
is POLES.
June 1993 RMSTAND Page 60-30
CHAPTER 60
DATA PROCESSING AND INTERPRETATION
If the stand DOES NOT have 10 of the BA AMD·for the calculated
Forest Type, then it is either SEEDLING/SAPLING or NONSTOCKED.
Calculations are based on STOCKABLE points (Not Status X) only.
Does the stand have 120 softwood trees per acre or 300 hardwood
trees per acre? If so, then the stand-size class is
SEEDLING/SAPLING.
If minimum stocking standards are not meet, then the site is
NONSTOCKED.
If 30of the of the Stockable portion of the stand is noristocked
(STATUS N), the stand is considered nonstocked.
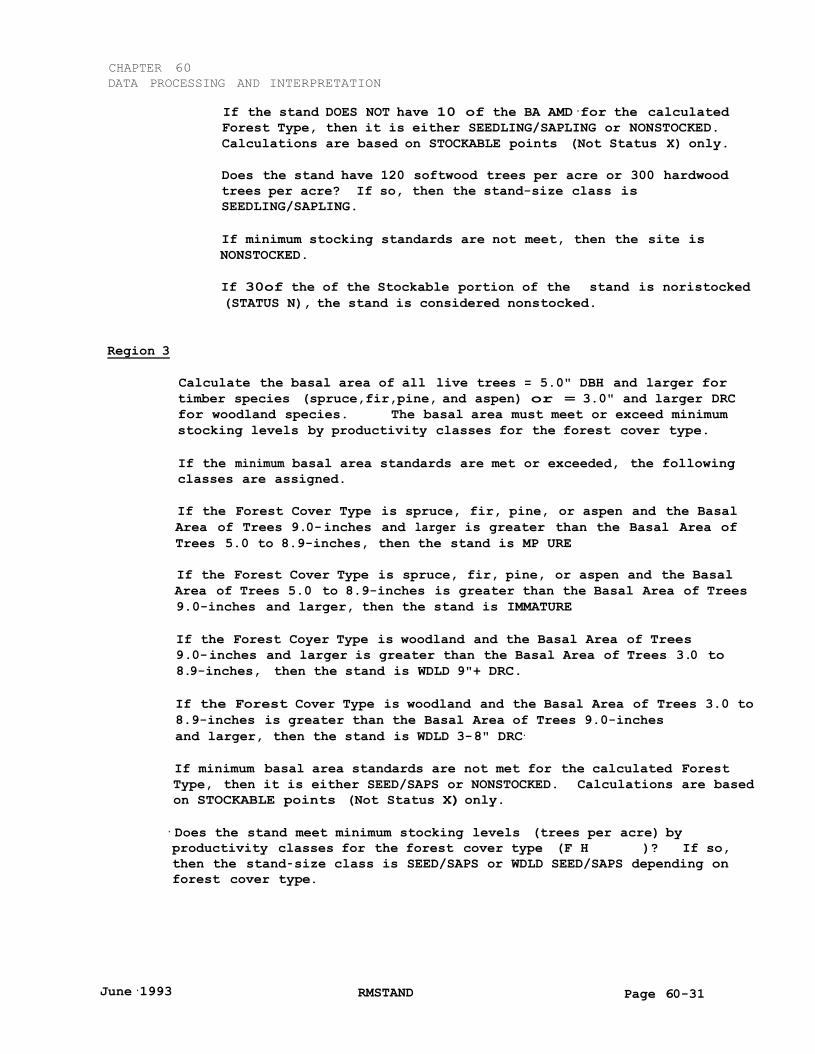
Region 3
Calculate the basal area of all live trees = 5.0" DBH and larger for
timber species (spruce,fir,pine, and aspen) or = 3.0" and larger DRC
for woodland species. The basal area must meet or exceed minimum
stocking levels by productivity classes for the forest cover type.
If the minimum basal area standards are met or exceeded, the following
classes are assigned.
If the Forest Cover Type is spruce, fir, pine, or aspen and the Basal
Area of Trees 9.0-inches and larger is greater than the Basal Area of
Trees 5.0 to 8.9-inches, then the stand is MP URE
If the Forest Cover Type is spruce, fir, pine, or aspen and the Basal
Area of Trees 5.0 to 8.9-inches is greater than the Basal Area of Trees
9.0-inches and larger, then the stand is IMMATURE
If the Forest Coyer Type is woodland and the Basal Area of Trees
9.0-inches and larger is greater than the Basal Area of Trees 3.0 to
8.9-inches, then the stand is WDLD 9"+ DRC.
If the Forest Cover Type is woodland and the Basal Area of Trees 3.0 to
8.9-inches is greater than the Basal Area of Trees 9.0-inches
and larger, then the stand is WDLD 3-8" DRC·
If minimum basal area standards are not met for the calculated Forest
Type, then it is either SEED/SAPS or NONSTOCKED. Calculations are based
on STOCKABLE points (Not Status X) only.
· Does the stand meet minimum stocking levels (trees per acre) by
productivity classes for the forest cover type (F H )? If so,
then the stand-size class is SEED/SAPS or WDLD SEED/SAPS depending on
forest cover type.
June ·1993 RMSTAND Page 60-31
CHAPTER 60
DATA PROCESSING AND INTERPRETATION
If minimum stocking standards are not meet, then the site is NONSTOCKED.
If 30of the of the Stockable portion of the stand is nonstocked
(STATUS N), the stand is considered nonstocked.
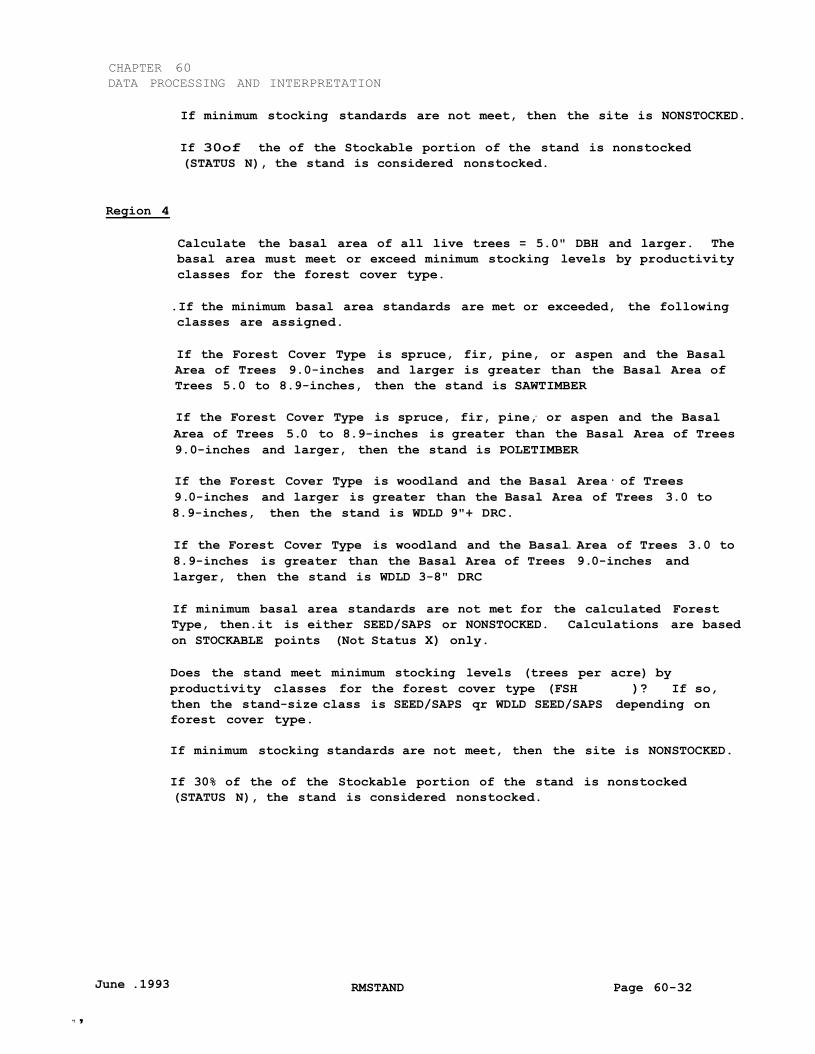
Region 4
Calculate the basal area of all live trees = 5.0" DBH and larger. The
basal area must meet or exceed minimum stocking levels by productivity
classes for the forest cover type.
.If the minimum basal area standards are met or exceeded, the following
classes are assigned.
If the Forest Cover Type is spruce, fir, pine, or aspen and the Basal
Area of Trees 9.0-inches and larger is greater than the Basal Area of
Trees 5.0 to 8.9-inches, then the stand is SAWTIMBER
If the Forest Cover Type is spruce, fir, pine,· or aspen and the Basal
Area of Trees 5.0 to 8.9-inches is greater than the Basal Area of Trees
9.0-inches and larger, then the stand is POLETIMBER
If the Forest Cover Type is woodland and the Basal Area· of Trees
9.0-inches and larger is greater than the Basal Area of Trees 3.0 to
8.9-inches, then the stand is WDLD 9"+ DRC.
If the Forest Cover Type is woodland and the Basal. Area of Trees 3.0 to
8.9-inches is greater than the Basal Area of Trees 9.0-inches and
larger, then the stand is WDLD 3-8" DRC
If minimum basal area standards are not met for the calculated Forest
Type, then.it is either SEED/SAPS or NONSTOCKED. Calculations are based
on STOCKABLE points (Not Status X) only.
Does the stand meet minimum stocking levels (trees per acre) by
productivity classes for the forest cover type (FSH )? If so,
then the stand-size class is SEED/SAPS qr WDLD SEED/SAPS depending on
forest cover type.
If minimum stocking standards are not meet, then the site is NONSTOCKED.
If 30% of the of the Stockable portion of the stand is nonstocked
(STATUS N), the stand is considered nonstocked.
June .1993 RMSTAND Page 60-32
., ,
CHAPTER 60
DATA PROCESSING AND INTERPRETATION
The confidence limits are for the average basal area as follows:
X + t (SE)
so + 1.25 (3.87)
so + 4.84 sq. ft
So it is 70 percent probable that the true mean of the stand lies between 45.16
and 54.84 square feet of basal area. This assumes that all measurements made at
the point are 100 percent accurate.
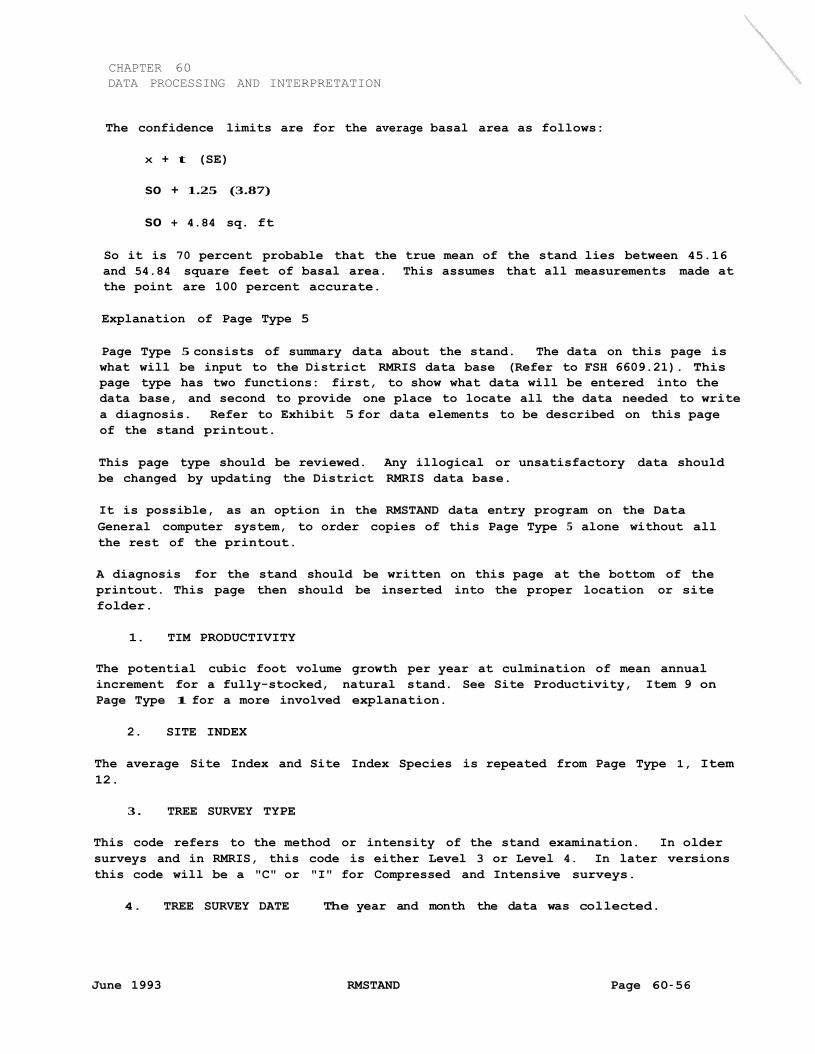
Explanation of Page Type 5
Page Type 5 consists of summary data about the stand. The data on this page is
what will be input to the District RMRIS data base (Refer to FSH 6609.21). This
page type has two functions: first, to show what data will be entered into the
data base, and second to provide one place to locate all the data needed to write
a diagnosis. Refer to Exhibit 5 for data elements to be described on this page
of the stand printout.
This page type should be reviewed. Any illogical or unsatisfactory data should
be changed by updating the District RMRIS data base.
It is possible, as an option in the RMSTAND data entry program on the Data
General computer system, to order copies of this Page Type 5 alone without all
the rest of the printout.
A diagnosis for the stand should be written on this page at the bottom of the
printout. This page then should be inserted into the proper location or site
folder.
1. TIM PRODUCTIVITY
The potential cubic foot volume growth per year at culmination of mean annual
increment for a fully-stocked, natural stand. See Site Productivity, Item 9 on
Page Type 1 for a more involved explanation.
2. SITE INDEX
The average Site Index and Site Index Species is repeated from Page Type 1, Item
12.
3 . TREE SURVEY TYPE
This code refers to the method or intensity of the stand examination. In older
surveys and in RMRIS, this code is either Level 3 or Level 4. In later versions
this code will be a "C" or "I" for Compressed and Intensive surveys.
4. TREE SURVEY DATE The year and month the data was collected.
June 1993 RMSTAND Page 60-56
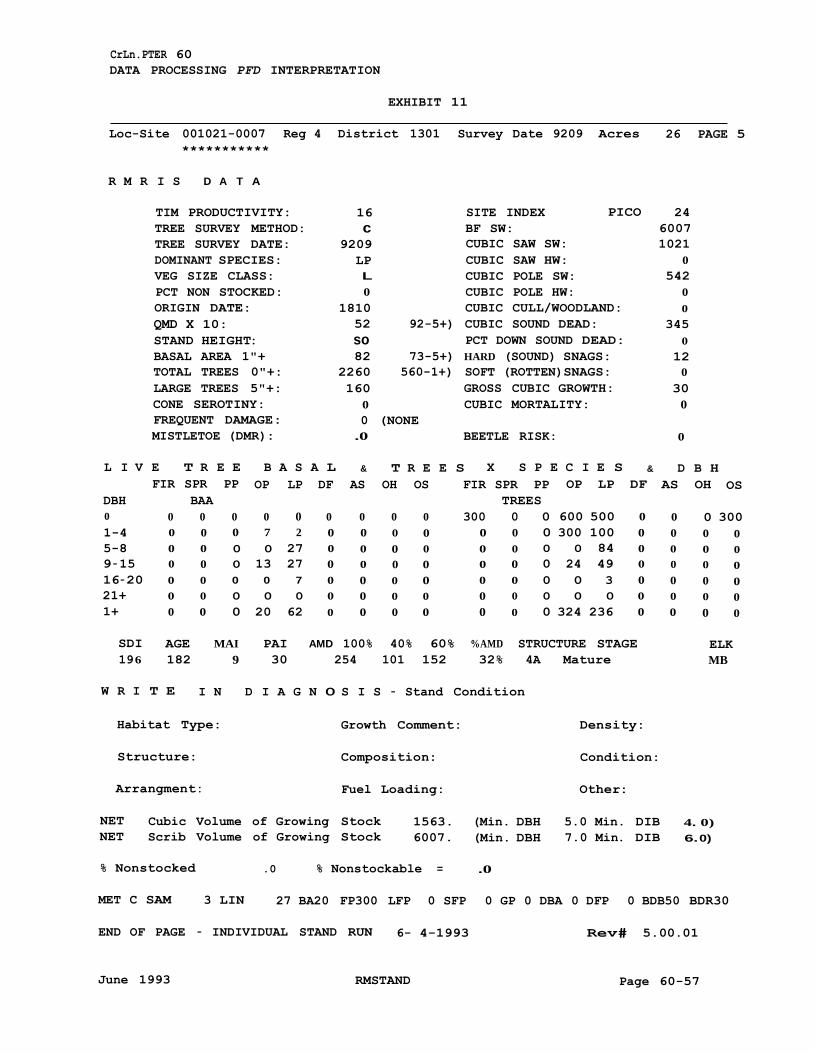
CrLn.PTER 60
DATA PROCESSING PFD INTERPRETATION
EXHIBIT 11
Loc-Site 001021-0007 Reg 4 District 1301 Survey Date 9209 Acres
***********
R M R I S D A T A
26 PAGE 5
TIM PRODUCTIVITY:
TREE SURVEY METHOD:
TREE SURVEY DATE:
DOMINANT SPECIES:
VEG SIZE CLASS:
PCT NON STOCKED:
16
c 9209
LP
L
0
SITE INDEX
BF SW:
CUBIC SAW SW:
CUBIC SAW HW:
CUBIC POLE SW:
CUBIC POLE HW:
PICO 24
6007
1021
0
542
0
ORIGIN DATE:
QMD X 10:
STAND HEIGHT:
BASAL AREA 1"+
TOTAL TREES 0"+:
LARGE TREES 5"+:
CONE SEROTINY:
1810
52
so 82
2260
160
0
CUBIC CULL/WOODLAND:
92-5+) CUBIC SOUND DEAD:
PCT DOWN SOUND DEAD:
73-5+) HARD (SOUND) SNAGS:
560-1+) SOFT (ROTTEN)SNAGS:
GROSS CUBIC GROWTH:
CUBIC MORTALITY:
0
345
0
12
0
30
0
FREQUENT DAMAGE:
MISTLETOE (DMR):
0 (NONE
.0
BEETLE RISK: 0
L I V E T R E E B A S A L & T R E E S X S P E C I E S & D B H
FIR SPR PP OP LP DF AS OH OS FIR SPR PP
DBH BAA TREES
0 0 0 0 0 0 0 0 0 0 300 0 0
OP
600
LP
500
DF
0
AS
0
OH
0
OS
300
1-4 0 0 0 7 2 0 0 0 0 0 0 0 300 100 0 0 0 0
5-8 0 0 0 0 27 0 0 0 0 0 0 0 0 84 0 0 0 0
9-15 0 0 0 13 27 0 0 0 0 0 0 0 24 49 0 0 0 0
16-20 0 0 0 0 7 0 0 0 0 0 0 0 0 3 0 0 0 0
21+ 0 0 0 0 0 0 0 0 0 0 0 0 0 0 0 0 0 0
1+ 0 0 0 20 62 0 0 0 0 0 0 0 324 236 0 0 0 0
SDI
196
AGE
182
MAI
9
PAI
30
AMD 100% 40% 60%
254 101 152
%AMD
32%
STRUCTURE STAGE
4A Mature
ELK
MB
W R I T E I N D I A G N 0 S I S - Stand Condition
Habitat Type:
Structure:
Arrangment:
Growth Comment:
Composition:
Fuel Loading:
Density:
Condition:
Other:
NET
NET
Cubic Volume of Growing Stock
Scrib Volume of Growing Stock
1563.
6007.
(Min. DBH
(Min. DBH
5.0 Min. DIB
7.0 Min. DIB
4. 0)
6. 0)
% Nonstocked .0 % Nonstockable = .0
MET C SAM 3 LIN 27 BA20 FP300 LFP 0 SFP 0 GP 0 DBA 0 DFP 0 BDB50 BDR30
END OF PAGE - INDIVIDUAL STAND RUN 6- 4-1993 Rev# 5.00.01
June 1993 RMSTAND Page 60-57
CHAPTER 60
DATA' PROCESSING AND .INTERPRETATION
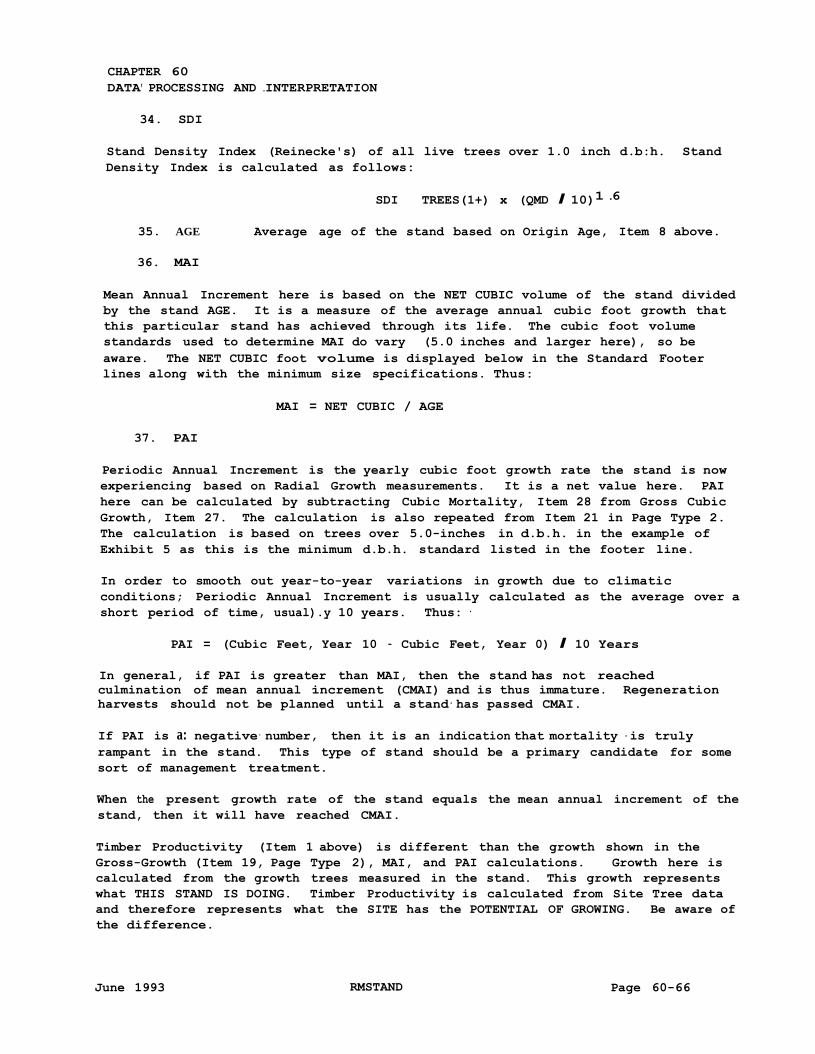
34. SDI
Stand Density Index (Reinecke's) of all live trees over 1.0 inch d.b:h. Stand
Density Index is calculated as follows:
SDI TREES(1+) x (QMD I 10)1·6
35. AGE Average age of the stand based on Origin Age, Item 8 above.
36. MAI
Mean Annual Increment here is based on the NET CUBIC volume of the stand divided
by the stand AGE. It is a measure of the average annual cubic foot growth that
this particular stand has achieved through its life. The cubic foot volume
standards used to determine MAI do vary (5.0 inches and larger here), so be
aware. The NET CUBIC foot volume is displayed below in the Standard Footer
lines along with the minimum size specifications. Thus:
MAI = NET CUBIC / AGE
37. PAI
Periodic Annual Increment is the yearly cubic foot growth rate the stand is now
experiencing based on Radial Growth measurements. It is a net value here. PAI
here can be calculated by subtracting Cubic Mortality, Item 28 from Gross Cubic
Growth, Item 27. The calculation is also repeated from Item 21 in Page Type 2.
The calculation is based on trees over 5.0-inches in d .b.h. in the example of
Exhibit 5 as this is the minimum d.b.h. standard listed in the footer line.
In order to smooth out year-to-year variations in growth due to climatic
conditions; Periodic Annual Increment is usually calculated as the average over a
short period of time, usual).y 10 years. Thus: ·
PAI = (Cubic Feet, Year 10 - Cubic Feet, Year 0) I 10 Years
In general, if PAI is greater than MAI, then the stand has not reached
culmination of mean annual ·increment (CMAI) and is thus immature. Regeneration
harvests should not be planned until a stand· has passed CMAI.
If PAI is a: negative· number, then it is an indication that mortality - is truly
rampant in the stand. This type of stand should be a primary candidate for some
sort of management treatment.
When the present growth rate of the stand equals the mean annual increment of the
stand, then it will have reached CMAI.
Timber Productivity (Item 1 above) is different than the growth shown in the
Gross-Growth (Item 19, Page Type 2), MAI, and PAI calculations. Growth here is
calculated from the growth trees measured in the stand. This growth represents
what THIS STAND IS DOING. Timber Productivity is calculated from Site Tree data
and therefore represents what the SITE has the POTENTIAL OF GROWING. Be aware of
the difference.
June 1993 RMSTAND Page 60-66
CHAPTER 60
DATA PROCESSING AND INTERPRETATION
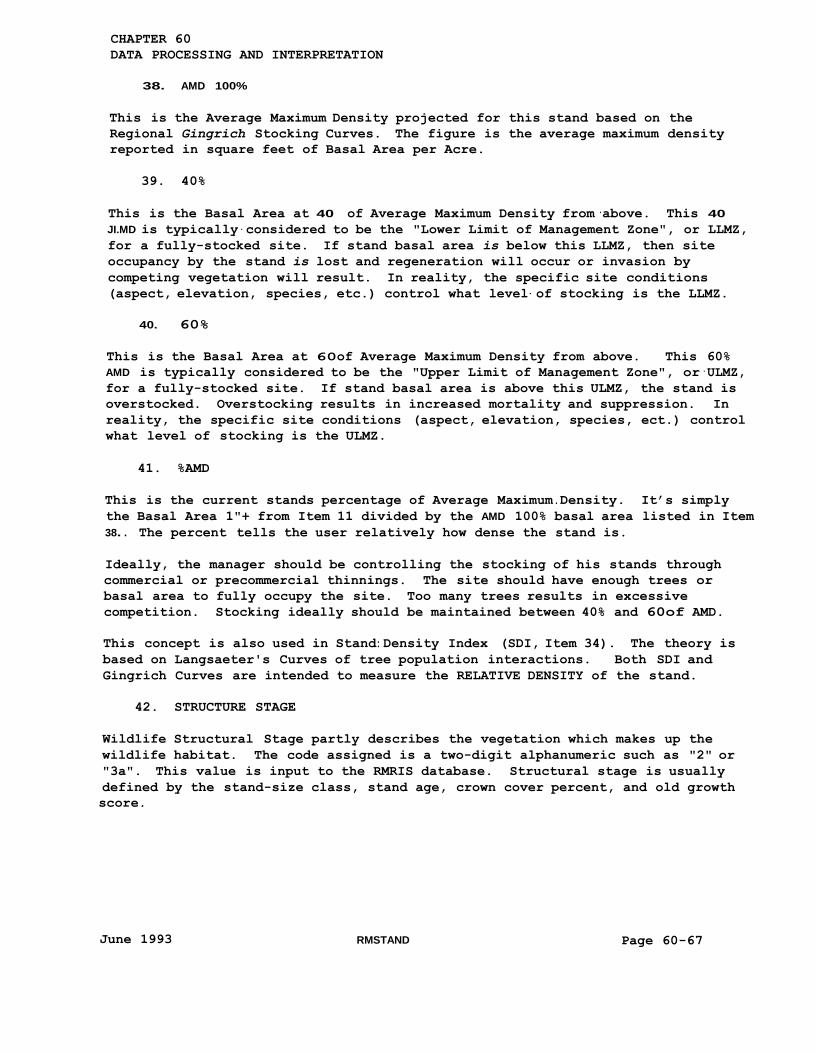
38. AMD 100%
This is the Average Maximum Density projected for this stand based on the
Regional Gingrich Stocking Curves. The figure is the average maximum density
reported in square feet of Basal Area per Acre.
39. 40%
This is the Basal Area at 40 of Average Maximum Density from ·above. This 40
JI.MD is typically - considered to be the "Lower Limit of Management Zone", or LLMZ,
for a fully-stocked site. If stand basal area is below this LLMZ, then site
occupancy by the stand is lost and regeneration will occur or invasion by
competing vegetation will result. In reality, the specific site conditions
(aspect, elevation, species, etc.) control what level- of stocking is the LLMZ.
40. 60%
This is the Basal Area at 60of Average Maximum Density from above. This 60%
AMD is typically considered to be the "Upper Limit of Management Zone", or·ULMZ,
for a fully-stocked site. If stand basal area is above this ULMZ, the stand is
overstocked. Overstocking results in increased mortality and suppression. In
reality, the specific site conditions (aspect, elevation, species, ect.) control
what level of stocking is the ULMZ.
41. %AMD
This is the current stands percentage of Average Maximum.Density. It’s simply
the Basal Area 1"+ from Item 11 divided by the AMD 100% basal area listed in Item
38. . The percent tells the user relatively how dense the stand is.
Ideally, the manager should be controlling the stocking of his stands through
commercial or precommercial thinnings. The site should have enough trees or
basal area to fully occupy the site. Too many trees results in excessive
competition. Stocking ideally should be maintained between 40% and 60of AMD.
This concept is also used in Stand: Density Index (SDI, Item 34). The theory is
based on Langsaeter's Curves of tree population interactions. Both SDI and
Gingrich Curves are intended to measure the RELATIVE DENSITY of the stand.
42. STRUCTURE STAGE
Wildlife Structural Stage partly describes the vegetation which makes up the
wildlife habitat. The code assigned is a two-digit alphanumeric such as "2" or
"3a". This value is input to the RMRIS database. Structural stage is usually
defined by the stand-size class, stand age, crown cover percent, and old growth
score.
June 1993 RMSTAND Page 60-67
CHAPTER 60
DATA PROCESSING AND INTERPRETATION
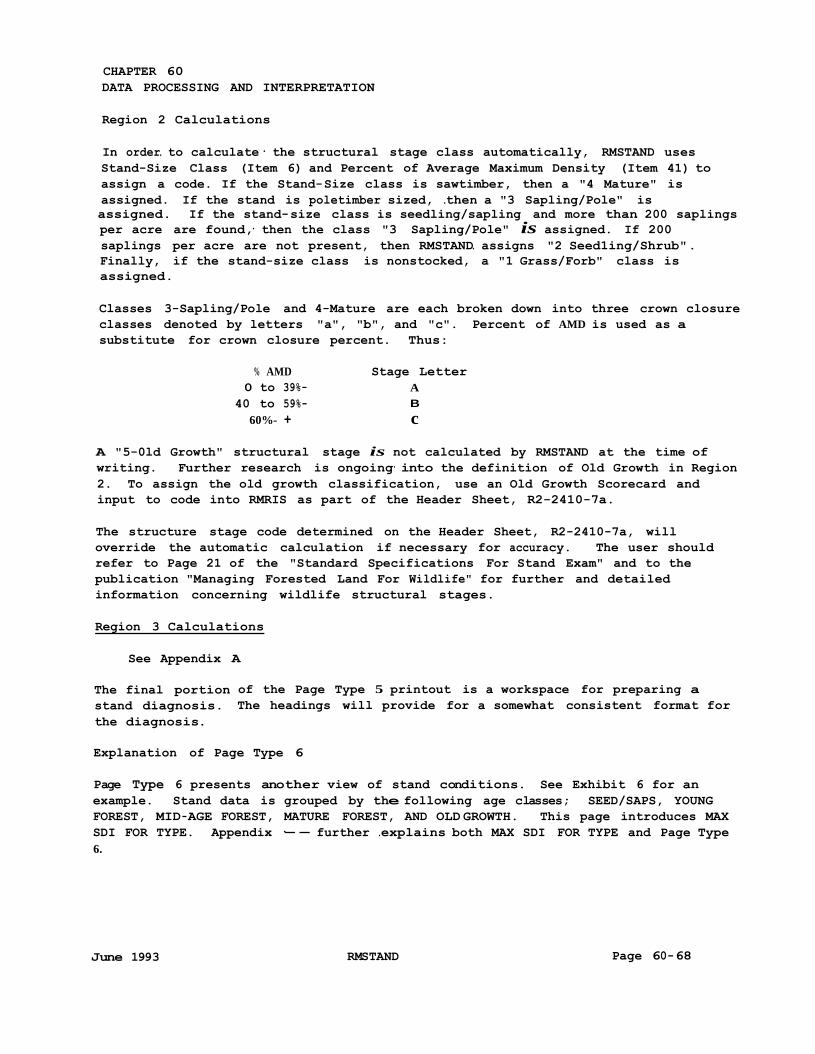
Region 2 Calculations
In order. to calculate· the structural stage class automatically, RMSTAND uses
Stand-Size Class (Item 6) and Percent of Average Maximum Density (Item 41) to
assign a code. If the Stand-Size class is sawtimber, then a "4 Mature" is
assigned. If the stand is poletimber sized, .then a "3 Sapling/Pole" is
assigned. If the stand-size class is seedling/sapling and more than. 200 saplings
per acre are found,· then the class "3 Sapling/Pole" is assigned. If 200 saplings per acre are not present, then RMSTAND. assigns "2 Seed1ing/Shrub".
Finally, if the stand-size class is nonstocked, a "1 Grass/Forb" class is
assigned.
Classes 3-Sapling/Pole and 4-Mature are each broken down into three crown closure
classes denoted by letters "a", "b", and "c". Percent of AMD is used as a
substitute for crown closure percent. Thus:
% AMD
0 to 39%-
40 to 59%-
60%- +
Stage Letter
A
B
c
A "5-0ld Growth" structural stage is not calculated by RMSTAND at the time of
writing. Further research is ongoing· into the definition of Old Growth in Region
2. To assign the old growth classification, use an Old Growth Scorecard and
input to code into RMRIS as part of the Header Sheet, R2-2410-7a.
The structure stage code determined on the Header Sheet, R2-2410-7a, will
override the automatic calculation if necessary for accuracy. The user should
refer to Page 21 of the "Standard Specifications For Stand Exam" and to the.
publication "Managing Forested Land For Wildlife" for further and detailed
information concerning wildlife structural stages.
Region 3 Calculations
See Appendix A
The final portion
stand diagnosis.
the diagnosis.
of the Page Type 5 printout is a workspace for preparing a
The headings will provide for a somewhat consistent format for
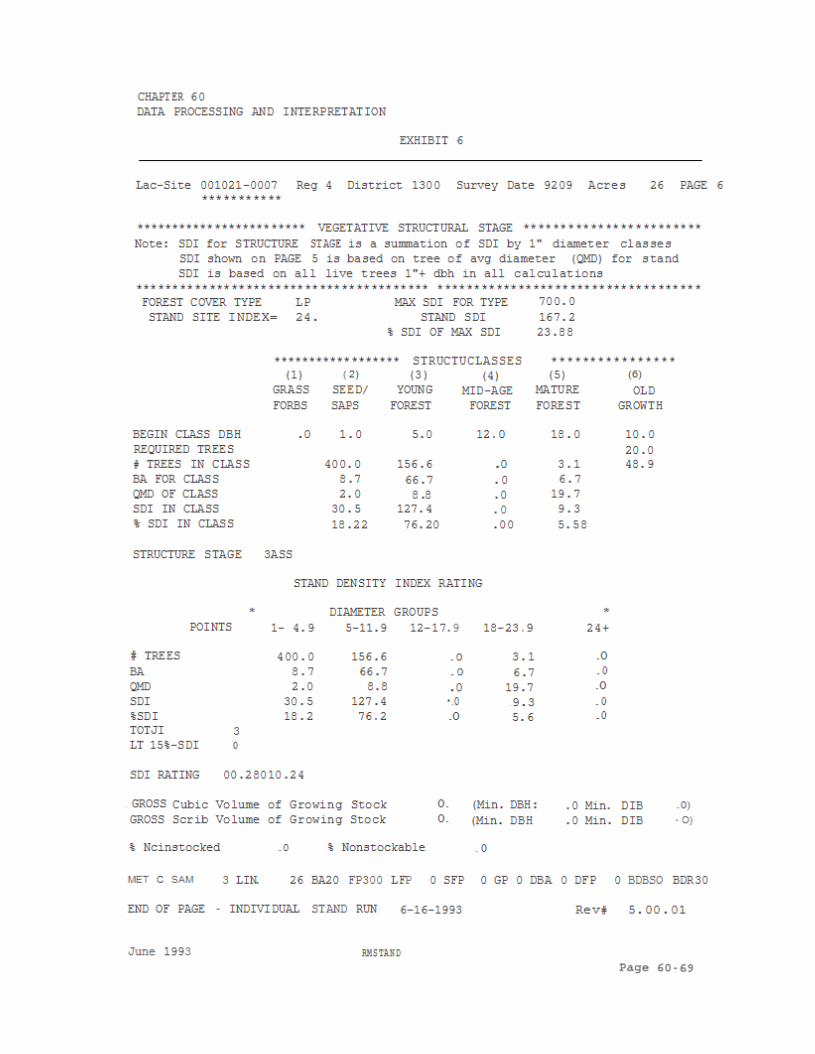
Explanation of Page Type 6
Page Type 6 presents another view of stand conditions. See Exhibit 6 for an
example. Stand data is grouped by the following age classes; SEED/SAPS, YOUNG
FOREST, MID-AGE FOREST, MATURE FOREST, AND OLD GROWTH. This page introduces MAX
SDI FOR TYPE. Appendix ·-- further .explains both MAX SDI FOR TYPE and Page Type
6.
June 1993 RMSTAND Page 60-68
5. Patrick D. Jackson, 2000, “Vegetative Structural Stages Calculations as Calculated by
RMSTAND”. U.S. Department of Agriculture – Southwestern Region Forest Service,
Internal publication.
Vegetative Structural Stage Calculations
As Calculated by RMSTAND
March 2000 (updated 8/10/2005)
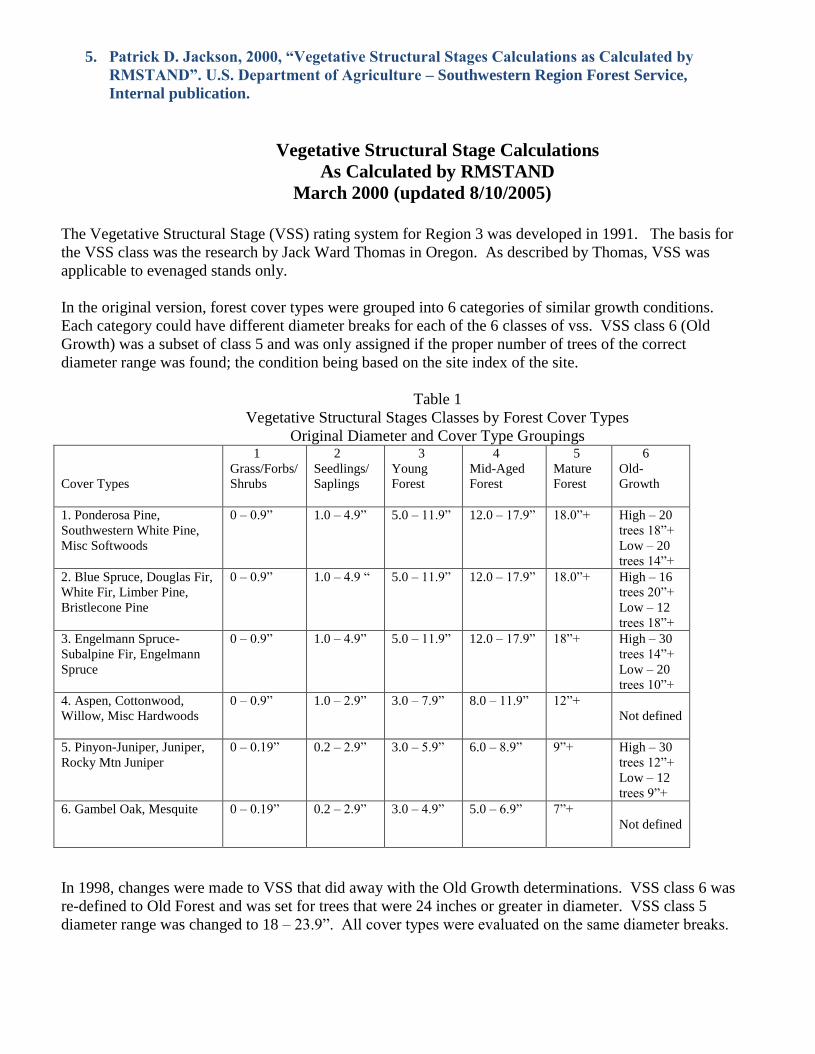
The Vegetative Structural Stage (VSS) rating system for Region 3 was developed in 1991. The basis for
the VSS class was the research by Jack Ward Thomas in Oregon. As described by Thomas, VSS was
applicable to evenaged stands only.
In the original version, forest cover types were grouped into 6 categories of similar growth conditions.
Each category could have different diameter breaks for each of the 6 classes of vss. VSS class 6 (Old
Growth) was a subset of class 5 and was only assigned if the proper number of trees of the correct
diameter range was found; the condition being based on the site index of the site.
Table 1
Vegetative Structural Stages Classes by Forest Cover Types
Original Diameter and Cover Type Groupings
Cover Types
1
Grass/Forbs/
Shrubs
2
Seedlings/
Saplings
3
Young
Forest
4
Mid-Aged
Forest
5
Mature
Forest
6
Old-
Growth
1. Ponderosa Pine,
Southwestern White Pine,
Misc Softwoods
0 – 0.9” 1.0 – 4.9” 5.0 – 11.9” 12.0 – 17.9” 18.0”+ High – 20
trees 18”+
Low – 20
trees 14”+
2. Blue Spruce, Douglas Fir,
White Fir, Limber Pine,
Bristlecone Pine
0 – 0.9” 1.0 – 4.9 “ 5.0 – 11.9” 12.0 – 17.9” 18.0”+ High – 16
trees 20”+
Low – 12
trees 18”+
3. Engelmann Spruce-
Subalpine Fir, Engelmann
Spruce
0 – 0.9” 1.0 – 4.9” 5.0 – 11.9” 12.0 – 17.9” 18”+ High – 30
trees 14”+
Low – 20
trees 10”+
4. Aspen, Cottonwood,
Willow, Misc Hardwoods
0 – 0.9” 1.0 – 2.9” 3.0 – 7.9” 8.0 – 11.9” 12”+
Not defined
5. Pinyon-Juniper, Juniper,
Rocky Mtn Juniper
0 – 0.19” 0.2 – 2.9” 3.0 – 5.9” 6.0 – 8.9” 9”+ High – 30
trees 12”+
Low – 12
trees 9”+
6. Gambel Oak, Mesquite 0 – 0.19” 0.2 – 2.9” 3.0 – 4.9” 5.0 – 6.9” 7”+
Not defined
In 1998, changes were made to VSS that did away with the Old Growth determinations. VSS class 6 was
re-defined to Old Forest and was set for trees that were 24 inches or greater in diameter. VSS class 5
diameter range was changed to 18 – 23.9”. All cover types were evaluated on the same diameter breaks.
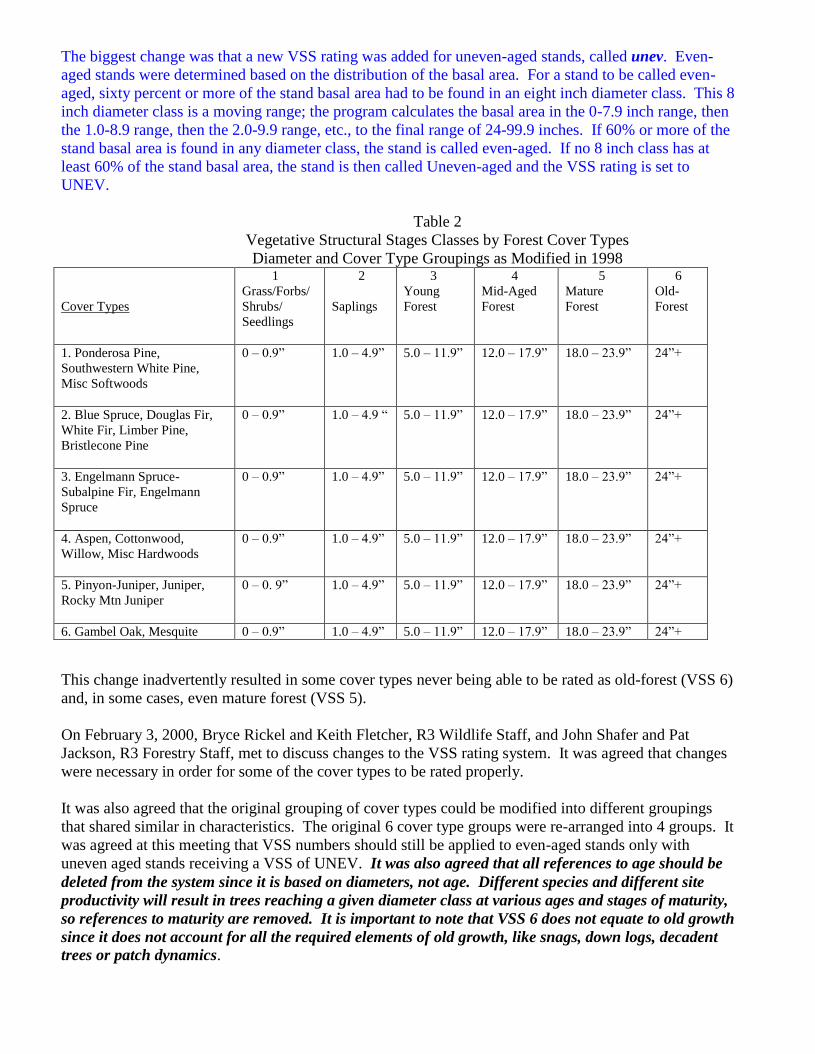
The biggest change was that a new VSS rating was added for uneven-aged stands, called unev. Even-
aged stands were determined based on the distribution of the basal area. For a stand to be called even-
aged, sixty percent or more of the stand basal area had to be found in an eight inch diameter class. This 8
inch diameter class is a moving range; the program calculates the basal area in the 0-7.9 inch range, then
the 1.0-8.9 range, then the 2.0-9.9 range, etc., to the final range of 24-99.9 inches. If 60% or more of the
stand basal area is found in any diameter class, the stand is called even-aged. If no 8 inch class has at
least 60% of the stand basal area, the stand is then called Uneven-aged and the VSS rating is set to
UNEV.
Table 2
Vegetative Structural Stages Classes by Forest Cover Types
Diameter and Cover Type Groupings as Modified in 1998
Cover Types
1
Grass/Forbs/
Shrubs/
Seedlings
2
Saplings
3
Young
Forest
4
Mid-Aged
Forest
5
Mature
Forest
6
Old-
Forest
1. Ponderosa Pine,
Southwestern White Pine,
Misc Softwoods
0 – 0.9” 1.0 – 4.9” 5.0 – 11.9” 12.0 – 17.9” 18.0 – 23.9” 24”+
2. Blue Spruce, Douglas Fir,
White Fir, Limber Pine,
Bristlecone Pine
0 – 0.9” 1.0 – 4.9 “ 5.0 – 11.9” 12.0 – 17.9” 18.0 – 23.9” 24”+
3. Engelmann Spruce-
Subalpine Fir, Engelmann
Spruce
0 – 0.9” 1.0 – 4.9” 5.0 – 11.9” 12.0 – 17.9” 18.0 – 23.9” 24”+
4. Aspen, Cottonwood,
Willow, Misc Hardwoods
0 – 0.9” 1.0 – 4.9” 5.0 – 11.9” 12.0 – 17.9” 18.0 – 23.9” 24”+
5. Pinyon-Juniper, Juniper,
Rocky Mtn Juniper
0 – 0. 9” 1.0 – 4.9” 5.0 – 11.9” 12.0 – 17.9” 18.0 – 23.9” 24”+
6. Gambel Oak, Mesquite 0 – 0.9” 1.0 – 4.9” 5.0 – 11.9” 12.0 – 17.9” 18.0 – 23.9” 24”+
This change inadvertently resulted in some cover types never being able to be rated as old-forest (VSS 6)
and, in some cases, even mature forest (VSS 5).
On February 3, 2000, Bryce Rickel and Keith Fletcher, R3 Wildlife Staff, and John Shafer and Pat
Jackson, R3 Forestry Staff, met to discuss changes to the VSS rating system. It was agreed that changes
were necessary in order for some of the cover types to be rated properly.
It was also agreed that the original grouping of cover types could be modified into different groupings
that shared similar in characteristics. The original 6 cover type groups were re-arranged into 4 groups. It
was agreed at this meeting that VSS numbers should still be applied to even-aged stands only with
uneven aged stands receiving a VSS of UNEV. It was also agreed that all references to age should be
deleted from the system since it is based on diameters, not age. Different species and different site
productivity will result in trees reaching a given diameter class at various ages and stages of maturity,
so references to maturity are removed. It is important to note that VSS 6 does not equate to old growth
since it does not account for all the required elements of old growth, like snags, down logs, decadent
trees or patch dynamics.
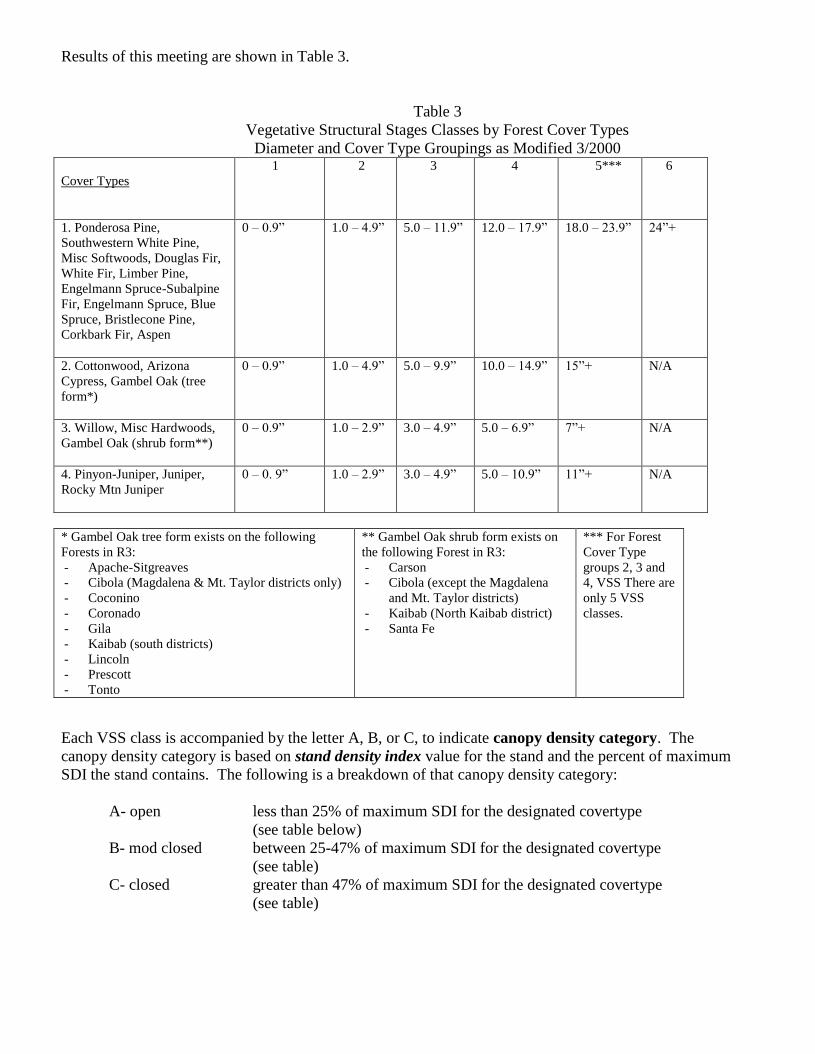
Results of this meeting are shown in Table 3.
Table 3
Vegetative Structural Stages Classes by Forest Cover Types
Diameter and Cover Type Groupings as Modified 3/2000
Cover Types
1
2
3
4
5***
6
1. Ponderosa Pine,
Southwestern White Pine,
Misc Softwoods, Douglas Fir,
White Fir, Limber Pine,
Engelmann Spruce-Subalpine
Fir, Engelmann Spruce, Blue
Spruce, Bristlecone Pine,
Corkbark Fir, Aspen
0 – 0.9” 1.0 – 4.9” 5.0 – 11.9” 12.0 – 17.9” 18.0 – 23.9” 24”+
2. Cottonwood, Arizona
Cypress, Gambel Oak (tree
form*)
0 – 0.9” 1.0 – 4.9” 5.0 – 9.9” 10.0 – 14.9” 15”+ N/A
3. Willow, Misc Hardwoods,
Gambel Oak (shrub form**)
0 – 0.9” 1.0 – 2.9” 3.0 – 4.9” 5.0 – 6.9” 7”+ N/A
4. Pinyon-Juniper, Juniper,
Rocky Mtn Juniper
0 – 0. 9” 1.0 – 2.9” 3.0 – 4.9” 5.0 – 10.9” 11”+ N/A
* Gambel Oak tree form exists on the following
Forests in R3:
- Apache-Sitgreaves
- Cibola (Magdalena & Mt. Taylor districts only)
- Coconino
- Coronado
- Gila
- Kaibab (south districts)
- Lincoln
- Prescott
- Tonto
** Gambel Oak shrub form exists on
the following Forest in R3:
- Carson
- Cibola (except the Magdalena
and Mt. Taylor districts)
- Kaibab (North Kaibab district)
- Santa Fe
*** For Forest
Cover Type
groups 2, 3 and
4, VSS There are
only 5 VSS
classes.
Each VSS class is accompanied by the letter A, B, or C, to indicate canopy density category. The
canopy density category is based on stand density index value for the stand and the percent of maximum
SDI the stand contains. The following is a breakdown of that canopy density category:
A- open less than 25% of maximum SDI for the designated covertype
(see table below)
B- mod closed between 25-47% of maximum SDI for the designated covertype
(see table)
C- closed greater than 47% of maximum SDI for the designated covertype
(see table)
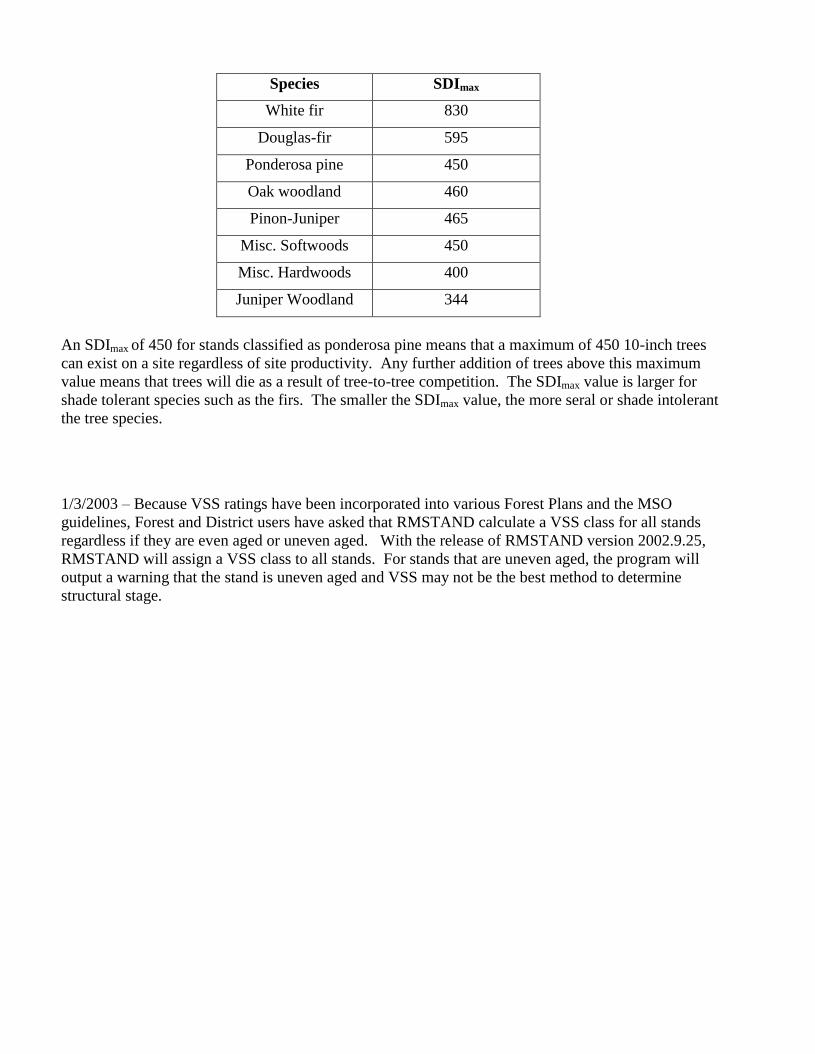
Species SDImax
White fir 830
Douglas-fir 595
Ponderosa pine 450
Oak woodland 460
Pinon-Juniper 465
Misc. Softwoods 450
Misc. Hardwoods 400
Juniper Woodland 344
An SDImax of 450 for stands classified as ponderosa pine means that a maximum of 450 10-inch trees
can exist on a site regardless of site productivity. Any further addition of trees above this maximum
value means that trees will die as a result of tree-to-tree competition. The SDImax value is larger for
shade tolerant species such as the firs. The smaller the SDImax value, the more seral or shade intolerant
the tree species.
1/3/2003 – Because VSS ratings have been incorporated into various Forest Plans and the MSO
guidelines, Forest and District users have asked that RMSTAND calculate a VSS class for all stands
regardless if they are even aged or uneven aged. With the release of RMSTAND version 2002.9.25,
RMSTAND will assign a VSS class to all stands. For stands that are uneven aged, the program will
output a warning that the stand is uneven aged and VSS may not be the best method to determine
structural stage.
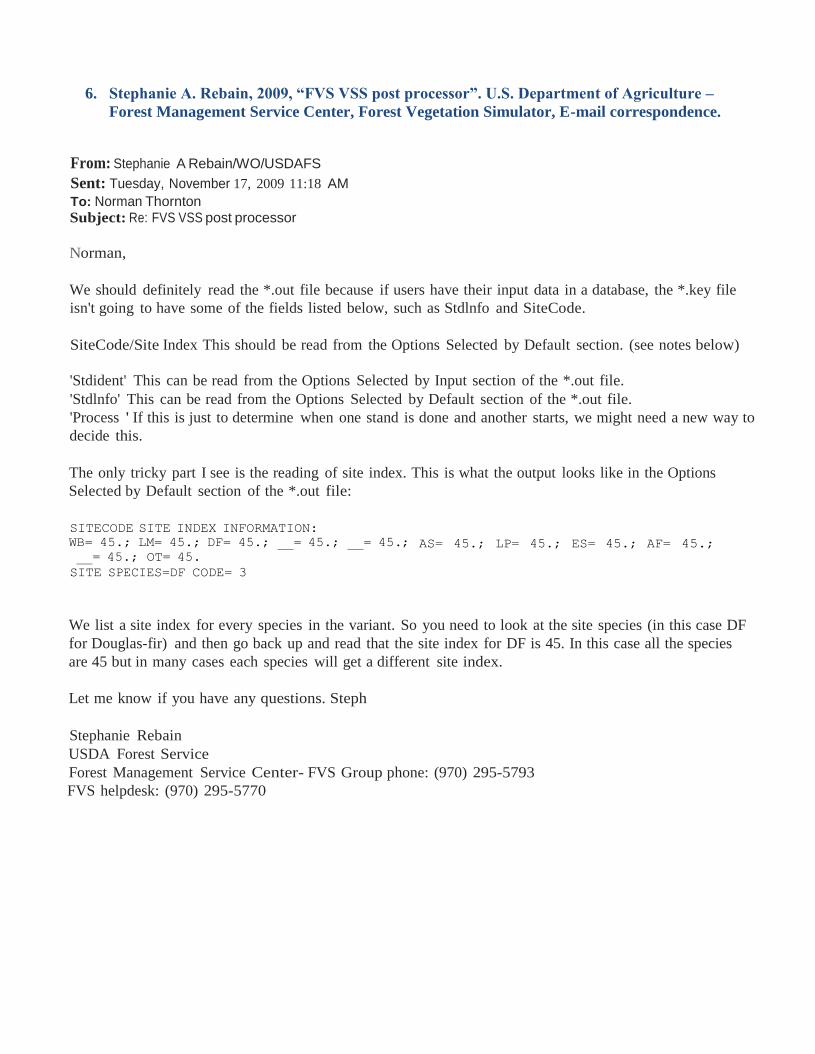
6. Stephanie A. Rebain, 2009, “FVS VSS post processor”. U.S. Department of Agriculture –
Forest Management Service Center, Forest Vegetation Simulator, E-mail correspondence.
From: Stephanie A Rebain/WO/USDAFS
Sent: Tuesday, November 17, 2009 11:18 AM
To: Norman Thornton Subject: Re: FVS VSS post processor
Norman,
We should definitely read the *.out file because if users have their input data in a database, the *.key file
isn't going to have some of the fields listed below, such as Stdlnfo and SiteCode.
SiteCode/Site Index This should be read from the Options Selected by Default section. (see notes below)
'Stdident' This can be read from the Options Selected by Input section of the *.out file.
'Stdlnfo' This can be read from the Options Selected by Default section of the *.out file.
'Process ' If this is just to determine when one stand is done and another starts, we might need a new way to
decide this.
The only tricky part I see is the reading of site index. This is what the output looks like in the Options
Selected by Default section of the *.out file:
SITECODE SITE INDEX INFORMATION:
WB= 45.; LM= 45.; DF= 45.; = 45.; = 45.; AS= 45.; LP= 45.; ES= 45.; AF= 45.;
= 45.; OT= 45.
SITE SPECIES=DF CODE= 3
We list a site index for every species in the variant. So you need to look at the site species (in this case DF
for Douglas-fir) and then go back up and read that the site index for DF is 45. In this case all the species
are 45 but in many cases each species will get a different site index.
Let me know if you have any questions. Steph
Stephanie Rebain
USDA Forest Service
Forest Management Service Center- FVS Group phone: (970) 295-5793
FVS helpdesk: (970) 295-5770
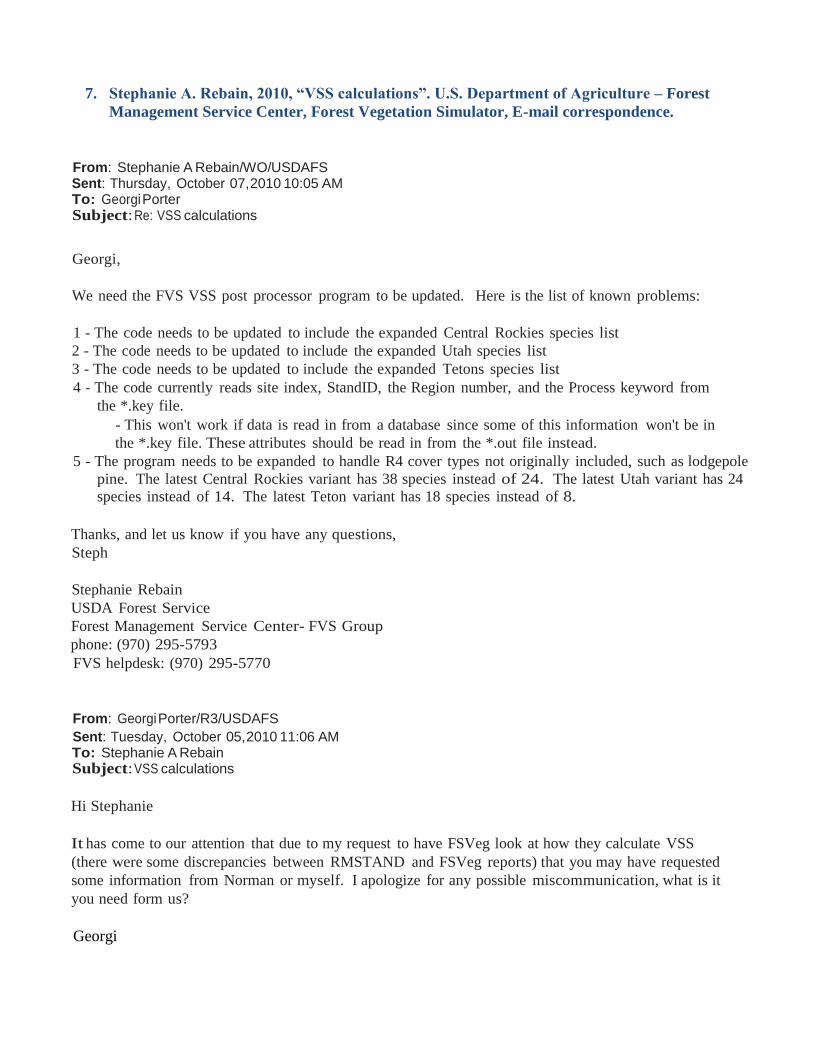
7. Stephanie A. Rebain, 2010, “VSS calculations”. U.S. Department of Agriculture – Forest
Management Service Center, Forest Vegetation Simulator, E-mail correspondence.
From: Stephanie A Rebain/WO/USDAFS Sent: Thursday, October 07,2010 10:05 AM To: Georgi Porter Subject: Re: VSS calculations
Georgi,
We need the FVS VSS post processor program to be updated. Here is the list of known problems:
1 - The code needs to be updated to include the expanded Central Rockies species list
2 - The code needs to be updated to include the expanded Utah species list
3 - The code needs to be updated to include the expanded Tetons species list
4 - The code currently reads site index, StandID, the Region number, and the Process keyword from
the *.key file.
- This won't work if data is read in from a database since some of this information won't be in
the *.key file. These attributes should be read in from the *.out file instead.
5 - The program needs to be expanded to handle R4 cover types not originally included, such as lodgepole
pine. The latest Central Rockies variant has 38 species instead of 24. The latest Utah variant has 24
species instead of 14. The latest Teton variant has 18 species instead of 8.
Thanks, and let us know if you have any questions,
Steph
Stephanie Rebain
USDA Forest Service
Forest Management Service Center- FVS Group
phone: (970) 295-5793
FVS helpdesk: (970) 295-5770
From: Georgi Porter/R3/USDAFS
Sent: Tuesday, October 05,2010 11:06 AM To: Stephanie A Rebain Subject: VSS calculations
Hi Stephanie
It has come to our attention that due to my request to have FSVeg look at how they calculate VSS
(there were some discrepancies between RMSTAND and FSVeg reports) that you may have requested
some information from Norman or myself. I apologize for any possible miscommunication, what is it
you need form us?
Georgi