Rockin’ the Bakken - University of Minnesota College of ...cusp.umn.edu/Napa_2013/Bakken...
57
Rockin’ the Bakken Kirk Dewey, PE Section Manager HDR Engineering, Inc. Bismarck, ND 701-557-9710 [email protected]
Transcript of Rockin’ the Bakken - University of Minnesota College of ...cusp.umn.edu/Napa_2013/Bakken...

Rockin’ the Bakken
Kirk Dewey, PE Section Manager HDR Engineering, Inc. Bismarck, ND 701-557-9710 [email protected]
Rockin’ the Bakken

Rockin’ the Bakken

www.hdrinc.com
Outline
• The Bakken Formation
– What is it? How Big?
– Oil and Gas Development
• Electrical Infrastructure Challenges
– Load Estimates
– System Limitations
– Changes in Infrastructure
www.hdrinc.com
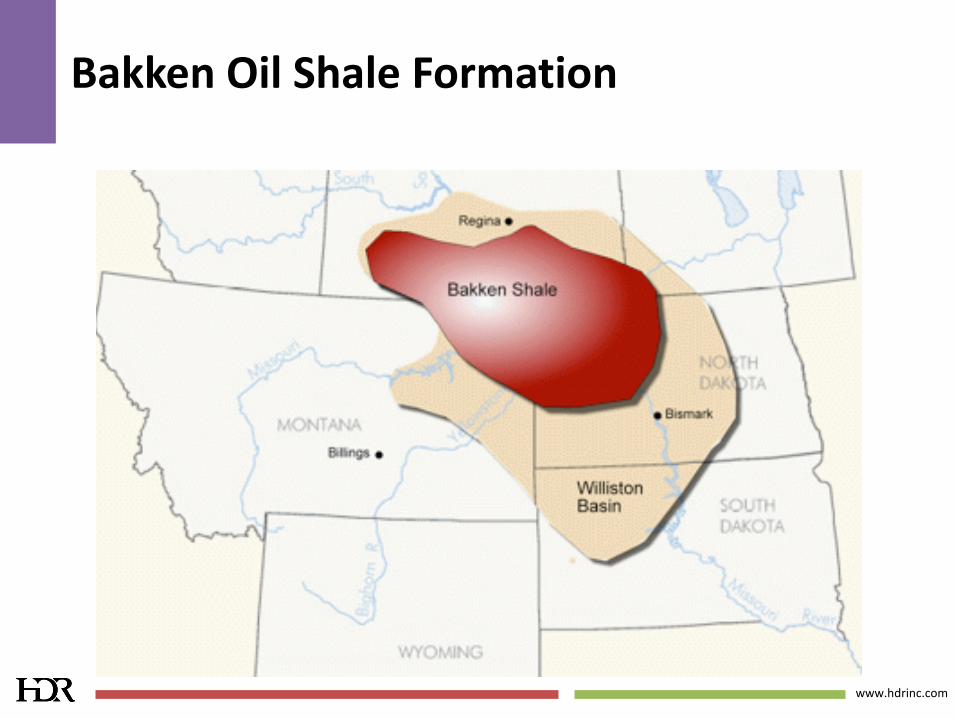
Bakken Oil Shale Formation

www.hdrinc.com
Shale Plays HDR is Helping Clients Serve
Our initial entry point into the O&G industry has been to sell these traditional HDR services to our clients.

www.hdrinc.com
Top oil-producing states as of July 2012
• Top 5 states produce thousands of barrels of oil on a monthly basis
• North Dakota recently jumped ahead of Alaska and California to become the number 2 oil producer
1
59,675
Texas
2
20,896
North
Dakota
4
12,873
Alaska
3
16,430
California
5
5,917
Louisiana
Note: Number of barrels per month as of July 2012
Oct 2013: 23,226

www.hdrinc.com
USGS – 2008 Assessment of Bakken Oil & Gas

www.hdrinc.com
Est. Mature Area of Bakken Formation

www.hdrinc.com
Well Development
By the Numbers: February 8, 2013
• Price of oil: $96/Barrel
• ND oil production: #2 in USA, Oct 2013: 23.2 MMBO
• Active Rigs in ND: 185 (high: 218, May 29,2012)

www.hdrinc.com
Well Facts
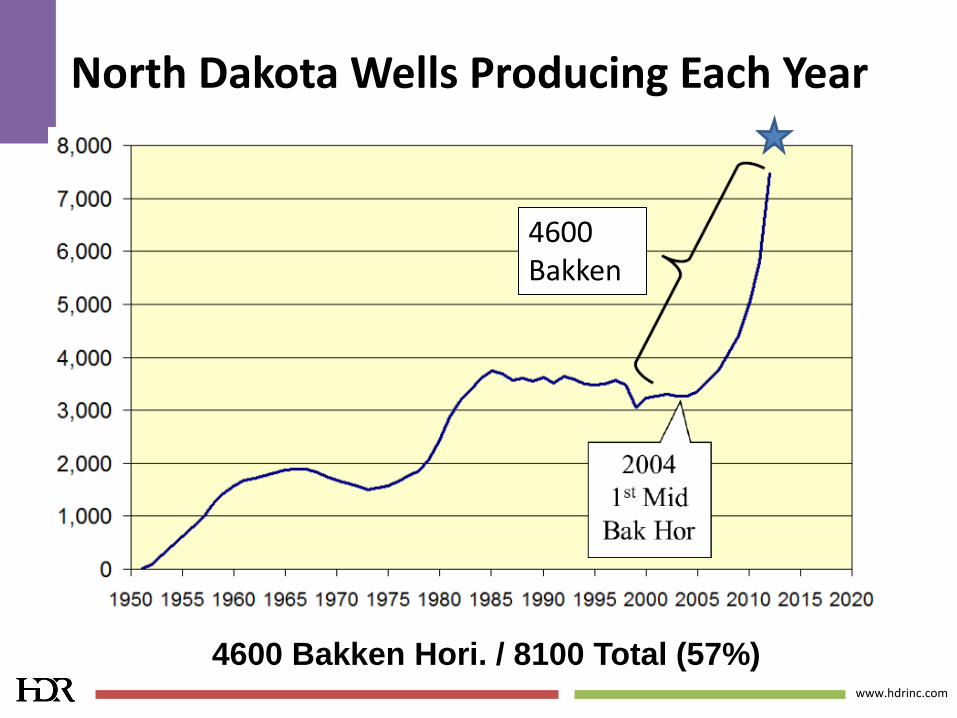
• 8100 producing wells
– 4,600 Bakken (57%)
– 3,600 more to secure leases
• 40,000 additional development wells
– 225 rigs – another 16 years
– 100 rigs – another 30 years
www.hdrinc.com
4600 Bakken Hori. / 8100 Total (57%)
North Dakota Wells Producing Each Year
4600 Bakken

www.hdrinc.com
Typical 2012 Bakken Well
• 45 year well life
• 615,000 barrels of oil
• $9 million to drill/complete
• $20 million net profit
• $4 million in taxes
• $7 million in royalties
• $2 million in wages
• $2 million in oper. expense

www.hdrinc.com
North Dakota Oil Industry Jobs
www.hdrinc.com
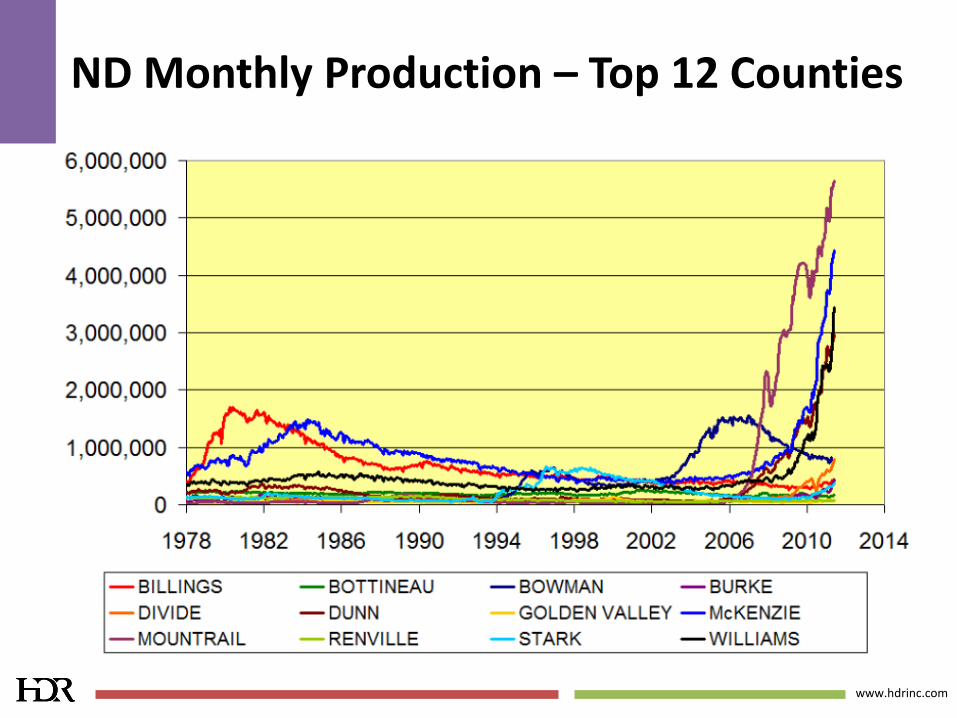
ND Monthly Production – Top 12 Counties
www.hdrinc.com
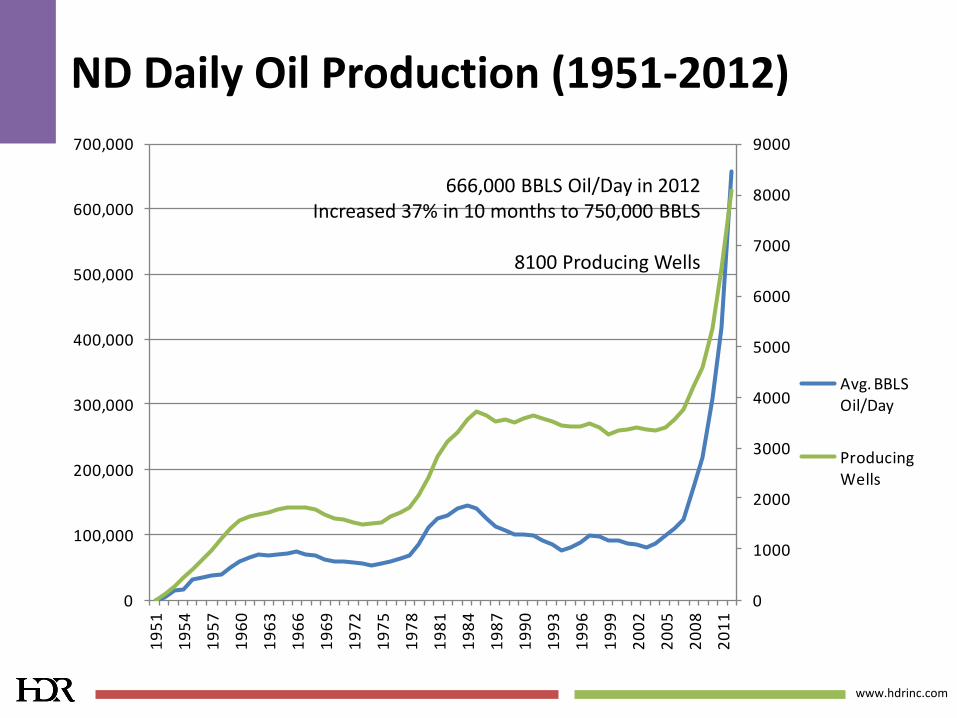
ND Daily Oil Production (1951-2012)
0
1000
2000
3000
4000
5000
6000
7000
8000
9000
0
100,000
200,000
300,000
400,000
500,000
600,000
700,0001
95
1
19
54
19
57
19
60
19
63
19
66
19
69
19
72
19
75
19
78
19
81
19
84
19
87
19
90
19
93
19
96
19
99
20
02
20
05
20
08
20
11
Avg. BBLS Oil/Day
Producing Wells
666,000 BBLS Oil/Day in 2012 Increased 37% in 10 months to 750,000 BBLS
8100 Producing Wells

www.hdrinc.com
Well Development - # of Drilling Rigs

www.hdrinc.com
Oil Drilling Rigs in Western ND, Oct 2012

www.hdrinc.com
Oil Drilling Rigs in Townships in WND, Oct 2012

www.hdrinc.com
Horizontal Drilling in WND, Oct 2012

www.hdrinc.com
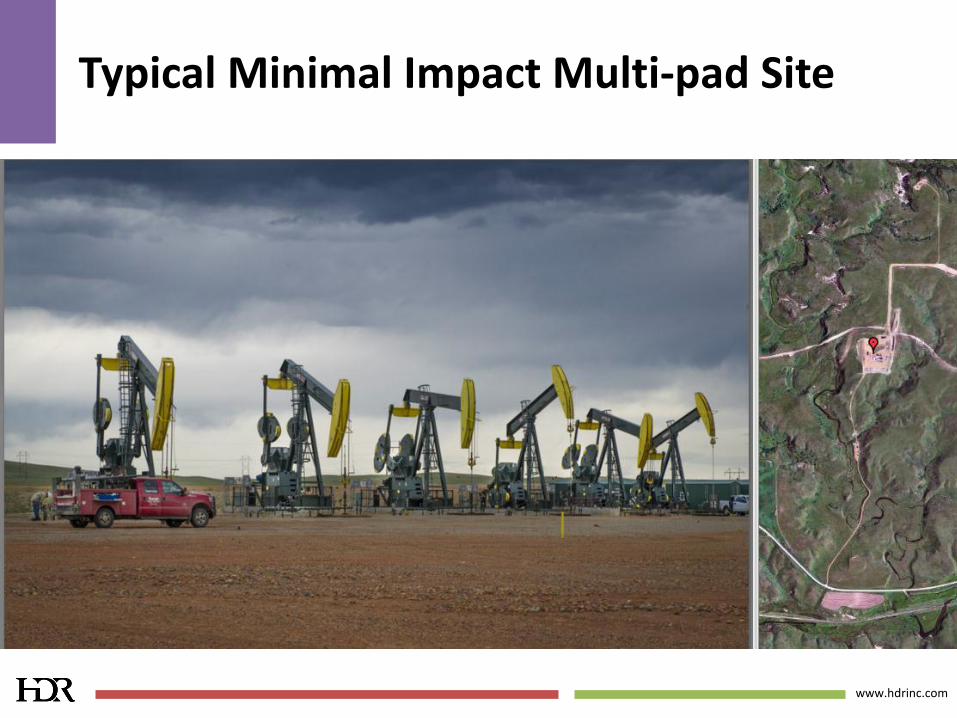
Typical Minimal Impact Multi-pad Site
www.hdrinc.com
Typical Minimal Impact Multi-pad Site
www.hdrinc.com
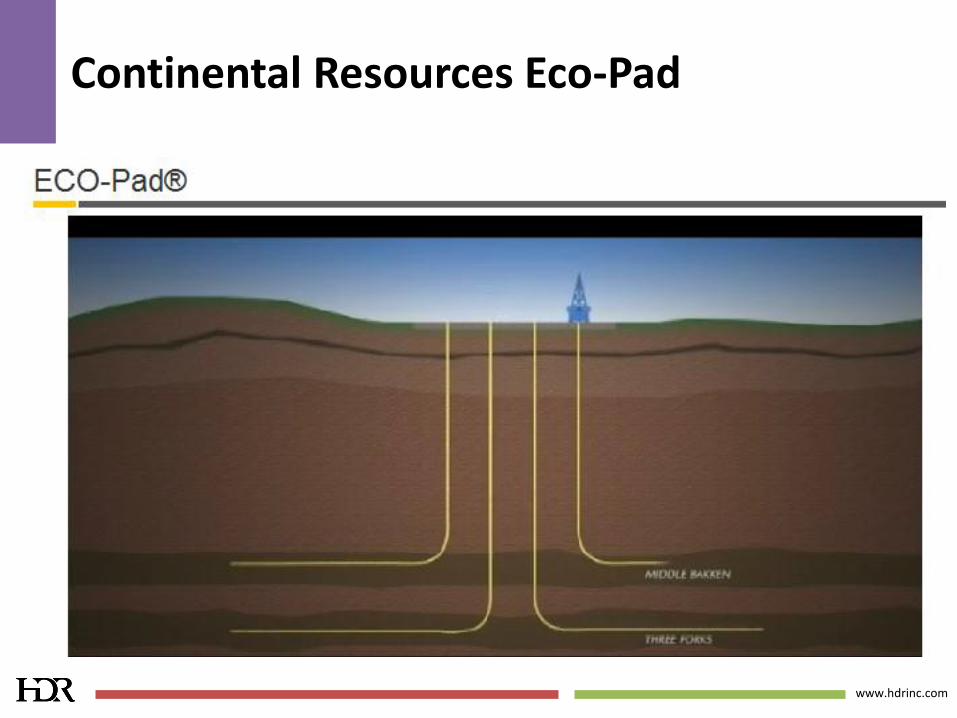
Continental Resources Eco-Pad

www.hdrinc.com
Continental Resources Development Plan

www.hdrinc.com
Typical Hydraulic Fracture Stimulation

www.hdrinc.com
Why Fracture the Rock?
• Already developed easy oil – Oil flows easily without hydraulic fracturing
– Pools where oil is trapped
– Natural fractures in earth
• Unconventional Reserves – Reservoirs are tight
– Uneconomic to produce without hydraulic fracturing
– Must create a path for oil to flow

www.hdrinc.com
Frac Water Additives
• 99.5% water and sand
• 80.5% water
• 19.0% sand or ceramic beads
• 0.5% chemicals
• Most are found in every household

www.hdrinc.com
ND and MT Bakken Assoc. Gas Production

www.hdrinc.com
Electrical Infrastructure Challenges
• Load Estimating
• Electric Utility System Limitations
• Changes in Design and Infrastructure
www.hdrinc.com
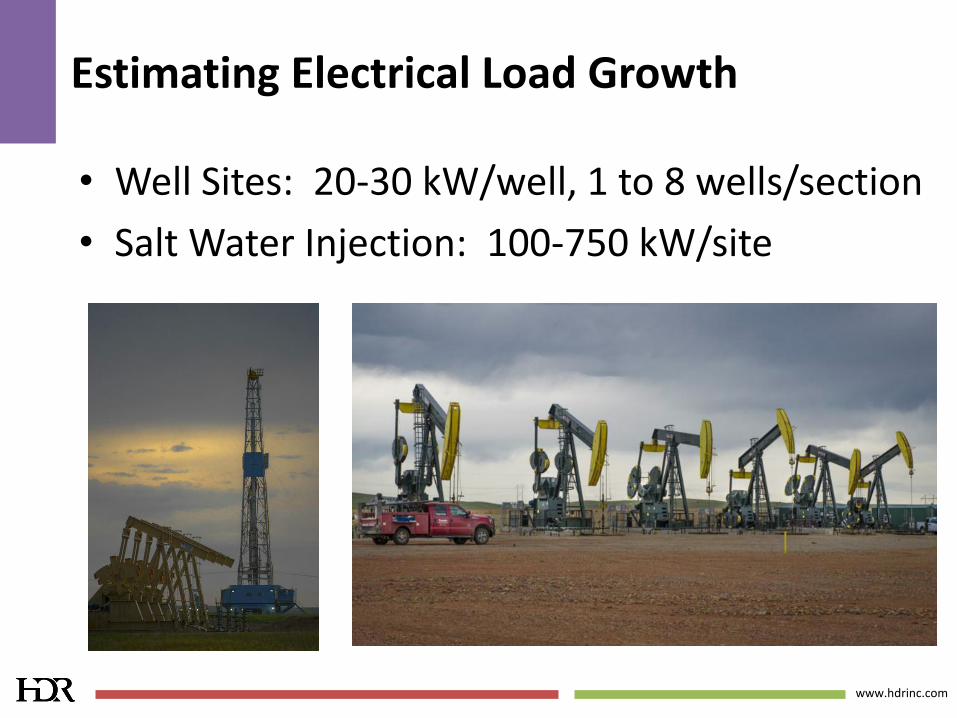
Estimating Electrical Load Growth
• Well Sites: 20-30 kW/well, 1 to 8 wells/section
• Salt Water Injection: 100-750 kW/site

www.hdrinc.com
Estimating Electrical Load Growth (cont.)
• Compressor Stations: 500 to 10,000 kW/site
• Gas Processing Plants: 10-40 MW/site

www.hdrinc.com
Estimating Electrical Load Growth (cont.)
• Oil Loading Facilities – Truck and Rail: 1-4 MW
• Workforce Camps: 4-6 kW/bed
www.hdrinc.com
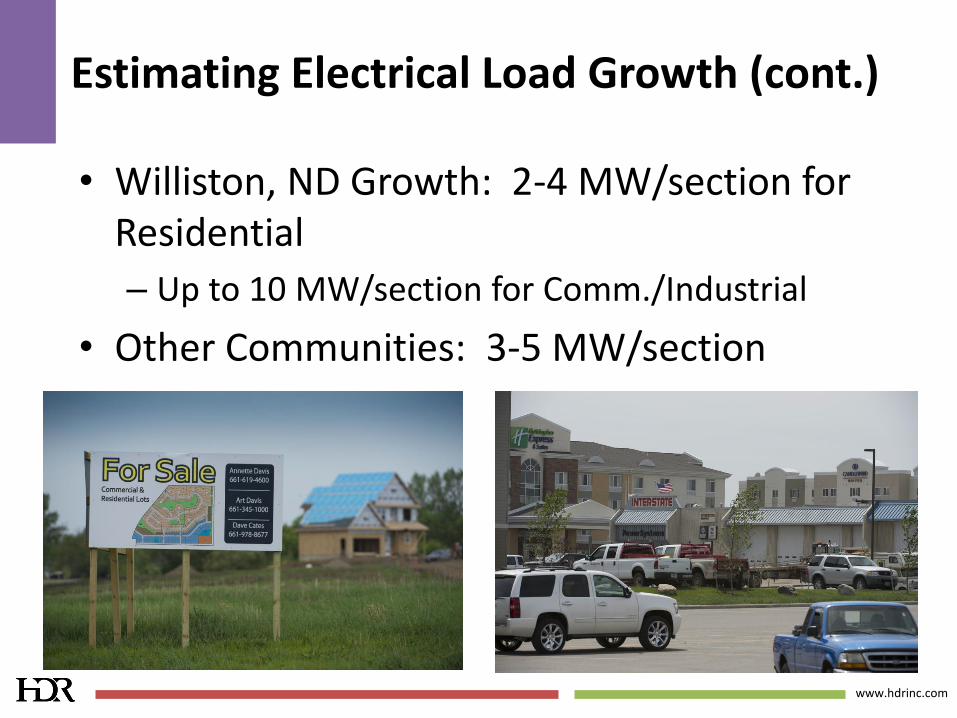
Estimating Electrical Load Growth (cont.)
• Williston, ND Growth: 2-4 MW/section for Residential
– Up to 10 MW/section for Comm./Industrial
• Other Communities: 3-5 MW/section

www.hdrinc.com
Regional Electric Supply
www.hdrinc.com
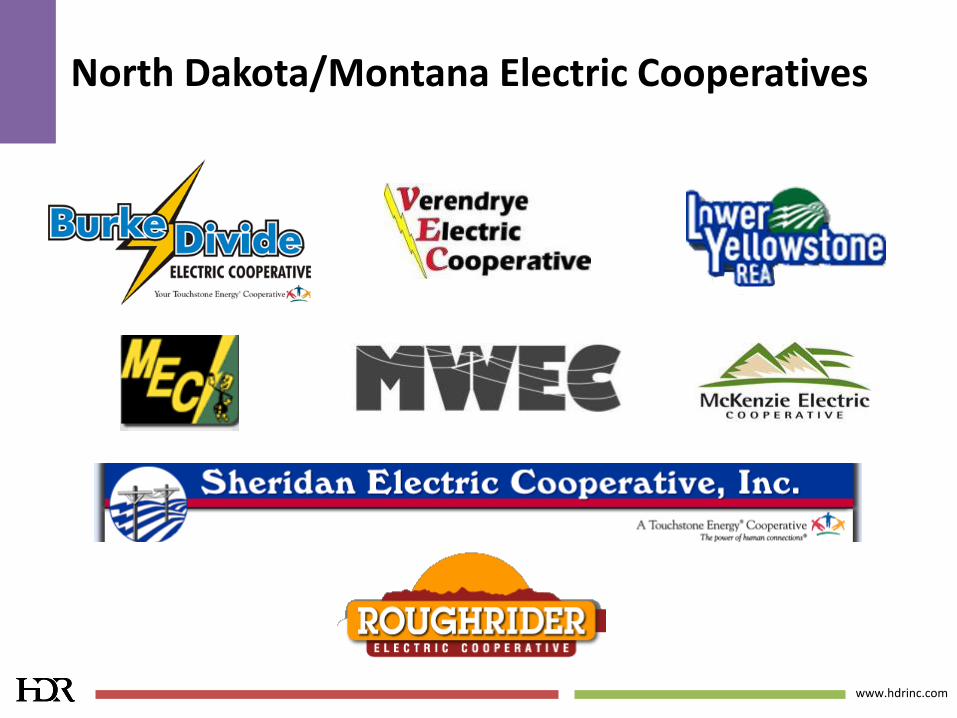
North Dakota/Montana Electric Cooperatives

www.hdrinc.com
0
100
200
300
400
500
600
700
71
/72
74
/75
77
/78
80
/81
83
/84
86
/87
89
/90
92
/93
95
/96
98
/99
01
/02
04
/05
07
/08
10
/11
13
/14
16
/17
19
/20
22
/23
De
man
d (
MW
)
2004
2007
2009
2012
Load Forecast – Coop X
KLJ projects 820 MW by 2025

www.hdrinc.com
0
50
100
150
200
250
300
350
4007
1/7
2
74
/75
77
/78
80
/81
83
/84
86
/87
89
/90
92
/93
95
/96
98
/99
01
/02
04
/05
07
/08
10
/11
13
/14
16
/17
19
/20
22
/23
De
man
d (
MW
) 2004
2007
2009
2012
2013
Load Forecast – Coop Y
KLJ projects 561 MW by 2025

www.hdrinc.com
2012 Load Forecast for Coops Serving the Bakken Area
Feb 2012 Peak 500 MW
www.hdrinc.com
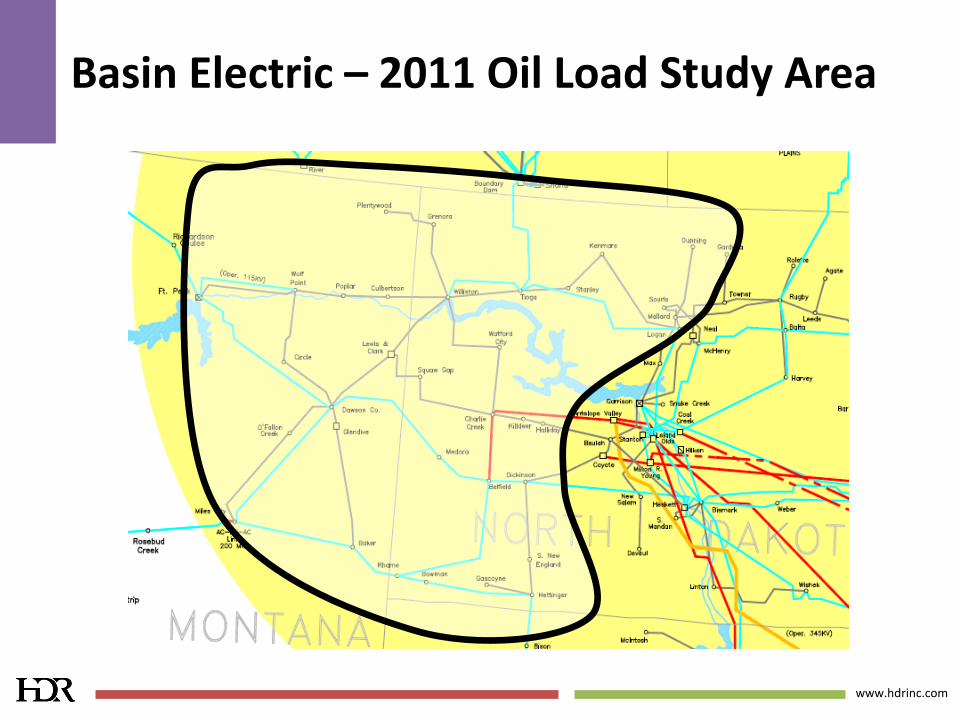
Basin Electric – 2011 Oil Load Study Area
www.hdrinc.com
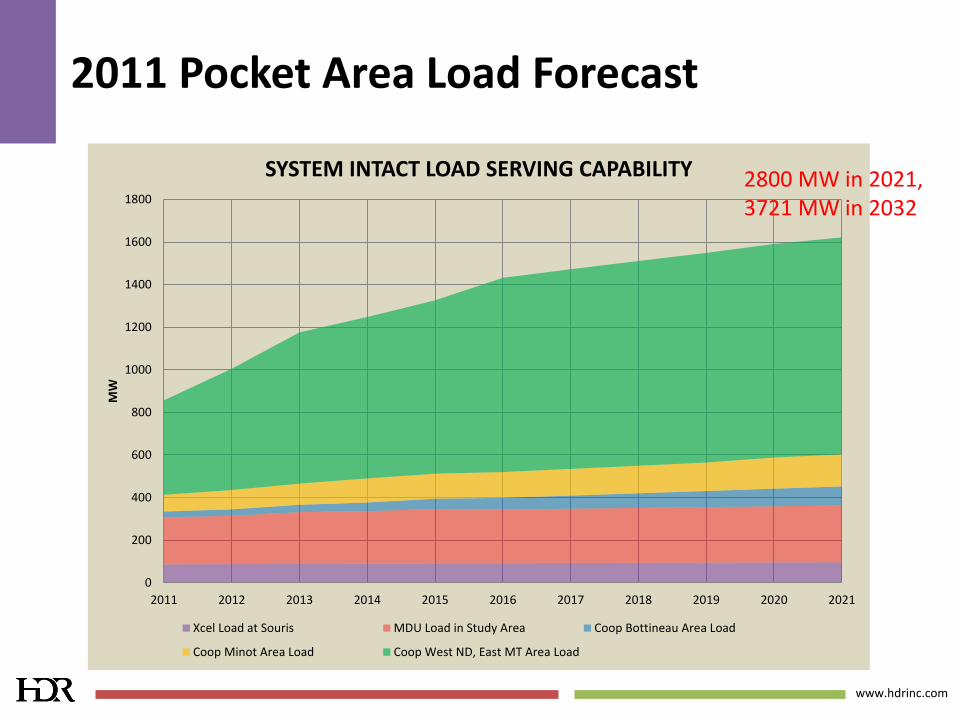
2011 Pocket Area Load Forecast
0
200
400
600
800
1000
1200
1400
1600
1800
2011 2012 2013 2014 2015 2016 2017 2018 2019 2020 2021
MW
SYSTEM INTACT LOAD SERVING CAPABILITY
Xcel Load at Souris MDU Load in Study Area Coop Bottineau Area Load
Coop Minot Area Load Coop West ND, East MT Area Load
2800 MW in 2021, 3721 MW in 2032

www.hdrinc.com
Williston Load Pocket (500 MW Jan 31 ‘13)

www.hdrinc.com
Williston Load Pocket Profile Jan 31, 2013
www.hdrinc.com
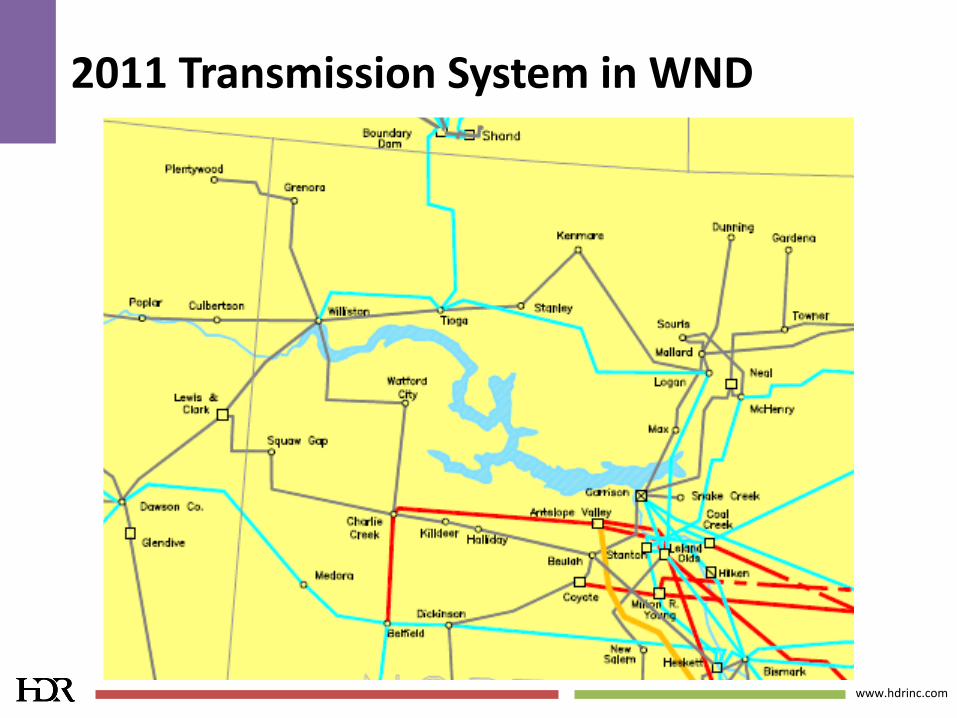
2011 Transmission System in WND

www.hdrinc.com
Blaisdell
Proposed 345kV Line 345kV Line
230kV Line
115kV Line
Des Lacs
Tioga
AVS
Williston
Proposed 345 kV Additions
CCR

www.hdrinc.com
No. of Substations – Coop X
17
43
0
5
10
15
20
25
30
35
40
45
50
No.of Subs
2007
2012

www.hdrinc.com
95 118
568
912
0
100
200
300
400
500
600
700
800
900
1000
Base MVA Upper MVA
2007
2012
Substation Capacity – Coop X

www.hdrinc.com
Substation Design Changes
• 2007 Design
• Radial 57 and 69 kV Source
• Single Bus Design, 69-12.47/7.2 kV
• HS Fuses, 7.5/10.5 MVA Transformer, Regs, and 4 to 6 Feeders
• 2012 Design
• Looped 115 kV Source
• Ring Bus Design (4 to 6 Position), 115-24.94/14.4 kV,
• HS Breaker or Cir Sw, One or Two 15/20/25 MVA Transformers, Regs, 6 to 12 Feeders

www.hdrinc.com
Miles of Transmission Line – Coop X
14
65
1 14 18
215
0
50
100
150
200
250
57 kV Line 69 kV Line 115 kV
2007
201260 Yr Old Line
New Line

www.hdrinc.com
1105
259
52
498
102
1015
0
200
400
600
800
1000
1200
Small Cond -1PH Small Cond - 3PH Large Cond -3Ph
Mile
s o
f D
ist
Lin
e
2007 2012
60 Yr Old Line 12.47/7.2kV
New Line 24.94/14.4kV
Miles of Distribution Line – Coop X

www.hdrinc.com
Distribution Line Changes - 2007 to 2012
• 2012: 1090 miles of 3Ø (red) • 24.94/14.4kV
• 2007: 395 miles of 3Ø (red) • 12.47/7.2kV

www.hdrinc.com
Meters in Rural Mountrail County
1848
195
2043
4714
1688
6402
0
1000
2000
3000
4000
5000
6000
7000
1Ø Meters 3Ø Meters Total
2007
2012

www.hdrinc.com
• Transmission, distribution and substation design
• Transportation – truck bypass
• Railroad oil loading facility
• Water and waste water facilities
• Power generation
HDR Activities in the Bakken
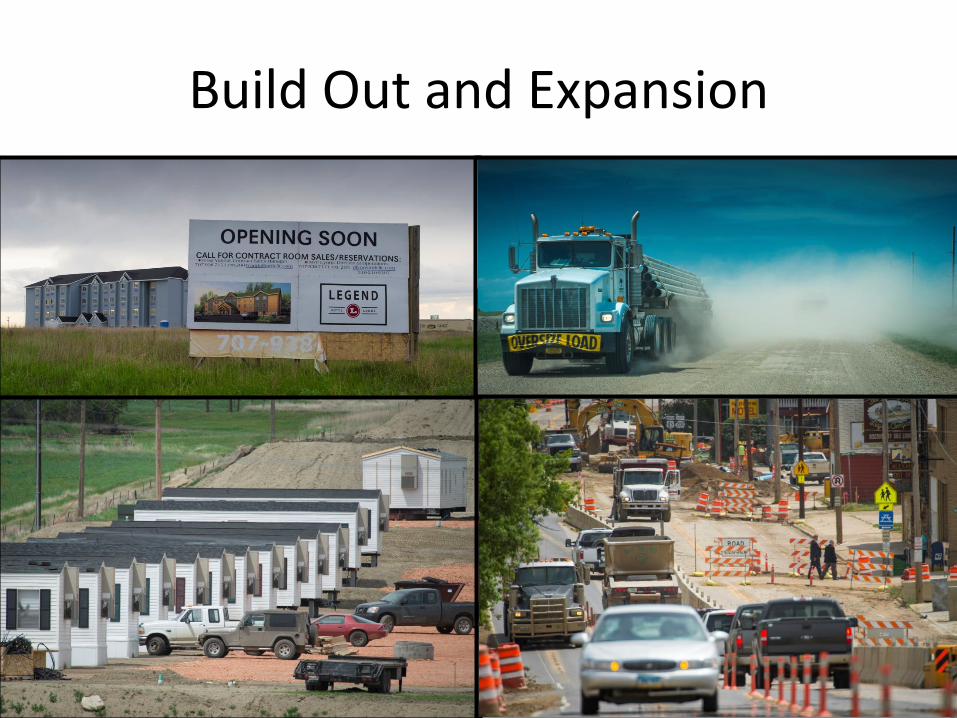
Build Out and Expansion

www.hdrinc.com
Workers and worker housing
Water: fresh water and water treatment – Frac water
Product transportation -- trucks, rail, pipelines
Electrical infrastructure and power supply
Environmental laws – future of hydraulic fracturing
Limitations to Development

www.hdrinc.com
The Mystery City
www.hdrinc.com
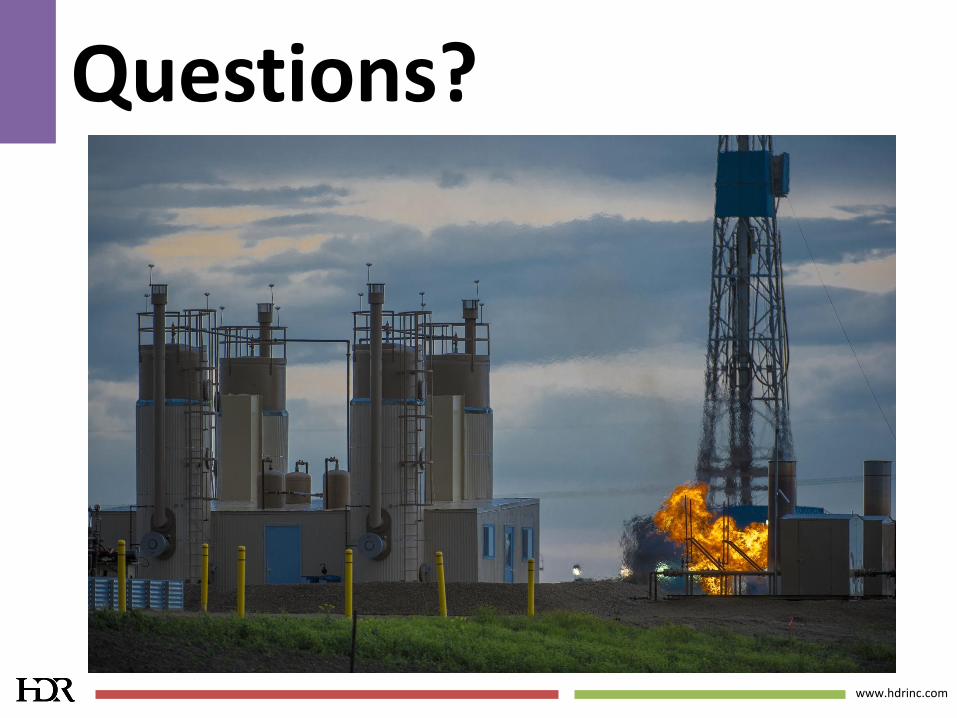
Questions?

www.hdrinc.com
Typical Load Factor – Dec 15 to 22, 2012
0
1000
2000
3000
4000
5000
6000
7000
8000
9000
10000
0
2000
4000
6000
8000
10000
12000
14000
16000
18000
1.00 49.00 97.00 145.00 193.00 241.00 289.00
Robinson Lake
Stony Creek
LF = 82%
LF = 97%