
Rocket Powered Unicorn
56
Rocket Powered Unicorn The Skies Ahead Aren’t so Blue
Transcript of Rocket Powered Unicorn

Rocket Powered Unicorn
The Skies Ahead Aren’t so Blue

Disclaimer Muddy Waters Capital LLC (“Muddy Waters”) is an investment adviser to one or more funds that are in the business of buying and selling securities and other financial instruments. Muddy Waters currently has a short position in the securities of the subject company covered herein (“Subject Company”). Muddy Waters will profit if the trading prices of Subject Company’s securities decline. Muddy Waters may change its views about or its investment positions in Subject Company at any time, for any reason or no reason. Muddy Waters may buy, sell, cover or otherwise change the form or substance of its Subject Company investment. Muddy Waters disclaims any obligation to notify the market of any such changes. The information and opinions expressed in this presentation (the “Presentation”) are based on publicly available information about Subject Company. Muddy Waters recognizes that there may be non-public information in the possession of Subject Company or others that could lead Subject Company or others to disagree with Muddy Waters's analyses, conclusions and opinions. This Presentation expresses our opinions, which we have based upon generally available information, field research, inferences and deductions through our due diligence and analytical process. To the best of our ability and belief, all information contained herein and in any oral communication is accurate and reliable, and has been obtained from public sources we believe to be accurate and reliable, and who are not insiders or connected persons of the stock covered herein or who may otherwise owe any fiduciary duty or duty of confidentiality to the issuer. However, such information is presented “as is,” without warranty of any kind, whether express or implied. Muddy Waters makes no representation, express or implied, as to the accuracy, timeliness, or completeness of any such information or with regard to the results to be obtained from its use. Further, this Presentation contains a very large measure of analysis and opinion and includes forward-looking statements, estimates, projections and opinions prepared with respect to, among other things, Subject Company’s anticipated operating performance, access to capital markets, market conditions, cash flow, assets and liabilities. Such statements, estimates, projections and opinions may prove to be substantially inaccurate and are inherently subject to significant risks and uncertainties beyond Muddy Waters's control. All expressions of opinion are subject to change without notice, and Muddy Waters does not undertake to update or supplement any reports or any of the information, analysis and opinion contained in them. The Presentation is not investment advice or a recommendation or solicitation to buy or sell any securities. Except where otherwise indicated, the Presentation speaks as of the date hereof, and Muddy Waters undertakes no obligation to correct, update or revise the Presentation or to otherwise provide any additional materials. Muddy Waters also undertakes no commitment to take or refrain from taking any action with respect to Subject Company or any other company. As used herein, except to the extent the context otherwise requires, Muddy Waters includes its affiliates and its and their respective partners, directors, officers and employees.
Source: S&P Capital IQ
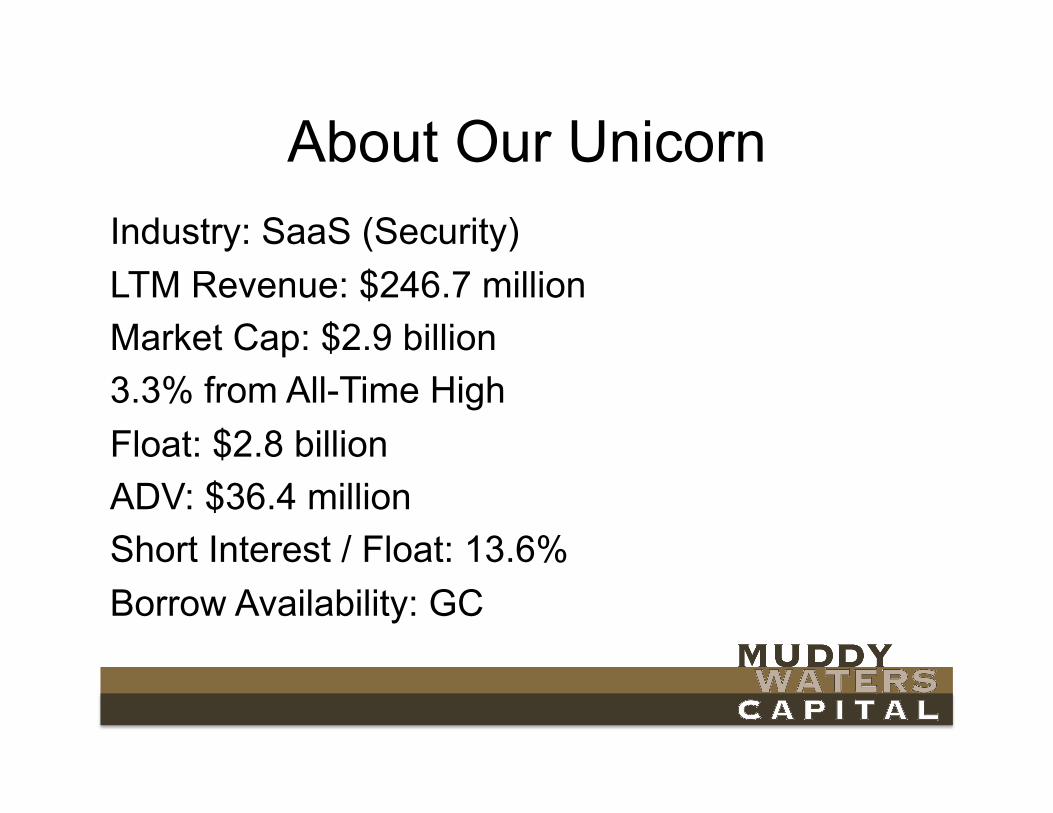
About Our Unicorn Industry: SaaS (Security) LTM Revenue: $246.7 million Market Cap: $2.9 billion 3.3% from All-Time High Float: $2.8 billion ADV: $36.4 million Short Interest / Float: 13.6% Borrow Availability: GC

Priced for Perfection
• LTM EV / Sales: 11.9x
• Fourth richest in 45 company SaaS comp universe

What is this Rocket Powered Unicorn?

Proofpoint, Inc. (NASDAQ: PFPT)
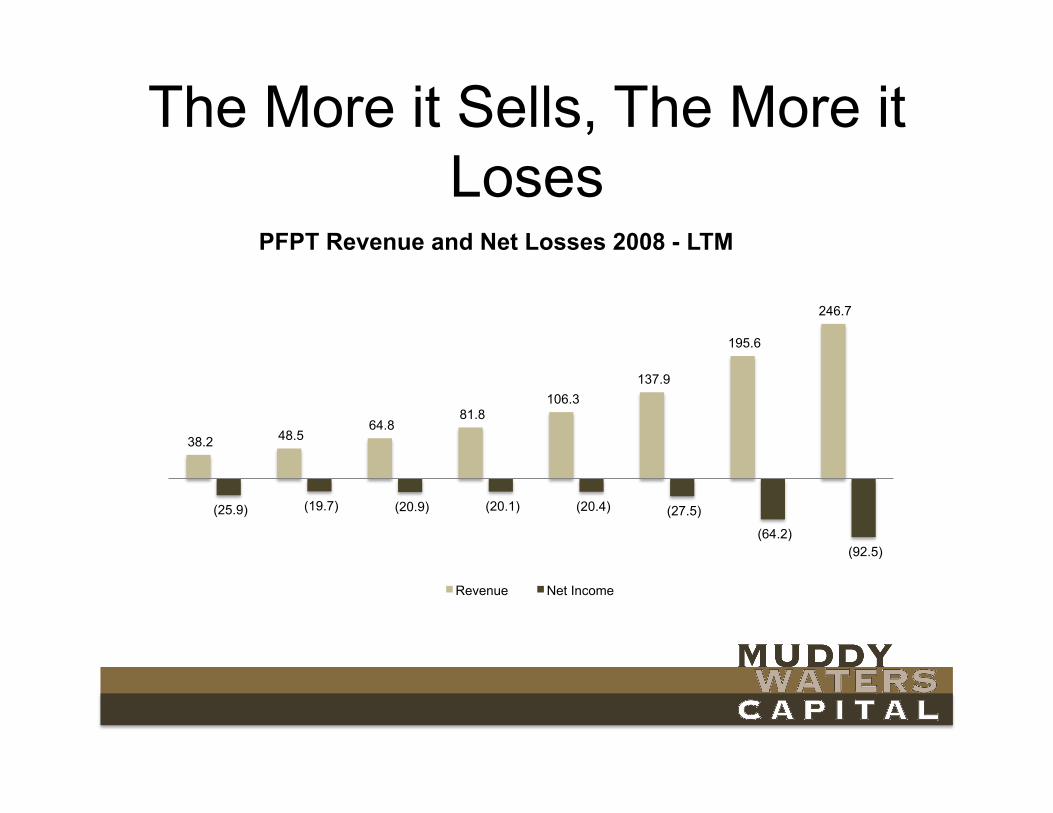
The More it Sells, The More it Loses
38.2 48.5 64.8
81.8 106.3
137.9
195.6
246.7
(25.9) (19.7) (20.9) (20.1) (20.4) (27.5)
(64.2) (92.5)
PFPT Revenue and Net Losses 2008 - LTM
Revenue Net Income

But its Multiple Expands
4.78x
3.15x
6.58x
8.92x 8.58x
9.80x
11.77x
3.79x
2.69x
5.51x
7.23x 6.86x 7.75x
9.25x
2H2012 1H2013 2H2013 1H2014 2H2014 1H2015 2H2015
PFPT multiple expansion 2013 - Present TEV/LTM Total Revenue TEV/NTM Total Revenues

What Powers PFPT’s Rocket?
• Mischaracterization as “cyber” security • Management misleading re TAM and organic
growth • Analysts Gone Wild • Failure to acknowledge competitive pressures
that have already led to discounting • Last gasp effort to grab market share before
MSFT, GOOG, AMZN, and CSCO move in
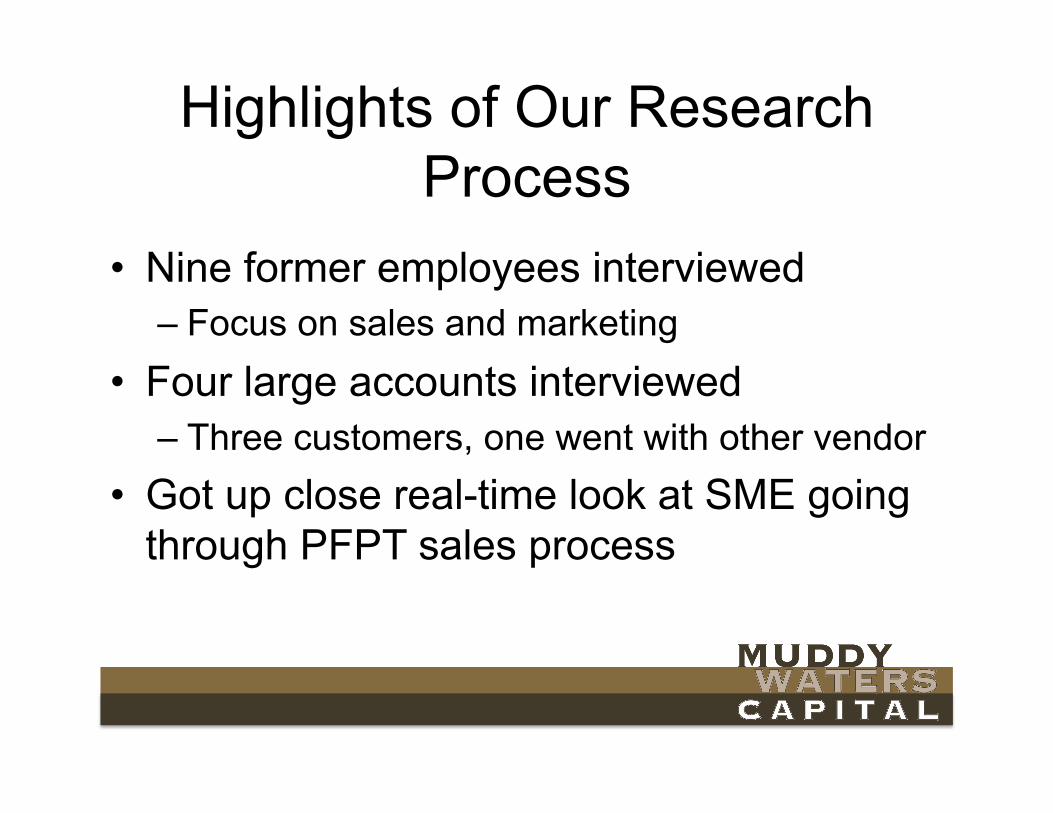
Highlights of Our Research Process
• Nine former employees interviewed – Focus on sales and marketing
• Four large accounts interviewed – Three customers, one went with other vendor
• Got up close real-time look at SME going through PFPT sales process
PFPT is Email Security (not Cyber)

PFPT Likes Saying “Cyber”

But it’s Almost Entirely Email Security and Archiving
-‐
10,000
20,000
30,000
40,000
50,000
60,000
70,000
80,000
Q1 13 Q2 13 Q3 13 Q4 13 Q1 14 Q2 14 Q3 14 Q4 14 Q1 15 Q2 15 Q3 15
Email Security Archiving and Governance
Email CAGR: 45.6% Archiving CAGR: 17.6%

PFPT Email Security Offerings
• “Protection” – anti-spam and anti-malware • “Privacy” – email encryption • “TAP” – Targeted Advanced Protection

Secure Email Gateway revenue (2014) Worldwide Information Security spending (2014)
Why PFPT Doesn’t Like Admitting it’s Just Email
Source: Gartner
$71.1 billion
$1.3 billion
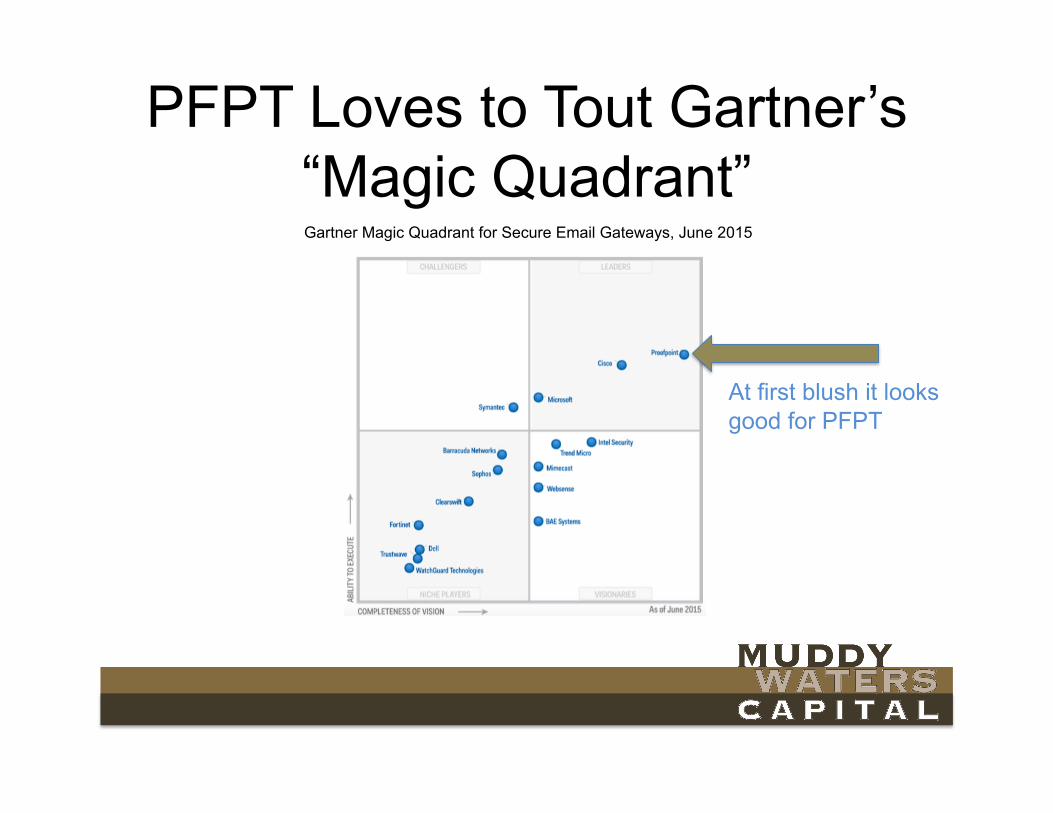
PFPT Loves to Tout Gartner’s “Magic Quadrant” Gartner Magic Quadrant for Secure Email Gateways, June 2015
At first blush it looks good for PFPT

But Here is What Gartner Says • “The SEG market is mature.” • “The SEG revenue from the Magic
Quadrant vendors in 2014 was $1.3 billion…”
• “We anticipate continued, low single-digit growth (2% to 4%) for the overall market.”
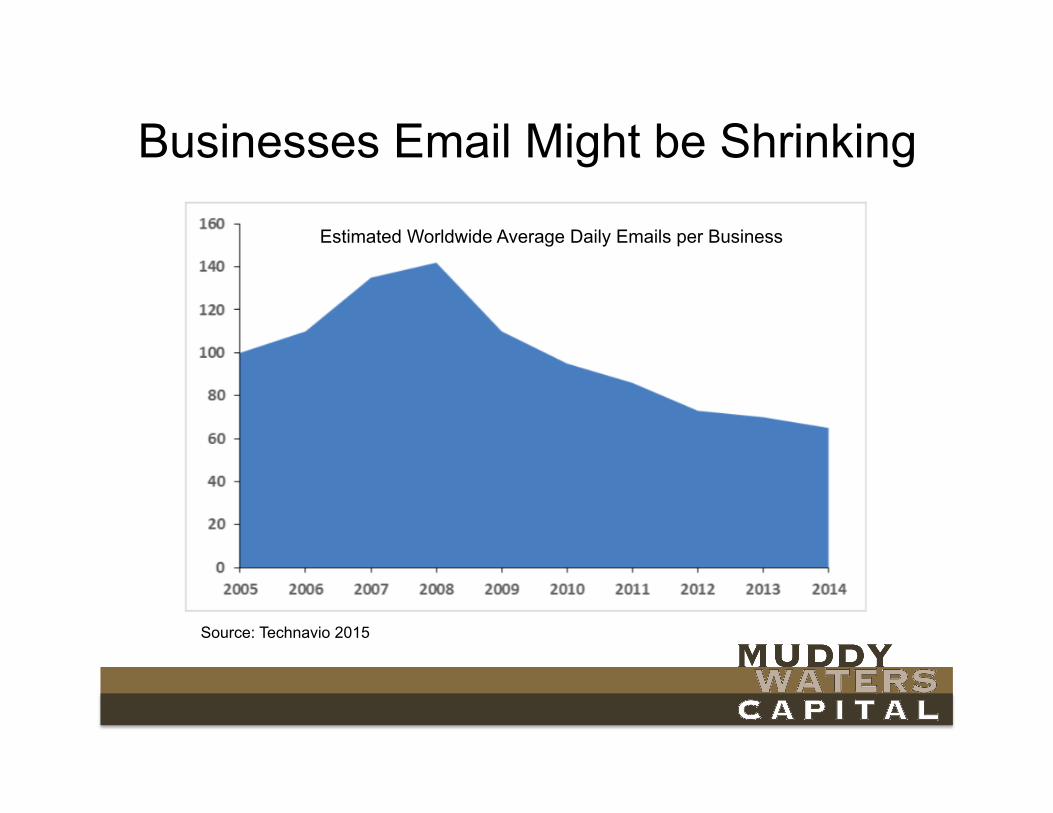
Businesses Email Might be Shrinking
Source: Technavio 2015
Estimated Worldwide Average Daily Emails per Business
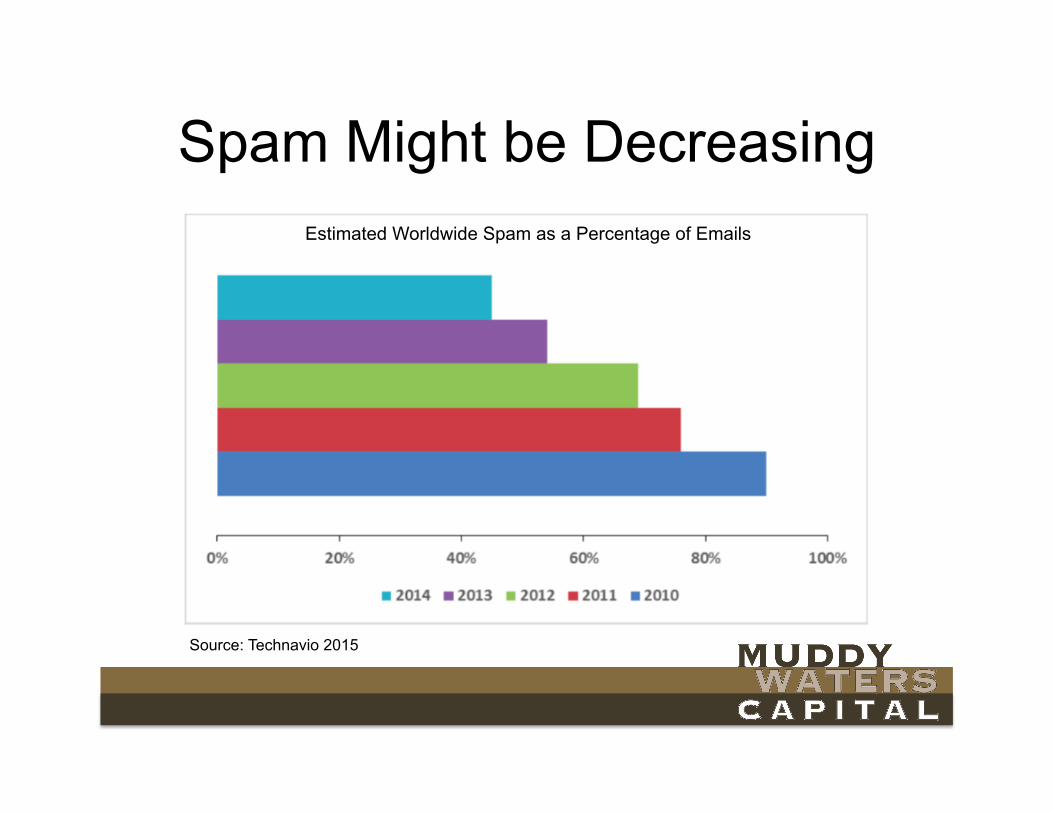
Spam Might be Decreasing
Source: Technavio 2015
Estimated Worldwide Spam as a Percentage of Emails
Email Security Would be Superfluous…
…if everybody in the world set their SPF signatures.

But Isn’t TAP the Greatest Thing Since…well…Tap?
What is TAP?
• PFPT’s solution for “Targeted Attack Protection” (a subset of “Advance Persistent Threats”) – Criminals often send emails with malicious
attachments or URLs that when opened, allow them to access the network
• TAP goes beyond signature analysis; sandboxes emails and opens and analyzes attachments and links
Q: How Big is the TAP Market?
A: “I think there’s lots of estimates that are, frankly, bullshit.”
- Gary Steel, CEO; Sep 3, 2013

Q: How Big is the APT Security TAM?
“…pull away all the hype of the Advanced Persistent Threat market and the big stupid TAM numbers that are being thrown around today…” (emphasis added)
- Gary Steel, CEO; December 3, 2013

PFPT’s Own Big Stupid TAM Numbers
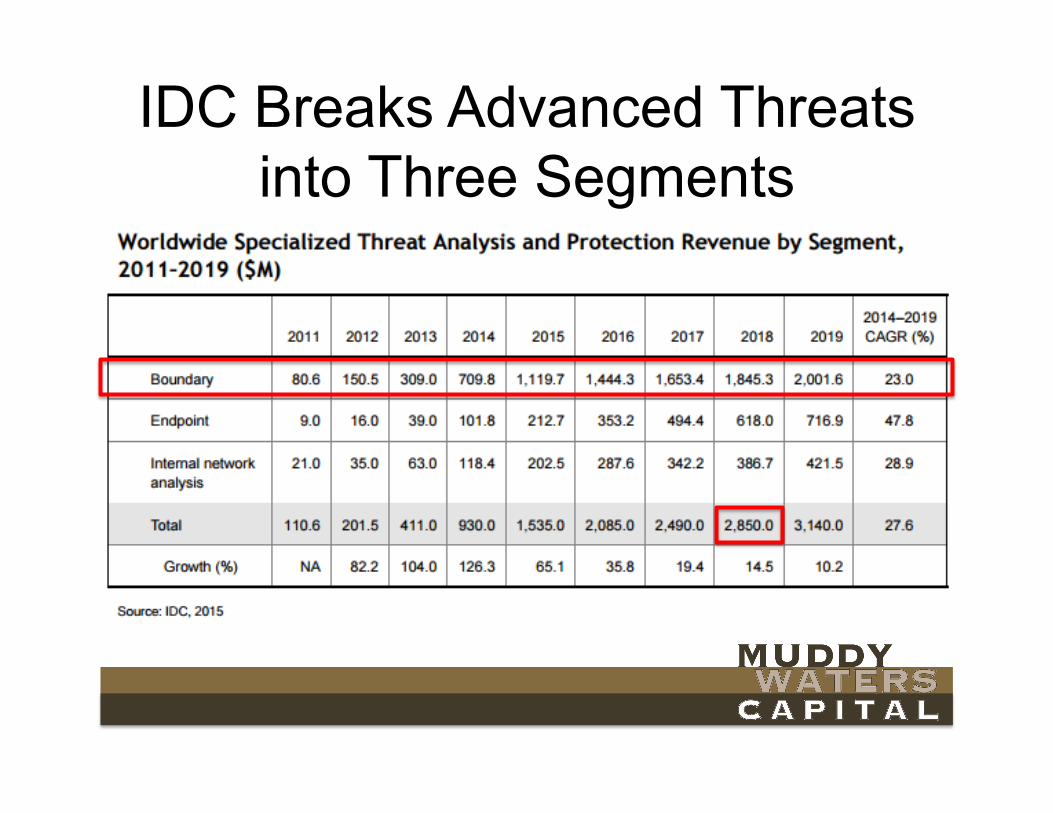
IDC Breaks Advanced Threats into Three Segments

TAP is a Slice of Boundary ATP

IDC Report
“Boundary covers all types of traffic (e.g., HTML, SMTP, TCP/IP). Most of the boundary solutions consist of security appliances, but some functions will be handled in the cloud.”
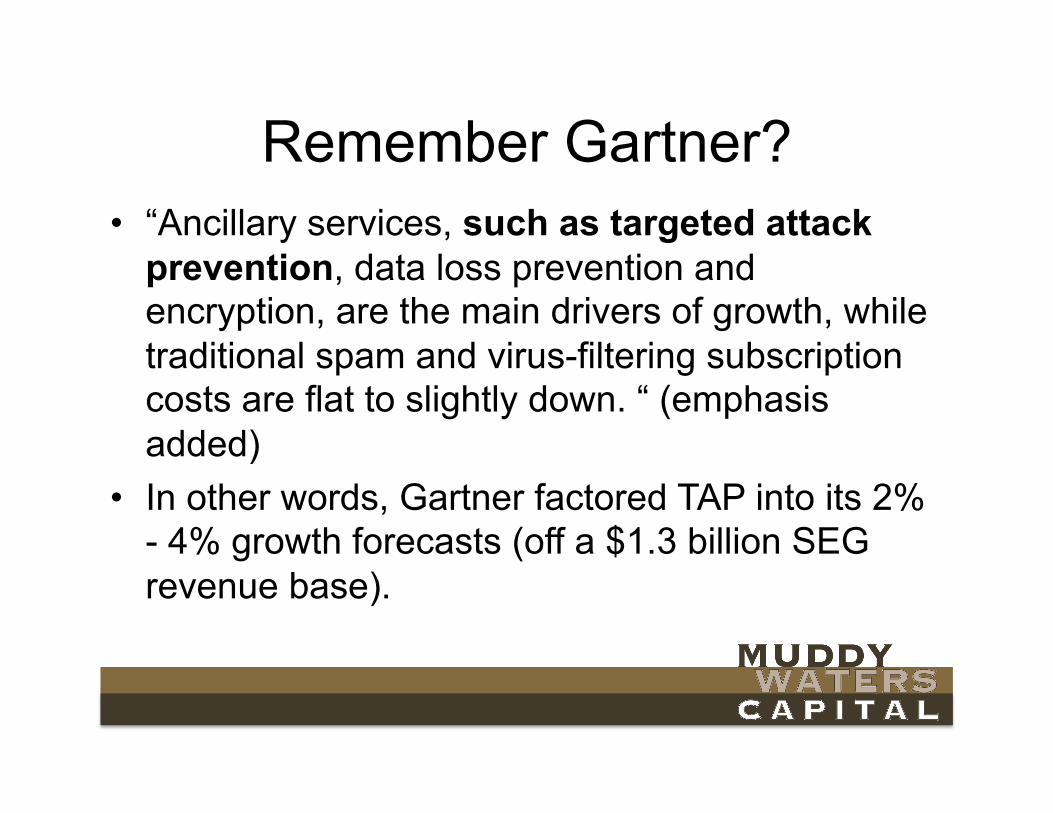
Remember Gartner? • “Ancillary services, such as targeted attack
prevention, data loss prevention and encryption, are the main drivers of growth, while traditional spam and virus-filtering subscription costs are flat to slightly down. “ (emphasis added)
• In other words, Gartner factored TAP into its 2% - 4% growth forecasts (off a $1.3 billion SEG revenue base).

Email Not as Much Mindshare as PFPT Says
• Financial services, healthcare, and government put the highest premium on securing email
• For many industries, email isn’t core to their business

TAP Bottom Line • 2013 estimate of $400 million was a
substantial overstatement • 2018 TAM of $2.9 billion is disingenuous. It is
just a slice – probably minority slice – of estimated $1.8 billion boundary
• Boundary is slowest growth segment of Advanced Threats market
• PFPT not even among vendors mentioned in IDC report
Sometimes PFPT’s Numbers are Small and Stupid
Acquired Revenue

• PFPT management consistently represent acquisitions as contributing little revenue
• PFPT disclosed 2013 recognized revenue from acquisitions only $4.3 million
• Those companies generated $44.6 million in 2012, the year before the acquisitions
• PFPT’s annual rev growth from 2012-2014 was $89.3 million
Fudging PFPT’s Organic Growth

Less Can be More When Responding to the SEC
At IPO in 2012 SEC asked for detail on what products actually sell:
"We note that in your business section you list many products, but it is unclear whether they generate any significant amounts of revenue.” (emphasis added) - SEC correspondence, Jan. 10, 2012
PFPT was “unable to specifically attribute revenue”
“the Company’s subscription solution is comprised of many different elements. All customers who have purchased a valid subscription from the Company have the right to, and may at their own discretion, access its security-as-a-service platform and the various services it contains, including those solutions developed to address the new and evolving messaging solutions such as social media and file sharing applications. As a result, the Company is unable to specifically attribute revenue to the individual elements that comprise the Company’s subscription solution.” - SEC correspondence, Jan. 25, 2012

Less Can be More When Responding to the SEC
PFPT very recently found the ability to specifically attribute revenue to products:
“In the past when we first got into a customer we just had a one product sale, typically protection…” - Paul Auvil, CFO, Dec 1, 2015

Analysts Gone WILD!!!

But Seriously… Analysts seem to be caught in positive feedback loop (or spiral):
1. Recommend PFPT as a Buy 2. Stock goes up 3. Analyst gets praise 4. Analyst gets more bullish 5. Analyst gets more praise 6. Analyst gets Uber Bullish

Examples • “Proofpoint Hits 88mph with Strong 3Q15 Performance;
Raising Target Price to $80” • “Knocking it out the Park! Strong Guidance” • “…the primary concern of Proofpoint investors heading
into the quarter was 2016 guidance, which was answered with a resounding WOW.”
• One analyst’s approach: – 10-year DCF – PT raised to $82 (Nov 2015) from $72 (Sep 2015) – While lowering 2016E FCF by 32%!

Competitive Pressures Already Negatively Impacting Large
Accounts Migration to Cloud Email is not Good for PFPT’s
Market Share

Why Platforms are a Threat
• Platforms (esp. MSFT) have a long record of degrading and destroying businesses
• Because they’re ubiquitous, their cost to develop new features is trivial
• Existing players might have better products, but “Good Enough” often wins the day

• Eroding pricing power: PFPT has been premium priced, but now offering major discounts to large accounts seriously considering competitors – this includes TAP
• Signs of stress: Sales tactics have become very high pressure at times with large accounts
• Competition to continue to close the technology gap
Competition Already a Major Issue
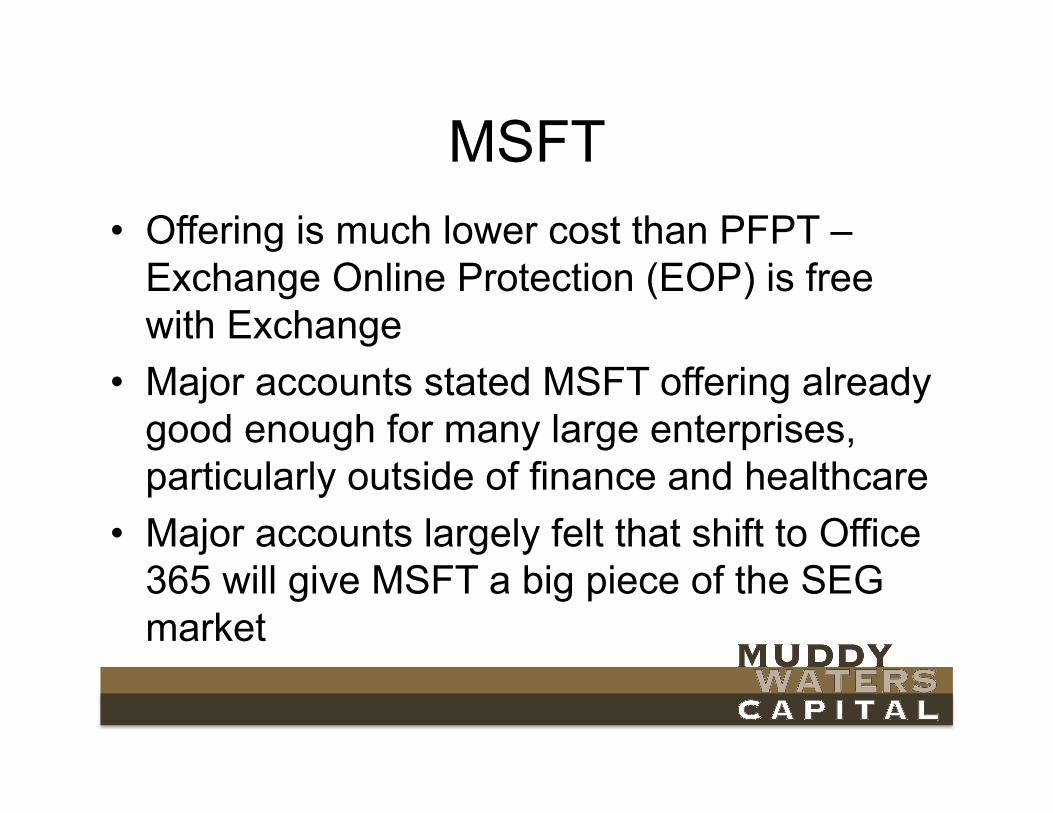
• Offering is much lower cost than PFPT – Exchange Online Protection (EOP) is free with Exchange
• Major accounts stated MSFT offering already good enough for many large enterprises, particularly outside of finance and healthcare
• Major accounts largely felt that shift to Office 365 will give MSFT a big piece of the SEG market
MSFT

GOOG and AMZN PFPT GOOG $5/
month GOOG $10/
month AMZN
Business email addresses ([email protected]) X X X Video and voice calls X X
Integrated online calendars X X X Online text documents, spreadsheets and slides X X
Security and admin controls X X X X
24/7 phone and email support X X X X Unlimited Storage X Audit and reporting X X eDiscovery covering emails, chats, docs and files X X X Easily search and export to different formats X X X Email Archive X X X
Set message retention policies X X X Place and enforce litigation holds on inboxes X X X Anti malware, Antispam X X X X
CSCO
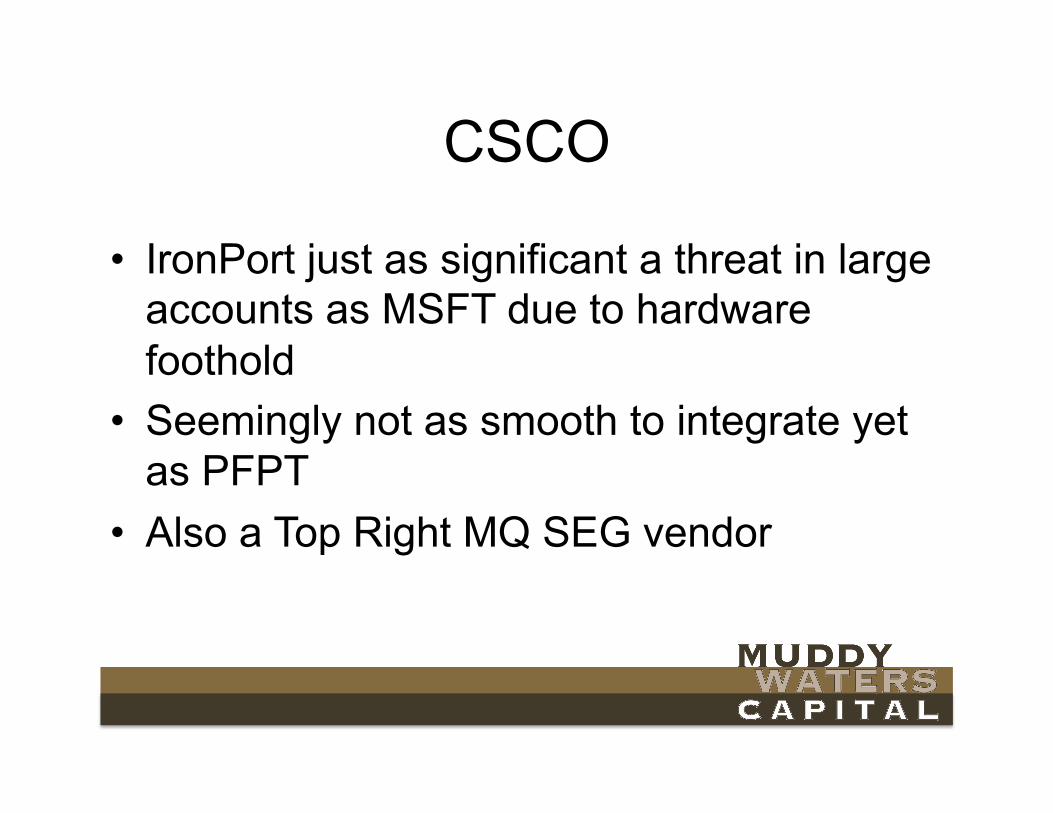
• IronPort just as significant a threat in large accounts as MSFT due to hardware foothold
• Seemingly not as smooth to integrate yet as PFPT
• Also a Top Right MQ SEG vendor
SME – PFPT Possibly Cannibalizing through Essentials
One former inside sales rep expressed frustration that Essentials (much lower priced product) was cannibalizing the primary offering for SMEs.

Last Gasp to Grab Market Share before Competition
Moves In

PFPT’s Ratio Should be MUCH Lower by Now
“And then sales and marketing is currently sitting at about 55%...so we look to drive sales and marketing down to mid-30s over time…we expect in the 3- to 5-year time frame to generate, call it, 20% to 22% on a non-GAAP-to-EBITDA basis and a similar number on free cash flow.” - Paul Auvil, CFO, Nov. 28, 2012

But Sales & Marketing Spend is at All-Time Highs
Where’s the Bang for the Buck?
PFPT billing and revenue YoY growth rates in 2015 are in line with those of 2014

Bottom Line
• PFPT’s growth rate is at real risk • Caveat is that next one or two quarters are
unlikely to see tapering, given recent customer adds

Cyber Security Coming Back to Earth

Cyber Security Fragile COMPANY 52-WEEK
HIGH OFF FROM HIGH EV/REVENUE
Radware Ltd. (NasdaqGS:RDWR) 24.91 -34% 2.9x
Symantec Corporation (NasdaqGS:SYMC) 27.32 -28% 1.9x
Qualys, Inc. (NasdaqGS:QLYS) 55.47 -30% 7.4x
VASCO Data Security International Inc. (NasdaqCM:VDSI) 35.0 -46% 2.2x
Fortinet Inc. (NasdaqGS:FTNT) 50.31 -29% 5.6x
Barracuda Networks, Inc. (NYSE:CUDA) 46.78 -59% 2.7x
Rapid7, Inc. (NasdaqGM:RPD) 26.19 -35% 5.9x
FireEye, Inc. (NasdaqGS:FEYE) 55.33 -60% 5.3x
AVG Technologies N.V. (NYSE:AVG) 29.15 -31% 2.8x
CyberArk Software, Ltd. (NasdaqGS:CYBR) 76.35 -45% 7.4x
Sophos Group plc (LSE:SOPH) 4.37 -12% 7.1x

The Smartest Money is Selling

Insiders Now Hitting Bids
LTM Insider Sales $38 million
Chart source: The Washington Service