Robustness, Validity and Significance of the ECB's AQR … · economic governance banking union...
42
E BANKING UNION ECONOMIC GOVERNANCE BANKING UNION ECONOMIC GOVERNANCE BANKING UNION ECONOMIC GOVERNANCE BANKING UNION ECON As NRAs SRM MIP MTO NRP CRD SSM SGP EIP MTO SCP ESAs EFSM EDP AMR CSRs AGS DGS EFSF ESM ESBR EBA EWG NCAs NRAs SRM MIP MTO NRP CRD SSM SG UNION ECONOMIC GOVERNANCE BANKING UNION ECONOMIC GOVERNANCE BANKING UNION ECONOMIC GOVERNANCE BANKING UNION ECONOMIC GOVE S DGS EFSF ESM ESBR EBA EWG NCAs NRAs SRM MIP MTO NRP CRD SSM SGP EIP MTO SCP ESAs EFSM EDP AMR CSRs AGS DGS EFSF ESM ESBR EBA EWG NCAs N NOMIC GOVERNANCE BANKING UNION ECONOMIC GOVERNANCE BANKING UNION ECONOMIC GOVERNANCE BANKING UNION ECONOMIC GOVERNANCE BA O SCP ESAs EFSM EDP AMR CSRs AGS DGS EFSF ESM ESBR EBA EWG NCAs NRAs SRM MIP MTO NRP CRD SSM SGP EIP MTO SCP ESAs EFSM EDP AMR CSRs AGS DG VERNANCE BANKING UNION ECONOMIC GOVERNANCE BANKING UNION ECONOMIC GOVERNANCE BANKING UNION ECONOMIC GOVERNANCE BANKING UN MIP MTO NRP CRD SSM SGP EIP MTO SCP ESAs EFSM EDP AMR CSRs AGS DGS EFSF ESM ESBR EBA EWG NCAs NRAs SRM MIP MTO NRP CRD SSM SGP EIP MTO SC BANKING UNION ECONOMIC GOVERNANCE BANKING UNION ECONOMIC GOVERNANCE BANKING UNION ECONOMIC GOVERNANCE BANKING UNION ECONO NION ECONOMIC GOVERNANCE BANKING UNION ECONOMIC GOVERNANCE BANKING UNION ECONOMIC GOVERNANCE BANKING UNION ECONOMIC GOVER s EFSM EDP AMR CSRs AGS DGS EFSF ESM ESBR EBA EWG NCAs NRAs SRM MIP MTO NRP CRD SSM SGP EIP MTO SCP ESAs EFSM EDP AMR CSRs AGS DGS EFSF ES CE BANKING UNION ECONOMIC GOVERNANCE BANKING UNION ECONOMIC GOVERNANCE BANKING UNION ECONOMIC GOVERNANCE BANKING UNION ECO RP CRD SSM SGP EIP MTO SCP ESAs EFSM EDP AMR CSRs AGS DGS EFSF ESM ESBR EBA EWG NCAs NRAs SRM MIP MTO NRP CRD SSM SGP EIP MTO SCP ESAs EFS NG UNION ECONOMIC GOVERNANCE BANKING UNION ECONOMIC GOVERNANCE BANKING UNION ECONOMIC GOVERNANCE BANKING UNION ECONOMIC GO A EWG NCAs NRAs SRM MIP MTO NRP CRD SSM SGP EIP MTO SCP ESAs EFSM EDP AMR CSRs AGS DGS EFSF ESM ESBR EBA EWG NCAs NRAs SRM MIP MTO NRP C CONOMIC GOVERNANCE BANKING UNION ECONOMIC GOVERNANCE BANKING UNION ECONOMIC GOVERNANCE BANKING UNION ECONOMIC GOVERNANCE R CSRs AGS DGS EFSF ESM ESBR EBA EWG NCAs NRAs SRM MIP MTO NRP CRD SSM SGP EIP MTO SCP ESAs EFSM EDP AMR CSRs AGS DGS EFSF ESM ESBR EBA EW GOVERNANCE BANKING UNION ECONOMIC GOVERNANCE BANKING UNION ECONOMIC GOVERNANCE BANKING UNION ECONOMIC GOVERNANCE BANKING GP EIP MTO SCP ESAs EFSM EDP AMR CSRs AGS DGS EFSF ESM ESBR EBA EWG NCAs NRAs SRM MIP MTO NRP CRD SSM SGP EIP MTO SCP ESAs EFSM EDP AMR CS NCE BANKING UNION ECONOMIC GOVERNANCE BANKING UNION ECONOMIC GOVERNANCE BANKING UNION ECONOMIC GOVERNANCE BANKING UNION ECO NRAs SRM MIP MTO NRP CRD SSM SGP EIP MTO SCP ESAs EFSM EDP AMR CSRs AGS DGS EFSF ESM ESBR EBA EWG NCAs NRAs SRM MIP MTO NRP CRD SSM SGP E NG UNION ECONOMIC GOVERNANCE BANKING UNION ECONOMIC GOVERNANCE BANKING UNION ECONOMIC GOVERNANCE BANKING UNION ECONOMIC GO GS EFSF ESM ESBR EBA EWG NCAs NRAs SRM MIP MTO NRP CRD SSM SGP EIP MTO SCP ESAs EFSM EDP AMR CSRs AGS DGS EFSF ESM ESBR EBA EWG NCAs NRA CONOMIC GOVERNANCE BANKING UNION ECONOMIC GOVERNANCE BANKING UNION ECONOMIC GOVERNANCE BANKING UNION ECONOMIC GOVERNANCE P ESAs EFSM EDP AMR CSRs AGS DGS EFSF ESM ESBR EBA EWG NCAs NRAs SRM MIP MTO NRP CRD SSM SGP EIP MTO SCP ESAs EFSM EDP AMR CSRs AGS DGS E GOVERNANCE BANKING UNION ECONOMIC GOVERNANCE BANKING UNION ECONOMIC GOVERNANCE BANKING UNION ECONOMIC GOVERNANCE BANKING MTO NRP CRD SSM SGP EIP MTO SCP ESAs EFSM EDP AMR CSRs AGS DGS EFSF ESM ESBR EBA EWG NCAs NRAs SRM MIP MTO NRP CRD SSM SGP EIP MTO SCP ES NCE BANKING UNION ECONOMIC GOVERNANCE BANKING UNION ECONOMIC GOVERNANCE BANKING UNION ECONOMIC GOVERNANCE BANKING UNION ECO SBR EBA EWG NCAs NRAs SRM MIP MTO NRP CRD SSM SGP EIP MTO SCP ESAs EFSM EDP AMR CSRs AGS DGS EFSF ESM ESBR EBA EWG NCAs NRAs SRM MIP MT NG UNION ECONOMIC GOVERNANCE BANKING UNION ECONOMIC GOVERNANCE BANKING UNION ECONOMIC GOVERNANCE BANKING UNION ECONOMIC GO EDP AMR CSRs AGS DGS EFSF ESM ESBR EBA EWG NCAs NRAs SRM MIP MTO NRP CRD SSM SGP EIP MTO SCP ESAs EFSM EDP AMR CSRs AGS DGS EFSF ESM ESBR CONOMIC GOVERNANCE BANKING UNION ECONOMIC GOVERNANCE BANKING UNION ECONOMIC GOVERNANCE BANKING UNION ECONOMIC GOVERNANCE SSM SGP EIP MTO SCP ESAs EFSM EDP AMR CSRs AGS DGS EFSF ESM ESBR EBA EWG NCAs NRAs SRM MIP MTO NRP CRD SSM SGP EIP MTO SCP ESAs EFSM EDP A GOVERNANCE BANKING UNION ECONOMIC GOVERNANCE BANKING UNION ECONOMIC GOVERNANCE BANKING UNION ECONOMIC GOVERNANCE BANKING NCAs NRAs SRM MIP MTO NRP CRD SSM SGP EIP MTO SCP ESAs EFSM EDP AMR CSRs AGS DGS EFSF ESM ESBR EBA EWG NCAs NRAs SRM MIP MTO NRP CRD SSM NCE BANKING UNION ECONOMIC GOVERNANCE BANKING UNION ECONOMIC GOVERNANCE BANKING UNION ECONOMIC GOVERNANCE BANKING UNION ECO AGS DGS EFSF ESM ESBR EBA EWG NCAs NRAs SRM MIP MTO NRP CRD SSM SGP EIP MTO SCP ESAs EFSM EDP AMR CSRs AGS DGS EFSF ESM ESBR EBA EWG NC NG UNION ECONOMIC GOVERNANCE BANKING UNION ECONOMIC GOVERNANCE BANKING UNION ECONOMIC GOVERNANCE BANKING UNION ECONOMIC GO MTO SCP ESAs EFSM EDP AMR CSRs AGS DGS EFSF ESM ESBR EBA EWG NCAs NRAs SRM MIP MTO NRP CRD SSM SGP EIP MTO SCP ESAs EFSM EDP AMR CSRs AG CONOMIC GOVERNANCE BANKING UNION ECONOMIC GOVERNANCE BANKING UNION ECONOMIC GOVERNANCE BANKING UNION ECONOMIC GOVERNANCE RM MIP MTO NRP CRD SSM SGP EIP MTO SCP ESAs EFSM EDP AMR CSRs AGS DGS EFSF ESM ESBR EBA EWG NCAs NRAs SRM MIP MTO NRP CRD SSM SGP EIP MTO GOVERNANCE BANKING UNION ECONOMIC GOVERNANCE BANKING UNION ECONOMIC GOVERNANCE BANKING UNION ECONOMIC GOVERNANCE BANKING ESM ESBR EBA EWG NCAs NRAs SRM MIP MTO NRP CRD SSM SGP EIP MTO SCP ESAs EFSM EDP AMR CSRs AGS DGS EFSF ESM ESBR EBA EWG NCAs NRAs SRM M NCE BANKING UNION ECONOMIC GOVERNANCE BANKING UNION ECONOMIC GOVERNANCE BANKING UNION ECONOMIC GOVERNANCE BANKING UNION ECO GS EFSF ESM ESBR EBA EWG NCAs NRAs SRM MIP MTO NRP CRD SSM SGP EIP MTO SCP ESAs EFSM EDP AMR CSRs AGS DGS EFSF ESM ESBR EBA EWG NCAs NRA NG UNION ECONOMIC GOVERNANCE BANKING UNION ECONOMIC GOVERNANCE BANKING UNION ECONOMIC GOVERNANCE BANKING UNION ECONOMIC GO CP ESAs EFSM EDP AMR CSRs AGS DGS EFSF ESM ESBR EBA EWG NCAs NRAs SRM MIP MTO NRP CRD SSM SGP EIP MTO SCP ESAs EFSM EDP AMR CSRs AGS DGS E CONOMIC GOVERNANCE BANKING UNION ECONOMIC GOVERNANCE BANKING UNION ECONOMIC GOVERNANCE BANKING UNION ECONOMIC GOVERNANCE P MTO NRP CRD SSM SGP EIP MTO SCP ESAs EFSM EDP AMR CSRs AGS DGS EFSF ESM ESBR EBA EWG NCAs NRAs SRM MIP MTO NRP CRD SSM SGP EIP MTO SCP E GOVERNANCE BANKING UNION ECONOMIC GOVERNANCE BANKING UNION ECONOMIC GOVERNANCE BANKING UNION ECONOMIC GOVERNANCE BANKING SBR EBA EWG NCAs NRAs SRM MIP MTO NRP CRD SSM SGP EIP MTO SCP ESAs EFSM EDP AMR CSRs AGS DGS EFSF ESM ESBR EBA EWG NCAs NRAs SRM MIP MT NCE BANKING UNION ECONOMIC GOVERNANCE BANKING UNION ECONOMIC GOVERNANCE BANKING UNION ECONOMIC GOVERNANCE BANKING UNION ECO EDP AMR CSRs AGS DGS EFSF ESM ESBR EBA EWG NCAs NRAs SRM MIP MTO NRP CRD SSM SGP EIP MTO SCP ESAs EFSM EDP AMR CSRs AGS DGS EFSF ESM ESBR NG UNION ECONOMIC GOVERNANCE BANKING UNION ECONOMIC GOVERNANCE BANKING UNION ECONOMIC GOVERNANCE BANKING UNION ECONOMIC GO SSM SGP EIP MTO SCP ESAs EFSM EDP AMR CSRs AGS DGS EFSF ESM ESBR EBA EWG NCAs NRAs SRM MIP MTO NRP CRD SSM SGP EIP MTO SCP ESAs EFSM EDP A CONOMIC GOVERNANCE BANKING UNION ECONOMIC GOVERNANCE BANKING UNION ECONOMIC GOVERNANCE BANKING UNION ECONOMIC GOVERNANCE NCAs NRAs SRM MIP MTO NRP CRD SSM SGP EIP MTO SCP ESAs EFSM EDP AMR CSRs AGS DGS EFSF ESM ESBR EBA EWG NCAs NRAs SRM MIP MTO NRP CRD SS GOVERNANCE BANKING UNION ECONOMIC GOVERNANCE BANKING UNION ECONOMIC GOVERNANCE BANKING UNION ECONOMIC GOVERNANCE BANKING CSRs AGS DGS EFSF ESM ESBR EBA EWG NCAs NRAs SRM MIP MTO NRP CRD SSM SGP EIP MTO SCP ESAs EFSM EDP AMR CSRs AGS DGS EFSF ESM ESBR EBA EWG NCE BANKING UNION ECONOMIC GOVERNANCE BANKING UNION ECONOMIC GOVERNANCE BANKING UNION ECONOMIC GOVERNANCE BANKING UNION ECO EIP MTO SCP ESAs EFSM EDP AMR CSRs AGS DGS EFSF ESM ESBR EBA EWG NCAs NRAs SRM MIP MTO NRP CRD SSM SGP EIP MTO SCP ESAs EFSM EDP AMR CSRs NG UNION ECONOMIC GOVERNANCE BANKING UNION ECONOMIC GOVERNANCE BANKING UNION ECONOMIC GOVERNANCE BANKING UNION ECONOMIC GO s SRM MIP MTO NRP CRD SSM SGP EIP MTO SCP ESAs EFSM EDP AMR CSRs AGS DGS EFSF ESM ESBR EBA EWG NCAs NRAs SRM MIP MTO NRP CRD SSM SGP EIP M CONOMIC GOVERNANCE BANKING UNION ECONOMIC GOVERNANCE BANKING UNION ECONOMIC GOVERNANCE BANKING UNION ECONOMIC GOVERNANCE EFSF ESM ESBR EBA EWG NCAs NRAs SRM MIP MTO NRP CRD SSM SGP EIP MTO SCP ESAs EFSM EDP AMR CSRs AGS DGS EFSF ESM ESBR EBA EWG NCAs NRAs S GOVERNANCE BANKING UNION ECONOMIC GOVERNANCE BANKING UNION ECONOMIC GOVERNANCE BANKING UNION ECONOMIC GOVERNANCE BANKING ESAs EFSM EDP AMR CSRs AGS DGS EFSF ESM ESBR EBA EWG NCAs NRAs SRM MIP MTO NRP CRD SSM SGP EIP MTO SCP ESAs EFSM EDP AMR CSRs AGS DGS EFS NCE BANKING UNION ECONOMIC GOVERNANCE BANKING UNION ECONOMIC GOVERNANCE BANKING UNION ECONOMIC GOVERNANCE BANKING UNION ECO TO NRP CRD SSM SGP EIP MTO SCP ESAs EFSM EDP AMR CSRs AGS DGS EFSF ESM ESBR EBA EWG NCAs NRAs SRM MIP MTO NRP CRD SSM SGP EIP MTO SCP ESAs NG UNION ECONOMIC GOVERNANCE BANKING UNION ECONOMIC GOVERNANCE BANKING UNION ECONOMIC GOVERNANCE BANKING UNION ECONOMIC GO R EBA EWG NCAs NRAs SRM MIP MTO NRP CRD SSM SGP EIP MTO SCP ESAs EFSM EDP AMR CSRs AGS DGS EFSF ESM ESBR EBA EWG NCAs NRAs SRM MIP MTO N CONOMIC GOVERNANCE BANKING UNION ECONOMIC GOVERNANCE BANKING UNION ECONOMIC GOVERNANCE BANKING UNION ECONOMIC GOVERNANCE AMR CSRs AGS DGS EFSF ESM ESBR EBA EWG NCAs NRAs SRM MIP MTO NRP CRD SSM SGP EIP MTO SCP ESAs EFSM EDP AMR CSRs AGS DGS EFSF ESM ESBR EB GOVERNANCE BANKING UNION ECONOMIC GOVERNANCE BANKING UNION ECONOMIC GOVERNANCE BANKING UNION ECONOMIC GOVERNANCE BANKING SM SGP EIP MTO SCP ESAs EFSM EDP AMR CSRs AGS DGS EFSF ESM ESBR EBA EWG NCAs NRAs SRM MIP MTO NRP CRD SSM SGP EIP MTO SCP ESAs EFSM EDP AM NCE BANKING UNION ECONOMIC GOVERNANCE BANKING UNION ECONOMIC GOVERNANCE BANKING UNION ECONOMIC GOVERNANCE BANKING UNION ECO CAs NRAs SRM MIP MTO NRP CRD SSM SGP EIP MTO SCP ESAs EFSM EDP AMR CSRs AGS DGS EFSF ESM ESBR EBA EWG NCAs NRAs SRM MIP MTO NRP CRD SSM S NG UNION ECONOMIC GOVERNANCE BANKING UNION ECONOMIC GOVERNANCE BANKING UNION ECONOMIC GOVERNANCE BANKING UNION ECONOMIC GO AGS DGS EFSF ESM ESBR EBA EWG NCAs NRAs SRM MIP MTO NRP CRD SSM SGP EIP MTO SCP ESAs EFSM EDP AMR CSRs AGS DGS EFSF ESM ESBR EBA EWG NC CONOMIC GOVERNANCE BANKING UNION ECONOMIC GOVERNANCE BANKING UNION ECONOMIC GOVERNANCE BANKING UNION ECONOMIC GOVERNANCE MTO SCP ESAs EFSM EDP AMR CSRs AGS DGS EFSF ESM ESBR EBA EWG NCAs NRAs SRM MIP MTO NRP CRD SSM SGP EIP MTO SCP ESAs EFSM EDP AMR CSRs AG GOVERNANCE BANKING UNION ECONOMIC GOVERNANCE BANKING UNION ECONOMIC GOVERNANCE BANKING UNION ECONOMIC GOVERNANCE BANKING RM MIP MTO NRP CRD SSM SGP EIP MTO SCP ESAs EFSM EDP AMR CSRs AGS DGS EFSF ESM ESBR EBA EWG NCAs NRAs SRM MIP MTO NRP CRD SSM SGP EIP MTO NCE BANKING UNION ECONOMIC GOVERNANCE BANKING UNION ECONOMIC GOVERNANCE BANKING UNION ECONOMIC GOVERNANCE BANKING UNION ECO ESM ESBR EBA EWG NCAs NRAs SRM MIP MTO NRP CRD SSM SGP EIP MTO SCP ESAs EFSM EDP AMR CSRs AGS DGS EFSF ESM ESBR EBA EWG NCAs NRAs SRM M NG UNION ECONOMIC GOVERNANCE BANKING UNION ECONOMIC GOVERNANCE BANKING UNION ECONOMIC GOVERNANCE BANKING UNION ECONOMIC GO GS EFSF ESM ESBR EBA EWG NCAs NRAs SRM MIP MTO NRP CRD SSM SGP EIP MTO SCP ESAs EFSM EDP AMR CSRs AGS DGS EFSF ESM ESBR EBA EWG NCAs NRA CONOMIC GOVERNANCE BANKING UNION ECONOMIC GOVERNANCE BANKING UNION ECONOMIC GOVERNANCE BANKING UNION ECONOMIC GOVERNANCE DIRECTORATE GENERAL FOR INTERNAL POLICIES ECONOMIC GOVERNANCE SUPPORT UNIT S TUDY Provided at the request of the Economic and Monetary Affairs Committee EN ECON IPOL EGOV Robustness, Validity and Significance of the ECB’s Asset Quality Review and Stress Test Exercise Author: Sascha Steffen European School of Management and Technology (ESMT) October 2014
-
Upload
truongcong -
Category
Documents
-
view
218 -
download
0
Transcript of Robustness, Validity and Significance of the ECB's AQR … · economic governance banking union...
ECONOMIC GOVERNANCE BANKING UNION ECONOMIC GOVERNANCE BANKING UNION ECONOMIC GOVERNANCE BANKING UNION ECONOMIC GOVERNANCE BANKING UNION ECONOMIC GOVERNANCE BANKING UNION ECONOMIC GOVERNANCE BANKING UNION ECONOMIC GOVERNANCE BANKING UNION ECONOMICAGS DGS EFSF ESM ESBR EBA EWG NCAs NRAs SRM MIP MTO NRP CRD SSM SGP EIP MTO SCP ESAs EFSM EDP AMR CSRs AGS DGS EFSF ESM ESBR EBA EWG NCAs NRAs SRM MIP MTO NRP CRD SSM SGP EIP MTO SCP ESAs EFSM EDP AMR CSRs AGS DGS EFSF ESM ESBR EBA EWG NCAs NRAs SRM MIP MTO NRP CRD SSM SGP EIP GOVERNANCE BANKING UNION ECONOMIC GOVERNANCE BANKING UNION ECONOMIC GOVERNANCE BANKING UNION ECONOMIC GOVERNANCE BANKING UNION ECONOMIC GOVERNANCE BANKING UNION ECONOMIC GOVERNANCE BANKING UNION ECONOMIC GOVERNANCE BANKING UNION ECONOMIC GOVERNANMTO SCP ESAs EFSM EDP AMR CSRs AGS DGS EFSF ESM ESBR EBA EWG NCAs NRAs SRM MIP MTO NRP CRD SSM SGP EIP MTO SCP ESAs EFSM EDP AMR CSRs AGS DGS EFSF ESM ESBR EBA EWG NCAs NRAs SRM MIP MTO NRP CRD SSM SGP EIP MTO SCP ESAs EFSM EDP AMR CSRs AGS DGS EFSF ESM ESBR EBA EWG NCAs NRAs SCE BANKING UNION ECONOMIC GOVERNANCE BANKING UNION ECONOMIC GOVERNANCE BANKING UNION ECONOMIC GOVERNANCE BANKING UNION ECONOMIC GOVERNANCE BANKING UNION ECONOMIC GOVERNANCE BANKING UNION ECONOMIC GOVERNANCE BANKING UNION ECONOMIC GOVERNANCE BANKINRM MIP MTO NRP CRD SSM SGP EIP MTO SCP ESAs EFSM EDP AMR CSRs AGS DGS EFSF ESM ESBR EBA EWG NCAs NRAs SRM MIP MTO NRP CRD SSM SGP EIP MTO SCP ESAs EFSM EDP AMR CSRs AGS DGS EFSF ESM ESBR EBA EWG NCAs NRAs SRM MIP MTO NRP CRD SSM SGP EIP MTO SCP ESAs EFSM EDP AMR CSRs AGS DGS EFSG UNION ECONOMIC GOVERNANCE BANKING UNION ECONOMIC GOVERNANCE BANKING UNION ECONOMIC GOVERNANCE BANKING UNION ECONOMIC GOVERNANCE BANKING UNION ECONOMIC GOVERNANCE BANKING UNION ECONOMIC GOVERNANCE BANKING UNION ECONOMIC GOVERNANCE BANKING UNION EF ESM ESBR EBA EWG NCAs NRAs SRM MIP MTO NRP CRD SSM SGP EIP MTO SCP ESAs EFSM EDP AMR CSRs AGS DGS EFSF ESM ESBR EBA EWG NCAs NRAs SRM MIP MTO NRP CRD SSM SGP EIP MTO SCP ESAs EFSM EDP AMR CSRs AGS DGS EFSF ESM ESBR EBA EWG NCAs NRAs SRM MIP MTO NRP CRD SSM SGP EIP MTO SCP ESAs CONOMIC GOVERNANCE BANKING UNION ECONOMIC GOVERNANCE BANKING UNION ECONOMIC GOVERNANCE BANKING UNION ECONOMIC GOVERNANCE BANKING UNION ECONOMIC GOVERNANCE BANKING UNION ECONOMIC GOVERNANCE BANKING UNION ECONOMIC GOVERNANCE BANKING UNION ECONOMIC GESAs EFSM EDP AMR CSRs AGS DGS EFSF ESM ESBR EBA EWG NCAs NRAs SRM MIP MTO NRP CRD SSM SGP EIP MTO SCP ESAs EFSM EDP AMR CSRs AGS DGS EFSF ESM ESBR EBA EWG NCAs NRAs SRM MIP MTO NRP CRD SSM SGP EIP MTO SCP ESAs EFSM EDP AMR CSRs AGS DGS EFSF ESM ESBR EBA EWG NCAs NRAs SRM MIP MOVERNANCE BANKING UNION ECONOMIC GOVERNANCE BANKING UNION ECONOMIC GOVERNANCE BANKING UNION ECONOMIC GOVERNANCE BANKING UNION ECONOMIC GOVERNANCE BANKING UNION ECONOMIC GOVERNANCE BANKING UNION ECONOMIC GOVERNANCE BANKING UNION ECONOMIC GOVERNANCTO NRP CRD SSM SGP EIP MTO SCP ESAs EFSM EDP AMR CSRs AGS DGS EFSF ESM ESBR EBA EWG NCAs NRAs SRM MIP MTO NRP CRD SSM SGP EIP MTO SCP ESAs EFSM EDP AMR CSRs AGS DGS EFSF ESM ESBR EBA EWG NCAs NRAs SRM MIP MTO NRP CRD SSM SGP EIP MTO SCP ESAs EFSM EDP AMR CSRs AGS DGS EFSF ESM ESBE ECONOMIC GOVERNANCE BANKING UNION ECONOMIC GOVERNANCE BANKING UNION ECONOMIC GOVERNANCE BANKING UNION ECONOMIC GOVERNANCE BANKING UNION ECONOMIC GOVERNANCE BANKING UNION ECONOMIC GOVERNANCE BANKING UNION ECONOMIC GOVERNANCE BANKING UNION ECONOMIR EBA EWG NCAs NRAs SRM MIP MTO NRP CRD SSM SGP EIP MTO SCP ESAs EFSM EDP AMR CSRs AGS DGS EFSF ESM ESBR EBA EWG NCAs NRAs SRM MIP MTO NRP CRD SSM SGP EIP MTO SCP ESAs EFSM EDP AMR CSRs AGS DGS EFSF ESM ESBR EBA EWG NCAs NRAs SRM MIP MTO NRP CRD SSM SGP EIP MTO SCP ESAs EFSM EDP IC GOVERNANCE BANKING UNION ECONOMIC GOVERNANCE BANKING UNION ECONOMIC GOVERNANCE BANKING UNION ECONOMIC GOVERNANCE BANKING UNION ECONOMIC GOVERNANCE BANKING UNION ECONOMIC GOVERNANCE BANKING UNION ECONOMIC GOVERNANCE BANKING UNION ECONOMIC GOVERNAMR CSRs AGS DGS EFSF ESM ESBR EBA EWG NCAs NRAs SRM MIP MTO NRP CRD SSM SGP EIP MTO SCP ESAs EFSM EDP AMR CSRs AGS DGS EFSF ESM ESBR EBA EWG NCAs NRAs SRM MIP MTO NRP CRD SSM SGP EIP MTO SCP ESAs EFSM EDP AMR CSRs AGS DGS EFSF ESM ESBR EBA EWG NCAs NRAs SRM MIP MTO NRP CRD SSANCE BANKING UNION ECONOMIC GOVERNANCE BANKING UNION ECONOMIC GOVERNANCE BANKING UNION ECONOMIC GOVERNANCE BANKING UNION ECONOMIC GOVERNANCE BANKING UNION ECONOMIC GOVERNANCE BANKING UNION ECONOMIC GOVERNANCE BANKING UNION ECONOMIC GOVERNANCE BANM SGP EIP MTO SCP ESAs EFSM EDP AMR CSRs AGS DGS EFSF ESM ESBR EBA EWG NCAs NRAs SRM MIP MTO NRP CRD SSM SGP EIP MTO SCP ESAs EFSM EDP AMR CSRs AGS DGS EFSF ESM ESBR EBA EWG NCAs NRAs SRM MIP MTO NRP CRD SSM SGP EIP MTO SCP ESAs EFSM EDP AMR CSRs AGS DGS EFSF ESM ESBR EBA EWG NCKING UNION ECONOMIC GOVERNANCE BANKING UNION ECONOMIC GOVERNANCE BANKING UNION ECONOMIC GOVERNANCE BANKING UNION ECONOMIC GOVERNANCE BANKING UNION ECONOMIC GOVERNANCE BANKING UNION ECONOMIC GOVERNANCE BANKING UNION ECONOMIC GOVERNANCE BANKING UNIOAs NRAs SRM MIP MTO NRP CRD SSM SGP EIP MTO SCP ESAs EFSM EDP AMR CSRs AGS DGS EFSF ESM ESBR EBA EWG NCAs NRAs SRM MIP MTO NRP CRD SSM SGP EIP MTO SCP ESAs EFSM EDP AMR CSRs AGS DGS EFSF ESM ESBR EBA EWG NCAs NRAs SRM MIP MTO NRP CRD SSM SGP EIP MTO SCP ESAs EFSM EDP AMR CSRs AGN ECONOMIC GOVERNANCE BANKING UNION ECONOMIC GOVERNANCE BANKING UNION ECONOMIC GOVERNANCE BANKING UNION ECONOMIC GOVERNANCE BANKING UNION ECONOMIC GOVERNANCE BANKING UNION ECONOMIC GOVERNANCE BANKING UNION ECONOMIC GOVERNANCE BANKING UNION ECONOMS DGS EFSF ESM ESBR EBA EWG NCAs NRAs SRM MIP MTO NRP CRD SSM SGP EIP MTO SCP ESAs EFSM EDP AMR CSRs AGS DGS EFSF ESM ESBR EBA EWG NCAs NRAs SRM MIP MTO NRP CRD SSM SGP EIP MTO SCP ESAs EFSM EDP AMR CSRs AGS DGS EFSF ESM ESBR EBA EWG NCAs NRAs SRM MIP MTO NRP CRD SSM SGP EIP MTIC GOVERNANCE BANKING UNION ECONOMIC GOVERNANCE BANKING UNION ECONOMIC GOVERNANCE BANKING UNION ECONOMIC GOVERNANCE BANKING UNION ECONOMIC GOVERNANCE BANKING UNION ECONOMIC GOVERNANCE BANKING UNION ECONOMIC GOVERNANCE BANKING UNION ECONOMIC GOVERNO SCP ESAs EFSM EDP AMR CSRs AGS DGS EFSF ESM ESBR EBA EWG NCAs NRAs SRM MIP MTO NRP CRD SSM SGP EIP MTO SCP ESAs EFSM EDP AMR CSRs AGS DGS EFSF ESM ESBR EBA EWG NCAs NRAs SRM MIP MTO NRP CRD SSM SGP EIP MTO SCP ESAs EFSM EDP AMR CSRs AGS DGS EFSF ESM ESBR EBA EWG NCAs NRAs SRM ANCE BANKING UNION ECONOMIC GOVERNANCE BANKING UNION ECONOMIC GOVERNANCE BANKING UNION ECONOMIC GOVERNANCE BANKING UNION ECONOMIC GOVERNANCE BANKING UNION ECONOMIC GOVERNANCE BANKING UNION ECONOMIC GOVERNANCE BANKING UNION ECONOMIC GOVERNANCE BANMIP MTO NRP CRD SSM SGP EIP MTO SCP ESAs EFSM EDP AMR CSRs AGS DGS EFSF ESM ESBR EBA EWG NCAs NRAs SRM MIP MTO NRP CRD SSM SGP EIP MTO SCP ESAs EFSM EDP AMR CSRs AGS DGS EFSF ESM ESBR EBA EWG NCAs NRAs SRM MIP MTO NRP CRD SSM SGP EIP MTO SCP ESAs EFSM EDP AMR CSRs AGS DGS EFSF ESKING UNION ECONOMIC GOVERNANCE BANKING UNION ECONOMIC GOVERNANCE BANKING UNION ECONOMIC GOVERNANCE BANKING UNION ECONOMIC GOVERNANCE BANKING UNION ECONOMIC GOVERNANCE BANKING UNION ECONOMIC GOVERNANCE BANKING UNION ECONOMIC GOVERNANCE BANKING UNIOM ESBR EBA EWG NCAs NRAs SRM MIP MTO NRP CRD SSM SGP EIP MTO SCP ESAs EFSM EDP AMR CSRs AGS DGS EFSF ESM ESBR EBA EWG NCAs NRAs SRM MIP MTO NRP CRD SSM SGP EIP MTO SCP ESAs EFSM EDP AMR CSRs AGS DGS EFSF ESM ESBR EBA EWG NCAs NRAs SRM MIP MTO NRP CRD SSM SGP EIP MTO SCP ESAs EFN ECONOMIC GOVERNANCE BANKING UNION ECONOMIC GOVERNANCE BANKING UNION ECONOMIC GOVERNANCE BANKING UNION ECONOMIC GOVERNANCE BANKING UNION ECONOMIC GOVERNANCE BANKING UNION ECONOMIC GOVERNANCE BANKING UNION ECONOMIC GOVERNANCE BANKING UNION ECONOMISM EDP AMR CSRs AGS DGS EFSF ESM ESBR EBA EWG NCAs NRAs SRM MIP MTO NRP CRD SSM SGP EIP MTO SCP ESAs EFSM EDP AMR CSRs AGS DGS EFSF ESM ESBR EBA EWG NCAs NRAs SRM MIP MTO NRP CRD SSM SGP EIP MTO SCP ESAs EFSM EDP AMR CSRs AGS DGS EFSF ESM ESBR EBA EWG NCAs NRAs SRM MIP MTO NRP IC GOVERNANCE BANKING UNION ECONOMIC GOVERNANCE BANKING UNION ECONOMIC GOVERNANCE BANKING UNION ECONOMIC GOVERNANCE BANKING UNION ECONOMIC GOVERNANCE BANKING UNION ECONOMIC GOVERNANCE BANKING UNION ECONOMIC GOVERNANCE BANKING UNION ECONOMIC GOVERNCRD SSM SGP EIP MTO SCP ESAs EFSM EDP AMR CSRs AGS DGS EFSF ESM ESBR EBA EWG NCAs NRAs SRM MIP MTO NRP CRD SSM SGP EIP MTO SCP ESAs EFSM EDP AMR CSRs AGS DGS EFSF ESM ESBR EBA EWG NCAs NRAs SRM MIP MTO NRP CRD SSM SGP EIP MTO SCP ESAs EFSM EDP AMR CSRs AGS DGS EFSF ESM ESBR EBA EANCE BANKING UNION ECONOMIC GOVERNANCE BANKING UNION ECONOMIC GOVERNANCE BANKING UNION ECONOMIC GOVERNANCE BANKING UNION ECONOMIC GOVERNANCE BANKING UNION ECONOMIC GOVERNANCE BANKING UNION ECONOMIC GOVERNANCE BANKING UNION ECONOMIC GOVERNANCE BANWG NCAs NRAs SRM MIP MTO NRP CRD SSM SGP EIP MTO SCP ESAs EFSM EDP AMR CSRs AGS DGS EFSF ESM ESBR EBA EWG NCAs NRAs SRM MIP MTO NRP CRD SSM SGP EIP MTO SCP ESAs EFSM EDP AMR CSRs AGS DGS EFSF ESM ESBR EBA EWG NCAs NRAs SRM MIP MTO NRP CRD SSM SGP EIP MTO SCP ESAs EFSM EDP AMR CKING UNION ECONOMIC GOVERNANCE BANKING UNION ECONOMIC GOVERNANCE BANKING UNION ECONOMIC GOVERNANCE BANKING UNION ECONOMIC GOVERNANCE BANKING UNION ECONOMIC GOVERNANCE BANKING UNION ECONOMIC GOVERNANCE BANKING UNION ECONOMIC GOVERNANCE BANKING UNIOSRs AGS DGS EFSF ESM ESBR EBA EWG NCAs NRAs SRM MIP MTO NRP CRD SSM SGP EIP MTO SCP ESAs EFSM EDP AMR CSRs AGS DGS EFSF ESM ESBR EBA EWG NCAs NRAs SRM MIP MTO NRP CRD SSM SGP EIP MTO SCP ESAs EFSM EDP AMR CSRs AGS DGS EFSF ESM ESBR EBA EWG NCAs NRAs SRM MIP MTO NRP CRD SSM SGP N ECONOMIC GOVERNANCE BANKING UNION ECONOMIC GOVERNANCE BANKING UNION ECONOMIC GOVERNANCE BANKING UNION ECONOMIC GOVERNANCE BANKING UNION ECONOMIC GOVERNANCE BANKING UNION ECONOMIC GOVERNANCE BANKING UNION ECONOMIC GOVERNANCE BANKING UNION ECONOMEIP MTO SCP ESAs EFSM EDP AMR CSRs AGS DGS EFSF ESM ESBR EBA EWG NCAs NRAs SRM MIP MTO NRP CRD SSM SGP EIP MTO SCP ESAs EFSM EDP AMR CSRs AGS DGS EFSF ESM ESBR EBA EWG NCAs NRAs SRM MIP MTO NRP CRD SSM SGP EIP MTO SCP ESAs EFSM EDP AMR CSRs AGS DGS EFSF ESM ESBR EBA EWG NCAs NRIC GOVERNANCE BANKING UNION ECONOMIC GOVERNANCE BANKING UNION ECONOMIC GOVERNANCE BANKING UNION ECONOMIC GOVERNANCE BANKING UNION ECONOMIC GOVERNANCE BANKING UNION ECONOMIC GOVERNANCE BANKING UNION ECONOMIC GOVERNANCE BANKING UNION ECONOMIC GOVERNAs SRM MIP MTO NRP CRD SSM SGP EIP MTO SCP ESAs EFSM EDP AMR CSRs AGS DGS EFSF ESM ESBR EBA EWG NCAs NRAs SRM MIP MTO NRP CRD SSM SGP EIP MTO SCP ESAs EFSM EDP AMR CSRs AGS DGS EFSF ESM ESBR EBA EWG NCAs NRAs SRM MIP MTO NRP CRD SSM SGP EIP MTO SCP ESAs EFSM EDP AMR CSRs AGS DGS ANCE BANKING UNION ECONOMIC GOVERNANCE BANKING UNION ECONOMIC GOVERNANCE BANKING UNION ECONOMIC GOVERNANCE BANKING UNION ECONOMIC GOVERNANCE BANKING UNION ECONOMIC GOVERNANCE BANKING UNION ECONOMIC GOVERNANCE BANKING UNION ECONOMIC GOVERNANCE BANEFSF ESM ESBR EBA EWG NCAs NRAs SRM MIP MTO NRP CRD SSM SGP EIP MTO SCP ESAs EFSM EDP AMR CSRs AGS DGS EFSF ESM ESBR EBA EWG NCAs NRAs SRM MIP MTO NRP CRD SSM SGP EIP MTO SCP ESAs EFSM EDP AMR CSRs AGS DGS EFSF ESM ESBR EBA EWG NCAs NRAs SRM MIP MTO NRP CRD SSM SGP EIP MTO SCP EKING UNION ECONOMIC GOVERNANCE BANKING UNION ECONOMIC GOVERNANCE BANKING UNION ECONOMIC GOVERNANCE BANKING UNION ECONOMIC GOVERNANCE BANKING UNION ECONOMIC GOVERNANCE BANKING UNION ECONOMIC GOVERNANCE BANKING UNION ECONOMIC GOVERNANCE BANKING UNIOSAs EFSM EDP AMR CSRs AGS DGS EFSF ESM ESBR EBA EWG NCAs NRAs SRM MIP MTO NRP CRD SSM SGP EIP MTO SCP ESAs EFSM EDP AMR CSRs AGS DGS EFSF ESM ESBR EBA EWG NCAs NRAs SRM MIP MTO NRP CRD SSM SGP EIP MTO SCP ESAs EFSM EDP AMR CSRs AGS DGS EFSF ESM ESBR EBA EWG NCAs NRAs SRM MIP MTN ECONOMIC GOVERNANCE BANKING UNION ECONOMIC GOVERNANCE BANKING UNION ECONOMIC GOVERNANCE BANKING UNION ECONOMIC GOVERNANCE BANKING UNION ECONOMIC GOVERNANCE BANKING UNION ECONOMIC GOVERNANCE BANKING UNION ECONOMIC GOVERNANCE BANKING UNION ECONOMO SCP ESAs EFSM EDP AMR CSRs AGS DGS EFSF ESM ESBR EBA EWG NCAs NRAs SRM MIP MTO NRP CRD SSM SGP EIP MTO SCP ESAs EFSM EDP AMR CSRs AGS DGS EFSF ESM ESBR EBA EWG NCAs NRAs SRM MIP MTO NRP CRD SSM SGP EIP MTO SCP ESAs EFSM EDP AMR CSRs AGS DGS EFSF ESM ESBR EBA EWG NCAs NRAs SRM IC GOVERNANCE BANKING UNION ECONOMIC GOVERNANCE BANKING UNION ECONOMIC GOVERNANCE BANKING UNION ECONOMIC GOVERNANCE BANKING UNION ECONOMIC GOVERNANCE BANKING UNION ECONOMIC GOVERNANCE BANKING UNION ECONOMIC GOVERNANCE BANKING UNION ECONOMIC GOVERNMIP MTO NRP CRD SSM SGP EIP MTO SCP ESAs EFSM EDP AMR CSRs AGS DGS EFSF ESM ESBR EBA EWG NCAs NRAs SRM MIP MTO NRP CRD SSM SGP EIP MTO SCP ESAs EFSM EDP AMR CSRs AGS DGS EFSF ESM ESBR EBA EWG NCAs NRAs SRM MIP MTO NRP CRD SSM SGP EIP MTO SCP ESAs EFSM EDP AMR CSRs AGS DGS EFSF EANCE BANKING UNION ECONOMIC GOVERNANCE BANKING UNION ECONOMIC GOVERNANCE BANKING UNION ECONOMIC GOVERNANCE BANKING UNION ECONOMIC GOVERNANCE BANKING UNION ECONOMIC GOVERNANCE BANKING UNION ECONOMIC GOVERNANCE BANKING UNION ECONOMIC GOVERNANCE BANSM ESBR EBA EWG NCAs NRAs SRM MIP MTO NRP CRD SSM SGP EIP MTO SCP ESAs EFSM EDP AMR CSRs AGS DGS EFSF ESM ESBR EBA EWG NCAs NRAs SRM MIP MTO NRP CRD SSM SGP EIP MTO SCP ESAs EFSM EDP AMR CSRs AGS DGS EFSF ESM ESBR EBA EWG NCAs NRAs SRM MIP MTO NRP CRD SSM SGP EIP MTO SCP ESAs EFKING UNION ECONOMIC GOVERNANCE BANKING UNION ECONOMIC GOVERNANCE BANKING UNION ECONOMIC GOVERNANCE BANKING UNION ECONOMIC GOVERNANCE BANKING UNION ECONOMIC GOVERNANCE BANKING UNION ECONOMIC GOVERNANCE BANKING UNION ECONOMIC GOVERNANCE BANKING UNIOSM EDP AMR CSRs AGS DGS EFSF ESM ESBR EBA EWG NCAs NRAs SRM MIP MTO NRP CRD SSM SGP EIP MTO SCP ESAs EFSM EDP AMR CSRs AGS DGS EFSF ESM ESBR EBA EWG NCAs NRAs SRM MIP MTO NRP CRD SSM SGP EIP MTO SCP ESAs EFSM EDP AMR CSRs AGS DGS EFSF ESM ESBR EBA EWG NCAs NRAs SRM MIP MTO NRP N ECONOMIC GOVERNANCE BANKING UNION ECONOMIC GOVERNANCE BANKING UNION ECONOMIC GOVERNANCE BANKING UNION ECONOMIC GOVERNANCE BANKING UNION ECONOMIC GOVERNANCE BANKING UNION ECONOMIC GOVERNANCE BANKING UNION ECONOMIC GOVERNANCE BANKING UNION ECONOMCRD SSM SGP EIP MTO SCP ESAs EFSM EDP AMR CSRs AGS DGS EFSF ESM ESBR EBA EWG NCAs NRAs SRM MIP MTO NRP CRD SSM SGP EIP MTO SCP ESAs EFSM EDP AMR CSRs AGS DGS EFSF ESM ESBR EBA EWG NCAs NRAs SRM MIP MTO NRP CRD SSM SGP EIP MTO SCP ESAs EFSM EDP AMR CSRs AGS DGS EFSF ESM ESBR EBA EIC GOVERNANCE BANKING UNION ECONOMIC GOVERNANCE BANKING UNION ECONOMIC GOVERNANCE BANKING UNION ECONOMIC GOVERNANCE BANKING UNION ECONOMIC GOVERNANCE BANKING UNION ECONOMIC GOVERNANCE BANKING UNION ECONOMIC GOVERNANCE BANKING UNION ECONOMIC GOVERNWG NCAs NRAs SRM MIP MTO NRP CRD SSM SGP EIP MTO SCP ESAs EFSM EDP AMR CSRs AGS DGS EFSF ESM ESBR EBA EWG NCAs NRAs SRM MIP MTO NRP CRD SSM SGP EIP MTO SCP ESAs EFSM EDP AMR CSRs AGS DGS EFSF ESM ESBR EBA EWG NCAs NRAs SRM MIP MTO NRP CRD SSM SGP EIP MTO SCP ESAs EFSM EDP AMR CANCE BANKING UNION ECONOMIC GOVERNANCE BANKING UNION ECONOMIC GOVERNANCE BANKING UNION ECONOMIC GOVERNANCE BANKING UNION ECONOMIC GOVERNANCE BANKING UNION ECONOMIC GOVERNANCE BANKING UNION ECONOMIC GOVERNANCE BANKING UNION ECONOMIC GOVERNANCE BANSRs AGS DGS EFSF ESM ESBR EBA EWG NCAs NRAs SRM MIP MTO NRP CRD SSM SGP EIP MTO SCP ESAs EFSM EDP AMR CSRs AGS DGS EFSF ESM ESBR EBA EWG NCAs NRAs SRM MIP MTO NRP CRD SSM SGP EIP MTO SCP ESAs EFSM EDP AMR CSRs AGS DGS EFSF ESM ESBR EBA EWG NCAs NRAs SRM MIP MTO NRP CRD SSM SGP KING UNION ECONOMIC GOVERNANCE BANKING UNION ECONOMIC GOVERNANCE BANKING UNION ECONOMIC GOVERNANCE BANKING UNION ECONOMIC GOVERNANCE BANKING UNION ECONOMIC GOVERNANCE BANKING UNION ECONOMIC GOVERNANCE BANKING UNION ECONOMIC GOVERNANCE BANKING UNIOSGP EIP MTO SCP ESAs EFSM EDP AMR CSRs AGS DGS EFSF ESM ESBR EBA EWG NCAs NRAs SRM MIP MTO NRP CRD SSM SGP EIP MTO SCP ESAs EFSM EDP AMR CSRs AGS DGS EFSF ESM ESBR EBA EWG NCAs NRAs SRM MIP MTO NRP CRD SSM SGP EIP MTO SCP ESAs EFSM EDP AMR CSRs AGS DGS EFSF ESM ESBR EBA EWG NCAs N ECONOMIC GOVERNANCE BANKING UNION ECONOMIC GOVERNANCE BANKING UNION ECONOMIC GOVERNANCE BANKING UNION ECONOMIC GOVERNANCE BANKING UNION ECONOMIC GOVERNANCE BANKING UNION ECONOMIC GOVERNANCE BANKING UNION ECONOMIC GOVERNANCE BANKING UNION ECONOMNRAs SRM MIP MTO NRP CRD SSM SGP EIP MTO SCP ESAs EFSM EDP AMR CSRs AGS DGS EFSF ESM ESBR EBA EWG NCAs NRAs SRM MIP MTO NRP CRD SSM SGP EIP MTO SCP ESAs EFSM EDP AMR CSRs AGS DGS EFSF ESM ESBR EBA EWG NCAs NRAs SRM MIP MTO NRP CRD SSM SGP EIP MTO SCP ESAs EFSM EDP AMR CSRs AGS DIC GOVERNANCE BANKING UNION ECONOMIC GOVERNANCE BANKING UNION ECONOMIC GOVERNANCE BANKING UNION ECONOMIC GOVERNANCE BANKING UNION ECONOMIC GOVERNANCE BANKING UNION ECONOMIC GOVERNANCE BANKING UNION ECONOMIC GOVERNANCE BANKING UNION ECONOMIC GOVERNGS EFSF ESM ESBR EBA EWG NCAs NRAs SRM MIP MTO NRP CRD SSM SGP EIP MTO SCP ESAs EFSM EDP AMR CSRs AGS DGS EFSF ESM ESBR EBA EWG NCAs NRAs SRM MIP MTO NRP CRD SSM SGP EIP MTO SCP ESAs EFSM EDP AMR CSRs AGS DGS EFSF ESM ESBR EBA EWG NCAs NRAs SRM MIP MTO NRP CRD SSM SGP EIP MTO SANCE BANKING UNION ECONOMIC GOVERNANCE BANKING UNION ECONOMIC GOVERNANCE BANKING UNION ECONOMIC GOVERNANCE BANKING UNION ECONOMIC GOVERNANCE BANKING UNION ECONOMIC GOVERNANCE BANKING UNION ECONOMIC GOVERNANCE BANKING UNION ECONOMIC GOVERNANCE BANCP ESAs EFSM EDP AMR CSRs AGS DGS EFSF ESM ESBR EBA EWG NCAs NRAs SRM MIP MTO NRP CRD SSM SGP EIP MTO SCP ESAs EFSM EDP AMR CSRs AGS DGS EFSF ESM ESBR EBA EWG NCAs NRAs SRM MIP MTO NRP CRD SSM SGP EIP MTO SCP ESAs EFSM EDP AMR CSRs AGS DGS EFSF ESM ESBR EBA EWG NCAs NRAs SRM MIKING UNION ECONOMIC GOVERNANCE BANKING UNION ECONOMIC GOVERNANCE BANKING UNION ECONOMIC GOVERNANCE BANKING UNION ECONOMIC GOVERNANCE BANKING UNION ECONOMIC GOVERNANCE BANKING UNION ECONOMIC GOVERNANCE BANKING UNION ECONOMIC GOVERNANCE BANKING UNIOP MTO NRP CRD SSM SGP EIP MTO SCP ESAs EFSM EDP AMR CSRs AGS DGS EFSF ESM ESBR EBA EWG NCAs NRAs SRM MIP MTO NRP CRD SSM SGP EIP MTO SCP ESAs EFSM EDP AMR CSRs AGS DGS EFSF ESM ESBR EBA EWG NCAs NRAs SRM MIP MTO NRP CRD SSM SGP EIP MTO SCP ESAs EFSM EDP AMR CSRs AGS DGS EFSF ESM N ECONOMIC GOVERNANCE BANKING UNION ECONOMIC GOVERNANCE BANKING UNION ECONOMIC GOVERNANCE BANKING UNION ECONOMIC GOVERNANCE BANKING UNION ECONOMIC GOVERNANCE BANKING UNION ECONOMIC GOVERNANCE BANKING UNION ECONOMIC GOVERNANCE BANKING UNION ECONOMESBR EBA EWG NCAs NRAs SRM MIP MTO NRP CRD SSM SGP EIP MTO SCP ESAs EFSM EDP AMR CSRs AGS DGS EFSF ESM ESBR EBA EWG NCAs NRAs SRM MIP MTO NRP CRD SSM SGP EIP MTO SCP ESAs EFSM EDP AMR CSRs AGS DGS EFSF ESM ESBR EBA EWG NCAs NRAs SRM MIP MTO NRP CRD SSM SGP EIP MTO SCP ESAs EFSM IC GOVERNANCE BANKING UNION ECONOMIC GOVERNANCE BANKING UNION ECONOMIC GOVERNANCE BANKING UNION ECONOMIC GOVERNANCE BANKING UNION ECONOMIC GOVERNANCE BANKING UNION ECONOMIC GOVERNANCE BANKING UNION ECONOMIC GOVERNANCE BANKING UNION ECONOMIC GOVERNEDP AMR CSRs AGS DGS EFSF ESM ESBR EBA EWG NCAs NRAs SRM MIP MTO NRP CRD SSM SGP EIP MTO SCP ESAs EFSM EDP AMR CSRs AGS DGS EFSF ESM ESBR EBA EWG NCAs NRAs SRM MIP MTO NRP CRD SSM SGP EIP MTO SCP ESAs EFSM EDP AMR CSRs AGS DGS EFSF ESM ESBR EBA EWG NCAs NRAs SRM MIP MTO NRP CRANCE BANKING UNION ECONOMIC GOVERNANCE BANKING UNION ECONOMIC GOVERNANCE BANKING UNION ECONOMIC GOVERNANCE BANKING UNION ECONOMIC GOVERNANCE BANKING UNION ECONOMIC GOVERNANCE BANKING UNION ECONOMIC GOVERNANCE BANKING UNION ECONOMIC GOVERNANCE BAND SSM SGP EIP MTO SCP ESAs EFSM EDP AMR CSRs AGS DGS EFSF ESM ESBR EBA EWG NCAs NRAs SRM MIP MTO NRP CRD SSM SGP EIP MTO SCP ESAs EFSM EDP AMR CSRs AGS DGS EFSF ESM ESBR EBA EWG NCAs NRAs SRM MIP MTO NRP CRD SSM SGP EIP MTO SCP ESAs EFSM EDP AMR CSRs AGS DGS EFSF ESM ESBR EBA EWKING UNION ECONOMIC GOVERNANCE BANKING UNION ECONOMIC GOVERNANCE BANKING UNION ECONOMIC GOVERNANCE BANKING UNION ECONOMIC GOVERNANCE BANKING UNION ECONOMIC GOVERNANCE BANKING UNION ECONOMIC GOVERNANCE BANKING UNION ECONOMIC GOVERNANCE BANKING UNIOG NCAs NRAs SRM MIP MTO NRP CRD SSM SGP EIP MTO SCP ESAs EFSM EDP AMR CSRs AGS DGS EFSF ESM ESBR EBA EWG NCAs NRAs SRM MIP MTO NRP CRD SSM SGP EIP MTO SCP ESAs EFSM EDP AMR CSRs AGS DGS EFSF ESM ESBR EBA EWG NCAs NRAs SRM MIP MTO NRP CRD SSM SGP EIP MTO SCP ESAs EFSM EDP AMR CSRN ECONOMIC GOVERNANCE BANKING UNION ECONOMIC GOVERNANCE BANKING UNION ECONOMIC GOVERNANCE BANKING UNION ECONOMIC GOVERNANCE BANKING UNION ECONOMIC GOVERNANCE BANKING UNION ECONOMIC GOVERNANCE BANKING UNION ECONOMIC GOVERNANCE BANKING UNION ECONOMs AGS DGS EFSF ESM ESBR EBA EWG NCAs NRAs SRM MIP MTO NRP CRD SSM SGP EIP MTO SCP ESAs EFSM EDP AMR CSRs AGS DGS EFSF ESM ESBR EBA EWG NCAs NRAs SRM MIP MTO NRP CRD SSM SGP EIP MTO SCP ESAs EFSM EDP AMR CSRs AGS DGS EFSF ESM ESBR EBA EWG NCAs NRAs SRM MIP MTO NRP CRD SSM SGP EIP IC GOVERNANCE BANKING UNION ECONOMIC GOVERNANCE BANKING UNION ECONOMIC GOVERNANCE BANKING UNION ECONOMIC GOVERNANCE BANKING UNION ECONOMIC GOVERNANCE BANKING UNION ECONOMIC GOVERNANCE BANKING UNION ECONOMIC GOVERNANCE BANKING UNION ECONOMIC GOVERNEIP MTO SCP ESAs EFSM EDP AMR CSRs AGS DGS EFSF ESM ESBR EBA EWG NCAs NRAs SRM MIP MTO NRP CRD SSM SGP EIP MTO SCP ESAs EFSM EDP AMR CSRs AGS DGS EFSF ESM ESBR EBA EWG NCAs NRAs SRM MIP MTO NRP CRD SSM SGP EIP MTO SCP ESAs EFSM EDP AMR CSRs AGS DGS EFSF ESM ESBR EBA EWG NCAs NRANCE BANKING UNION ECONOMIC GOVERNANCE BANKING UNION ECONOMIC GOVERNANCE BANKING UNION ECONOMIC GOVERNANCE BANKING UNION ECONOMIC GOVERNANCE BANKING UNION ECONOMIC GOVERNANCE BANKING UNION ECONOMIC GOVERNANCE BANKING UNION ECONOMIC GOVERNANCE BANAs SRM MIP MTO NRP CRD SSM SGP EIP MTO SCP ESAs EFSM EDP AMR CSRs AGS DGS EFSF ESM ESBR EBA EWG NCAs NRAs SRM MIP MTO NRP CRD SSM SGP EIP MTO SCP ESAs EFSM EDP AMR CSRs AGS DGS EFSF ESM ESBR EBA EWG NCAs NRAs SRM MIP MTO NRP CRD SSM SGP EIP MTO SCP ESAs EFSM EDP AMR CSRs AGS DGS KING UNION ECONOMIC GOVERNANCE BANKING UNION ECONOMIC GOVERNANCE BANKING UNION ECONOMIC GOVERNANCE BANKING UNION ECONOMIC GOVERNANCE BANKING UNION ECONOMIC GOVERNANCE BANKING UNION ECONOMIC GOVERNANCE BANKING UNION ECONOMIC GOVERNANCE BANKING UNIOEFSF ESM ESBR EBA EWG NCAs NRAs SRM MIP MTO NRP CRD SSM SGP EIP MTO SCP ESAs EFSM EDP AMR CSRs AGS DGS EFSF ESM ESBR EBA EWG NCAs NRAs SRM MIP MTO NRP CRD SSM SGP EIP MTO SCP ESAs EFSM EDP AMR CSRs AGS DGS EFSF ESM ESBR EBA EWG NCAs NRAs SRM MIP MTO NRP CRD SSM SGP EIP MTO SCP EN ECONOMIC GOVERNANCE BANKING UNION ECONOMIC GOVERNANCE BANKING UNION ECONOMIC GOVERNANCE BANKING UNION ECONOMIC GOVERNANCE BANKING UNION ECONOMIC GOVERNANCE BANKING UNION ECONOMIC GOVERNANCE BANKING UNION ECONOMIC GOVERNANCE BANKING UNION ECONOMSAs EFSM EDP AMR CSRs AGS DGS EFSF ESM ESBR EBA EWG NCAs NRAs SRM MIP MTO NRP CRD SSM SGP EIP MTO SCP ESAs EFSM EDP AMR CSRs AGS DGS EFSF ESM ESBR EBA EWG NCAs NRAs SRM MIP MTO NRP CRD SSM SGP EIP MTO SCP ESAs EFSM EDP AMR CSRs AGS DGS EFSF ESM ESBR EBA EWG NCAs NRAs SRM MIP MTIC GOVERNANCE BANKING UNION ECONOMIC GOVERNANCE BANKING UNION ECONOMIC GOVERNANCE BANKING UNION ECONOMIC GOVERNANCE BANKING UNION ECONOMIC GOVERNANCE BANKING UNION ECONOMIC GOVERNANCE BANKING UNION ECONOMIC GOVERNANCE BANKING UNION ECONOMIC GOVERNO SCP ESAs EFSM EDP AMR CSRs AGS DGS EFSF ESM ESBR EBA EWG NCAs NRAs SRM MIP MTO NRP CRD SSM SGP EIP MTO SCP ESAs EFSM EDP AMR CSRs AGS DGS EFSF ESM ESBR EBA EWG NCAs NRAs SRM MIP MTO NRP CRD SSM SGP EIP MTO SCP ESAs EFSM EDP AMR CSRs AGS DGS EFSF ESM ESBR EBA EWG NCAs NRAs SRM ANCE BANKING UNION ECONOMIC GOVERNANCE BANKING UNION ECONOMIC GOVERNANCE BANKING UNION ECONOMIC GOVERNANCE BANKING UNION ECONOMIC GOVERNANCE BANKING UNION ECONOMIC GOVERNANCE BANKING UNION ECONOMIC GOVERNANCE BANKING UNION ECONOMIC GOVERNANCE GOV
DIRECTORATE GENERAL FOR INTERNAL POLICIES ECONOMIC GOVERNANCE SUPPORT UNIT
S T U D Y
Provided at the request of theEconomic and Monetary Affairs Committee
ENECON
IPOLEGOV
Robustness, Validity and Significance of the ECB’s Asset Quality Review and Stress Test Exercise
Author: Sascha SteffenEuropean School of Management and Technology (ESMT)
October 2014
IPOL
EGOV
DIRECTORATE-GENERAL FOR INTERNAL POLICIES
ECONOMIC GOVERNANCE SUPPORT UNIT
PE 528.761
STUDY
Robustness, Validity and Significance of the ECB’s
Asset Quality Review and Stress Test Exercise
Author: Sascha Steffen
European School of Management and Technology (ESMT)
Provided in advance of the Supervisory Hearing with
the Chair of the Supervisory Board of the Single Supervisory Mechanism
in ECON
on 3 November 2014
Abstract
As we are moving toward a eurozone banking union, the European Central Bank (ECB)
is going to take over the regulatory oversight of 128 banks in November 2014. To that
end, the ECB conducted a comprehensive assessment of these banks, which included an
asset quality review (AQR) and a stress test. The fundamental question is what will the
financial condition of these banks be when the ECB commences its regulatory oversight?
And, can the comprehensive assessment lead to a full repair of banks’ balance sheets so
that the ECB takes over financially sound banks and is the necessary regulation in place
to facilitate this? Overall, the design of the assessment does not comprehensively deal
with the problems in the financial sector and risks may remain that will pose substantial
threats to financial stability in the eurozone.
October 2014
ECON EN
PE 528.761 2
This paper was requested by the European Parliament's Economic and Monetary Affairs Committee.
AUTHOR
Sascha Steffen, European School of Management and Technology (ESMT)
RESPONSIBLE ADMINISTRATOR
Marcel Magnus
Economic Governance Support Unit
Directorate for Economic and Scientific Policies
Directorate-General for the Internal Policies of the Union
European Parliament
B-1047 Brussels
LANGUAGE VERSION
Original: EN
ABOUT THE EDITOR
Economic Governance Support Unit provides in-house and external expertise to support EP committees
and other parliamentary bodies in playing an effective role within the European Union framework for
coordination and surveillance of economic and fiscal policies.
E-mail: [email protected]
This document is also available on Economic and Monetary Affairs Committee homepage, under section
European Semester and Economic Dialogue at:
http://www.europarl.europa.eu/committees/en/ECON/home.html
Manuscript completed in October 2014.
© European Union, 2014
DISCLAIMER
The opinions expressed in this document are the sole responsibility of the authors and do not necessarily
represent the official position of the European Parliament.
Reproduction and translation for non-commercial purposes are authorised, provided the source is
acknowledged and the publisher is given prior notice and sent a copy.
3 PE 528.761
CONTENTS
List of abbreviations ...................................................................................................................................... 4
List of tables .................................................................................................................................................. 5
List of figures ................................................................................................................................................. 5
List of key findings ........................................................................................................................................ 5
Executive summary ....................................................................................................................................... 6
1. Introduction ............................................................................................................................................ 7
2. Stress tests after the 2007-2009 financial crisis ...................................................................................... 9
3. ECB’s 2014 comprehensive assessment ............................................................................................... 10
3.1 Objective and Scope of the Comprehensive Assessment ........................................................... 10
3.2 Asset Quality Review .................................................................................................................. 11
3.3 Design and Execution of EBA 2014 Stress Tests ....................................................................... 12
3.3.1 Stress test scenarios and modeling approach .................................................................. 12
3.3.2 Stress test outcome .......................................................................................................... 13
4. Systemic risk and implications for stress testing .................................................................................. 14
4.1 Systemic Risk and Contagion ..................................................................................................... 15
4.1.1 Contractual contagion or domino effects ........................................................................ 15
4.1.2 Information contagion ..................................................................................................... 15
4.1.3 Fire sale contagion .......................................................................................................... 16
4.1.4 Price complexity externalities ......................................................................................... 16
4.2 Common Exposures .................................................................................................................... 17
4.3 Implications for stress testing ...................................................................................................... 17
5. Alternative stress testing models using public data .............................................................................. 18
5.1 Alternative Macroprudential Stress Test Models ........................................................................ 18
5.2 Alternatives to the EBA 2011 Stress Test ................................................................................... 19
5.2.1 Steffen (2011) and Acharya and Steffen (2013) ............................................................. 19
5.2.2 Acharya et al. (2014) ....................................................................................................... 20
5.3 An Alternative to the EBA 2014 Stress Test .............................................................................. 21
5.3.1 Cross-country capital shortfalls using book and market stressed capital ratios .............. 22
5.3.2 Ranking banks with largest capital shortfalls using SRISK ........................................... 23
5.3.3 Assessing Losses Based on Write Downs of Non-Performing Loans ............................ 24
5.3.4 Comparing shortfalls based on regulatory and book (or market) stressed capital ratios 24
6. Conclusions .......................................................................................................................................... 25
References .................................................................................................................................................... 27
Annexes ....................................................................................................................................................... 30
PE 528.761 4
LIST OF ABBREVIATIONS
AFS Available for Sale
AIG American International Group, Inc. (U.S.-based insurance company)
AQR Asset Quality Review
BHC Bank Holding Company
BRRD Bank Recovery and Resolution Directive
C Tier 1 ratio Common Equity Tier 1 ratio (CRD III/Basel 2.5)
CCAR Comprehensive Capital Analysis and Review
CDS Credit Default Swap
CEBS Committee of European Banking Supervisors
CET1 Core Equity Tier 1 capital (CRR/CRD IV; Basel 3)
CoVaR Co-movement Value-at-Risk
CRD III Directive 2010/76/EU
CRR/CRD IV Regulation (EU) No 575/2013 and Directive 2013/36/EU
DFA Dodd-Frank Act
DIP Distressed Insurance Premium
EBA European Banking Authority
EC European Commission
ECB European Central Bank
ECOFIN Economic and Financial Affairs Council
ESM European Stability Mechanism
ESRB European Systemic Risk Board
EU European Union
Fed Federal Reserve Bank
GDP Gross Domestic Product
GIIPS Greece, Ireland, Italy, Portugal, Spain
HFT Held For Trading
HTM Held to Maturity
IFRS International Financial Reporting Standards
IMF International Monetary Fund
IRB Internal Ratings-Based Approach
LRMES Long-run Marginal Expected Shortfall
LTRO Long-Term Refinancing Operation
LVG Leverage
MES Marginal Expected Shortfall
NCA National Competent Authority
NPL Non-performing Loans
NSA National Supervisory Authority
OMT Outright Monetary Transaction
P&L Profit and Loss
QA Quality Assurance
RWA Risk-Weighted Assets
SCAP Supervisory Capital Assessment Program
SES Systemic Expected Shortfall
SME Small- and Medium-size Enterprise
SMP Securities Markets Program
SRISK Systemic Risk Measure
SSM Single Supervisory Mechanism
USD U.S. Dollar
5 PE 528.761
LIST OF TABLES
TABLE 1. Top 10 banks with largest (percentage) capital shortfalls: July 2010 vs. July 2011 ................. 19 TABLE 2. Sample of ECB Stress Test Banks: Descriptive Statistics ......................................................... 22 TABLE 3. Capital Shortfalls Using Book Capital Measures ...................................................................... 23 TABLE 4. Capital Shortfalls Using Book and Market Capital Shortfalls ................................................... 23
TABLE 5. Write Down of NPL Portfolio ................................................................................................... 24
LIST OF FIGURES
FIGURE 1. Crowding-out of Lending in Italy and Spain ............................................................................. 8
FIGURE 2. Correlation of Capital Shortfalls .............................................................................................. 25
LIST OF KEY FINDINGS
BOX 1. Key Findings: Stress Test Review ................................................................................................... 9 BOX 2. Key Findings: EBA 2014 Stress Test Exercise .............................................................................. 10 BOX 3. Key Findings: Systemic Risk and Implications for Stress Testing ................................................ 15
BOX 4. Key Findings: Alternative Stress Test Models ............................................................................... 18
PE 528.761 6
EXECUTIVE SUMMARY
The European Central Bank (ECB) will take over the regulatory oversight of 128 banks in the eurozone in
November 2014. The ECB will effectively assume roles as both central bank and regulator in charge of
the Single Supervisory Mechanism (SSM). In preparation, the ECB conducted a comprehensive
assessment of these banks, which included an asset quality review (AQR) and a stress test. The credibility
of the ECB might be severely damaged if these banks fail because of legacy assets soon after it takes over
regulatory oversight. The comprehensive assessment was thus necessary to clean up banks’ balance
sheets before the takeover.
The banking system in the eurozone is still vulnerable. During the credit boom of 2004-2006, banks
invested too much and accrued too much leverage. Importantly, they did not internalize how their
behavior affects the entire financial system. This became obvious during the 2007-2009 global financial
crisis, as well as during the recent sovereign debt crisis when banks incurred massive losses and needed
substantial government support. European stress tests were implemented in 2010 and 2011 as part of
macroprudential oversight; however, they were ineffective. Substantial solvency concerns with respect to
some institutions remained and caused a disruption in short-term funding markets in the fall of 2011. The
ECB thus implemented a tailor-made monetary policy to support these institutions, further reducing
incentives of banks and national regulators to act.
The ECB faces a trade-off: On the one hand, it wants to maintain its reputation as a central bank and build
its reputation as a regulator from the start by comprehensively identifying and valuing the problem assets
of the 128 banks. On the other hand, there is the potential for capital shortfalls but no clearly defined
backstops should any of the banks falter. Worse, national regulators may have incentives that induced
them to not fully disclose problem assets, yet the ECB depended on information from the national
regulators when conducting the comprehensive assessment. The trade-off may have weakened the
significance of both the AQR and the stress test exercise.
Stress tests are supposed to be part of the macroprudential regulation of banks. However, regulators still
have to realize that the financial system is a “system” and incorporate this rational in the way they
regulate banks. Banks are increasingly interconnected through contractual relationships, as well as
exposures to similar assets and similar comparable macroeconomic shocks. Because banks do not
internalize the risks their behavior creates for the system, they invest too much and accrue too much
leverage. The ECB’s comprehensive assessment does not account for this “systemic risk.”
Taken together, the trade-off faced by the ECB, as well as the omission of systemic risk in the
assessment, strongly suggest that the ECB may not be able to reach its objective to identify the problem
assets and cleanup the balance sheets of European banks, putting its reputation in danger and leaving the
financial system vulnerable. The ECB may thus have to continue providing assistance to banks about
whose solvency one can have serious doubts. Importantly, a sustainable growth path still eludes the
eurozone countries and the results in this report further increase doubts that Europe can escape this low-
growth environment in the near future.
In this report, I describe alternative stress test models that rely on public data. These models account for,
among other items, systemic risk. They have produced results consistent with economic developments in
2010 and 2011 and provide interesting findings using the banks included in the comprehensive
assessment. These models can serve as credible benchmarks for the comprehensive assessment, as well as
future stress tests.
7 PE 528.761
1. INTRODUCTION
In November 2014, the European Central Bank (ECB) is going to take over the regulatory oversight of
128 banks in the eurozone. To facilitate this step toward a banking union, the ECB conducted a
comprehensive assessment of these banks, which included an asset quality review (AQR) and a stress
test.
While European banks did undergo stress tests in 2010 and 2011, the political environment has changed.
The main objective in 2010 and 2011 was to assess the resilience of the banking system to different risk
factors. These tests, however, which were designed by the European Banking Authority (EBA), have
widely been criticized. Beginning in November 2014, the ECB will effectively assume roles both as
central bank and regulator in charge of the Single Supervisory Mechanism (SSM).1 The credibility of the
ECB might be severely damaged if banks fail due to legacy assets soon after the ECB commences
regulatory oversight. A comprehensive assessment was thus necessary to evaluate the financial soundness
of these banks and clean up their balance sheets before ECB oversight begins.
This is important, as the incentives of the national supervisors in dealing with eurozone banks are
different. First, they were not successful in preventing an excessive build-up of risk in the financial
system before the recent financial crisis.2 More importantly, in some cases it is doubtful that they have
dealt with the write-down needs of banks quickly enough, ignoring the risks and deferring problems to
the future. Secondly, some problem banks may simply have been too large and resolution too costly and
regulators may have tried to avoid a public outcry over bank failures and or costs to taxpayers; or the
countries may not have had the fiscal capacity to effectively resolve the problems. Finally, forbearance
might have been politically motivated due to strong ties between banks and politicians.3
Whatever the reasons were, the actions of the ECB to support the eurozone economy through the
Securities Markets Programme in 2010 and 2011, Long-Term Refinancing Operations (LTRO) in 2011
and 2012, and the announcement of the Outright Monetary Transactions (OMT) program in 2012
provided support to a troubled financial system, thereby making it possible for the ECB to delay dealing
with troubled banks. Repeatedly lowering its collateral standard, the ECB was effectively providing
assistance to banks that likely had solvency issues.4 Thus, national regulators may have had even more
incentives to defer actions as the problem was partly addressed by the ECB. The ECB’s comprehensive
assessment should contribute to curtailing such forbearance by national regulators. Using a single
framework for the identification and valuation of non-performing loans, for example, and uainf a
common supervisory benchmark should help remove undue forbearance and clean up financial
institutions.
The weak and uneven economic recovery in Europe supports this narrative. Europe, and the southern
peripheral countries in particular, were mired in recession from early 2011 to 2013 and a sustainable
growth path still eludes them. A big problem is the small scale of lending especially to small and medium
enterprises (SME) in the eurozone. The scarcity of bank capital appears to have caused a misallocation of
credit in the area, preventing a widespread economic recovery. Moreover, under-capitalized banks loaded
up on risky sovereign bonds, which destabilized the banks even further, resulting in substantial liquidity,
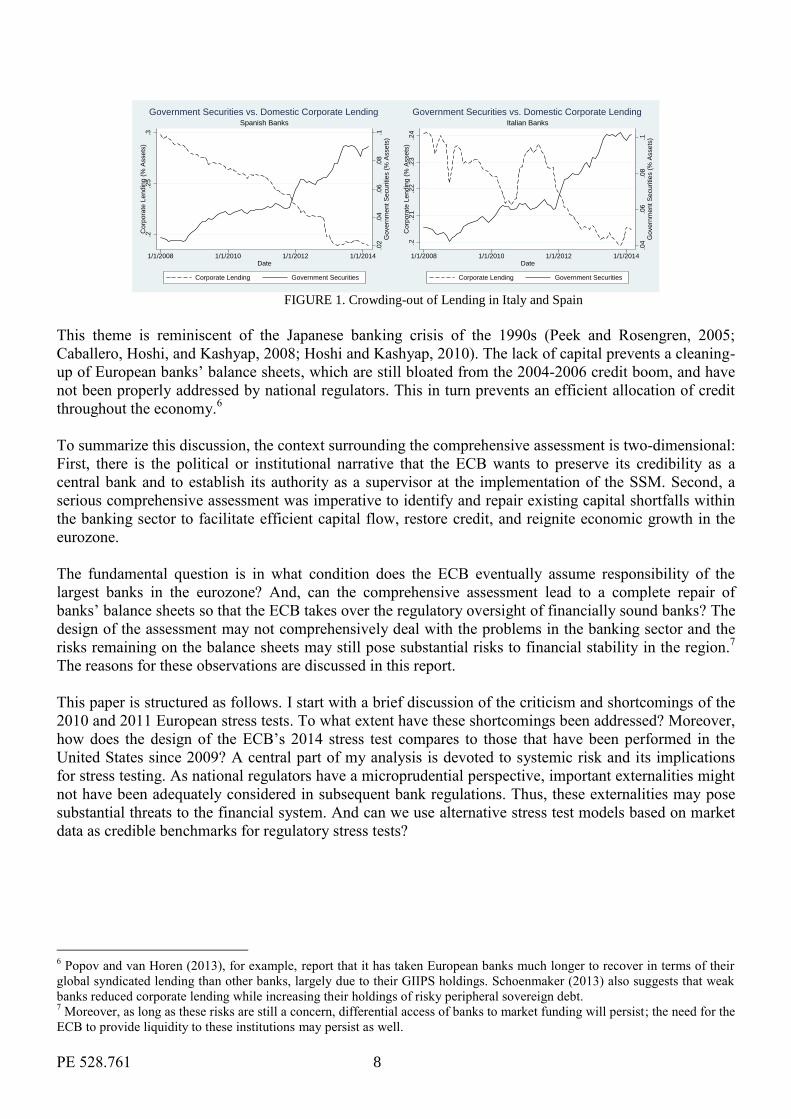
solvency problems, and a crowding out of lending to non-financial firms (Acharya and Steffen, 2014).5
The crowding out effect is shown in Figure 1 using ECB data.
1 The advantages and disadvantages of combining both roles are not discussed here. Goodhart (1988) and Hellwig (2014c)
provide extensive discussions on the topic. 2 While the counter-cyclical capital buffers that were introduced in Spain helped to smooth the effects at the beginning of the
crisis, they eventually appeared to be too small. 3 Hellwig (2014a and 2014b) provide an in-depth discussion of these issues.
4 ECB support was most important for weakly capitalized banks (Acharya and Steffen, 2014b).
5 In fact, if diversification does not reduce banks’ capital requirements, loading up on one asset becomes a rational response
(Acharya et al., 2014).
PE 528.761 8
FIGURE 1. Crowding-out of Lending in Italy and Spain
This theme is reminiscent of the Japanese banking crisis of the 1990s (Peek and Rosengren, 2005;
Caballero, Hoshi, and Kashyap, 2008; Hoshi and Kashyap, 2010). The lack of capital prevents a cleaning-
up of European banks’ balance sheets, which are still bloated from the 2004-2006 credit boom, and have
not been properly addressed by national regulators. This in turn prevents an efficient allocation of credit
throughout the economy.6
To summarize this discussion, the context surrounding the comprehensive assessment is two-dimensional:
First, there is the political or institutional narrative that the ECB wants to preserve its credibility as a
central bank and to establish its authority as a supervisor at the implementation of the SSM. Second, a
serious comprehensive assessment was imperative to identify and repair existing capital shortfalls within
the banking sector to facilitate efficient capital flow, restore credit, and reignite economic growth in the
eurozone.
The fundamental question is in what condition does the ECB eventually assume responsibility of the
largest banks in the eurozone? And, can the comprehensive assessment lead to a complete repair of
banks’ balance sheets so that the ECB takes over the regulatory oversight of financially sound banks? The
design of the assessment may not comprehensively deal with the problems in the banking sector and the
risks remaining on the balance sheets may still pose substantial risks to financial stability in the region.7
The reasons for these observations are discussed in this report.
This paper is structured as follows. I start with a brief discussion of the criticism and shortcomings of the
2010 and 2011 European stress tests. To what extent have these shortcomings been addressed? Moreover,
how does the design of the ECB’s 2014 stress test compares to those that have been performed in the
United States since 2009? A central part of my analysis is devoted to systemic risk and its implications
for stress testing. As national regulators have a microprudential perspective, important externalities might
not have been adequately considered in subsequent bank regulations. Thus, these externalities may pose
substantial threats to the financial system. And can we use alternative stress test models based on market
data as credible benchmarks for regulatory stress tests?
6 Popov and van Horen (2013), for example, report that it has taken European banks much longer to recover in terms of their
global syndicated lending than other banks, largely due to their GIIPS holdings. Schoenmaker (2013) also suggests that weak
banks reduced corporate lending while increasing their holdings of risky peripheral sovereign debt. 7 Moreover, as long as these risks are still a concern, differential access of banks to market funding will persist; the need for the
ECB to provide liquidity to these institutions may persist as well.
.02
.04
.06
.08
.1G
ove
rnm
ent
Securities (
% A
ssets
)
.2.2
5.3
Co
rpora
te L
endin
g (
% A
ssets
)
1/1/2008 1/1/2010 1/1/2012 1/1/2014Date
Corporate Lending Government Securities
Spanish Banks
Government Securities vs. Domestic Corporate Lending
.04
.06
.08
.1G
ove
rnm
ent
Securities (
% A
ssets
)
.2.2
1.2
2.2
3.2
4C
orp
ora
te L
endin
g (
% A
ssets
)
1/1/2008 1/1/2010 1/1/2012 1/1/2014Date
Corporate Lending Government Securities
Italian Banks
Government Securities vs. Domestic Corporate Lending
9 PE 528.761
2. STRESS TESTS AFTER THE 2007-2009 FINANCIAL CRISIS
KEY FINDINGS
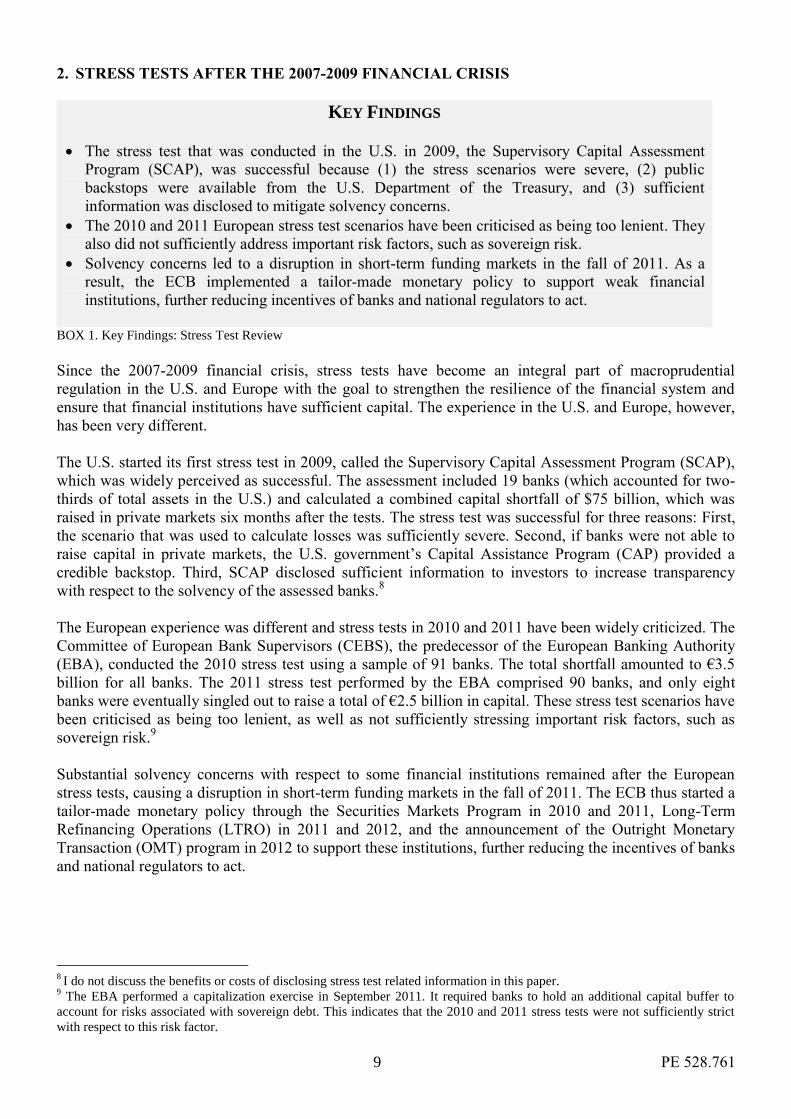
The stress test that was conducted in the U.S. in 2009, the Supervisory Capital Assessment
Program (SCAP), was successful because (1) the stress scenarios were severe, (2) public
backstops were available from the U.S. Department of the Treasury, and (3) sufficient
information was disclosed to mitigate solvency concerns.
The 2010 and 2011 European stress test scenarios have been criticised as being too lenient. They
also did not sufficiently address important risk factors, such as sovereign risk.
Solvency concerns led to a disruption in short-term funding markets in the fall of 2011. As a
result, the ECB implemented a tailor-made monetary policy to support weak financial
institutions, further reducing incentives of banks and national regulators to act.
BOX 1. Key Findings: Stress Test Review
Since the 2007-2009 financial crisis, stress tests have become an integral part of macroprudential
regulation in the U.S. and Europe with the goal to strengthen the resilience of the financial system and
ensure that financial institutions have sufficient capital. The experience in the U.S. and Europe, however,
has been very different.
The U.S. started its first stress test in 2009, called the Supervisory Capital Assessment Program (SCAP),
which was widely perceived as successful. The assessment included 19 banks (which accounted for two-
thirds of total assets in the U.S.) and calculated a combined capital shortfall of $75 billion, which was
raised in private markets six months after the tests. The stress test was successful for three reasons: First,
the scenario that was used to calculate losses was sufficiently severe. Second, if banks were not able to
raise capital in private markets, the U.S. government’s Capital Assistance Program (CAP) provided a
credible backstop. Third, SCAP disclosed sufficient information to investors to increase transparency
with respect to the solvency of the assessed banks.8
The European experience was different and stress tests in 2010 and 2011 have been widely criticized. The
Committee of European Bank Supervisors (CEBS), the predecessor of the European Banking Authority
(EBA), conducted the 2010 stress test using a sample of 91 banks. The total shortfall amounted to €3.5
billion for all banks. The 2011 stress test performed by the EBA comprised 90 banks, and only eight
banks were eventually singled out to raise a total of €2.5 billion in capital. These stress test scenarios have
been criticised as being too lenient, as well as not sufficiently stressing important risk factors, such as
sovereign risk.9
Substantial solvency concerns with respect to some financial institutions remained after the European
stress tests, causing a disruption in short-term funding markets in the fall of 2011. The ECB thus started a
tailor-made monetary policy through the Securities Markets Program in 2010 and 2011, Long-Term
Refinancing Operations (LTRO) in 2011 and 2012, and the announcement of the Outright Monetary
Transaction (OMT) program in 2012 to support these institutions, further reducing the incentives of banks
and national regulators to act.
8 I do not discuss the benefits or costs of disclosing stress test related information in this paper.
9 The EBA performed a capitalization exercise in September 2011. It required banks to hold an additional capital buffer to
account for risks associated with sovereign debt. This indicates that the 2010 and 2011 stress tests were not sufficiently strict
with respect to this risk factor.
PE 528.761 10
3. ECB’S 2014 COMPREHENSIVE ASSESSMENT
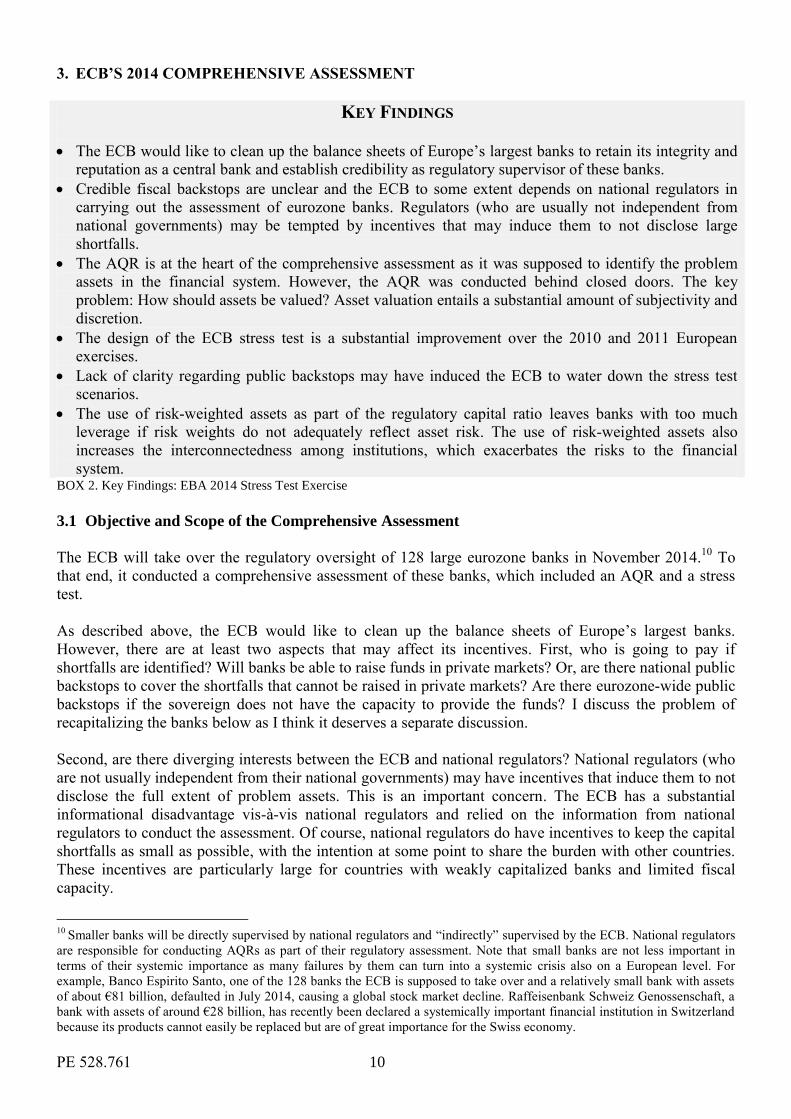
KEY FINDINGS
The ECB would like to clean up the balance sheets of Europe’s largest banks to retain its integrity and
reputation as a central bank and establish credibility as regulatory supervisor of these banks.
Credible fiscal backstops are unclear and the ECB to some extent depends on national regulators in
carrying out the assessment of eurozone banks. Regulators (who are usually not independent from
national governments) may be tempted by incentives that may induce them to not disclose large
shortfalls.
The AQR is at the heart of the comprehensive assessment as it was supposed to identify the problem
assets in the financial system. However, the AQR was conducted behind closed doors. The key
problem: How should assets be valued? Asset valuation entails a substantial amount of subjectivity and
discretion.
The design of the ECB stress test is a substantial improvement over the 2010 and 2011 European
exercises.
Lack of clarity regarding public backstops may have induced the ECB to water down the stress test
scenarios.
The use of risk-weighted assets as part of the regulatory capital ratio leaves banks with too much
leverage if risk weights do not adequately reflect asset risk. The use of risk-weighted assets also
increases the interconnectedness among institutions, which exacerbates the risks to the financial
system. BOX 2. Key Findings: EBA 2014 Stress Test Exercise
3.1 Objective and Scope of the Comprehensive Assessment
The ECB will take over the regulatory oversight of 128 large eurozone banks in November 2014.10
To
that end, it conducted a comprehensive assessment of these banks, which included an AQR and a stress
test.
As described above, the ECB would like to clean up the balance sheets of Europe’s largest banks.
However, there are at least two aspects that may affect its incentives. First, who is going to pay if
shortfalls are identified? Will banks be able to raise funds in private markets? Or, are there national public
backstops to cover the shortfalls that cannot be raised in private markets? Are there eurozone-wide public
backstops if the sovereign does not have the capacity to provide the funds? I discuss the problem of
recapitalizing the banks below as I think it deserves a separate discussion.
Second, are there diverging interests between the ECB and national regulators? National regulators (who
are not usually independent from their national governments) may have incentives that induce them to not
disclose the full extent of problem assets. This is an important concern. The ECB has a substantial
informational disadvantage vis-à-vis national regulators and relied on the information from national
regulators to conduct the assessment. Of course, national regulators do have incentives to keep the capital
shortfalls as small as possible, with the intention at some point to share the burden with other countries.
These incentives are particularly large for countries with weakly capitalized banks and limited fiscal
capacity.
10
Smaller banks will be directly supervised by national regulators and “indirectly” supervised by the ECB. National regulators
are responsible for conducting AQRs as part of their regulatory assessment. Note that small banks are not less important in
terms of their systemic importance as many failures by them can turn into a systemic crisis also on a European level. For
example, Banco Espirito Santo, one of the 128 banks the ECB is supposed to take over and a relatively small bank with assets
of about €81 billion, defaulted in July 2014, causing a global stock market decline. Raffeisenbank Schweiz Genossenschaft, a
bank with assets of around €28 billion, has recently been declared a systemically important financial institution in Switzerland
because its products cannot easily be replaced but are of great importance for the Swiss economy.
11 PE 528.761
Both aspects have implications for the design of both the AQR and the stress test. The ECB might be
induced to dilute the tests ex ante to avoid a major burden on the national sovereigns.11
This, however,
conflicts with the primary objective of the ECB and puts its future reputation as a central bank and a
regulatory overseer at risk. Moreover, it increases the likelihood that the ECB needs to continue with a
monetary policy tailored to weak banks.
Additionally, a weak comprehensive assessment does a serious disservice to the transparency of the
comprehensive assessment and of eurozone banks’ balance sheets. In 2011, when the extent of the
influence of sovereign bonds on banks’ balance sheets became visible, short-term investors (such as U.S.
money market funds) substantially reduced their funding from banks with large exposures to risky
sovereign debt because they questioned the solvency of these institutions. A decisive comprehensive
assessment is supposed to increase balance sheet transparency and reduce solvency concerns in order to
open private funding markets for European banks; for many banks, these markets are still out of reach.
3.2 Asset Quality Review
The Asset Quality Review (AQR) is the first part of the comprehensive assessment. The AQR is a point-
in-time assessment of the eurozone banks’ loan books with the goal of identifying problem assets. This
part of the assessment is crucial given the objective described in the introduction. If the ECB wants to
assume regulatory responsibility for a healthy financial system, it has to start by analyzing the balance
sheets of banks in as much detail as possible, identifying which assets are problematic, and requesting
remedial measures where appropriate (ECB, 2014b). There is not much information available as to how
the AQR was actually performed; however, a few points are worth mentioning about the AQR process.
Identify problem assets: The AQR should have uncovered the non-performing assets that are still on the
balance sheets of the 128 banks. Non-performing asset examples might be Irish or Spanish real estate
loans or the shipping loans of German banks. The value of these loans needs to be adjusted to reflect the
increase in credit risks that have been caused by the real estate and shipping crises. While credit risks are
always hard to quantify, decreases in the market value of collateral provides some indication of write-
down needs. And in some cases where market values of collateral are unavailable because the crisis led to
a market freeze (to which the banks, fearing the consequences of market transparency, may have even
contributed), the market freeze itself should be taken as a signal for write-down needs. Moreover, the
AQR considers only a fraction of a bank’s loan book that has been selected for this exercise. Thus,
problem loans might still be hidden in banks’ balance sheets, as they were not evaluated.
Valuation: How are assets valued? Loans do usually not have market prices. Should discounted cash
flows be used instead? How are cash flows estimated? How are discount rates determined? Valuations of
loans are thus very subjective. Should we trust market prices if they are available? Or are they depressed
and deviating from fundamental value?
Combining the AQR and the stress test: How are the results from the AQR reflected in the stress test?
Conceptually, the AQR should have preceded the stress test and the results from the AQR should fully
enter the stress test exercise. The AQR and stress test, however, were conducted in parallel. The ECB has
recently published the methodology on how the AQR and stress test have to be combined (ECB, 2014a). I
still have some reservations regarding this process. While the results from the AQR are used in the stress
test, the ECB could not fully disclose the results to the banks in order not to trigger mandatory disclosures
of banks to investors. Instead, the ECB constructed adjustments that the banks are supposed to use (“join
up”). These adjustments seem to exhibit a certain amount of discretion on the side of the ECB. They
might be used to attenuate the requirements of the comprehensive assessment ex post, as described above.
11
The Treaty on Stability, Coordination and Governance (TSCG), also called the “fiscal compact,” which entered into force on
January 1, 2013, puts further pressure on the flexibility of sovereigns’ budgets.
PE 528.761 12
3.3 Design and Execution of EBA 2014 Stress Tests
I investigate the stress test as the second part of the comprehensive assessment in the remainder of the
paper and raise important concerns as to the consistency of the approach with the main objective of this
exercise. In this subsection I discuss the issues surrounding the (1) scenario of the tests, (2) the modeling
approach, and (3) the evaluation of the results. I focus on key aspects to keep the discussion manageable
and to avoid a subjective bias by being too detailed with respect to, for example, scenario realizations. I
address the design of the EBA 201412
scenarios (as well as model choice and outcome) in depth in the
annexes.
1. Annex I provides an in-depth comparison of the EBA 2011 and EBA 2014 stress tests.
2. Annex II provides a detailed overview of (1) the adverse scenarios in 2014 versus the adverse scenario
in 2011 and (2) versus the actual economic development 2011-2013 with respect to the following
macroeconomic factors: GDP, unemployment, inflation, government bond yields, and house prices. I
focus on the eurozone, Germany, and the GIIPS (Greece, Italy, Ireland, Portugal, and Spain) for
comparison. The interested reader can easily compare these factors across the different countries.
3. Annex III provides a comparison between the stress tests that have been conducted in the US, the
Comprehensive Capital Analysis and Review (CCAR) 2014 and EBA 2014.
3.3.1 Stress test scenarios and modeling approach
The design of the EBA 2014 stress test exercise is a substantial improvement over the previous exercises
in 2010 and 2011 in various aspects. For example, a larger number of banks are included, the scope of
macro shocks as well as country-specific shocks is substantially broader (also compared to the U.S.),13
a
wider range of risks are considered (also counterparty risk when assessing market risk), and national
authorities are encouraged to add other country-specific risks as well (even though these will not enter the
overall assessment to ensure comparability). Several other issues are worth highlighting (also comparing
the EBA 2014 and EBA 2011).
Severity of stress tests: A frequently discussed question is: Are the stress test scenarios severe enough?
The adverse scenario is not based on a historical scenario but on a series of shocks, as described in Annex
I, that have been constructed by the EBA/ESRB using historical data, along with their judgment. This
makes it difficult to compare the stress test to other tests or time periods. Should the answer to that
question be based on how many banks “fail” the stress test or whether or not a bank fails on the ECB’s
watch shortly after the tests, as happened in 2010 and 2011. A better question to ask may be: Are there
reasons to assume that the stress tests might be deliberately weak in the first place? And the answer to
that question would be yes. Conflicting incentives of the ECB and national authorities and missing public
backstops make it more likely that the stress scenarios are too weak to avoid large capital shortfalls that
cannot be financed with public funds.
Consistency of the stress test scenarios: Unfortunately, it is impossible to investigate the consistency of
the adverse stress scenario using the information provided in the methodology note for at least two
reasons. First, the time series data of many of the macro variables are not publicly available for several
countries (not on Bloomberg, Datastream or other public sources), surprisingly even for standard
information such as GDP. Second, based on the description of the modeling approach, a replication of the
scenario is hardly feasible. Given the shocks that enter the model, it would have been interesting to see
12
EBA 2014 is simply a notation for the EBA stress test in 2014; the stress tests in 2010 and 2011 are abbreviated with EBA
2010 and EBA 2011, respectively. 13
Of course, a higher degree of complexity (e.g., through several macro variables and countries) increases the risk that the
models are not correctly specified. I will return to this issue in the section 5 of this paper.
13 PE 528.761
the responses of the various macro factors that eventually enter the adverse scenario.14
As the ECB has
incentives to make the scenarios weaker (at least for some banks), a consistent modeling approach for the
stress test would have been reassuring and helped to increase transparency.
Horizon and static balance sheet assumption: A striking difference compared to EBA 2011 is the
choice of a three-year stress test horizon instead of two years. This can be interpreted as a higher risk
aversion by the ECB, which supports their objective to accept responsibility of a financially sound group
of banks. However, the rather long horizon is problematic because of the static balance sheet assumption.
In other words, even though a bank is confronted with, for example, a three-year recession, it is assumed
to not change its business model, sell assets or change its funding structure. This tends to ignore any
behavioral and feedback effects, which eventually pose substantial risks to the financial system. I discuss
these issues in detail in the next section.
Liquidity risk: Liquidity risk is still not explicitly modeled in EBA 2014 stress test. While it is indirectly
accounted for through an increase in funding costs, different funding structures (i.e., the relative reliance
on wholesale funding) are not modeled, nor are bank runs by short-term investors and, in particular, runs
on the financial system as a whole.
Bottom-up approach: The ECB relies on the information provided by the banks (who conduct the stress
test using internal models) and the national regulators who are in close contact with the national banks in
order to assure the validity of the information. This process emphasizes the relevance of the incentive
problems of the national regulators and government not to disclose the extent of the capital shortfalls of
their banks.
3.3.2 Stress test outcome
The stress test outcome can be assessed based on how the stress test results are evaluated, as well as the
consequences that follow.
Common Equity Tier 1 capital ratio and thresholds: The comprehensive assessment follows the
capital definition of the CRR/CRD IV with transitional rules and the partial removal of the prudential
filters. As in EBA 2011, the 2014 assessment uses a single capital ratio to assess the outcome of the AQR
and stress test, the Common Equity Tier 1 capital ratio.15
The ECB gives national regulators the
opportunity or encourages them to use different leverage ratios and stricter thresholds. The latter,
however, may not have incentives to make the tests even stricter to contain possible shortfalls.
Risk-weighted assets: Similar to 2011, the 2014 stress test uses a regulatory capital ratio, whose
denominator is risk-weighted assets. Acharya et al. (2014) show that the use of risk-weighted assets to
some extent explains the outcome of the 2011 stress test. Using regulatory capital ratios rests on the
crucial assumption that the risk weights correctly reflect the risks of the asset. Sovereign debt is a
particular example that demonstrates that this is not the case. The sovereign debt crisis made clear that
sovereign debt is risky; however, regulators have not yet made an attempt to increase risk weights, which
14
The Federal Reserve Bank provides the raw data on its website (http://www.federalreserve.gov/bankinforeg/stress-
tests/2014-appendix-a.htm). 15
I discuss the use of multiple ratios in the final section.
PE 528.761 14
are still zero in the standardized approach of Basel III.16
Underestimating the risk of sovereign debt leaves
banks with too much leverage. Moreover, it increases the interconnectedness among institutions, which
exacerbates financial system risks.
Recapitalization: While the purpose of the EBA 2011 stress test was to assess the solvency of individual
banks as well as the resilience of the EU banking system, the EBA 2014 stress test exercise focuses on the
recapitalization of EU banks, i.e., to repair banks’ balance sheets by “identifying and implementing
necessary corrective action” (ECB, 2013). ECB (2014) states that capital shortfalls have to be covered by
raising capital; selling assets should be the exception, and be “distinct from normal operations.” This is a
positive development since stress tests in 2011, as well as the capitalization exercise, required that banks
have to meet a specific capital threshold without actually requiring raising capital.
In July 2014, the ECB outlined how national authorities have to address capital shortfalls with reference
to the Terms of Reference of the Economic and Financial Affairs Council (ECOFIN Council) published
on July 8, 2014 (ECOFIN, 2014). The ECB determined that banks are supposed to use private sources to
access capital. Several banks have used opportunities in 2013 and 2014 to raise capital. If the results of
the comprehensive assessment are disclosed, it is likely that private market funding will be unavailable
for banks with shortfalls. This might be even more problematic if investors are still sceptical as to the
solvency problems of these banks. If private funding is not available, public backstops can be used
subject to state aid rules and the EU Bank Recovery and Resolution Directive (BRRD), which comes into
effect on January 1, 2015. The rules of receiving state aid, and whether or not there needs to be a bail-in
and in what form, however, are still unclear. Moreover, there is the question of whether or not there is a
Europe-wide public backstop for those countries that cannot afford to recapitalize their banks and whether
the European Stability Mechanism (ESM) can eventually be used to provide necessary funding to
recapitalize the banks.
It might not only be exceedingly difficult for banks with shortfalls to raise equity themselves, but this
problem could also extend to short-term funding markets. The ECB may be forced to continue its
unconventional measures and start another LTRO program similar to 2011 to avoid a liquidity crisis. In
other words, missing backstop mechanisms increase the likelihood that the comprehensive assessment
will be substantially diluted to avoid large capital shortfalls and a disruption of short-term funding
markets.
4. SYSTEMIC RISK AND IMPLICATIONS FOR STRESS TESTING
KEY FINDINGS
Stress tests are microprudential, not macroprudential.
Static balance sheets are inconsistent with different forms of systemic risk.
Stress tests should model behavioral effects and how shocks feed from banks to the real sector and
back to the financial sector.
To comprehensively assess systemic risk in macroeconomic stress tests, the scope of the institutions
that are analyzed has to be broadened and include other financial institutions, such as insurance firms
16
Note that banks using the internal ratings-based (IRB) approach can switch to the standardized approach when
calculating capital requirements for sovereign debt. Interestingly, the EBA 2014 stress test explicitly accounts for mark-
to-market losses on sovereign bonds in the available-for-sale (AFS) and held-for-trading (HFT) category by removing
the prudential filters over the 2014-2016 period. Based on my analysis using the most recent EBA disclosure data,
European banks currently hold a large part of their sovereign bonds in the AFS account. While the treatment in the
stress test has to be appreciated, it indicates that the overall regulatory approach as to benefits that are associated with
sovereign debt (which is zero risk weights and, importantly, no concentration limits relative to capital) is inconsistent.
Recent research emphasizes the economic risks that are associated with sovereign debt, such as regulatory capital
arbitrage and moral hazard (Acharya and Steffen, 2014).
15 PE 528.761
or hedge funds. BOX 3. Key Findings: Systemic Risk and Implications for Stress Testing
While European the stress tests in 2010, 2011, and 2014 have a macroprudential objective, the nature of
their execution was still microprudential (Greenlaw et al., 2012). Stress tests should not ignore that the
financial system “is a system” (Tucker, 2009). This has to be due to both the 2007-2009 financial crisis
and the recent sovereign debt crisis. Unfortunately, however, this concept has not yet been incorporated
into the way eurozone banks are regulated.
The EBA and ECB are assessing the risk exposures of banks on an individual level; however, they do not
account for feedback effects or linkages between banks, or between banks and other parts of the financial
system (i.e., they do not conceptualize “systemic risk” and its effect on banks and the macro economy).17
But it is precisely these linkages that might increase the default risk of banks even though they seem to be
well capitalized individually. In other words, too much leverage may accumulate in the financial system
as a whole, because banks do not internalize externalities associated with their investment and financing
decisions.18
In this section, I outline the major forms of systemic risk and how banks are affected. I investigate how
shocks can propagate through the financial system, as well as how they can simultaneously affect
different institutions because of common exposures. I also derive implications of systemic risk for
macroprudential stress testing.
4.1 Systemic Risk and Contagion
4.1.1 Contractual contagion or domino effects
There is a growing literature focusing on banking networks through interbank claims (Gai and Kapadia,
2010; Gai et al., 2011; Haldane and May, 2011; Haldane, 2009). For example, Gai et al. (2011) model a
network of banks that are linked together by their interbank claims. They investigate, once a network
structure is in place, whether and how an initial shock propagates through the system. If a single bank
makes the decision to hoard liquidity, it will become harder for other banks that usually borrow from that
bank to meet their own liquidity condition unless they start hoarding themselves. The structure and
connectivity of the network determines how this shock spreads and where it stops. Contagion can also
spread through deposit contracts (Dasgupta, 2004). Importantly, these domino effects are a consequence
of contractual relationships.
4.1.2 Information contagion
Information contagion does not rely on contractual relationships. While the common exposures of banks
are discussed further below, it is important to note that holdings of similar assets (or asset commonality)
exposes banks to the same risk factors, which can lead to information contagion (Allen et al., 2012).
(Allen et al., 2012) develop a model in which asset commonality increases systemic risk because banks
are short-term financed. If short-term investors receive a signal about the solvency of banks, they might
17
Several studies highlight that the financial system has become more interconnected. Wagner (2010) documents a substantial
increase in correlation of banks’ stock returns over the last decade. Acharya and Steffen (2014b) show that European banks
loaded up on European sovereign debt because zero risk weights increased the interconnectedness between banks. Cai et al.
(2014) find an increase in common exposure to large syndicated corporate loans since the 1990s, not only in the U.S. but also
among European and Asian banks. This highlights how global integration of capital markets increases the interconnectedness
of financial institutions. 18
A few researchers investigate how to internalize systemic risk (Babus, 2013; Castiglionesi and Navarro, 2010; Zawadowski,
2013).
PE 528.761 16
decide not to rollover their investments if solvency risks are high. This issue arises because investors only
receive signals about bank solvency, not about (opaque) bank assets.19
4.1.3 Fire sale contagion
Fire sales occur due to the binding constraints of banks, which could be capital requirements or,
importantly, constraints by short-term investors, i.e., banks are forced to sell assets to repay investors
(Shleifer and Vishny, 2011). Banks are highly leveraged and substantial exposure to short-term funding
such as to money market funds make them particularly vulnerable to stops in short-term funding and the
necessary deleveraging might start a cascade of liquidations, as well as a further drop in asset prices. A
decline in asset prices reduces the net worth of banks, which eventually causes a massive decline in
financial intermediation.
An important problem is that those banks that would be natural buyers of these securities usually engage
in the same strategies and thus invest in similar assets. As they are overleveraged and most likely have to
liquidate these assets themselves, they are not available as buyers. Those market participants that
eventually buy the assets value them less, thereby dislocating prices from fundamental values. This is
precisely what happened in 2008 following the bankruptcy of Lehman Brothers. Commercial banks,
broker-dealers, hedge funds etc. were heavily exposed to short-term funding collateralized with
mortgage-backed securities, which used to be safe securities. After the Lehman Brother default, the short-
term funding market dried up causing investors that specialized in these securities to sell the assets, which
resulted in a massive price decline and losses.
Fire sales have further feedback into the real sector and affect the financial system in several different
ways.
1. Banks start hoarding cash on their balance sheet or increase deposits with central banks as a
precautionary liquidity move (Acharya et al., 2010; Brunnermeier and Sannikov, 2014; Diamond and
Rajan, 2011; Holmstrom and Tirole, 1998).
2. Real investments compete with financial assets. If the price of financial assets is low enough, banks
might use the scarce balance sheet capacity available to them and invest in financial assets rather than
in real assets (He et al., 2010; Shleifer and Vishny, 2010).
3. Banks overinvested in securitized loans before the onset of the crisis to cater to increased investor
demand and the need to deleverage during the crisis, which caused a credit crunch (Shleifer and
Vishny, 2010).
4. Risk-averse investors irrationally believe that asset prices cannot go down and flee into “safe” assets
once they learn that they hold high-risk securities (Gennaioli et al., 2012).
Correlated investments of banks thus can lead to fire sales. Banks tend to leverage and invest too much ex
ante because they do not internalize the fire sale externalities generated through deleveraging in a crisis
(Stein, 2010).
4.1.4 Price complexity externalities
Price complexity externalities are related to fire sale externalities but do not depend on the binding
constraints of banks, such as short-term funding (Caballero and Simsek, 2013). Caballero and Simsek
(2013) develop a model of complexity in financial networks where complexity is conceptualized through
the uncertainty of banks regarding the cross-exposure of other banks in the network. During crises, banks
19
Money market mutual funds in the U.S. withdrew their funding from several European banks completely in fall 2011
because of concerns about banks’ exposure to risky sovereign debt, as well as the solvency of these institutions (Acharya and
Steffen, 2014b).
17 PE 528.761
typically become more concerned about the exposure of their counterparties and of the counterparties’
counterparties’ exposures, etc.
4.2 Common Exposures
While idiosyncratic risk is an important concern, the high degree of interconnectedness in the financial
system exposes it to common or system-wide shocks (Hellwig, 1995). Relevant macro risk factors are, for
example, interest rates, exchange rates or real estate prices. Hellwig (1995, 2014a) provides examples
about the roles of common shocks in various financial crises since the 1980s:20
1. The savings and loan crisis in the U.S. in the 1980s and 1990s was caused by maturity mismatch of the
asset and liability side of banks’ balance sheets and a shock (i.e., increase) to interest rates.
2. The Asian financial crisis in the 1990s was associated with exchange rate risks.
3. The recent crises in Ireland and Spain were associated with a decline in real estate prices.
4. The 2007-2009 global financial crisis involved a decline in real estate prices, as well as various forms
of contagion magnifying the extent of the crisis.
Importantly, these shocks to macro risk factors might be subtler as they are “hidden” in counterparty
(credit risk) exposures. For example, over the last few years, banks have developed innovative risk
management techniques to hedge certain types of risks through products such as credit default swaps.
This was an important catalyst during the 2007-2009 financial crisis. AIG insured virtually all banks’
exposure to mortgage-backed securities. While banks’ exposure was transformed into counterparty credit
risk to AIG, AIG’s risk was driven by real estate prices, which increased the correlation among all banks
insured by AIG.
4.3 Implications for stress testing
Assessing linkages between banks is important for monitoring the stability of the financial system and
should be a key component in future macroprudential stress tests. The different forms of systemic risk
outlined above and how banks are interconnected and exposed to common shocks have several
implications for the design of stress tests.
Empirical measures of asset commonality need to be developed to quantify the extent of portfolio
overlap. Cai et al. (2014) investigate this using data from the syndicated loan market in the U.S. since
1989. They construct a novel measure of asset commonality in corporate loans and find an interesting
result. While banks diversify though loan syndication and reduce idiosyncratic default risk, asset
commonality increases over time, as does systemic risk. They relate their measure to market-based
measures of systemic risk such as SRISK, co-movement value-at-risk (CoVaR), and distressed insurance
premium (DIP). They show that asset commonality explains differences in systemic risk in the cross-
section of banks, particularly during recessions.21
The data collected during the AQR exercise should be very valuable to the construction of these
measures. The loan market interconnectedness measure developed in Cai et al. (2014) provides a first step
in quantifying banks’ exposures. Regulators with more detailed data can extend the analyses investigating
and monitoring specific industry overlap, common exposures to leveraged loans or, for example,
exchange rate risks that might be hidden in these loans.
However, if the exposures to common shocks are hidden as described above, identifying common
exposures on banks’ balance sheets might be insufficient. How do banks manage their risks? Who are the
counterparties and where do the risks eventually accumulate? If the EBA had conducted the same stress
20
Hellwig (1995, 2014a) provides a more extensive discussion, as well as further references. 21
CoVaR is developed in Adrian and Brunnermeier (2010) and DIP in Huang et al. (2011).
PE 528.761 18
test back in 2006 or 2007, would they have identified the key risk factors during the 2007-2009 financial
crisis and, importantly, the exposure European banks had towards these factors? This is hard to believe.
As a simple example, the tremendous exposure of European banks to AIG would not have been
identified. Credit default swaps or other hedge contracts probably would not have been disclosed either.
Moreover, the scope of the stress tests (as conducted today) is limited to European banks. The financial
system, however, not only includes banks, but also insurance companies (such as AIG) and the shadow
banking system (such as money market funds, hedge funds, private equity, etc.), which becomes
increasingly important. Even though the number of banks that are part of the EBA 2014 stress test has
substantially increased since 2010, future stress tests should consider other non-bank financial institutions
in their assessment of systemic risk.
Similarly, the static balance sheet assumption that underlies the current EBA 2014 stress test is
inconsistent with the different forms of systemic risk and contagion described above. This approach does
not account for a deleveraging process of a banking system that has invested too much and accrued too
much debt during credit booms. Banks have to rebalance their portfolios, sell assets, and reduce balance
sheets. Moreover, securities in available-for-sale or trading portfolios are marked-to-market and price
effects will be magnified through fire sale externalities.
Future stress tests should model possible feedback effects from the banking sector to the real sector. As
argued above, banks might engage in precautionary liquidity hoarding, which would reduce credit supply
to firms and might lead to a credit crunch. A deteriorating economy suggests higher default rates of firms,
which will in turn affect the banking sector. Elevated default probabilities increase loss given defaults as
well (maybe because collateral becomes less valuable if the usual buyers are not available to purchase the
collateral), which increases expected losses, leads to higher impairment charges, and a further reduction
in bank equity.
The next section provides alternative macroprudential stress tests that can serve as a benchmark for
regulatory stress tests using market data.
5. ALTERNATIVE STRESS TESTING MODELS USING PUBLIC DATA
KEY FINDINGS
Stress test scenarios that are based on a large number of risk factors are subject to model
misspecification, which indicates that other models would be more appropriate as benchmarks.
It was not the methodology of the European stress test (EBA 2011) that caused the deficiencies
of the tests, but rather the reliance on Basel II risk weights.
Required capitalization based on a Core Tier 1 ratio as used in the EBA 2011 stress tests is
inadequate and does not compare to other (benchmark) stress test models because of the use of
risk-weighted assets.
Market-based stress scenarios can be used to predict possible stress in access to wholesale
funding, such as money market funds.
Stress tests based on market data incorporate externalities associated with systemic risk, a key
component that is still missing in regulatory stress tests. BOX 4. Key Findings: Alternative Stress Test Models
5.1 Alternative Macroprudential Stress Test Models
Given the incentive problems of financial institutions carrying out the comprehensive assessment, as well
at the shortcomings of regulatory stress tests, it might be advantageous to have benchmark models against
which one can evaluate the outcomes of regulatory assessments. Steffen (2011), Acharya and Steffen
(2013), and Acharya et al. (2013) report interesting alternative stress tests using public data. These
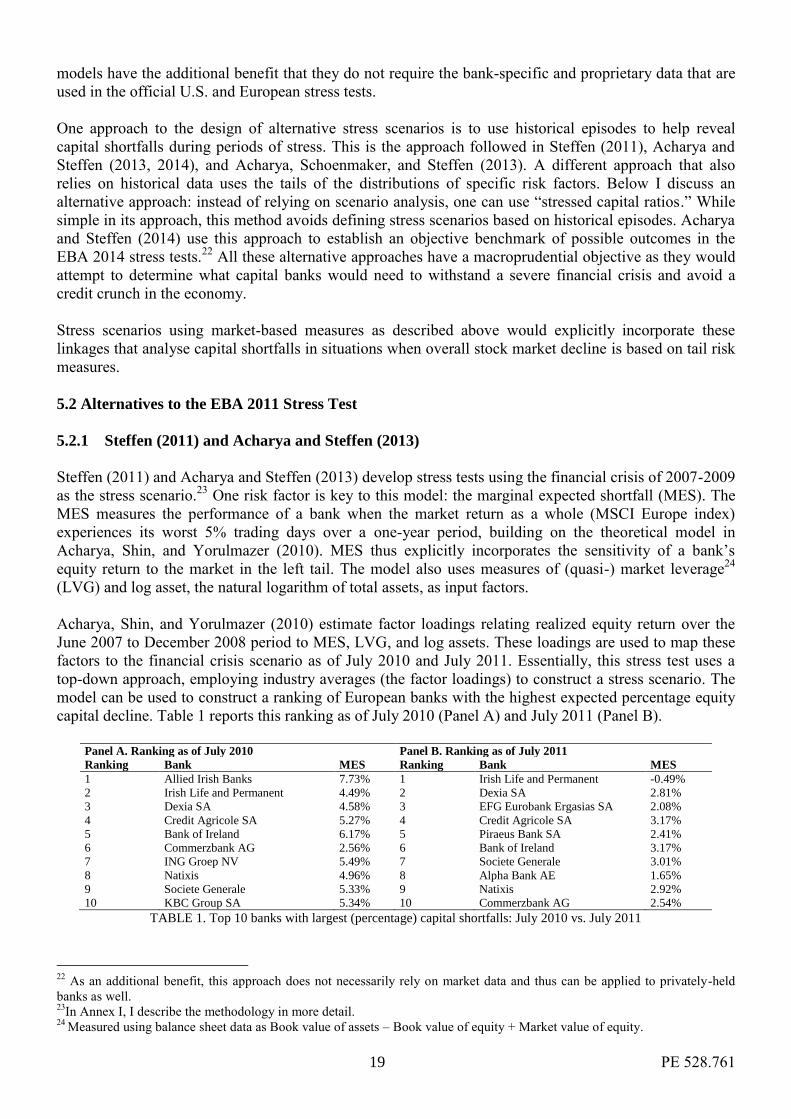
19 PE 528.761
models have the additional benefit that they do not require the bank-specific and proprietary data that are
used in the official U.S. and European stress tests.
One approach to the design of alternative stress scenarios is to use historical episodes to help reveal
capital shortfalls during periods of stress. This is the approach followed in Steffen (2011), Acharya and
Steffen (2013, 2014), and Acharya, Schoenmaker, and Steffen (2013). A different approach that also
relies on historical data uses the tails of the distributions of specific risk factors. Below I discuss an
alternative approach: instead of relying on scenario analysis, one can use “stressed capital ratios.” While
simple in its approach, this method avoids defining stress scenarios based on historical episodes. Acharya
and Steffen (2014) use this approach to establish an objective benchmark of possible outcomes in the
EBA 2014 stress tests.22
All these alternative approaches have a macroprudential objective as they would
attempt to determine what capital banks would need to withstand a severe financial crisis and avoid a
credit crunch in the economy.
Stress scenarios using market-based measures as described above would explicitly incorporate these
linkages that analyse capital shortfalls in situations when overall stock market decline is based on tail risk
measures.
5.2 Alternatives to the EBA 2011 Stress Test
5.2.1 Steffen (2011) and Acharya and Steffen (2013)
Steffen (2011) and Acharya and Steffen (2013) develop stress tests using the financial crisis of 2007-2009
as the stress scenario.23
One risk factor is key to this model: the marginal expected shortfall (MES). The
MES measures the performance of a bank when the market return as a whole (MSCI Europe index)
experiences its worst 5% trading days over a one-year period, building on the theoretical model in
Acharya, Shin, and Yorulmazer (2010). MES thus explicitly incorporates the sensitivity of a bank’s
equity return to the market in the left tail. The model also uses measures of (quasi-) market leverage24
(LVG) and log asset, the natural logarithm of total assets, as input factors.
Acharya, Shin, and Yorulmazer (2010) estimate factor loadings relating realized equity return over the
June 2007 to December 2008 period to MES, LVG, and log assets. These loadings are used to map these
factors to the financial crisis scenario as of July 2010 and July 2011. Essentially, this stress test uses a
top-down approach, employing industry averages (the factor loadings) to construct a stress scenario. The
model can be used to construct a ranking of European banks with the highest expected percentage equity
capital decline. Table 1 reports this ranking as of July 2010 (Panel A) and July 2011 (Panel B).
Panel A. Ranking as of July 2010 Panel B. Ranking as of July 2011
Ranking Bank MES Ranking Bank MES
1 Allied Irish Banks 7.73% 1 Irish Life and Permanent -0.49%
2 Irish Life and Permanent 4.49% 2 Dexia SA 2.81%
3 Dexia SA 4.58% 3 EFG Eurobank Ergasias SA 2.08%
4 Credit Agricole SA 5.27% 4 Credit Agricole SA 3.17%
5 Bank of Ireland 6.17% 5 Piraeus Bank SA 2.41%
6 Commerzbank AG 2.56% 6 Bank of Ireland 3.17%
7 ING Groep NV 5.49% 7 Societe Generale 3.01%
8 Natixis 4.96% 8 Alpha Bank AE 1.65%
9 Societe Generale 5.33% 9 Natixis 2.92%
10 KBC Group SA 5.34% 10 Commerzbank AG 2.54%
TABLE 1. Top 10 banks with largest (percentage) capital shortfalls: July 2010 vs. July 2011
22
As an additional benefit, this approach does not necessarily rely on market data and thus can be applied to privately-held
banks as well. 23
In Annex I, I describe the methodology in more detail. 24
Measured using balance sheet data as Book value of assets – Book value of equity + Market value of equity.
PE 528.761 20
As of July 2010, the banks in Ireland led the list of financial institutions with the largest expected capital
shortfalls.25
Ireland requested financial assistance from the European Union, the euro-member states, and
the International Monetary Fund (IMF) in November 2010; it received an overall support package of
€67.5 billion.26
In the 2010 and 2011 shortfall rankings in Table 1, banks in Belgium and France, specifically Dexia SA,
Credit Agricole SA, and Societe Generale, moved to the top of Europe’s systemic financial institutions. In
June 2010, Dexia SA exited the state guarantee program under which it could issue state guaranteed
short- and long-term debt. Dexia SA entered the program in October 2008, after it had been bailed out. In
October 2011, after having reported €4 billion in losses largely due to bad investments, such as in
peripheral sovereign bonds, the bank was broken up.
Overall, while the 2010 and 2011 stress tests basically gave a free pass to the banks that were most at risk,
the alternative stress test (which can be easily implemented at low cost) “correctly” predicted which
banks eventually got into trouble. Acharya and Steffen (2013) show that both in 2007 and 2008 as well as
in 2010 and 2011, the capital shortfalls of their model were highly correlated with funds used to bailout
these banks. Moreover, Acharya and Steffen (2014) document that U.S. money market funds were
completely withdrawing their funds from the French lenders on top of the list in this ranking.
5.2.2 Acharya et al. (2014)
Acharya et al. (2014) also use a stress test model based on public market data. Their approach was
developed in Acharya et al. (2010) and Brownlees and Engle (2011). The outcome measure “SRISK” is
the amount of capital a bank would need to raise in the event of a crisis. SRISK depends on a bank’s
stock return during a crisis, as well as its market leverage. The stress scenario they employ defines a crisis
as a 40% global stock market decline over a six-month period. Based on the (historical) co-movement of
a bank’s equity return and the stock market index, which is called a long-run marginal expected shortfall
(LRMES), they estimate the decline in the market value of equity over the simulation period. Moreover,
the model specifies a regulatory capital ratio of 8% in the U.S. and 5.5% in Europe that has to be met.27
They compare the projected losses of the regulatory stress tests in Europe to SRISK, as well as realized
losses during the fall of 2011. While the EBA 2011 stress test has been widely criticized because its stress
scenarios were too weak or because it did not address sovereign risk adequately,28
these authors document
that the projected losses from the EBA 2011 stress tests correlate significantly with the realized losses
during the severe economic conditions in fall 2011.
More importantly, Acharya et al. (2014) find that the outcome of the EBA stress tests (i.e., the required
capitalization of the banks) was uncorrelated with SRISK, and in terms of magnitude, inadequate and not
comparable. This discrepancy arises because the EBA 2011 stress tests use the Core Tier 1 capital ratio
(Basel II) as the measure of capitalization. This ratio is defined as core Tier 1 Capital relative to risk-
weighted assets. This is problematic as risk weights do not change over time when asset risks change;
thus, they do not reflect their actual risk. Zero risk weights on sovereign debt are an important example as
banks engage in regulatory arbitrage, building substantial exposure to risky sovereign debt of peripheral
25
Irish Life and Permanent (ranked first in the July 2011 ranking) was nationalized in October 2011. 26
A detailed analysis of the financial assistance package for Ireland and other states is provided on the website in the
Economic and Financial Affairs section of the European Commission
(http://ec.europa.eu/economy_finance/eu_borrower/ireland/index_en.htm).
27 The results of this methodology are available on New York University’s Volatility Laboratory website (V-Lab) where
systemic risk rankings are updated weekly both globally and in the U.S. (see http://Vlab.stern.nyu.edu/). 28
EBA 2011 considered sovereign risk only in the trading book even though most of these assets were held in the banking
book.
21 PE 528.761
countries without holding equity capital (Acharya and Steffen, 2014b). This behavior leads to excessive
leverage in the banking system.
They conjecture that forbearance (because banks were not required to raise capital) did not come from the
methodology of the stress test; it arose from the use of risk weights when determining the level of
capitalization after the losses had been accounted for. Similar to my earlier argument, this result indicates
the appropriateness of using multiple models. Market-based stress tests such as those described above do
not rely on flawed risk weights and incorporate actual asset risk. Moreover and alternatively, other
measures of bank capitalization should be used that do not rely on risk weight; instead, they should rely
on total assets, such as the (Basel III) leverage ratio.
5.3 An Alternative to the EBA 2014 Stress Test
Acharya and Steffen (2014a) propose an alternative stress test that can serve as a benchmark for stress
tests. As stated above, the advantage of this approach is to use stressed capital ratios and to avoid using
historical episodes. Moreover, it is hardly feasible to design stress scenarios that account for all future
shocks that might affect a financial system.
To account for potential losses in future stress scenarios, Acharya and Steffen (2014a) employ four
stressed capital shortfall measures. The first two measures raise the level of capital requirements, while
the remaining two measures (also) account for losses:
1. Book Capital Shortfall: Using book values of equity and assets, the less stringent benchmark is a
leverage ratio (book equity/assets) of 4% and the more stringent benchmark is a 7% leverage ratio.
Haldane (2012) reports that a 4% capital ratio (7% for the largest financial institutions) would have
been necessary to guard against bank failure during the recent financial crisis.
2. Market Capital Shortfall: Similarly, using the market value of equity and assets, the less stringent
benchmark is a leverage ratio (market equity/assets) of 4% and the more stringent benchmark is a 7%
leverage ratio.
3. SRISK or Capital Shortfall in a Systemic Crisis: Acharya and Steffen (2014a) assume a systemic
financial crisis with a global stock market decline of 40%. SRISK is our measure for a bank’s capital
shortfall in this scenario, assuming a 5.5% prudential capital ratio with losses estimated using the V-
Lab methodology to estimate the downside risk of bank stock returns.29
While this scenario and the
resulting SRISK measure use market data and market equity (instead of book equity) in determining
leverage, the approach is conceptually similar to that of the European stress tests, which is to estimate
losses in a stress scenario and determine the capital shortfall between a prudential capital requirement
and the remaining equity after losses.
4. Capital Shortfall after Write Down: Acharya and Steffen (2014a) assume that banks have to write
down their entire non-performing loan portfolio net of reserves during a severe financial crisis. They
account for this write down when calculating the capital shortfall of the banks using the book capital
shortfall measures (which are adjusted for the write downs) and comparing them to a threshold of 4%.
This shortfall measure is motivated by theory that posits that under-capitalized banks continue to
provide funding to unhealthy borrowers to prevent a write down of their loans (“zombie lending”) and
that a forced write down can ameliorate the zombie lending problem.
29
This capital shortfall measure has been implemented based on Acharya at al. (2012) and Brownlees and Engle (2013). The
data are provided by New York University’s V-Lab (http://vlab.stern.nyu.edu/welcome/risk/). The theoretical motivation for
the measure can be found in Acharya et al. (2010). SRISK has been documented to be a comprehensive measure that includes
losses due to both a bank’s investments in assets and its exposure to fragile liabilities, which in the current European context
relate, respectively, to holdings of peripheral sovereign bonds and (short-term) funding risk, such as U.S. money market fund
withdrawals and other wholesale investors (Figure 5).
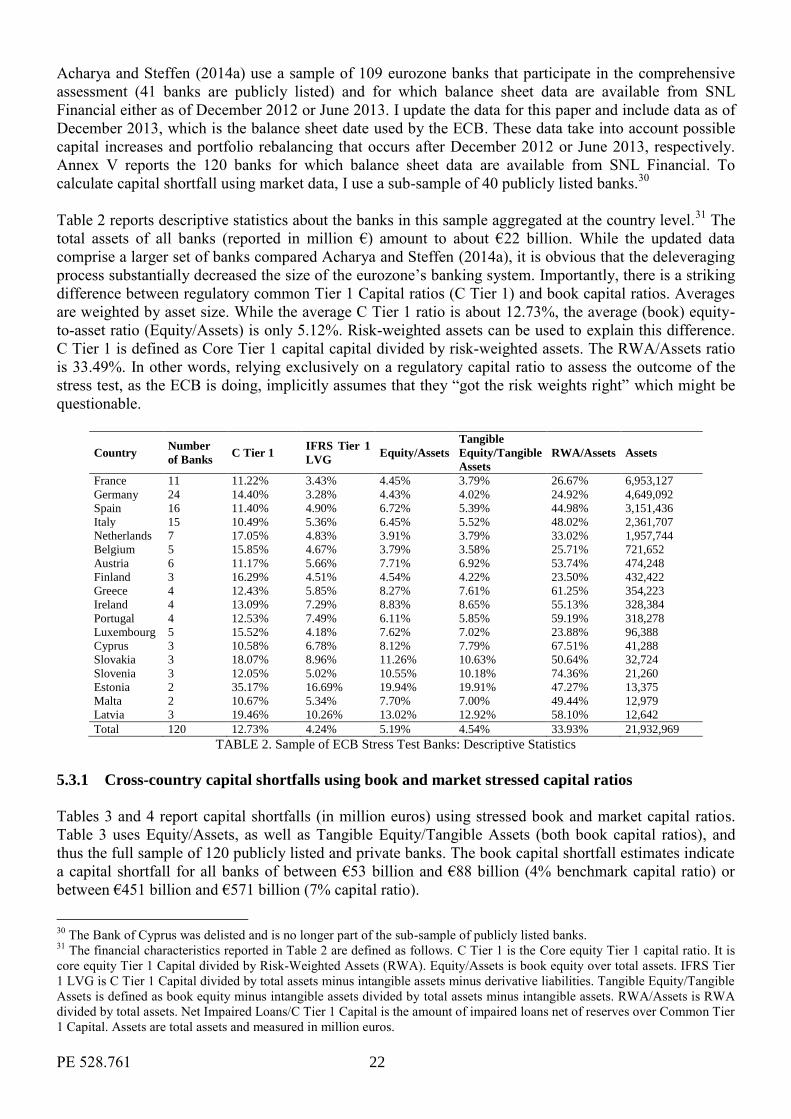
PE 528.761 22
Acharya and Steffen (2014a) use a sample of 109 eurozone banks that participate in the comprehensive
assessment (41 banks are publicly listed) and for which balance sheet data are available from SNL
Financial either as of December 2012 or June 2013. I update the data for this paper and include data as of
December 2013, which is the balance sheet date used by the ECB. These data take into account possible
capital increases and portfolio rebalancing that occurs after December 2012 or June 2013, respectively.
Annex V reports the 120 banks for which balance sheet data are available from SNL Financial. To
calculate capital shortfall using market data, I use a sub-sample of 40 publicly listed banks.30
Table 2 reports descriptive statistics about the banks in this sample aggregated at the country level.31
The
total assets of all banks (reported in million €) amount to about €22 billion. While the updated data
comprise a larger set of banks compared Acharya and Steffen (2014a), it is obvious that the deleveraging
process substantially decreased the size of the eurozone’s banking system. Importantly, there is a striking
difference between regulatory common Tier 1 Capital ratios (C Tier 1) and book capital ratios. Averages
are weighted by asset size. While the average C Tier 1 ratio is about 12.73%, the average (book) equity-
to-asset ratio (Equity/Assets) is only 5.12%. Risk-weighted assets can be used to explain this difference.
C Tier 1 is defined as Core Tier 1 capital capital divided by risk-weighted assets. The RWA/Assets ratio
is 33.49%. In other words, relying exclusively on a regulatory capital ratio to assess the outcome of the
stress test, as the ECB is doing, implicitly assumes that they “got the risk weights right” which might be
questionable.
Country Number
of Banks C Tier 1
IFRS Tier 1
LVG Equity/Assets
Tangible
Equity/Tangible
Assets
RWA/Assets Assets
France 11 11.22% 3.43% 4.45% 3.79% 26.67% 6,953,127
Germany 24 14.40% 3.28% 4.43% 4.02% 24.92% 4,649,092
Spain 16 11.40% 4.90% 6.72% 5.39% 44.98% 3,151,436
Italy 15 10.49% 5.36% 6.45% 5.52% 48.02% 2,361,707
Netherlands 7 17.05% 4.83% 3.91% 3.79% 33.02% 1,957,744
Belgium 5 15.85% 4.67% 3.79% 3.58% 25.71% 721,652
Austria 6 11.17% 5.66% 7.71% 6.92% 53.74% 474,248
Finland 3 16.29% 4.51% 4.54% 4.22% 23.50% 432,422
Greece 4 12.43% 5.85% 8.27% 7.61% 61.25% 354,223
Ireland 4 13.09% 7.29% 8.83% 8.65% 55.13% 328,384
Portugal 4 12.53% 7.49% 6.11% 5.85% 59.19% 318,278
Luxembourg 5 15.52% 4.18% 7.62% 7.02% 23.88% 96,388
Cyprus 3 10.58% 6.78% 8.12% 7.79% 67.51% 41,288
Slovakia 3 18.07% 8.96% 11.26% 10.63% 50.64% 32,724
Slovenia 3 12.05% 5.02% 10.55% 10.18% 74.36% 21,260
Estonia 2 35.17% 16.69% 19.94% 19.91% 47.27% 13,375
Malta 2 10.67% 5.34% 7.70% 7.00% 49.44% 12,979
Latvia 3 19.46% 10.26% 13.02% 12.92% 58.10% 12,642
Total 120 12.73% 4.24% 5.19% 4.54% 33.93% 21,932,969
TABLE 2. Sample of ECB Stress Test Banks: Descriptive Statistics
5.3.1 Cross-country capital shortfalls using book and market stressed capital ratios
Tables 3 and 4 report capital shortfalls (in million euros) using stressed book and market capital ratios.
Table 3 uses Equity/Assets, as well as Tangible Equity/Tangible Assets (both book capital ratios), and
thus the full sample of 120 publicly listed and private banks. The book capital shortfall estimates indicate
a capital shortfall for all banks of between €53 billion and €88 billion (4% benchmark capital ratio) or
between €451 billion and €571 billion (7% capital ratio).
30
The Bank of Cyprus was delisted and is no longer part of the sub-sample of publicly listed banks. 31
The financial characteristics reported in Table 2 are defined as follows. C Tier 1 is the Core equity Tier 1 capital ratio. It is
core equity Tier 1 Capital divided by Risk-Weighted Assets (RWA). Equity/Assets is book equity over total assets. IFRS Tier
1 LVG is C Tier 1 Capital divided by total assets minus intangible assets minus derivative liabilities. Tangible Equity/Tangible
Assets is defined as book equity minus intangible assets divided by total assets minus intangible assets. RWA/Assets is RWA
divided by total assets. Net Impaired Loans/C Tier 1 Capital is the amount of impaired loans net of reserves over Common Tier
1 Capital. Assets are total assets and measured in million euros.
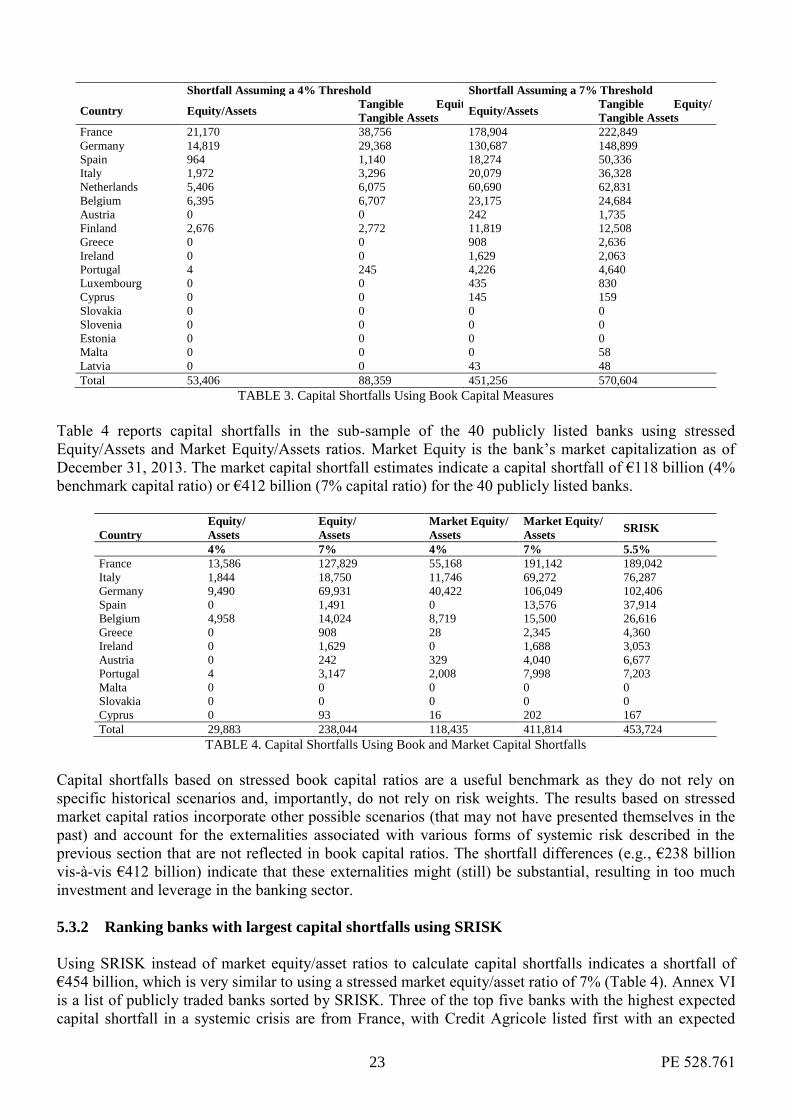
23 PE 528.761
Shortfall Assuming a 4% Threshold Shortfall Assuming a 7% Threshold
Country Equity/Assets Tangible Equity/
Tangible Assets Equity/Assets
Tangible Equity/
Tangible Assets
France 21,170 38,756 178,904 222,849
Germany 14,819 29,368 130,687 148,899
Spain 964 1,140 18,274 50,336
Italy 1,972 3,296 20,079 36,328
Netherlands 5,406 6,075 60,690 62,831
Belgium 6,395 6,707 23,175 24,684
Austria 0 0 242 1,735
Finland 2,676 2,772 11,819 12,508
Greece 0 0 908 2,636
Ireland 0 0 1,629 2,063
Portugal 4 245 4,226 4,640
Luxembourg 0 0 435 830
Cyprus 0 0 145 159
Slovakia 0 0 0 0
Slovenia 0 0 0 0
Estonia 0 0 0 0
Malta 0 0 0 58
Latvia 0 0 43 48
Total 53,406 88,359 451,256 570,604
TABLE 3. Capital Shortfalls Using Book Capital Measures
Table 4 reports capital shortfalls in the sub-sample of the 40 publicly listed banks using stressed
Equity/Assets and Market Equity/Assets ratios. Market Equity is the bank’s market capitalization as of
December 31, 2013. The market capital shortfall estimates indicate a capital shortfall of €118 billion (4%
benchmark capital ratio) or €412 billion (7% capital ratio) for the 40 publicly listed banks.
Country
Equity/
Assets
Equity/
Assets
Market Equity/
Assets
Market Equity/
Assets SRISK
4% 7% 4% 7% 5.5%
France 13,586 127,829 55,168 191,142 189,042
Italy 1,844 18,750 11,746 69,272 76,287
Germany 9,490 69,931 40,422 106,049 102,406
Spain 0 1,491 0 13,576 37,914
Belgium 4,958 14,024 8,719 15,500 26,616
Greece 0 908 28 2,345 4,360
Ireland 0 1,629 0 1,688 3,053
Austria 0 242 329 4,040 6,677
Portugal 4 3,147 2,008 7,998 7,203
Malta 0 0 0 0 0
Slovakia 0 0 0 0 0
Cyprus 0 93 16 202 167
Total 29,883 238,044 118,435 411,814 453,724
TABLE 4. Capital Shortfalls Using Book and Market Capital Shortfalls
Capital shortfalls based on stressed book capital ratios are a useful benchmark as they do not rely on
specific historical scenarios and, importantly, do not rely on risk weights. The results based on stressed
market capital ratios incorporate other possible scenarios (that may not have presented themselves in the
past) and account for the externalities associated with various forms of systemic risk described in the
previous section that are not reflected in book capital ratios. The shortfall differences (e.g., €238 billion
vis-à-vis €412 billion) indicate that these externalities might (still) be substantial, resulting in too much
investment and leverage in the banking sector.
5.3.2 Ranking banks with largest capital shortfalls using SRISK
Using SRISK instead of market equity/asset ratios to calculate capital shortfalls indicates a shortfall of
€454 billion, which is very similar to using a stressed market equity/asset ratio of 7% (Table 4). Annex VI
is a list of publicly traded banks sorted by SRISK. Three of the top five banks with the highest expected
capital shortfall in a systemic crisis are from France, with Credit Agricole listed first with an expected
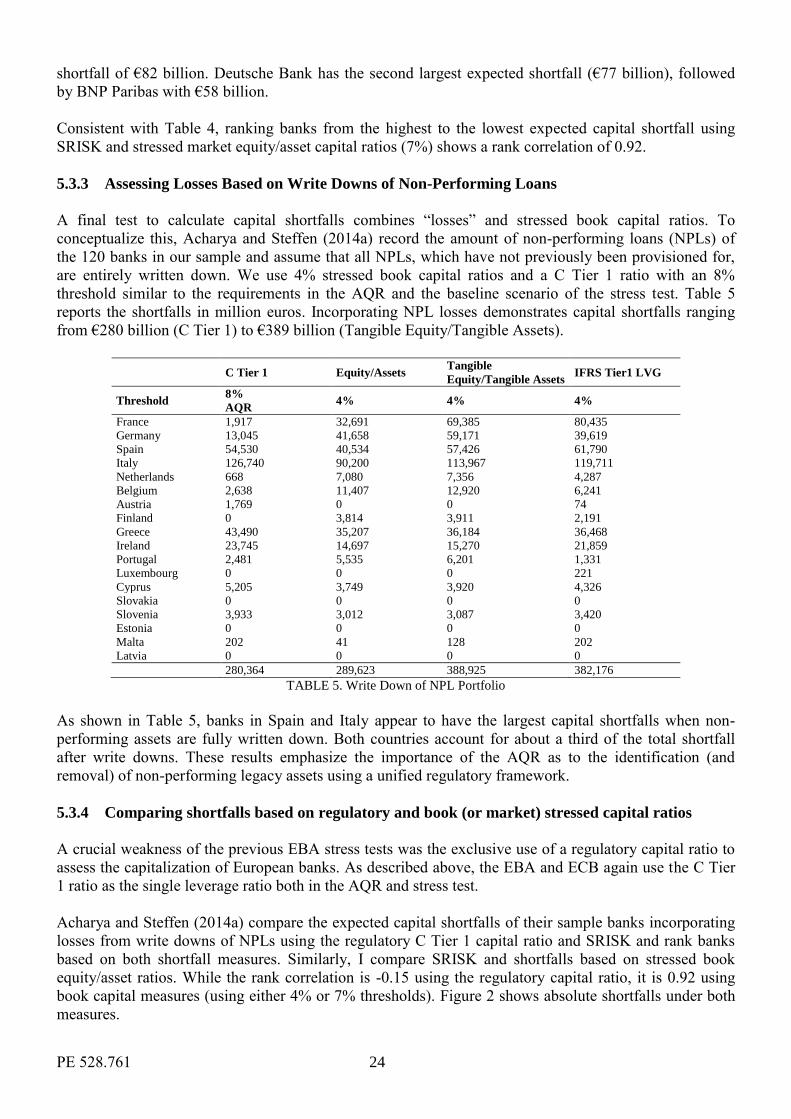
PE 528.761 24
shortfall of €82 billion. Deutsche Bank has the second largest expected shortfall (€77 billion), followed
by BNP Paribas with €58 billion.
Consistent with Table 4, ranking banks from the highest to the lowest expected capital shortfall using
SRISK and stressed market equity/asset capital ratios (7%) shows a rank correlation of 0.92.
5.3.3 Assessing Losses Based on Write Downs of Non-Performing Loans
A final test to calculate capital shortfalls combines “losses” and stressed book capital ratios. To
conceptualize this, Acharya and Steffen (2014a) record the amount of non-performing loans (NPLs) of
the 120 banks in our sample and assume that all NPLs, which have not previously been provisioned for,
are entirely written down. We use 4% stressed book capital ratios and a C Tier 1 ratio with an 8%
threshold similar to the requirements in the AQR and the baseline scenario of the stress test. Table 5
reports the shortfalls in million euros. Incorporating NPL losses demonstrates capital shortfalls ranging
from €280 billion (C Tier 1) to €389 billion (Tangible Equity/Tangible Assets).
C Tier 1 Equity/Assets Tangible
Equity/Tangible Assets IFRS Tier1 LVG
Threshold 8%
AQR 4% 4% 4%
France 1,917 32,691 69,385 80,435
Germany 13,045 41,658 59,171 39,619
Spain 54,530 40,534 57,426 61,790
Italy 126,740 90,200 113,967 119,711
Netherlands 668 7,080 7,356 4,287
Belgium 2,638 11,407 12,920 6,241
Austria 1,769 0 0 74
Finland 0 3,814 3,911 2,191
Greece 43,490 35,207 36,184 36,468
Ireland 23,745 14,697 15,270 21,859
Portugal 2,481 5,535 6,201 1,331
Luxembourg 0 0 0 221
Cyprus 5,205 3,749 3,920 4,326
Slovakia 0 0 0 0
Slovenia 3,933 3,012 3,087 3,420
Estonia 0 0 0 0
Malta 202 41 128 202
Latvia 0 0 0 0
280,364 289,623 388,925 382,176
TABLE 5. Write Down of NPL Portfolio
As shown in Table 5, banks in Spain and Italy appear to have the largest capital shortfalls when non-
performing assets are fully written down. Both countries account for about a third of the total shortfall
after write downs. These results emphasize the importance of the AQR as to the identification (and
removal) of non-performing legacy assets using a unified regulatory framework.
5.3.4 Comparing shortfalls based on regulatory and book (or market) stressed capital ratios
A crucial weakness of the previous EBA stress tests was the exclusive use of a regulatory capital ratio to
assess the capitalization of European banks. As described above, the EBA and ECB again use the C Tier
1 ratio as the single leverage ratio both in the AQR and stress test.
Acharya and Steffen (2014a) compare the expected capital shortfalls of their sample banks incorporating
losses from write downs of NPLs using the regulatory C Tier 1 capital ratio and SRISK and rank banks
based on both shortfall measures. Similarly, I compare SRISK and shortfalls based on stressed book
equity/asset ratios. While the rank correlation is -0.15 using the regulatory capital ratio, it is 0.92 using
book capital measures (using either 4% or 7% thresholds). Figure 2 shows absolute shortfalls under both
measures.
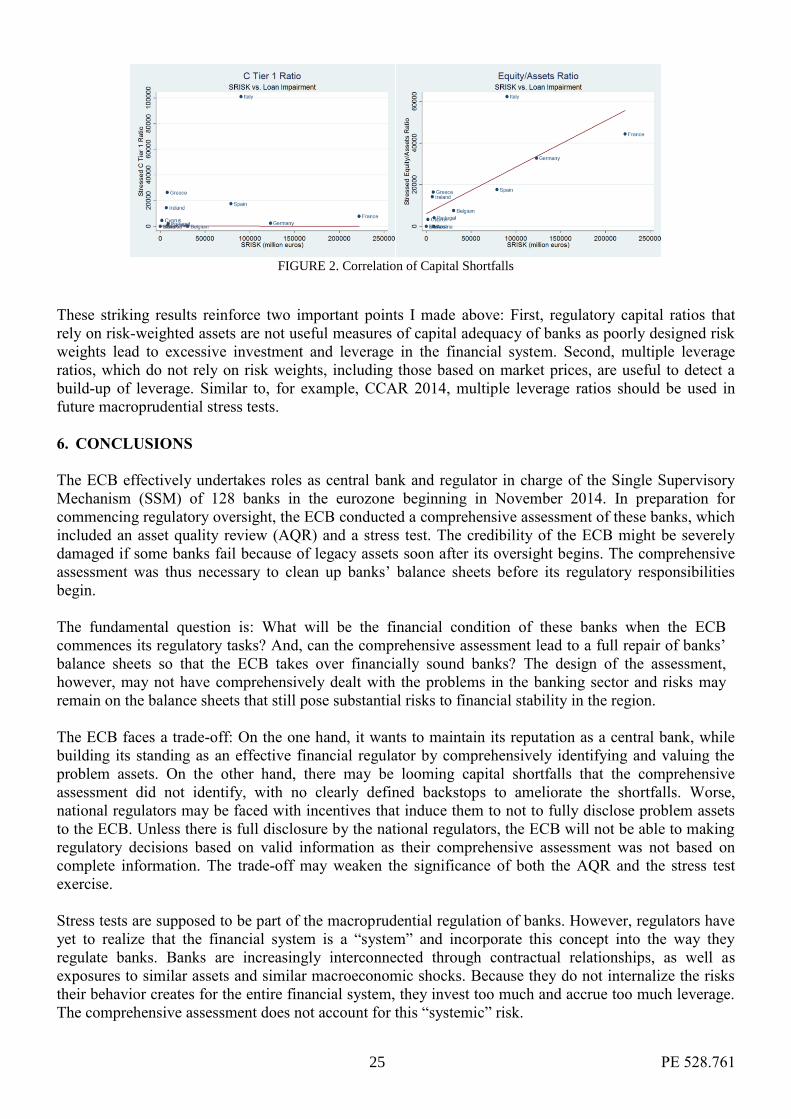
25 PE 528.761
FIGURE 2. Correlation of Capital Shortfalls
These striking results reinforce two important points I made above: First, regulatory capital ratios that
rely on risk-weighted assets are not useful measures of capital adequacy of banks as poorly designed risk
weights lead to excessive investment and leverage in the financial system. Second, multiple leverage
ratios, which do not rely on risk weights, including those based on market prices, are useful to detect a
build-up of leverage. Similar to, for example, CCAR 2014, multiple leverage ratios should be used in
future macroprudential stress tests.
6. CONCLUSIONS
The ECB effectively undertakes roles as central bank and regulator in charge of the Single Supervisory
Mechanism (SSM) of 128 banks in the eurozone beginning in November 2014. In preparation for
commencing regulatory oversight, the ECB conducted a comprehensive assessment of these banks, which
included an asset quality review (AQR) and a stress test. The credibility of the ECB might be severely
damaged if some banks fail because of legacy assets soon after its oversight begins. The comprehensive
assessment was thus necessary to clean up banks’ balance sheets before its regulatory responsibilities
begin.
The fundamental question is: What will be the financial condition of these banks when the ECB
commences its regulatory tasks? And, can the comprehensive assessment lead to a full repair of banks’
balance sheets so that the ECB takes over financially sound banks? The design of the assessment,
however, may not have comprehensively dealt with the problems in the banking sector and risks may
remain on the balance sheets that still pose substantial risks to financial stability in the region.
The ECB faces a trade-off: On the one hand, it wants to maintain its reputation as a central bank, while
building its standing as an effective financial regulator by comprehensively identifying and valuing the
problem assets. On the other hand, there may be looming capital shortfalls that the comprehensive
assessment did not identify, with no clearly defined backstops to ameliorate the shortfalls. Worse,
national regulators may be faced with incentives that induce them to not to fully disclose problem assets
to the ECB. Unless there is full disclosure by the national regulators, the ECB will not be able to making
regulatory decisions based on valid information as their comprehensive assessment was not based on
complete information. The trade-off may weaken the significance of both the AQR and the stress test
exercise.
Stress tests are supposed to be part of the macroprudential regulation of banks. However, regulators have
yet to realize that the financial system is a “system” and incorporate this concept into the way they
regulate banks. Banks are increasingly interconnected through contractual relationships, as well as
exposures to similar assets and similar macroeconomic shocks. Because they do not internalize the risks
their behavior creates for the entire financial system, they invest too much and accrue too much leverage.
The comprehensive assessment does not account for this “systemic” risk.
PE 528.761 26
Taken together, the trade-off faced by the ECB as well as the omission of systemic risk suggests that the
ECB may not be able to reach its objective to identify the problem assets and cleanup the balance sheets
of 128 eurozone banks before beginning its regulatory responsibilities, thereby putting its reputation in
danger and leaving the financial system in a vulnerable state. The ECB may thus have to continue
providing assistance to banks whose solvency is questionable. Importantly, a sustainable growth path still
eludes the eurozone countries and the results in this report further increase doubts that the eurozone can
escape this low-growth environment in the near future.
In this report, I describe alternative stress test models that rely on public data and account for systemic
risk. These models have generated results consistent with economic developments in 2010 and 2011 and
provide interesting results using the sample of the banks that take part in the ECB’s 2014 comprehensive
assessment. These models can serve as a credible benchmark for future comprehensive assessments.
27 PE 528.761
REFERENCES
Acharya, V., Engle, R., Pierret, D., 2014. Testing macroprudential stress tests: The risk of regulatory
risk weights. J. Monet. Econ. 65, 36–53. doi:10.1016/j.jmoneco.2014.04.014
Acharya, V. V., Engle, R., Richardson, M., 2012. Capital Shortfall: A New Approach to Ranking and
Regulating Systemic Risks. Am. Econ. Rev. 102, 59–64. doi:10.1257/aer.102.3.59
Acharya, V. V., Schoenmaker, D., Steffen, S., 2013. How much capital do European banks need?
Some estimates. VoxEu.
Acharya, V. V., Shin, H.S., Yorulmazer, T., 2010. Crisis Resolution and Bank Liquidity. Rev. Financ.
Stud. 24, 2166–2205. doi:10.1093/rfs/hhq073
Acharya, V. V., Steffen, S., 2013. Analyzing Systemic Risk of the European Banking Sector, in:
Fouque, J.P., Langsam, J. (Eds.), Handbook on Systemic RIsk. Cambridge University Press.
Acharya, V. V., Steffen, S., 2014a. Falling Short of Expectations? Stress-Testing the European
Banking System. Econ. Policy, CEPS Policy Briefs.
Acharya, V. V., Steffen, S., 2014b. The “Greatest” Carry Trade Ever? Understanding Eurozone Bank
Risks. J. financ. econ. forthcomin.
Adrian, T., Brunnermeier, M.K., 2009. CoVaR. SSRN Electron. J. doi:10.2139/ssrn.1269446
Allen, F., Babus, A., Carletti, E., 2012. Asset commonality, debt maturity and systemic risk. J. financ.
econ. 104, 519–534. doi:10.1016/j.jfineco.2011.07.003
Babus, A., 2013. The Formation of Financial Networks. SSRN Electron. J. doi:10.2139/ssrn.939754
Brownlees, C.T., Engle, R.F., 2011. Volatility, Correlation and Tails for Systemic Risk Measurement.
SSRN Electron. J. doi:10.2139/ssrn.1611229
Brunnermeier, M.K., Sannikov, Y., 2014. A Macroeconomic Model with a Financial Sector †. Am.
Econ. Rev. 104, 379–421. doi:10.1257/aer.104.2.379
Caballero, R.J., Simsek, A., 2013. Fire Sales in a Model of Complexity. J. Finance 68, 2549–2587.
doi:10.1111/jofi.12087
Cai, J., Saunders, A., Steffen, S., 2012. Syndication, Interconnectedness, and Systemic Risk. SSRN
Electron. J. doi:10.2139/ssrn.1508642
Castiglionesi, F., Navarro, N., 2010. Optimal Fragile Financial Networks. Work. Pap.
Dasgupta, A., 2004. Financial Contagion Through Capital Connections: A Model of the Origin and
Spread of Bank Panics. J. Eur. Econ. Assoc. 2, 1049–1084. doi:10.1162/1542476042813896
Diamond, D.W., Rajan, R.G., 2011. Fear of Fire Sales, Illiquidity Seeking, and Credit Freezes. Q. J.
Econ. 126, 557–591. doi:10.1093/qje/qjr012
EBA, 2011a. Results of the 2011 EU-wide stress test [WWW Document]. URL
http://www.eba.europa.eu/risk-analysis-and-data/eu-wide-stress-testing/2011/results
PE 528.761 28
EBA, 2011b. 2011 EU-Wide Stress Test: Methodological Note [WWW Document]. URL
https://www.eba.europa.eu/documents/10180/15932/EBA-ST-2011-004-Detailed-Methodological-
Note_1.pdf
EBA, 2014. Methodological note EU‐ wide Stress Test 2014 [WWW Document]. URL
https://www.eba.europa.eu/documents/10180/669262/Methodological+Note.pdf
EC, 2014. European Commission projections for the 2014 EU-wide stress tests baseline scenario
[WWW Document]. URL https://www.eba.europa.eu/documents/10180/669262/EC+projections.pdf
ECB, 2013. Note Comprehensive Assessment - October 2013 [WWW Document]. URL
http://www.ecb.europa.eu/pub/pdf/other/notecomprehensiveassessment201310en.pdf?065ff8953213aa
f23e385c1119dd541a
ECB, 2014a. Comprehensive Assessment Stress Test Manual [WWW Document]. URL
http://www.ecb.europa.eu/pub/pdf/other/castmanual201408en.pdf
ECB, 2014b. Asset Quality Review - Phase 2 Manual [WWW Document]. URL
http://www.ecb.europa.eu/pub/pdf/other/assetqualityreviewphase2manual201403en.pdf?e8cc41ce0e4e
e40222cbe148574e4af7
ECB, 2014c. Note on the Comprehensive Assessment - February 2014 [WWW Document]. URL
http://www.ecb.europa.eu/pub/pdf/other/notecomprehensiveassessment201402en.pdf?120cf5522a79fe
53cd30a54aaf34f55d
ECOFIN, 2014. Terms of Reference - Applicable rules on addressing capital shortfalls and burden
sharing in the context of the Asset Quality Review and Stress Tests [WWW Document]. URL
http://www.consilium.europa.eu/uedocs/cms_data/docs/pressdata/en/ecofin/143781.pdf
ESRB, 2014. EBA/SSM stress test: The macroeconomic adverse scenario [WWW Document]. URL
https://www.eba.europa.eu/documents/10180/669262/2014-04-
29_ESRB_Adverse_macroeconomic_scenario_-_specification_and_results_finall_version.pdf
Fed, 2013a. Comprehensive Capital Analysis and Review 2014: Summary Instructions and Guidance.
[WWW Document]. URL
http://www.federalreserve.gov/newsevents/press/bcreg/bcreg20131101a2.pdf
Fed, 2013b. Comprehensive Capital Analysis and Review 2014: Assessment Framework and Results
[WWW Document]. URL http://www.federalreserve.gov/newsevents/press/bcreg/ccar-2013-results-
20130314.pdf
Fed, 2014. Dodd-Frank Act Stress Test 2014: Supervisory Stress Test Methodology and Results
[WWW Document]. URL
http://www.federalreserve.gov/newsevents/press/bcreg/bcreg20140320a1.pdf
Gai, P., Haldane, A., Kapadia, S., 2011. Complexity, concentration and contagion. J. Monet. Econ. 58,
453–470. doi:10.1016/j.jmoneco.2011.05.005
Gai, P., Kapadia, S., 2010. Contagion in financial networks. Proc. R. Soc. A Math. Phys. Eng. Sci.
466, 2401–2423. doi:10.1098/rspa.2009.0410
29 PE 528.761
Gennaioli, N., Shleifer, A., Vishny, R., 2012. Neglected risks, financial innovation, and financial
fragility. J. financ. econ. 104, 452–468. doi:10.1016/j.jfineco.2011.05.005
Haldane, A.G., 2009. Rethinking the Financial Network, in: Speech at the Financial Student
Association, Amsterdam, 28 April. Amsterdam.
Haldane, A.G., May, R.M., 2011. Systemic risk in banking ecosystems. Nature 469, 351–5.
doi:10.1038/nature09659
He, Z., Khang, I.G., Krishnamurthy, A., 2010. Balance Sheet Adjustments during the 2008 Crisis. IMF
Econ. Rev. 58, 118–156. doi:10.1057/imfer.2010.6
Hellwig, M.F., 1995. Systemic Aspects of Risk Management in Banking and Finance. Swiss J. Econ.
Stat. 131, 723–737.
Hellwig, M.F., 2014a. Systemic Risk and Macro-Prudential Policy. Speech Ned. Bank’s High-Level
Semin. "Making Macroprudent. Policy Work Pract.
Hellwig, M.F., 2014b. Yes Virginia, There is a European Banking Union! But It May Not Make Your
Wishes Come True. Max Planck Inst. Res. Collect. Goods 2014/12.
Hellwig, M.F., 2014c. Financial Stability, Monetary Policy, Banking Supervision, and Central
Banking. Max Planck Inst. Res. Collect. Goods 2014/12.
Holmstrom, B., Tirole, J., 1998. Private and Public Supply of Liquidity. J. Polit. Econ. 106, 1–40.
Huang, X., Zhou, H., Zhu, H., 2009. A framework for assessing the systemic risk of major financial
institutions. J. Bank. Financ. 33, 2036–2049. doi:10.1016/j.jbankfin.2009.05.017
Shleifer, A., Vishny, R., 2011. Fire Sales in Finance and Macroeconomics. J. Econ. Perspect. 25, 29–
48. doi:10.1257/jep.25.1.29
Shleifer, A., Vishny, R.W., 2010. Unstable Banking. J. financ. econ. 97, 306–318.
Steffen, S., 2011. Measuring systemic risk of the European banking sector. VoxEu.
Stein, J.C., 2010. Monetary Policy as Financial-Stability Regulation. NBER Work. Pap.
Tucker, P., 2009. The Debate on Financial System resilience: Macroprudential Instruments. Barclays
Annu. Lect.
Wagner, W., 2010. Diversification at financial institutions and systemic crises. J. Financ.
Intermediation 19, 373–386. doi:10.1016/j.jfi.2009.07.002
Zawadowski, A., 2013. Entangled Financial Systems. SSRN Electron. J. doi:10.2139/ssrn.1765993
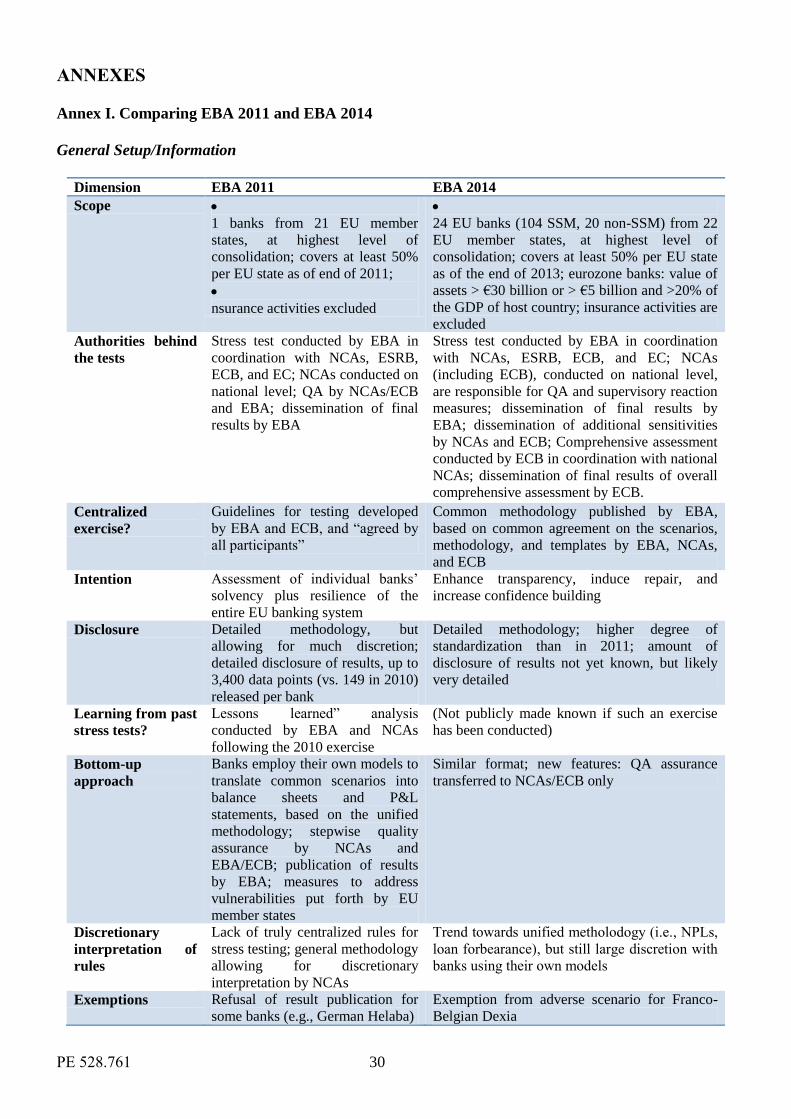
PE 528.761 30
ANNEXES
Annex I. Comparing EBA 2011 and EBA 2014
General Setup/Information
Dimension EBA 2011 EBA 2014
Scope 9
1 banks from 21 EU member
states, at highest level of
consolidation; covers at least 50%
per EU state as of end of 2011;
i
nsurance activities excluded
1
24 EU banks (104 SSM, 20 non-SSM) from 22
EU member states, at highest level of
consolidation; covers at least 50% per EU state
as of the end of 2013; eurozone banks: value of
assets > €30 billion or > €5 billion and >20% of
the GDP of host country; insurance activities are
excluded
Authorities behind
the tests
Stress test conducted by EBA in
coordination with NCAs, ESRB,
ECB, and EC; NCAs conducted on
national level; QA by NCAs/ECB
and EBA; dissemination of final
results by EBA
Stress test conducted by EBA in coordination
with NCAs, ESRB, ECB, and EC; NCAs
(including ECB), conducted on national level,
are responsible for QA and supervisory reaction
measures; dissemination of final results by
EBA; dissemination of additional sensitivities
by NCAs and ECB; Comprehensive assessment
conducted by ECB in coordination with national
NCAs; dissemination of final results of overall
comprehensive assessment by ECB.
Centralized
exercise?
Guidelines for testing developed
by EBA and ECB, and “agreed by
all participants”
Common methodology published by EBA,
based on common agreement on the scenarios,
methodology, and templates by EBA, NCAs,
and ECB
Intention Assessment of individual banks’
solvency plus resilience of the
entire EU banking system
Enhance transparency, induce repair, and
increase confidence building
Disclosure Detailed methodology, but
allowing for much discretion;
detailed disclosure of results, up to
3,400 data points (vs. 149 in 2010)
released per bank
Detailed methodology; higher degree of
standardization than in 2011; amount of
disclosure of results not yet known, but likely
very detailed
Learning from past
stress tests?
Lessons learned” analysis
conducted by EBA and NCAs
following the 2010 exercise
(Not publicly made known if such an exercise
has been conducted)
Bottom-up
approach
Banks employ their own models to
translate common scenarios into
balance sheets and P&L
statements, based on the unified
methodology; stepwise quality
assurance by NCAs and
EBA/ECB; publication of results
by EBA; measures to address
vulnerabilities put forth by EU
member states
Similar format; new features: QA assurance
transferred to NCAs/ECB only
Discretionary
interpretation of
rules
Lack of truly centralized rules for
stress testing; general methodology
allowing for discretionary
interpretation by NCAs
Trend towards unified metholodogy (i.e., NPLs,
loan forbearance), but still large discretion with
banks using their own models
Exemptions Refusal of result publication for
some banks (e.g., German Helaba)
Exemption from adverse scenario for Franco-
Belgian Dexia
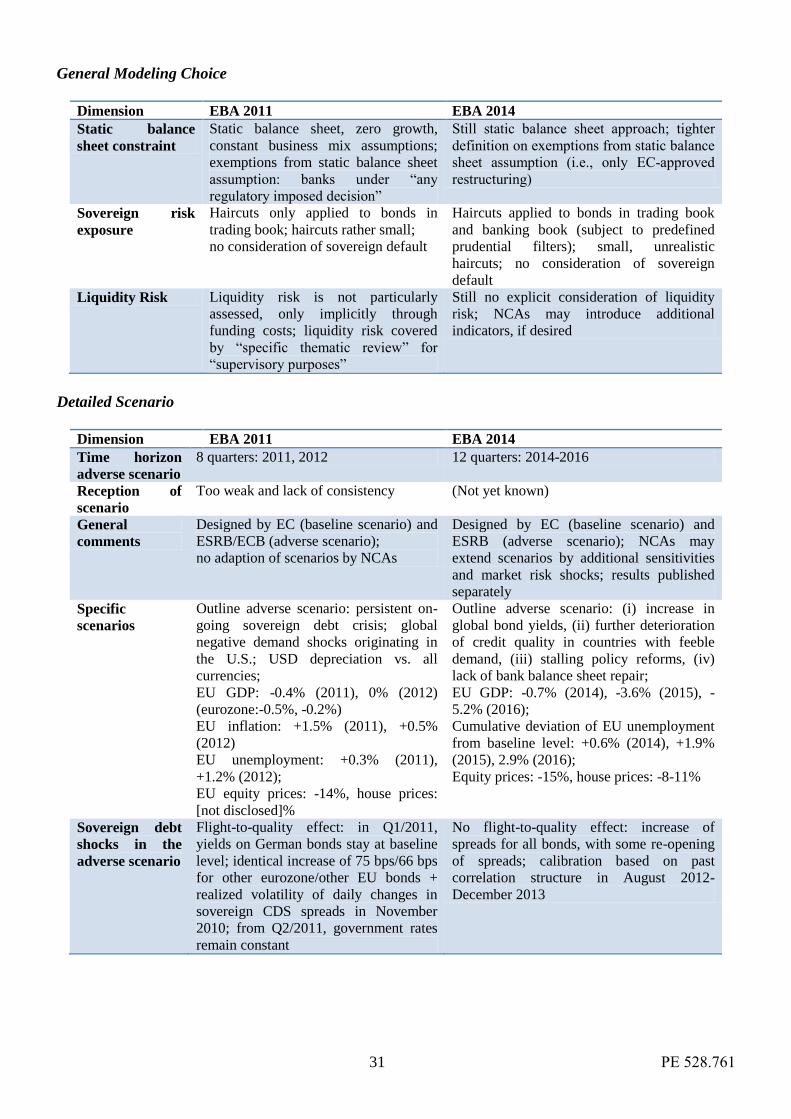
31 PE 528.761
General Modeling Choice
Dimension EBA 2011 EBA 2014
Static balance
sheet constraint
Static balance sheet, zero growth,
constant business mix assumptions;
exemptions from static balance sheet
assumption: banks under “any
regulatory imposed decision”
Still static balance sheet approach; tighter
definition on exemptions from static balance
sheet assumption (i.e., only EC-approved
restructuring)
Sovereign risk
exposure
Haircuts only applied to bonds in
trading book; haircuts rather small;
no consideration of sovereign default
Haircuts applied to bonds in trading book
and banking book (subject to predefined
prudential filters); small, unrealistic
haircuts; no consideration of sovereign
default
Liquidity Risk Liquidity risk is not particularly
assessed, only implicitly through
funding costs; liquidity risk covered
by “specific thematic review” for
“supervisory purposes”
Still no explicit consideration of liquidity
risk; NCAs may introduce additional
indicators, if desired
Detailed Scenario
Dimension EBA 2011 EBA 2014
Time horizon
adverse scenario
8 quarters: 2011, 2012 12 quarters: 2014-2016
Reception of
scenario
Too weak and lack of consistency (Not yet known)
General
comments
Designed by EC (baseline scenario) and
ESRB/ECB (adverse scenario);
no adaption of scenarios by NCAs
Designed by EC (baseline scenario) and
ESRB (adverse scenario); NCAs may
extend scenarios by additional sensitivities
and market risk shocks; results published
separately
Specific
scenarios
Outline adverse scenario: persistent on-
going sovereign debt crisis; global
negative demand shocks originating in
the U.S.; USD depreciation vs. all
currencies;
EU GDP: -0.4% (2011), 0% (2012)
(eurozone:-0.5%, -0.2%)
EU inflation: +1.5% (2011), +0.5%
(2012)
EU unemployment: +0.3% (2011),
+1.2% (2012);
EU equity prices: -14%, house prices:
[not disclosed]%
Outline adverse scenario: (i) increase in
global bond yields, (ii) further deterioration
of credit quality in countries with feeble
demand, (iii) stalling policy reforms, (iv)
lack of bank balance sheet repair;
EU GDP: -0.7% (2014), -3.6% (2015), -
5.2% (2016);
Cumulative deviation of EU unemployment
from baseline level: +0.6% (2014), +1.9%
(2015), 2.9% (2016);
Equity prices: -15%, house prices: -8-11%
Sovereign debt
shocks in the
adverse scenario
Flight-to-quality effect: in Q1/2011,
yields on German bonds stay at baseline
level; identical increase of 75 bps/66 bps
for other eurozone/other EU bonds +
realized volatility of daily changes in
sovereign CDS spreads in November
2010; from Q2/2011, government rates
remain constant
No flight-to-quality effect: increase of
spreads for all bonds, with some re-opening
of spreads; calibration based on past
correlation structure in August 2012-
December 2013
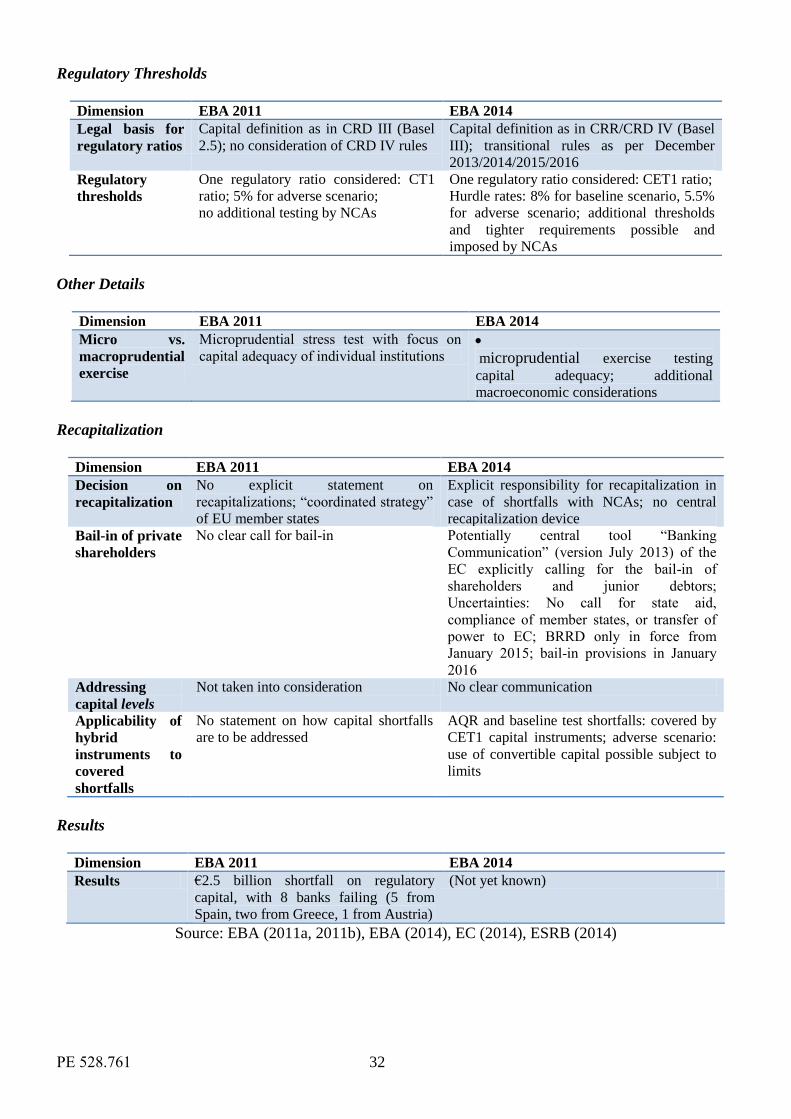
PE 528.761 32
Regulatory Thresholds
Dimension EBA 2011 EBA 2014
Legal basis for
regulatory ratios
Capital definition as in CRD III (Basel
2.5); no consideration of CRD IV rules
Capital definition as in CRR/CRD IV (Basel
III); transitional rules as per December
2013/2014/2015/2016
Regulatory
thresholds
One regulatory ratio considered: CT1
ratio; 5% for adverse scenario;
no additional testing by NCAs
One regulatory ratio considered: CET1 ratio;
Hurdle rates: 8% for baseline scenario, 5.5%
for adverse scenario; additional thresholds
and tighter requirements possible and
imposed by NCAs
Other Details
Dimension EBA 2011 EBA 2014
Micro vs.
macroprudential
exercise
Microprudential stress test with focus on
capital adequacy of individual institutions A
microprudential exercise testing
capital adequacy; additional
macroeconomic considerations
Recapitalization
Dimension EBA 2011 EBA 2014
Decision on
recapitalization
No explicit statement on
recapitalizations; “coordinated strategy”
of EU member states
Explicit responsibility for recapitalization in
case of shortfalls with NCAs; no central
recapitalization device
Bail-in of private
shareholders
No clear call for bail-in Potentially central tool “Banking
Communication” (version July 2013) of the
EC explicitly calling for the bail-in of
shareholders and junior debtors;
Uncertainties: No call for state aid,
compliance of member states, or transfer of
power to EC; BRRD only in force from
January 2015; bail-in provisions in January
2016 Addressing
capital levels
Not taken into consideration No clear communication
Applicability of
hybrid
instruments to
covered
shortfalls
No statement on how capital shortfalls
are to be addressed
AQR and baseline test shortfalls: covered by
CET1 capital instruments; adverse scenario:
use of convertible capital possible subject to
limits
Results
Dimension EBA 2011 EBA 2014
Results €2.5 billion shortfall on regulatory
capital, with 8 banks failing (5 from
Spain, two from Greece, 1 from Austria)
(Not yet known)
Source: EBA (2011a, 2011b), EBA (2014), EC (2014), ESRB (2014)
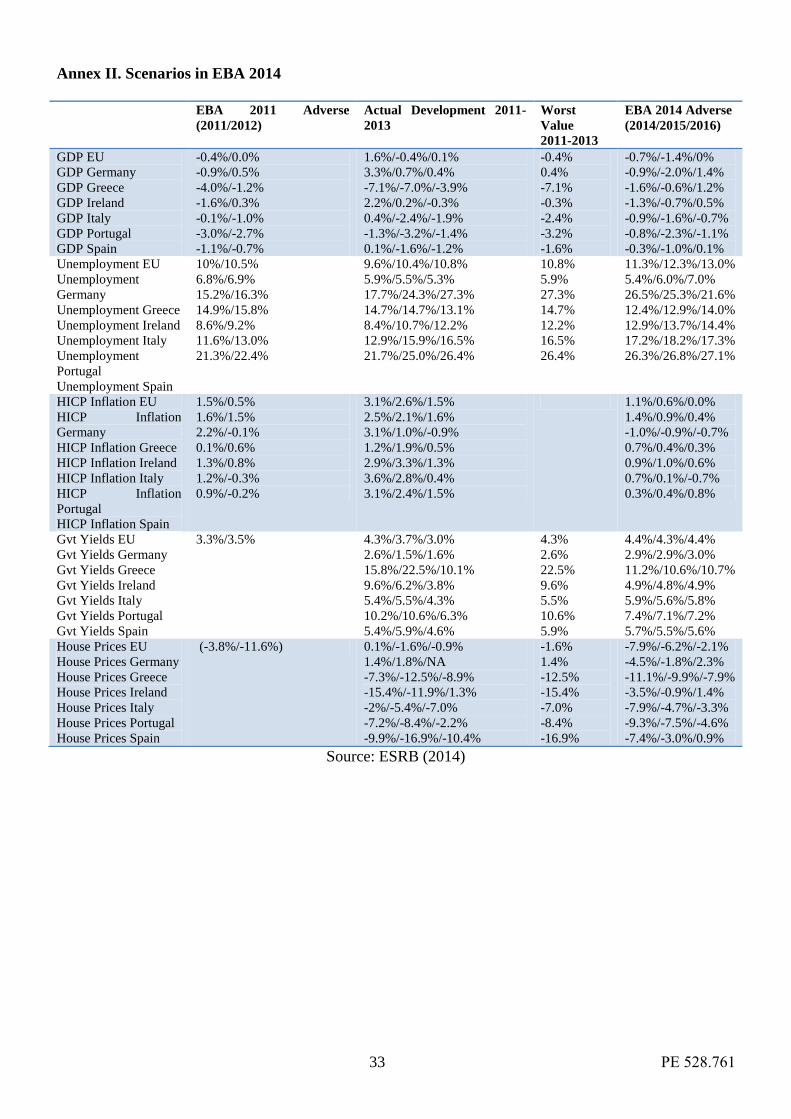
33 PE 528.761
Annex II. Scenarios in EBA 2014
EBA 2011 Adverse
(2011/2012)
Actual Development 2011-
2013
Worst
Value
2011-2013
EBA 2014 Adverse
(2014/2015/2016)
GDP EU
GDP Germany
GDP Greece
GDP Ireland
GDP Italy
GDP Portugal
GDP Spain
-0.4%/0.0%
-0.9%/0.5%
-4.0%/-1.2%
-1.6%/0.3%
-0.1%/-1.0%
-3.0%/-2.7%
-1.1%/-0.7%
1.6%/-0.4%/0.1%
3.3%/0.7%/0.4%
-7.1%/-7.0%/-3.9%
2.2%/0.2%/-0.3%
0.4%/-2.4%/-1.9%
-1.3%/-3.2%/-1.4%
0.1%/-1.6%/-1.2%
-0.4%
0.4%
-7.1%
-0.3%
-2.4%
-3.2%
-1.6%
-0.7%/-1.4%/0%
-0.9%/-2.0%/1.4%
-1.6%/-0.6%/1.2%
-1.3%/-0.7%/0.5%
-0.9%/-1.6%/-0.7%
-0.8%/-2.3%/-1.1%
-0.3%/-1.0%/0.1%
Unemployment EU
Unemployment
Germany
Unemployment Greece
Unemployment Ireland
Unemployment Italy
Unemployment
Portugal
Unemployment Spain
10%/10.5%
6.8%/6.9%
15.2%/16.3%
14.9%/15.8%
8.6%/9.2%
11.6%/13.0%
21.3%/22.4%
9.6%/10.4%/10.8%
5.9%/5.5%/5.3%
17.7%/24.3%/27.3%
14.7%/14.7%/13.1%
8.4%/10.7%/12.2%
12.9%/15.9%/16.5%
21.7%/25.0%/26.4%
10.8%
5.9%
27.3%
14.7%
12.2%
16.5%
26.4%
11.3%/12.3%/13.0%
5.4%/6.0%/7.0%
26.5%/25.3%/21.6%
12.4%/12.9%/14.0%
12.9%/13.7%/14.4%
17.2%/18.2%/17.3%
26.3%/26.8%/27.1%
HICP Inflation EU
HICP Inflation
Germany
HICP Inflation Greece
HICP Inflation Ireland
HICP Inflation Italy
HICP Inflation
Portugal
HICP Inflation Spain
1.5%/0.5%
1.6%/1.5%
2.2%/-0.1%
0.1%/0.6%
1.3%/0.8%
1.2%/-0.3%
0.9%/-0.2%
3.1%/2.6%/1.5%
2.5%/2.1%/1.6%
3.1%/1.0%/-0.9%
1.2%/1.9%/0.5%
2.9%/3.3%/1.3%
3.6%/2.8%/0.4%
3.1%/2.4%/1.5%
1.1%/0.6%/0.0%
1.4%/0.9%/0.4%
-1.0%/-0.9%/-0.7%
0.7%/0.4%/0.3%
0.9%/1.0%/0.6%
0.7%/0.1%/-0.7%
0.3%/0.4%/0.8%
Gvt Yields EU
Gvt Yields Germany
Gvt Yields Greece
Gvt Yields Ireland
Gvt Yields Italy
Gvt Yields Portugal
Gvt Yields Spain
3.3%/3.5% 4.3%/3.7%/3.0%
2.6%/1.5%/1.6%
15.8%/22.5%/10.1%
9.6%/6.2%/3.8%
5.4%/5.5%/4.3%
10.2%/10.6%/6.3%
5.4%/5.9%/4.6%
4.3%
2.6%
22.5%
9.6%
5.5%
10.6%
5.9%
4.4%/4.3%/4.4%
2.9%/2.9%/3.0%
11.2%/10.6%/10.7%
4.9%/4.8%/4.9%
5.9%/5.6%/5.8%
7.4%/7.1%/7.2%
5.7%/5.5%/5.6%
House Prices EU
House Prices Germany
House Prices Greece
House Prices Ireland
House Prices Italy
House Prices Portugal
House Prices Spain
(-3.8%/-11.6%) 0.1%/-1.6%/-0.9%
1.4%/1.8%/NA
-7.3%/-12.5%/-8.9%
-15.4%/-11.9%/1.3%
-2%/-5.4%/-7.0%
-7.2%/-8.4%/-2.2%
-9.9%/-16.9%/-10.4%
-1.6%
1.4%
-12.5%
-15.4%
-7.0%
-8.4%
-16.9%
-7.9%/-6.2%/-2.1%
-4.5%/-1.8%/2.3%
-11.1%/-9.9%/-7.9%
-3.5%/-0.9%/1.4%
-7.9%/-4.7%/-3.3%
-9.3%/-7.5%/-4.6%
-7.4%/-3.0%/0.9%
Source: ESRB (2014)
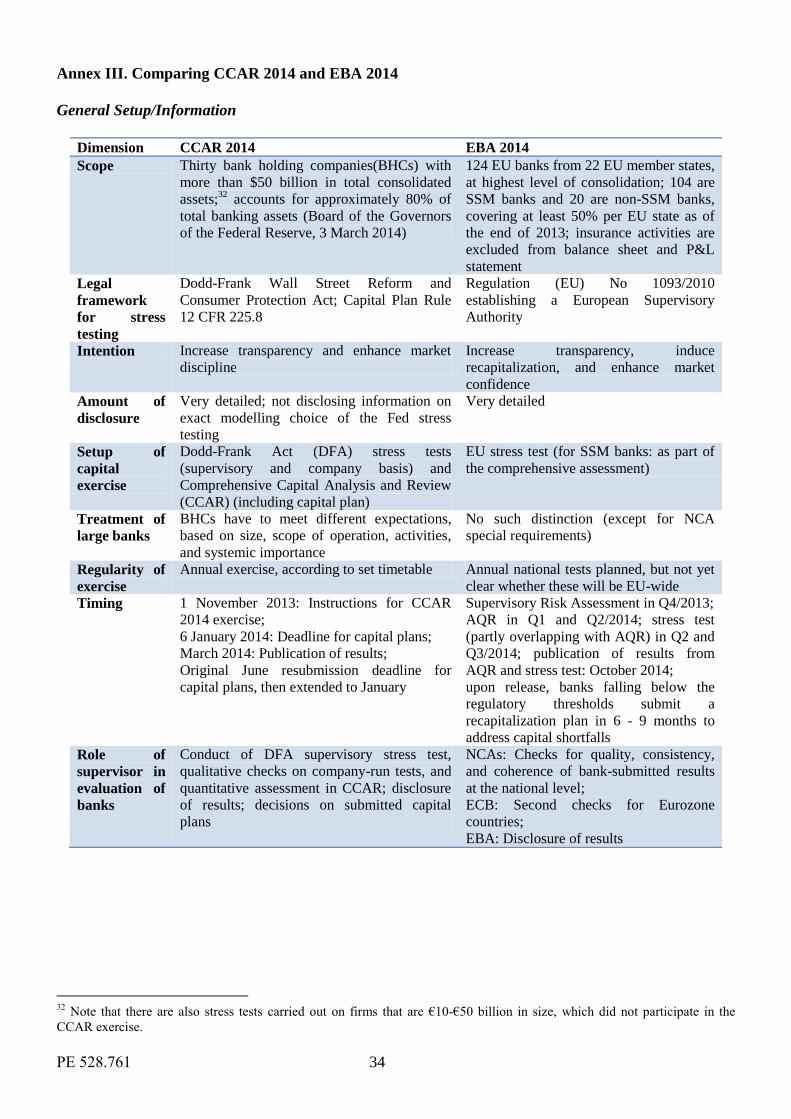
PE 528.761 34
Annex III. Comparing CCAR 2014 and EBA 2014
General Setup/Information
Dimension CCAR 2014 EBA 2014
Scope Thirty bank holding companies(BHCs) with
more than $50 billion in total consolidated
assets;32
accounts for approximately 80% of
total banking assets (Board of the Governors
of the Federal Reserve, 3 March 2014)
124 EU banks from 22 EU member states,
at highest level of consolidation; 104 are
SSM banks and 20 are non-SSM banks,
covering at least 50% per EU state as of
the end of 2013; insurance activities are
excluded from balance sheet and P&L
statement
Legal
framework
for stress
testing
Dodd-Frank Wall Street Reform and
Consumer Protection Act; Capital Plan Rule
12 CFR 225.8
Regulation (EU) No 1093/2010
establishing a European Supervisory
Authority
Intention Increase transparency and enhance market
discipline
Increase transparency, induce
recapitalization, and enhance market
confidence
Amount of
disclosure
Very detailed; not disclosing information on
exact modelling choice of the Fed stress
testing
Very detailed
Setup of
capital
exercise
Dodd-Frank Act (DFA) stress tests
(supervisory and company basis) and
Comprehensive Capital Analysis and Review
(CCAR) (including capital plan)
EU stress test (for SSM banks: as part of
the comprehensive assessment)
Treatment of
large banks
BHCs have to meet different expectations,
based on size, scope of operation, activities,
and systemic importance
No such distinction (except for NCA
special requirements)
Regularity of
exercise
Annual exercise, according to set timetable Annual national tests planned, but not yet
clear whether these will be EU-wide
Timing 1 November 2013: Instructions for CCAR
2014 exercise;
6 January 2014: Deadline for capital plans;
March 2014: Publication of results;
Original June resubmission deadline for
capital plans, then extended to January
Supervisory Risk Assessment in Q4/2013;
AQR in Q1 and Q2/2014; stress test
(partly overlapping with AQR) in Q2 and
Q3/2014; publication of results from
AQR and stress test: October 2014;
upon release, banks falling below the
regulatory thresholds submit a
recapitalization plan in 6 - 9 months to
address capital shortfalls
Role of
supervisor in
evaluation of
banks
Conduct of DFA supervisory stress test,
qualitative checks on company-run tests, and
quantitative assessment in CCAR; disclosure
of results; decisions on submitted capital
plans
NCAs: Checks for quality, consistency,
and coherence of bank-submitted results
at the national level;
ECB: Second checks for Eurozone
countries;
EBA: Disclosure of results
32
Note that there are also stress tests carried out on firms that are €10-€50 billion in size, which did not participate in the
CCAR exercise.
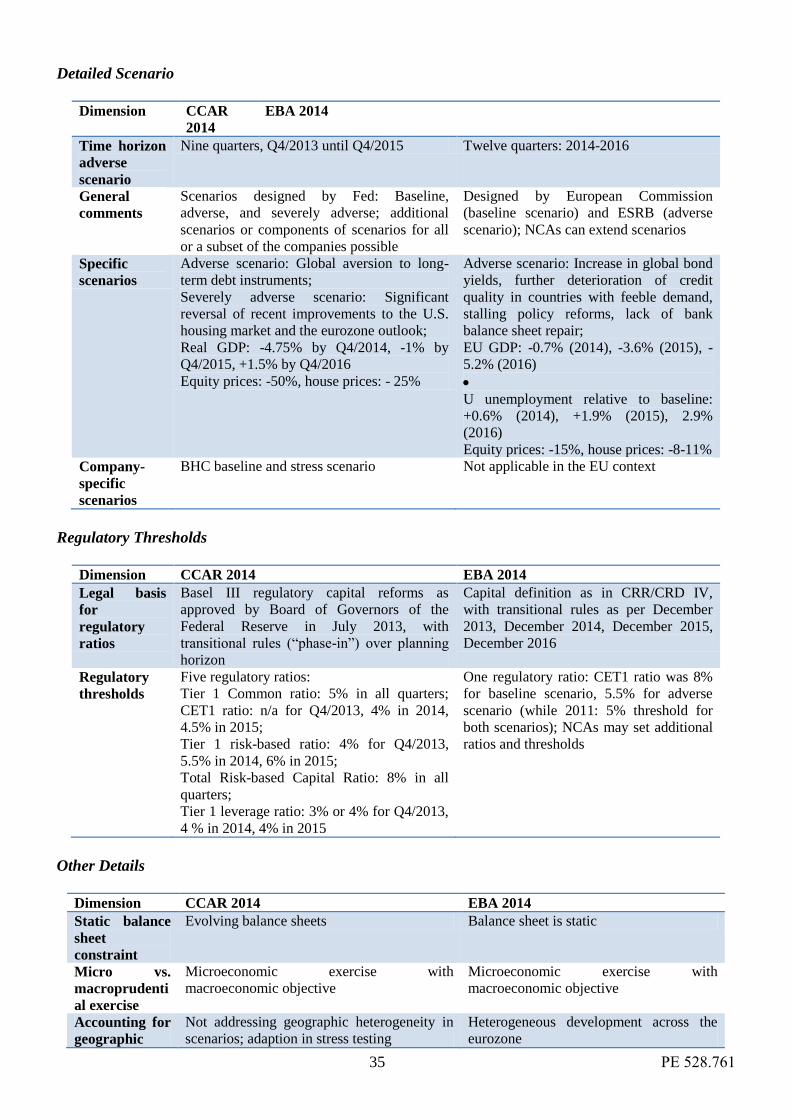
35 PE 528.761
Detailed Scenario
Dimension CCAR
2014
EBA 2014
Time horizon
adverse
scenario
Nine quarters, Q4/2013 until Q4/2015 Twelve quarters: 2014-2016
General
comments
Scenarios designed by Fed: Baseline,
adverse, and severely adverse; additional
scenarios or components of scenarios for all
or a subset of the companies possible
Designed by European Commission
(baseline scenario) and ESRB (adverse
scenario); NCAs can extend scenarios
Specific
scenarios
Adverse scenario: Global aversion to long-
term debt instruments;
Severely adverse scenario: Significant
reversal of recent improvements to the U.S.
housing market and the eurozone outlook;
Real GDP: -4.75% by Q4/2014, -1% by
Q4/2015, +1.5% by Q4/2016
Equity prices: -50%, house prices: - 25%
Adverse scenario: Increase in global bond
yields, further deterioration of credit
quality in countries with feeble demand,
stalling policy reforms, lack of bank
balance sheet repair;
EU GDP: -0.7% (2014), -3.6% (2015), -
5.2% (2016)
E
U unemployment relative to baseline:
+0.6% (2014), +1.9% (2015), 2.9%
(2016)
Equity prices: -15%, house prices: -8-11%
Company-
specific
scenarios
BHC baseline and stress scenario Not applicable in the EU context
Regulatory Thresholds
Dimension CCAR 2014 EBA 2014
Legal basis
for
regulatory
ratios
Basel III regulatory capital reforms as
approved by Board of Governors of the
Federal Reserve in July 2013, with
transitional rules (“phase-in”) over planning
horizon
Capital definition as in CRR/CRD IV,
with transitional rules as per December
2013, December 2014, December 2015,
December 2016
Regulatory
thresholds
Five regulatory ratios:
Tier 1 Common ratio: 5% in all quarters;
CET1 ratio: n/a for Q4/2013, 4% in 2014,
4.5% in 2015;
Tier 1 risk-based ratio: 4% for Q4/2013,
5.5% in 2014, 6% in 2015;
Total Risk-based Capital Ratio: 8% in all
quarters;
Tier 1 leverage ratio: 3% or 4% for Q4/2013,
4 % in 2014, 4% in 2015
One regulatory ratio: CET1 ratio was 8%
for baseline scenario, 5.5% for adverse
scenario (while 2011: 5% threshold for
both scenarios); NCAs may set additional
ratios and thresholds
Other Details
Dimension CCAR 2014 EBA 2014
Static balance
sheet
constraint
Evolving balance sheets Balance sheet is static
Micro vs.
macroprudenti
al exercise
Microeconomic exercise with
macroeconomic objective
Microeconomic exercise with
macroeconomic objective
Accounting for
geographic
Not addressing geographic heterogeneity in
scenarios; adaption in stress testing
Heterogeneous development across the
eurozone
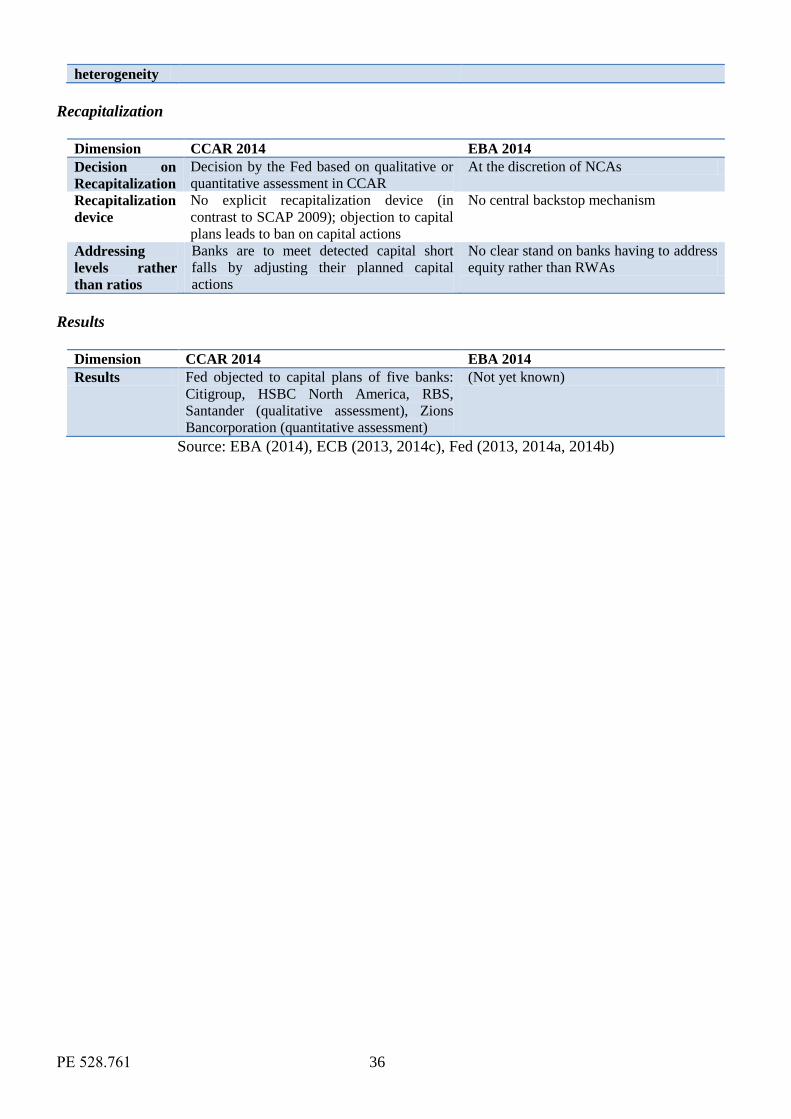
PE 528.761 36
heterogeneity
Recapitalization
Dimension CCAR 2014 EBA 2014
Decision on
Recapitalization
Decision by the Fed based on qualitative or
quantitative assessment in CCAR
At the discretion of NCAs
Recapitalization
device
No explicit recapitalization device (in
contrast to SCAP 2009); objection to capital
plans leads to ban on capital actions
No central backstop mechanism
Addressing
levels rather
than ratios
Banks are to meet detected capital short
falls by adjusting their planned capital
actions
No clear stand on banks having to address
equity rather than RWAs
Results
Dimension CCAR 2014 EBA 2014
Results Fed objected to capital plans of five banks:
Citigroup, HSBC North America, RBS,
Santander (qualitative assessment), Zions
Bancorporation (quantitative assessment)
(Not yet known)
Source: EBA (2014), ECB (2013, 2014c), Fed (2013, 2014a, 2014b)
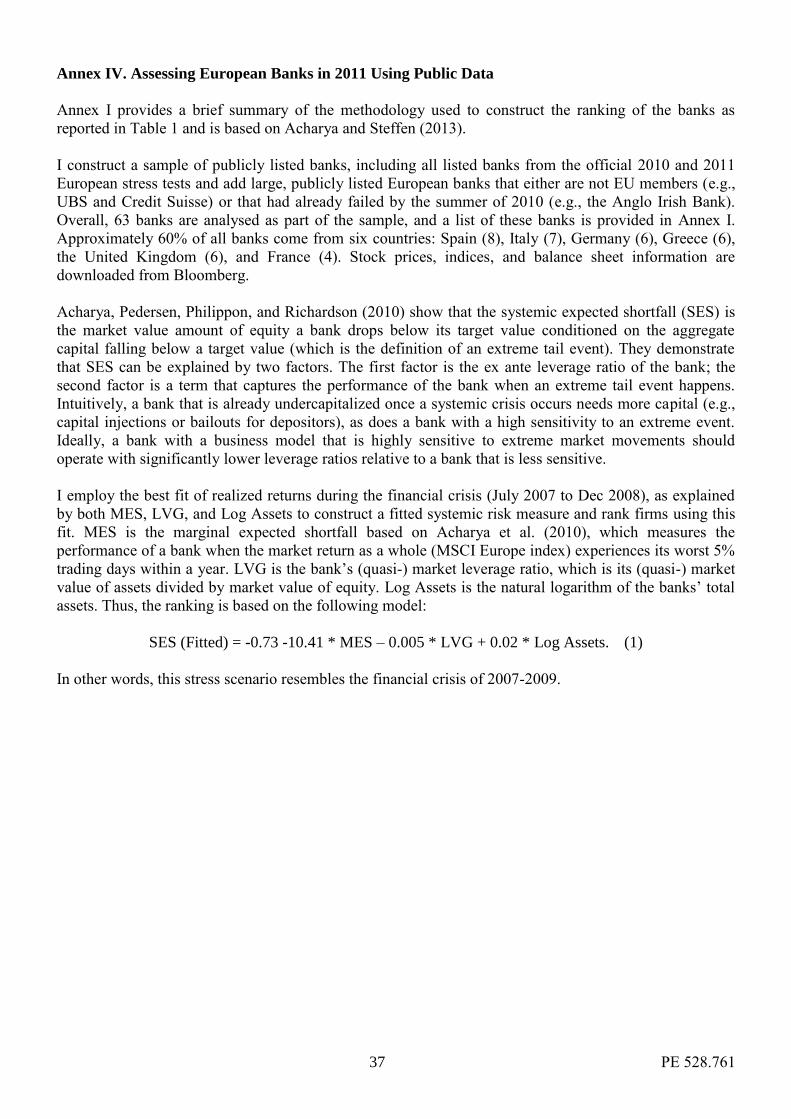
37 PE 528.761
Annex IV. Assessing European Banks in 2011 Using Public Data
Annex I provides a brief summary of the methodology used to construct the ranking of the banks as
reported in Table 1 and is based on Acharya and Steffen (2013).
I construct a sample of publicly listed banks, including all listed banks from the official 2010 and 2011
European stress tests and add large, publicly listed European banks that either are not EU members (e.g.,
UBS and Credit Suisse) or that had already failed by the summer of 2010 (e.g., the Anglo Irish Bank).
Overall, 63 banks are analysed as part of the sample, and a list of these banks is provided in Annex I.
Approximately 60% of all banks come from six countries: Spain (8), Italy (7), Germany (6), Greece (6),
the United Kingdom (6), and France (4). Stock prices, indices, and balance sheet information are
downloaded from Bloomberg.
Acharya, Pedersen, Philippon, and Richardson (2010) show that the systemic expected shortfall (SES) is
the market value amount of equity a bank drops below its target value conditioned on the aggregate
capital falling below a target value (which is the definition of an extreme tail event). They demonstrate
that SES can be explained by two factors. The first factor is the ex ante leverage ratio of the bank; the
second factor is a term that captures the performance of the bank when an extreme tail event happens.
Intuitively, a bank that is already undercapitalized once a systemic crisis occurs needs more capital (e.g.,
capital injections or bailouts for depositors), as does a bank with a high sensitivity to an extreme event.
Ideally, a bank with a business model that is highly sensitive to extreme market movements should
operate with significantly lower leverage ratios relative to a bank that is less sensitive.
I employ the best fit of realized returns during the financial crisis (July 2007 to Dec 2008), as explained
by both MES, LVG, and Log Assets to construct a fitted systemic risk measure and rank firms using this
fit. MES is the marginal expected shortfall based on Acharya et al. (2010), which measures the
performance of a bank when the market return as a whole (MSCI Europe index) experiences its worst 5%
trading days within a year. LVG is the bank’s (quasi-) market leverage ratio, which is its (quasi-) market
value of assets divided by market value of equity. Log Assets is the natural logarithm of the banks’ total
assets. Thus, the ranking is based on the following model:
SES (Fitted) = -0.73 -10.41 * MES – 0.005 * LVG + 0.02 * Log Assets. (1)
In other words, this stress scenario resembles the financial crisis of 2007-2009.
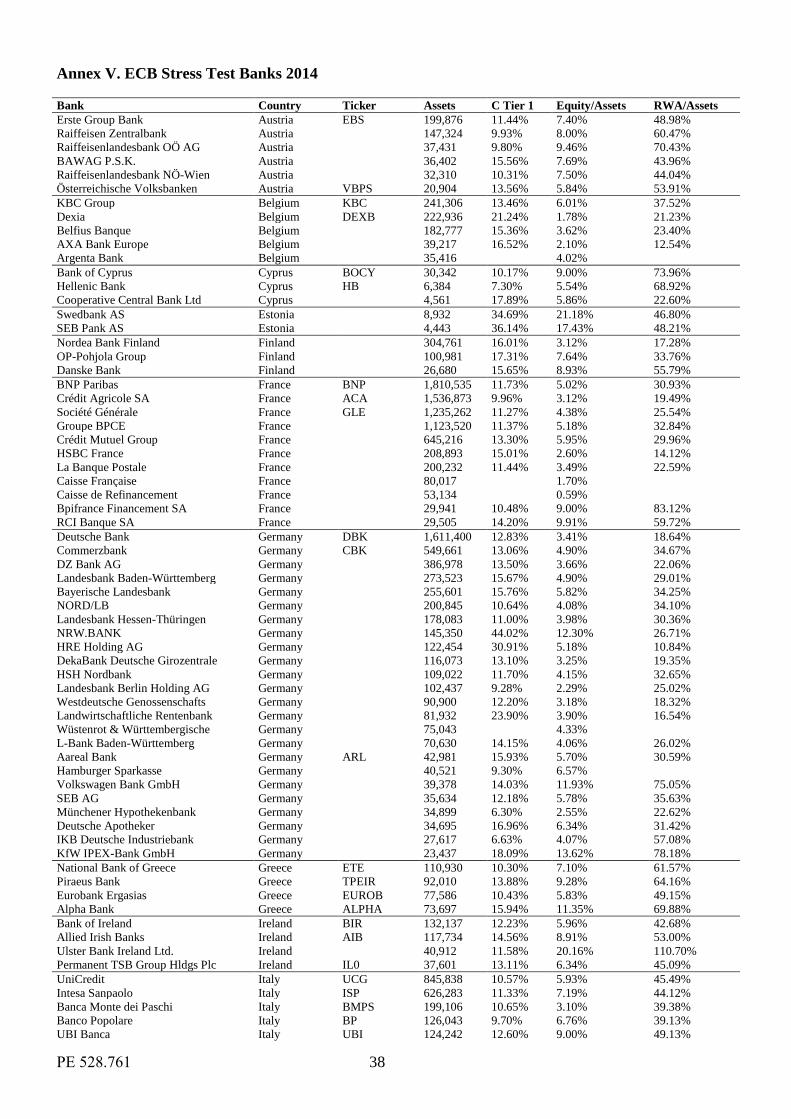
PE 528.761 38
Annex V. ECB Stress Test Banks 2014
Bank Country Ticker Assets C Tier 1 Equity/Assets RWA/Assets
Erste Group Bank Austria EBS 199,876 11.44% 7.40% 48.98%
Raiffeisen Zentralbank Austria
147,324 9.93% 8.00% 60.47%
Raiffeisenlandesbank OÖ AG Austria
37,431 9.80% 9.46% 70.43%
BAWAG P.S.K. Austria
36,402 15.56% 7.69% 43.96%
Raiffeisenlandesbank NÖ-Wien Austria
32,310 10.31% 7.50% 44.04%
Österreichische Volksbanken Austria VBPS 20,904 13.56% 5.84% 53.91%
KBC Group Belgium KBC 241,306 13.46% 6.01% 37.52%
Dexia Belgium DEXB 222,936 21.24% 1.78% 21.23%
Belfius Banque Belgium
182,777 15.36% 3.62% 23.40%
AXA Bank Europe Belgium
39,217 16.52% 2.10% 12.54%
Argenta Bank Belgium 35,416 4.02%
Bank of Cyprus Cyprus BOCY 30,342 10.17% 9.00% 73.96%
Hellenic Bank Cyprus HB 6,384 7.30% 5.54% 68.92%
Cooperative Central Bank Ltd Cyprus
4,561 17.89% 5.86% 22.60%
Swedbank AS Estonia 8,932 34.69% 21.18% 46.80%
SEB Pank AS Estonia 4,443 36.14% 17.43% 48.21%
Nordea Bank Finland Finland
304,761 16.01% 3.12% 17.28%
OP-Pohjola Group Finland
100,981 17.31% 7.64% 33.76%
Danske Bank Finland
26,680 15.65% 8.93% 55.79%
BNP Paribas France BNP 1,810,535 11.73% 5.02% 30.93%
Crédit Agricole SA France ACA 1,536,873 9.96% 3.12% 19.49%
Société Générale France GLE 1,235,262 11.27% 4.38% 25.54%
Groupe BPCE France
1,123,520 11.37% 5.18% 32.84%
Crédit Mutuel Group France
645,216 13.30% 5.95% 29.96%
HSBC France France
208,893 15.01% 2.60% 14.12%
La Banque Postale France
200,232 11.44% 3.49% 22.59%
Caisse Française France
80,017
1.70%
Caisse de Refinancement France
53,134
0.59%
Bpifrance Financement SA France
29,941 10.48% 9.00% 83.12%
RCI Banque SA France 29,505 14.20% 9.91% 59.72%
Deutsche Bank Germany DBK 1,611,400 12.83% 3.41% 18.64%
Commerzbank Germany CBK 549,661 13.06% 4.90% 34.67%
DZ Bank AG Germany
386,978 13.50% 3.66% 22.06%
Landesbank Baden-Württemberg Germany
273,523 15.67% 4.90% 29.01%
Bayerische Landesbank Germany
255,601 15.76% 5.82% 34.25%
NORD/LB Germany
200,845 10.64% 4.08% 34.10%
Landesbank Hessen-Thüringen Germany
178,083 11.00% 3.98% 30.36%
NRW.BANK Germany
145,350 44.02% 12.30% 26.71%
HRE Holding AG Germany
122,454 30.91% 5.18% 10.84%
DekaBank Deutsche Girozentrale Germany
116,073 13.10% 3.25% 19.35%
HSH Nordbank Germany
109,022 11.70% 4.15% 32.65%
Landesbank Berlin Holding AG Germany
102,437 9.28% 2.29% 25.02%
Westdeutsche Genossenschafts Germany
90,900 12.20% 3.18% 18.32%
Landwirtschaftliche Rentenbank Germany
81,932 23.90% 3.90% 16.54%
Wüstenrot & Württembergische Germany
75,043
4.33%
L-Bank Baden-Württemberg Germany
70,630 14.15% 4.06% 26.02%
Aareal Bank Germany ARL 42,981 15.93% 5.70% 30.59%
Hamburger Sparkasse Germany
40,521 9.30% 6.57%
Volkswagen Bank GmbH Germany
39,378 14.03% 11.93% 75.05%
SEB AG Germany
35,634 12.18% 5.78% 35.63%
Münchener Hypothekenbank Germany
34,899 6.30% 2.55% 22.62%
Deutsche Apotheker Germany
34,695 16.96% 6.34% 31.42%
IKB Deutsche Industriebank Germany
27,617 6.63% 4.07% 57.08%
KfW IPEX-Bank GmbH Germany
23,437 18.09% 13.62% 78.18%
National Bank of Greece Greece ETE 110,930 10.30% 7.10% 61.57%
Piraeus Bank Greece TPEIR 92,010 13.88% 9.28% 64.16%
Eurobank Ergasias Greece EUROB 77,586 10.43% 5.83% 49.15%
Alpha Bank Greece ALPHA 73,697 15.94% 11.35% 69.88%
Bank of Ireland Ireland BIR 132,137 12.23% 5.96% 42.68%
Allied Irish Banks Ireland AIB 117,734 14.56% 8.91% 53.00%
Ulster Bank Ireland Ltd. Ireland
40,912 11.58% 20.16% 110.70%
Permanent TSB Group Hldgs Plc Ireland IL0 37,601 13.11% 6.34% 45.09%
UniCredit Italy UCG 845,838 10.57% 5.93% 45.49%
Intesa Sanpaolo Italy ISP 626,283 11.33% 7.19% 44.12%
Banca Monte dei Paschi Italy BMPS 199,106 10.65% 3.10% 39.38%
Banco Popolare Italy BP 126,043 9.70% 6.76% 39.13%
UBI Banca Italy UBI 124,242 12.60% 9.00% 49.13%
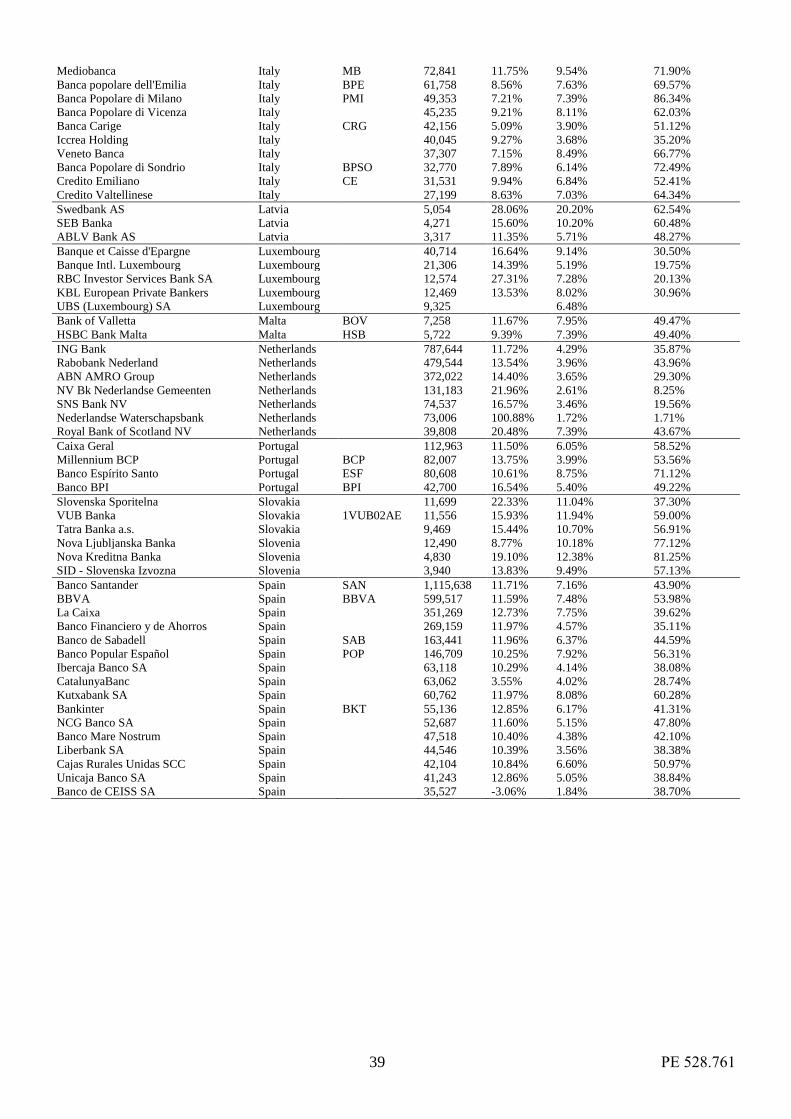
39 PE 528.761
Mediobanca Italy MB 72,841 11.75% 9.54% 71.90%
Banca popolare dell'Emilia Italy BPE 61,758 8.56% 7.63% 69.57%
Banca Popolare di Milano Italy PMI 49,353 7.21% 7.39% 86.34%
Banca Popolare di Vicenza Italy
45,235 9.21% 8.11% 62.03%
Banca Carige Italy CRG 42,156 5.09% 3.90% 51.12%
Iccrea Holding Italy
40,045 9.27% 3.68% 35.20%
Veneto Banca Italy
37,307 7.15% 8.49% 66.77%
Banca Popolare di Sondrio Italy BPSO 32,770 7.89% 6.14% 72.49%
Credito Emiliano Italy CE 31,531 9.94% 6.84% 52.41%
Credito Valtellinese Italy 27,199 8.63% 7.03% 64.34%
Swedbank AS Latvia
5,054 28.06% 20.20% 62.54%
SEB Banka Latvia
4,271 15.60% 10.20% 60.48%
ABLV Bank AS Latvia
3,317 11.35% 5.71% 48.27%
Banque et Caisse d'Epargne Luxembourg 40,714 16.64% 9.14% 30.50%
Banque Intl. Luxembourg Luxembourg
21,306 14.39% 5.19% 19.75%
RBC Investor Services Bank SA Luxembourg
12,574 27.31% 7.28% 20.13%
KBL European Private Bankers Luxembourg
12,469 13.53% 8.02% 30.96%
UBS (Luxembourg) SA Luxembourg 9,325 6.48%
Bank of Valletta Malta BOV 7,258 11.67% 7.95% 49.47%
HSBC Bank Malta Malta HSB 5,722 9.39% 7.39% 49.40%
ING Bank Netherlands 787,644 11.72% 4.29% 35.87%
Rabobank Nederland Netherlands
479,544 13.54% 3.96% 43.96%
ABN AMRO Group Netherlands
372,022 14.40% 3.65% 29.30%
NV Bk Nederlandse Gemeenten Netherlands
131,183 21.96% 2.61% 8.25%
SNS Bank NV Netherlands
74,537 16.57% 3.46% 19.56%
Nederlandse Waterschapsbank Netherlands
73,006 100.88% 1.72% 1.71%
Royal Bank of Scotland NV Netherlands 39,808 20.48% 7.39% 43.67%
Caixa Geral Portugal
112,963 11.50% 6.05% 58.52%
Millennium BCP Portugal BCP 82,007 13.75% 3.99% 53.56%
Banco Espírito Santo Portugal ESF 80,608 10.61% 8.75% 71.12%
Banco BPI Portugal BPI 42,700 16.54% 5.40% 49.22%
Slovenska Sporitelna Slovakia 11,699 22.33% 11.04% 37.30%
VUB Banka Slovakia 1VUB02AE 11,556 15.93% 11.94% 59.00%
Tatra Banka a.s. Slovakia
9,469 15.44% 10.70% 56.91%
Nova Ljubljanska Banka Slovenia
12,490 8.77% 10.18% 77.12%
Nova Kreditna Banka Slovenia
4,830 19.10% 12.38% 81.25%
SID - Slovenska Izvozna Slovenia 3,940 13.83% 9.49% 57.13%
Banco Santander Spain SAN 1,115,638 11.71% 7.16% 43.90%
BBVA Spain BBVA 599,517 11.59% 7.48% 53.98%
La Caixa Spain
351,269 12.73% 7.75% 39.62%
Banco Financiero y de Ahorros Spain
269,159 11.97% 4.57% 35.11%
Banco de Sabadell Spain SAB 163,441 11.96% 6.37% 44.59%
Banco Popular Español Spain POP 146,709 10.25% 7.92% 56.31%
Ibercaja Banco SA Spain
63,118 10.29% 4.14% 38.08%
CatalunyaBanc Spain
63,062 3.55% 4.02% 28.74%
Kutxabank SA Spain
60,762 11.97% 8.08% 60.28%
Bankinter Spain BKT 55,136 12.85% 6.17% 41.31%
NCG Banco SA Spain
52,687 11.60% 5.15% 47.80%
Banco Mare Nostrum Spain
47,518 10.40% 4.38% 42.10%
Liberbank SA Spain
44,546 10.39% 3.56% 38.38%
Cajas Rurales Unidas SCC Spain
42,104 10.84% 6.60% 50.97%
Unicaja Banco SA Spain
41,243 12.86% 5.05% 38.84%
Banco de CEISS SA Spain 35,527 -3.06% 1.84% 38.70%
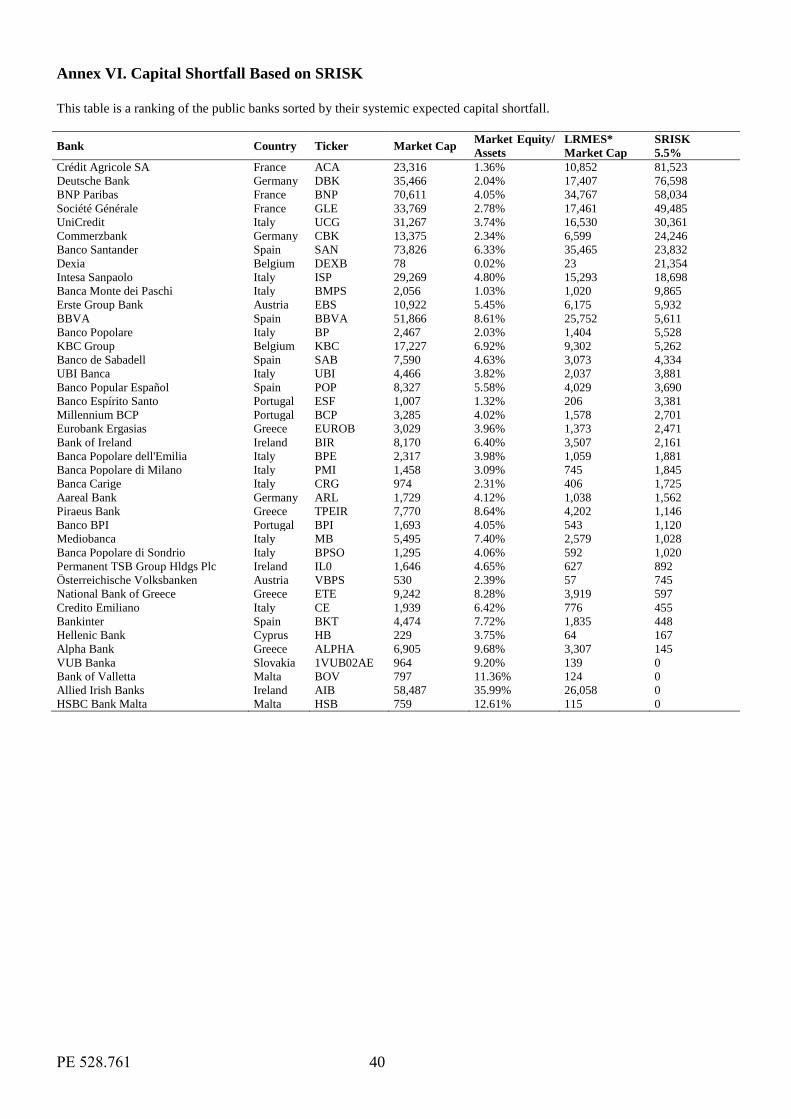
PE 528.761 40
Annex VI. Capital Shortfall Based on SRISK
This table is a ranking of the public banks sorted by their systemic expected capital shortfall.
Bank Country Ticker Market Cap Market Equity/
Assets
LRMES*
Market Cap
SRISK
5.5%
Crédit Agricole SA France ACA 23,316 1.36% 10,852 81,523
Deutsche Bank Germany DBK 35,466 2.04% 17,407 76,598
BNP Paribas France BNP 70,611 4.05% 34,767 58,034
Société Générale France GLE 33,769 2.78% 17,461 49,485
UniCredit Italy UCG 31,267 3.74% 16,530 30,361
Commerzbank Germany CBK 13,375 2.34% 6,599 24,246
Banco Santander Spain SAN 73,826 6.33% 35,465 23,832
Dexia Belgium DEXB 78 0.02% 23 21,354
Intesa Sanpaolo Italy ISP 29,269 4.80% 15,293 18,698
Banca Monte dei Paschi Italy BMPS 2,056 1.03% 1,020 9,865
Erste Group Bank Austria EBS 10,922 5.45% 6,175 5,932
BBVA Spain BBVA 51,866 8.61% 25,752 5,611
Banco Popolare Italy BP 2,467 2.03% 1,404 5,528
KBC Group Belgium KBC 17,227 6.92% 9,302 5,262
Banco de Sabadell Spain SAB 7,590 4.63% 3,073 4,334
UBI Banca Italy UBI 4,466 3.82% 2,037 3,881
Banco Popular Español Spain POP 8,327 5.58% 4,029 3,690
Banco Espírito Santo Portugal ESF 1,007 1.32% 206 3,381
Millennium BCP Portugal BCP 3,285 4.02% 1,578 2,701
Eurobank Ergasias Greece EUROB 3,029 3.96% 1,373 2,471
Bank of Ireland Ireland BIR 8,170 6.40% 3,507 2,161
Banca Popolare dell'Emilia Italy BPE 2,317 3.98% 1,059 1,881
Banca Popolare di Milano Italy PMI 1,458 3.09% 745 1,845
Banca Carige Italy CRG 974 2.31% 406 1,725
Aareal Bank Germany ARL 1,729 4.12% 1,038 1,562
Piraeus Bank Greece TPEIR 7,770 8.64% 4,202 1,146
Banco BPI Portugal BPI 1,693 4.05% 543 1,120
Mediobanca Italy MB 5,495 7.40% 2,579 1,028
Banca Popolare di Sondrio Italy BPSO 1,295 4.06% 592 1,020
Permanent TSB Group Hldgs Plc Ireland IL0 1,646 4.65% 627 892
Österreichische Volksbanken Austria VBPS 530 2.39% 57 745
National Bank of Greece Greece ETE 9,242 8.28% 3,919 597
Credito Emiliano Italy CE 1,939 6.42% 776 455
Bankinter Spain BKT 4,474 7.72% 1,835 448
Hellenic Bank Cyprus HB 229 3.75% 64 167
Alpha Bank Greece ALPHA 6,905 9.68% 3,307 145
VUB Banka Slovakia 1VUB02AE 964 9.20% 139 0
Bank of Valletta Malta BOV 797 11.36% 124 0
Allied Irish Banks Ireland AIB 58,487 35.99% 26,058 0
HSBC Bank Malta Malta HSB 759 12.61% 115 0
ECONOMIC GOVERNANCE BANKING UNION ECONOMIC GOVERNANCE BANKING UNION ECONOMIC GOVERNANCE BANKING UNION ECONOMIC GOVERNANCE BANKING UNION ECONOMIC GOVERNANCE BANKING UNION ECONOMIC GOVERNANCE BANKING UNION ECONOMIC GOVERNANCE BANKING UNION ECONOMICAGS DGS EFSF ESM ESBR EBA EWG NCAs NRAs SRM MIP MTO NRP CRD SSM SGP EIP MTO SCP ESAs EFSM EDP AMR CSRs AGS DGS EFSF ESM ESBR EBA EWG NCAs NRAs SRM MIP MTO NRP CRD SSM SGP EIP MTO SCP ESAs EFSM EDP AMR CSRs AGS DGS EFSF ESM ESBR EBA EWG NCAs NRAs SRM MIP MTO NRP CRD SSM SGP EIP GOVERNANCE BANKING UNION ECONOMIC GOVERNANCE BANKING UNION ECONOMIC GOVERNANCE BANKING UNION ECONOMIC GOVERNANCE BANKING UNION ECONOMIC GOVERNANCE BANKING UNION ECONOMIC GOVERNANCE BANKING UNION ECONOMIC GOVERNANCE BANKING UNION ECONOMIC GOVERNANMTO SCP ESAs EFSM EDP AMR CSRs AGS DGS EFSF ESM ESBR EBA EWG NCAs NRAs SRM MIP MTO NRP CRD SSM SGP EIP MTO SCP ESAs EFSM EDP AMR CSRs AGS DGS EFSF ESM ESBR EBA EWG NCAs NRAs SRM MIP MTO NRP CRD SSM SGP EIP MTO SCP ESAs EFSM EDP AMR CSRs AGS DGS EFSF ESM ESBR EBA EWG NCAs NRAs SCE BANKING UNION ECONOMIC GOVERNANCE BANKING UNION ECONOMIC GOVERNANCE BANKING UNION ECONOMIC GOVERNANCE BANKING UNION ECONOMIC GOVERNANCE BANKING UNION ECONOMIC GOVERNANCE BANKING UNION ECONOMIC GOVERNANCE BANKING UNION ECONOMIC GOVERNANCE BANKINRM MIP MTO NRP CRD SSM SGP EIP MTO SCP ESAs EFSM EDP AMR CSRs AGS DGS EFSF ESM ESBR EBA EWG NCAs NRAs SRM MIP MTO NRP CRD SSM SGP EIP MTO SCP ESAs EFSM EDP AMR CSRs AGS DGS EFSF ESM ESBR EBA EWG NCAs NRAs SRM MIP MTO NRP CRD SSM SGP EIP MTO SCP ESAs EFSM EDP AMR CSRs AGS DGS EFSG UNION ECONOMIC GOVERNANCE BANKING UNION ECONOMIC GOVERNANCE BANKING UNION ECONOMIC GOVERNANCE BANKING UNION ECONOMIC GOVERNANCE BANKING UNION ECONOMIC GOVERNANCE BANKING UNION ECONOMIC GOVERNANCE BANKING UNION ECONOMIC GOVERNANCE BANKING UNION EF ESM ESBR EBA EWG NCAs NRAs SRM MIP MTO NRP CRD SSM SGP EIP MTO SCP ESAs EFSM EDP AMR CSRs AGS DGS EFSF ESM ESBR EBA EWG NCAs NRAs SRM MIP MTO NRP CRD SSM SGP EIP MTO SCP ESAs EFSM EDP AMR CSRs AGS DGS EFSF ESM ESBR EBA EWG NCAs NRAs SRM MIP MTO NRP CRD SSM SGP EIP MTO SCP ESAs CONOMIC GOVERNANCE BANKING UNION ECONOMIC GOVERNANCE BANKING UNION ECONOMIC GOVERNANCE BANKING UNION ECONOMIC GOVERNANCE BANKING UNION ECONOMIC GOVERNANCE BANKING UNION ECONOMIC GOVERNANCE BANKING UNION ECONOMIC GOVERNANCE BANKING UNION ECONOMIC GESAs EFSM EDP AMR CSRs AGS DGS EFSF ESM ESBR EBA EWG NCAs NRAs SRM MIP MTO NRP CRD SSM SGP EIP MTO SCP ESAs EFSM EDP AMR CSRs AGS DGS EFSF ESM ESBR EBA EWG NCAs NRAs SRM MIP MTO NRP CRD SSM SGP EIP MTO SCP ESAs EFSM EDP AMR CSRs AGS DGS EFSF ESM ESBR EBA EWG NCAs NRAs SRM MIP MOVERNANCE BANKING UNION ECONOMIC GOVERNANCE BANKING UNION ECONOMIC GOVERNANCE BANKING UNION ECONOMIC GOVERNANCE BANKING UNION ECONOMIC GOVERNANCE BANKING UNION ECONOMIC GOVERNANCE BANKING UNION ECONOMIC GOVERNANCE BANKING UNION ECONOMIC GOVERNANCTO NRP CRD SSM SGP EIP MTO SCP ESAs EFSM EDP AMR CSRs AGS DGS EFSF ESM ESBR EBA EWG NCAs NRAs SRM MIP MTO NRP CRD SSM SGP EIP MTO SCP ESAs EFSM EDP AMR CSRs AGS DGS EFSF ESM ESBR EBA EWG NCAs NRAs SRM MIP MTO NRP CRD SSM SGP EIP MTO SCP ESAs EFSM EDP AMR CSRs AGS DGS EFSF ESM ESBE ECONOMIC GOVERNANCE BANKING UNION ECONOMIC GOVERNANCE BANKING UNION ECONOMIC GOVERNANCE BANKING UNION ECONOMIC GOVERNANCE BANKING UNION ECONOMIC GOVERNANCE BANKING UNION ECONOMIC GOVERNANCE BANKING UNION ECONOMIC GOVERNANCE BANKING UNION ECONOMIR EBA EWG NCAs NRAs SRM MIP MTO NRP CRD SSM SGP EIP MTO SCP ESAs EFSM EDP AMR CSRs AGS DGS EFSF ESM ESBR EBA EWG NCAs NRAs SRM MIP MTO NRP CRD SSM SGP EIP MTO SCP ESAs EFSM EDP AMR CSRs AGS DGS EFSF ESM ESBR EBA EWG NCAs NRAs SRM MIP MTO NRP CRD SSM SGP EIP MTO SCP ESAs EFSM EDP IC GOVERNANCE BANKING UNION ECONOMIC GOVERNANCE BANKING UNION ECONOMIC GOVERNANCE BANKING UNION ECONOMIC GOVERNANCE BANKING UNION ECONOMIC GOVERNANCE BANKING UNION ECONOMIC GOVERNANCE BANKING UNION ECONOMIC GOVERNANCE BANKING UNION ECONOMIC GOVERNAMR CSRs AGS DGS EFSF ESM ESBR EBA EWG NCAs NRAs SRM MIP MTO NRP CRD SSM SGP EIP MTO SCP ESAs EFSM EDP AMR CSRs AGS DGS EFSF ESM ESBR EBA EWG NCAs NRAs SRM MIP MTO NRP CRD SSM SGP EIP MTO SCP ESAs EFSM EDP AMR CSRs AGS DGS EFSF ESM ESBR EBA EWG NCAs NRAs SRM MIP MTO NRP CRD SSANCE BANKING UNION ECONOMIC GOVERNANCE BANKING UNION ECONOMIC GOVERNANCE BANKING UNION ECONOMIC GOVERNANCE BANKING UNION ECONOMIC GOVERNANCE BANKING UNION ECONOMIC GOVERNANCE BANKING UNION ECONOMIC GOVERNANCE BANKING UNION ECONOMIC GOVERNANCE BANM SGP EIP MTO SCP ESAs EFSM EDP AMR CSRs AGS DGS EFSF ESM ESBR EBA EWG NCAs NRAs SRM MIP MTO NRP CRD SSM SGP EIP MTO SCP ESAs EFSM EDP AMR CSRs AGS DGS EFSF ESM ESBR EBA EWG NCAs NRAs SRM MIP MTO NRP CRD SSM SGP EIP MTO SCP ESAs EFSM EDP AMR CSRs AGS DGS EFSF ESM ESBR EBA EWG NCKING UNION ECONOMIC GOVERNANCE BANKING UNION ECONOMIC GOVERNANCE BANKING UNION ECONOMIC GOVERNANCE BANKING UNION ECONOMIC GOVERNANCE BANKING UNION ECONOMIC GOVERNANCE BANKING UNION ECONOMIC GOVERNANCE BANKING UNION ECONOMIC GOVERNANCE BANKING UNIOAs NRAs SRM MIP MTO NRP CRD SSM SGP EIP MTO SCP ESAs EFSM EDP AMR CSRs AGS DGS EFSF ESM ESBR EBA EWG NCAs NRAs SRM MIP MTO NRP CRD SSM SGP EIP MTO SCP ESAs EFSM EDP AMR CSRs AGS DGS EFSF ESM ESBR EBA EWG NCAs NRAs SRM MIP MTO NRP CRD SSM SGP EIP MTO SCP ESAs EFSM EDP AMR CSRs AGN ECONOMIC GOVERNANCE BANKING UNION ECONOMIC GOVERNANCE BANKING UNION ECONOMIC GOVERNANCE BANKING UNION ECONOMIC GOVERNANCE BANKING UNION ECONOMIC GOVERNANCE BANKING UNION ECONOMIC GOVERNANCE BANKING UNION ECONOMIC GOVERNANCE BANKING UNION ECONOMS DGS EFSF ESM ESBR EBA EWG NCAs NRAs SRM MIP MTO NRP CRD SSM SGP EIP MTO SCP ESAs EFSM EDP AMR CSRs AGS DGS EFSF ESM ESBR EBA EWG NCAs NRAs SRM MIP MTO NRP CRD SSM SGP EIP MTO SCP ESAs EFSM EDP AMR CSRs AGS DGS EFSF ESM ESBR EBA EWG NCAs NRAs SRM MIP MTO NRP CRD SSM SGP EIP MTIC GOVERNANCE BANKING UNION ECONOMIC GOVERNANCE BANKING UNION ECONOMIC GOVERNANCE BANKING UNION ECONOMIC GOVERNANCE BANKING UNION ECONOMIC GOVERNANCE BANKING UNION ECONOMIC GOVERNANCE BANKING UNION ECONOMIC GOVERNANCE BANKING UNION ECONOMIC GOVERNO SCP ESAs EFSM EDP AMR CSRs AGS DGS EFSF ESM ESBR EBA EWG NCAs NRAs SRM MIP MTO NRP CRD SSM SGP EIP MTO SCP ESAs EFSM EDP AMR CSRs AGS DGS EFSF ESM ESBR EBA EWG NCAs NRAs SRM MIP MTO NRP CRD SSM SGP EIP MTO SCP ESAs EFSM EDP AMR CSRs AGS DGS EFSF ESM ESBR EBA EWG NCAs NRAs SRM ANCE BANKING UNION ECONOMIC GOVERNANCE BANKING UNION ECONOMIC GOVERNANCE BANKING UNION ECONOMIC GOVERNANCE BANKING UNION ECONOMIC GOVERNANCE BANKING UNION ECONOMIC GOVERNANCE BANKING UNION ECONOMIC GOVERNANCE BANKING UNION ECONOMIC GOVERNANCE BANMIP MTO NRP CRD SSM SGP EIP MTO SCP ESAs EFSM EDP AMR CSRs AGS DGS EFSF ESM ESBR EBA EWG NCAs NRAs SRM MIP MTO NRP CRD SSM SGP EIP MTO SCP ESAs EFSM EDP AMR CSRs AGS DGS EFSF ESM ESBR EBA EWG NCAs NRAs SRM MIP MTO NRP CRD SSM SGP EIP MTO SCP ESAs EFSM EDP AMR CSRs AGS DGS EFSF ESKING UNION ECONOMIC GOVERNANCE BANKING UNION ECONOMIC GOVERNANCE BANKING UNION ECONOMIC GOVERNANCE BANKING UNION ECONOMIC GOVERNANCE BANKING UNION ECONOMIC GOVERNANCE BANKING UNION ECONOMIC GOVERNANCE BANKING UNION ECONOMIC GOVERNANCE BANKING UNIOM ESBR EBA EWG NCAs NRAs SRM MIP MTO NRP CRD SSM SGP EIP MTO SCP ESAs EFSM EDP AMR CSRs AGS DGS EFSF ESM ESBR EBA EWG NCAs NRAs SRM MIP MTO NRP CRD SSM SGP EIP MTO SCP ESAs EFSM EDP AMR CSRs AGS DGS EFSF ESM ESBR EBA EWG NCAs NRAs SRM MIP MTO NRP CRD SSM SGP EIP MTO SCP ESAs EFN ECONOMIC GOVERNANCE BANKING UNION ECONOMIC GOVERNANCE BANKING UNION ECONOMIC GOVERNANCE BANKING UNION ECONOMIC GOVERNANCE BANKING UNION ECONOMIC GOVERNANCE BANKING UNION ECONOMIC GOVERNANCE BANKING UNION ECONOMIC GOVERNANCE BANKING UNION ECONOMISM EDP AMR CSRs AGS DGS EFSF ESM ESBR EBA EWG NCAs NRAs SRM MIP MTO NRP CRD SSM SGP EIP MTO SCP ESAs EFSM EDP AMR CSRs AGS DGS EFSF ESM ESBR EBA EWG NCAs NRAs SRM MIP MTO NRP CRD SSM SGP EIP MTO SCP ESAs EFSM EDP AMR CSRs AGS DGS EFSF ESM ESBR EBA EWG NCAs NRAs SRM MIP MTO NRP IC GOVERNANCE BANKING UNION ECONOMIC GOVERNANCE BANKING UNION ECONOMIC GOVERNANCE BANKING UNION ECONOMIC GOVERNANCE BANKING UNION ECONOMIC GOVERNANCE BANKING UNION ECONOMIC GOVERNANCE BANKING UNION ECONOMIC GOVERNANCE BANKING UNION ECONOMIC GOVERNCRD SSM SGP EIP MTO SCP ESAs EFSM EDP AMR CSRs AGS DGS EFSF ESM ESBR EBA EWG NCAs NRAs SRM MIP MTO NRP CRD SSM SGP EIP MTO SCP ESAs EFSM EDP AMR CSRs AGS DGS EFSF ESM ESBR EBA EWG NCAs NRAs SRM MIP MTO NRP CRD SSM SGP EIP MTO SCP ESAs EFSM EDP AMR CSRs AGS DGS EFSF ESM ESBR EBA EANCE BANKING UNION ECONOMIC GOVERNANCE BANKING UNION ECONOMIC GOVERNANCE BANKING UNION ECONOMIC GOVERNANCE BANKING UNION ECONOMIC GOVERNANCE BANKING UNION ECONOMIC GOVERNANCE BANKING UNION ECONOMIC GOVERNANCE BANKING UNION ECONOMIC GOVERNANCE BANWG NCAs NRAs SRM MIP MTO NRP CRD SSM SGP EIP MTO SCP ESAs EFSM EDP AMR CSRs AGS DGS EFSF ESM ESBR EBA EWG NCAs NRAs SRM MIP MTO NRP CRD SSM SGP EIP MTO SCP ESAs EFSM EDP AMR CSRs AGS DGS EFSF ESM ESBR EBA EWG NCAs NRAs SRM MIP MTO NRP CRD SSM SGP EIP MTO SCP ESAs EFSM EDP AMR CKING UNION ECONOMIC GOVERNANCE BANKING UNION ECONOMIC GOVERNANCE BANKING UNION ECONOMIC GOVERNANCE BANKING UNION ECONOMIC GOVERNANCE BANKING UNION ECONOMIC GOVERNANCE BANKING UNION ECONOMIC GOVERNANCE BANKING UNION ECONOMIC GOVERNANCE BANKING UNIOSRs AGS DGS EFSF ESM ESBR EBA EWG NCAs NRAs SRM MIP MTO NRP CRD SSM SGP EIP MTO SCP ESAs EFSM EDP AMR CSRs AGS DGS EFSF ESM ESBR EBA EWG NCAs NRAs SRM MIP MTO NRP CRD SSM SGP EIP MTO SCP ESAs EFSM EDP AMR CSRs AGS DGS EFSF ESM ESBR EBA EWG NCAs NRAs SRM MIP MTO NRP CRD SSM SGP N ECONOMIC GOVERNANCE BANKING UNION ECONOMIC GOVERNANCE BANKING UNION ECONOMIC GOVERNANCE BANKING UNION ECONOMIC GOVERNANCE BANKING UNION ECONOMIC GOVERNANCE BANKING UNION ECONOMIC GOVERNANCE BANKING UNION ECONOMIC GOVERNANCE BANKING UNION ECONOMEIP MTO SCP ESAs EFSM EDP AMR CSRs AGS DGS EFSF ESM ESBR EBA EWG NCAs NRAs SRM MIP MTO NRP CRD SSM SGP EIP MTO SCP ESAs EFSM EDP AMR CSRs AGS DGS EFSF ESM ESBR EBA EWG NCAs NRAs SRM MIP MTO NRP CRD SSM SGP EIP MTO SCP ESAs EFSM EDP AMR CSRs AGS DGS EFSF ESM ESBR EBA EWG NCAs NRIC GOVERNANCE BANKING UNION ECONOMIC GOVERNANCE BANKING UNION ECONOMIC GOVERNANCE BANKING UNION ECONOMIC GOVERNANCE BANKING UNION ECONOMIC GOVERNANCE BANKING UNION ECONOMIC GOVERNANCE BANKING UNION ECONOMIC GOVERNANCE BANKING UNION ECONOMIC GOVERNAs SRM MIP MTO NRP CRD SSM SGP EIP MTO SCP ESAs EFSM EDP AMR CSRs AGS DGS EFSF ESM ESBR EBA EWG NCAs NRAs SRM MIP MTO NRP CRD SSM SGP EIP MTO SCP ESAs EFSM EDP AMR CSRs AGS DGS EFSF ESM ESBR EBA EWG NCAs NRAs SRM MIP MTO NRP CRD SSM SGP EIP MTO SCP ESAs EFSM EDP AMR CSRs AGS DGS ANCE BANKING UNION ECONOMIC GOVERNANCE BANKING UNION ECONOMIC GOVERNANCE BANKING UNION ECONOMIC GOVERNANCE BANKING UNION ECONOMIC GOVERNANCE BANKING UNION ECONOMIC GOVERNANCE BANKING UNION ECONOMIC GOVERNANCE BANKING UNION ECONOMIC GOVERNANCE BANEFSF ESM ESBR EBA EWG NCAs NRAs SRM MIP MTO NRP CRD SSM SGP EIP MTO SCP ESAs EFSM EDP AMR CSRs AGS DGS EFSF ESM ESBR EBA EWG NCAs NRAs SRM MIP MTO NRP CRD SSM SGP EIP MTO SCP ESAs EFSM EDP AMR CSRs AGS DGS EFSF ESM ESBR EBA EWG NCAs NRAs SRM MIP MTO NRP CRD SSM SGP EIP MTO SCP EKING UNION ECONOMIC GOVERNANCE BANKING UNION ECONOMIC GOVERNANCE BANKING UNION ECONOMIC GOVERNANCE BANKING UNION ECONOMIC GOVERNANCE BANKING UNION ECONOMIC GOVERNANCE BANKING UNION ECONOMIC GOVERNANCE BANKING UNION ECONOMIC GOVERNANCE BANKING UNIOSAs EFSM EDP AMR CSRs AGS DGS EFSF ESM ESBR EBA EWG NCAs NRAs SRM MIP MTO NRP CRD SSM SGP EIP MTO SCP ESAs EFSM EDP AMR CSRs AGS DGS EFSF ESM ESBR EBA EWG NCAs NRAs SRM MIP MTO NRP CRD SSM SGP EIP MTO SCP ESAs EFSM EDP AMR CSRs AGS DGS EFSF ESM ESBR EBA EWG NCAs NRAs SRM MIP MTN ECONOMIC GOVERNANCE BANKING UNION ECONOMIC GOVERNANCE BANKING UNION ECONOMIC GOVERNANCE BANKING UNION ECONOMIC GOVERNANCE BANKING UNION ECONOMIC GOVERNANCE BANKING UNION ECONOMIC GOVERNANCE BANKING UNION ECONOMIC GOVERNANCE BANKING UNION ECONOMO SCP ESAs EFSM EDP AMR CSRs AGS DGS EFSF ESM ESBR EBA EWG NCAs NRAs SRM MIP MTO NRP CRD SSM SGP EIP MTO SCP ESAs EFSM EDP AMR CSRs AGS DGS EFSF ESM ESBR EBA EWG NCAs NRAs SRM MIP MTO NRP CRD SSM SGP EIP MTO SCP ESAs EFSM EDP AMR CSRs AGS DGS EFSF ESM ESBR EBA EWG NCAs NRAs SRM IC GOVERNANCE BANKING UNION ECONOMIC GOVERNANCE BANKING UNION ECONOMIC GOVERNANCE BANKING UNION ECONOMIC GOVERNANCE BANKING UNION ECONOMIC GOVERNANCE BANKING UNION ECONOMIC GOVERNANCE BANKING UNION ECONOMIC GOVERNANCE BANKING UNION ECONOMIC GOVERNMIP MTO NRP CRD SSM SGP EIP MTO SCP ESAs EFSM EDP AMR CSRs AGS DGS EFSF ESM ESBR EBA EWG NCAs NRAs SRM MIP MTO NRP CRD SSM SGP EIP MTO SCP ESAs EFSM EDP AMR CSRs AGS DGS EFSF ESM ESBR EBA EWG NCAs NRAs SRM MIP MTO NRP CRD SSM SGP EIP MTO SCP ESAs EFSM EDP AMR CSRs AGS DGS EFSF EANCE BANKING UNION ECONOMIC GOVERNANCE BANKING UNION ECONOMIC GOVERNANCE BANKING UNION ECONOMIC GOVERNANCE BANKING UNION ECONOMIC GOVERNANCE BANKING UNION ECONOMIC GOVERNANCE BANKING UNION ECONOMIC GOVERNANCE BANKING UNION ECONOMIC GOVERNANCE BANSM ESBR EBA EWG NCAs NRAs SRM MIP MTO NRP CRD SSM SGP EIP MTO SCP ESAs EFSM EDP AMR CSRs AGS DGS EFSF ESM ESBR EBA EWG NCAs NRAs SRM MIP MTO NRP CRD SSM SGP EIP MTO SCP ESAs EFSM EDP AMR CSRs AGS DGS EFSF ESM ESBR EBA EWG NCAs NRAs SRM MIP MTO NRP CRD SSM SGP EIP MTO SCP ESAs EFKING UNION ECONOMIC GOVERNANCE BANKING UNION ECONOMIC GOVERNANCE BANKING UNION ECONOMIC GOVERNANCE BANKING UNION ECONOMIC GOVERNANCE BANKING UNION ECONOMIC GOVERNANCE BANKING UNION ECONOMIC GOVERNANCE BANKING UNION ECONOMIC GOVERNANCE BANKING UNIOSM EDP AMR CSRs AGS DGS EFSF ESM ESBR EBA EWG NCAs NRAs SRM MIP MTO NRP CRD SSM SGP EIP MTO SCP ESAs EFSM EDP AMR CSRs AGS DGS EFSF ESM ESBR EBA EWG NCAs NRAs SRM MIP MTO NRP CRD SSM SGP EIP MTO SCP ESAs EFSM EDP AMR CSRs AGS DGS EFSF ESM ESBR EBA EWG NCAs NRAs SRM MIP MTO NRP N ECONOMIC GOVERNANCE BANKING UNION ECONOMIC GOVERNANCE BANKING UNION ECONOMIC GOVERNANCE BANKING UNION ECONOMIC GOVERNANCE BANKING UNION ECONOMIC GOVERNANCE BANKING UNION ECONOMIC GOVERNANCE BANKING UNION ECONOMIC GOVERNANCE BANKING UNION ECONOMCRD SSM SGP EIP MTO SCP ESAs EFSM EDP AMR CSRs AGS DGS EFSF ESM ESBR EBA EWG NCAs NRAs SRM MIP MTO NRP CRD SSM SGP EIP MTO SCP ESAs EFSM EDP AMR CSRs AGS DGS EFSF ESM ESBR EBA EWG NCAs NRAs SRM MIP MTO NRP CRD SSM SGP EIP MTO SCP ESAs EFSM EDP AMR CSRs AGS DGS EFSF ESM ESBR EBA EIC GOVERNANCE BANKING UNION ECONOMIC GOVERNANCE BANKING UNION ECONOMIC GOVERNANCE BANKING UNION ECONOMIC GOVERNANCE BANKING UNION ECONOMIC GOVERNANCE BANKING UNION ECONOMIC GOVERNANCE BANKING UNION ECONOMIC GOVERNANCE BANKING UNION ECONOMIC GOVERNWG NCAs NRAs SRM MIP MTO NRP CRD SSM SGP EIP MTO SCP ESAs EFSM EDP AMR CSRs AGS DGS EFSF ESM ESBR EBA EWG NCAs NRAs SRM MIP MTO NRP CRD SSM SGP EIP MTO SCP ESAs EFSM EDP AMR CSRs AGS DGS EFSF ESM ESBR EBA EWG NCAs NRAs SRM MIP MTO NRP CRD SSM SGP EIP MTO SCP ESAs EFSM EDP AMR CANCE BANKING UNION ECONOMIC GOVERNANCE BANKING UNION ECONOMIC GOVERNANCE BANKING UNION ECONOMIC GOVERNANCE BANKING UNION ECONOMIC GOVERNANCE BANKING UNION ECONOMIC GOVERNANCE BANKING UNION ECONOMIC GOVERNANCE BANKING UNION ECONOMIC GOVERNANCE BANSRs AGS DGS EFSF ESM ESBR EBA EWG NCAs NRAs SRM MIP MTO NRP CRD SSM SGP EIP MTO SCP ESAs EFSM EDP AMR CSRs AGS DGS EFSF ESM ESBR EBA EWG NCAs NRAs SRM MIP MTO NRP CRD SSM SGP EIP MTO SCP ESAs EFSM EDP AMR CSRs AGS DGS EFSF ESM ESBR EBA EWG NCAs NRAs SRM MIP MTO NRP CRD SSM SGP KING UNION ECONOMIC GOVERNANCE BANKING UNION ECONOMIC GOVERNANCE BANKING UNION ECONOMIC GOVERNANCE BANKING UNION ECONOMIC GOVERNANCE BANKING UNION ECONOMIC GOVERNANCE BANKING UNION ECONOMIC GOVERNANCE BANKING UNION ECONOMIC GOVERNANCE BANKING UNIOSGP EIP MTO SCP ESAs EFSM EDP AMR CSRs AGS DGS EFSF ESM ESBR EBA EWG NCAs NRAs SRM MIP MTO NRP CRD SSM SGP EIP MTO SCP ESAs EFSM EDP AMR CSRs AGS DGS EFSF ESM ESBR EBA EWG NCAs NRAs SRM MIP MTO NRP CRD SSM SGP EIP MTO SCP ESAs EFSM EDP AMR CSRs AGS DGS EFSF ESM ESBR EBA EWG NCAs N ECONOMIC GOVERNANCE BANKING UNION ECONOMIC GOVERNANCE BANKING UNION ECONOMIC GOVERNANCE BANKING UNION ECONOMIC GOVERNANCE BANKING UNION ECONOMIC GOVERNANCE BANKING UNION ECONOMIC GOVERNANCE BANKING UNION ECONOMIC GOVERNANCE BANKING UNION ECONOMNRAs SRM MIP MTO NRP CRD SSM SGP EIP MTO SCP ESAs EFSM EDP AMR CSRs AGS DGS EFSF ESM ESBR EBA EWG NCAs NRAs SRM MIP MTO NRP CRD SSM SGP EIP MTO SCP ESAs EFSM EDP AMR CSRs AGS DGS EFSF ESM ESBR EBA EWG NCAs NRAs SRM MIP MTO NRP CRD SSM SGP EIP MTO SCP ESAs EFSM EDP AMR CSRs AGS DIC GOVERNANCE BANKING UNION ECONOMIC GOVERNANCE BANKING UNION ECONOMIC GOVERNANCE BANKING UNION ECONOMIC GOVERNANCE BANKING UNION ECONOMIC GOVERNANCE BANKING UNION ECONOMIC GOVERNANCE BANKING UNION ECONOMIC GOVERNANCE BANKING UNION ECONOMIC GOVERNGS EFSF ESM ESBR EBA EWG NCAs NRAs SRM MIP MTO NRP CRD SSM SGP EIP MTO SCP ESAs EFSM EDP AMR CSRs AGS DGS EFSF ESM ESBR EBA EWG NCAs NRAs SRM MIP MTO NRP CRD SSM SGP EIP MTO SCP ESAs EFSM EDP AMR CSRs AGS DGS EFSF ESM ESBR EBA EWG NCAs NRAs SRM MIP MTO NRP CRD SSM SGP EIP MTO SANCE BANKING UNION ECONOMIC GOVERNANCE BANKING UNION ECONOMIC GOVERNANCE BANKING UNION ECONOMIC GOVERNANCE BANKING UNION ECONOMIC GOVERNANCE BANKING UNION ECONOMIC GOVERNANCE BANKING UNION ECONOMIC GOVERNANCE BANKING UNION ECONOMIC GOVERNANCE BANCP ESAs EFSM EDP AMR CSRs AGS DGS EFSF ESM ESBR EBA EWG NCAs NRAs SRM MIP MTO NRP CRD SSM SGP EIP MTO SCP ESAs EFSM EDP AMR CSRs AGS DGS EFSF ESM ESBR EBA EWG NCAs NRAs SRM MIP MTO NRP CRD SSM SGP EIP MTO SCP ESAs EFSM EDP AMR CSRs AGS DGS EFSF ESM ESBR EBA EWG NCAs NRAs SRM MIKING UNION ECONOMIC GOVERNANCE BANKING UNION ECONOMIC GOVERNANCE BANKING UNION ECONOMIC GOVERNANCE BANKING UNION ECONOMIC GOVERNANCE BANKING UNION ECONOMIC GOVERNANCE BANKING UNION ECONOMIC GOVERNANCE BANKING UNION ECONOMIC GOVERNANCE BANKING UNIOP MTO NRP CRD SSM SGP EIP MTO SCP ESAs EFSM EDP AMR CSRs AGS DGS EFSF ESM ESBR EBA EWG NCAs NRAs SRM MIP MTO NRP CRD SSM SGP EIP MTO SCP ESAs EFSM EDP AMR CSRs AGS DGS EFSF ESM ESBR EBA EWG NCAs NRAs SRM MIP MTO NRP CRD SSM SGP EIP MTO SCP ESAs EFSM EDP AMR CSRs AGS DGS EFSF ESM N ECONOMIC GOVERNANCE BANKING UNION ECONOMIC GOVERNANCE BANKING UNION ECONOMIC GOVERNANCE BANKING UNION ECONOMIC GOVERNANCE BANKING UNION ECONOMIC GOVERNANCE BANKING UNION ECONOMIC GOVERNANCE BANKING UNION ECONOMIC GOVERNANCE BANKING UNION ECONOMESBR EBA EWG NCAs NRAs SRM MIP MTO NRP CRD SSM SGP EIP MTO SCP ESAs EFSM EDP AMR CSRs AGS DGS EFSF ESM ESBR EBA EWG NCAs NRAs SRM MIP MTO NRP CRD SSM SGP EIP MTO SCP ESAs EFSM EDP AMR CSRs AGS DGS EFSF ESM ESBR EBA EWG NCAs NRAs SRM MIP MTO NRP CRD SSM SGP EIP MTO SCP ESAs EFSM IC GOVERNANCE BANKING UNION ECONOMIC GOVERNANCE BANKING UNION ECONOMIC GOVERNANCE BANKING UNION ECONOMIC GOVERNANCE BANKING UNION ECONOMIC GOVERNANCE BANKING UNION ECONOMIC GOVERNANCE BANKING UNION ECONOMIC GOVERNANCE BANKING UNION ECONOMIC GOVERNEDP AMR CSRs AGS DGS EFSF ESM ESBR EBA EWG NCAs NRAs SRM MIP MTO NRP CRD SSM SGP EIP MTO SCP ESAs EFSM EDP AMR CSRs AGS DGS EFSF ESM ESBR EBA EWG NCAs NRAs SRM MIP MTO NRP CRD SSM SGP EIP MTO SCP ESAs EFSM EDP AMR CSRs AGS DGS EFSF ESM ESBR EBA EWG NCAs NRAs SRM MIP MTO NRP CRANCE BANKING UNION ECONOMIC GOVERNANCE BANKING UNION ECONOMIC GOVERNANCE BANKING UNION ECONOMIC GOVERNANCE BANKING UNION ECONOMIC GOVERNANCE BANKING UNION ECONOMIC GOVERNANCE BANKING UNION ECONOMIC GOVERNANCE BANKING UNION ECONOMIC GOVERNANCE BAND SSM SGP EIP MTO SCP ESAs EFSM EDP AMR CSRs AGS DGS EFSF ESM ESBR EBA EWG NCAs NRAs SRM MIP MTO NRP CRD SSM SGP EIP MTO SCP ESAs EFSM EDP AMR CSRs AGS DGS EFSF ESM ESBR EBA EWG NCAs NRAs SRM MIP MTO NRP CRD SSM SGP EIP MTO SCP ESAs EFSM EDP AMR CSRs AGS DGS EFSF ESM ESBR EBA EWKING UNION ECONOMIC GOVERNANCE BANKING UNION ECONOMIC GOVERNANCE BANKING UNION ECONOMIC GOVERNANCE BANKING UNION ECONOMIC GOVERNANCE BANKING UNION ECONOMIC GOVERNANCE BANKING UNION ECONOMIC GOVERNANCE BANKING UNION ECONOMIC GOVERNANCE BANKING UNIOG NCAs NRAs SRM MIP MTO NRP CRD SSM SGP EIP MTO SCP ESAs EFSM EDP AMR CSRs AGS DGS EFSF ESM ESBR EBA EWG NCAs NRAs SRM MIP MTO NRP CRD SSM SGP EIP MTO SCP ESAs EFSM EDP AMR CSRs AGS DGS EFSF ESM ESBR EBA EWG NCAs NRAs SRM MIP MTO NRP CRD SSM SGP EIP MTO SCP ESAs EFSM EDP AMR CSRN ECONOMIC GOVERNANCE BANKING UNION ECONOMIC GOVERNANCE BANKING UNION ECONOMIC GOVERNANCE BANKING UNION ECONOMIC GOVERNANCE BANKING UNION ECONOMIC GOVERNANCE BANKING UNION ECONOMIC GOVERNANCE BANKING UNION ECONOMIC GOVERNANCE BANKING UNION ECONOMs AGS DGS EFSF ESM ESBR EBA EWG NCAs NRAs SRM MIP MTO NRP CRD SSM SGP EIP MTO SCP ESAs EFSM EDP AMR CSRs AGS DGS EFSF ESM ESBR EBA EWG NCAs NRAs SRM MIP MTO NRP CRD SSM SGP EIP MTO SCP ESAs EFSM EDP AMR CSRs AGS DGS EFSF ESM ESBR EBA EWG NCAs NRAs SRM MIP MTO NRP CRD SSM SGP EIP IC GOVERNANCE BANKING UNION ECONOMIC GOVERNANCE BANKING UNION ECONOMIC GOVERNANCE BANKING UNION ECONOMIC GOVERNANCE BANKING UNION ECONOMIC GOVERNANCE BANKING UNION ECONOMIC GOVERNANCE BANKING UNION ECONOMIC GOVERNANCE BANKING UNION ECONOMIC GOVERNEIP MTO SCP ESAs EFSM EDP AMR CSRs AGS DGS EFSF ESM ESBR EBA EWG NCAs NRAs SRM MIP MTO NRP CRD SSM SGP EIP MTO SCP ESAs EFSM EDP AMR CSRs AGS DGS EFSF ESM ESBR EBA EWG NCAs NRAs SRM MIP MTO NRP CRD SSM SGP EIP MTO SCP ESAs EFSM EDP AMR CSRs AGS DGS EFSF ESM ESBR EBA EWG NCAs NRANCE BANKING UNION ECONOMIC GOVERNANCE BANKING UNION ECONOMIC GOVERNANCE BANKING UNION ECONOMIC GOVERNANCE BANKING UNION ECONOMIC GOVERNANCE BANKING UNION ECONOMIC GOVERNANCE BANKING UNION ECONOMIC GOVERNANCE BANKING UNION ECONOMIC GOVERNANCE BANAs SRM MIP MTO NRP CRD SSM SGP EIP MTO SCP ESAs EFSM EDP AMR CSRs AGS DGS EFSF ESM ESBR EBA EWG NCAs NRAs SRM MIP MTO NRP CRD SSM SGP EIP MTO SCP ESAs EFSM EDP AMR CSRs AGS DGS EFSF ESM ESBR EBA EWG NCAs NRAs SRM MIP MTO NRP CRD SSM SGP EIP MTO SCP ESAs EFSM EDP AMR CSRs AGS DGS KING UNION ECONOMIC GOVERNANCE BANKING UNION ECONOMIC GOVERNANCE BANKING UNION ECONOMIC GOVERNANCE BANKING UNION ECONOMIC GOVERNANCE BANKING UNION ECONOMIC GOVERNANCE BANKING UNION ECONOMIC GOVERNANCE BANKING UNION ECONOMIC GOVERNANCE BANKING UNIOEFSF ESM ESBR EBA EWG NCAs NRAs SRM MIP MTO NRP CRD SSM SGP EIP MTO SCP ESAs EFSM EDP AMR CSRs AGS DGS EFSF ESM ESBR EBA EWG NCAs NRAs SRM MIP MTO NRP CRD SSM SGP EIP MTO SCP ESAs EFSM EDP AMR CSRs AGS DGS EFSF ESM ESBR EBA EWG NCAs NRAs SRM MIP MTO NRP CRD SSM SGP EIP MTO SCP EN ECONOMIC GOVERNANCE BANKING UNION ECONOMIC GOVERNANCE BANKING UNION ECONOMIC GOVERNANCE BANKING UNION ECONOMIC GOVERNANCE BANKING UNION ECONOMIC GOVERNANCE BANKING UNION ECONOMIC GOVERNANCE BANKING UNION ECONOMIC GOVERNANCE BANKING UNION ECONOMSAs EFSM EDP AMR CSRs AGS DGS EFSF ESM ESBR EBA EWG NCAs NRAs SRM MIP MTO NRP CRD SSM SGP EIP MTO SCP ESAs EFSM EDP AMR CSRs AGS DGS EFSF ESM ESBR EBA EWG NCAs NRAs SRM MIP MTO NRP CRD SSM SGP EIP MTO SCP ESAs EFSM EDP AMR CSRs AGS DGS EFSF ESM ESBR EBA EWG NCAs NRAs SRM MIP MTIC GOVERNANCE BANKING UNION ECONOMIC GOVERNANCE BANKING UNION ECONOMIC GOVERNANCE BANKING UNION ECONOMIC GOVERNANCE BANKING UNION ECONOMIC GOVERNANCE BANKING UNION ECONOMIC GOVERNANCE BANKING UNION ECONOMIC GOVERNANCE BANKING UNION ECONOMIC GOVERNO SCP ESAs EFSM EDP AMR CSRs AGS DGS EFSF ESM ESBR EBA EWG NCAs NRAs SRM MIP MTO NRP CRD SSM SGP EIP MTO SCP ESAs EFSM EDP AMR CSRs AGS DGS EFSF ESM ESBR EBA EWG NCAs NRAs SRM MIP MTO NRP CRD SSM SGP EIP MTO SCP ESAs EFSM EDP AMR CSRs AGS DGS EFSF ESM ESBR EBA EWG NCAs NRAs SRM ANCE BANKING UNION ECONOMIC GOVERNANCE BANKING UNION ECONOMIC GOVERNANCE BANKING UNION ECONOMIC GOVERNANCE BANKING UNION ECONOMIC GOVERNANCE BANKING UNION ECONOMIC GOVERNANCE BANKING UNION ECONOMIC GOVERNANCE BANKING UNION ECONOMIC GOVERNANCE GOV
Contact: [email protected] more information: http://www.europarl.europa.eu/committees/en/ECON/home.html
DIRECTORATE GENERAL FOR INTERNAL POLICIES ECONOMIC GOVERNANCE SUPPORT UNIT
IPOLEGOV
PE 528.761ISBN 978-92-823-6063-7doi: 10.2861/71214
CAT Q
A-05-14-005-EN
-N


![Economic governance, general tax policy · 2017-09-26 · Economic governance, general tax policy PE 606.773 1. ... 1 - ECONOMIC GOVERNANCE - [4.1.4.] Economic governance refers to](https://static.fdocuments.us/doc/165x107/5f4e57af2463c468753247c3/economic-governance-general-tax-2017-09-26-economic-governance-general-tax-policy.jpg)