Robust nitrate removal and bioenergy generation with ...
9
Contents lists available at ScienceDirect Bioresource Technology journal homepage: www.elsevier.com/locate/biortech Robust nitrate removal and bioenergy generation with elucidating functional microorganisms under carbon constraint in a novel multianode tidal constructed wetland coupled with microbial fuel cell Longmian Wang a,1, ⁎ , Qingqing Pang a,1 , Ying Zhou b , Fuquan Peng a , Fei He a , Weixin Li a,c , Bin Xu a , Yibin Cui a , Xiang Zhu a a Nanjing Institute of Environmental Sciences, Ministry of Ecology and Environment, Nanjing 210042, PR China b College of Environment, Hohai University, Nanjing 210098, PR China c Collaborative Innovation Center of Atmospheric Environment and Equipment Technology, Nanjing University of Information Science & Technology, Nanjing 210044, PR China GRAPHICAL ABSTRACT ARTICLE INFO Keywords: Electricigens Tidal flow constructed wetland Microbial fuel cell Nitrate removal Nitrogen–transformation genera ABSTRACT This study investigated synthetic wastewater treatment under low inflow C/N ratio and characterized NO 3 - –N- transforming and electricity-producing bacteria in a multi-anode tidal constructed wetland–microbial fuel cell (TFCW–MFC). The optimal concurrent average removal rates of NH 4 + –N and NO 3 - –N were 73% and 78%, respectively, under a flood/rest/flood time of 4 h/2h/4h in “tide” mode accompanied by one recirculation. The lowest NO 3 - –N concentration among all anodes was observed when the electrode gap was 45 cm. Similarly, the 45 cm anode exhibited selective enrichment of Variovorax and Azoarcus. Correction analysis showed that the high relative abundance of Azoarcus was crucial in enhancing NO 3 - –N removal, and the internal resistance significantly decreased as the relative abundance of Acidovorax increased. These results suggest that NO 3 - –N removal and bioelectricity generation can be promoted in a TFCW–MFC with limited carbon by improving the culture conditions for specific genera. https://doi.org/10.1016/j.biortech.2020.123744 Received 23 April 2020; Received in revised form 23 June 2020; Accepted 23 June 2020 ⁎ Corresponding author. E-mail address: [email protected] (L. Wang). 1 Co-first authors. Bioresource Technology 314 (2020) 123744 Available online 26 June 2020 0960-8524/ © 2020 Elsevier Ltd. All rights reserved. T
Transcript of Robust nitrate removal and bioenergy generation with ...

Contents lists available at ScienceDirect
Bioresource Technology
journal homepage: www.elsevier.com/locate/biortech
Robust nitrate removal and bioenergy generation with elucidatingfunctional microorganisms under carbon constraint in a novel multianodetidal constructed wetland coupled with microbial fuel cell
Longmian Wanga,1,⁎, Qingqing Panga,1, Ying Zhoub, Fuquan Penga, Fei Hea, Weixin Lia,c, Bin Xua,Yibin Cuia, Xiang Zhua
aNanjing Institute of Environmental Sciences, Ministry of Ecology and Environment, Nanjing 210042, PR Chinab College of Environment, Hohai University, Nanjing 210098, PR Chinac Collaborative Innovation Center of Atmospheric Environment and Equipment Technology, Nanjing University of Information Science & Technology, Nanjing 210044, PRChina
G R A P H I C A L A B S T R A C T
A R T I C L E I N F O
Keywords:ElectricigensTidal flow constructed wetlandMicrobial fuel cellNitrate removalNitrogen–transformation genera
A B S T R A C T
This study investigated synthetic wastewater treatment under low inflow C/N ratio and characterized NO3−–N-
transforming and electricity-producing bacteria in a multi-anode tidal constructed wetland–microbial fuel cell(TFCW–MFC). The optimal concurrent average removal rates of NH4
+–N and NO3−–N were 73% and 78%,
respectively, under a flood/rest/flood time of 4 h/2h/4h in “tide” mode accompanied by one recirculation. Thelowest NO3
−–N concentration among all anodes was observed when the electrode gap was 45 cm. Similarly, the45 cm anode exhibited selective enrichment of Variovorax and Azoarcus. Correction analysis showed that thehigh relative abundance of Azoarcus was crucial in enhancing NO3
−–N removal, and the internal resistancesignificantly decreased as the relative abundance of Acidovorax increased. These results suggest that NO3
−–Nremoval and bioelectricity generation can be promoted in a TFCW–MFC with limited carbon by improving theculture conditions for specific genera.
https://doi.org/10.1016/j.biortech.2020.123744Received 23 April 2020; Received in revised form 23 June 2020; Accepted 23 June 2020
⁎ Corresponding author.E-mail address: [email protected] (L. Wang).
1 Co-first authors.
Bioresource Technology 314 (2020) 123744
Available online 26 June 20200960-8524/ © 2020 Elsevier Ltd. All rights reserved.
T

1. Introduction
Constructed wetland–microbial fuel cell (CW–MFC), which is anecological sewage treatment system, has been applied to treat varioustypes of wastewater (Yadav et al., 2012; Oon et al., 2017; Doherty et al.,2015). This technology can enhance the removal efficiency of nitrogenwhile generating electric energy (Fang et al., 2013). Compared with theopen-circuit type, the closed-circuit CW–MFC can improve the removalrate of nitrate nitrogen (NO3
−–N) by 30%–40% (Wang et al., 2016)
with the highest rate of up to approximately 95% (Oon et al., 2018).Coupling hydrophytes with sediment MFCs produces a good removaleffect on NO3
−–N (85%) for surface water treatment with a low con-centration of nitrogen (Xu et al., 2019b); however, the result of high-strength NO3
−–N abasement is unknown. The electricity output can beincreased by changing the electrode materials, hydraulic retention time(HRT), and wastewater flow direction. The power density can reach222 mW/m2 (Sophia and Sreeja, 2017). The bioenergy generationunder different electrode gaps has also been compared (Li et al., 2012;
Fig. 1. Structural chart of TFCW–MFC (A, and B) and specific operation mode in different stages (C). Gray, blue, green, and white represent the feed, flood, drain, andrest phases in “tide” mode, respectively. The effluents from different recirculation times are in the end of the flood phase. (For interpretation of the references tocolour in this figure legend, the reader is referred to the web version of this article.)
L. Wang, et al. Bioresource Technology 314 (2020) 123744
2

Song et al., 2017), whereas existing studies are mainly conducted underhigh-chemical-oxygen-demand (COD) inflow. Therefore, the robustNO3
−–N removal using CW–MFC while ensuring electricity harvestunder a low COD/total nitrogen (TN) or C/N ratio at the influent mustbe solved.
Functional genes play an important role in nitrogen transformation.nxrA (NO2
−–N → NO3−–N) and narG (NO3
−-N → NO2−–N) and nirS
(NO2−–N → NO) are regarded as the main limiting factors in deni-
trogenation. nrfA (NO3−–N → NH4
+–N) in dissimilatory nitrate re-duction to ammonium (NH4
+–N) (DNRA) is also a key functional gene.Nitrogen-related microorganisms are affected by various elements inwastewater, and the various transformation ways of nitrogen generallyexist contemporaneously. Wang et al. (2016) observed that the relativeabundance of beta-proteobacteria, nitrobacteria, and denitrifying bac-teria in closed-circuit CW–MFC evidently improves compared with thatin open circuit under micro neutral water inflow, and the removal rateof NO3
−–N increases by 40.2%. In addition, comparison of filter sizesshowed that small particle size promotes the diversities of De-chloromonas and Desulfobulbus, resulting in a high removal rate (87.1%)of NO3
−–N (Wang et al., 2017). Many previous studies performed mi-crobial analyses under sufficient carbon sources, but few explored themicroorganisms in a carbon-constrained environment and performedan in-depth interpretation of the role of denitrification functional genesin NO3
−–N removal.Previous studies focused on the diversity and composition in elec-
trode layers of electricigens in CW–MFC. Fang et al. (2017) proved thatthe abundances of Geobacter, Desulfobulbus, and Desulfuromonas in theanode layer are higher than those in the cathode layer because of theanaerobic environment. In addition to electrode structure, substrateconcentration, pH, and HRT are important factors influencing the mi-crobial composition associated with power production in CW–MFC(Wang et al., 2016, 2019a; Tao et al., 2020). Competition or mutualismpossibly exists between coexisting electricigens and denitrifying mi-croorganisms (Xu et al., 2019a). However, the correlation betweenelectricigens and denitrifying bacteria and the contribution of micro-organisms to denitrification and electricity production were not stu-died.
Tidal flow CW (TFCW) can remove considerable amounts ofNH4
+–N due to the improved oxygen environment (Wu et al., 2011).Conversely, the high oxygen condition of wetland limits the deni-trification process, which enriches NO3
−–N in the effluent. Thus, TFCWwas combined with MFC in one of the first attempts to achieve thesatisfactory removal of NH4
+–N and NO3−–N and harvest energy under
a limited C/N ratio at the inflow.The main goal of this study was to understand NO3
−–N removal andelectricity production mechanisms at the molecular level and the role ofmicrobes in NO3
−–N transformation and bioenergy generation. Thespecific objectives are as follows: (1) to evaluate the treatment perfor-mance under different flooding and emptying times at identical ratioand recirculation times (Rt); (2) to compare the capacity of bioelec-tricity generation using multi-anode systems; and (3) to investigate thespatial compositions of the primary nitrogen-transformation functionalgenes and electroactive microbes in TFCW–MFC and examine the re-sponse of the dominant genera to NO3
−–N removal and electricityproduction. This configuration was adopted under the assumption thata promising operation mode can concurrently relieve the potentialnegative impact of NH4
+–N and NO3−–N on wastewater. The estab-
lishment and analysis of the molecular relationships could also accel-erate the targeted NO3
−–N transformation and ensure bioelectricitygeneration by stimulating specific functional microbial communities atthe genus level for implementation of this technology.
2. Materials and methods
2.1. Construction and operation of TFCW–MFC
Fig. 1A shows the construction of TFCW–MFC. The TFCW–MFCreactor is mainly composed of three parts: a synthetic wastewater tank,a reactor cylinder, and a circulating tank. The synthetic wastewatertank and circulating tank are composed of a 100 L polyethylene cy-linder with cover. The reactor cylinder is composed of a plexiglass cy-linder with a diameter of 50 cm and a height of 85 cm. Gravel with aparticle size of 0.5–1 cm was selected as the filter material, and acti-vated carbon–carbon felt–copper mesh (particle size of activated carbonof 3–5 mm) was used as the electrode material. In the system, thecathode was placed on the top directly contacting with air (10 cmthick), whereas three anodes (6 cm thick) were embedded under thecathode with the distances of 15 (A-2), 30 (A-3), and 45 cm (A-4) be-tween the filling position of the three anodes and the cathode. The filtermaterial was used as the separating layer (with thickness about 10, 9,and 9 cm from top to bottom) between adjacent electrode layers. Thelower filter material (9 cm thick) contained pebble at the bottom(15 cm thick) to improve the wastewater distribution in the system andprevent blockage. The adjustable resistance of 1000 Ω was connectedoutside between the electrodes through the copper wire, and the digitalvoltage acquisition system (Keithley 2700, Tektronix Company, USA)was connected to both ends of the resistance via the wire to monitorand record the voltage output of the TFCW–MFC reactor in real time.Cattail, which commonly exists in wetlands and can increase the ac-tivity of microorganisms, was planted on the surface of the cathodelayer. The inlet was arranged at the lower part of the reactor cylinder.The up-flow water distribution method was adopted to set six samplingpoints for testing of water quality (W1, W2, W3, W4, W5, and W6). Thetotal outlet was W6. Six filter material sampling points, namely,cathode layer (A-1), upper filter material (A-5), anode layer Ⅰ (A-2),anode layer Ⅱ (A-3), anode layer III (A-4), and lower filter material (A-6), were laid. A tin paper protective film was wrapped outside the cy-linder to prevent algal growth inside the reactor. The system was placedoutdoors and sheltered from wind and rain by a tent. The temperaturewas in the range of 15 °C–32 °C during the experimental period.
In multi-anode TFCW–MFC, a peristaltic pump (BT 600–2 J, LongerPrecision Pump Co., Ltd., UK) and a high pressure pump (2BV5121,Shanghai ShangBing Pumps Co., Ltd., China) were employed to controlthe intermittent water inflow and instantaneous drainage, respectively.One cycle (“tide”) includes four phases: feed, flood, drain, and rest(Fig. 1B). The C/N ratio in the influent was approximately 3. Thesynthetic sewage was treated by consecutive internal recirculation forthree times. The multi-anode TFCW–MFC was adopted to operate for240 days under the ratio of flood to rest time of 2:1. On the basis of theflood–rest time of sewage in the reactor, the study was divided intothree stages (2 h–1 h, 4 h–2 h, and 6 h–3 h), the specific strategy ofwhich is shown in Fig. 1C.
2.2. Wastewater composition and analysis
Synthetic wastewater was used for configuration to control the in-fluent characteristics. C6H12O6, nutrient salts (NH4Cl, NaNO3, andNaNO2), buffer solution (KH2PO4 and HCl), and trace elements (CaCl2,MgSO4, and FeSO4) were contained.
Water samples were collected every 2 days at the time point ofjuncture between the flood and drain phases. The influent and effluentsof all layers resulting from Rt = 1 and Rt = 3 were collected in multi-anode TFCW–MFC, and each sample was taken in triplicate. Water andwastewater quality indexes, including pH, dissolved oxygen (DO), COD,TN, NH4
+–N, NO3−–N, and nitrite (NO2
−–N) levels, were determinedin accordance with standard methods (American Public HealthAssociation, 2012). The electricity-producing performance of the multi-anode TFCW–MFC system was analyzed under optimal recirculation
L. Wang, et al. Bioresource Technology 314 (2020) 123744
3
numbers and flood–rest times. Output voltage was automatically ac-quired in a frequency of 1 time/min using the digital voltage acquisi-tion system (Keithley 2700, Tektronix Company, US).
2.3. High-throughput sequencing analysis
Spatial samples (A-1—A-6) were collected for cryo-preservation inthe rest phase at the end of the experiment to analyze the distributioncharacteristics of the bacteria in the system under the optimum op-eration mode. Three samples from the same space were mixed to formone composite sample. DNA extractions were carried out for varioussample particles (250 mg/each sample) by using the MIO-DNA kit (MOBIO Laboratories, Carlsbad, CA, USA) in accordance with the manu-facturer’s instructions. Subsequently, 3 µL of DNA extract was suctionedfor 1.2% agarose gel electrophoresis. High-quality DNAs with clearbright bands (approximate 30 ng/µL DNA content) could be used astemplate for polymerase chain reaction (PCR). nxrA, narG, nirS, nrfA,and 16S rRNA V4–V5 were amplified by PCR using universal bacterialprimers. In accordance with the requirements of Illumina HiSeq, two-way sequencing and two-step PCR amplification were adopted as pre-viously described (Wang et al., 2020) to construct the library.
Sequencing data were deposited in the National Center forBiotechnology Information. The accession numbers of nxrA, narG, nirS,nrfA, and 16S rRNA V4–V5 are SRP197082, SRP196470, SRP197047,SRP197078, and SRP194054, respectively.
2.4. Statistical analysis
The contaminants removal rates were calculated by the followingformula (Eq. (1)). R, Ci and Ce refers to the removal rate, influentconcentration and effluent concentration (mg/L). The electricity gen-eration indices were calculated using Ohm's law.
= ×CC
R 100%i
e (1)
The change diagram of wastewater concentration and bioelectricitywas drawn using Origin software (Origin 2018, OriginLab Corporation,MA, USA). Raw sequencing data were processed using mothur V.1.39.5software (The University of Michigan, MI, USA) under valid sequencesdistributed to operational taxonomic units (OTUs) with 97% similarity.Statistical analysis was conducted by SPSS 23.0 software (IBMCorporation, New York, NY, USA) for the determination of Spearmancorrelation. p < 0.05 means significant correlation, and p < 0.01indicates extremely significant correlation.
3. Results and discussion
3.1. Analysis of COD and nitrogen removal under different operation modes
In the multi-anode TFCW–MFC system, results showed that the pHand DO concentration in the effluent were in the range of 6.87–7.54 and0.75–1.99 mg/L, respectively, after the system stabilized. This DOconcentration was higher than those in other studies (Fang et al., 2013)because of the oxygen absorbed into the reactor during tidal circula-tion. In addition, no evident differences in pH and DO were observed,irrespective of recirculation times and flood-rest time variation, and thepH at the effluent represented weak alkaline. This result indicates thatthe system has high capacity for resistance to shock loading and that noadverse anaerobic acidification occurred, which is conducive to themetabolic function of microorganisms.
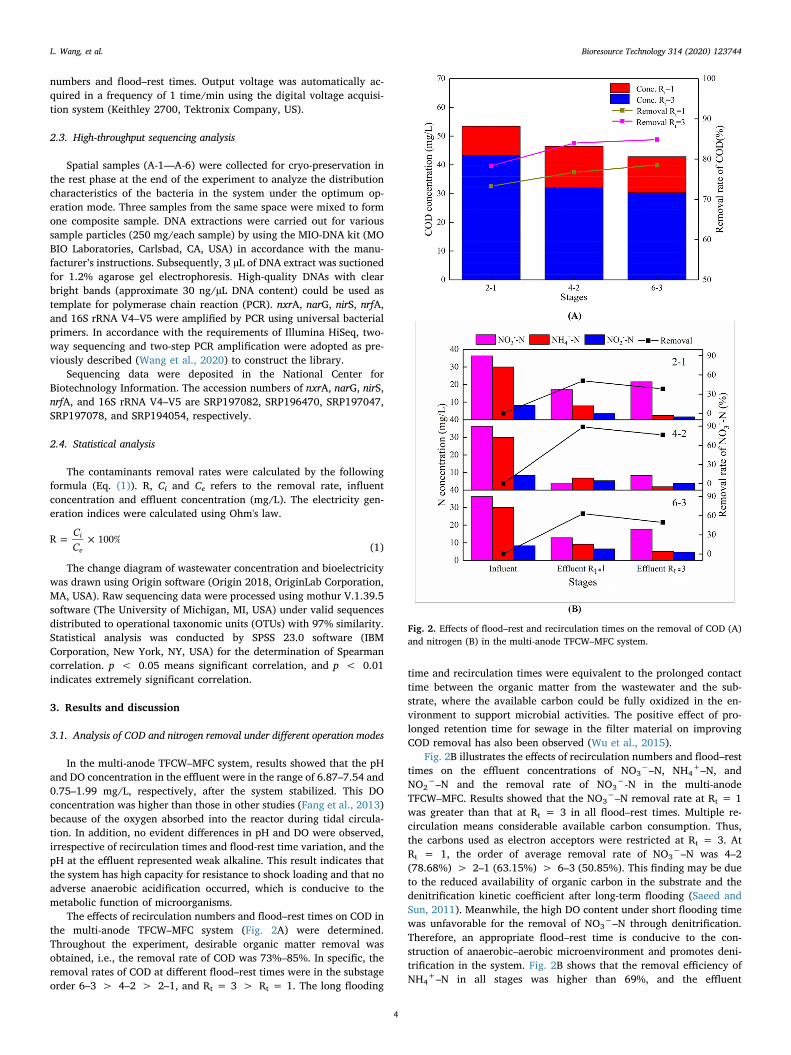
The effects of recirculation numbers and flood–rest times on COD inthe multi-anode TFCW–MFC system (Fig. 2A) were determined.Throughout the experiment, desirable organic matter removal wasobtained, i.e., the removal rate of COD was 73%–85%. In specific, theremoval rates of COD at different flood–rest times were in the substageorder 6–3 > 4–2 > 2–1, and Rt = 3 > Rt = 1. The long flooding
time and recirculation times were equivalent to the prolonged contacttime between the organic matter from the wastewater and the sub-strate, where the available carbon could be fully oxidized in the en-vironment to support microbial activities. The positive effect of pro-longed retention time for sewage in the filter material on improvingCOD removal has also been observed (Wu et al., 2015).
Fig. 2B illustrates the effects of recirculation numbers and flood–resttimes on the effluent concentrations of NO3
−–N, NH4+–N, and
NO2−–N and the removal rate of NO3
−-N in the multi-anodeTFCW–MFC. Results showed that the NO3
−–N removal rate at Rt = 1was greater than that at Rt = 3 in all flood–rest times. Multiple re-circulation means considerable available carbon consumption. Thus,the carbons used as electron acceptors were restricted at Rt = 3. AtRt = 1, the order of average removal rate of NO3
−–N was 4–2(78.68%) > 2–1 (63.15%) > 6–3 (50.85%). This finding may be dueto the reduced availability of organic carbon in the substrate and thedenitrification kinetic coefficient after long-term flooding (Saeed andSun, 2011). Meanwhile, the high DO content under short flooding timewas unfavorable for the removal of NO3
−–N through denitrification.Therefore, an appropriate flood–rest time is conducive to the con-struction of anaerobic–aerobic microenvironment and promotes deni-trification in the system. Fig. 2B shows that the removal efficiency ofNH4
+–N in all stages was higher than 69%, and the effluent
Fig. 2. Effects of flood–rest and recirculation times on the removal of COD (A)and nitrogen (B) in the multi-anode TFCW–MFC system.
L. Wang, et al. Bioresource Technology 314 (2020) 123744
4

concentration of NH4+–N at Rt = 3 (1.88–5.12 mg/L) was smaller than
that at Rt = 1 (6.80–9.17 mg/L). Moreover, the flood–rest time exertedno evident effect on NH4
+–N removal at the identical recirculationtime. The removal of NH4
+–N in CW resulted from the comprehensivecoordination of various actions, including nitrification, adsorption, andassimilation related to organic matter decomposition (Sun et al., 2005).The effluent concentration of NO2
−–N was independent of the re-circulation numbers and flood–rest times, given that NO2
−–N is locatedin the intermediate transition state of nitrification and denitrification.In general, the removal effect of NO3
−–N is given priority, followed byensuring the high-efficient removal of NH4
+–N. The operation modewith the flood–rest time of 4–2 and Rt = 1 was employed, which de-monstrated the best nitrogen removal performance using multi-anodeTFCW–MFC.
3.2. Electricity production, NO3−–N removal at different electrode
spacings, and the interrelationship between them
Fig. 3A shows the average voltage at different electrode spacings ofTFCW–MFC using the flood–rest time of 4–2 and Rt = 1. The voltage inthe 30 cm spacing (0.358 V) was remarkably higher than those in the 15(0.293 V) and 45 cm spacings. This result agrees with the findings of Liet al. (2012), who showed that voltage output initially increases andthen decreases with the increase in electrode distance. The variationtendency may be attributed to the great internal resistance in the large
electrode spacing disadvantage to power generation. A small electrodespacing destroys the anaerobic environment in the anode where oxygenis more readily transferred to. However, the voltage generated in thepresent study is not higher than those in other reports (Fang et al.,2017; Li et al., 2012). The modest bioelectricity generation could beattributed to the low organic load in the wastewater and electronconsumption by NO3
−–N acting in the anode, thus reducing the po-tential difference between the anode and the cathode. As shown inFig. 3B, the change trend of the voltage under the spacing of eachelectrode was consistent during the tidal flow period in the multi-anodeTFCW–MFC system. The voltages were the highest and lowest in theflooding and resting stages, respectively. The feeding and drainingstages in the phase of voltage sharply increased and declined, respec-tively. The regular tendency is due to the construction of a better redoxpotential gradient between the anode and the cathode as the DO con-centration decreased in the flooding period. However, the increase inDO concentration during the instantaneous evacuation time reducedthe effectiveness of electron transfer in the system.
Fig. 3C shows the polarization and power density curves obtainedby changing the external resistance of the system. The open-circuitvoltages were 0.562, 0.641, and 0.522 V in the 15, 30, and 45 cmspacings between the anode and the cathode, respectively. The max-imum power densities were 0.154 (15 cm spacing), 0.214 (30 cm spa-cing), and 0.133 (45 cm spacing) W/m3. Similar and high power densityvalues have been reported by previous studies. Oon et al. (2017) have
Fig. 3. Multi-anode TFCW–MFC at the flood–rest time of 4–2 h and 1 recirculation, (A) average voltage under three electrode spacings, (B) voltage within one tidalperiod, (C) polarization and power density curves of the system under different electrode spacings.
L. Wang, et al. Bioresource Technology 314 (2020) 123744
5

reported a value of 0.185 W/m3 in CW-MFC with supplementaryaeration, and Wang et al. (2019a) have reported a maximum value of0.628 W/m3 in CW-MFC with long retention time. The internal re-sistance values of the system were 33.49, 28.54, and 41.46 Ω in the 15,30, and 45 cm spacings between the anode and the cathode, respec-tively. The peak power density and the minimum internal resistanceappeared simultaneously when the electrode spacing was 30 cm, whichis in line with a previous report (Song et al., 2017). The decrease inelectrode spacing can reduce the obstruction of proton transfer,whereas the DO near the cathode easily moves to the anode area if theelectrode spacing is extremely low, which reduces the activity of elec-tricity-producing bacteria and the power density (Virdis et al., 2010).
Fig. 4 illustrates the concentration and removal rates of NO3−–N at
effluents from the three anode layers in the TFCW–MFC system. In theoptimal operation method, the corresponding removal rates of NO3
−–Nwere 32.65%, 22.30%, and 67.60% when the spacing distances be-tween the anode and the cathode were 15, 30, and 45 cm, respectively.The lowest effluent concentration of NO3
−–N at 45 cm distance wasattributed to the DO with a gradient trend that declined with the in-crease in flooding depth, and the low concentration of DO at 45 cmdistance was conducive to denitrification. Notably, the removal effi-ciency of NO3
−–N with a high concentration of DO at 15 cm distancewas conversely higher than that at 30 cm distance. Given that the roots
Fig. 4. Removal performance of nitrate nitrogen in all anode layers of multi-anode TFCW–MFC under the optimal operation mode.
Fig. 5. Spatial composition of nitrogen-transformation functional genes for nxrA (A), narG (B), nirS (C), and nrfA (D) at the genus level.
L. Wang, et al. Bioresource Technology 314 (2020) 123744
6

of cattail thrived in 15 cm distance, high numbers of denitrifying bac-teria probably inhabited this area and played a certain role. Timmerset al. (2012) observed that Rhodocyclaceae and Comamonadaceae par-ticipate in denitrification and exist in plant roots during plant MFC.
Spearman correlation analysis revealed that the removal rate ofNO3
−–N was significantly negatively correlated with voltage andpower density, with coefficient R values of −0.886 and −0.829, re-spectively. This result is because NO3
−–N can be used as an electronacceptor in high-concentration NO3
−–N wastewater to compete for theelectrons from the oxidation of organics by electricity-producing bac-teria; this condition reduces the electrons transferred to the cathodelayer and thus inhibits the electricity generation capacity of the system(Wang et al., 2019a). Moreover, no significant correlation existed be-tween electrode spacing and NO3
−–N removal rate and between elec-trode spacing and electricity producing index (p > 0.05), implyingthat electrode spacing only played a partial role in NO3
−-N eliminationand power generation even though denitrification and electricity har-vest performance are mainly affected by the synergistic effect of plantroot exudates, redox gradients, and microorganisms in the system (Zhaoet al., 2004).
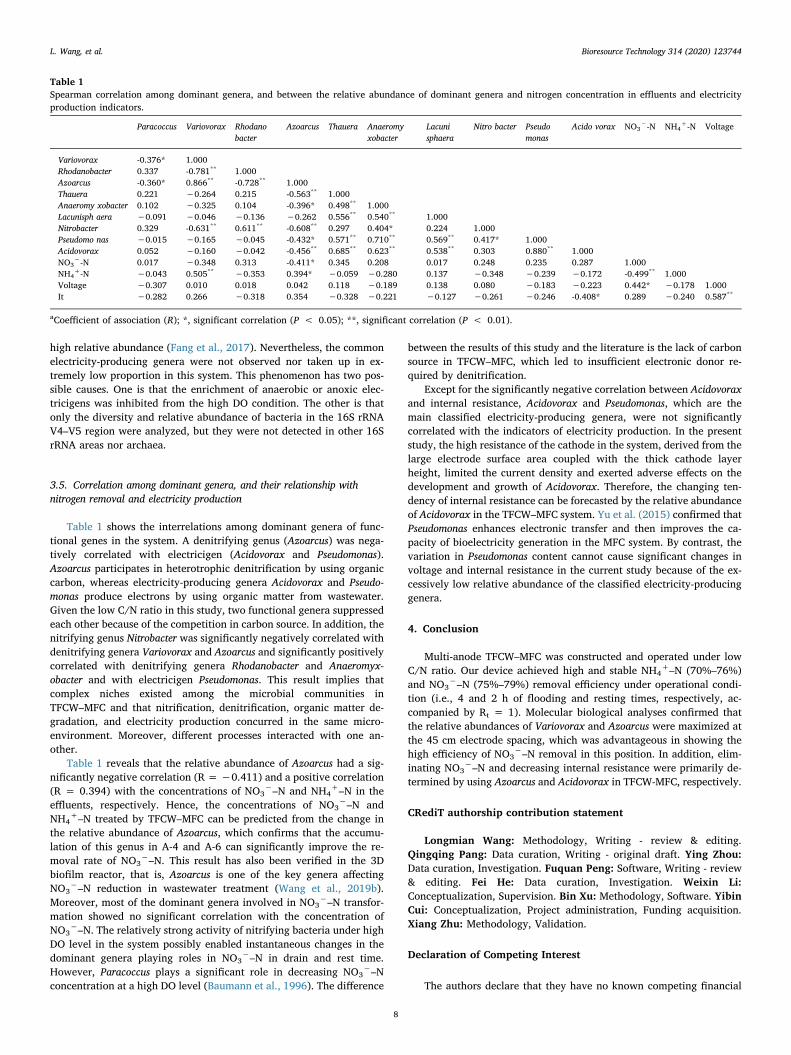
3.3. Analysis of spatial composition of nitrogen transformation genes underoptimal operation conditions
Fig. 5 shows the compositions of nxrA, narG, nirS, and nrfA at thegenus level under the optimum condition of nitrogen removal. Exceptfor nxrA, the diversities encoded by the three other genes were high.Fig. 5A shows that the nxrA in each filter layer was relatively stablewith the exclusive Nitrobacter, with a relative abundance of more than99.8%. However, several studies have shown that Nitrospira is pre-dominant in biofilm reactors. Such condition is attributed to the suit-ability of Nitrospira for the low-DO zone; however, the high con-centration of DO (0.98–2.78 mg/L) from the tidal way impedes itsreproduction. Liu and Wang (2014) also proved that the abundance ofNitrospira increases gradually at long-term low DO level, whereas thenumber of Nitrobacter decreases. The thriving growth of Nitrobacteroccurs when the NO2
−–N concentration is in the range of 5–10 mg/L(Haseborg et al., 2010). Hence, the NO2
−–N concentration(1.10–5.31 mg/L) under the optimal mode for nitrogen removal is alsoa favorable condition for the growth and vigorous reproduction of Ni-trobacter.
In terms of narG, the dominant genera that have been classifiedwere ranked based on their decreasing relative abundance: Paracoccus,Variovorax, and Oligotropha. Paracoccus had the highest relative abun-dance in A-1 (37.47%), and the genus content in the anode graduallydecreased with the increase in electrode spacing. Paracoccus, whichincludes aerobic denitrifying bacteria (Patureau et al., 2000), occupiedthe highest content among all samples because of the high oxygen en-vironment in the whole system. Meanwhile, the high DO level near thecathode and the upper anode benefitted the proliferation of this genus.The relative abundances of Variovorax and Oligotropha in all anodelayers showed a trend opposite that of Paracoccus, especially Variovorax(29.50%), which surpassed Paracoccus (12.61%) as the most dominantgenus in A-4. The two aforesaid genera are possibly oxygen sensitiveand are thus unsuitable to grow in an aerobic environment, resulting inthe said phenomenon. The most favorable microenvironment (A-4) fordeveloping Variovorax enabled its maximum effect on NO3
−–N trans-formation, which may explain the lower effluent concentration ofNO3
−–N in A-4 than in A-2 and A-3. Previous studies have suggestedthat Oligotropha predominates in ammonia-oxidizing bacteria (Danget al., 2010). In the current study, this genus was observed in narG,indicating that it may convert NO3
−–N to NO2−–N via denitrification
in addition to participating in nitrification.As shown in Fig. 5C, the dominant genera classified in nirS included
Rhodanobacter (10.66%–23.65%), Azoarcus (9.11%–36.99%), Thauera(7.21%–27.04%), and Pseudomonas (1.79%–16.03%). This system
composition is similar to that of the main denitrifying genera encodedby nirS in the sewage treatment plant, as previously determined byhigh-throughput sequencing (Zhang et al, 2019). Nitrate nitrogen hadthe lowest removal rate in A-3 but the highest relative abundance ofThauera (27.04%), revealing that denitrifying genera other thanThauera primarily contributed to NO3
−–N removal. The relativeabundance of Rhodanobacter (23.65%) was also maximized in A-3 be-cause the high level of NO3
−–N created a special ecological niche forRhodanobacter to thrive. The degradation of toluene and ethylbenzeneby Azoarcus occurs under denitrification conditions (Sperfeld et al.,2018). In the present study, Azoarcus showed a high relative abundancein A-4 to A-6 and reached the peak value in A-4 (36.95%), suggestingthat Azoarcus can perform heterotrophic denitrification with sufficientsupply of organic carbon. Therefore, Azoarcus growing in the loweranode and filter materials to become the genus with the highest per-centage may be the main reason for the relatively low effluent con-centration of NO3
−–N in the corresponding positions.As shown in Fig. 5D, most genera in nrfA cannot be unclassified. The
relative abundances of dominant genera, namely, Anaeromyxobacter(5.31%–9.17%) and Lacunisphaera (4.56%–9.40%), were low in alllayers and showed no substantial fluctuation regardless of spatial var-iation. Lacunisphaera, a genus isolated from freshwater lakes (Rast et al.,2017), is superior in the relative abundance because pH meets the ap-propriate range of 6.0–9.0 in this system. Another noteworthy result isthe relative abundances of Pseudopropionibacterium (13.06%) and Acti-nomyces (9.62%), which suddenly increased in A-4. Although the con-tribution of nitrate dissimilation reduction to NH4
+–N transformationcannot be quantified in this system, the abnormal change in thestructure of nrfA genus in A-4 may explain the low concentration ofNO3
−–N and the high concentration of NH4+-N. In general, aerobic and
anaerobic denitrifying bacteria coexist in the multi-anode TFCW–MFCsystem, as reported in another study on CW (Pelissari et al., 2016), andthe robust NO3
−–N removal in A-4 might be attributed to the structuralvariation of dominant genera for narG, nirS, and nrfA.
3.4. Analysis of spatial composition of electricity-producing bacteria underoptimal operation conditions
Fig. 6 shows the relative abundance of exoelectrogenic microbes atthe genus level within 16S rRNA V4–V5. Most genera were unclassifiedwith the relative abundance of 98.1%–99.6%, and the classifieddominant electrogenic genera included Acidovorax and Pseudomonas.The categorized electricity-producing genera presented a high relativeabundance in A-2, whereas the maximum voltage was reflected on A-3.This result suggests that the predominantly unclassified genera possesscharacteristics of power generation at each filter layer, especially at A-3. Electricity-producing genera determined by previous studies,namely, Geobacter, Desulfobulbus, and Desulfuromonas, accounted for a
Fig. 6. Spatial composition of electricity-producing bacteria from 16S rRNA V4-V5 region at the genus level.
L. Wang, et al. Bioresource Technology 314 (2020) 123744
7
high relative abundance (Fang et al., 2017). Nevertheless, the commonelectricity-producing genera were not observed nor taken up in ex-tremely low proportion in this system. This phenomenon has two pos-sible causes. One is that the enrichment of anaerobic or anoxic elec-tricigens was inhibited from the high DO condition. The other is thatonly the diversity and relative abundance of bacteria in the 16S rRNAV4–V5 region were analyzed, but they were not detected in other 16SrRNA areas nor archaea.
3.5. Correlation among dominant genera, and their relationship withnitrogen removal and electricity production
Table 1 shows the interrelations among dominant genera of func-tional genes in the system. A denitrifying genus (Azoarcus) was nega-tively correlated with electricigen (Acidovorax and Pseudomonas).Azoarcus participates in heterotrophic denitrification by using organiccarbon, whereas electricity-producing genera Acidovorax and Pseudo-monas produce electrons by using organic matter from wastewater.Given the low C/N ratio in this study, two functional genera suppressedeach other because of the competition in carbon source. In addition, thenitrifying genus Nitrobacter was significantly negatively correlated withdenitrifying genera Variovorax and Azoarcus and significantly positivelycorrelated with denitrifying genera Rhodanobacter and Anaeromyx-obacter and with electricigen Pseudomonas. This result implies thatcomplex niches existed among the microbial communities inTFCW–MFC and that nitrification, denitrification, organic matter de-gradation, and electricity production concurred in the same micro-environment. Moreover, different processes interacted with one an-other.
Table 1 reveals that the relative abundance of Azoarcus had a sig-nificantly negative correlation (R = −0.411) and a positive correlation(R = 0.394) with the concentrations of NO3
−–N and NH4+–N in the
effluents, respectively. Hence, the concentrations of NO3−–N and
NH4+–N treated by TFCW–MFC can be predicted from the change in
the relative abundance of Azoarcus, which confirms that the accumu-lation of this genus in A-4 and A-6 can significantly improve the re-moval rate of NO3
−–N. This result has also been verified in the 3Dbiofilm reactor, that is, Azoarcus is one of the key genera affectingNO3
−–N reduction in wastewater treatment (Wang et al., 2019b).Moreover, most of the dominant genera involved in NO3
−–N transfor-mation showed no significant correlation with the concentration ofNO3
−–N. The relatively strong activity of nitrifying bacteria under highDO level in the system possibly enabled instantaneous changes in thedominant genera playing roles in NO3
−–N in drain and rest time.However, Paracoccus plays a significant role in decreasing NO3
−–Nconcentration at a high DO level (Baumann et al., 1996). The difference
between the results of this study and the literature is the lack of carbonsource in TFCW–MFC, which led to insufficient electronic donor re-quired by denitrification.
Except for the significantly negative correlation between Acidovoraxand internal resistance, Acidovorax and Pseudomonas, which are themain classified electricity-producing genera, were not significantlycorrelated with the indicators of electricity production. In the presentstudy, the high resistance of the cathode in the system, derived from thelarge electrode surface area coupled with the thick cathode layerheight, limited the current density and exerted adverse effects on thedevelopment and growth of Acidovorax. Therefore, the changing ten-dency of internal resistance can be forecasted by the relative abundanceof Acidovorax in the TFCW–MFC system. Yu et al. (2015) confirmed thatPseudomonas enhances electronic transfer and then improves the ca-pacity of bioelectricity generation in the MFC system. By contrast, thevariation in Pseudomonas content cannot cause significant changes involtage and internal resistance in the current study because of the ex-cessively low relative abundance of the classified electricity-producinggenera.
4. Conclusion
Multi-anode TFCW–MFC was constructed and operated under lowC/N ratio. Our device achieved high and stable NH4
+–N (70%–76%)and NO3
−–N (75%–79%) removal efficiency under operational condi-tion (i.e., 4 and 2 h of flooding and resting times, respectively, ac-companied by Rt = 1). Molecular biological analyses confirmed thatthe relative abundances of Variovorax and Azoarcus were maximized atthe 45 cm electrode spacing, which was advantageous in showing thehigh efficiency of NO3
−–N removal in this position. In addition, elim-inating NO3
−–N and decreasing internal resistance were primarily de-termined by using Azoarcus and Acidovorax in TFCW-MFC, respectively.
CRediT authorship contribution statement
Longmian Wang: Methodology, Writing - review & editing.Qingqing Pang: Data curation, Writing - original draft. Ying Zhou:Data curation, Investigation. Fuquan Peng: Software, Writing - review& editing. Fei He: Data curation, Investigation. Weixin Li:Conceptualization, Supervision. Bin Xu: Methodology, Software. YibinCui: Conceptualization, Project administration, Funding acquisition.Xiang Zhu: Methodology, Validation.
Declaration of Competing Interest
The authors declare that they have no known competing financial
Table 1Spearman correlation among dominant genera, and between the relative abundance of dominant genera and nitrogen concentration in effluents and electricityproduction indicators.
Paracoccus Variovorax Rhodanobacter
Azoarcus Thauera Anaeromyxobacter
Lacunisphaera
Nitro bacter Pseudomonas
Acido vorax NO3−-N NH4
+-N Voltage
Variovorax -0.376* 1.000Rhodanobacter 0.337 -0.781** 1.000Azoarcus -0.360* 0.866** -0.728** 1.000Thauera 0.221 −0.264 0.215 -0.563** 1.000Anaeromy xobacter 0.102 −0.325 0.104 -0.396* 0.498** 1.000Lacunisph aera −0.091 −0.046 −0.136 −0.262 0.556** 0.540** 1.000Nitrobacter 0.329 -0.631** 0.611** -0.608** 0.297 0.404* 0.224 1.000Pseudomo nas −0.015 −0.165 −0.045 -0.432* 0.571** 0.710** 0.569** 0.417* 1.000Acidovorax 0.052 −0.160 −0.042 -0.456** 0.685** 0.623** 0.538** 0.303 0.880** 1.000NO3
−-N 0.017 −0.348 0.313 -0.411* 0.345 0.208 0.017 0.248 0.235 0.287 1.000NH4
+-N −0.043 0.505** −0.353 0.394* −0.059 −0.280 0.137 −0.348 −0.239 −0.172 -0.499** 1.000Voltage −0.307 0.010 0.018 0.042 0.118 −0.189 0.138 0.080 −0.183 −0.223 0.442* −0.178 1.000It −0.282 0.266 −0.318 0.354 −0.328 −0.221 −0.127 −0.261 −0.246 -0.408* 0.289 −0.240 0.587**
aCoefficient of association (R); *, significant correlation (P < 0.05); **, significant correlation (P < 0.01).
L. Wang, et al. Bioresource Technology 314 (2020) 123744
8

interests or personal relationships that could have appeared to influ-ence the work reported in this paper.
Acknowledgments
This study was supported by the Innovative team project of NanjingInstitute of Environmental Sciences, MEE (GYZX200101), the NationalNatural Science Foundation of China (No. 51778265), Key R & DProgram of Ningxia Hui Autonomous Region (2019BFG02028).
Appendix A. Supplementary data
Supplementary data to this article can be found online at https://doi.org/10.1016/j.biortech.2020.123744.
References
American Public Health Association, A., 2012. Standard Methods for the Examination forWater and Wastewater. American Public Health Association Washington, DC.
Baumann, B., Snozzi, M., Zehnder, A.J.B., Meer, J.R.V.D., 1996. Dynamics of deni-trification activity of Paracoccus denitrificans in continuous culture during aerobic-anaerobic changes. J. Bacteriol. 178, 4367–4374.
Dang, H., Li, J., Chen, R., Wang, L., Guo, L., Zhang, Z., Klotz, M., 2010. Diversity,abundance, and spatial distribution of sediment ammonia-oxidizing betaproteo-bacteria in response to environmental gradients and coastal eutrophication inJiaozhou Bay, China. Appl. Environ. Microbiol. 76, 4691–4702.
Doherty, L., Zhao, Y., Zhao, X., Wang, W., 2015. Nutrient and organics removal fromswine slurry with simultaneous electricity generation in an alum sludge-based con-structed wetland incorporating microbial fuel cell technology. Chem. Eng. J. 266,74–81.
Fang, Z., Cao, X., Li, X., Wang, H., Li, X., 2017. Electrode and azo dye decolorizationperformance in microbial-fuel-cell-coupled constructed wetlands with differentelectrode size during long-term wastewater treatment. Bioresour. Technol. 238,450–460.
Fang, Z., Song, H., Cang, N., Li, X., 2013. Performance of microbial fuel cell coupledconstructed wetland system for decolorization of azo dye and bioelectricity genera-tion. Bioresour. Technol. 144, 165–171.
Haseborg, E.T., Zamora, T.M., Fröhlich, J., Frimmel, F.H., 2010. Nitrifying microorgan-isms in fixed-bed biofilm reactors fed with different nitrite and ammonia con-centrations. Bioresour. Technol. 101, 1701–1706.
Li, X., Hai, S., Li, X., Lei, W., 2012. Electricity generation during wastewater treatment bya microbial fuel cell coupled with constructed wetland. Journal of SoutheastUniversity 28, 175–178.
Liu, G., Wang, J., 2014. Role of solids retention time on complete nitrification: me-chanistic understanding and modeling. J. Environ. Eng. 140 (1), 48–56.
Oon, Y.L., Ong, S.A., Ho, L.N., Wong, Y.S., Dahalan, F.A., Oon, Y.S., Lehl, H.K., Thung,W.E., Nordin, N., 2017. Role of macrophyte and effect of supplementary aeration inup-flow constructed wetland-microbial fuel cell for simultaneous wastewater treat-ment and energy recovery. Bioresour. Technol. 224, 265–275.
Oon, Y.L., Ong, S.A., Ho, L.N., Wong, Y.S., Dahalan, F.A., Oon, Y.S., Lehl, H.K., Thung,W.E., Nordin, N., 2018. Up-flow constructed wetland-microbial fuel cell for azo dye,saline, nitrate remediation and bioelectricity generation: from waste to energy ap-proach. Bioresour. Technol. 266, 97–108.
Patureau, D., Zumstein, E., Delgenes, J.P., Moletta, R., 2000. Aerobic Denitrifiers Isolatedfrom Diverse Natural and Managed Ecosystems. Microb. Ecol. 39 (2), 145–152.
Pelissari, C., Santos, M.O.D., Rousso, B.Z., Bento, A.P., Armas, R.D.D., Sezerino, P.H.,2016. Organic load and hydraulic regime influence over the bacterial communityresponsible for the nitrogen cycling in bed media of vertical subsurface flow con-structed wetland. Ecol. Eng. 95, 180–188.
Rast, P., Glöckner, I., Boedeker, C., Jeske, O., Wiegand, S., Reinhardt, R., Schumann, P.,Rohde, M., Spring, S., Glöckner, F.O., Jogler, C., Jogler, M., 2017. Three NovelSpecies with Peptidoglycan Cell Walls form the New Genus Lacunisphaera gen. nov.in the Family Opitutaceae of the Verrucomicrobial Subdivision 4. Front. Microbiol. 8,1–18.
Saeed, T., Sun, G., 2011. Kinetic modelling of nitrogen and organics removal in verticaland horizontal flow wetlands. Water Res. 45, 3137–3152.
Song, H., Zhang, S., Long, X., Yang, X., Li, H., Xiang, W., 2017. Optimization of bioe-lectricity generation in constructed wetland-coupled microbial fuel cell systems.Water. 185, 1–13.
Sophia, A.C., Sreeja, S., 2017. Green energy generation from plant microbial fuel cells(PMFC) using compost and a novel clay separator. Sustainable Energy Technol.Assess. 21, 59–66.
Sperfeld, M., Rauschenbach, C., Diekert, G., Studenik, S., 2018. Microbial community of agasworks aquifer and identification of nitrate-reducing Azoarcus and Georgfuchsia askey players in BTEX degradation. Water Res. 132, 146–157.
Sun, G., Zhao, Y., Allen, S., 2005. Enhanced removal of organic matter and ammoniacal-nitrogen in a column experiment of tidal flow constructed wetland system. J.Biotechnol. 115 (2), 189–197.
Tao, M., Guan, L., Jing, Z., Tao, Z., Wang, Y., Luo, H., Wang, Y., 2020. Enhanced deni-trification and power generation of municipal wastewater treatment plants (WWTPs)effluents with biomass in microbial fuel cell coupled with constructed wetland. Sci.Total Environ. 709, 136159.
Timmers, R.A., Rothballer, M., Strik, D.P.B.T.B., Engel, M., Schulz, S., Schloter, M.,Hartmann, A., Hamelers, B., Buisman, C., 2012. Microbial community structureelucidates performance of Glyceria maxima plant microbial fuel cell. Appl. Microbiol.Biotechnol. 94, 537–548.
Virdis, B., Rabaey, K., Rozendal, R.A., Yuan, Z.G., Keller, J., 2010. Simultaneous ni-trification, denitrification and carbon removal in microbial fuel cells. Water Res. 44,2970–2980.
Wang, G., Guo, Y., Cai, J., Wen, H., Mao, Z., Zhang, H., Wang, X., Ma, L., Zhu, M., 2019a.Electricity production and the analysis of the anode microbial community in a con-structed wetland-microbial fuel cell. Rsc Adv. 37, 21460–21472.
Wang, J., Song, X., Wang, Y., Abayneh, B., Li, Y., Yan, D., Bai, J., 2016. Nitrate removaland bioenergy production in constructed wetland coupled with microbial fuel cell:Establishment of electrochemically active bacteria community on anode. Bioresour.Technol. 221, 358–365.
Wang, J., Song, X., Wang, Y., Bai, J., Bai, H., Yan, D., Cao, Y., Li, Y., Yu, Z., Dong, G.,2017. Bioelectricity generation, contaminant removal and bacterial community dis-tribution as affected by substrate material size and aquatic macrophyte in constructedwetland-microbial fuel cell. Bioresour. Technol. 245, 372–378.
Wang, L.M., Xu, W.W., Yu, J.H., Zhang, A.G., Peng, F.Q., Lian, J.J., Huang, J.X., Pang,Q.Q., Zhu, X., Gao, P.C., 2020. Response of denitrobacteria involved in nitrogen re-moval for treatment of simulated livestock wastewater using a novel bioreactor. Ecol.Eng. 147, 105762.
Wang, S., Yang, X., Meng, H., Zhang, Y., Li, X., Xu, J., 2019b. Enhanced denitrification bynano ɑ-Fe2O3 induced self-assembled hybrid biofilm on particle electrodes of three-dimensional biofilm electrode reactors. Environ. Int. 125, 142–151.
Wu, H.M., Zhang, J., Ngo, H.H., Guo, W.S., Hu, Z., Liang, S., Fan, J.L., Liu, H., 2015. Areview on the sustainability of constructed wetlands for wastewater treatment: designand operation. Bioresour. Technol. 175, 594–601.
Wu, S., Zhang, D., Austin, D., Dong, R., Pang, C., 2011. Evaluation of a lab-scale tidal flowconstructed wetland performance: oxygen transfer capacity, organic matter andammonium removal. Ecol. Eng. 37, 1789–1795.
Xu, F., Ouyang, D.L., Rene, E.R., Ng, H.Y., Guo, L.L., Zhu, Y.J., Zhou, L.L., Yuan, Q., Miao,M., Wang, Q., Kong, Q., 2019a. Electricity production enhancement in a constructedwetland-microbial fuel cell system for treating saline wastewater. Bioresour. Technol.288, 121462.
Xu, P., Xiao, E., Wu, J., He, F., Zhang, Y., Wu, Z., 2019b. Enhanced nitrate reduction inwater by a combined bio-electrochemical system of microbial fuel cells and sub-merged aquatic plant Ceratophyllum demersum. J. Environ. Sci.-China 78, 338–351.
Yadav, A.K., Dash, P., Mohanty, A., Abbassi, R., Mishra, B.K., 2012. Performance as-sessment of innovative constructed wetland-microbial fuel cell for electricity pro-duction and dye removal. Ecol. Eng. 47, 126–131.
Yu, J., Park, Y., Kim, B., Lee, T., 2015. Power densities and microbial communities ofbrewery wastewater-fed microbial fuel cells according to the initial substrates.Bioprocess Biosyst. Eng. 38, 85–92.
Zhang, H., Feng, J., Chen, S., Zhao, Z., Li, B., Wang, Y., Jia, J., Li, S., Wang, Y., Yan, M.,Lu, K., Hao, H., 2019. Geographical patterns of nirS gene abundance and nirS-typedenitrifying bacterial community associated with activated sludge from differentwastewater treatment plants. Microb. Ecol. 77, 304–316.
Zhao, Y., Sun, G., Lafferty, C., Allen, S., 2004. Optimising the performance of a lab-scaletidal flow reed bed system treating agricultural wastewater. Water Sci. Technol. 50,65–72.
L. Wang, et al. Bioresource Technology 314 (2020) 123744
9