Robust Learning of Dynamic Interactions for Enhancing ...
26
Robust Learning of Dynamic Interactions for Enhancing Power System Resilience FOA 1861 PROJECT UPDATE BIG DATA ANALYSIS OF SYNCHROPHASOR DATA Dr. Jie Chen, Co-PI, IBM Neeraj Nayak, Co-PI, EPG Joel Lindsay, NETL Sandra Jenkins, DOE Project Officer Yuxuan Yuan, PhD Student, ISU Dr. Zhaoyu Wang, PI, ISU Dr. Ian Dobson, Co-PI, ISU Dr. V. Ajjarapu, Co-PI, ISU
Transcript of Robust Learning of Dynamic Interactions for Enhancing ...

INSERT ORG LOGO (Optional)
Robust Learning of Dynamic Interactions for Enhancing Power
System Resilience
FOA 1861 PROJECT UPDATE BIG DATA ANALYSIS OF SYNCHROPHASOR DATA
Dr. Jie Chen, Co-PI, IBM
Neeraj Nayak, Co-PI, EPG
Joel Lindsay, NETL
Sandra Jenkins, DOE Project Officer
Yuxuan Yuan, PhD Student, ISU
Dr. Zhaoyu Wang, PI, ISU
Dr. Ian Dobson, Co-PI, ISU
Dr. V. Ajjarapu, Co-PI, ISU

INSERT ORG LOGO (Optional)
Outline
• Project Overview
• Experimental Results
• Technical Progress
• Project Challenges & Risk Mitigation
• Future Effort
2

INSERT ORG LOGO (Optional)
Project Overview
The overall goal of the project is to leverage robust graphical
learning and PMU data to learn the dynamic interactions of
electrical grid components in order to improve the power system
resilience. Specifically, this project incorporates four objectives:
1) Massive PMU data preparation, refining, and real-time visualization and
access.
2) Identifying and cataloguing anomalous patterns.
3) Learning interaction graphs using deep graph neural networks.
4) Graph-based modeling, monitoring, and mitigation of cascading outages.
3
INSERT ORG LOGO (Optional)
Project Overview
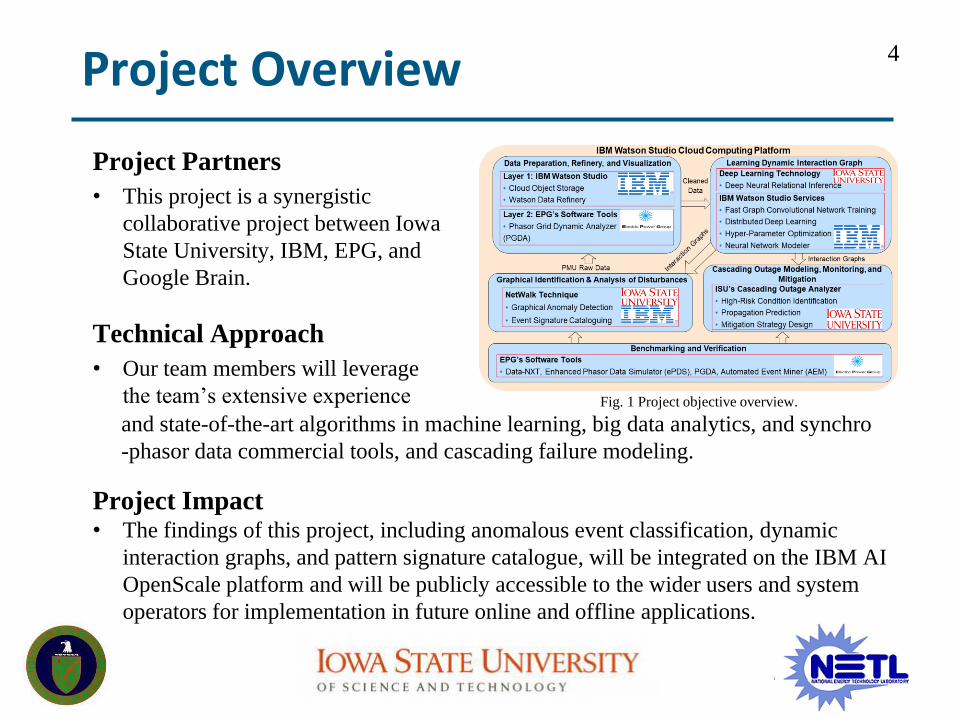
Project Partners
• This project is a synergistic
collaborative project between Iowa
State University, IBM, EPG, and
Google Brain.
Technical Approach
• Our team members will leverage
the team’s extensive experience
Project Impact• The findings of this project, including anomalous event classification, dynamic
interaction graphs, and pattern signature catalogue, will be integrated on the IBM AI
OpenScale platform and will be publicly accessible to the wider users and system
operators for implementation in future online and offline applications.
and state-of-the-art algorithms in machine learning, big data analytics, and synchro
-phasor data commercial tools, and cascading failure modeling.
Fig. 1 Project objective overview.
4
INSERT ORG LOGO (Optional)
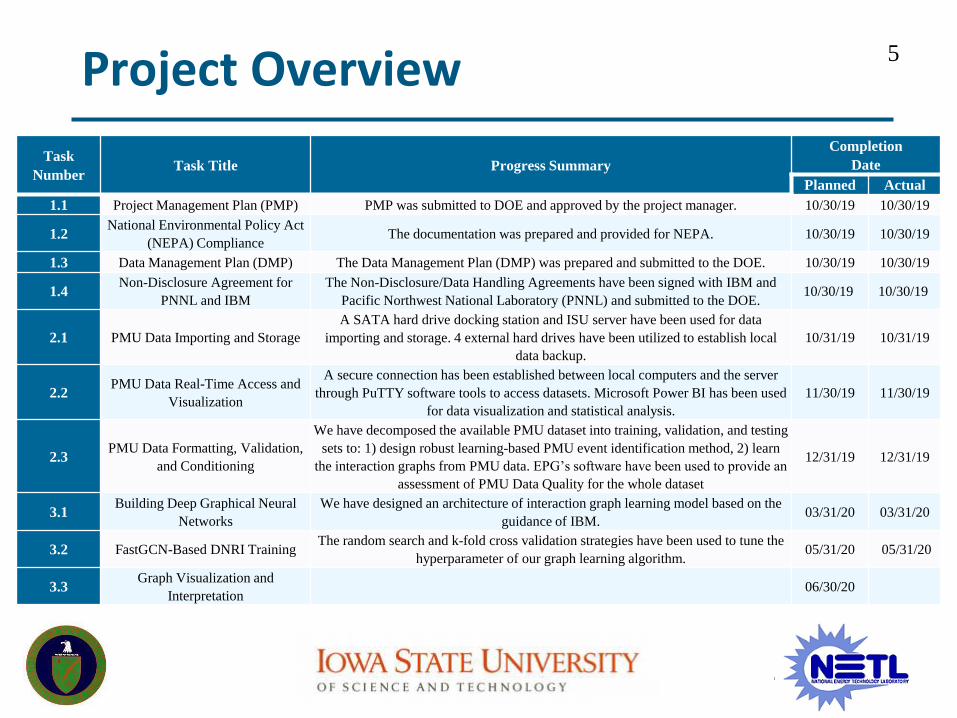
Project Overview
Task
NumberTask Title Progress Summary
Completion
Date
Planned Actual
1.1 Project Management Plan (PMP) PMP was submitted to DOE and approved by the project manager. 10/30/19 10/30/19
1.2National Environmental Policy Act
(NEPA) ComplianceThe documentation was prepared and provided for NEPA. 10/30/19 10/30/19
1.3 Data Management Plan (DMP) The Data Management Plan (DMP) was prepared and submitted to the DOE. 10/30/19 10/30/19
1.4Non-Disclosure Agreement for
PNNL and IBM
The Non-Disclosure/Data Handling Agreements have been signed with IBM and
Pacific Northwest National Laboratory (PNNL) and submitted to the DOE.10/30/19 10/30/19
2.1 PMU Data Importing and Storage
A SATA hard drive docking station and ISU server have been used for data
importing and storage. 4 external hard drives have been utilized to establish local
data backup.
10/31/19 10/31/19
2.2PMU Data Real-Time Access and
Visualization
A secure connection has been established between local computers and the server
through PuTTY software tools to access datasets. Microsoft Power BI has been used
for data visualization and statistical analysis.
11/30/19 11/30/19
2.3PMU Data Formatting, Validation,
and Conditioning
We have decomposed the available PMU dataset into training, validation, and testing
sets to: 1) design robust learning-based PMU event identification method, 2) learn
the interaction graphs from PMU data. EPG’s software have been used to provide an
assessment of PMU Data Quality for the whole dataset
12/31/19 12/31/19
3.1Building Deep Graphical Neural
Networks
We have designed an architecture of interaction graph learning model based on the
guidance of IBM.03/31/20 03/31/20
3.2 FastGCN-Based DNRI TrainingThe random search and k-fold cross validation strategies have been used to tune the
hyperparameter of our graph learning algorithm.05/31/20 05/31/20
3.3Graph Visualization and
Interpretation06/30/20
5

INSERT ORG LOGO (Optional)
Project Overview
Task
NumberTask Title Progress Summary
Completion
Date
Planned Actual
3.4 Interaction Graph Validation 06/30/20
4.1High-Risk Operational Condition
Detection09/30/20
4.2Visualization and Prediction of
Cascading Outage Propagation10/31/20
4.3 Cascading Mitigation Strategy Design 11/30/20
4.4 Comparison of Methods 12/31/20
5.1 Graphical Anomaly Detection
We have developed a robust learning-based two-stage event identification based on
our PMU dataset. The interaction graph will be integrated with this model to further
improve the classification accuracy.
10/31/20
5.2 Event Signature Extraction 11/30/20
5.3 Disturbance Analysis Validation 12/31/20
6.0Validation with Commercial Software
Tools03/12/21
6.1 Offline Benchmarking Analysis 03/12/21
6.2 Online Validation and Testing 03/12/21
7.1 Module Integration 01/31/21
7.2Building an Open-source Platform for
Project Findings03/12/21
8.0Publications, Presentations, Final
Briefings and Reports to DOE03/12/21
6

INSERT ORG LOGO (Optional)
Experimental Results
Data Importing and Storage (Task 2)• A ISU server, which has 256GB RAM
memory, 22TB hard drive, and 2 – 10 core
Xeon CPU E5-2660 v3 @ 2.6GHz, has been
utilized to import and store massive PMU
data.
• 4 external hard drives have been utilized to
establish local data backup to protect data
against server-level failuresFig. 2 ISU server.
Data Visualization (Task 2)• Power BI has been used to perform data
visualization by developing dashboards.
• Our dashboards contains statistical
information for all three systems and
selected event curves.Fig. 3 Power BI dashboard.
7
INSERT ORG LOGO (Optional)
Experimental Results
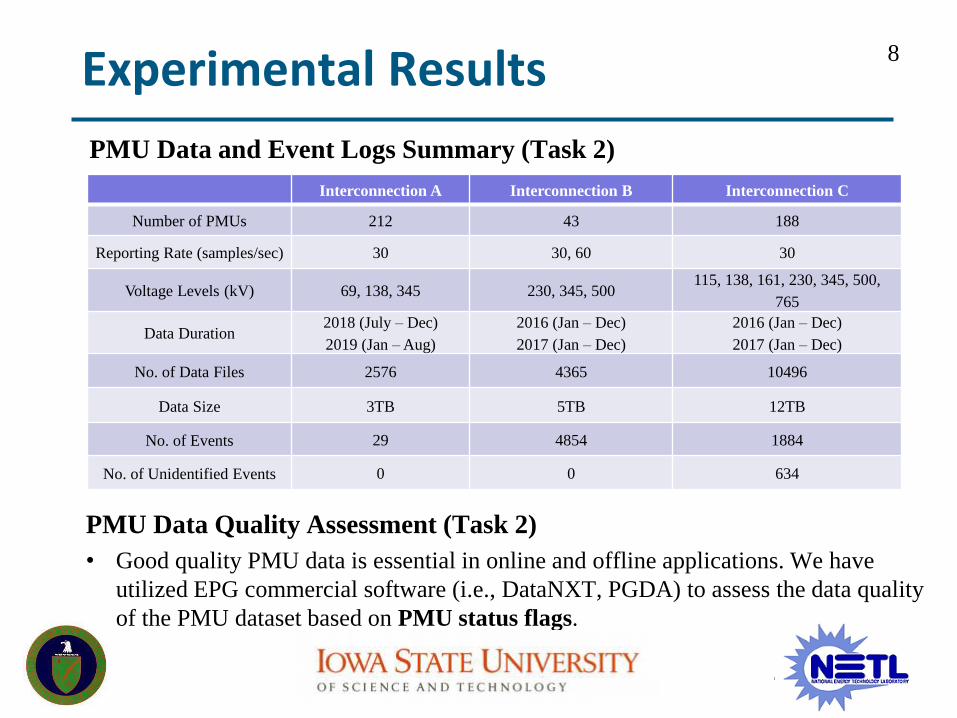
PMU Data Quality Assessment (Task 2)
• Good quality PMU data is essential in online and offline applications. We have
utilized EPG commercial software (i.e., DataNXT, PGDA) to assess the data quality
of the PMU dataset based on PMU status flags.
Interconnection A Interconnection B Interconnection C
Number of PMUs 212 43 188
Reporting Rate (samples/sec) 30 30, 60 30
Voltage Levels (kV) 69, 138, 345 230, 345, 500115, 138, 161, 230, 345, 500,
765
Data Duration2018 (July – Dec)
2019 (Jan – Aug)
2016 (Jan – Dec)
2017 (Jan – Dec)
2016 (Jan – Dec)
2017 (Jan – Dec)
No. of Data Files 2576 4365 10496
Data Size 3TB 5TB 12TB
No. of Events 29 4854 1884
No. of Unidentified Events 0 0 634
PMU Data and Event Logs Summary (Task 2)
8
INSERT ORG LOGO (Optional)
Experimental Results
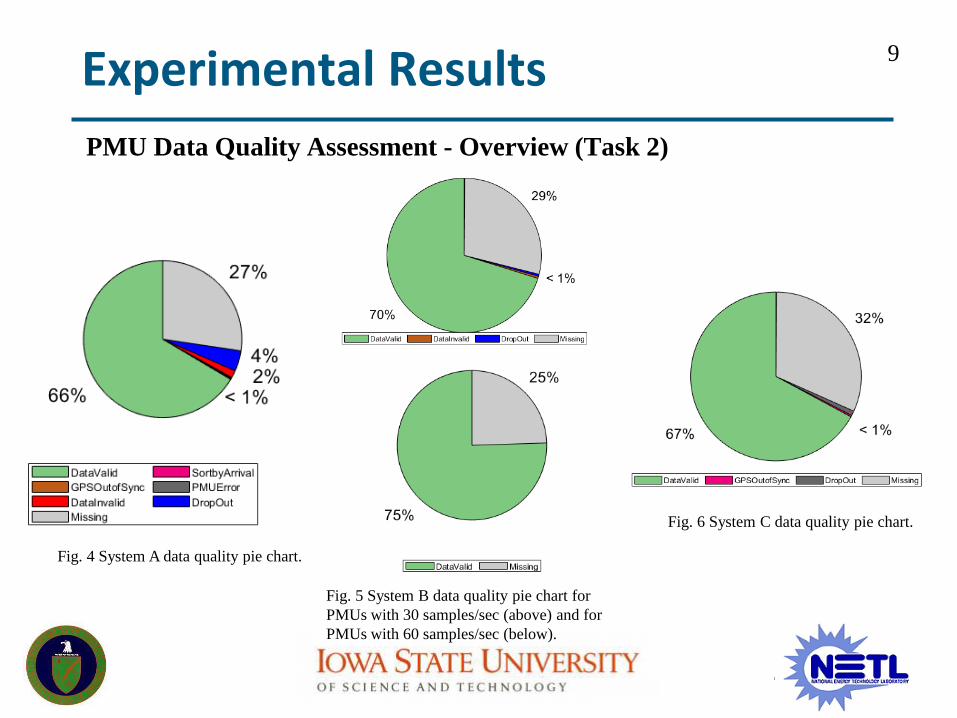
PMU Data Quality Assessment - Overview (Task 2)
Fig. 4 System A data quality pie chart.
Fig. 5 System B data quality pie chart for
PMUs with 30 samples/sec (above) and for
PMUs with 60 samples/sec (below).
Fig. 6 System C data quality pie chart.
9

INSERT ORG LOGO (Optional)
Experimental Results
PMU Data Quality Assessment – System A (Task 2)
Fig. 7 Overall data quality for each PMU in system A.
10

INSERT ORG LOGO (Optional)
Experimental Results
PMU Data Quality Assessment – System A (Task 2)
Fig. 8 Overall data quality analysis for total 18 signals of each PMUs in system A.
11

INSERT ORG LOGO (Optional)
Experimental Results
PMU Data Quality Assessment– Statistical Analysis (Task 2)
To provide more details about PMU data quality, we have defined and plotted two survival functions,
𝑆 𝑘 and 𝑆 𝑐 :
𝑆 𝑘 = Pr{number of missing data per PMU per day
total number of data per PMU per day> 𝑘}
𝑆 c = Pr{number of consecutive missing data > 𝑐}
• Based on the left figure, PMUs show data quality issues more than 30% of time.
• Based on the right figure, around 3% of data quality issues have more than 10 consecutive bad
data.
Fig. 9 Survival function 𝑆 𝑘 using PMU dataset . Fig. 10 Survival function 𝑆 𝑐 using PMU dataset .
(1)
(2)
12

INSERT ORG LOGO (Optional)
Technical Progress
• Based on our data quality assessment, PMU data quality problems are
inevitable and not rare, which can disjoint the dimensional consistency of data
samples between the offline training and online testing. Poor robustness
against data quality makes the PMU-based event identifiers not sufficiently
convincing [1].
• Machine learning-based methods typically suffer from event data scarcity,
resulting in a data imbalance problem [2].
• Most of the signal processing-based methods require massive computations
due to the complicated mathematical transformation and optimization, which
might challenge the practical deployment of the methods [3].
Challenges of Developing PMU-Based Event Identifiers (Task 3 & 5)
13
INSERT ORG LOGO (Optional)
Technical Progress
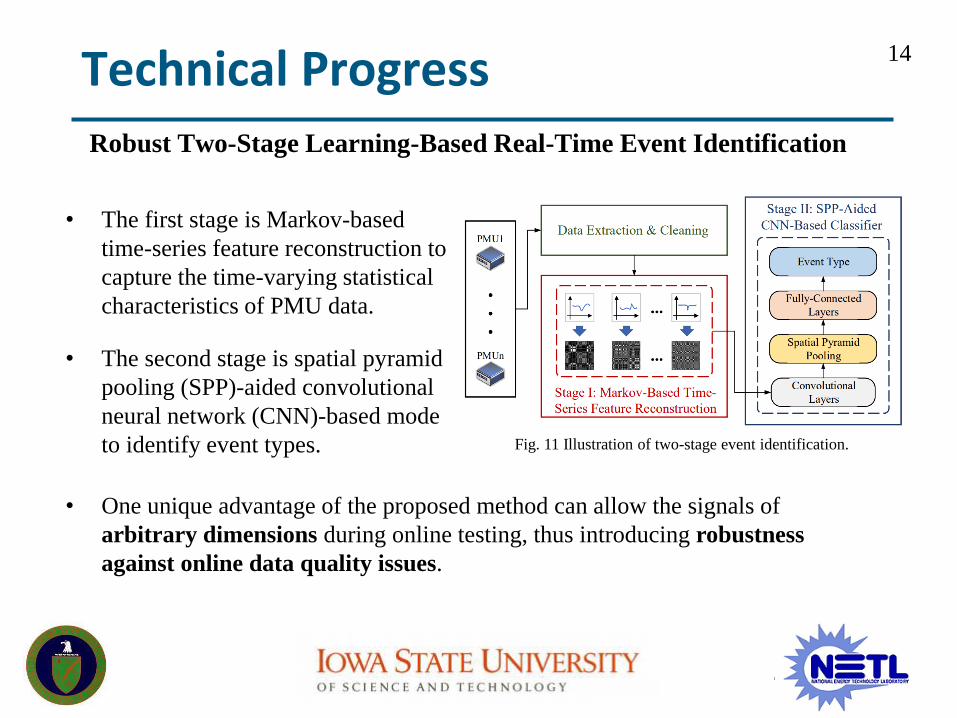
Robust Two-Stage Learning-Based Real-Time Event Identification
Fig. 11 Illustration of two-stage event identification.
• The first stage is Markov-based
time-series feature reconstruction to
capture the time-varying statistical
characteristics of PMU data.
• The second stage is spatial pyramid
pooling (SPP)-aided convolutional
neural network (CNN)-based mode
to identify event types.
• One unique advantage of the proposed method can allow the signals of
arbitrary dimensions during online testing, thus introducing robustness
against online data quality issues.
14

INSERT ORG LOGO (Optional)
Technical ProgressPMU Data Extraction & Cleaning
• To apply PMU-based event identifiers in real-time, a 2-second analysis-
window is selected to extract the event data based on the event logs.
• We use the voltage magnitude and frequency variation data from each PMU to
train our learning model.
• For each PMU, the event data is re-sorted based on time stamps.
• Following our data quality assessment, when the consecutive missing/bad data
occurs, the data is excluded from our study.
• The rest of the missing/bad data are filled and corrected by taking an average
of the two preceding samples.
15
INSERT ORG LOGO (Optional)
Technical Progress
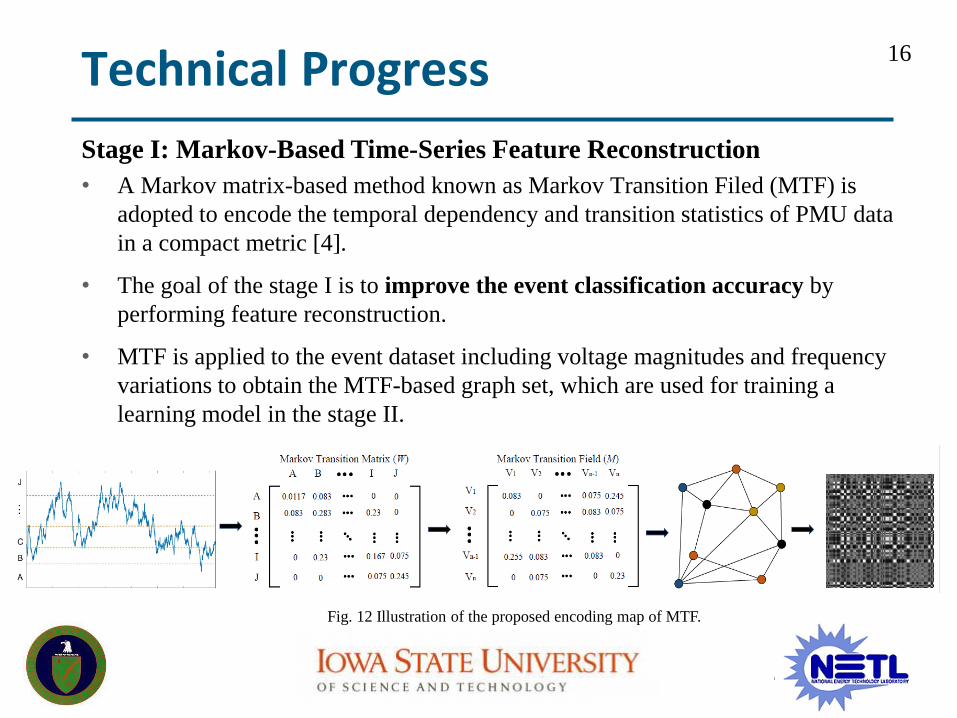
Stage I: Markov-Based Time-Series Feature Reconstruction
• A Markov matrix-based method known as Markov Transition Filed (MTF) is
adopted to encode the temporal dependency and transition statistics of PMU data
in a compact metric [4].
• The goal of the stage I is to improve the event classification accuracy by
performing feature reconstruction.
• MTF is applied to the event dataset including voltage magnitudes and frequency
variations to obtain the MTF-based graph set, which are used for training a
learning model in the stage II.
Fig. 12 Illustration of the proposed encoding map of MTF.
16
INSERT ORG LOGO (Optional)
Technical Progress
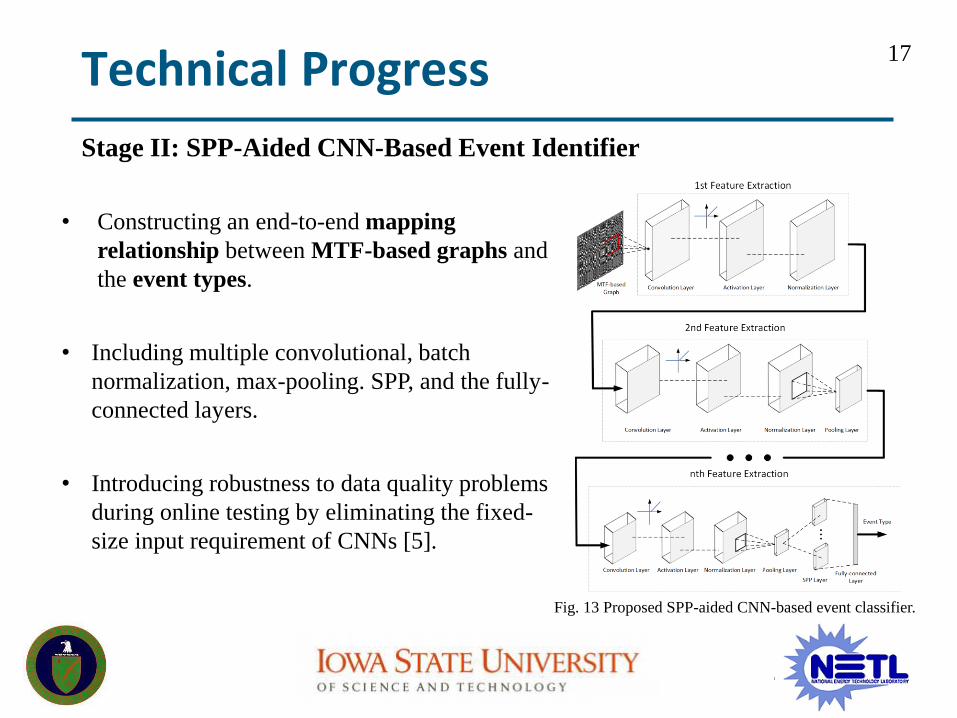
Stage II: SPP-Aided CNN-Based Event Identifier
Fig. 13 Proposed SPP-aided CNN-based event classifier.
• Constructing an end-to-end mapping
relationship between MTF-based graphs and
the event types.
• Including multiple convolutional, batch
normalization, max-pooling. SPP, and the fully-
connected layers.
• Introducing robustness to data quality problems
during online testing by eliminating the fixed-
size input requirement of CNNs [5].
17
INSERT ORG LOGO (Optional)
Technical Progress
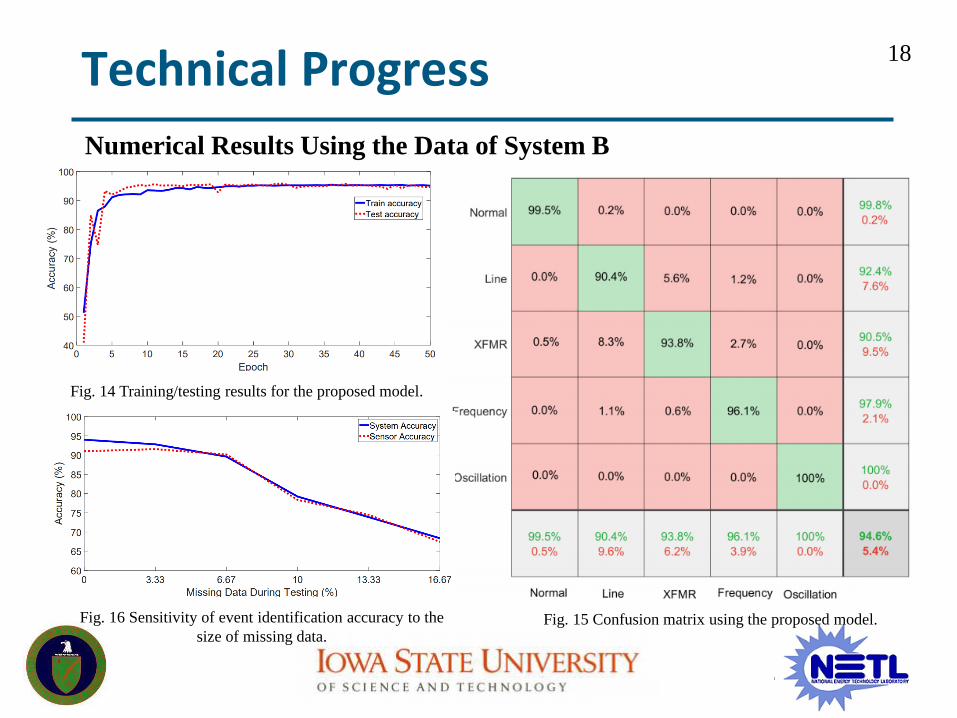
Numerical Results Using the Data of System B
Fig. 14 Training/testing results for the proposed model.
Fig. 15 Confusion matrix using the proposed model.Fig. 16 Sensitivity of event identification accuracy to the
size of missing data.
18

INSERT ORG LOGO (Optional)
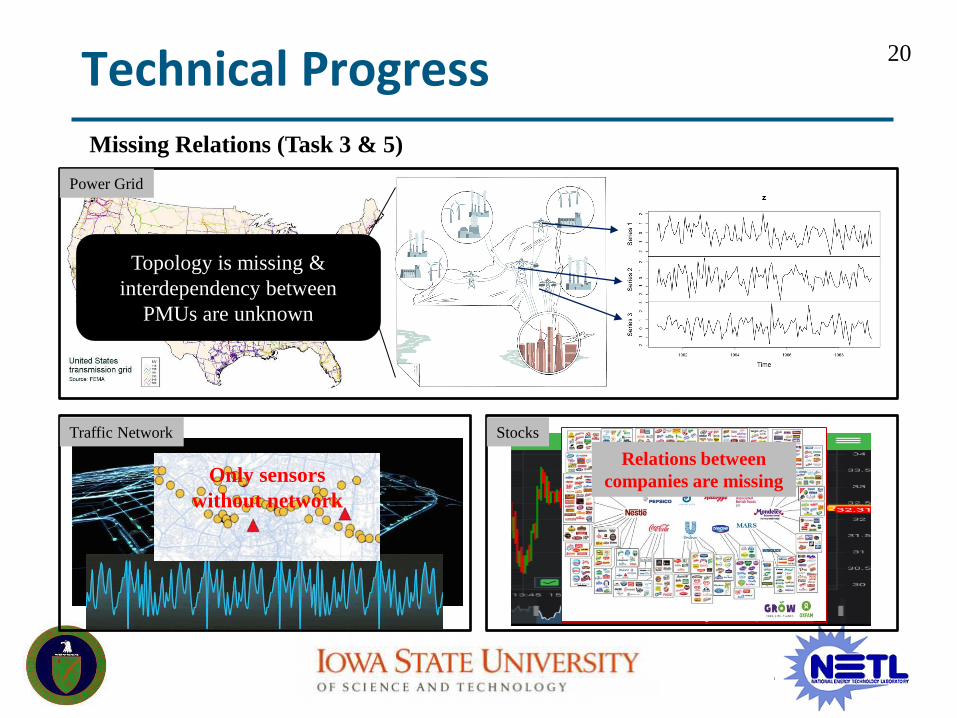
Technical ProgressSimilar to traffic network and stocks, power systems are complex networks of
interdependent components with interactions. (Task 3 & 5)
Power Grid
Traffic Network Stocks
19
INSERT ORG LOGO (Optional)
Technical Progress
Missing Relations (Task 3 & 5)
Power Grid
Traffic Network Stocks
Only sensors
without network
Relations between
companies are missing
Topology is missing &
interdependency between
PMUs are unknown
20
INSERT ORG LOGO (Optional)
Technical Progress
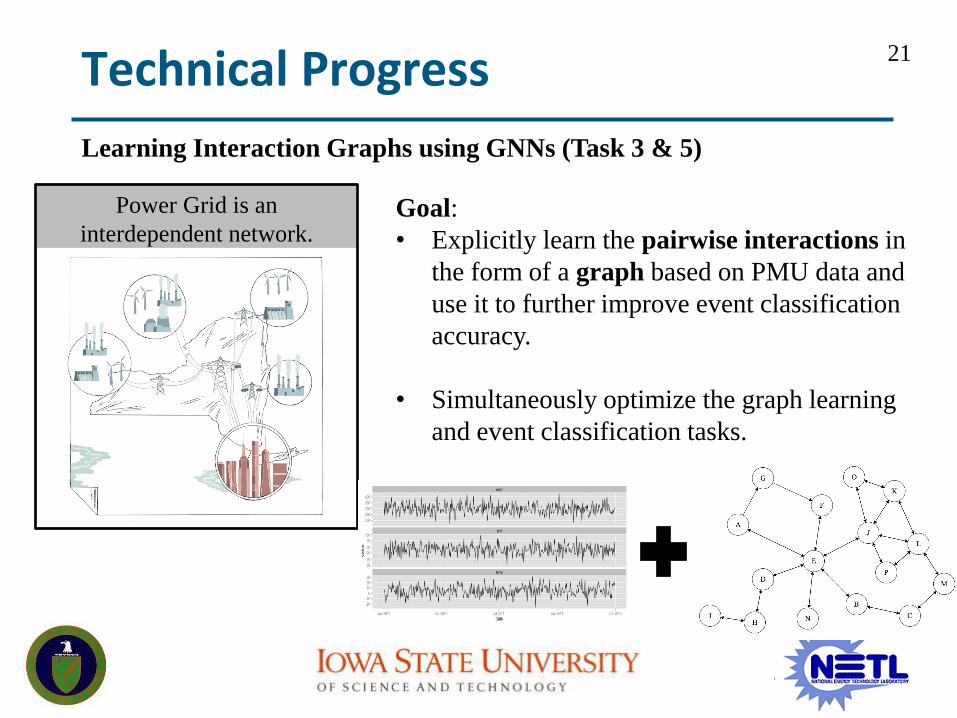
Learning Interaction Graphs using GNNs (Task 3 & 5)
Power Grid is an
interdependent network.Goal:
• Explicitly learn the pairwise interactions in
the form of a graph based on PMU data and
use it to further improve event classification
accuracy.
• Simultaneously optimize the graph learning
and event classification tasks.
21

INSERT ORG LOGO (Optional)
Technical Progress
Proposed Spatial GNN-Based Event Identifier (Task 3 & 5)
Fig. 17 Spatial GNN-based event identifier.
GNN modelClassification
model
22

INSERT ORG LOGO (Optional)
Future EffortRemaining Tasks and Schedule
• Graphical Cascading Failure Modeling, Monitoring, and Mitigation (Task
4): The possible cascading failure data will be extracted to develop a PMU-
based influence graph for monitoring and mitigating cascading outages.
• Interaction Graph-based Event Identifier (Task 5): The proposed spatial
GNN-based event identifier will be validated using our PMU dataset.
• Unidentified Event Extraction (Task 5): We will utilized a unsupervised
graphical data clustering method to extract and catalogue unidentified events.
24
INSERT ORG LOGO (Optional)
Future EffortRemaining Tasks and Schedule
• Event Identification using Poor Event Logs (Task 5): We will developed a
novel event identification model to mitigate the challenge of event data
scarcity using recent semi-supervised machine learning technique.
• Offline Benchmarking Analysis (Task 6): EPG’s commercial software such
as PGDA or AEM will be used to compare with the proposed learning-based
method in identifying anomalous events.
• Integration with Open Source Platform (Task 7): The resulted deep learning
models will be deployed as a service on big data platform such as IBM AI
OpenScale
25

INSERT ORG LOGO (Optional)
Reference
[1] J. Zhao, J. Tan, L. Wu, L. Zhan, W. Yao, and Y. Liu, “Impact of the measurement errors on
synchrophasor-based wams applications,” IEEE Access, vol. 7, pp. 143 960–143 972, 2019.
[2] H. Li, Y. Weng, E. Farantatos, and M. Patel, “An unsupervised learning framework for
event detection, type identification and localization using pmus without any historical labels,”
2019 IEEE Power Energy Society General Meeting (PESGM), pp. 1–5, 2019.
[3] S. Liu, Y. Zhao, Z. Lin, Y. Liu, Y. Ding, L. Yang, and S. Yi, “Data-driven event detection
of power systems based on unequal-interval reduction of pmu data and local outlier factor,”
IEEE Trans. Smart Grid, vol. 11, no. 2, pp. 1630–1643, 2020.
[4] Z. Wang and T. Oates, “Encoding time series as images for visual inspection and
classification using tiled convolutional neural networks,” Association for the Advancement of
Artificial Intelligence, pp. 40–46, 2015.
[5] K. He, X. Zhang, S. Ren, and J. Sun, “Spatial pyramid pooling in deep convolutional
networks for visual recognition,” IEEE Trans. on Pattern Analysis and Machine Intell., vol. 37,
no. 9, pp. 1904–1916, 2015.
26

INSERT ORG LOGO (Optional)
Q&A
THANKS