
Robust Design 7 - Ops A La Carte A La... · •Ops A La Carte's Peter Arrowsmithwill be giving a...
72
Robust Design & Reliability Engineering Apr 4, 2012 Louis LaVallee Sr Reliability Consultant
Transcript of Robust Design 7 - Ops A La Carte A La... · •Ops A La Carte's Peter Arrowsmithwill be giving a...
Robust Design & Reliability Engineering
Apr 4, 2012
Louis LaValleeSr Reliability Consultant
Ops A La Carte is a Professional Reliability Engineering firm focused on providing you confidence in reliability throughout your product life cycle.
Mike Silverman Managing Partner Offices & labs(408) [email protected]
Louis LaValleeSr. Reliability [email protected]
Websitewww.opsalacarte.com
Dave Vaughan [email protected]

Who Are We?– Ops A La Carte Santa Clara, CA
– Founded in 2001
– Named top 10 fastest growing, privately-held companies in the Silicon Valley in 2006 and 2009 by the San Jose Business Journal.
– Over 1400 projects completed in 10 years
– Over 500 Customers in over 30 countries
– Over 100 different industries, 6 main verticals
Clean Tech, Med Tech, Telecom, Defense, Oil/Gas, Consumer product
– We conduct FREE monthly webinars.
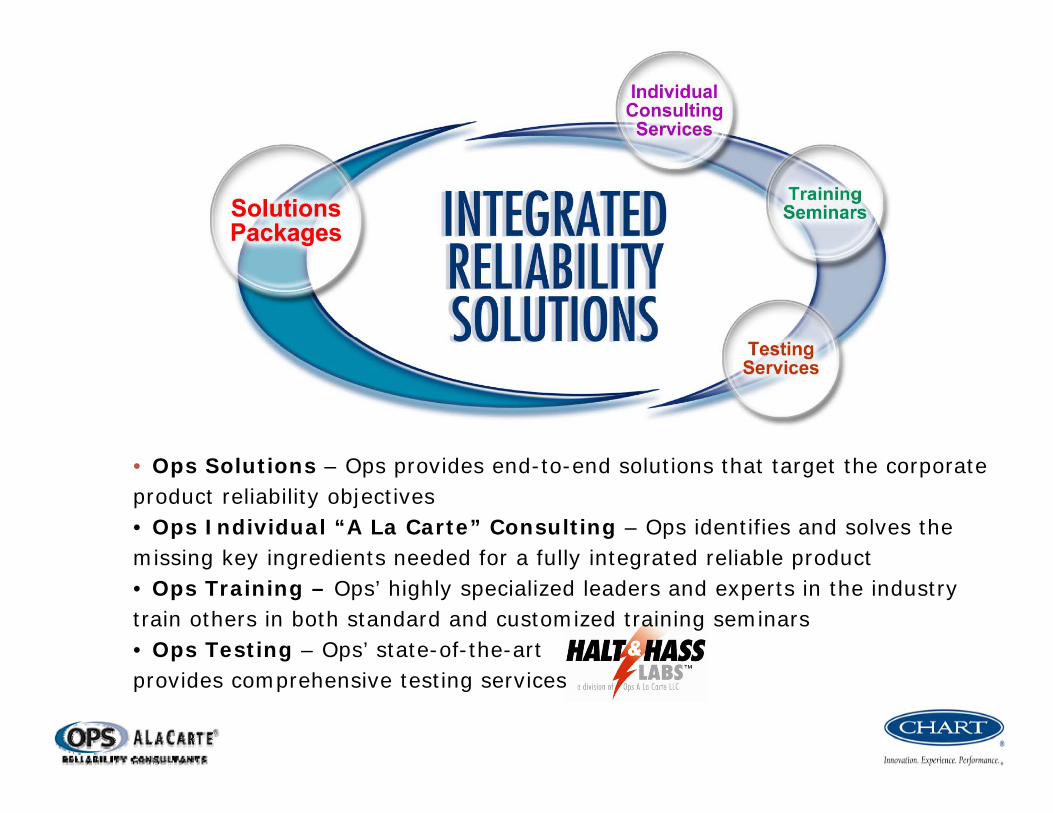
• Ops Solutions – Ops provides end-to-end solutions that target the corporate product reliability objectives • Ops Individual “A La Carte” Consulting – Ops identifies and solves the missing key ingredients needed for a fully integrated reliable product • Ops Training – Ops’ highly specialized leaders and experts in the industry train others in both standard and customized training seminars• Ops Testing – Ops’ state-of-the-artprovides comprehensive testing services

Presenter: Dave Vaughan,National Sales Manager, HALT/HASS [email protected]
HQ in Minnesota
• World’s Largest Cryogenic Equipment Supplier
• Building quality products since ‘ 63
• HALT/HASS chamber manufacturer since ‘ 97
• ISO 9001 Certified
• Only HALT/HASS supplier that can offer you a true Turn-key solution with Tank, Pipe and Chamber.
• Hundreds of HALT/HASS chambers worldwide.

Upcoming Events For Ops a la Carte•IPC Conference on Test & Inspection•May 15-17, 2012, Costa Mesa, CA.
•Ops A La Carte’s Vijay Prasad will be giving a presentation at this conference on "New Techniques for More Effective ESS".
•SMTA Conference on Soldering and Reliability•May 15‐18, 2012, Toronto. •Ops A La Carte's Peter Arrowsmith will be giving a presentation at this conference on "Improving Product Reliability Using Accelerated Stress Testing".

Upcoming Events for Ops a la Carte•MD&M East •May 22‐24, 2012, Philadelphia, PA•Ops A La Carte's Mike Silverman will be giving a 3 hour class on "Medical Reliability Testing ‐ Identifying Testing Requirements Early.“
•Applied Reliability Symposium •June 13-15, 2012, New Orleans, LA•Ops A La Carte's Mike Silverman will be giving a presentation on "Calculating ROI When Implementing a Design for Reliability Program".

Other Reliability Events
Certified Quality Engineer Preparation ClassDate(s): April 17 to May 29, 2012Time: 6pm‐10pm one night a week, 7 weeksLocation: San Jose, CA and Webinarhttp://www.opsalacarte.com/Pages/education/edu_10cqe.htm

Annual Reliability SymposiumMay 7‐11, 2012 in Santa Clara, California and via webinarTRACK ONE ‐ DFX TOOLS• Design for Reliability (DfR): May 7‐8• Design for 6 Sigma (DfSS): May 9• Design for Mechanical Reliability (DfMR): May 10• Design for Warranty (DfW): May 11 morning• Design for Software Reliability (DfS): May 11 afternoon
TRACK TWO ‐ REL TOOLS: ALT/DOE/RCA• Design of Experiments (DOE): May 7‐8• Best Accelerated Reliability Tests (BART): May 9‐10• Root Cause Analysis (RCA): May 11

Webinar Demographics
Registrants Approx 200US States 30Countries 13
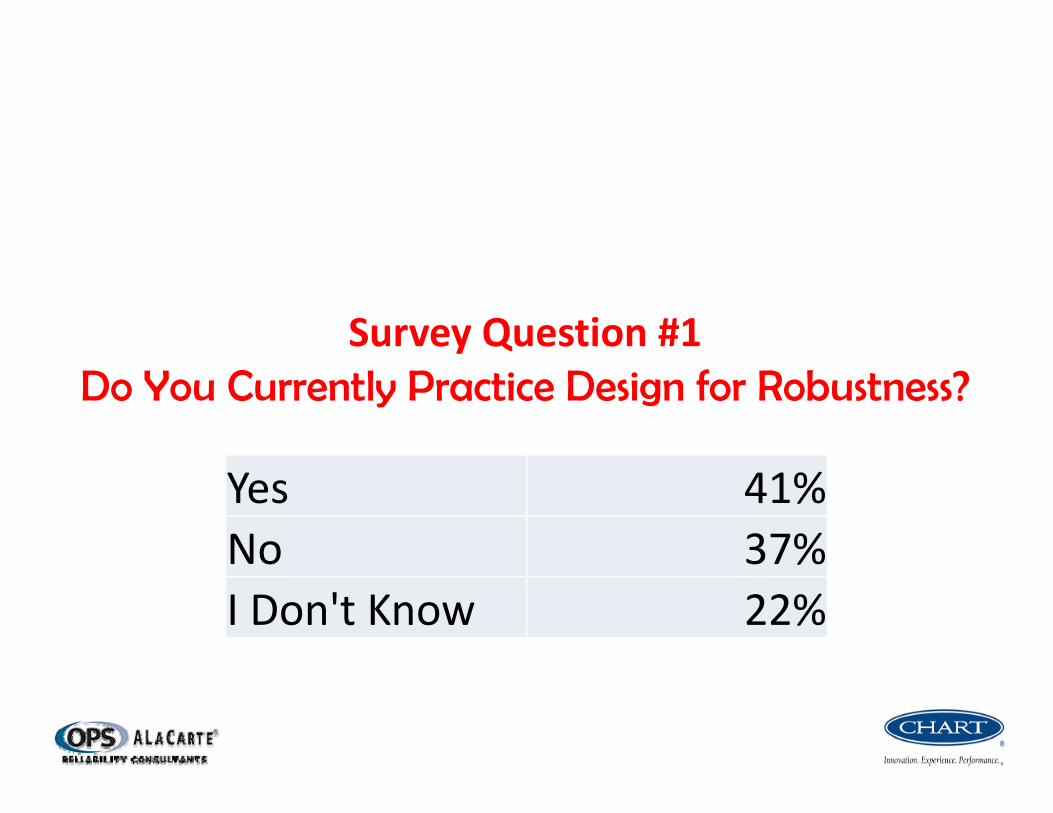
Survey Question #1Do You Currently Practice Design for Robustness?
Yes 41%No 37%I Don't Know 22%

Survey Question #2Do You Differentiate Design for Robustness from Design for Reliability when designing a product?
Yes 21%No 48%I Don't Know 30%

Abstract
Robust Design (RD) Methodology is discussed for hardware development. Comparison is made with reliability engineering (RE) tools and practices. Differences and similarities are presented.
Proximity to ideal function for robust design is presented and compared to physics of failure and other reliability modeling and prediction approaches . Measurement selection is shown to strongly differentiates RD and reliability engineering methods When and how to get the most from each methodology is outlined. Pitfalls for each set of practices are also covered.

DOE
TRIZ
PUGHDFR
QFD
AXD
VA/VE
ROBUST DESIGN
CP/CS MNGMT DFSS6
Many Design methods & Interfaces
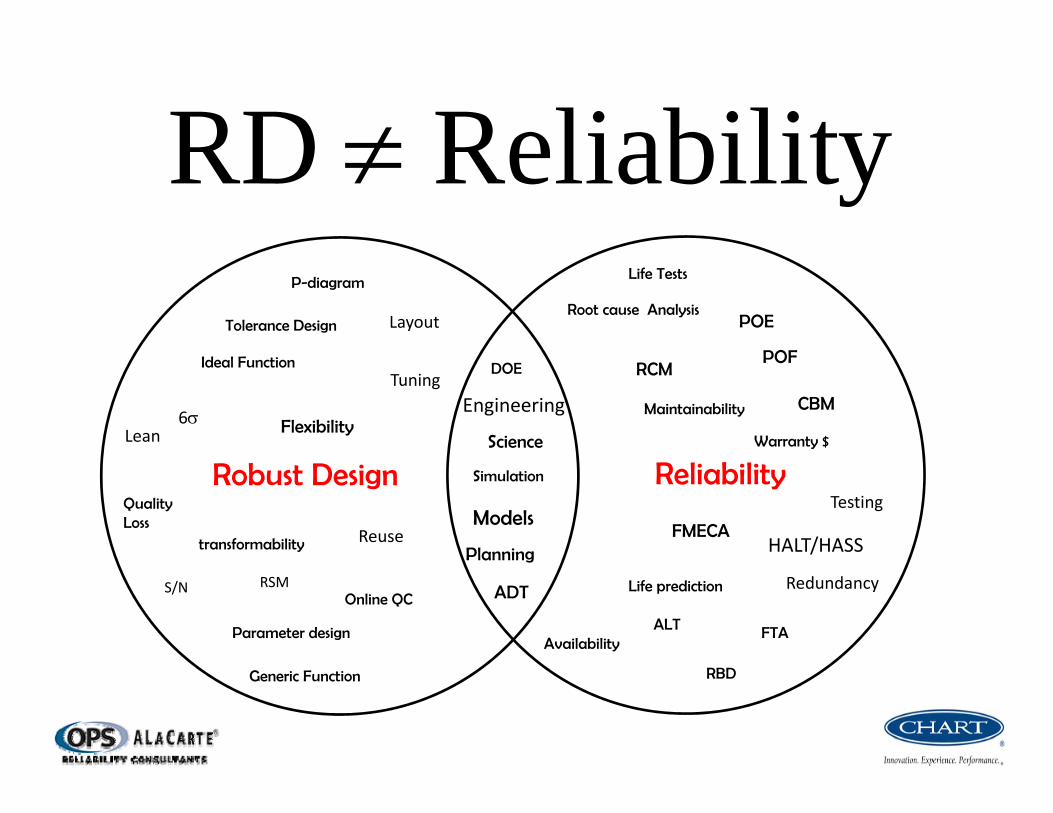
yReliabilitRD
Robust Design Reliability
DOEPOFIdeal Function
RSM
Root cause Analysis
Parameter design
Life prediction
6
FMECA
P-diagram
ADT
transformability
Engineering
Models
Science
Maintainability
Online QC
Tolerance Design
ALT
Life Tests
Planning
FTA
RBD
Simulation
RCM
Warranty $
Quality Loss
HALT/HASS
Availability
S/N
POE
Lean
Testing
Redundancy
Tuning
Reuse
CBM
Generic Function
Layout
Flexibility
A systematic engineering based methodology (which is part of the Quality Engineering Process) that develops and manufactures high reliabilityproducts at low cost with reduced delivery cycle. The goal of robust design is to improve R&D productivity and reduce variation while maintaining low cost before shipment and minimal loss to society after shipment.
Robust Design Definition

Robustness is…
“The ability to transform input to output as closely to ideal function as possible. Proximity to ideal function is highly desirable. A design is more robust if ratio of useful part to harmful part of input energy is large. A design is more robust if it operates close to ideal, even when exposed to various noise factors, including time”
Reliability is…
“The ability of a system, subsystem, assembly, or component to perform its required functions under stated conditions for a specified period of time”

RD Noise Factor Definitions:
Factors that disturb the function, which are difficult to control, or too expensive to control.
External noise factors include temperature, humidity, dust, vibration, contaminants,…
Unit-to-unit variation from manufacturing processes.
Deterioration, as time passes.
Selection of noise factors and levels is a prediction of how device will be used downstream. Noise factors are used for upstream, midstream and sometimes downstream experimentation.
HALT & Reliability
Polling question 1
How would you classify highly accelerated life testing (HALT )?
A. Robust design activity B. Reliability activity C. NeitherD. Both

Robust Design HALT
Quantitative Qualitative
‘Customer from hell ‘ prediction , with compound noise factors
Highly elevated stress levels for Temp, Vibration , voltage
Energy efficiency maximization None
Transformability of input to output None
Ideal function driven Failure mode driven
Cost & Quality Loss driven Warranty costs, Service costs
Upstream Technologyreproducibility downstream
Design-Build-test-fix-test-fixHALT Calculator
ANSWER: B

Test Time Compression with HALT/HASS
Highly Accelerated Life Test (HALT)
• Stresses product beyond specifications• Gathers information on Product Limitations• Focuses on Design Weakness & Failures• 6 DoF Vibration • High Thermal Rate of Change• Loosely Defined ‐Modified “On the Fly”• Not a “Pass/Fail” Test
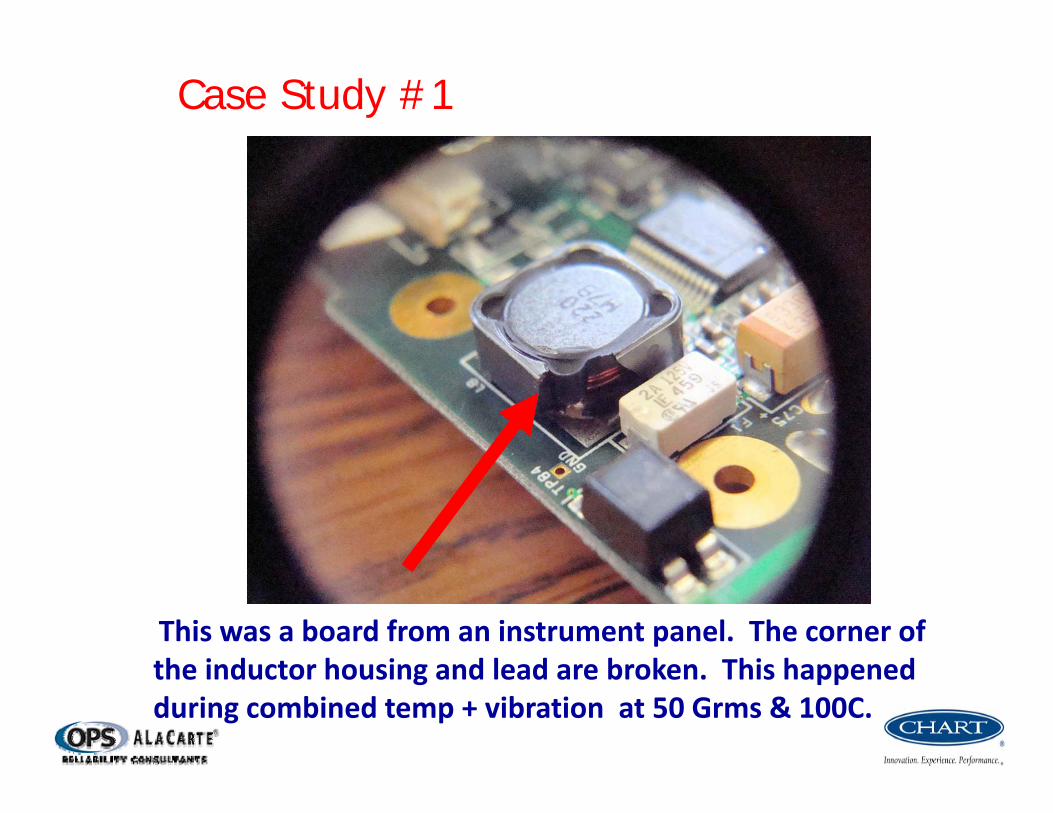
This was a board from an instrument panel. The corner of the inductor housing and lead are broken. This happened during combined temp + vibration at 50 Grms & 100C.
Case Study #1
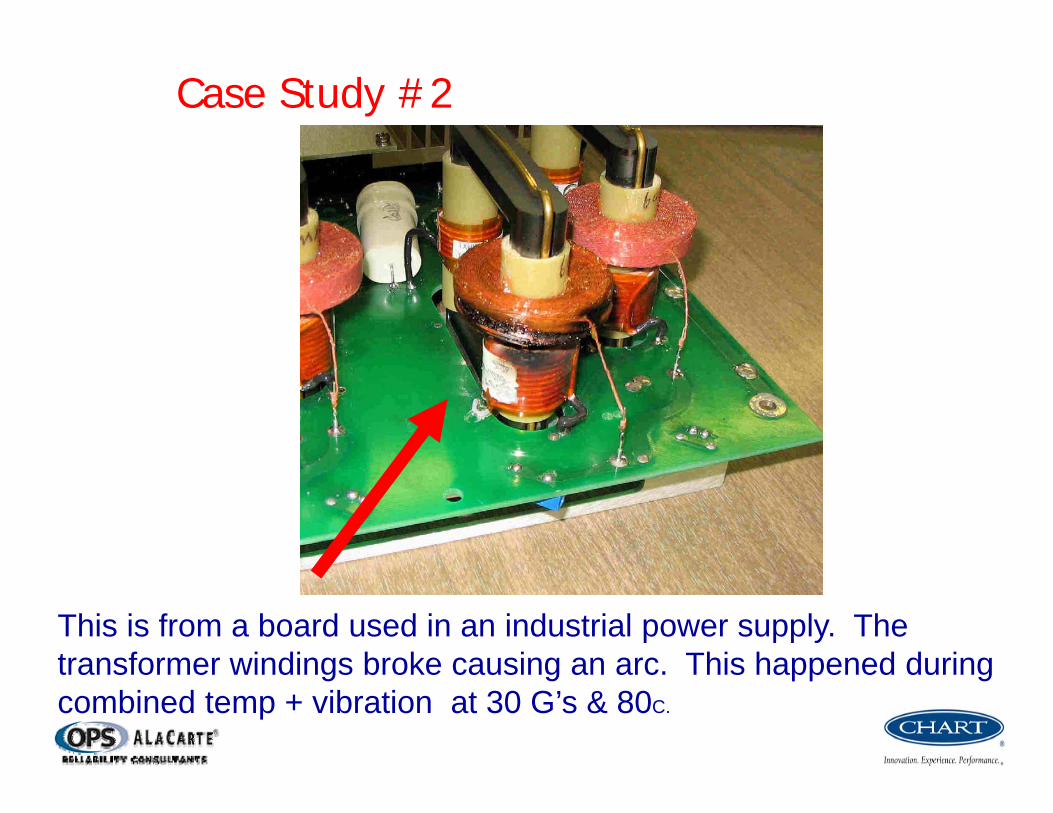
This is from a board used in an industrial power supply. The transformer windings broke causing an arc. This happened during combined temp + vibration at 30 G’s & 80C.
Case Study #2

• Largest Test Equipment manufacturer for the semiconductor industry
• Over $10 million dollars in warranty claims per year• Implemented HALT/HASS as part of their Product Development Process
• Company wide deployment
• Result: After 2‐3 years, warranty claims were reduced to $500K.
Case Study #3
• What HALT/HASS does for your Company– Your Product’s Reliability
• New Products– Expedite the Development of New Products
– Understand the existing product margins (and widen them)
– ‘Ruggedize’ the product and remove design related weaknesses
• Mature Products– Warranty Concerns
– Find Manufacturing Defects/ Initiate Process Changes
– Look for Continuous Product Improvement
Defective products create unexpected costs for producers and financial losses for disappointed consumers

Harmful Variation & Countermeasures
• Search for root cause & eliminate it
• Screen out defectives(scrap and rework)
• Feedback/feed forward control systems
• Tighten tolerances (control, noise, signal factors)
• Add a subsystem to balance the problem
• Calibration & adjustment
• Robust design (Parameter design & RSM)
• Change the concept to better one
• Turn off or turn down the power
• Correct design mistakes (putting diodes in backwards)

Enabled Reasoning
Flexible technology to avoid having to reoptimize or reinvent a new design each time
Fewer experiments to obtain required information.
Improved reproducibility of experiments and measurements
Improved energy efficiency through dynamic S/N ratios & adjustment factors
Experimental planning to reduce ad hoc / trial & error testing
Bringing Improvement objective to experimentation rather than just characterization
Preventing non-robust designs from going downstream creating lots of trouble
Smoother subsystem integration With coarse and fine tuning factor identification
Sales Points for Robust design
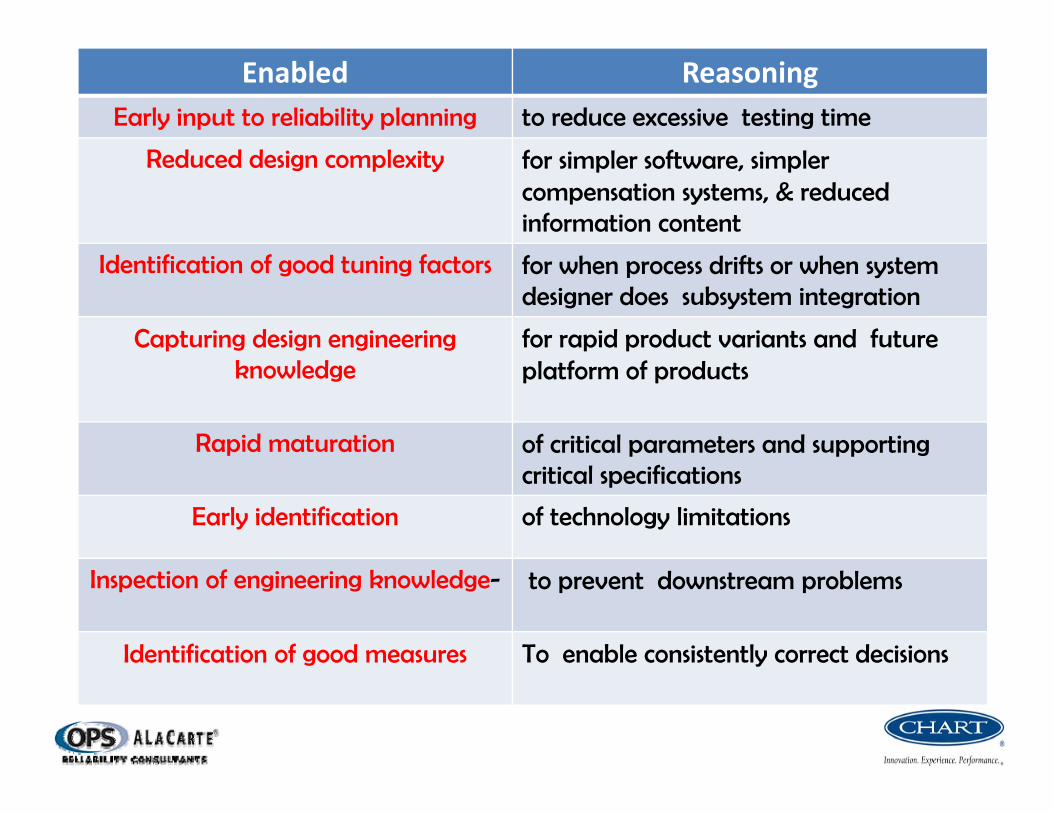
Enabled ReasoningEarly input to reliability planning to reduce excessive testing time
Reduced design complexity for simpler software, simpler compensation systems, & reduced information content
Identification of good tuning factors for when process drifts or when system designer does subsystem integration
Capturing design engineering knowledge
for rapid product variants and future platform of products
Rapid maturation of critical parameters and supporting critical specifications
Early identification of technology limitations
Inspection of engineering knowledge- to prevent downstream problems
Identification of good measures To enable consistently correct decisions
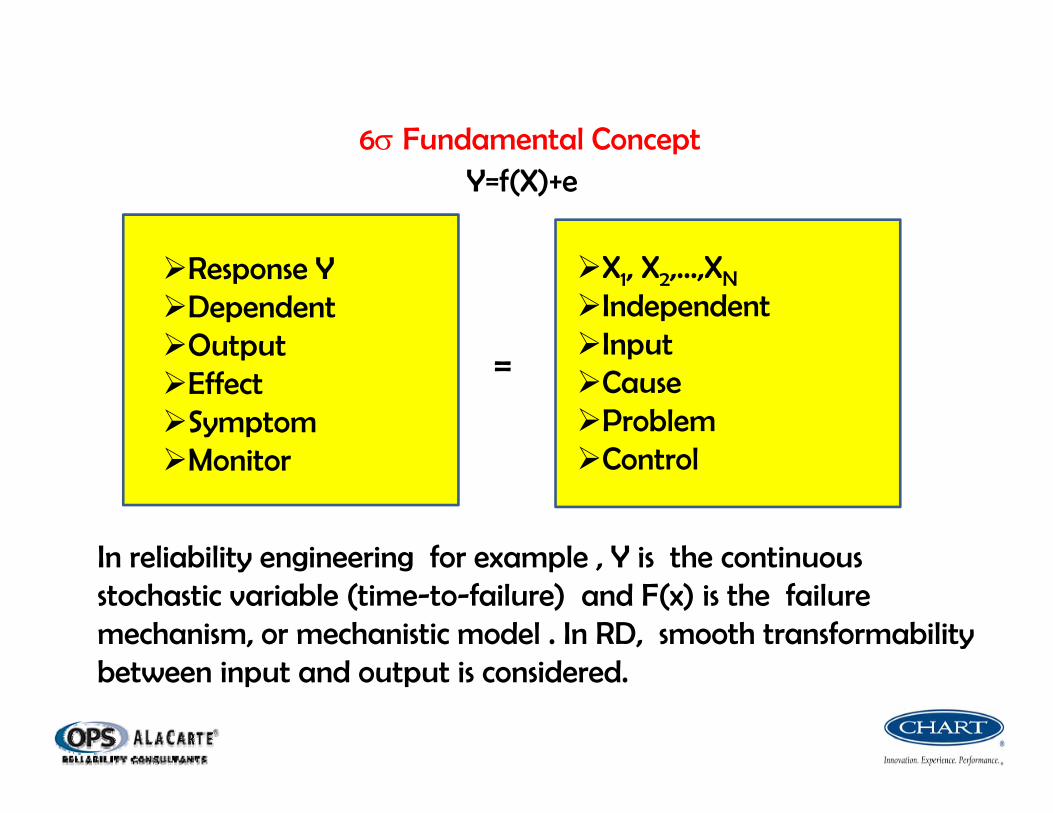
Y=f(X)+e6 Fundamental Concept
Response YDependentOutputEffectSymptomMonitor
X1, X2,…,XN
IndependentInputCauseProblemControl
In reliability engineering for example , Y is the continuous stochastic variable (time-to-failure) and F(x) is the failure mechanism, or mechanistic model . In RD, smooth transformability between input and output is considered.
=
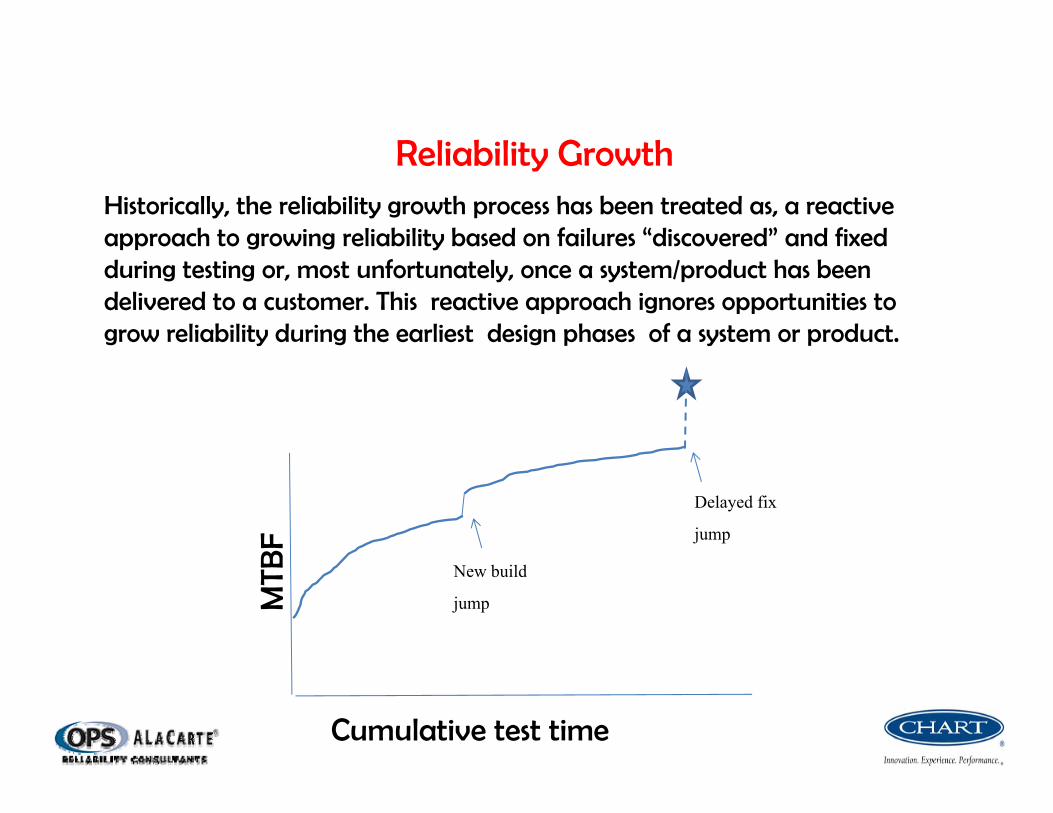
Historically, the reliability growth process has been treated as, a reactive approach to growing reliability based on failures “discovered” and fixed during testing or, most unfortunately, once a system/product has been delivered to a customer. This reactive approach ignores opportunities to grow reliability during the earliest design phases of a system or product.
Reliability Growth
MTB
F
Cumulative test time
New build
jump
Delayed fix
jump

Factors Can be changed today
time
Factors Can be changed in 1 week
time
S/N
Factors Can be changed in 2 weeks
time
Benchmark Target
Robustness Growth
S/N
Robustness gains
S/N
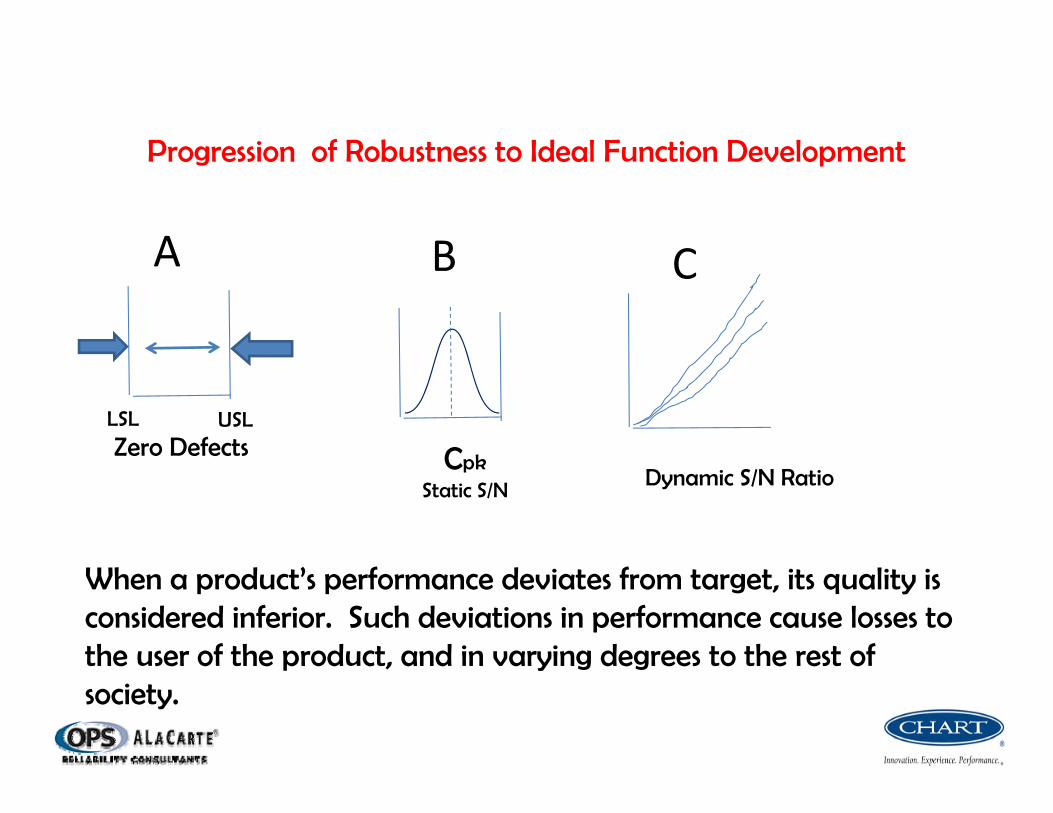
Zero Defects CpkStatic S/N
Dynamic S/N Ratio
A B C
When a product’s performance deviates from target, its quality is considered inferior. Such deviations in performance cause losses to the user of the product, and in varying degrees to the rest of society.
Progression of Robustness to Ideal Function Development
USLLSL

Main FunctionY=f(x)+
UsefulOutput
HarmfulOutput
Input signalsMi
Noise Factors
Taxonomy of Design Function --P Diagram
Control Factors

Polling Question 2
Which is a more difficult problem for engineers?
a. Tuning the mean value of a device or process outputb. Controlling the variation of a device or process outputc. Both have the same degree of difficultyd. Tuning and variation control are just manufacturing
problems
Spring Example
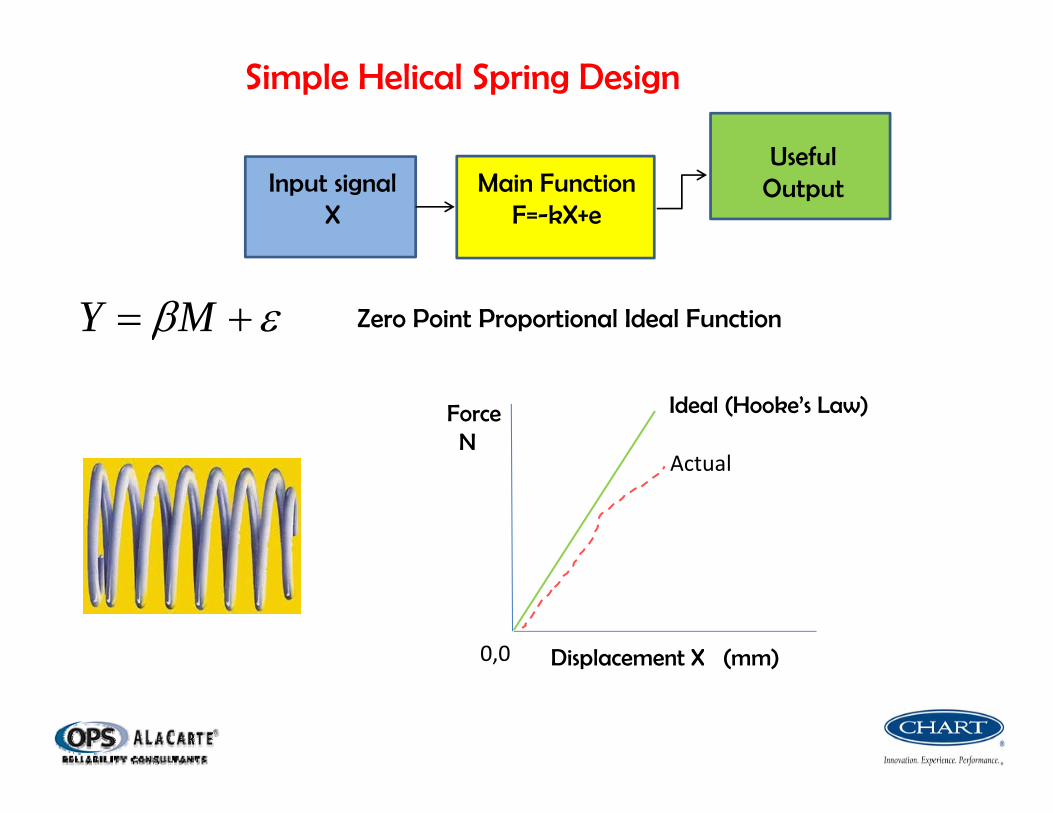
Main FunctionF=-kX+e
UsefulOutput
0,0
MY
ForceN
Displacement X (mm)
Ideal (Hooke’s Law)
Actual
Simple Helical Spring Design
Input signalX
Zero Point Proportional Ideal Function
0,0 M signal
N1
N2
Response
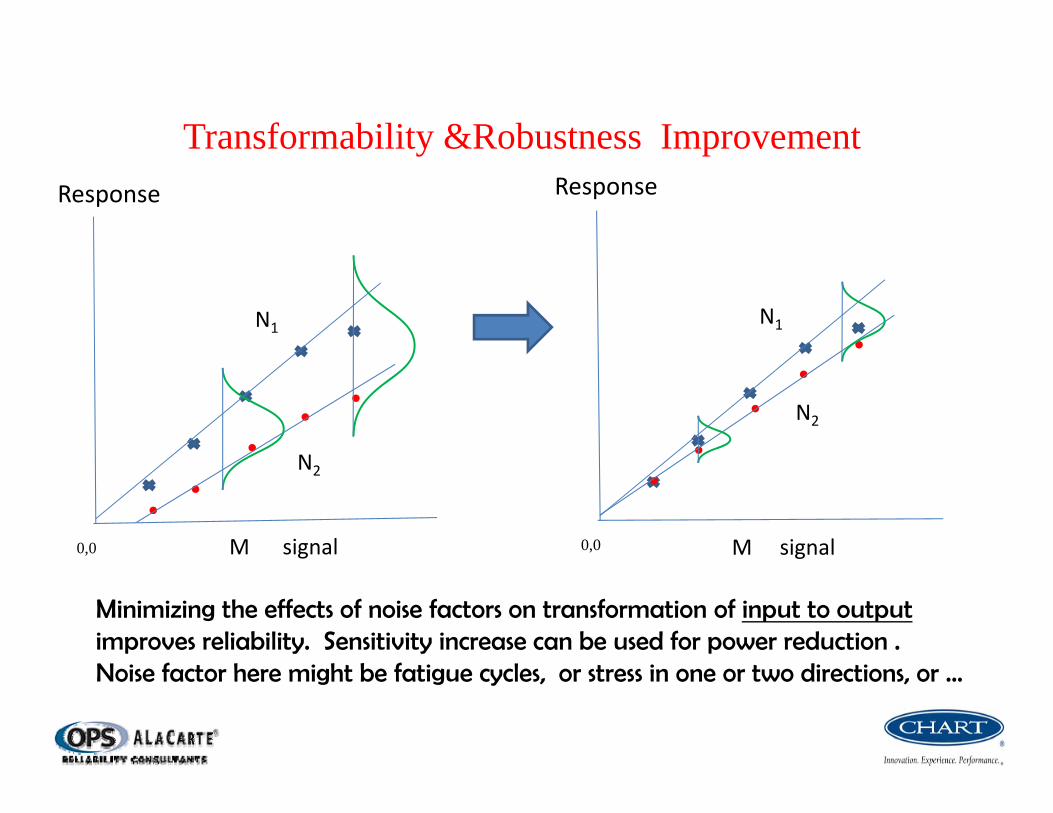
Minimizing the effects of noise factors on transformation of input to outputimproves reliability. Sensitivity increase can be used for power reduction . Noise factor here might be fatigue cycles, or stress in one or two directions, or …
Transformability &Robustness Improvement
0,0 M signal
N1
N2
Response

Resolution of the quantity of work which various types of sources have performed on the target characteristic. All factors affect variation. (screening?)
In physics, the quantity of work is proportional to the product of a generalized force and a generalized displacement.
Energy is always the product of a pair of variables e.g. Force and distance for mechanical , voltage and charge, pressure and volume, absolute temperature and S, magnetic potential and magnetic flux, chemical potential and quantity of material, moment and angular rotation, etc.
RD’s focus is on elements of energy transfer
Analysis of Variance ANOVA
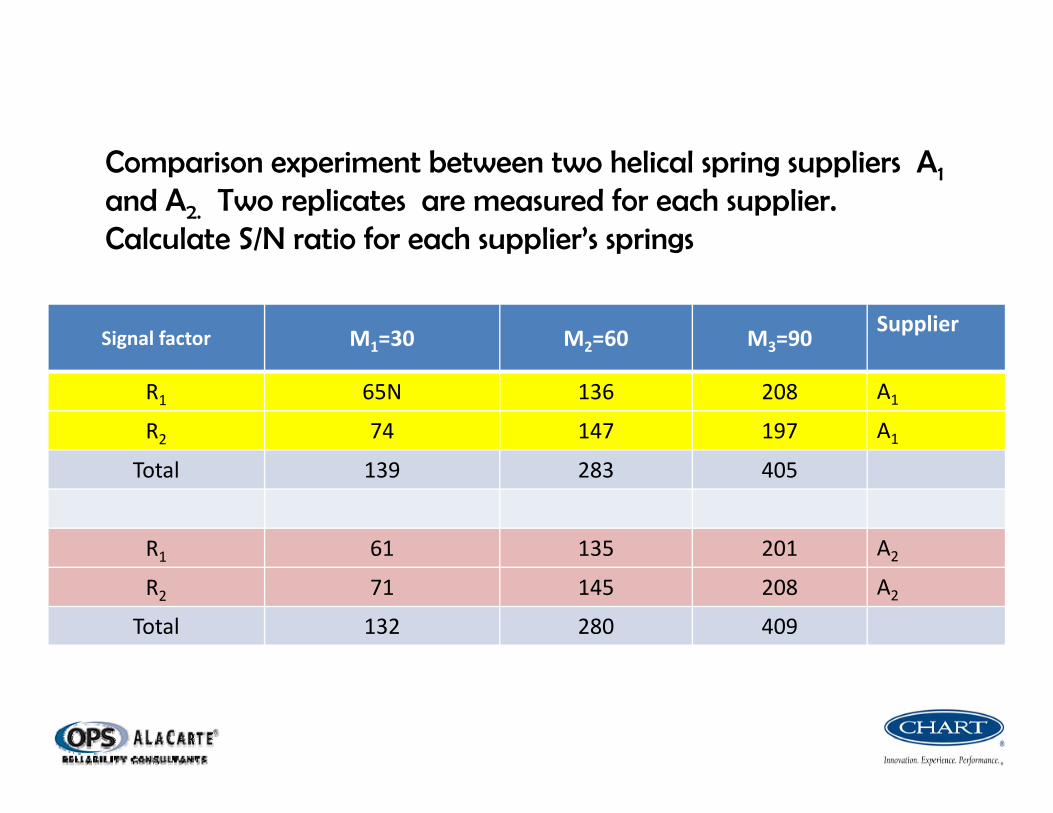
Comparison experiment between two helical spring suppliers A1
and A2. Two replicates are measured for each supplier. Calculate S/N ratio for each supplier’s springs
Signal factor M1=30 M2=60 M3=90Supplier
R1 65N 136 208 A1
R2 74 147 197 A1
Total 139 283 405
R1 61 135 201 A2
R2 71 145 208 A2
Total 132 280 409

e
e
ee
Te
kk
k
krT
V
VSrr
krSV
krdfSSS
df
yMyMyMrr
S
MMMr
rrSE
krdf
yyyS
010
0
0
22211
0
222
21
220
0
2211
211
1
log10
1
1
1
...1...
)(
...0
Power of signal to change useful output
Power of Noise to change harmful output‐‐‐‐‐‐‐‐‐‐‐‐‐‐‐‐‐‐‐‐‐‐‐‐‐‐‐‐‐‐‐‐‐‐‐‐‐‐‐‐‐‐‐‐‐‐‐‐‐‐
Robustness S/N ratio ANOVA Calculation
Total Sum of Squares
Power of signal
Expected value of
Total Degrees of freedom
Sum of squares for slope
Sum of squares for error
Error Variance
Degrees of freedom for
Degrees of freedom for error

dB
dB
SV
dfSSS
dfrr
yMyMyMS
rrdfS
A
A
ee
Te
T
79.7
29.91177.log1037.44
37.4414.13165725200
1
log10
37.445
86.2215
586.22114.131657131879
1
14.13165725200
)405902836013930()(
200,2590603026
131879197...7465
2
1
2
0
2111111
2220
222
S/N Ratio Calculation & Comparison for Two Suppliers A1 & A2
Supplier A2 better by 1.5 dB

Main FunctionY=f(x)+
UsefulOutputInput signal
M
Main function is to transform input signal to useful output. Energy transformation takes many different forms, (but usually not 2nd order polynomials, as in RSM)
2
1
21
00 )(
MMY
MMYMY
MMYYMY
MY
...
)
1
MMYjXRjXRYY
MYeY
x
M
Common Ideal Function Forms: MMMY ***

Measurements Discussion
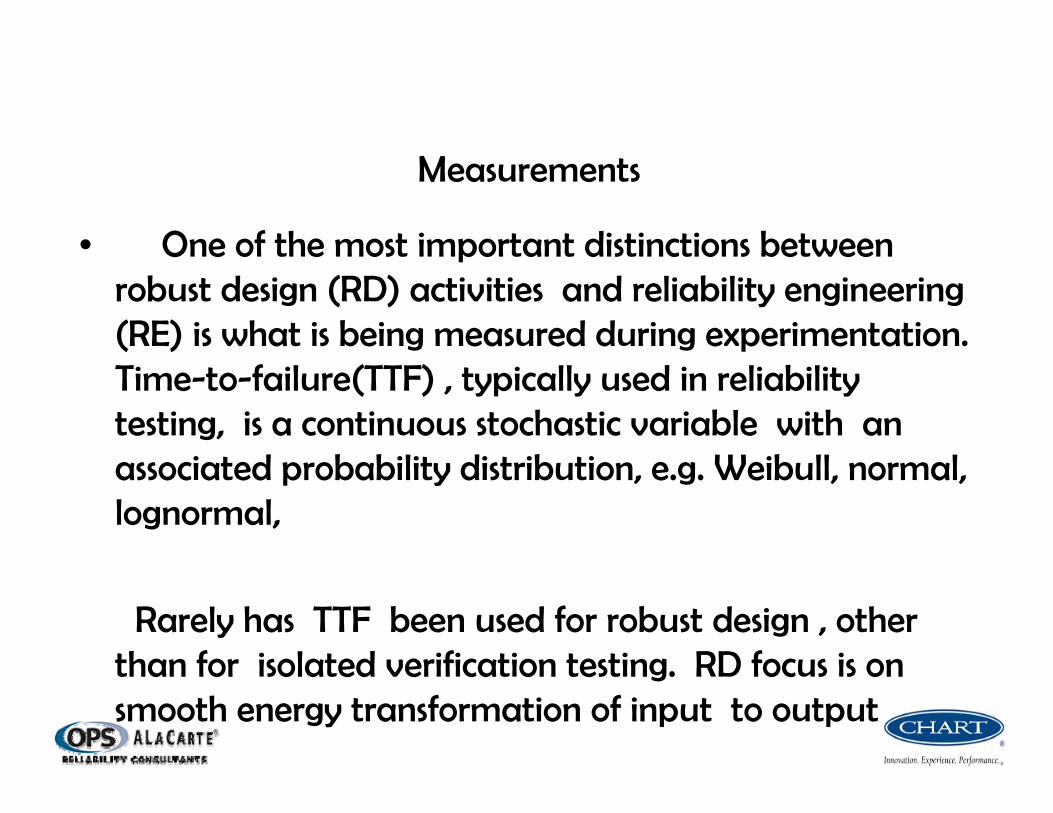
Measurements
• One of the most important distinctions between robust design (RD) activities and reliability engineering (RE) is what is being measured during experimentation. Time-to-failure(TTF) , typically used in reliability testing, is a continuous stochastic variable with an associated probability distribution, e.g. Weibull, normal, lognormal,
Rarely has TTF been used for robust design , other than for isolated verification testing. RD focus is on smooth energy transformation of input to output
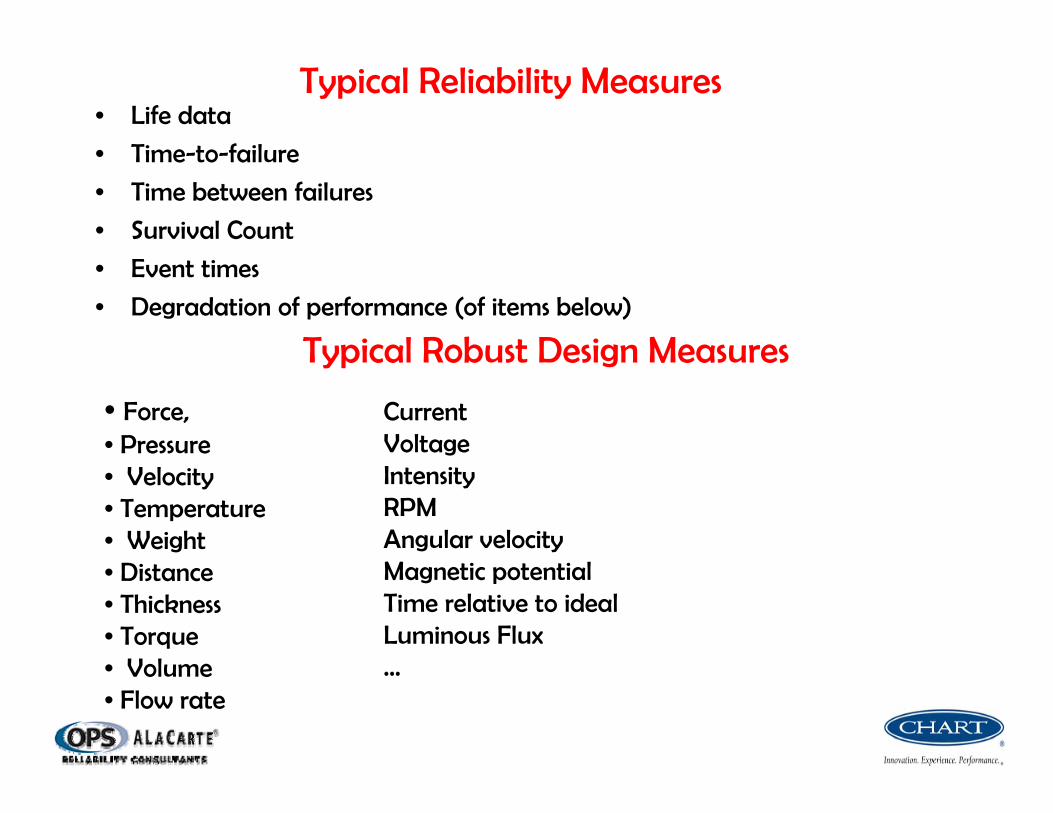
Typical Reliability Measures • Life data
• Time-to-failure
• Time between failures
• Survival Count
• Event times
• Degradation of performance (of items below)
Typical Robust Design Measures
• Force, • Pressure • Velocity• Temperature• Weight• Distance• Thickness• Torque • Volume• Flow rate
CurrentVoltageIntensityRPMAngular velocityMagnetic potentialTime relative to idealLuminous Flux…

RD Criteria for Measurement Validity first
Continuous variable (richest analytics)
Completeness
Fundamental, disaggregated
Practical, affordable
Monotonic with control factors
Related to basic energy transfer mechanism
Measurement Capability High
Engineering Focus
Picks up information about dysfunction
Open loop
Try not to measure ‘ideally zero ‘ quantities

X
Stack 1
X
Stack 2
X
Stack 3
X
Stack 4
Lack of monotonicity of ‘misregistration’ measurement
Four paper stacks with same X. Same number indicates different problems and different required countermeasures. Yield?

Science & Engineering Attitude
• In science, understanding nature, searching for an accurate relational equation, and uncovering patterns and symmetries are most important. Reduction of error between observed characteristic value and the relational equation prediction is paramount. This method is completely correct as a scientific objective, i.e. searching for a formula which correctly expresses observational data.
• Engineering attitude however must consider profitability, excellence, efficiency of R&D. Low cost competitive designs which can operate with small variation even when subjected to combinations of worst predicted customer usage conditions, manufacturing tolerances, and degradation processes are required.
RD is more engineering oriented while Reliability (POF) is more science oriented!
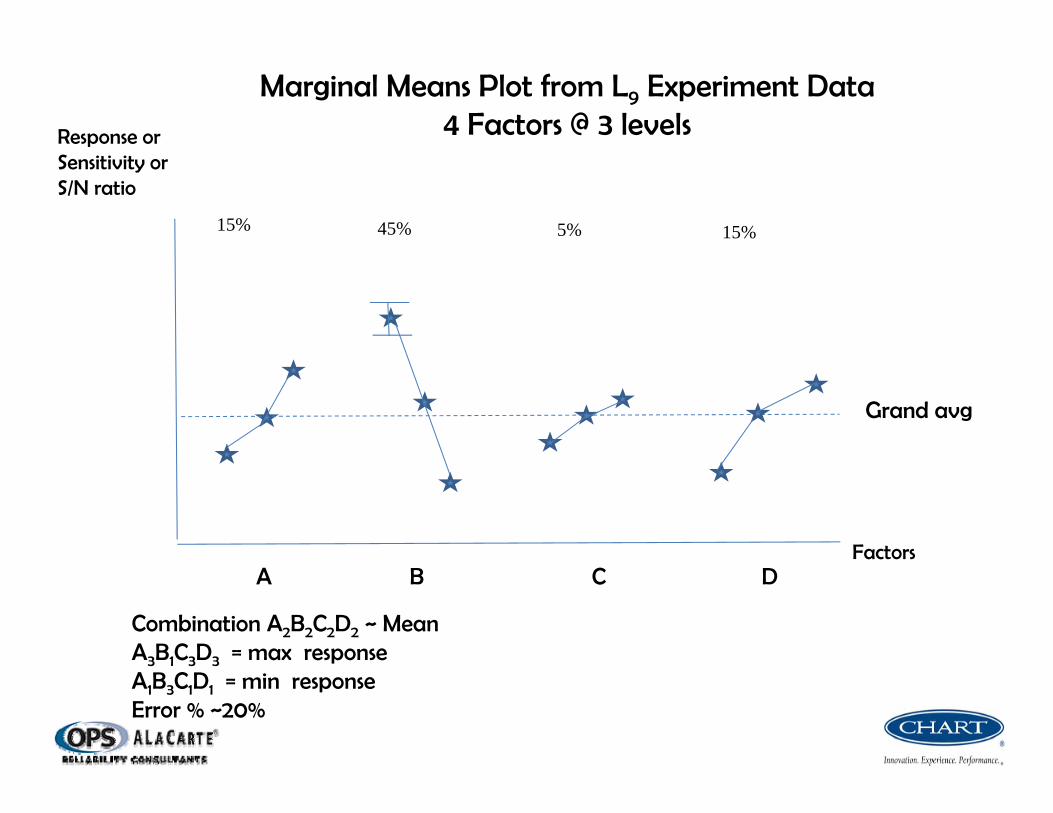
Response orSensitivity or S/N ratio
A B C D
Grand avg
Marginal Means Plot from L9 Experiment Data4 Factors @ 3 levels
15% 45% 5% 15%
Combination A2B2C2D2 ~ MeanA3B1C3D3 = max responseA1B3C1D1 = min responseError % ~20%
Factors
Ideal Function Examples

Automotive Brake Pad Example
IdealY
M
RealityYM=Master cylinder Pressure
Y=Torque Generated
IdealY
MM*
Y
MM*
Adjustment signal M*=Pad surface area
Y=torque generated
Reality
Ideal Function=Y=MM*
M
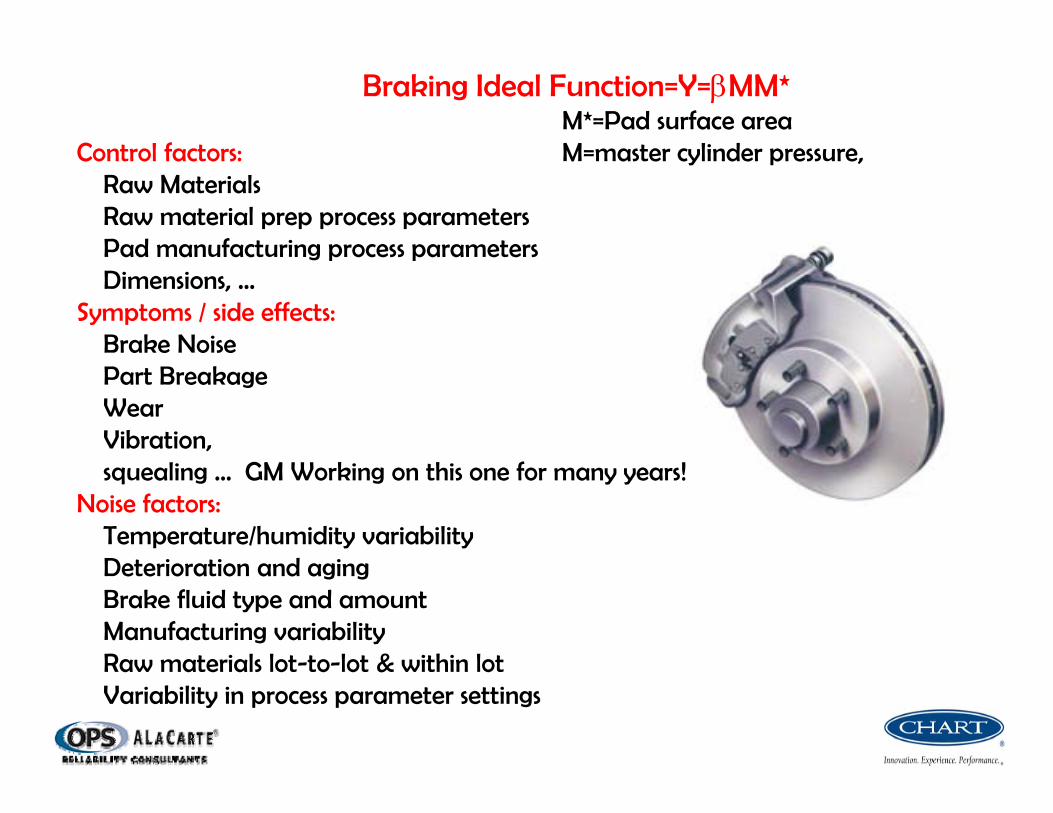
Braking Ideal Function=Y=MM* M*=Pad surface area
Control factors: M=master cylinder pressure,Raw MaterialsRaw material prep process parametersPad manufacturing process parametersDimensions, …
Symptoms / side effects:Brake NoisePart BreakageWearVibration, squealing … GM Working on this one for many years!
Noise factors:Temperature/humidity variabilityDeterioration and agingBrake fluid type and amountManufacturing variability Raw materials lot-to-lot & within lotVariability in process parameter settings

Numerical Control Machine (NC)
Ideal Function: Transform programmed dimensions into product dimensions
A generic test piece rather than an actual part, can be designed. The test piece can be easier to measure accurately. It also can evaluate multiple levels of signal factor.
Control Factors: Speed, Feed rate, Tool Material, Tool travel, Tool stiffness, cut Depth, tool angle, …
Noise Factors: Material Hardness, tool wear, Lubricant age, Lubricant condition,…
Lots of dimensionsto measure by CMM~67 level signal factor

M67M1
NC machine Intended dimension(mm)
Pa
rt D
imen
sions
Hardness 1
v
Hardness 2IdealFunctionY=M+e
Generic test piece Transformability
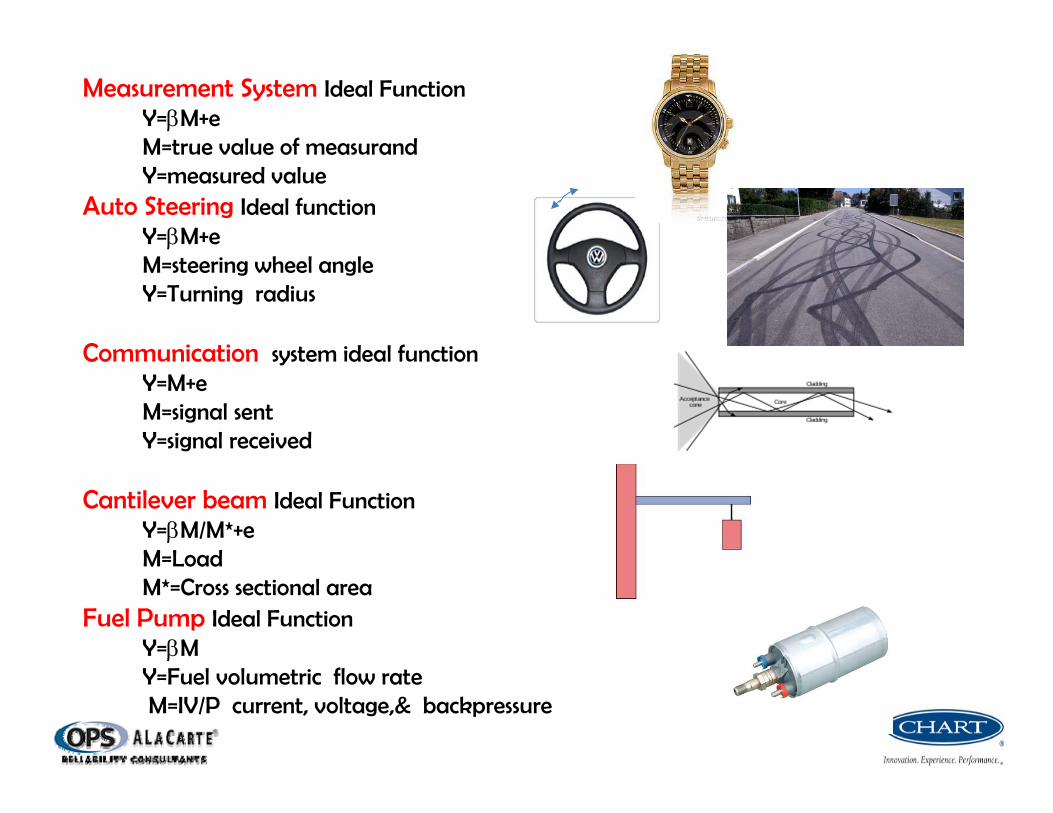
Measurement System Ideal FunctionY=M+eM=true value of measurandY=measured value
Auto Steering Ideal functionY=M+eM=steering wheel angleY=Turning radius
Communication system ideal functionY=M+eM=signal sentY=signal received
Cantilever beam Ideal FunctionY=M/M*+eM=LoadM*=Cross sectional area
Fuel Pump Ideal FunctionY=MY=Fuel volumetric flow rateM=IV/P current, voltage,& backpressure

Laser welding for Lap Joint Ideal FunctionY=MM*+e M=displacementM*=LengthY=measured shear force
Windshield wiper Ideal FunctionY=M+eY = measured arrival time for wiper to reach a fixed pointM=Theoretical, ideal time for which system was designed 1/rpm
of the motor
Metal Stamping ideal functionY=M+eY=thickness change (t0-t)after stampingM=intended height changeMinimize

Adhesive film ideal functionY=M+eY=peel strength
M=contact widthMaximize
W
Roll Mill ideal functionY=M+eY=Thickness change
M=reduction ratioMaximize
Determine the limiting value for thinness. More robust condition would enable thinner

POF

Knowledge of how things fail and the root causes of failures enables engineers to identify and avoid unknowingly creating inherent potential failure mechanisms in new product designs and solve problems faster
“Knowing how & why things fail is equally important to understand how & why things work”
POF is applicable to the entire product life cycle
POF Underpinnings
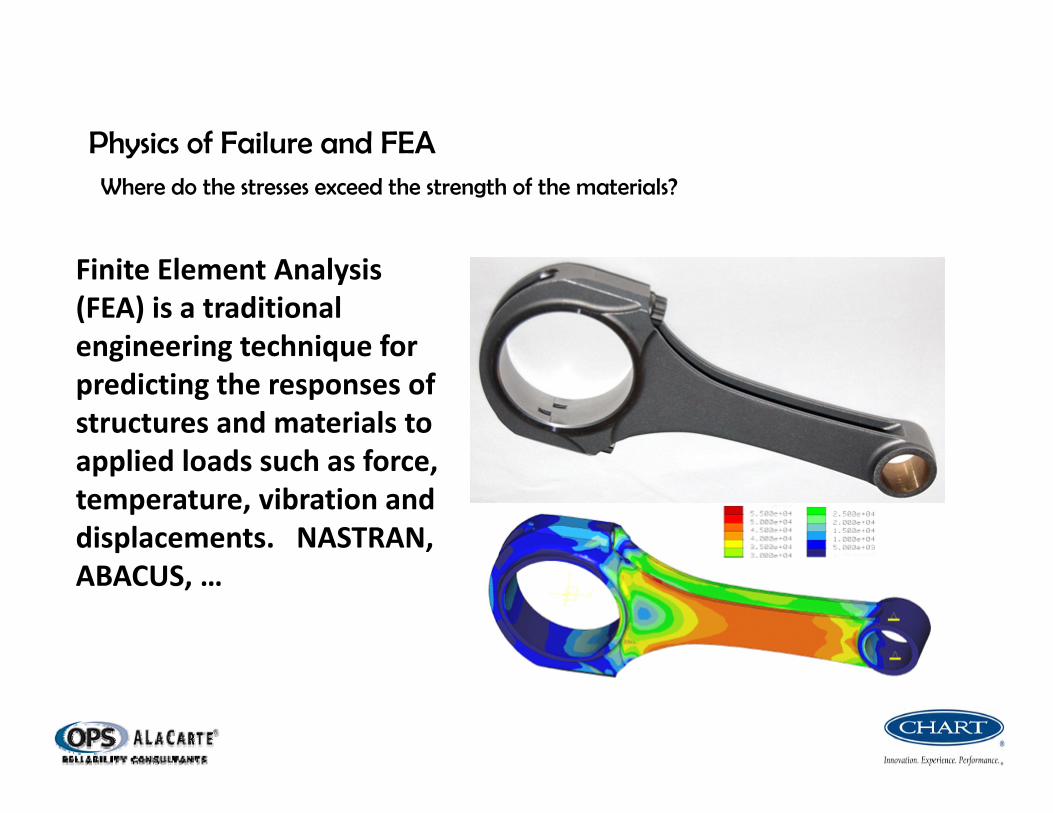
Finite Element Analysis (FEA) is a traditional engineering technique for predicting the responses of structures and materials to applied loads such as force, temperature, vibration and displacements. NASTRAN, ABACUS, …
Physics of Failure and FEAWhere do the stresses exceed the strength of the materials?

RSM
Describe Design Collect Fit Predict

Response Surface Methods (RSM) Plateaus & Some Robustness
Requires construction of a mathematical model via response surface methods (RSM) Typical model is a second order polynomial model of the form:
The model approximates the unknown true response function by the first few terms of a Taylor’s series expansion . RSM has recently been enhanced by inclusion of Propagation of error (POE) methodology.
‘s are unknown coefficients to be estimated from experimental data. is an unknown calculable error .
21122222
211122110 XXXXXXY

Y
A1
Variation from factor A setting is transmitted to variation in response Y. How much variation depends on nonlinearity of relationship and input variation.
A2
k
iresidx
iY ix
y1
222
2
Propagation of Error & RSM
2221
211
2111110
4.125
4.125
7.2515ˆ
residAY A
AAy
AAY
AAY
Factor A
sensitivity

Central Composite Design
Plateau
RSM Graphics
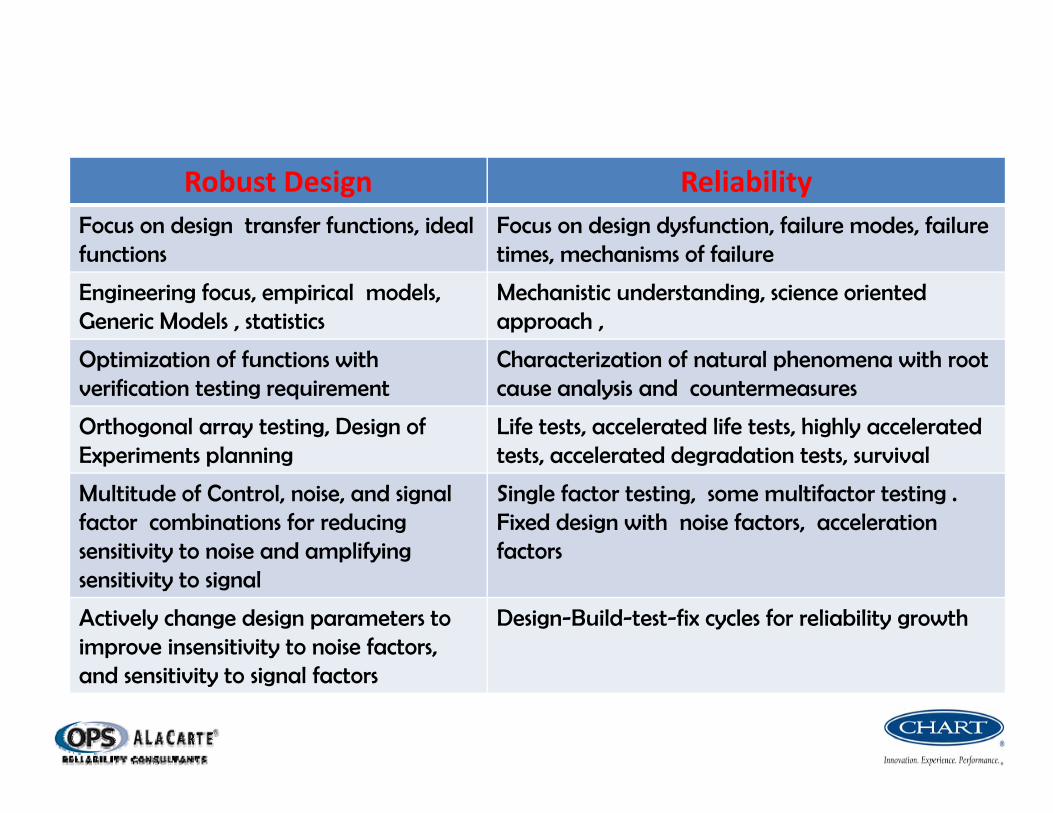
Robust Design Reliability Focus on design transfer functions, ideal functions
Focus on design dysfunction, failure modes, failure times, mechanisms of failure
Engineering focus, empirical models, Generic Models , statistics
Mechanistic understanding, science orientedapproach ,
Optimization of functions with verification testing requirement
Characterization of natural phenomena with root cause analysis and countermeasures
Orthogonal array testing, Design of Experiments planning
Life tests, accelerated life tests, highly accelerated tests, accelerated degradation tests, survival
Multitude of Control, noise, and signal factor combinations for reducing sensitivity to noise and amplifying sensitivity to signal
Single factor testing, some multifactor testing . Fixed design with noise factors, accelerationfactors
Actively change design parameters to improve insensitivity to noise factors, and sensitivity to signal factors
Design-Build-test-fix cycles for reliability growth
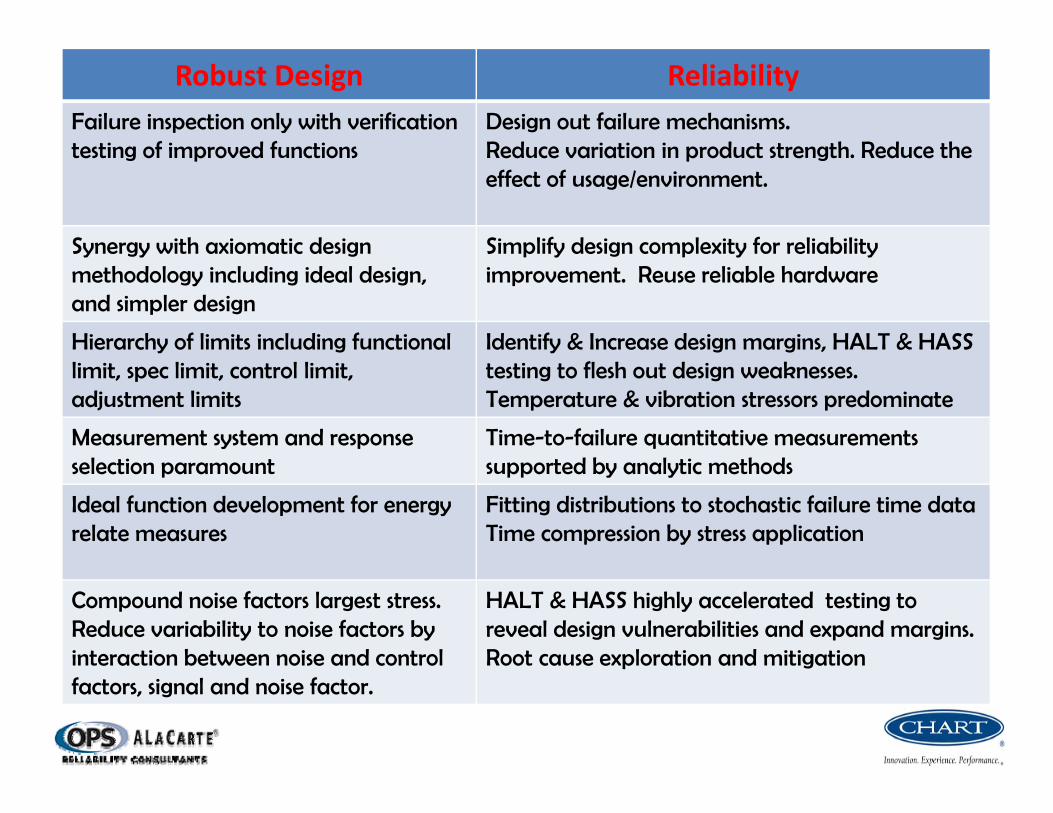
Robust Design Reliability Failure inspection only with verification testing of improved functions
Design out failure mechanisms.Reduce variation in product strength. Reduce the effect of usage/environment.
Synergy with axiomatic design methodology including ideal design, and simpler design
Simplify design complexity for reliability improvement. Reuse reliable hardware
Hierarchy of limits including functional limit, spec limit, control limit, adjustment limits
Identify & Increase design margins, HALT & HASS testing to flesh out design weaknesses.Temperature & vibration stressors predominate
Measurement system and response selection paramount
Time-to-failure quantitative measurements supported by analytic methods
Ideal function development for energy relate measures
Fitting distributions to stochastic failure time dataTime compression by stress application
Compound noise factors largest stress. Reduce variability to noise factors by interaction between noise and control factors, signal and noise factor.
HALT & HASS highly accelerated testing to reveal design vulnerabilities and expand margins. Root cause exploration and mitigation

Summary
• RD methods and Reliability methods both have functionality at their core. RD methods attempt to optimize the designs toward ideal function, diverting energy from creating problems and dysfunction. Reliability methods attempt to minimize dysfunction through mechanistic understand and mitigation of the root causes for problems.
• RD methods actively change design parameters to efficiently and cost effectively explore viable design space. Reliability methods subject the designs to stresses, accelerating stresses, and even highly accelerated stresses, [to improve time and cost of testing]. First principle physical models are considered where available to predict stability.
• Both RE and RD methods have strong merits, and learning when and how to apply each is a great advantage to product engineering teams.
Thanks for you kind attention • Presentation .PDF will be available shortly on www.opsalacarte.com
• Send comments and questions to [email protected]

APPENDIX

Upcoming Reliability Webinars
Our next FREE Webinar will be on: June 6, 2012Which topic would you like to see?1. Choosing the right Accelerated Life Test2. Getting the most out of your FMEA3. ROI for Design for Reliability4. ROI for HALT Calculator
Send answer to : [email protected]