
Robust and E cient Object Recognition for a Humanoid ... · PDF fileRobust and E cient Object...
12
Robust and Efficient Object Recognition for a Humanoid Soccer Robot Alexander H¨ artl 1 , Ubbo Visser 1 , and Thomas R¨ ofer 2 1 University of Miami, Department of Computer Science, 1365 Memorial Drive, Coral Gables, FL, 33146 USA E-Mail: {a.haertl|visser}@cs.miami.edu 2 Deutsches Forschungszentrum f¨ ur K¨ unstliche Intelligenz, Cyber-Physical Systems, Enrique-Schmidt-Str. 5, 28359 Bremen, Germany E-Mail: [email protected] Abstract. Static color classification as a first processing step of an ob- ject recognition system is still the de facto standard in the RoboCup Standard Platform League (SPL). Despite its efficiency, this approach lacks robustness with regard to changing illumination. We propose a new object recognition system where objects are found based on color similarities. Our experiments with line, goal, and ball recognition show that the new system is real-time capable on a contemporary NAO (ver- sion 3.2 and above). We show that the detection rate is comparable to color-table-based object recognition under static lighting conditions and substantially better under changing illumination. 1 Introduction Color-based recognition of geometrically simple objects is a well known problem that has been extensively studied for over two decades [18,5]. Prominent exam- ples for successful image processing methods are edge detection [2,10], region- growth algorithms [21,8], and histogram-based algorithms [12,19,14]. A popular approach is based on edge detection and subsequent Hough transformation [4] in which the authors show a method for line detection that can be used for more general curve fitting. Although the literature shows a broad range of varia- tions and implementations of the mentioned approaches, only a few can be used for embedded systems that are constrained by limited resources such as time, memory, and/or CPU power. The RoboCup Soccer environment demands efficient real-time object recog- nition. Many systems are still based on fixed color tables that are similar or based on the CMVision system [1]. It is well suited for static lighting conditions but lacks robustness when illumination varies. R¨ ofer [15] improved the robust- ness by introducing ambiguous color classes and delaying hard decisions to a later processing stage. Reinhardt [14] uses different heuristics applied to color histograms to cope with variations in illumination. We propose a new object recognition system where objects are found based on color similarities. As a first step, a subsampling is created considering the
Transcript of Robust and E cient Object Recognition for a Humanoid ... · PDF fileRobust and E cient Object...

Robust and Efficient Object Recognition for aHumanoid Soccer Robot
Alexander Hartl1, Ubbo Visser1, and Thomas Rofer2
1 University of Miami, Department of Computer Science,1365 Memorial Drive, Coral Gables, FL, 33146 USA
E-Mail: {a.haertl|visser}@cs.miami.edu2 Deutsches Forschungszentrum fur Kunstliche Intelligenz,
Cyber-Physical Systems, Enrique-Schmidt-Str. 5, 28359 Bremen, GermanyE-Mail: [email protected]
Abstract. Static color classification as a first processing step of an ob-ject recognition system is still the de facto standard in the RoboCupStandard Platform League (SPL). Despite its efficiency, this approachlacks robustness with regard to changing illumination. We propose anew object recognition system where objects are found based on colorsimilarities. Our experiments with line, goal, and ball recognition showthat the new system is real-time capable on a contemporary NAO (ver-sion 3.2 and above). We show that the detection rate is comparable tocolor-table-based object recognition under static lighting conditions andsubstantially better under changing illumination.
1 Introduction
Color-based recognition of geometrically simple objects is a well known problemthat has been extensively studied for over two decades [18,5]. Prominent exam-ples for successful image processing methods are edge detection [2,10], region-growth algorithms [21,8], and histogram-based algorithms [12,19,14]. A popularapproach is based on edge detection and subsequent Hough transformation [4]in which the authors show a method for line detection that can be used formore general curve fitting. Although the literature shows a broad range of varia-tions and implementations of the mentioned approaches, only a few can be usedfor embedded systems that are constrained by limited resources such as time,memory, and/or CPU power.
The RoboCup Soccer environment demands efficient real-time object recog-nition. Many systems are still based on fixed color tables that are similar orbased on the CMVision system [1]. It is well suited for static lighting conditionsbut lacks robustness when illumination varies. Rofer [15] improved the robust-ness by introducing ambiguous color classes and delaying hard decisions to alater processing stage. Reinhardt [14] uses different heuristics applied to colorhistograms to cope with variations in illumination.
We propose a new object recognition system where objects are found basedon color similarities. As a first step, a subsampling is created considering the

perspective projection of objects on the field plane (Section 2.1). Based on thesubsampling, the image is segmented line-wise considering color similarities ofneighboring pixels, similar to region growing (Section 2.2). The actual objectrecognition (Section 3) is based on the result of this segmentation. Line andball detection are based on region growing, considering the shape of the objects,whereas the goal detection is histogram-based.
We have conducted our experiments for line, goal, and ball recognition (Sec-tion 4) and our results show that it is real-time capable on a contemporary NAO(version 3.2 and above).
2 Preprocessing
Processing the image in its full resolution (YUV422 640×480) is computationallyexpensive and would not allow for real-time operation. Therefore, the effectiveresolution has to be reduced. The naıve approach would be to reduce the resolu-tion for the actual processing globally. This, however, does not account for theperspective projection of objects on the field plane: closer objects appear largerin the image. In order to rectify this effect the image is locally subsampled withdifferent resolutions.
2.1 Subsampling
The image is split into two areas: a) the field plane and b) the area above thisplane, for which a static subsampling is applied with a high horizontal and lowvertical resolution suitable for goal post detection. The basic idea for a) is toproject a homogeneous grid on the field plane into the image [11]. However,the exact projection of a grid is approximated by two means to increase theefficiency of the following segmentation process. First, the rotation about theimage axis is ignored because a humanoid robot operates mostly upright andtherefore the camera possesses a small rotation about that axis. This has beenverified experimentally, which showed that the average deviation while walkingand moving the head is only 1.15 degrees [6]. The second approximation limitsthe sampling points within a line to a fixed interval, i.e., the distance betweenthe sampling points is limited to a fixed number of pixels.
Both approximations decrease the complexity and therefore increase the ef-ficiency of the subsequent segmentation process. The resulting subsampling isreduced to rectangular blocks of homogeneous grids of sampling points, as shownin Figure 1. The computation of the grid is thus reduced to finding the coor-dinates of the borders of those blocks of different resolutions. Note that thecomputation of the subsampling requires the camera pose to be known; here itis computed based on sensor fusion of forward kinematics and the IMU (cf. [16]).First, the border between the upper and lower area is found by projecting a pointin the distance of the field diagonal into the image plane. This is motivated bythe fact that the farthest object to be recognized on the field plane has a dis-tance of the field diagonal. Second, the borders between the blocks of different
(a) (b)
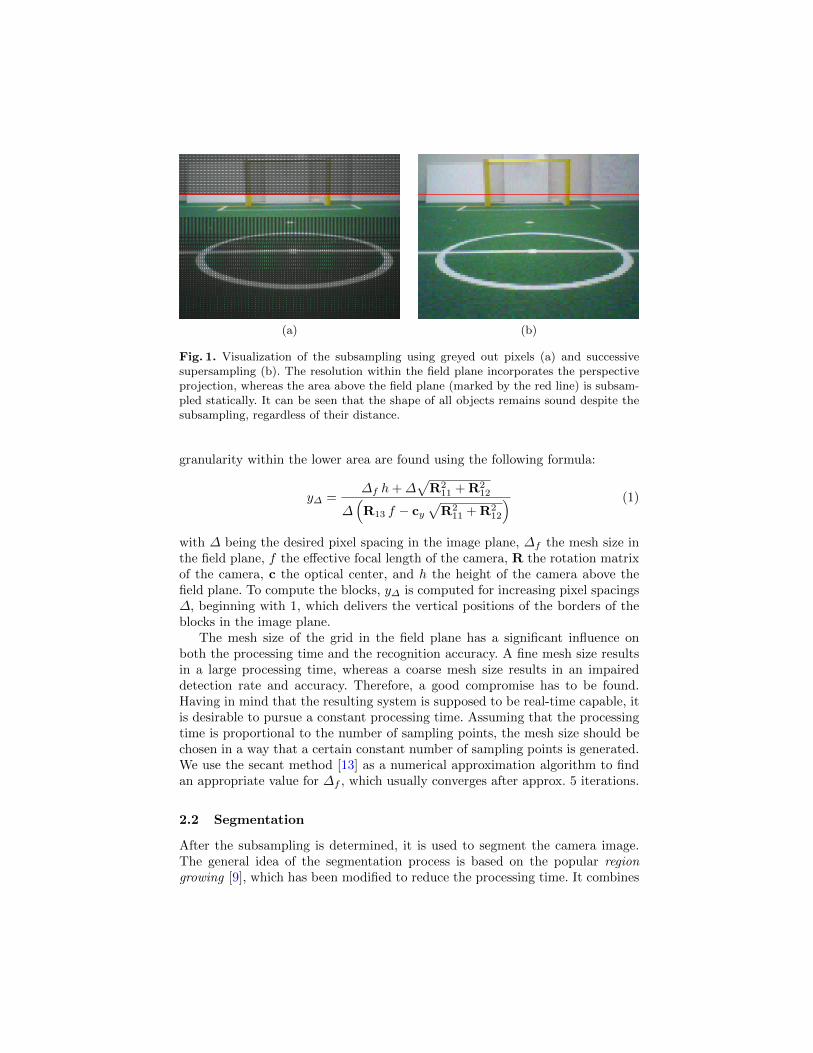
Fig. 1. Visualization of the subsampling using greyed out pixels (a) and successivesupersampling (b). The resolution within the field plane incorporates the perspectiveprojection, whereas the area above the field plane (marked by the red line) is subsam-pled statically. It can be seen that the shape of all objects remains sound despite thesubsampling, regardless of their distance.
granularity within the lower area are found using the following formula:
y∆ =∆f h+∆
√R2
11 + R212
∆(R13 f − cy
√R2
11 + R212
) (1)
with ∆ being the desired pixel spacing in the image plane, ∆f the mesh size inthe field plane, f the effective focal length of the camera, R the rotation matrixof the camera, c the optical center, and h the height of the camera above thefield plane. To compute the blocks, y∆ is computed for increasing pixel spacings∆, beginning with 1, which delivers the vertical positions of the borders of theblocks in the image plane.
The mesh size of the grid in the field plane has a significant influence onboth the processing time and the recognition accuracy. A fine mesh size resultsin a large processing time, whereas a coarse mesh size results in an impaireddetection rate and accuracy. Therefore, a good compromise has to be found.Having in mind that the resulting system is supposed to be real-time capable, itis desirable to pursue a constant processing time. Assuming that the processingtime is proportional to the number of sampling points, the mesh size should bechosen in a way that a certain constant number of sampling points is generated.We use the secant method [13] as a numerical approximation algorithm to findan appropriate value for ∆f , which usually converges after approx. 5 iterations.
2.2 Segmentation
After the subsampling is determined, it is used to segment the camera image.The general idea of the segmentation process is based on the popular regiongrowing [9], which has been modified to reduce the processing time. It combines

(a) (b)
Fig. 2. Original camera image (a) and the result of the preprocessing stage (b). Thesegmentation considers the previously determined subsampling.
the efficiency of run length encoding (as e.g. in [1]) with the robustness of regiongrowing. Therefore, the image is traversed linearly in a single pass, and regionscan only grow to the right. Also, regions are limited to single rows, so that theapproach can be seen as a dynamic programming implementation of region grow-ing. Henceforth, a region within a row is referred to as a segment. The similaritycriterion used is the comparison with the average color of the hitherto segment.A major advantage of the modified region growing is that the memory is onlytraversed once in a linear fashion, which significantly reduces random memoryaccesses and improves the caching efficiency and ultimately the processing time.
Color comparison is performed channel-wise: the absolute color difference ofeach channel is computed and compared to a predefined threshold, and the pixelis added to the segment if no threshold is exceeded, otherwise a new segmentis started. The major advantage of separate thresholds per channel in conjunc-tion with the YUV color space provided by NAO’s cameras is that a higherthreshold can be chosen for the brightness channel than for the color channels toimprove the illumination invariance. Also, the parameter space of the segmenta-tion process is reduced to three single values, compared to the high dimensionalconfiguration space of the common color-table-based approach.
The result of the segmentation process is shown in Figure 2. The amountof data is significantly reduced to an average of 1,250 segments compared to76,800 pixels (≈ 1.6%). Also, the amount of noise is significantly reduced, be-cause the region growing and the averaging acts as a kind of noise filter. Mostimportantly, all relevant objects (goal posts, lines, ball) have been clustered intosegments within each row. However, the approach has some disadvantages. Insome areas, especially around the ball, the object is split into multiple segmentsdue to the shadings of the object. Another disadvantage of this segmentation ap-proach is the inter-line inconsistency that arises from line-wise processing [17].We can observe this by looking at the goal posts (see Figure 2b). Their expectedtrapezoid-like shape is far from being perfect and include some awkward bends.However, both problems are treated explicitly in the corresponding object de-tectors.
(a) (b) (c)
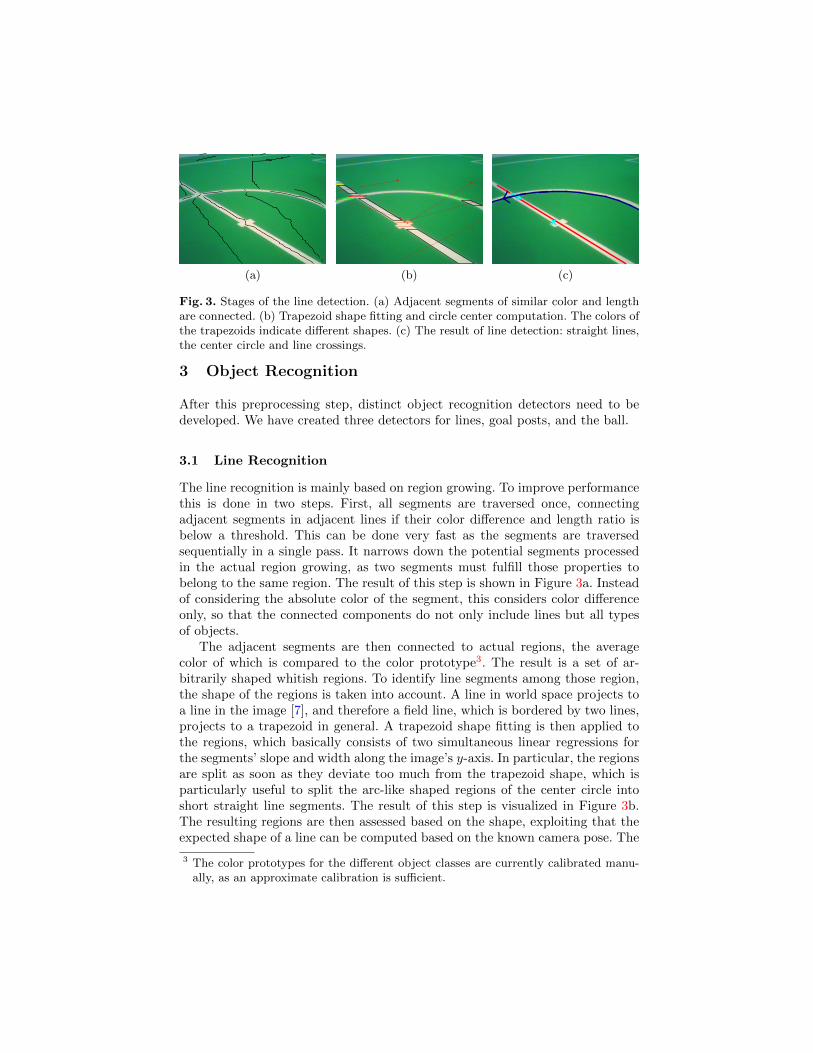
Fig. 3. Stages of the line detection. (a) Adjacent segments of similar color and lengthare connected. (b) Trapezoid shape fitting and circle center computation. The colors ofthe trapezoids indicate different shapes. (c) The result of line detection: straight lines,the center circle and line crossings.
3 Object Recognition
After this preprocessing step, distinct object recognition detectors need to bedeveloped. We have created three detectors for lines, goal posts, and the ball.
3.1 Line Recognition
The line recognition is mainly based on region growing. To improve performancethis is done in two steps. First, all segments are traversed once, connectingadjacent segments in adjacent lines if their color difference and length ratio isbelow a threshold. This can be done very fast as the segments are traversedsequentially in a single pass. It narrows down the potential segments processedin the actual region growing, as two segments must fulfill those properties tobelong to the same region. The result of this step is shown in Figure 3a. Insteadof considering the absolute color of the segment, this considers color differenceonly, so that the connected components do not only include lines but all typesof objects.
The adjacent segments are then connected to actual regions, the averagecolor of which is compared to the color prototype3. The result is a set of ar-bitrarily shaped whitish regions. To identify line segments among those region,the shape of the regions is taken into account. A line in world space projects toa line in the image [7], and therefore a field line, which is bordered by two lines,projects to a trapezoid in general. A trapezoid shape fitting is then applied tothe regions, which basically consists of two simultaneous linear regressions forthe segments’ slope and width along the image’s y-axis. In particular, the regionsare split as soon as they deviate too much from the trapezoid shape, which isparticularly useful to split the arc-like shaped regions of the center circle intoshort straight line segments. The result of this step is visualized in Figure 3b.The resulting regions are then assessed based on the shape, exploiting that theexpected shape of a line can be computed based on the known camera pose. The
3 The color prototypes for the different object classes are currently calibrated manu-ally, as an approximate calibration is sufficient.

(a) (b) (c)
Fig. 4. Goal detection. (a) Visualization of segment rating. (b) Layout of the Houghspace. (c) Resulting Hough responses and 5 highest local maxima (the colors of thelines indicate the order of the maxima).
different categories for the shapes are line segments, center circle segments andnon-line segments. This step reliably sorts out white segments in other robots,since they have a distinctive shape.
After potential line segments have been determined, a simple sanity checktests whether the segments next to the line segment are sufficiently green bycomparison with the corresponding color prototype. Then, the line segments areprojected onto the field plane for further processing under consideration of therolling shutter effect (cf. [15]). Collinear line segments are merged by cluster-ing in the Hesse normal form parameter space. Afterwards, the center circle isdetected. Therefore, line segments that potentially lie on the center circle aredetermined based on their length and shape. Assuming that those segments aretangential to the center circle, hypothetical center points are built by computingtwo points orthogonal to the segment in a distance of the known center circle ra-dius (see Figure 3b). Afterwards, those points are clustered, and if a sufficientlylarge cluster with at least three supporting segments is found, its centroid istreated as the center circle’s center point. Those segments are disregarded infurther processing. Finally, field line intersections are computed based on theline segments found, since they are valuable features for the self-localization.The result of the line detection including the center circle and intersections isvisualized in Figure 3c.
3.2 Goal Recognition
Due to the complex shape of the goal as a whole, goal detection is simplifiedto detecting the goal posts; the goal bar only serves as an indicator for thelaterality and as a sanity check. The general idea for detecting goal posts is acombination of Hough transformation [4] and region growing. This is relatedto histogram-based recognition, as presented in [19], extended to work with thesegments generated in the preprocessing step. The first step is to assign a ratingto the segments, i.e. the color difference (sum of channel-wise color differences)to the color prototype, as visualized in Figure 4a. This is implemented efficientlyexploiting the MMX instruction set extension available on NAO’s CPU.
The rated segments are accumulated in a one-dimensional Hough space. Theimage is split into bins (as a compromise of detection quality and processing time
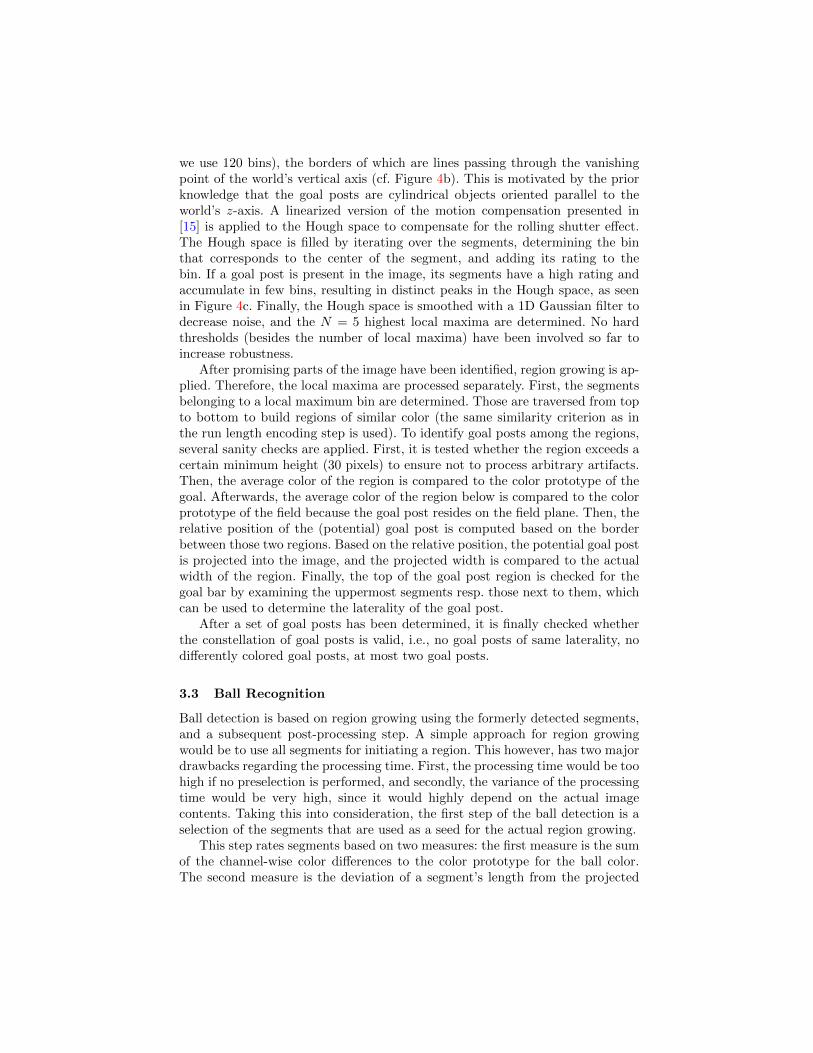
we use 120 bins), the borders of which are lines passing through the vanishingpoint of the world’s vertical axis (cf. Figure 4b). This is motivated by the priorknowledge that the goal posts are cylindrical objects oriented parallel to theworld’s z-axis. A linearized version of the motion compensation presented in[15] is applied to the Hough space to compensate for the rolling shutter effect.The Hough space is filled by iterating over the segments, determining the binthat corresponds to the center of the segment, and adding its rating to thebin. If a goal post is present in the image, its segments have a high rating andaccumulate in few bins, resulting in distinct peaks in the Hough space, as seenin Figure 4c. Finally, the Hough space is smoothed with a 1D Gaussian filter todecrease noise, and the N = 5 highest local maxima are determined. No hardthresholds (besides the number of local maxima) have been involved so far toincrease robustness.
After promising parts of the image have been identified, region growing is ap-plied. Therefore, the local maxima are processed separately. First, the segmentsbelonging to a local maximum bin are determined. Those are traversed from topto bottom to build regions of similar color (the same similarity criterion as inthe run length encoding step is used). To identify goal posts among the regions,several sanity checks are applied. First, it is tested whether the region exceeds acertain minimum height (30 pixels) to ensure not to process arbitrary artifacts.Then, the average color of the region is compared to the color prototype of thegoal. Afterwards, the average color of the region below is compared to the colorprototype of the field because the goal post resides on the field plane. Then, therelative position of the (potential) goal post is computed based on the borderbetween those two regions. Based on the relative position, the potential goal postis projected into the image, and the projected width is compared to the actualwidth of the region. Finally, the top of the goal post region is checked for thegoal bar by examining the uppermost segments resp. those next to them, whichcan be used to determine the laterality of the goal post.
After a set of goal posts has been determined, it is finally checked whetherthe constellation of goal posts is valid, i.e., no goal posts of same laterality, nodifferently colored goal posts, at most two goal posts.
3.3 Ball Recognition
Ball detection is based on region growing using the formerly detected segments,and a subsequent post-processing step. A simple approach for region growingwould be to use all segments for initiating a region. This however, has two majordrawbacks regarding the processing time. First, the processing time would be toohigh if no preselection is performed, and secondly, the variance of the processingtime would be very high, since it would highly depend on the actual imagecontents. Taking this into consideration, the first step of the ball detection is aselection of the segments that are used as a seed for the actual region growing.
This step rates segments based on two measures: the first measure is the sumof the channel-wise color differences to the color prototype for the ball color.The second measure is the deviation of a segment’s length from the projected

(a) (b)
Fig. 5. Preprocessing for ball detection. (a) Test scene including real SPL balls (markedwith arrows) along with other objects. (b) The resulting weighted segments. The twoactual balls get the highest rating.
diameter of the ball at that position. This way the center segment of the actualball (if it is in the image) should get the highest rating. This step does not invokeany hard thresholds, but sorts the segments by an objective measure. The resultof the step is visualized in Figure 5 using a complex test scene. It can be seenin Figure 5b that the highest rating is assigned to the actual RoboCup SPLballs. The other objects are downgraded because of the size and/or the color.The number of segments processed is bound to 1,500 beginning at the lowerboundary of the image to limit the maximum processing time and its variance.
The N = 5 best-rated segments are then used as a seed for region growing.The difficulties that arise from the shades and reflections on the ball motivatesthe use of an alternative color space for the segmentation that focuses on thecolor hue, similar to the HSV or HSL color space [20]. We decided against HSVbecause the conversion of YUV to HSV is quite expensive due to the use oftrigonometric functions resp. case distinction. Also, a lookup table is not wellsuited due to its space requirement of 16M entries, which makes cache missesvery likely. Therefore, a simpler approximation is used. The color model usedconsists of four (partly redundant) channels y′, s, cb′, cr′, which are defined asfollows:
y′ = y (2) s =√cb2 + cr2 (3)
cb′ =cb
s(4) cr′ =
cr
s(5)
The y′ channel is the same as the original y channel. s is comparable tothe saturation channel of HSV. cb′ and cr′ can be seen as normalized colorchannels, which together have similar properties as the hue channel of HSV.The advantage of this color space is twofold. Firstly, it allows for the effectiveuse of a lookup table, since the conversion function is now R2 → R3, yielding alookup table of 64K entries, which significantly benefits from caching. Secondly,the cyclic property of the hue [20] is avoided, simplifying the actual comparison.Also, the introduction of an additional color channel does not have a negativeinfluence on the processing time because of the implementation using MMX

Fig. 6. Different lighting conditions used for the evaluation.
instructions, where it makes no difference whether three or four channels areprocessed simultaneously.
Based on this color model, the region growing takes place. The segmentsabove and below are processed. To check whether a segment is added to theregion, the color difference of the segment’s color to the average color of theregion is computed and compared to thresholds for each channel. For the balldetection it is reasonable to choose a high threshold for the saturation andluminance considering the shading on and reflections of the ball, and a lowthreshold for the (normalized) color channels to exploit the uniform color of theball. Also, due to the known size of the ball, the region growing process can beterminated early if the bounding box of the region exceeds the projected sizeof the ball. This process is repeated for the N = 5 best segments found in thepreprocessing stage.
After some potential ball regions have been found, they are post-processed tofind the actual ball. First, the average color is compared to the color prototype.Then, the convex hull is determined. Based on the convex hull, a circle fitting isperformed to reduce the region found to a circle. We use the algebraic fit sinceit has a closed form solution and the results are neglectably worse compared tothe geometric fit in this scenario [3]. Due to the convex hull, the circle fittingalso handles partially visible balls properly. The RMS error of the data pointsin the circle fitting is used as a sanity check, since it indicates the “roundness”of the region. Based on the circle center found, the robot-relative position iscomputed by intersecting the viewing ray with the plane that is one ball radiusabove the field. Afterwards, the (hypothetical) ball is projected back into theimage, and the radius of the projection is compared to the radius found asanother sanity check. The first potential ball region that passes all sanity checksis finally selected as the ball.
4 Experiments & Results
The focus of the experiments conducted is twofold. On one hand, the perceptionrate and quality are of interest. On the other hand, since the processing powerof the NAO V3.2 is limited and the resulting system is supposed to be real-timecapable, the run time of the modules is examined in greater detail.
For the evaluation of the perception rate and quality, different log files werecreated and manually annotated, which allows for an automated evaluation. The

log files contain 190 frames on average, and were created while the default robotsoccer behavior was executed (approaching the ball and kicking). To simulatedifferent lighting conditions, three different scenarios were created, each of whichused different light sources, as seen in Figure 6. For comparison purposes thesame set of log files was evaluated with a well-established color-table-based visionsystem that was used by the SPL world champion 2009–2011 in all competitions[16]. For each scene a specialized color table was created which was evaluatedwith each log file to simulate changing lighting conditions. The new system useda single configuration for all scenes.
The results are summarized in table 1. The evaluation is split into three sec-tions: the newly developed system, the color-table-based system using matchingcolor tables (representing static illumination), and the color-table-based systemusing non-matching color tables4 (representing changing lighting conditions).The line detection rate refers to the coverage of lines rather than the line count.The performance of the new system is comparable to the color table system un-der static lighting conditions; the ball and goal rate is slightly better whereas theline detection has a lower detection rate but is more reliable5. The average errorof both systems is adequate and similar. Under changing illumination, however,the new system significantly outperforms the color-table-based system with re-gard to every percept type. The color-table-based system is basically unusablein this scenario except for the ball detection.
Besides the perception quality, the run time was evaluated as well. It wasmeasured when the robot was standing while the head control was active, whichensures representative diversity in the camera images that are processed. Again,the new system as well as the color-table-based system are evaluated. The resultsare shown in table 2. As expected, the run time of the new system is highercompared to the color-table-based system. However, the total run time of approx.6 ms is still comparably low and especially allows for real-time operation. Moreimportantly, the variance of the new system is significantly lower, despite the
4 Non-matching color tables refer to color tables that were created for a differentlighting situation than they are used in.
5 Note that the overall line detection rate is low because all lines, even those barelyperceivable for a human, were marked for reference.
Table 1. Detection rate and quality of the newly developed vision system compared toa color-table-based system. The right part of the table represents the color-table-basedsystem. The table shows the true positive rate (TP), the false positive rate (FP) andthe average error in image coordinates (err.).
matching non-matchingnew system color table color table
percept type TP FP err. TP FP err. TP FP err.
ball 86.4 % 0.3 % 1.538 px 77.1 % 0 % 1.292 px 68.1% 0.2 % 1.328 pxgoal post 84.3 % 0.5 % 2.18 px 81.1 % 0 % 1.377 px 7.7 % 6.4 % 2.223 px
lines 19 % 0.4 % 0.94 px 44.7 % 2.9 % 1.524 px 6 % 3.1 % 1.193 pxintersections 6.7 % 2.7 % 2.517 px 18.6 % 1 % 4.456 px 1.4 % 0 % 3.77 pxcenter circle 64.5 % 1.8 % 5.323 px 75 % 0.5 % 12.635 px 6 % 3.1 % 1.193 px
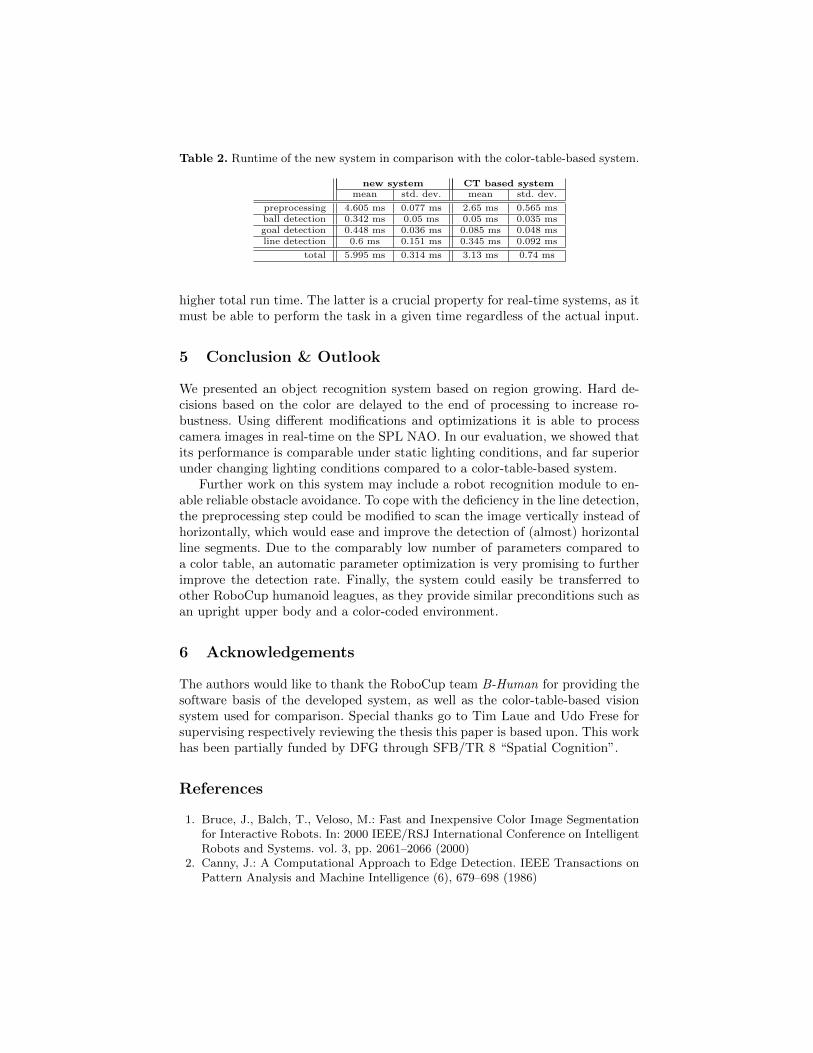
Table 2. Runtime of the new system in comparison with the color-table-based system.
new system CT based systemmean std. dev. mean std. dev.
preprocessing 4.605 ms 0.077 ms 2.65 ms 0.565 msball detection 0.342 ms 0.05 ms 0.05 ms 0.035 msgoal detection 0.448 ms 0.036 ms 0.085 ms 0.048 msline detection 0.6 ms 0.151 ms 0.345 ms 0.092 ms
total 5.995 ms 0.314 ms 3.13 ms 0.74 ms
higher total run time. The latter is a crucial property for real-time systems, as itmust be able to perform the task in a given time regardless of the actual input.
5 Conclusion & Outlook
We presented an object recognition system based on region growing. Hard de-cisions based on the color are delayed to the end of processing to increase ro-bustness. Using different modifications and optimizations it is able to processcamera images in real-time on the SPL NAO. In our evaluation, we showed thatits performance is comparable under static lighting conditions, and far superiorunder changing lighting conditions compared to a color-table-based system.
Further work on this system may include a robot recognition module to en-able reliable obstacle avoidance. To cope with the deficiency in the line detection,the preprocessing step could be modified to scan the image vertically instead ofhorizontally, which would ease and improve the detection of (almost) horizontalline segments. Due to the comparably low number of parameters compared toa color table, an automatic parameter optimization is very promising to furtherimprove the detection rate. Finally, the system could easily be transferred toother RoboCup humanoid leagues, as they provide similar preconditions such asan upright upper body and a color-coded environment.
6 Acknowledgements
The authors would like to thank the RoboCup team B-Human for providing thesoftware basis of the developed system, as well as the color-table-based visionsystem used for comparison. Special thanks go to Tim Laue and Udo Frese forsupervising respectively reviewing the thesis this paper is based upon. This workhas been partially funded by DFG through SFB/TR 8 “Spatial Cognition”.
References
1. Bruce, J., Balch, T., Veloso, M.: Fast and Inexpensive Color Image Segmentationfor Interactive Robots. In: 2000 IEEE/RSJ International Conference on IntelligentRobots and Systems. vol. 3, pp. 2061–2066 (2000)
2. Canny, J.: A Computational Approach to Edge Detection. IEEE Transactions onPattern Analysis and Machine Intelligence (6), 679–698 (1986)

3. Chernov, N., Lesort, C.: Least Squares Fitting of Circles. Journal of MathematicalImaging and Vision 23(3), 239–252 (2005)
4. Duda, R.O., Hart, P.E.: Use of the Hough Transformation To Detect Lines andCurves in Pictures. Communications of the ACM 15(1), 11–15 (1972)
5. Gevers, T., Smeulders, A.W.M.: Color-based object recognition. Pattern Recogni-tion 32(3), 453–464 (1999)
6. Hartl, A.: Robuste, echtzeitfahige Bildverarbeitung fur einen humanoiden Fußball-roboter. Master’s thesis, Universitat Bremen (2012)
7. Hartley, R., Zisserman, A.: Multiple View Geometry in Computer Vision. Cam-bridge University Press, 2nd edn. (2004)
8. Hojjatoleslami, S.A., Kittler, J.: Region Growing: A New Approach. IEEE Trans-actions on Image Processing 7(7), 1079–1084 (1998)
9. Jahne, B.: Digital Image Processing. Springer, 6th edn. (2005)10. Jain, R.C., Kasturi, R., Schunck, B.G.: Machine vision. McGraw-Hill (1995)11. Jamzad, M., Sadjad, B.S., Mirrokni, V.S., Kazemi, M., Chitsaz, H., Heydarnoori,
A., Hajiaghai, M.T., Chiniforooshan, E.: A Fast Vision System for Middle SizeRobots in RoboCup. In: Birk, A., Coradeschi, S., Tadokoro, S. (eds.) RoboCup2001: Robot Soccer World Cup V, Lecture Notes in Computer Science, vol. 2377,pp. 71–80. Springer Berlin Heidelberg (2002)
12. Otsu, N.: A Threshold Selection Method from Gray-Level Histograms. IEEE Trans-actions on Systems, Man, and Cybernetics 9(1), 62–66 (1979)
13. Press, W., Teukolsky, S., Flannery, B., Vetterling, W.: Numerical Recipes in C:The Art of Scientific Computing. Cambridge University Press (1992)
14. Reinhardt, T.: Kalibrierungsfreie Bildverarbeitungsalgorithmen zur echtzeitfahigenObjekterkennung im Roboterfußball. Master’s thesis, Hochschule fur Technik,Wirtschaft und Kultur Leipzig (2011)
15. Rofer, T.: Region-Based Segmentation with Ambiguous Color Classes and 2-DMotion Compensation. In: Visser, U., Ribeiro, F., Ohashi, T., Dellaert, F. (eds.)RoboCup 2007: Robot Soccer World Cup XI, Lecture Notes in Computer Science,vol. 5001, pp. 369–376. Springer Berlin Heidelberg (2008)
16. Rofer, T., Laue, T., Muller, J., Fabisch, A., Feldpausch, F., Gillmann, K., Graf,C., de Haas, T.J., Hartl, A., Humann, A., Honsel, D., Kastner, P., Kastner, T.,Konemann, C., Markowsky, B., Riemann, O.J.L., Wenk, F.: B-Human Team Re-port and Code Release 2011. Available online (2011), http://www.b-human.de/
downloads/bhuman11_coderelease.pdf17. Scharstein, D., Szeliski, R.: A Taxonomy and Evaluation of Dense Two-Frame
Stereo Correspondence Algorithms. International Journal of Computer Vision47(1–3), 7–42 (2002)
18. Swain, M.J., Ballard, D.H.: Color Indexing. International Journal of ComputerVision 7(1), 11–32 (1991)
19. Volioti, S., Lagoudakis, M.G.: Histogram-Based Visual Object Recognition for the2007 Four-Legged RoboCup League. In: Darzentas, J., Vouros, G.A., Vosinakis, S.,Arnellos, A. (eds.) Artificial Intelligence: Theories, Models and Applications, Lec-ture Notes in Computer Science, vol. 5138, pp. 313–326. Springer Berlin Heidelberg(2008)
20. Zhang, C., Wang, P.: A New Method of Color Image Segmentation Based on Inten-sity and Hue Clustering. In: 15th International Conference on Pattern Recognition.vol. 3, pp. 613–616 (2000)
21. Zucker, S.W.: Region Growing: Childhood and Adolescence. Computer Graphicsand Image Processing 5(3), 382–399 (1976)