Robots, O shoring and Welfare
38
Robots, Offshoring and Welfare * Alessandra Bonfiglioli † Rosario Crin ` o ‡ Gino Gancia § Ioannis Papadakis ¶ March 2021 Abstract We study the effect of industrial robots in the presence of offshoring. A simple model shows that if robots displace foreign-sourced tasks, automation is necessarily welfare- improving for the domestic economy. If instead robots displace domestically-produced tasks, automation can lower domestic welfare through a deterioration of the terms of trade, even when beneficial in autarky. These results underscore the importance of identifying which workers are in more direct competition with automation. Using data on imports of industrial robots and exploiting variation across industries, occu- pations and local labor markets, we find that automation displaces US workers, but that its effect is weaker in commuting zones that are more exposed to offshoring. In- dustrial robots also lower the incidence of offshoring and their negative employment effects are concentrated in non-offshorable occupations. These results are consistent with the view that automation contributes to the reshoring of economic activity, which in turn tends to mitigate any adverse labor market effects for US workers. JEL Classification: J23, J24, O33, D22 Keywords: Automation, Displacement, Offshoring, Robots * We thank Pascual Restrepo for useful comments. The usual disclaimer applies. † Queen Mary University of London and CEPR, Mile End Road, London E1 4NS, UK. E-mail: a.bonfi[email protected] ‡ Universit` a Cattolica del Sacro Cuore, Department of Economics and Finance, CEPR and CESifo. Via Necchi 5, 20123, Milan, Italy. E-mail: [email protected] § Queen Mary University of London and CEPR. Mile End Road, London E1 4NS, UK. E-mail: [email protected] ¶ Queen Mary University of London. Mile End Road, London E1 4NS, UK. E-mail: [email protected]
Transcript of Robots, O shoring and Welfare
Robots, Offshoring and Welfare*
Alessandra Bonfiglioli† Rosario Crino‡ Gino Gancia§
Ioannis Papadakis¶
March 2021
Abstract
We study the effect of industrial robots in the presence of offshoring. A simple model
shows that if robots displace foreign-sourced tasks, automation is necessarily welfare-
improving for the domestic economy. If instead robots displace domestically-produced
tasks, automation can lower domestic welfare through a deterioration of the terms of
trade, even when beneficial in autarky. These results underscore the importance of
identifying which workers are in more direct competition with automation. Using
data on imports of industrial robots and exploiting variation across industries, occu-
pations and local labor markets, we find that automation displaces US workers, but
that its effect is weaker in commuting zones that are more exposed to offshoring. In-
dustrial robots also lower the incidence of offshoring and their negative employment
effects are concentrated in non-offshorable occupations. These results are consistent
with the view that automation contributes to the reshoring of economic activity, which
in turn tends to mitigate any adverse labor market effects for US workers.
JEL Classification: J23, J24, O33, D22
Keywords: Automation, Displacement, Offshoring, Robots
*We thank Pascual Restrepo for useful comments. The usual disclaimer applies.†Queen Mary University of London and CEPR, Mile End Road, London E1 4NS, UK. E-mail:[email protected]‡Universita Cattolica del Sacro Cuore, Department of Economics and Finance, CEPR and CESifo. ViaNecchi 5, 20123, Milan, Italy. E-mail: [email protected]§Queen Mary University of London and CEPR. Mile End Road, London E1 4NS, UK. E-mail:[email protected]¶Queen Mary University of London. Mile End Road, London E1 4NS, UK. E-mail:[email protected]

1 Introduction
The nature and the organization of production is undergoing a radical transformation.
Advances in robotics technologies have led to the widespread use of automation in tasks
previously performed by workers. At the same time, improvements in communication
technologies have led companies to offshore stages of production to low-wage countries.
These two phenomena are having a profound effect on advanced economies. Although
they are believed to bring about higher productivity and lower costs, they are also often
blamed for the decline in manufacturing employment and stagnation of real wages (see,
for instance, Baldwin, 2019). More recently, a new hypothesis is gaining attention: that
automation, which is much more prevalent in advanced economies, can increase compet-
itiveness and bring back jobs that had been previously relocated to low-wage countries.
Examples of this process of “reshoring” have started to populate the business literature.
Yet, its scope, causes and consequences are still largely unknown.
In this paper, we study the interaction between automation and offshoring, from the
perspective of advanced countries. From a theoretical viewpoint, we show that offshoring
can change the welfare effects of automation. In particular, if robots replace foreign-
sourced tasks, automation is always beneficial for domestic workers. However, if robots
replace domestically-produced tasks, automation can be welfare-reducing for workers in
the adopting country, even if it would have been welfare-improving in autarky. These re-
sults underscore the importance of identifying which workers are competing with robots
more directly. We therefore turn to US data across industries, occupations and local labor
markets to validate the predictions of the model and assess which scenario is empirically
more plausible.1
To illustrate our theoretical result, we start from a simple task-based model of produc-
tion that incorporates the standard effects of automation. In autarky, substituting labor
with cheaper robots has a productivity effect, a capital deepening effect and a displace-
ment effect. While the first two effects raise welfare, the latter one tends to lower real
wages. But the negative effect is always dominated if the supply of capital is sufficiently
elastic. In the presence of offshoring, however, there is a new terms-of-trade effect that re-
distributes income across countries: automation lowers the relative wage of the workers
that are displaced by robots the most. If automation substitutes foreign labor, domestic
1We define automation as the replacement of human labor with robots. Robots are programmable ma-
chines that have the capability to move on at least three axes. Unlike other pieces of equipment, robots are
designed to replicate human actions.
1
workers do not suffer any displacement, while they benefit from a higher productivity,
capital deepening and cheaper foreign inputs. In this case, automation triggers reshoring
and raises domestic welfare. However, if domestic workers are substituted by robots, they
are harmed both by the displacement effect and by the increase in the cost of foreign in-
puts. In this case, automation can lower domestic welfare even if the higher productivity
and capital deepening would compensate the displacement effect in autarky.
The model also illustrates that whether automation replaces domestic or foreign work-
ers may depend not only on exogenous characteristics of the tasks they perform, but also
on economic incentives, which depend on the wage gap between countries. This opens the
possibility that, since offshoring increases foreign wages, the direction of automation may
switch endogenously from domestically-produced to foreign-sourced tasks. Finally, from
a normative perspective, the model implies that, since automation targeted at offshored
tasks redistributes income from the foreign to the domestic country, policy makers may
have an incentive to distort the use of robots strategically.
In the second part of the paper, we move to the empirical analysis. Recent anecdotal ev-
idence suggests that advanced countries across the world have started shifting away from
foreign inputs. For instance, Walmart (2016), the biggest retailer in the world, launched
the “Jobs in U.S. Manufacturing Portal” website as part of a broader “Investing in Ameri-
can Jobs” initiative which aims to bring manufacturing jobs back to the US. The COVID-19
pandemic has accelerated this trend by fostering automation and inducing governments
to aim at increasing self-sufficiency in strategic sectors. However, systematic on reshoring
evidence is scant.
Motivated by our model, we study the effect of industrial automation between 1990
and 2015 on US local labor markets, and how it relates to offshoring. To measure automa-
tion and offshoring, we use high-quality trade data on US imports of industrial robots and
intermediate inputs, respectively, and assign them to industries using detailed Import
Matrices. We then project these measures across 722 US commuting zones based on the
industry composition of employment. We further instrument the change in US imports of
industrial robots with similar changes observed in eleven European countries. With this
data, we find that robot imports lower manufacturing employment. Since manufacturing
is the sector where automation is concentrated, this evidence suggests that, on average,
robots displace US workers. However, we also find positive effects on wages, though not
always significant, consistent with the hypothesis that robots improve labor productivity.
Next, we ask how these effects depend on offshoring. To this end, we first show that oc-
cupations at risk of automation, denoted for short as “replaceable”, and those classified as
2

“offshorable” tend to have a relatively similar task content.2 This suggests that automation
and offshoring might indeed be substitutes, in that they may affect similar occupations.
Consistent with this evidence, we find that robot imports tend to lower offshoring, both at
the industry and at the commuting zone level. Building on these results, we further un-
pack the negative employment effect of robot imports across different occupations. This
exercise reveals that the employment losses are especially concentrated in occupations
performing non-offshorable and replaceable tasks. Finally, we look for heterogeneous ef-
fects across commuting zones specialized in industries with a different prevalence of off-
shoring. This exercise reveals that commuting zones that are more exposed to offshoring
experience a relatively smaller negative effect on manufacturing employment as a conse-
quence of automation. Overall, this evidence suggests that robot imports are associated
with reshoring, which is however not enough to fully compensate for the negative dis-
placement effect on manufacturing employment.
This paper makes several contributions to the literature. First, from a theoretical per-
spective, it shows that the welfare effects of automation may be very different in the pres-
ence of offshoring. To do so, it combines models of automation (such as Zeira, 1998, Ace-
moglu and Restrepo, 2019, Hemous and Olsen, 2020) with models of offshoring (such as
Grossman and Rossi-Hansberg, 2008, Rodriguez-Clare, 2010, Acemoglu, Gancia and Zili-
botti, 2015). The literature has shown that both phenomena can have ambiguous welfare
effects due to the tension between a productivity effect, which tends to benefit everybody,
and a displacement effect, which tends to have adverse effects on workers that compete
with robots or imports. However, this paper highlights two important differences be-
tween automation and offshoring: first, they may affect different workers; and, second,
unlike foreign labor, robots can be reproduced. The combination of these two features
generates the terms-of-trade effect that can change the welfare effect of automation. Ar-
tuc, Bastos and Rijkers (2018) and Krenz, Prettner and Strulik (2018) also develop models
of automation and offshoring, but assume that robots can replace domestic labor only.
Second, the paper contributes to the empirical literature on the identification of au-
tomation. Earlier papers use data from the International Federation of Robotics, which
are however available for 19 manufacturing industries only. Recognizing the high con-
2To measure replaceability, we use the classification of occupations developed by Graetz and Michaels
(2018). To measure offshorability, we use the index employed by Autor and Dorn (2013). The two indexes
capture different dimensions. For instance, replaceable occupations tend to perform manual and repetitive
works, while offshorable occupations do not require face-to-face interaction and physical presence on the
job.
3
centration of this very specialized sector, in which Japan and Germany alone account for
50 percent of global revenues, some recent papers have turned to robot imports as a mea-
sure of automation. These include Acemoglu and Restrepo (2020) and Blanas, Gancia and
Lee (2019), which use cross-country data; Acemoglu, Lelarge and Restrepo (2020) and
Bonfiglioli et al. (2020), which use firm-level data for France; and Humlum (2019), which
uses firm-level data for Denmark. In this paper, we show how to combine data on robot
imports together with Import Matrices to obtain an indicator of industrial automation that
varies across time and 66 industries. Following the literature on the measurement of off-
shoring started by Feenstra and Hanson (1999), we also construct time-varying offshoring
indicators at the industry level using the information on imported intermediate inputs
contained in the Import Matrices.
Third, in terms of empirical results, this paper confirms the negative effect of indus-
trial robots on manufacturing employment often found in the literature (see, for instance,
Acemoglu and Restrepo, 2020, Blanas, Gancia and Lee, 2019), but it also shows this effect
to be weaker in occupations and commuting zones that are more exposed to offshoring,
and hence where reshoring is more likely. We obtain these findings following the shift-
share approach across US local labor markets first applied to study the effect of Chinese
import competition by Autor, Dorn and Hanson (2013) and automation by Acemoglu and
Restrepo (2020). To unpack the effects across occupations, we use the classifications of re-
placeable tasks in Graetz and Michaels (2018) and of offshorable tasks in Autor and Dorn
(2013). Our results are also related to Aghion et al. (2019). Using firm-level data from
France, they find that machines have a positive effect on employment in sectors that face
international competition.
Finally, the paper is related to the nascent literature on reshoring. The empirical evi-
dence on this recent phenomenon is still inconclusive. For instance, Krenz, Prettner and
Strulik (2018) and Carbonero, Ernst and Weber (2018) find evidence of robot-induced
reshoring in a panel of countries and industries. Similarly, Faber (2020), Artuc, Christi-
aensen and Winkler (2019), Stemmler (2019), and Kugler et al. (2020) find evidence of
reshoring in Mexico, Brazil and Colombia. On the other hand, Hallward-Driemeier and
Nayyar (2019) and De Backer et al. (2016) argue that reshoring affects only a tiny minority
of countries and industries, while Stapleton and Webb (2020) show that robots had a pos-
itive impact on imports and multinational activities of Spanish firms. Differently from us,
these papers are mostly concerned with the impact of reshoring on developing countries,
and none of them focuses on the US.
The remainder of the paper is organized as follows. In Section 2, we build a simple
4

model to illustrate the welfare effects of automation in the presence of offshoring. In
Section 3, we construct the main variables used in the empirical analysis and illustrates the
main patterns in the data. In Section 4, we present the results of the econometric analysis.
Exploiting variation across occupations, industries and space, we study the relationship
between automation and offshoring, and how the effect of automation on labor market
outcomes depends on offshoring. Section 5 concludes.
2 A Simple Model of Industrial Robots and Offshoring
In this section, we build a simple two-country general-equilibrium model to illustrate
the welfare effects of automation and offshoring.3 The main lesson is that the effects of
automation on real wages can be very different depending on whether robots displace
tasks that are performed domestically or abroad. The theory will also suggest a simple
way to identify this displacement effect in the data. Since the goal is to derive qualitative
results that will guide the empirical analysis, the model is deliberately kept as simple as
possible.
2.1 The Basic Set-Up
The world economy comprises two countries, North and South, populated by Ln and Lsunits of workers, respectively. There is a single final good, which is the numeraire and
is freely traded. Production requires a set of tasks, which can be performed by workers
or robots. Robots differ from workers in that they are in perfectly elastic supply and can
only perform a subset of the existing tasks. Workers in the two countries also differ in
their technological capabilities in that labor in South can only be employed in a subset of
the tasks that North can perform. The production of tasks can be separated geographically
at no costs. In this model, automation is the replacement of any worker with robots and
offshoring is the replacement of a worker in North with one in South.
Production of the final good Y requires a measure one of tasks, which are aggregated
according to a Cobb-Douglas function:
lnY =∫ 1
0lnxi di, (1)
where xi is the output of task i. We denote with pi the cost of this task. Then, the demand3The model builds on earlier formalizations of automation, such as Zeira (1998), Acemoglu and Restrepo
(2019) and Hemous and Olsen (2020); and offshoring, such as Grossman and Rossi-Hansberg (2008),
Rodriguez-Clare (2010) and Acemoglu, Gancia and Zilibotti (2015).
5
for each task satisfies:
pixi = Y . (2)
With a symmetric Cobb-Douglas production function, each task gets the same share of
expenditure.
Tasks can be performed by workers in North, with productivity an and wage wn, work-
ers in South, with productivity as and wage ws, or robots, with a unit cost r (in terms of the
numeraire Y ) and productivity ar . We assume r < ar , which guarantees that some robots
will always be used in equilibrium. Workers in North can potentially perform any task
i ∈ [0,1] . Workers in South, instead, can only perform a measure λ < 1 of tasks, and we
refer to these tasks as “offshorable”. Finally, robots can only perform a measure κ < 1 of
tasks, and we refer to these tasks as “replaceable”. Some tasks can be both offshorable
and replaceable. Accordingly, we define ξ as the probability that a replaceable task is also
offshorable.
We denote withmn,ms andmr the measure of tasks performed in equilibrium by work-
ers in North, South and by robots, respectively, and assume for simplicity that workers in
different locations and robots cannot be combined to produce the same task. This implies
that ms +mn +mr = 1. Then, the cost of performing task i is:
pi =
pn = wn
an, if performed in North
ps = wsas, if performed in South
pr = rar, if performed by robots.
(3)
Imposing symmetry across tasks and labor-market clearing allows us to compute the
quantity of each task produced by workers:
xi =
xn = anLnmn
if performed in North
xs = asLsms
if performed in South.(4)
If task i is instead performed by robots, we can combine pr = r/ar with prxr = Y to solve
for its quantity:
xr =Y arr. (5)
Using the quantities (4)-(5) into (1), we can solve for aggregate production as:
Y =(asLsms
) ms1−mr
(anLnmn
) mn1−mr (ar
r
) mr1−mr
. (6)
Next, using prices (3) and quantities (4) into the demand function (2), we obtain wages:
wn =mnLnY , (7)
6
with an analogous expression for ws. Intuitively, the wage is increasing in the demand for
labor, which is proportional to the measure of tasks performed and total production, and
decreasing in the supply of labor.
Finally, we need to solve for ms, mn, and mr . To this end, note that if ps < pn, then
offshorable tasks are cheaper in South and hence will never be produced in North. This
will be the case if wages per efficiency unit of labor in South are lower than in North, i.e.,
wsan < wnas. In turn, this requires the technological capabilities of South, as measured by
λ, to be sufficiently low. A sufficient condition is
λ1−λ−κ(1− ξ)
<asan
LsLn
and we assume it to be always satisfied. Next, we want to focus on equilibria in which
robots are utilized. For that to be the case, automated tasks must be cheaper than those
performed by workers in North, pr < pn. In turn, this requires the cost of robots, r, to be
sufficiently low, namely, ran < wnar . Under these conditions, workers in North perform
the set of tasks that are neither replaceable nor offshorable:
mn = (1−λ)−κ(1− ξ).
Finally, note that robots will also be used in offshorable tasks if pr < ps, which is equivalent
to ras < wsar . In this case, workers in South perform the set of tasks that are offshorable
but not replaceable:
ms = λ−κξ.
If instead pr > ps, then workers in South are cheaper than robots, which implies that they
perform all offshorable tasks, ms = λ.
2.2 Robots, Offshoring and Real Wages
We are now in the position to study the effect of robots on real wages which, in this model,
coincide with welfare and also capture the demand for labor. We focus mostly on North,
although it is straightforward to derive the results for South. Using (7), (4) and (6) yields:
wn = an
(asan
wnws
) ms1−mr (ar
r
) mr1−mr
(8)
withwnws
=Lsms
mnLn. (9)
7

Equation (8) says that workers in North benefit from their own productivity, an, but also
from cheap labor in South, asanwnws> 1, and cheap robots, arr > 1. Equation (9), in turn, shows
that the North-South wage gap, which we also refer to as the terms of trade, depends on
the division of tasks between the two countries. These equations depend on the endoge-
nous variables mn, ms and mr , but are general in that they also apply to other models of
offshoring and automation.4 To better understand the effects of robots and offshoring, and
how they interact, we start by considering them in isolation.
2.2.1 Offshoring Only
Suppose first that there is no automation, i.e., κ = 0. Then:
wn = an
(asan
wnws
)λ= an
(1−λλ
asLsanLn
)λ.
Offshoring, i.e., an increase in λ, has two effects. First, as long as aswn > anws, production
costs are lower in South and hence relocating tasks there lowers prices, which benefits
all workers. Second, offshoring shifts the demand for labor in favor of workers in South,
thereby lowering wn/ws. This lowers the terms of trade for workers in North and tends to
hurt them. Overall, the efficiency effect dominates for low values of λ, when the wage gap
is large, but it vanishes for high values of λ, as the wage gap disappears for sufficiently
high levels of offshoring. As a result, wn is an inverted-U function of λ.
2.2.2 Automation Only
Consider now the case with no offshoring, i.e., λ = 0 and ξ = 0. Then:
wn =mnLnY = an
(arr
) κ1−κ. (10)
Equation (10) shows that real wages are always increasing in automation, κ. There are
three effects at work here. First, as long as ar > r, robots raise productivity. Second, as the
measure of tasks performed by workers in North falls, there is also a displacement effect.
However, the latter is offset by capital deepening: the supply of robots increases so as to
keep their price, r, constant. As a result, differently from offshoring, workers do not suffer
4For instance, they would still apply in a model where automation and offshoring opportuinities are en-
dogenous, along the lines of Acemoglu, Gancia and Zilibotti (2015) or as in the task-based approach of
Grossman and Rossi-Hansberg (2008) or Acemoglu and Restrepo (2018).
8

any deterioration of their terms of trade from robots.5
2.2.3 Automation and Offshoring
We now study the effect of automation in the presence of offshoring. There are two cases to
consider, depending on the relative wage in South. If wages in South are sufficiently low,
then offshoring is cheaper than using robots. We call this the “large wage gap” case. But if
wages in South are high enough, then offshorable tasks become at risk of automation. We
call this the “small wage gap” case.
Large wage gap: pn > pr > ps. In this case, robots replace North workers only. Without
loss of generality, we can then set ξ = 0. Imposing mn = 1−λ− κ, ms = λ and mr = κ into
(8) and (9) yields:
wn = an
( asan wnws)λ (ar
r
)κ1
1−κ
withwnws
=1−λ−κ
λLsLn.
Compared to the case without offshoring, there are two differences. First, the productiv-
ity effect of robots is stronger, because they replace workers in North that are now more
expensive: asanwnws> 1. As a result of this, robots can raise real wages in North even if they
would not be used in autarky (ar < r). On the other hand, however, automation lowers
the relative demand for North workers and hence increase the relative wage of workers in
South, which are not competing with robots. Hence, workers in North now suffer a nega-
tive terms-of-trade effect. Because of the latter, robots can now lower real wages in North,
even if they would have increased real wages in autarky (ar > r). This is more likely when
r and ws are high, because in this case the productivity gains are small and the negative
terms-of-trade effect may dominate.
Small wage gap: pn > ps > pr . In this case, robots substitute workers in both countries.
Imposing mn = (1−λ)−κ(1− ξ), ms = λ−κξ and mr = κ into (8) and (9) yields:
wn = an
(asan
wnws
)λ−κξ1−κ (ar
r
) κ1−κ
5This result would change if the supply of robots were not perfectly elastic. In this case, r would also
increase with κ.
9

withwnws
=1−λ−κ(1− ξ)
λ−κξLsLn.
The novelty is that the effect of robots on the terms of trade depends on ξ. If ξ > λ, robots
displace workers in South more than proportionally and hence improve the terms of trade
of North. In this case, wn necessarily increases with κ. If ξ < λ, robots lower the terms of
trade of North. In this case, the effects are qualitatively similar to the large wage gap case
discussed above, and they become identical if ξ→ 0.
We now briefly discuss some of the main implications of these results. The first les-
son is that robots replacing North workers may hurt them by increasing the relative wage
in South. Hence, in a world of global value chains, it is important to understand who is
competing with robots. In turn, this may depend both on the technological characteristics
of the tasks they perform, and on the level of offshoring. The reason is that offshoring
increases the relative wage in South, which makes automation of offshored tasks more
profitable. More in general, the model suggests that both a decline in the cost of robots
and technological catch-up in South can trigger a switch in automation from domestically
sourced tasks only to offshored tasks too. These results also have important policy im-
plications. In particular, since automation is likely to have terms-of-trade effects, which
redistribute income between countries, policy makers may have an incentive to distort the
use of robots strategically.
2.3 Extension: Two-Sector Model
Both automation and offshoring are more prevalent in the manufacturing sector. We now
show how the displacement effect can be identified from the allocation of labor between
sectors that are differentially exposed to automation. To this end, assume now that final
output is produced combining manufacturing goods, X, and services, Z, as follows:
Y = XαZ1−α.
Labor is mobile betweenX and Z. As before, manufacturing workers in North earn a share
of sector revenue, αY , equal to the fraction of tasks they perform, mxn:
wnLxn =mxnαY ,
where Lxn is employment in manufacturing in North. The service sector is symmetric,
hence wnLzn = mzn(1 − α)Y . Combining these expressions yields the allocation of labor
10

in North:LxnLzn
=α
1−αmxnmzn
. (11)
Equation (11) shows that this allocation depends exclusively on the tasks performed by
domestic workers in the two sectors. The intuition is that the productivity effect affects
both sectors equally and hence the allocation of labor only depends on the displacement
effect. For our purposes, equation (11) also implies that the effect of automation on the
tasks performed by workers in North can be read from changes in employment across
sectors. In the remainder of the paper, we build on this result to identify the displacement
effect of industrial robots and test how it varies with offshoring. Given that industrial
robots are used almost exclusively in manufacturing, their adoption should have no direct
effect on mzn. Hence, if we find that an exogenous shock to automation shifts workers
away from manufacturing, in must be that mxn is falling. Moreover, we will compare how
the displacement effect differs across local labor markets and occupations depending on
their exposure to offshoring. If we find a weaker or no displacement effect in areas or
occupations where offshoring is more prevalent, it will be evidence consistent with the
automation of foreign-sourced tasks.
3 Data and Stylized Facts
This section explains how we construct the main variables used in the empirical analysis
and illustrates the main patterns in the data.
3.1 Data and Variables
Our empirical analysis relates automation, offshoring and labor market outcomes (em-
ployment and wages) across US local labor markets. Following Autor and Dorn (2013),
Autor, Dorn and Hanson (2013) and Acemoglu and Restrepo (2019), among others, we
identify local labor markets using the concept of commuting zone (CZ) introduced by
Tolbert and Sizer (1996). CZs are defined as clusters of counties characterized by strong
commuting ties within them and weak commuting ties among them. Our sample includes
722 CZs covering the entire mainland United States.
Labor Market Outcomes. For each CZ, we measure employment and wages, both on ag-
gregate and for different sectors (manufacturing and non manufacturing) or skill groups
of workers (college and non-college educated), using micro-level data from two sources:
11

the decennial Censuses, for the years 1990 and 2000; and the American Community Sur-
vey (ACS), for the years 2005, 2010 and 2015. Both data sources are extracted from IPUMS
(Ruggles et al., 2020).6
Following Autor and Dorn (2013), we restrict the sample to working-age individuals
(aged 16 to 64) who are not unpaid family workers, do not reside in institutional group
quarters, and have reported being employed over the previous year. We construct CZ-
level employment using sample weights. To construct wages, we further exclude individ-
uals who are self-employed or farm workers, lack information on working hours, weeks or
wages, and report working less than 40 weeks per year and 35 hours per week. We com-
pute average wages as annual wages and salary income divided by total hours worked.
Wages are expressed at constant 2005 prices using the Personal Consumption Expendi-
ture Index. We also construct CZ-level population figures using data from the Censuses
and the ACS. In the regressions, we use ten-year equivalent changes of employment-to-
population ratios and log average wages, computed as 10 times the annualized change in
each variable over a given period (1990-2000, 2000-2005, 2005-2010 and 2010-2015).
Robot Exposure. To construct our proxy for automation at the CZ level, we use high-
quality data on US imports of industrial robots, and project these imports across local
labor markets using information on the industrial structure of employment in each CZ.
We start by extracting the value of robot imports from detailed product-level import data
collected by the US Customs (Schott, 2008) and available for the 1989-2018 period. Robot
imports are classified into specific 10-digit product codes of the Harmonized Tariff Sched-
ule classification.7 We apportion the overall value of US robot imports to 66 industries (de-
fined according to the classification of the Bureau of Economic Analysis, henceforth BEA
industries) using information on the cross-industry distribution of machinery (including
6The Censuses and the ACS are five and one percent samples, respectively, of the US population, and are
representative at the level of micro-regions known as Public Use Microdata Areas (PUMAs). We map
PUMAs to CZs using a crosswalk developed by Autor and Dorn (2013). We have also experimented with
an extended sample including ACS data for the year 2020. In this case, because the automation data
illustrated below are available up to the year 2018, we have used data for 2018 to construct automation
variables referring to the year 2020. Our main results hold also in this extended sample (available upon
request).7In particular, imports of industrial robots for multiple uses, lifting, handling, loading or unloading and
industrial robot parts are classified in the following HTS codes: 8479899540, 8479500000, 8428900100,
8428908015, 8428900120, 8428900220, 8479909740 and 8479909540.
12

robot) imports in each year extracted from the US Import Matrices.8 Finally, we appor-
tion the industry-level robot imports to individual CZs based on the industrial structure
of employment in each CZ. In particular, our final measure of CZ-level robot exposure is
constructed as follows:
Rob Expct =∑j
λcjt ·∆ lnRob Mjt, (12)
where c denotes CZs; ∆ lnRob Mjt is the ten-year equivalent log change in US robot im-
ports in industry j over period t; and λcjt is share of industry j in total employment of CZ
c at the beginning of period t.9
Variation in Rob Expct across CZs could be driven by CZ-specific factors that also in-
fluence labor market outcomes. For instance, positive demand shocks may induce firms
to automate, and simultaneously increase employment and wages. Similarly, firms may
adopt robots to raise productivity after some negative labor market shock. This implies
that the OLS estimates of the effects of automation on labor market outcomes could be bi-
ased, either upward or downward. To account for the potential endogeneity of Rob Expct,
we build on Autor, Dorn and Hanson (2013) and construct an instrument that is meant to
isolate the variation in Rob Expct due to supply shocks in robot exporting countries, rather
than to shocks occurring in individual CZs within the US. To construct the instrument,
we source from UN Comtrade data on robot exports from non-US countries to eleven
European economies over 1989-2018.10 To apportion the country-level robot imports to
individual industries, we use the share of each industry in total machinery imports into
a given country, extracted from country-specific Import Matrices available in the World
Input-Output Database (Timmer et al., 2015). Finally, we construct the instrument as
follows:
Rob Shockct =∑j
λcjt ·∆ lnRob MOjt , (13)
8Specifically, we compute US robot imports in industry j and year t as Rob Mjt =ωjt ·Rob Mt , where Rob Mt
is the total value of US robot imports and ωjt is the share of industry j in total US imports of machinery in
year t, constructed from the US Import Matrices.9We construct λcjt using data from the County Business Patterns (CBP). In the CBP, industries are defined
according to the 6-digit level of the 2012 NAICS classification. We map BEA industries into 6-digit NAICS
industries using a crosswalk provided with the US Input–Output Tables. In case of missing data on robot
imports for some years, we use data for the closest available year. Robot imports are expressed at constant
2005 prices using the US Consumer Price Index.10The eleven European countries are Austria, Denmark, Finland, France, Germany, Italy, Netherlands,
Spain, Sweden, Switzerland and the UK. In the UN Comtrade database, trade in industrial robots is
recorded under code 847950 of the Harmonized System classification.
13

where ∆ lnRob MOjt is the ten-year equivalent log change in robot exports from non-US
countries to the eleven European countries in industry j over period t.
Offshoring Intensity. Following Feenstra and Hanson (1999), we measure offshoring as
the share of imported intermediate inputs in total input purchases. A higher value of this
ratio corresponds to a greater usage of foreign inputs in production, reflecting a more in-
tensive relocation of production stages to foreign countries. We construct offshoring inten-
sities for the BEA industries using US Input-Output and Import Matrices over 1997-2018.
We use two complementary indicators of offshoring. The first, called broad offshoring,
considers imports of all types of inputs. The second, called narrow offshoring, considers
only imports of inputs that are closely related to the production process of an industry
and could thus be performed in house by firms.
The two indicators are constructed as follows:
B Of f shjt =
∑h I Mjht∑
h
(I Mjht + I Djht
) and N Of f shjt =I Mjjt∑
h
(I Mjht + I Djht
) ,where I Mjht and I Djht denote imports and domestic purchases, respectively, of inter-
mediates made by industry j from industry h in period t; and I Mjjt indicates imports
of intermediates made by industry j from within itself at time t. Then, we construct the
intensity of offshoring in each CZ similarly to eq. (12), using the industry-specific off-
shoring indicators, B Of f shjt and N Of f shjt, in place of the log change in robot imports.
Namely,
B Of f shct =∑j
λcjt ·B Of f shjt and N Of f shct =∑j
λcjt ·N Of f shjt. (14)
Occupational Characteristics. Finally, we use information on occupational character-
istics to unpack the overall employment effects of automation across different groups of
workers. Following Graetz and Michaels (2018), we classify each occupation according
to whether workers perform tasks that can or cannot be replaced by robots. Graetz and
Michaels (2018) define an occupation as “replaceable” if its title corresponds to at least
one of the robot application categories (e.g., welding, painting and assembling) identified
by the International Federation of Robotics. We source replaceability data by occupation
from Graetz and Michaels (2018).
We also classify occupations depending on how easy it is to relocate their tasks to for-
eign countries. Our main index of occupational offshorability is sourced from Autor and
14

Figure 1: Employment-to-Population Ratio by Sector
Source: US Censuses (1990, 2000) and American Community Survey (2005-2015).
Dorn (2013). The authors use the simple average of two variables constructed by Firpo,
Fortin and Lemieux (2011), who employ data from the O*Net database to measure the
degree to which workers require face-to-face interaction and physical presence on the
job. The index is reversed, so higher levels indicate higher offshorability. We standard-
ize the index to have mean 0 and standard deviation 1 across occupations, and define
as offshorable all occupations whose index is above the median. The two occupational
characteristics are available for 331 US Census occupations. We match these character-
istics to the US Censuses and the ACS using information on each worker’s occupation of
employment provided in the two data sources.11
3.2 Stylized Facts
We now present a number of facts about labor market outcomes, robot imports and off-
shoring in the US over the period of analysis. Figure 1 shows the evolution of employment
from 1990 to 2015. After being stable at around 85% of total population over the 1990s,
11In case an index is missing for an occupation, we use information for the corresponding broader occupa-
tional group.
15

Figure 2: Employment-to-Population Ratio by Occupation Group
Source: US Censuses (1990, 2000) and American Community Survey (2005-2015). Replaceableoccupations are those whose title corresponds to at least one of the robot application categoriesidentified by the International Federation of Robotics (Graetz and Michaels, 2018). Offshorability ismeasured by an index capturing the degree to which workers require face-to-face interaction andphysical presence on the job (Autor and Dorn, 2013). The index is rescaled so that higher valuesindicate higher offshorability. Offshorable occupations are those for which the index is above thesample median. All figures are arithmetic averages across CZs.
employment has significantly increased in the following years, reaching 91% of popu-
lation in 2015. These aggregate trends mask heterogeneity between manufacturing and
non-manufacturing sectors. The employment-to-population ratio has steadily decreased
in manufacturing, moving from 16% in 1990 to 9% in 2015. At the same time, employ-
ment has significantly risen relative to population in non-manufacturing sectors, passing
from 71% in 1990 to 82% in 2015. The existence of a shrinking industrial sector and an
expanding service sector are common trends to most industrialized countries, and reflect
the structural change occurred in these economies over recent decades. As we show later
on, automation has contributed to these trends, by inducing a reallocation of labor outside
of manufacturing.
Figure 2 unpacks the overall trend in employment across occupations with different
characteristics. The figure shows average employment-to-population ratios across CZs
in a given year, separately for offshorable and replaceable occupations. The difference
between the overall employment-to-population ratio and the ratio corresponding to either
16
group is equal to the employment-to-population ratio in the complement group of (non-
offshorable and non-replaceable) occupations. Employment has increased in offshorable
occupations, especially after the year 2000. At the same time, after reaching a plateau in
2000, the employment share of replaceable jobs has significantly declined in subsequent
years, with a rapid acceleration in 2010. These trends reveal a marked change in the
occupational structure of US employment over recent decades: employment has shifted
from non-offshorable to offshorable jobs and from occupations that can be replaced by
robots to those that cannot.
These adjustments in the US labor market have been concurrent with significant changes
in the importance of automation and offshoring. Figure 3 shows the evolution of US robot
imports over the period of analysis. To highlight the main trends in this variable, the
graph reports overall imports in each five-year interval starting in 1989. The graph also
displays the evolution of the two offshoring indicators, averaged across industries in each
five-year period. Two main facts emerge from Figure 3. First, robot imports have re-
mained at very low levels over the 1990s and the first half of the 2000s, but have rapidly
risen thereafter, with a marked acceleration after 2010. This confirms that automation
and adoption of industrial robots have significantly gained momentum in the US over re-
cent years.12 Second, the growth in offshoring has decelerated in the second half of the
2000s and become negative after 2010. Overall, these trends are consistent with anecdotal
evidence, according to which automation is leading firms to reshore activities previously
performed abroad.
The aggregate trends in robot imports and offshoring hide heterogeneity across sec-
tors, as shown in Figure 4. The latter reports the average values of robot imports per
worker (panel a) and of the two offshoring indicators (panel b) over the sample period,
separately for manufacturing and non-manufacturing sectors. Robot imports are almost
entirely concentrated in manufacturing and still almost inexistent in services. In partic-
ular, robot imports per worker amount to roughly 575,000$ on average in manufacturing
and 63,000$ in non-manufacturing industries. Similarly, despite the growth of service
offshoring in recent years (see, e.g., Crino, 2010), offshoring is still higher in manufac-
turing than in other sectors. According to both indicators, offshoring in manufacturing
exceeds offshoring in non-manufacturing industries by about three times over the period
of analysis.
Since different economic activities are not equally distributed in space, the heteroge-
12See, among others, Acemoglu and Restrepo (2019) for additional evidence on the growth in the usage of
industrial robots in the US based on data from the International Federation of Robotics.
17
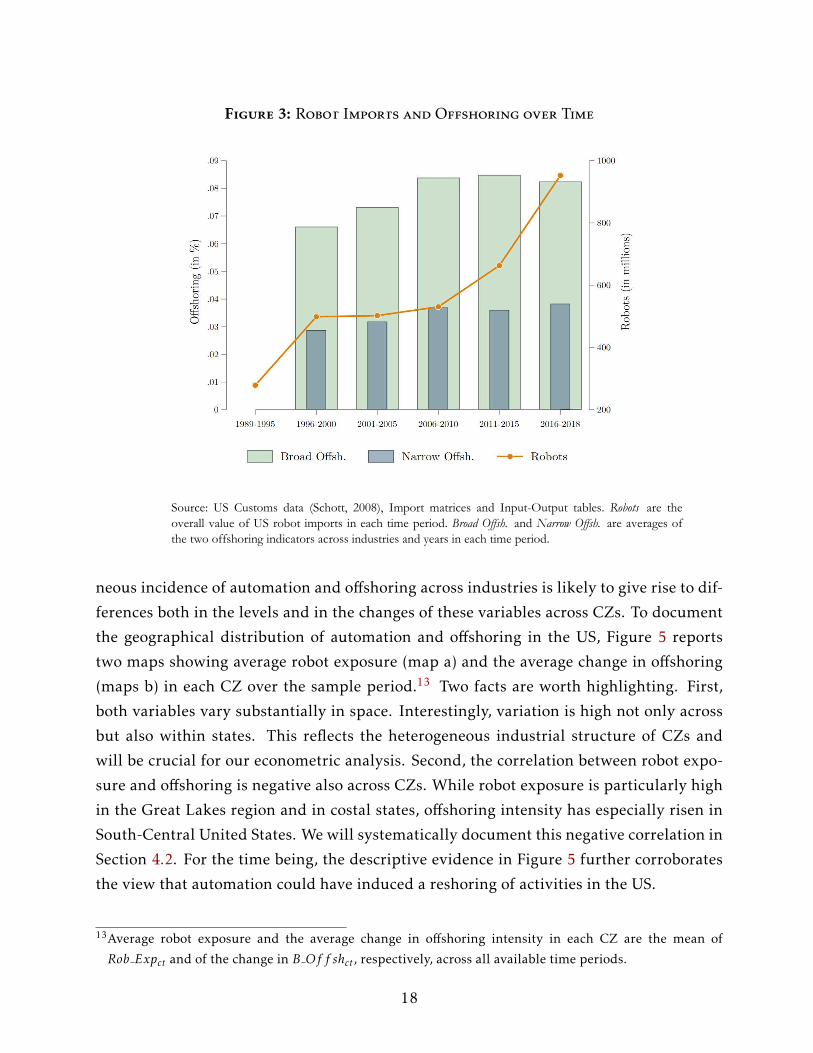
Figure 3: Robot Imports and Offshoring over Time
Source: US Customs data (Schott, 2008), Import matrices and Input-Output tables. Robots are theoverall value of US robot imports in each time period. Broad Offsh. and Narrow Offsh. are averages ofthe two offshoring indicators across industries and years in each time period.
neous incidence of automation and offshoring across industries is likely to give rise to dif-
ferences both in the levels and in the changes of these variables across CZs. To document
the geographical distribution of automation and offshoring in the US, Figure 5 reports
two maps showing average robot exposure (map a) and the average change in offshoring
(maps b) in each CZ over the sample period.13 Two facts are worth highlighting. First,
both variables vary substantially in space. Interestingly, variation is high not only across
but also within states. This reflects the heterogeneous industrial structure of CZs and
will be crucial for our econometric analysis. Second, the correlation between robot expo-
sure and offshoring is negative also across CZs. While robot exposure is particularly high
in the Great Lakes region and in costal states, offshoring intensity has especially risen in
South-Central United States. We will systematically document this negative correlation in
Section 4.2. For the time being, the descriptive evidence in Figure 5 further corroborates
the view that automation could have induced a reshoring of activities in the US.
13Average robot exposure and the average change in offshoring intensity in each CZ are the mean of
Rob Expct and of the change in B Of f shct , respectively, across all available time periods.
18
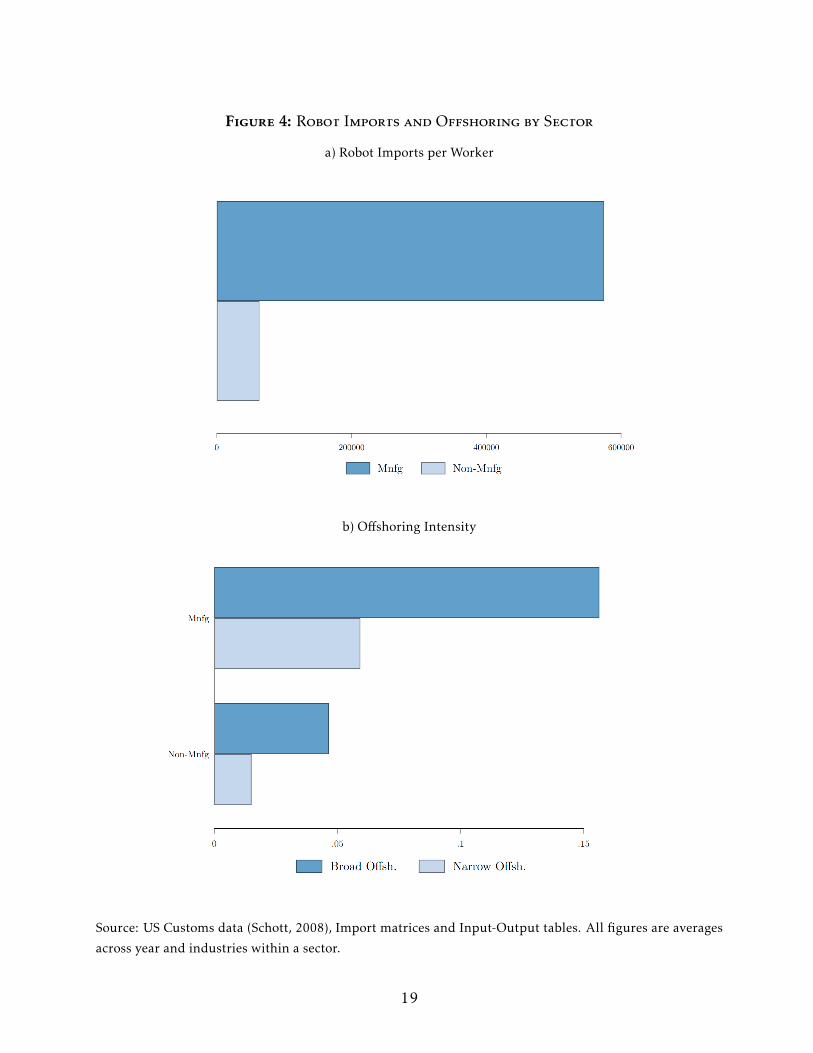
Figure 4: Robot Imports and Offshoring by Sector
a) Robot Imports per Worker
b) Offshoring Intensity
Source: US Customs data (Schott, 2008), Import matrices and Input-Output tables. All figures are averages
across year and industries within a sector.
19
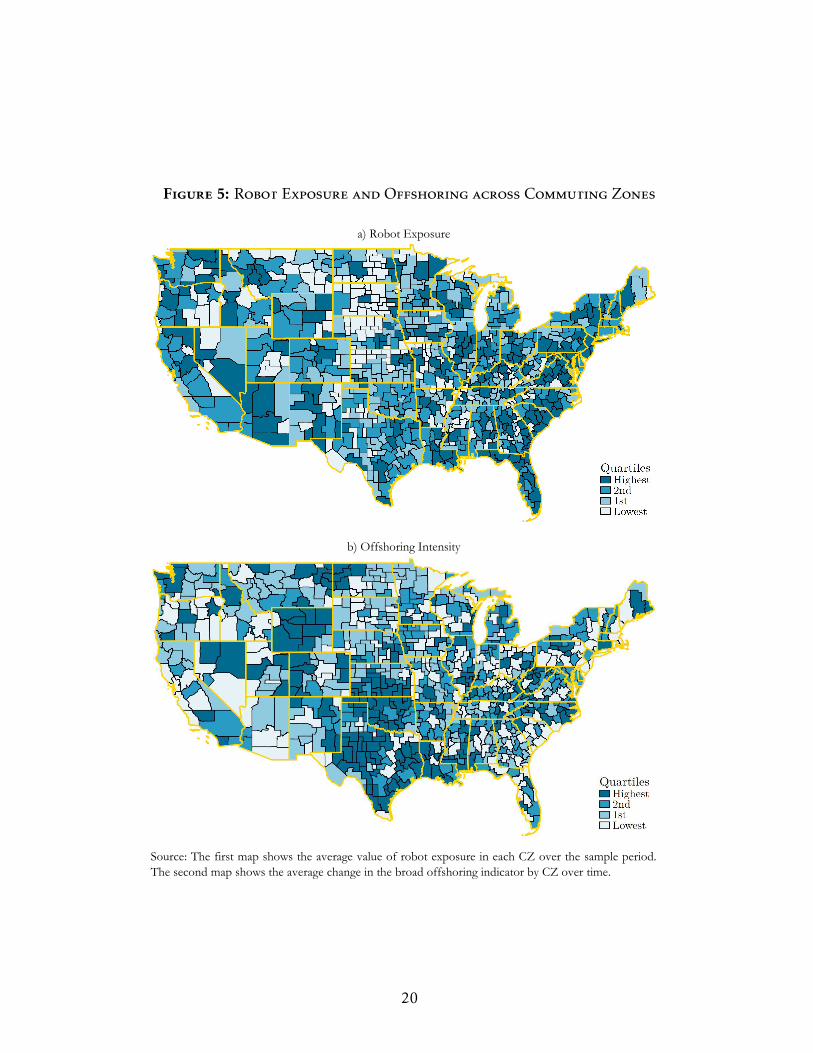
Figure 5: Robot Exposure and Offshoring across Commuting Zones
Source: The first map shows the average value of robot exposure in each CZ over the sample period.The second map shows the average change in the broad offshoring indicator by CZ over time.
a) Robot Exposure
b) Offshoring Intensity
20

Table 1: Summary Statistics
Mean Std. Dev. Obs.D Total Emp./Pop. 0.026 0.043 2888D Mnfg Emp./Pop. -0.020 0.041 2888D Non Mnfg Emp./Pop. 0.046 0.053 2888D ln Avg Wages 0.100 0.115 2888D ln Mnfg Wages 0.105 0.255 2888D ln Non Mnfg Wages 0.103 0.125 2888Rob_Exp 0.411 0.699 2888B_Offsh 0.048 0.033 2888N_Offsh 0.007 0.017 2888Notes. Statistics for variables in changes are computed across 722 CZsand four time periods: 1990-2000, 2000-2005, 2005-2010 and 2010-2015. Statistics for variables in levels (B_Offsh and N_Offsh ) arecomputed across 722 CZs and four years: 2000, 2005, 2010 and 2015.Changes in employment-to-population ratios and in log average wagesover a given time period are expressed in decadal terms. Rob_Exp isthe weighted average of ten-year equivalent log changes in US robotimports across industries, with weights given by the industrial structureof employment in each CZ at the beginning of each time period.B_Offsh and N_Offsh are weighted averages of the broad and narrowoffshoring indicators across industries, with weights given by theindustrial structure of employment in each CZ and year.
Finally, Table 1 reports summary statistics on the main variables used in the regres-
sions. All statistics are computed across CZs and time periods. The employment-to-
population ratio has increased on average by 2.6 percentage points (p.p.) per decade, as
the combination of a 4.6 p.p. average decadal increase in non-manufacturing industries
and a 2 p.p. average decadal reduction in the manufacturing sector. Average wages have
risen by 0.1 log points per decade in both sectors. Table 1 also confirms the significant
increase in automation documented before, with Rob Expct equal to 0.41 log points per
decade on average. The high standard deviation of Rob Expct points to significant vari-
ation in automation both in space and over time, consistent with the evidence emerging
from Figure 5. Finally, offshoring intensity is equal to 4.8 p.p. on average according to the
broad indicator, and to 1 p.p. according to the narrow indicator. Also in this case, there
is significant variation across CZs and time periods, as suggested by the high standard
deviations reported in the table.
21

4 Empirical Analysis
In this section, we present the results of the econometric analysis. We start by discussing
the average effects of robot exposure on labor market outcomes across CZs. Then, we pro-
vide novel evidence on the relationship between automation and offshoring, exploiting
variation across occupations, industries and space. Building on this evidence, we finally
revisit the average employment effects of robot exposure and unpack them across occupa-
tions and CZs with different exposure to offshoring.
4.1 Average Effects
To study how robot exposure affects labor market outcomes across CZs, we build on Autor,
Dorn and Hanson (2013) and Acemoglu and Restrepo (2019), and estimate specifications
of the following form:
∆Yct = αs +αt + β ·Rob Expct + X′ct ·γ + εct, (15)
where ∆Yct is the change in outcome Y in CZ c over period t; αs and αt are fixed effects for
US states and time periods, respectively; Rob Expct is our measure of CZ-level exposure
to imported robots; Xct is a vector of controls for other observable characteristics of the
CZ (details below); and εct is an error term.
We estimate eq. (15) by stacking ten-year equivalent first differences for four time
periods: 1990-2000, 2000-2005, 2005-2010 and 2010-2015. The state fixed effects con-
trol for heterogeneous trends in labor market outcomes across states, while the year fixed
effects absorb shocks hitting outcomes uniformly in all CZs. The control variables Xct in-
clude start-of-period proxies for the following CZ-level characteristics: size (log employ-
ment), demographic composition of the labor force (employment shares of female, foreign
born and college-educated workers), and composition of economic activities (employment
share of workers in routine-intensive occupations and offshoring intensity). These vari-
ables account for heterogeneous trends across CZs characterized by different initial condi-
tions. Xct also includes proxies for other trade-related shocks potentially occurring in CZ
c over period t, namely, export shocks and shocks to import competition from China and
other countries. These variables control for changes in trade exposure concurrent with the
import of robots.14 We weight the observations by the initial-period share of each CZ in
14The proxies for the demographic composition of employment and the share of routine-intensive occupa-
tions are constructed following Autor, Dorn and Hanson (2013). Unless otherwise indicated, we control
for offshoring intensity using the broad offshoring indicator; the first period with available data on off-
22

Table 2: Robot Exposure and Employment
(1) (2) (3) (4) (5) (6)D Total Emp./Pop.
D Mnfg Emp./Pop.
D Non Mnfg Emp./Pop.
D Total Emp./Pop.
D Mnfg Emp./Pop.
D Non Mnfg Emp./Pop.
Rob_Exp -0.012** -0.016*** 0.004 -0.006 -0.016*** 0.010*[0.005] [0.004] [0.005] [0.004] [0.004] [0.006]
Obs. 2879 2879 2879 2157 2157 2157R2 0.43 0.29 0.36 0.53 0.36 0.36
Rob_Exp 0.016 -0.056*** 0.072*** 0.006 -0.049*** 0.055***[0.016] [0.014] [0.018] [0.010] [0.010] [0.014]
Obs. 2157 2157 2157 2157 2157 2157R2 0.23 0.20 0.01 0.52 0.30 0.29
Rob_Shock 2.708*** 2.708*** 2.708*** 4.085*** 4.085*** 4.085***[0.450] [0.450] [0.450] [0.411] [0.411] [0.411]
Kleibergen-Paap F -stat. 36.2 36.2 36.2 99.0 99.0 99.0State FE yes yes yes yes yes yesYear FE yes yes yes yes yes yesControl variables no no no yes yes yesNotes. The sample consists of 722 CZs and four time periods: 1990-2000, 2000-2005, 2005-2010 and 2010-2015. The dependent variables, indicated in thecolumns' headings except for the first-stage regressions, are ten-year equivalent changes in overall employment-to-population ratio (columns 1 and 4),manufacturing employment-to-population ratio (columns 2 and 5), and non-manufacturing employment-to-population ratio (columns 3 and 6). Rob_Exp is theweighted average of ten-year equivalent log changes in US robot imports across industries, with weights given by the industrial structure of employment in eachCZ at the beginning of each time period. The instrument Rob_Shock is constructed analougously to Rob_Exp using industry-level data on robot exports from non-US countries to eleven developed countries other than the US. Control variables are start-of-period log employment, offshoring intensity (broad indicator), theemployment shares of female workers, foreign-born workers, college graduates and routine-intensive occupations, and the ten-year equivalent changes in exports,imports from China and imports from other countries over total employment. The first period with available data on offshoring is 2000-2005. Regressions areweighted by the initial share of each CZ in total US population. Standard errors, reported in square brackets, are correted for clustering within states. ***, ** and *denote significance at the 1, 5 and 10% level, respectively.
2nd Stage
1st Stage (Dep. Var.: Rob_Exp)
a) OLS
b) 2SLS
total population, and correct the standard errors for clustering at the state level to account
for spatial correlation across CZs.
We start by estimating eq. (15) using OLS. To account for the possible endogeneity of
Rob Expct, we then turn to 2SLS regressions, instrumenting Rob Expct with Rob Shockct.
Being constructed using changes in robot exports from non-US countries to other devel-
oped economies, Rob Shockct is meant to capture variation in CZ-level robot exposure
due to changes in supply conditions in foreign countries, rather than to contemporane-
ous shocks occurring in individual CZs and potentially correlated with labor market out-
comes. Because eq. (15) restricts the coefficient β to be the same across CZs, it delivers the
average effects of robot exposure on outcomes across US local labor markets.
Table 2 contains results for employment. OLS estimates are reported in panel a) and
shoring is 2000-2005. The proxies for export shocks and for shocks to import competition from China and
other countries are defined as changes in a given variable divided by start-of-period employment in the
CZ, and are constructed as in Autor, Dorn and Hanson (2013) using trade data from Schott (2008).
23

2SLS estimates in panel b). To study how the effect of robot exposure is influenced by
the covariates, we first present results from a parsimonious specification including only
state and year fixed effects (columns 1-3) and then add control variables (columns 4-6).
We estimate eq. (15) for three different outcomes. The first, used in columns (1) and (4),
is the change in total employment over population. The other outcomes, used in columns
(2) and (5) and in columns (3) and (6), respectively, are the changes in manufacturing and
non-manufacturing employment over population. Because total employment is the sum of
manufacturing and non-manufacturing employment, the properties of linear estimators
like OLS and 2SLS imply that the estimates of β reported in columns (2) and (3) add up
to the estimate reported in column (1); similarly, the estimates of β shown in columns (5)
and (6) add up to the estimate shown in column (4). This provides us with an immediate
way of decomposing the employment effects of robot exposure across manufacturing and
other sectors.
The OLS estimates show a negative and statistically significant correlation between
robot exposure and manufacturing employment. The correlation with non-manufacturing
employment is instead positive, and becomes statistically significant when we add control
variables. The two effects partly offset each other, so the correlation of robot exposure
with overall employment is weak and not always statistically significant. In Appendix
Table A1, we dig deeper into the timing of these relationships. Using the parsimonious
specification, we find that the correlations are stronger when estimated on later periods
(2005-2010 and 2010-2015) than earlier periods (1990-2000 and 2000-2005). This is con-
sistent with the acceleration of robot imports occurred in the second part of the sample,
as documented in Figure 3. Second, we perform a falsification test by regressing current
employment changes on the first lead of Rob Expct. The coefficients are always close to
zero, which further suggests that the relationship between robot exposure and employ-
ment is not driven by secular trends in outcomes that antedate an increase in automation.
We also perform an extensive sensitivity analysis on the baseline specification. We show,
in particular, that the main results are not driven by outliers, as they remain unchanged
when we exclude CZs in the top percentile of the distribution by Rob Expct in each period.
We also control for exposure to other types of capital and find that the correlations are not
contaminated by other forms of investment.15 Finally, we find similar results when using
a different proxy for robot exposure, which exploits changes in the stock of robot imports
15These variables are constructed analogously to Rob Expct , by replacing ∆ lnRob Mjt in eq. (12) with ten-
year equivalent log changes in expenditure on software and databases, ICT, machinery and other types of
capital and machinery.
24

over each period.16
We now turn to the 2SLS estimates. The bottom part of panel b) shows that the first-
stage coefficient on Rob Shockct is positive, large and very precisely estimated, which un-
derscores the strong predictive power of the instrument at explaining differences in robot
exposure across CZs.17 The second-stage coefficients, reported at the top of panel b),
are larger than their OLS counterparts in absolute value, suggesting OLS estimates to be
biased towards zero. Qualitatively, however, the 2SLS estimates confirm the evidence
emerged from the OLS regressions. In particular, robot exposure reduces employment in
manufacturing. This is consistent with robot adoption currently being larger in manufac-
turing than in other sectors. At the same time, robot exposure raises employment outside
of manufacturing. Presumably, the increased efficiency induced by automation boosts de-
mand for all factors, including services. Overall, the two effects almost exactly cancel out,
so robot exposure has no significant impact on overall employment.
To have a sense of the magnitude of these effects, we multiply the average value of
Rob Expct reported in Table 1 by the 2SLS coefficients shown in columns (5) and (6) of Ta-
ble 2. This yields −0.02 for manufacturing employment and 0.022 for non-manufacturing
employment. Accordingly, in a CZ with average robot exposure, manufacturing employ-
ment would fall by 2 p.p. per decade relative to population, roughly the average change
documented in Table 1. At the same time, non-manufacturing employment relative to
population would increase by 2.2 p.p. per decade, approximately half the size of the av-
erage change reported in Table 1. These figures suggest that automation has significantly
contributed to the reallocation of employment from manufacturing to non-manufacturing
sectors occurred in the US over the sample period.
Finally, in Table 3, we complement the employment results by studying the implica-
tions of robot exposure for wages. The estimates show that automation increases aver-
age wages. The effect is driven by non-manufacturing sectors. Together with our previ-
ous evidence on employment, this further suggests that robot exposure increases labor
demand outside of manufacturing. When separately considering college-educated and
non college-educated workers, we find positive wage effects for both groups, although the
point estimate is larger and precisely estimated for high-skill individuals. In manufactur-
ing, the effect of automation on average wages is negative, albeit imprecisely estimated,
16This measure is constructed as ∆Rob Exp Stkct =∑j λcjt
∑τ∈t ln(1 +Rob Mjτ ), where τ denotes individual
years within time period t.17The Kleibergen-Paap F-statistic for excluded instruments easily exceeds the value of 10, which is normally
considered as the rule-of-thumb threshold for instrument relevance.
25

Table 3: Robot Exposure and Wages
(1) (2) (3) (4) (5) (6) (7)D ln Avg Wages
D ln Mnfg Wages
D ln Mnfg Wages(College)
D ln Mnfg Wages (Non College)
D ln Non Mnfg Wages
D ln Non Mnfg Wages (College)
D ln Non Mnfg Wages (Non College)
Rob_Exp 0.031** 0.003 0.017 0.004 0.039*** 0.044*** 0.032[0.012] [0.023] [0.030] [0.027] [0.013] [0.014] [0.022]
Obs. 2157 2157 2151 2154 2157 2157 2157R2 0.52 0.20 0.18 0.08 0.49 0.51 0.24
Rob_Exp 0.064* -0.075 0.013 -0.102 0.097*** 0.114*** 0.055[0.033] [0.097] [0.099] [0.105] [0.030] [0.032] [0.034]
Obs. 2157 2157 2151 2154 2157 2157 2157R2 0.51 0.19 0.18 0.06 0.48 0.50 0.23
a) OLS
b) 2SLS, 2nd Stage
Notes. All regressions are estimated on a panel of 722 CZs. The dependent variables, indicated in the columns' headings, are ten-year equivalent log changes in average wages (column1), manufacturing wages (column 2), manufacturing wages of college graduates (column 3), manufacturing wages of non-college graduates (column 4), non-manufacturing wages(column 5), non-manufacturing wages of college graduates (column 6) and non-manufacturing wages of non-college graduates (column 7). Rob_Exp is the weighted average of ten-yearequivalent log changes in US robot imports across industries, with weights given by the industrial structure of employment in each CZ at the beginning of each time period. Theinstrument is Rob_Shock, constructed analougously to Rob_Exp using industry-level data on robot exports from non-US countries to eleven developed countries other than the US. Allregressions include state fixed effects, year fixed effects and the same control variables as in Table 2, and are weighted by the initial share of each CZ in total US population. Standarderrors, reported in square brackets, are correted for clustering within states. ***, ** and * denote significance at the 1, 5 and 10% level, respectively.
consistent with automation reducing labor demand in this sector. When separately con-
sidering workers with and without a college degree, we find a small positive estimate of
β for the former group and a larger negative estimate for the latter. While none of these
coefficients is precisely estimated, these results suggest that robots tend to reduce labor
demand in manufacturing especially for low-skill individuals.
Overall, these results are broadly consistent with Acemoglu and Restrepo (2019), who
study the effect of automation across US CZs over the 1990-2007 period using data on the
stock of robots in 19 industries from the International Federation of Robotics. Similarly
to us, they find evidence of negative employment effects, which are more pronunced in
manufacturing. However, they also find stronger negative effects on wages.
4.2 Robots and Offshoring
Having documented the average effects of robot exposure on labor market outcomes, we
turn to the main part of the analysis. Our interest lies in understanding how automation
interacts with offshoring, and what consequences such an interaction could have for the
US labor market. In this section, we analyze the relationship between robot exposure and
offshoring using different sources of variation in the data. In the next section, we turn to
investigating the implications for US employment.
As a starting point, we study the nature of tasks that can be performed by robots.
Specifically, we ask whether robots are suited for tasks with a high offshorability degree
or for relatively hard-to-offshore activities. To this purpose, we take advantage of the
occupation-level measures of offshorability and replaceability introduced in Section 3. We
26

Table 4: Robots Exposure and Offshoring Across Occupations, Industries and CZs
(1) (2) (3) (4) (5) (6) (7)Offshorability(AD, 2013)
D Offshoring(Broad)
D Offshoring(Narrow)
D Offshoring(Broad)
D Offshoring(Narrow)
D Offshoring(Broad)
D Offshoring(Narrow)
Replaceability 0.277**[0.130]
D ln Rob_M -0.076*** -0.080***[0.006] [0.005]
Rob_Exp -0.019*** -0.024*** -0.014*** -0.017***[0.004] [0.003] [0.005] [0.004]
Obs. 331 535 408 2157 2157 2157 2157R2 0.01 1.00 1.00 0.69 0.71 0.68 0.68Sample OccupationsEstimator OLS OLS OLS OLS OLS 2SLS 2SLS
Industries Panel CZs Panel
Notes. The regression in column (1) is estimated on a cross-section of occupations. The dependent variable is an indicator of offshorability, which measuresthe degree to which workers in a given occupation require face-to-face interaction and physical presence on the job (Autor and Dorn, 2013). Replaceability isa dummy equal to 1 for occupations whose title corresponds to at least one of the robot application categories identified by the International Federation ofRobotics, and equal to 0 otherwise (Graetz and Michaels, 2018). The regressions in columns (2) and (3) are estimated on a panel of 66 industries. Thedependent variables are changes in the broad and narrow offshoring indicators, respectively, over five-year periods. D ln Rob_M is the log change in USrobot imports in each industry. The regressions include fixed effects for industries and sector-year pairs, and are weigthted by start-of-period industryemployment. The regressions in columns (4)-(7) are estimated on a panel of CZs. The dependent variables are weighted averages of ten-year equivalentchanges in the industry-level offshoring indicators, with weights given by the industrial structure of employment in each CZ at the beginning of each timeperiod. Rob_Exp is the weighted average of ten-year equivalent log changes in US robot imports across industries, with weights given by the initial industrialstructure of employment in each CZ. In columns (6) and (7), the instrument is Rob_Shock , constructed analougously to Rob_Exp using industry-level dataon robot exports from non-US countries to eleven developed countries other than the US. The regressions include state fixed effects, year fixed effects andthe same control variables as in Table 2, and are weighted by the initial share of each CZ in total US population. Standard errors, reported in squarebrackets, are robust to heteroskedasticity in column (1), corrected for clustering within industries in columns (2) and (3), and corrected for clustering withinstates in columns (4)-(7). ***, ** and * denote significance at the 1, 5 and 10% level, respectively.
regress the offshorability index of Autor and Dorn (2013) on the replaceability dummy of
Graetz and Michaels (2018) across 331 US Census occupations. The results are reported
in column (1) of Table 4. The coefficient on the replaceability dummy is positive and
statistically significant, implying that replaceable occupations are more offshorable than
non-replaceable occupations, on average. Given that the offshorability index is standard-
ized with mean 0 and standard deviation 1, the coefficient implies a sizable difference of
28% of a standard deviation between the average offshorability of replaceable and non-
replaceable occupations.
In untabulated regressions, we have assessed the robustness of this result using two
alternative offshorability indices, developed by Blinder (2009) and Blinder and Krueger
(2013), respectively. The Blinder (2009) indicator assigns each occupation an offshora-
bility degree based on the author’s subjective assessment of how amenable tasks are to
electronic delivery. The Blinder and Krueger (2013) indicator quantifies the offshorability
of an occupation based on information from household surveys and professional coders’
assessment of the ease with which tasks can be relocated abroad. Also in these cases, we
found positive and precisely estimated coefficients on the replaceability dummy, suggest-
ing that the positive correlation between replaceability and offshorability does not depend
27

on how we measure the latter characteristic.
These results imply that automation and offshoring affect similar occupations. Accord-
ingly, automation may act as a substitute for offshoring, by allowing firms to use robots
in tasks that were previously performed abroad. We now provide more direct evidence of
this substitutability, by studying the relationship between robot imports and the two off-
shoring indicators across industries. To this purpose, we regress changes in the offshoring
indicators on changes in log robot imports over five-year periods across industries. We
control for industry fixed effects to absorb industry-specific trends and for sector×year
fixed effects to soak up common shocks across sectors; the regressions are weighted by in-
dustry employment at the beginning of each period. The results are reported in columns
(2) and (3) of Table 4. Regardless of the offshoring indicator, the coefficient on robot
imports is always negative and very precisely estimated: industries experiencing a more
rapid growth of robot imports also exhibit a relatively larger reduction in offshoring. This
finding is consistent with robots substituting tasks that used to be performed abroad, and
suggests that the rise of automation over the sample period has been associated with a
reshoring of activities to the US.
In the remaining columns of Table 4, we complement the previous results with evi-
dence across CZs. To this purpose, we estimate eq. (15) using changes in the two off-
shoring indicators as the dependent variable.18 We run these regressions using both OLS
(columns 4 and 5) and 2SLS (columns 6 and 7), to mitigate concerns with reverse causal-
ity and omitted variables; in the latter case, we use Rob Shockct as an instrument for
Rob Expct. The coefficient on Rob Expct is always negative and highly statistically sig-
nificant. Consistent with the descriptive evidence emerging from Figure 5, firms have
more intensively resorted to reshoring in CZs characterized by stronger robot exposure.
4.3 Robot Exposure, Offshoring and Employment
That robots and offshoring are substitutes for one another has potentially important impli-
cations for the employment effects of automation. If robots induce reshoring, their effects
are likely to be heterogeneous both across occupations and across CZs. First, automa-
tion may induce a relatively larger reduction in domestic employment in occupations that
are harder to offshore. The reason is that, in offshorable occupations, automation should
18In particular, the dependent variables are constructed as follows: ∆B Of f shct =∑j λcjt ·∆B Of f shjt and
∆N Of f shct =∑j λcjt ·∆N Of f shjt , where ∆B Of f shjt and ∆N Of f shjt are changes in a given offshoring
indicator in industry j over period t.
28

Table 5: Robot Exposure and Employment Across Occupation Groups
(1) (2) (3) (4)Replaceable(GM, 2018)
Non-Replaceable(GM, 2018)
Offshorable(AD, 2013)
Non-Offshorable(AD, 2013)
Rob_Exp -0.010* 0.003 0.006 -0.013***[0.005] [0.005] [0.005] [0.005]
Obs. 2157 2157 2157 2157R2 0.19 0.17 0.30 0.46
Offshorable &Replaceable
Offshorable &Non-Replaceable
Non-Offshorable &Replaceable
Non-Offshorable &Non-Replaceable
Rob_Exp 0.001 0.005 -0.011** -0.002[0.003] [0.005] [0.005] [0.004]
Obs. 2157 2157 2157 2157R2 0.09 0.28 0.23 0.21
Rob_Exp 0.018 -0.001 -0.033** 0.019[0.012] [0.021] [0.014] [0.015]
Obs. 2157 2157 2157 2157R2 0.06 0.28 0.21 0.19Notes. All regressions are estimated on a panel of 722 CZs. The dependent variables are ten-year equivalent changes inemployment (relative to population) in mutually exclusive groups of occupations, as defined in the columns' headings.Offshorable occupations are those for which the offshorability index developed by Autor and Dorn (2013) is above thesample median. Replaceable occupations are those whose title corresponds to at least one of the robot applicationcategories identified by the International Federation of Robotics (Graetz and Michaels, 2018). Non-offshorable and non-replaceable occupations are defined accordingly. Rob_Exp is the weighted average of ten-year equivalent log changes inUS robot imports across industries, with weights given by the industrial structure of employment in each CZ at thebeginning of each time period. The instrument is Rob_Shock , constructed analougously to Rob_Exp using industry-leveldata on robot exports from non-US countries to eleven developed countries other than the US. All regressions includestate fixed effects, year fixed effects and the same control variables as in Table 2, and are weighted by the initial share ofeach CZ in total US population. Standard errors, reported in square brackets, are correted for clustering within states.***, ** and * denote significance at the 1, 5 and 10% level, respectively.
b) OLS
c) 2SLS, 2nd Stage
a) OLS
partly affect foreign employment and foster reshoring to the US. Second, automation may
lead to a relatively smaller reduction in domestic employment in CZs characterized by a
higher offshoring intensity, as the scope for reshoring is relatively larger in these CZs. We
now revisit the average effects of robot exposure on employment in light of these consid-
erations. In particular, we allow the effects to vary across jobs and in space, and study
whether this heterogeneity is consistent with the substitutability between robots and off-
shoring documented before.
Our first exercise consists of unpacking the effects of robot exposure across occupa-
tions with different characteristics. To this purpose, we decompose the overall change in
the employment-to-population ratio across mutually exclusive groups of occupations, and
29

Table 6: Robot Exposure, Offshoring and Employment, Broad Offshoring Indicator
(1) (2) (3) (4) (5) (6)D Total Emp./Pop.
D Mnfg Emp./Pop.
D Non Mnfg Emp./Pop.
D Total Emp./Pop.
D Mnfg Emp./Pop.
D Non Mnfg Emp./Pop.
Rob_Exp -0.002 -0.037*** 0.035*** -0.003 -0.041*** 0.037***[0.011] [0.012] [0.012] [0.012] [0.012] [0.012]
Rob_Exp x B_Offsh -0.057 0.330** -0.387** -0.032 0.377** -0.409**[0.133] [0.157] [0.168] [0.141] [0.145] [0.158]
B_Offsh 0.067 -0.279*** 0.346*** 0.062 -0.245*** 0.307***[0.067] [0.057] [0.072] [0.064] [0.049] [0.068]
Obs. 2157 2157 2157 2157 2157 2157R2 0.53 0.36 0.36 0.53 0.37 0.36
Rob_Exp -0.259 -0.035 -0.224 0.000 -0.047*** 0.047***[0.160] [0.130] [0.150] [0.009] [0.012] [0.015]
Rob_Exp x B_Offsh -0.061 0.427*** -0.488*** -0.176 0.553*** -0.730***[0.125] [0.114] [0.173] [0.145] [0.179] [0.227]
B_Offsh 0.019 -0.321*** 0.339*** -0.143 -0.400* 0.257[0.061] [0.062] [0.081] [0.222] [0.218] [0.262]
Obs. 2157 2157 2157 2157 2157 2157R2 0.53 0.38 0.36 0.54 0.37 0.38Notes. All regressions are estimated on a panel of 722 CZs. The dependent variables, indicated in the columns' headings, are ten-year equivalent changes inoverall employment-to-population ratio (columns 1 and 4), manufacturing employment-to-population ratio (columns 2 and 5), and non-manufacturingemployment-to-population ratio (columns 3 and 6). Rob_Exp is the weighted average of ten-year equivalent log changes in US robot imports across industries,with weights given by the industrial structure of employment in each CZ at the beginning of each period. B_Offsh is the weighted average of the start-of-periodbroad offshoring indicator across industries, with weights given by the initial industrial structure of employment in each CZ. In panel b), the offshoring indicatorexcludes imports of machinery made by each industry. All regressions are estimated with OLS; include state fixed effects, year fixed effects and the same controlvariables as in Table 2; and are weighted by the initial share of each CZ in total US population. The regressions in panel c) also include interactions of Rob_Exp with log employment and the employment shares of female workers, foreign-born workers, college graduates and routine-intensive occupations at the beginningof each period. The regressions in panel d) also include four variables measuring the exposure of each CZ to software, ICT, machinery and other types of capital.These variables, which enter both linearly and interacted with B_Offsh , are constructed analogoulsy to Rob_Exp using ten-year equivalent log changes inexpenditure on each type of capital across industries in place of log changes in US robot imports. Standard errors, reported in square brackets, are correted forclustering within states. ***, ** and * denote significance at the 1, 5 and 10% level, respectively.
a) Baseline b) No Machinery in Offshoring Indicator
c) Additional Interactions of Robot Exposure d) Exposure to Other Types of Capital
then re-estimate eq. (15) using changes in group-specific employment over population as
the dependent variables. The results are reported in Table 5. To begin with, in panel a),
we divide occupations into two groups and use OLS regressions to describe the central
tendencies in the data. Columns (1) and (2) show, as expected, that robot exposure is as-
sociated with a significant fall in employment in replaceable occupations but no change
in non-replaceable occupations. More interestingly, columns (3) and (4) show that robot
exposure is uncorrelated with employment in offshorable jobs, but strongly negatively
correlated with employment in non-offshorable tasks.
In panel b), we examine this heterogeneity in greater detail by dividing occupations
into four mutually exclusive groups, which are obtained by combining replaceability and
offshorability. For instance, offshorable-replaceable occupations are those for which the
replaceability dummy is equal to 1 and the offshorability indicator is above the sample
median; the other groups are defined accordingly. The results show that the employment
30

changes in non-replaceable occupations are uncorrelated with robot exposure regardless
of offshorability. On the contrary, for replaceable occupations, employment changes are
uncorrelated with robot exposure if these occupations are also offshorable, but strongly
negatively correlated if they are non offshorable. The 2SLS regressions reported at the
bottom of the table confirm the qualitative pattern of results. Hence, automation has
heterogeneous effects across occupations depending on offshorability: while offshorable
occupations are largely sheltered from automation, non-offshorable occupations whose
tasks can be replaced by robots bear the burden of the negative effects of automation.
Next, we turn to the second exercise, and study whether the employment effects of
robot exposure vary across CZs depending on offshoring intensity. To do so, we add to eq.
(15) an interaction between Rob Expct and the start-of-period level of either offshoring
indicator, B Of f shct or N Of f shct.19 We report results for the overall employment-to-
population ratio and for its manufacturing and non-manufacturing components. Given
the well-known difficulty in instrumenting interaction terms, we focus on OLS regres-
sions.
The results are reported in Table 6 for the broad offshoring indicator and in Table 7
for the narrow measure. Strikingly, in the regression for manufacturing employment, the
coefficient on the interaction between robot exposure and offshoring is always positive
and very precisely estimated. This confirms that automation reduces manufacturing em-
ployment relatively less in CZs that are initially more reliant on offshoring. To quantify
the extent of heterogeneity, we use the estimated (linear and interaction) coefficients on
Rob Expct along with the observed distribution of offshoring across CZs in our data. This
exercise reveals that the employment effect of robot exposure is negative in the majority
of CZs; yet, for a small fraction of high offshoring-intensive CZs (the top 5% by B Of f shctand the top 1% by N Of f shct), automation actually leads to an increase in manufactur-
ing employment. In the regression for non-manufacturing employment, the coefficient on
the interaction between robot exposure and offshoring is always negative and precisely
estimated, consistent with the view that displaced workers reallocate, at least partially,
outside of the manufacturing sector.
In the remaining panels, we submit the baseline results to various robustness checks.
In panel b), we re-compute the offshoring indicators by excluding imports of machinery
made by each industry. This avoids the offshoring measures to be contaminated by robot
imports. In panel c), we augment the specification by adding interactions of Rob Expct
19The control variables Xct already include the linear term of B Of f shct . When interacting Rob Expct with
N Of f shct , we use a linear term in N Of f shct in place of the linear term in B Of f shct .
31
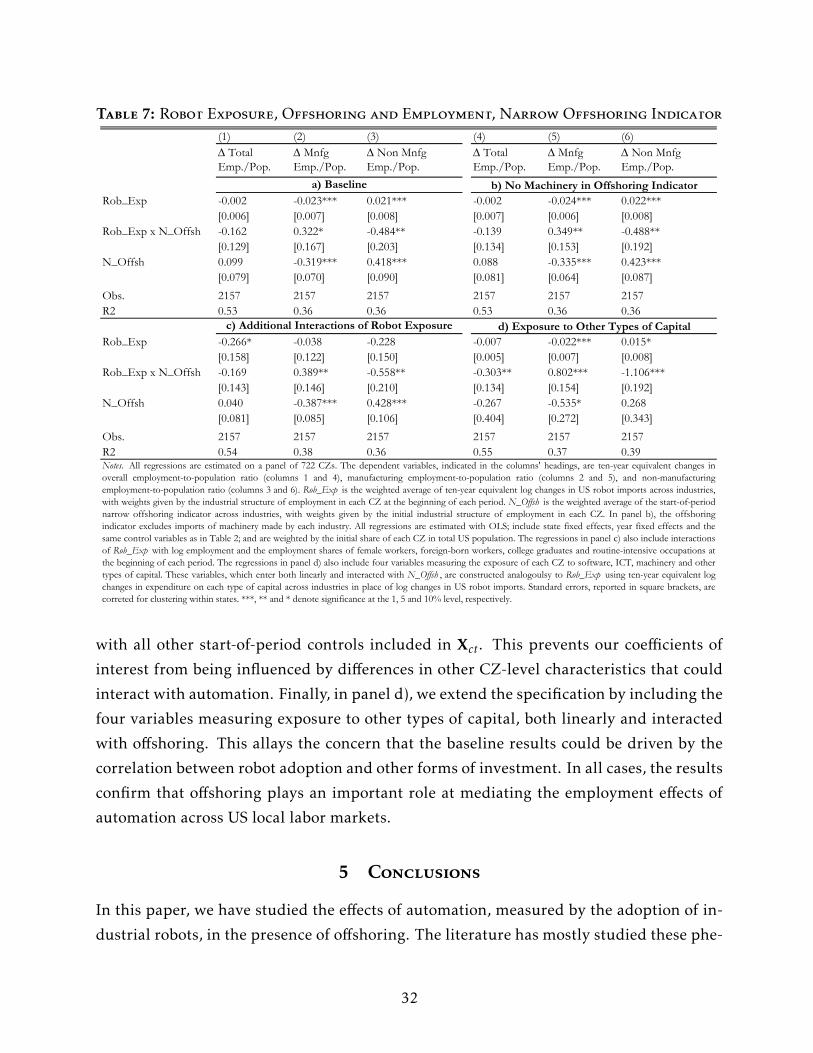
Table 7: Robot Exposure, Offshoring and Employment, Narrow Offshoring Indicator
(1) (2) (3) (4) (5) (6)D Total Emp./Pop.
D Mnfg Emp./Pop.
D Non Mnfg Emp./Pop.
D Total Emp./Pop.
D Mnfg Emp./Pop.
D Non Mnfg Emp./Pop.
Rob_Exp -0.002 -0.023*** 0.021*** -0.002 -0.024*** 0.022***[0.006] [0.007] [0.008] [0.007] [0.006] [0.008]
Rob_Exp x N_Offsh -0.162 0.322* -0.484** -0.139 0.349** -0.488**[0.129] [0.167] [0.203] [0.134] [0.153] [0.192]
N_Offsh 0.099 -0.319*** 0.418*** 0.088 -0.335*** 0.423***[0.079] [0.070] [0.090] [0.081] [0.064] [0.087]
Obs. 2157 2157 2157 2157 2157 2157R2 0.53 0.36 0.36 0.53 0.36 0.36
Rob_Exp -0.266* -0.038 -0.228 -0.007 -0.022*** 0.015*[0.158] [0.122] [0.150] [0.005] [0.007] [0.008]
Rob_Exp x N_Offsh -0.169 0.389** -0.558** -0.303** 0.802*** -1.106***[0.143] [0.146] [0.210] [0.134] [0.154] [0.192]
N_Offsh 0.040 -0.387*** 0.428*** -0.267 -0.535* 0.268[0.081] [0.085] [0.106] [0.404] [0.272] [0.343]
Obs. 2157 2157 2157 2157 2157 2157R2 0.54 0.38 0.36 0.55 0.37 0.39Notes. All regressions are estimated on a panel of 722 CZs. The dependent variables, indicated in the columns' headings, are ten-year equivalent changes inoverall employment-to-population ratio (columns 1 and 4), manufacturing employment-to-population ratio (columns 2 and 5), and non-manufacturingemployment-to-population ratio (columns 3 and 6). Rob_Exp is the weighted average of ten-year equivalent log changes in US robot imports across industries,with weights given by the industrial structure of employment in each CZ at the beginning of each period. N_Offsh is the weighted average of the start-of-periodnarrow offshoring indicator across industries, with weights given by the initial industrial structure of employment in each CZ. In panel b), the offshoringindicator excludes imports of machinery made by each industry. All regressions are estimated with OLS; include state fixed effects, year fixed effects and thesame control variables as in Table 2; and are weighted by the initial share of each CZ in total US population. The regressions in panel c) also include interactionsof Rob_Exp with log employment and the employment shares of female workers, foreign-born workers, college graduates and routine-intensive occupations atthe beginning of each period. The regressions in panel d) also include four variables measuring the exposure of each CZ to software, ICT, machinery and othertypes of capital. These variables, which enter both linearly and interacted with N_Offsh , are constructed analogoulsy to Rob_Exp using ten-year equivalent logchanges in expenditure on each type of capital across industries in place of log changes in US robot imports. Standard errors, reported in square brackets, arecorreted for clustering within states. ***, ** and * denote significance at the 1, 5 and 10% level, respectively.
a) Baseline b) No Machinery in Offshoring Indicator
c) Additional Interactions of Robot Exposure d) Exposure to Other Types of Capital
with all other start-of-period controls included in Xct. This prevents our coefficients of
interest from being influenced by differences in other CZ-level characteristics that could
interact with automation. Finally, in panel d), we extend the specification by including the
four variables measuring exposure to other types of capital, both linearly and interacted
with offshoring. This allays the concern that the baseline results could be driven by the
correlation between robot adoption and other forms of investment. In all cases, the results
confirm that offshoring plays an important role at mediating the employment effects of
automation across US local labor markets.
5 Conclusions
In this paper, we have studied the effects of automation, measured by the adoption of in-
dustrial robots, in the presence of offshoring. The literature has mostly studied these phe-
32

nomena in isolation. This is unfortunate, because what we have shown is that offshoring
can change the impact of automation in important ways. In particular, when robots affect
differentially domestically-produced and foreign-sourced tasks, automation has terms-of-
trade effects that redistribute income across countries. This has important implications.
While automation replacing foreign workers is necessarily welfare improving for the do-
mestic economy, automation replacing domestically-produced tasks can lower the real
wage of domestic workers through a deterioration of the terms of trade.
These results underscore the importance of identifying which workers are in more di-
rect competition with robots and motivate the empirical analysis conducted in the paper.
Using US data across industries, occupations and local labor markets, we have studied
the interaction between automation and offshoring over the 1990-2015 period. Our re-
sults suggest that industrial robots displace US workers from manufacturing industries,
but that the effect is weaker in CZs that are more exposed to offshoring. We also found
that industrial robots lower the incidence of offshoring, and that their negative employ-
ment effects are concentrated in occupations performing tasks that are classified as non
offshorable. These results are consistent with the view that automation contributes to the
reshoring of economic activity, which in turn tends to mitigate any adverse labor market
effects for US workers.
We conclude by discussing some limitations and possible extensions of our analysis.
The empirical findings in this paper are based entirely on US data. However, we consider
equally important to study the effect of US automation on low-wage countries. Consistent
with our results, some papers tend to find negative effects on labor market outcomes in
the developing world (see, for instance, Faber, 2020, Artuc, Christiaensen and Winkler,
2019, Stemmler, 2019, Kugler et al. 2020). Yet, it would be desirable to combine data
across countries to directly identify the terms-of-trade effect of automation. We view this
as an interesting direction for future research.
From a normative perspective, the result that automation is likely to redistribute in-
come across countries implies that policy makers may have an incentive to promote the
adoption of technologies that lower the dependence on foreign inputs. Such an effort can,
however, lead to an inefficient equilibrium with excessive automation and too little trade.
In fact, we speculate that foreign competition may even be the trigger for the adoption
of policies aiming at self-sufficiency. Exploring this scenario and possible remedies goes
beyond the scope of this paper, but seems another important and interesting avenue for
future research.
33
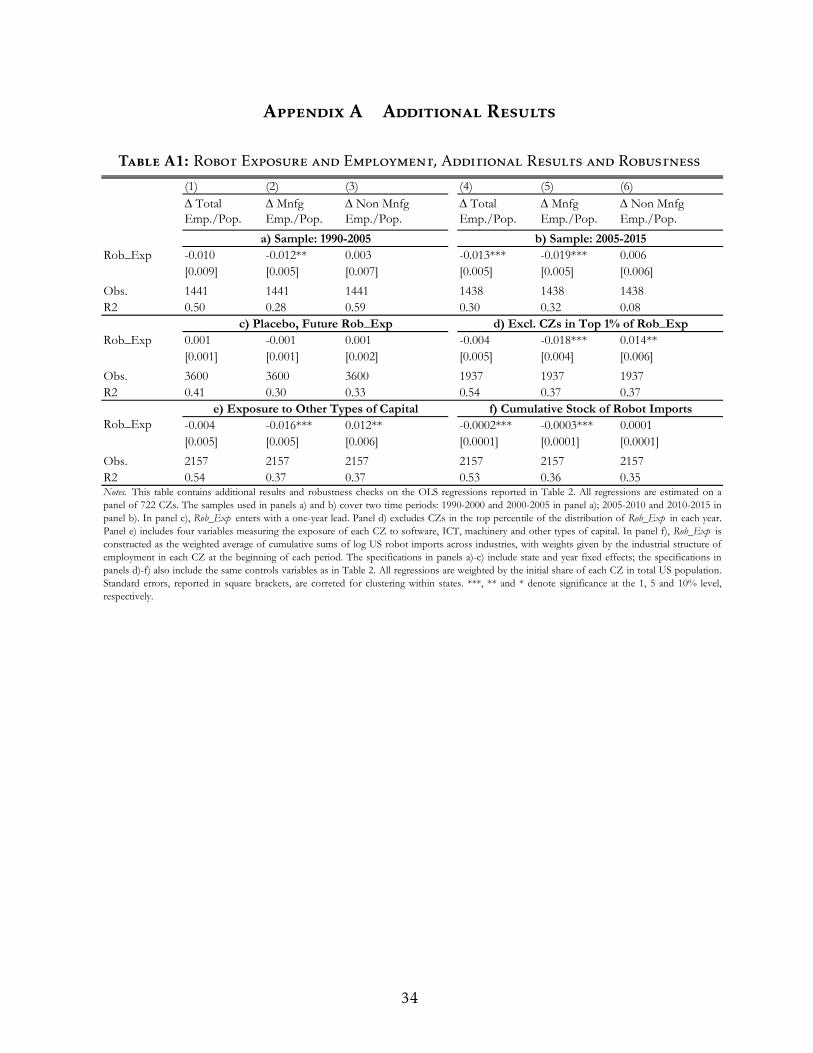
Appendix A Additional Results
Table A1: Robot Exposure and Employment, Additional Results and Robustness
(1) (2) (3) (4) (5) (6)D Total Emp./Pop.
D Mnfg Emp./Pop.
D Non Mnfg Emp./Pop.
D Total Emp./Pop.
D Mnfg Emp./Pop.
D Non Mnfg Emp./Pop.
Rob_Exp -0.010 -0.012** 0.003 -0.013*** -0.019*** 0.006[0.009] [0.005] [0.007] [0.005] [0.005] [0.006]
Obs. 1441 1441 1441 1438 1438 1438R2 0.50 0.28 0.59 0.30 0.32 0.08
Rob_Exp 0.001 -0.001 0.001 -0.004 -0.018*** 0.014**[0.001] [0.001] [0.002] [0.005] [0.004] [0.006]
Obs. 3600 3600 3600 1937 1937 1937R2 0.41 0.30 0.33 0.54 0.37 0.37
-0.004 -0.016*** 0.012** -0.0002*** -0.0003*** 0.0001[0.005] [0.005] [0.006] [0.0001] [0.0001] [0.0001]
Obs. 2157 2157 2157 2157 2157 2157R2 0.54 0.37 0.37 0.53 0.36 0.35Notes. This table contains additional results and robustness checks on the OLS regressions reported in Table 2. All regressions are estimated on apanel of 722 CZs. The samples used in panels a) and b) cover two time periods: 1990-2000 and 2000-2005 in panel a); 2005-2010 and 2010-2015 inpanel b). In panel c), Rob_Exp enters with a one-year lead. Panel d) excludes CZs in the top percentile of the distribution of Rob_Exp in each year.Panel e) includes four variables measuring the exposure of each CZ to software, ICT, machinery and other types of capital. In panel f), Rob_Exp isconstructed as the weighted average of cumulative sums of log US robot imports across industries, with weights given by the industrial structure ofemployment in each CZ at the beginning of each period. The specifications in panels a)-c) include state and year fixed effects; the specifications inpanels d)-f) also include the same controls variables as in Table 2. All regressions are weighted by the initial share of each CZ in total US population.Standard errors, reported in square brackets, are correted for clustering within states. ***, ** and * denote significance at the 1, 5 and 10% level,respectively.
Rob_Exp
a) Sample: 1990-2005
d) Excl. CZs in Top 1% of Rob_Exp
b) Sample: 2005-2015
c) Placebo, Future Rob_Exp
e) Exposure to Other Types of Capital f) Cumulative Stock of Robot Imports
34

References
[1] Acemoglu, Daron, Gino Gancia and Fabrizio Zilibotti (2015). “Offshoring and Di-rected Technical Change,” American Economic Journal: Macroeconomics, 7(3):84-122.
[2] Acemoglu, Daron, Claire Lelarge and Pascual Restrepo (2020). “Competing withRobots: Firm-Level Evidence from France,” American Economic Review, Papers andProceedings, forthcoming.
[3] Acemoglu, Daron and Pascual Restrepo (2018). “The Race Between Man and Ma-chine: Implications of Technology for Growth, Factor Shares and Employment.”American Economic Review, 108(6):1488–1542.
[4] Acemoglu, Daron and Pascual Restrepo (2019). “Robots and Jobs: Evidence from theUS Labor Markets,” Journal of Political Economy, forthcoming.
[5] Acemoglu, Daron and Pascual Restrepo (2020). “Demographics and Automation,”Review of Economic Studies, forthcoming.
[6] Aghion, Philippe, Celine Antonin, Simon Bunel, and Xavier Jaravel (2019). “WhatIs the Impact of Automation on Employment? New Evidence from France,” CEPRDiscussion Paper 14443.
[7] Artuc, Erhan, Paulo Bastos and Bob Rijkers (2018). “Robots, Tasks and Trade” WorldBank Policy Research Working Paper 8674
[8] Artuc, Erhan, Luc Christiaensen and Hernan Winkler (2019). “Does Automation inRich Countries Hurt Developing Ones? Evidence from the U.S. and Mexico,” workingpaper.
[9] Autor, David and David Dorn (2013). “The Growth of Low Skill Service Jobs andthe Polarization of the U.S. Labor Market,” American Economic Review, 103(5), 1553-1597.
[10] Autor, David, David Dorn and Gordon Hanson (2013). “The China Syndrome: LocalLabor Market Effects of Import Competition in the United States,” American Eco-nomic Review, 103(6), 2121-2168.
[11] Baldwin, Richard (2019). The Globotics Upheaval: Globalisation, Robotics and theFuture of Work. Oxford University Press.
[12] Blanas, Sotiris, Gino Gancia, and Sang Yoon (Tim) Lee (2019), “Who is Afraid ofMachines?” Economic Policy, 34(100), 627–690.
[13] Blinder, Alan (2009). “How Many U.S. Jobs Might Be Offshorable,” World Economics,10(2), 41-78.
[14] Blinder, Alan and Alan Krueger (2013). “Alternative Measures of Offshorability: ASurvey Approach,” Journal of Labor Economics, 31(2), S97-S128.
35

[15] Bonfiglioli, Alessandra, Rosario Crino, Harald Fadinger and Gino Gancia (2020).“Robot Imports and Firm-Level Outcomes, ” CEPR Discussion Paper 14593.
[16] Carbonero, Francesco, Ekkehard Ernst and Enzo Weber (2018). “Robots worldwide:The impact of automation on employment and trade,” ILO Working Paper No. 36.
[17] Crino, Rosario (2010). “Service Offshoring and White-Collar Employment,” Reviewof Economic Studies, 77(2): 595–632.
[18] De Backer, Koen, Timothy DeStefano, Carlo Menon and Jung Ran Suh (2018). “In-dustrial Robotics and the Global Organisation of Production,” OECD Science, Tech-nology and Industry Working Papers 2018/03.
[19] Faber, Marius (2020). “Robots and Reshoring: Evidence from Mexican Labor Mar-kets,” Journal of International Economics, 127.
[20] Feenstra, Robert and Gordon Hanson (1999). “The Impact of Outsourcing and High-Technology Capital on Wages: Estimates for the U.S., 1972-1990,” Quarterly Journalof Economics, 114(3), 907-940.
[21] Firpo, Sergio, Nicole M. Fortin and Thomas Lemieux (2011). “Occupational Tasksand Changes in the Wage Structure,” IZA DP No. 5542.
[22] Graetz, Georg and Guy Michaels (2018). “Robots at Work,” Review of Economics andStatistics 100(5): 753–68.
[23] Grossman, Gene and Esteban Rossi-Hansberg (2008). “Trading Tasks: A Simple The-ory of Offshoring,” American Economic Review, 98 (5): 1978-97.
[24] Hallward-Driemeier, Mary and Gaurav Nayyar (2019). “Have Robots Grounded theFlying Geese? Evidence from Greenfield FDI in Manufacturing,” World Bank PolicyResearch Working Paper 9097.
[25] Hemous, David and Morten Olsen (2020). “The Rise of the Machines: Automation,Horizontal Innovation and Income Inequality,” American Economic Journal: Macroe-conomics, forthcoming.
[26] Humlum, Anders (2019). “Robot Adoption and Labor Market Dynamics,” workingpaper.
[27] Krenz, Astrid, Klaus Prettner and Holger Strulik (2020). “Robots, Reshoring, and theLot of Low-Skilled Workers,” GLO Discussion Paper No. 443.
[28] Kugler, Adriana D., Maurice Kugler, Laura Ripani and Rodimiro Rodrigo (2020).“The Impacts of U.S. Robots on Employment in the Tropics: Evidence from Colom-bia,” NBER Working Paper No. 28034.
[29] Rodriguez-Clare, Andres (2010). “Offshoring in a Ricardian World,” American Eco-nomic Journal: Macroeconomics, 2(2), 227-258.
36

[30] Schott, Peter (2008). “The Relative Sophistication of Chinese Exports,” Economic Pol-icy, 23, 6–49.
[31] Stapleton, Katherine and Michael Webb (2020). “Automation, trade and multina-tional activity: Micro evidence from Spain,” CSAE Working Paper WPS/202016.
[32] Stemmler, Henry (2019). “Does automation lead to de-industrialization in emergingeconomies? Evidence from Brazil,” cege Discussion Papers, No. 382.
[33] Timmer, Marcel P., Erik Dietzenbacher, Bart Los, Robert Stehrer and Gaaitzen J. deVries (2015). “An Illustrated User Guide to the World Input–Output Database: theCase of Global Automotive Production,” Review of International Economics, 23(3),575-605.
[34] Tolbert Charles M. and Molly Sizer (1996). “U.S. Commuting Zones and Labor Mar-ket Areas: A 1990 Update,” Staff Reports 278812, United States Department of Agri-culture, Economic Research Service.
[35] Walmart (2016). “An ambitious plan to bring manufacturing back home.”https://www.cnbc.com/advertorial/2016/10/19/an-ambitious-plan-to-bring-manufacturing-back-home.html.
[36] Zeira, Joseph (1998). “Workers, Machines, And Economic Growth,” Quarterly Journalof Economics, 113(4), 1091–1117.
37