Robert P. Hartwig, Ph.D., CPCU Executive Vice President & Chief Economist Insurance Information...
33
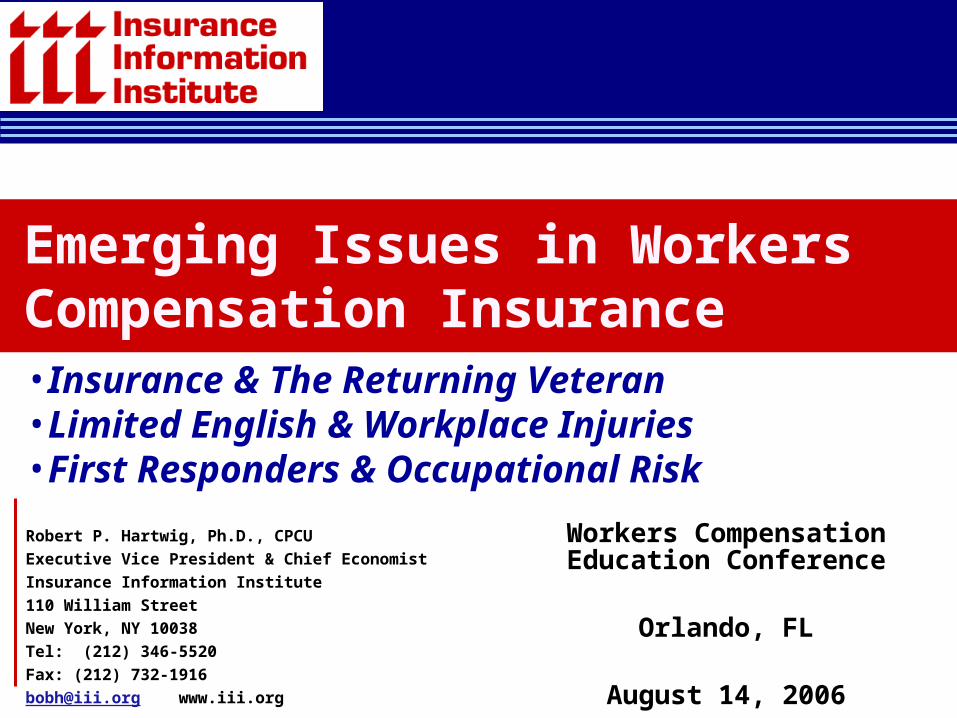
Robert P. Hartwig, Ph.D., CPCU Executive Vice President & Chief Economist Insurance Information Institute 110 William Street New York, NY 10038 Tel: (212) 346-5520 Fax: (212) 732-1916 [email protected] www.iii.org Emerging Issues in Workers Compensation Insurance Workers Compensation Education Conference Orlando, FL August 14, 2006 •Insurance & The Returning Veteran •Limited English & Workplace Injuries •First Responders & Occupational Risk
-
Upload
aubrey-perry -
Category
Documents
-
view
222 -
download
0
Transcript of Robert P. Hartwig, Ph.D., CPCU Executive Vice President & Chief Economist Insurance Information...
Robert P. Hartwig, Ph.D., CPCU
Executive Vice President & Chief Economist
Insurance Information Institute
110 William Street
New York, NY 10038
Tel: (212) 346-5520
Fax: (212) 732-1916
[email protected] www.iii.org
Emerging Issues in Workers Compensation Insurance
Workers Compensation Education Conference
Orlando, FL
August 14, 2006
•Insurance & The Returning Veteran•Limited English & Workplace Injuries•First Responders & Occupational Risk

Presentation Outline
• Limited English & Undocumented
Workers and Workers Compensation
• First Responders
• Emerging Latent Risk Exposure?
• The Returning Veteran & WC• Journal of Workers Compensation, Fall 2006

INSURANCE INFORMATION INSTITUTE
LIMITED ENGLISH & UNDOCUMENTED WORKERS
Above Average Risk for Occupational Injury & Death
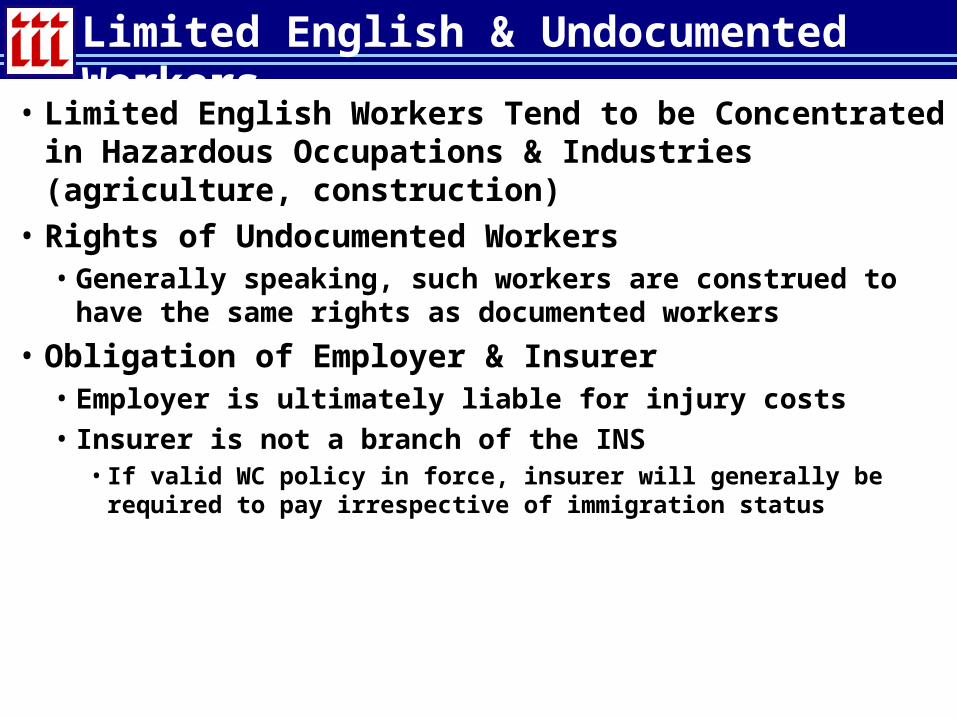
Limited English & Undocumented Workers
• Limited English Workers Tend to be Concentrated in Hazardous Occupations & Industries (agriculture, construction)
• Rights of Undocumented Workers• Generally speaking, such workers are construed to have the
same rights as documented workers
• Obligation of Employer & Insurer• Employer is ultimately liable for injury costs• Insurer is not a branch of the INS
• If valid WC policy in force, insurer will generally be required to pay irrespective of immigration status
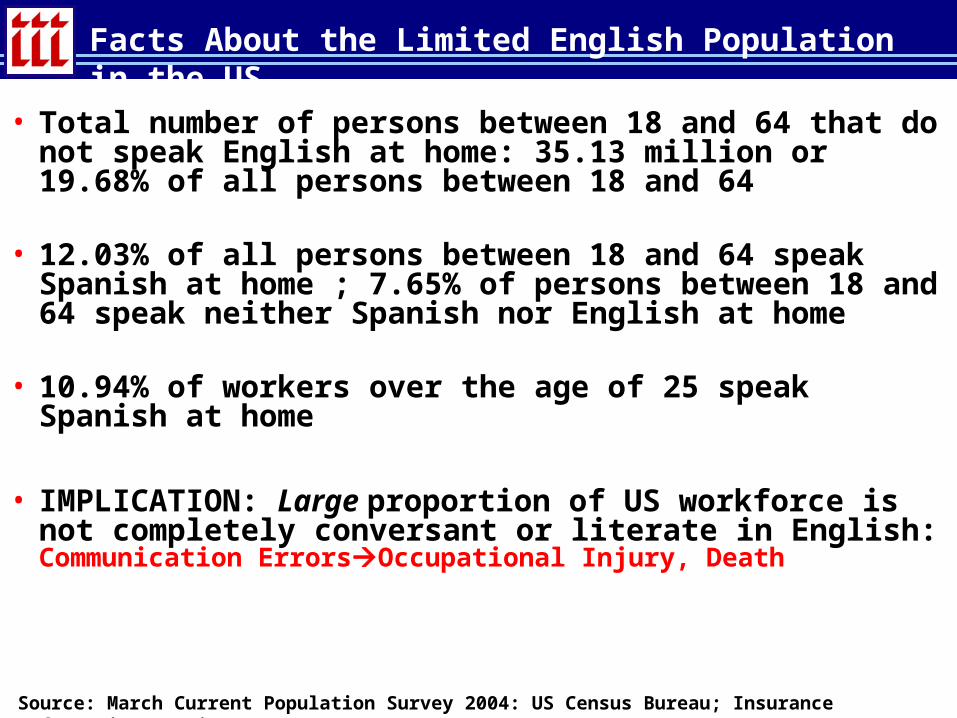
Facts About the Limited English Population in the US
• Total number of persons between 18 and 64 that do not speak English at home: 35.13 million or 19.68% of all persons between 18 and 64
• 12.03% of all persons between 18 and 64 speak Spanish at home ; 7.65% of persons between 18 and 64 speak neither Spanish nor English at home
• 10.94% of workers over the age of 25 speak Spanish at home
• IMPLICATION: Large proportion of US workforce is not completely conversant or literate in English: Communication ErrorsOccupational Injury, Death
Source: March Current Population Survey 2004: US Census Bureau; Insurance Information Institute.
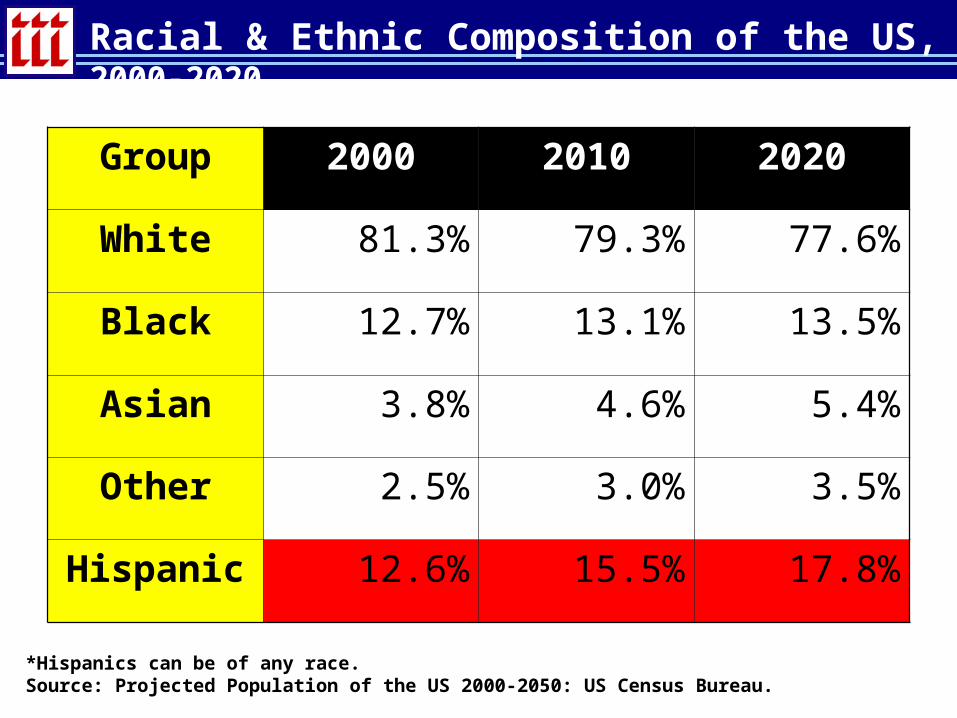
Racial & Ethnic Composition of the US, 2000-2020
Group 2000 2010 2020
White 81.3% 79.3% 77.6%
Black 12.7% 13.1% 13.5%
Asian 3.8% 4.6% 5.4%
Other 2.5% 3.0% 3.5%
Hispanic 12.6% 15.5% 17.8%
*Hispanics can be of any race.Source: Projected Population of the US 2000-2050: US Census Bureau.

Educational Attainment by Race and Ethnicity, 2004
Group
No High School
High School
Some College
College or More
White, Non-Latino 10.0% 32.8% 26.3% 30.7%
Black, Non-Latino 19.3% 36.0% 27.0% 17.7%
Asian 13.2% 19.7% 17.5% 49.4%
Latino 41.6% 27.6% 18.6% 12.0%
Source: Table 10, Educational Attainment of Population Over 25 Years by Race, Sex, Citizenship; US Census Bureau.
Low levels of education attainment among Latino populations associated with Latino
over-representation in low wage, high risk jobs
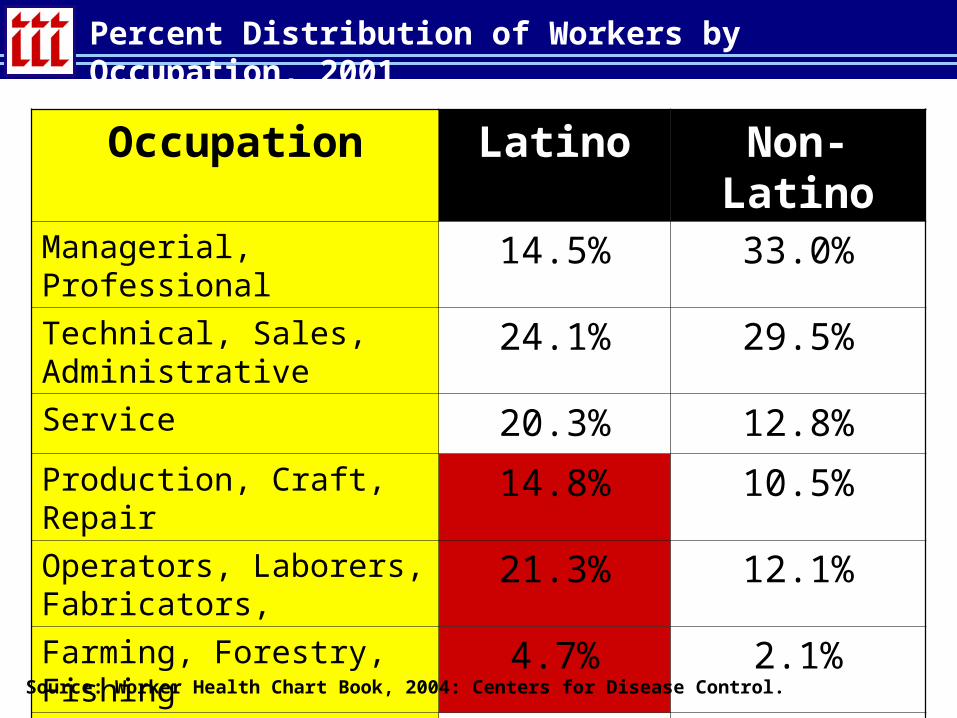
Percent Distribution of Workers by Occupation, 2001
Occupation Latino Non-LatinoManagerial, Professional 14.5% 33.0%
Technical, Sales, Administrative
24.1% 29.5%
Service 20.3% 12.8%
Production, Craft, Repair 14.8% 10.5%
Operators, Laborers, Fabricators,
21.3% 12.1%
Farming, Forestry, Fishing 4.7% 2.1%Total 10.9% 89.1%
Source: Worker Health Chart Book, 2004: Centers for Disease Control.

Fatal Worker Injury Rates by Race and Ethnicity, 2002*
3.80
2.97
4.78
2.32
0.00.51.01.52.02.53.03.54.04.55.0
White, Non-Latino
Black Latino Asian
Source: Worker Health Chart Book, 2004: Centers for Disease Control and III calculations.
Latino workers experience highest
rate of fatal injuries on the job, 25% more
than whites, 61% more than blacks and more than double the
rate for Asians
Fatality Rate per 100,000 Workers Employed

742810
1091
420
0
200
400
600
800
1000
1200
White, Non-Latino
Black Latino Asian
Source: Worker Health Chart Book, 2004: Centers for Disease Control and III calculations.
Latino workers experience highest rate of non-fatal
injuries on the job as well; 46% more than
whites, 34% more than blacks and 150%
the rate for Asians
Injury Rate per 100,000 Workers Employed
Non-Fatal Worker Injury Rates by Race and Ethnicity, 2002
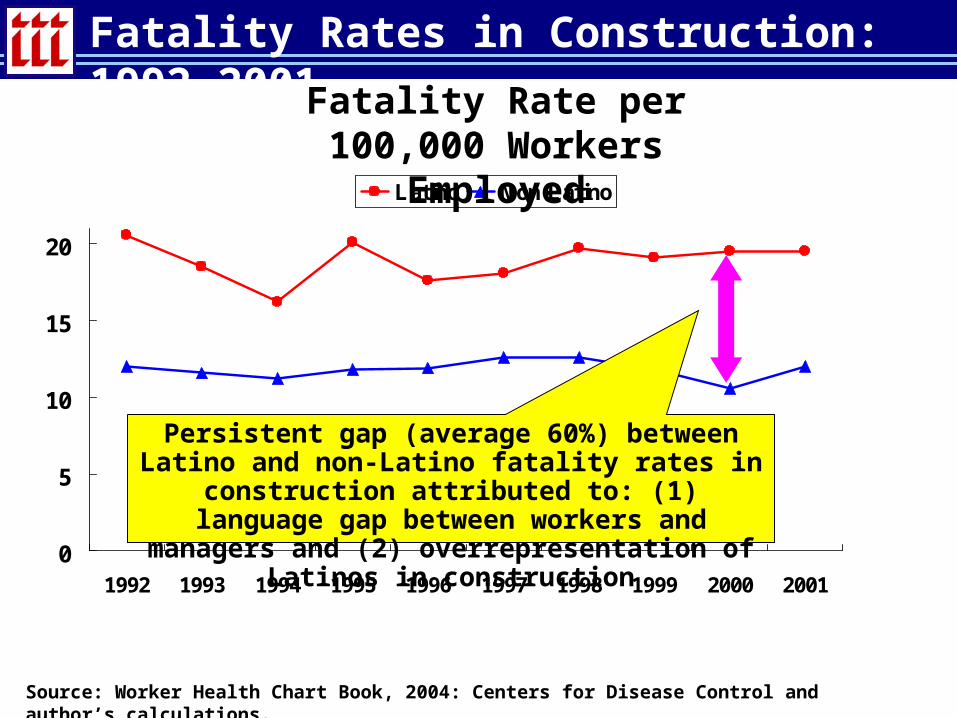
Fatality Rates in Construction: 1992-2001
0
5
10
15
20
1992 1993 1994 1995 1996 1997 1998 1999 2000 2001
Latino Non-Latino
Source: Worker Health Chart Book, 2004: Centers for Disease Control and author’s calculations.
Persistent gap (average 60%) between Latino and non-Latino fatality rates in construction attributed to: (1) language gap between workers and managers and (2)
overrepresentation of Latinos in construction
Fatality Rate per 100,000 Workers Employed
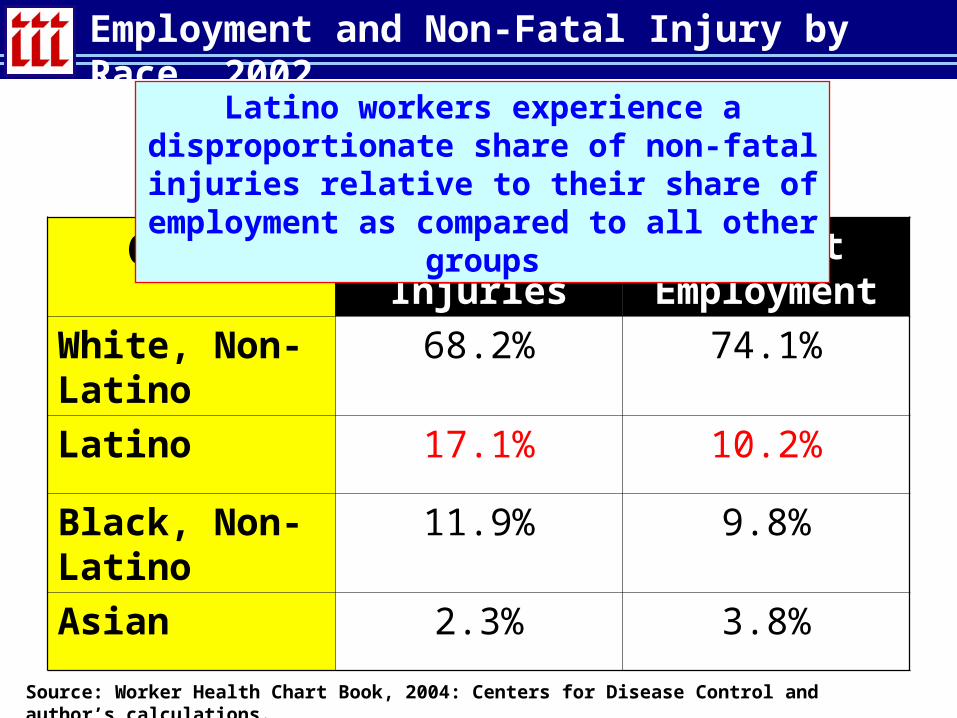
Employment and Non-Fatal Injury by Race, 2002
Group Percent of Injuries
Percent Employment
White, Non-Latino
68.2% 74.1%
Latino 17.1% 10.2%
Black, Non-Latino
11.9% 9.8%
Asian 2.3% 3.8%
Source: Worker Health Chart Book, 2004: Centers for Disease Control and author’s calculations.
Latino workers experience a disproportionate share of non-fatal injuries relative to their share of employment as compared to all other groups
A Look Ahead…
• Rapid rise in Latino population over the next decade (including a substantial share of undocumented workers) suggests increasing worker injury and death in industries where Latinos are over-represented.
• Shift of Latino populations to lower risk jobs due to improvements in educational attainment will reduce Latino workplace injury and deaths rates.

INSURANCE INFORMATION INSTITUTE
FIRST RESPONDERSLatent Illnesses & Disease are an Emerging
Workers Compensation Issue

Health Effects of 9/11 First Responders
• In the wake of 9/11, there is growing concern about the health effects of exposures sustained by First Responders
• WTC First Responders exposed to physical hazards and environmental toxins:
• 10,000 Fire Department of New York personnel• 30,000 other works and volunteers
• CDC’s National Institute for Occupational Safety and Health has evaluated more than 10,000 workers and volunteers
• Many participants experienced lower and upper respiratory symptoms
• Recent Death of 9/11 Responder Determined to be from 9/11 Exposure (a first)
Source: National Institute for Occupational Safety and Health

Insured Loss Estimates: Large CNBR Terrorist Attack ($B)
Type of Coverage New York WashingtonSan
FranciscoDes
Moines
Group Life $82.0 $22.5 $21.5 $3.4
General Liability 14.4 2.9 3.2 0.4
Workers Comp 483.7 126.7 87.5 31.4
Residential Prop. 38.7 12.7 22.6 2.6
Commercial Prop. 158.3 31.5 35.5 4.1
Auto 1.0 0.6 0.8 0.4
TOTAL $778.1 $196.8 $171.2 $42.3
Source: American Academy of Actuaries, Response to President’s Working Group, Appendix II, April 26, 2006.

Empirical Health Studies of WTC First Responders
Male 91%
Female 9%
Non-Hispanic Whites
58%
Hispanics
15%
Other16%
Non-Hispanic Blacks
11%
Source: JAMA, October 2004
First Responders are predominantly male and non-Hispanic white
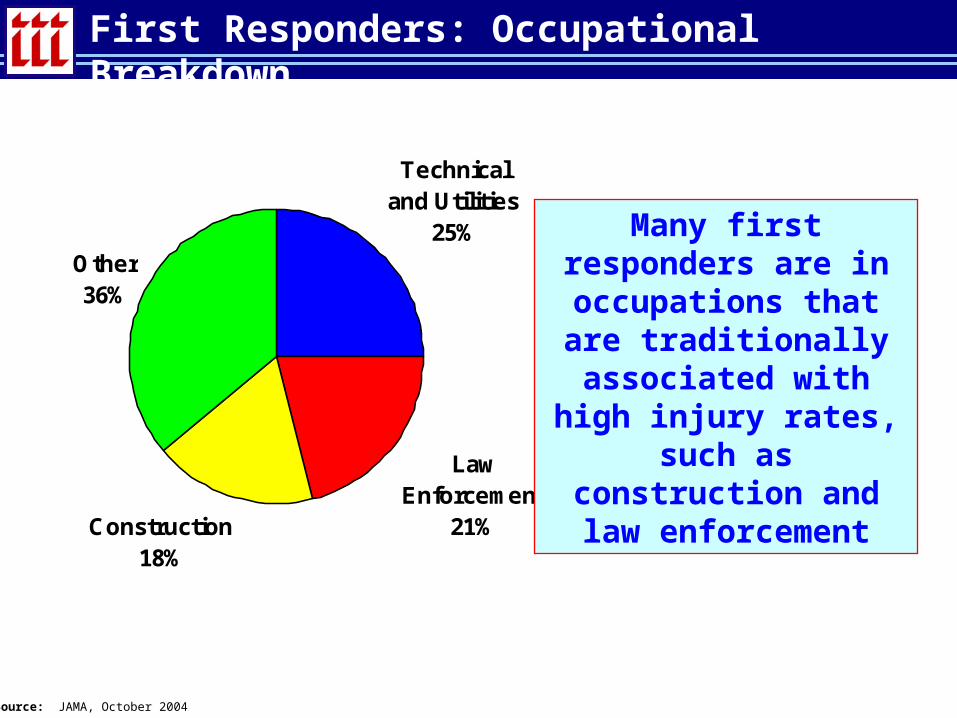
First Responders: Occupational Breakdown
Technical and Utilities
25%
Law Enforcement
21%Construction18%
Other36%
Source: JAMA, October 2004
Many first responders are in occupations that are traditionally associated with high injury rates,
such as construction and law enforcement
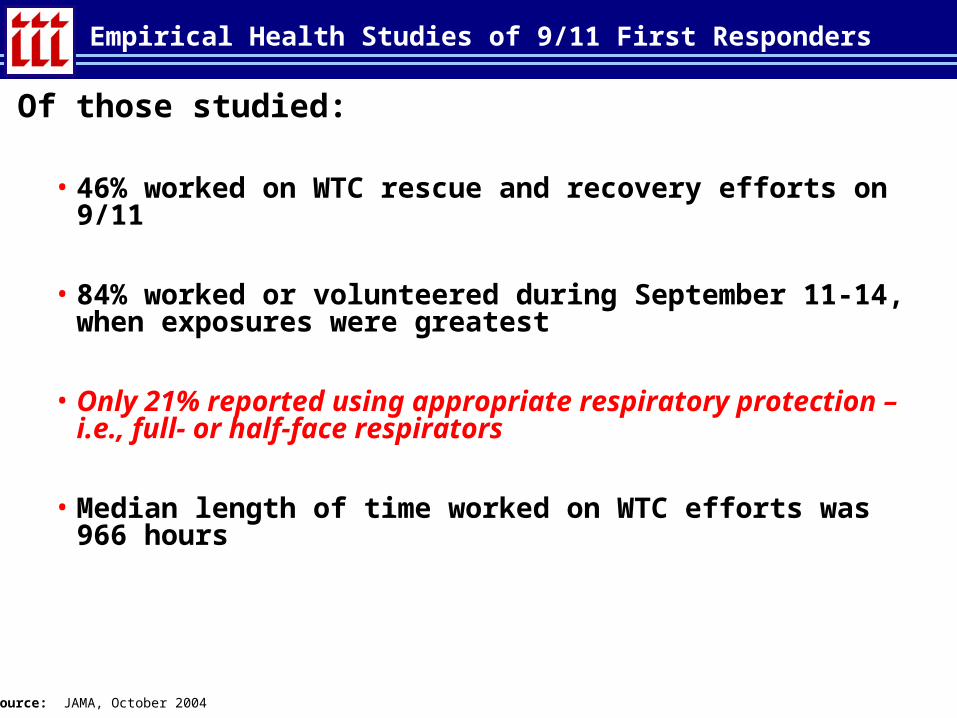
Empirical Health Studies of 9/11 First Responders
Of those studied:
• 46% worked on WTC rescue and recovery efforts on 9/11
• 84% worked or volunteered during September 11-14, when exposures were greatest
• Only 21% reported using appropriate respiratory protection – i.e., full- or half-face respirators
• Median length of time worked on WTC efforts was 966 hours
Source: JAMA, October 2004
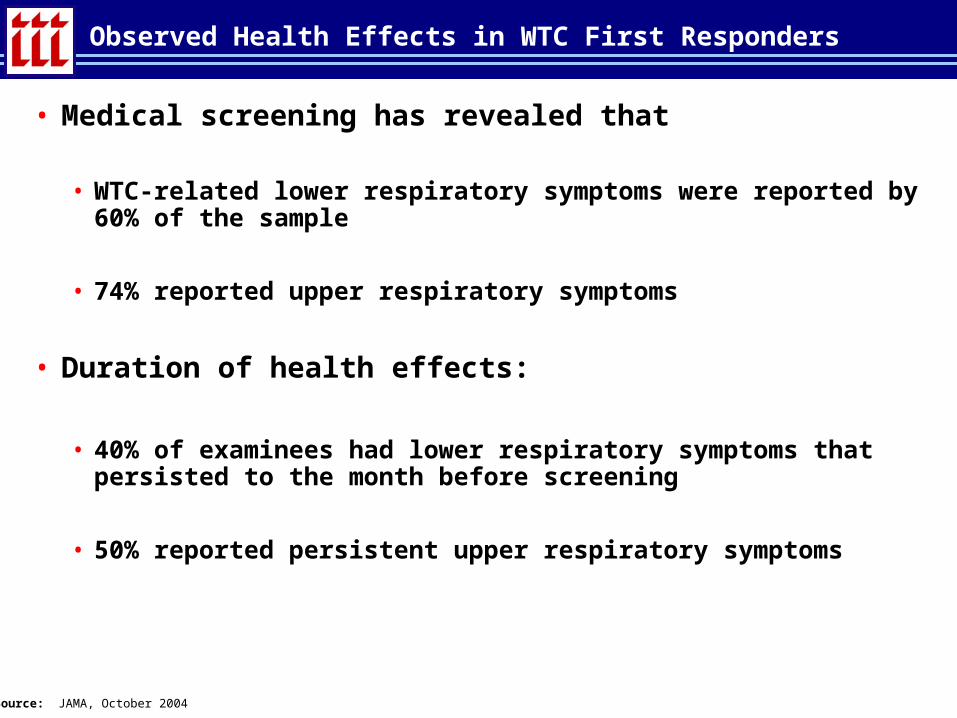
Observed Health Effects in WTC First Responders
• Medical screening has revealed that
• WTC-related lower respiratory symptoms were reported by 60% of the sample
• 74% reported upper respiratory symptoms
• Duration of health effects:
• 40% of examinees had lower respiratory symptoms that persisted to the month before screening
• 50% reported persistent upper respiratory symptoms
Source: JAMA, October 2004

Other Observed Health Effects for WTC First Responders
First Responders also experienced numerous other health-related symptoms:
• Lower back pain (16%)
• Upper extremity pain (16%)
• Lower extremity pain (13%)
• Heartburn (15%)
• Eye irritation (14%)
• Frequent headaches (13%)
Source: JAMA, October 2004

INSURANCE INFORMATION INSTITUTE
RETURNING VETERANSInsurance Issues Associated with the
Reintegration of Military Veterans to the Workplace
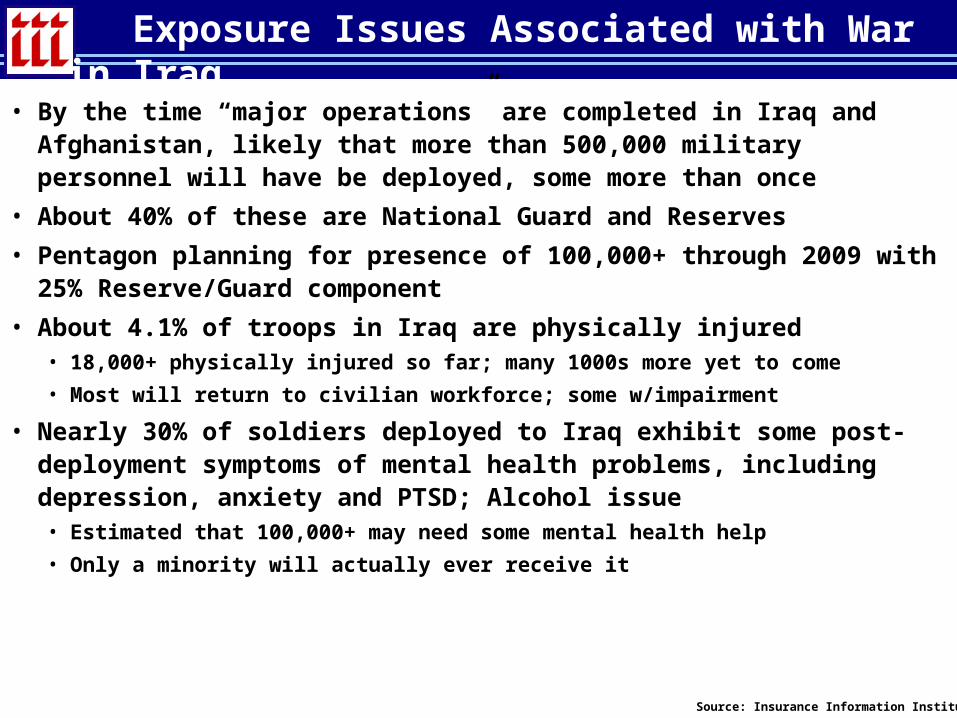
Exposure Issues Associated with War in Iraq
• By the time “major operations” are completed in Iraq and Afghanistan, likely that more than 500,000 military personnel will have be deployed, some more than once
• About 40% of these are National Guard and Reserves
• Pentagon planning for presence of 100,000+ through 2009 with 25% Reserve/Guard component
• About 4.1% of troops in Iraq are physically injured• 18,000+ physically injured so far; many 1000s more yet to come
• Most will return to civilian workforce; some w/impairment
• Nearly 30% of soldiers deployed to Iraq exhibit some post-deployment symptoms of mental health problems, including depression, anxiety and PTSD; Alcohol issue• Estimated that 100,000+ may need some mental health help
• Only a minority will actually ever receive it
Source: Insurance Information Institute
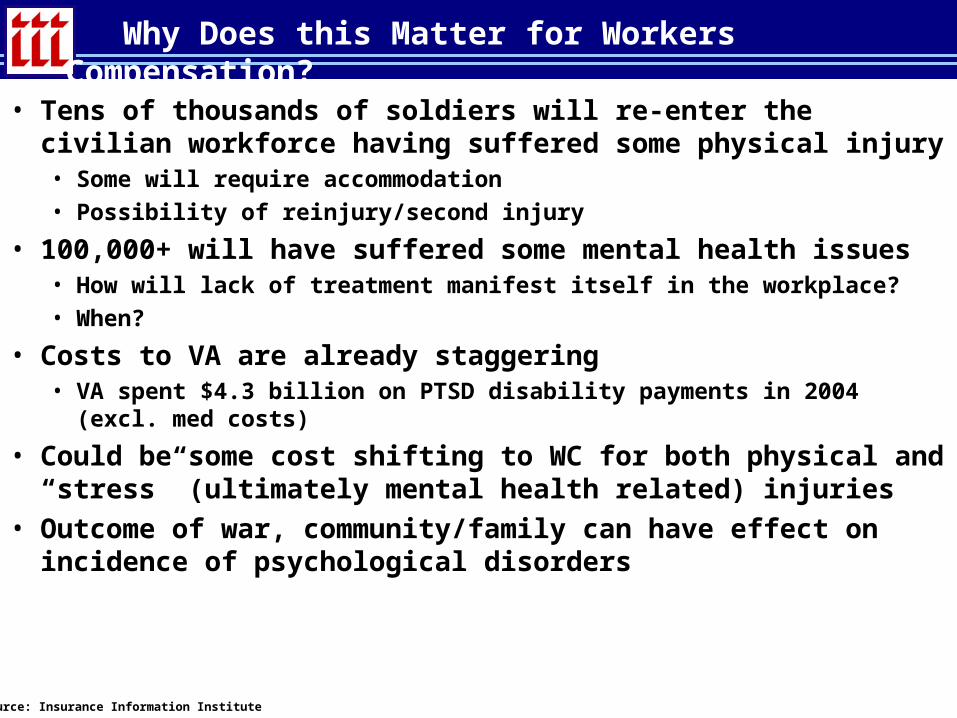
Why Does this Matter for Workers Compensation?
• Tens of thousands of soldiers will re-enter the civilian workforce having suffered some physical injury• Some will require accommodation• Possibility of reinjury/second injury
• 100,000+ will have suffered some mental health issues• How will lack of treatment manifest itself in the workplace?• When?
• Costs to VA are already staggering• VA spent $4.3 billion on PTSD disability payments in 2004 (excl. med
costs)
• Could be some cost shifting to WC for both physical and “stress” (ultimately mental health related) injuries
• Outcome of war, community/family can have effect on incidence of psychological disorders
Source: Insurance Information Institute
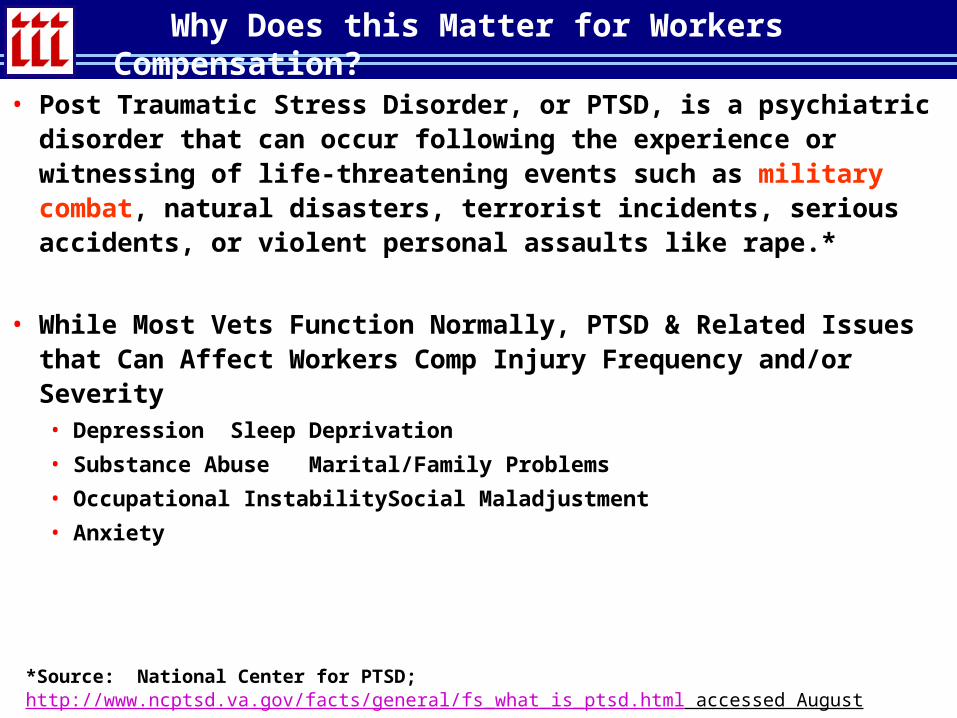
Why Does this Matter for Workers Compensation?
• Post Traumatic Stress Disorder, or PTSD, is a psychiatric disorder that can occur following the experience or witnessing of life-threatening events such as military combat, natural disasters, terrorist incidents, serious accidents, or violent personal assaults like rape.*
• While Most Vets Function Normally, PTSD & Related Issues that Can Affect Workers Comp Injury Frequency and/or Severity• Depression Sleep Deprivation
• Substance Abuse Marital/Family Problems
• Occupational Instability Social Maladjustment
• Anxiety
*Source: National Center for PTSD; http://www.ncptsd.va.gov/facts/general/fs_what_is_ptsd.html accessed August 20, 2005.
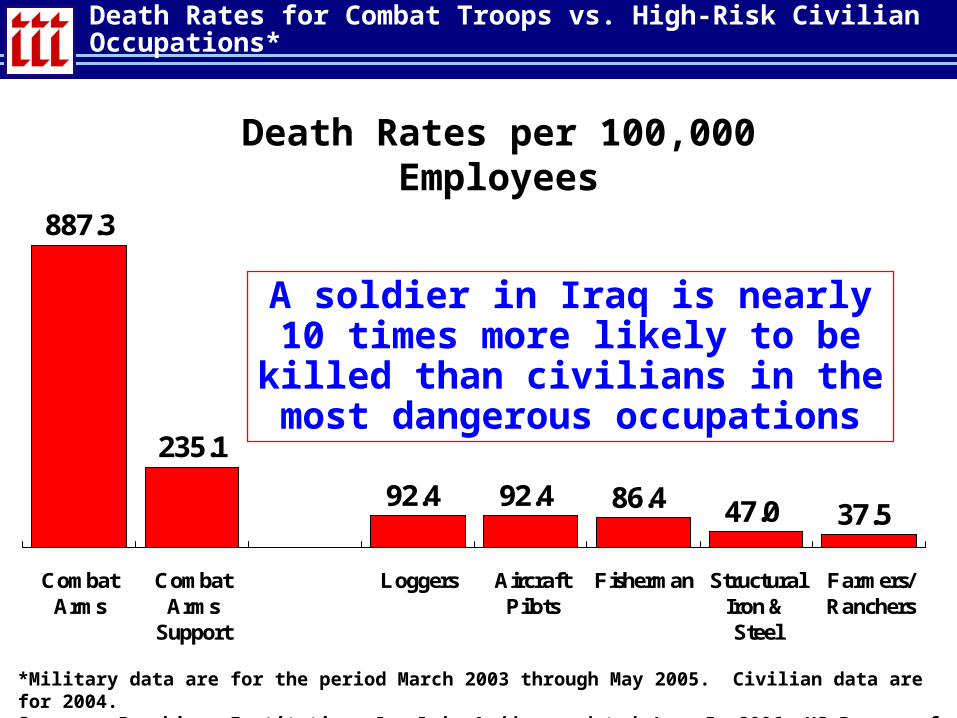
Death Rates for Combat Troops vs. High-Risk Civilian Occupations*
887.3
235.1
92.4 92.4 86.4 47.0 37.5
CombatArms
CombatArms
Support
Loggers AircraftPilots
Fisherman StructuralIron &Steel
Farmers/Ranchers
A soldier in Iraq is nearly 10 times more likely to be killed than civilians in
the most dangerous occupations
*Military data are for the period March 2003 through May 2005. Civilian data are for 2004.Source: Brookings Institution, Iraq Index Archive, updated June 5, 2006; US Bureau of Labor Statistics.
Death Rates per 100,000 Employees
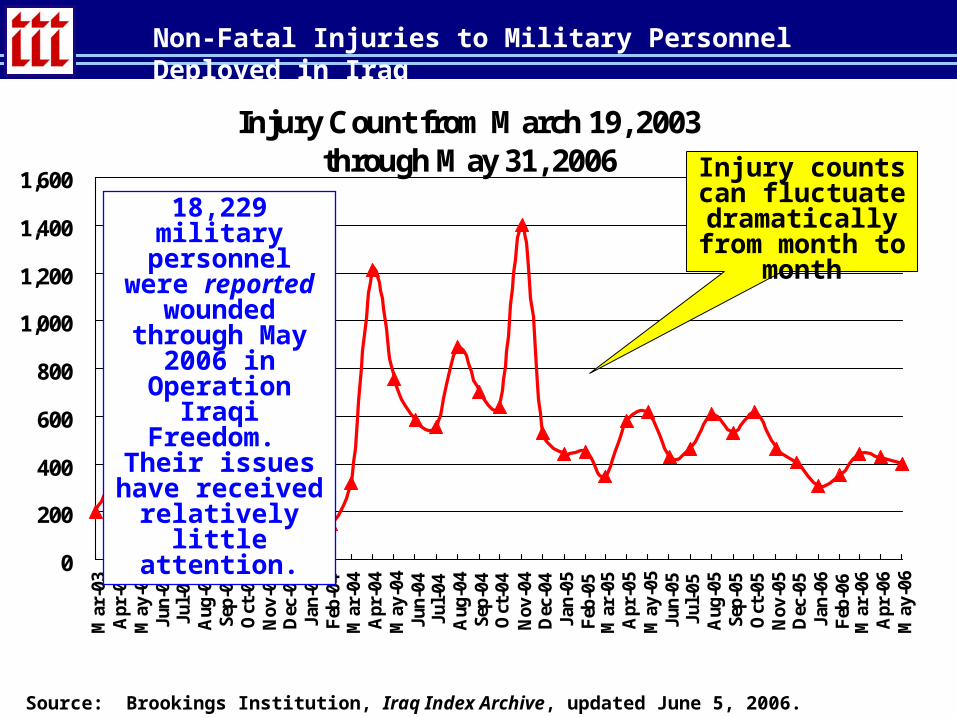
Injury Count from March 19, 2003through May 31, 2006
0
200
400
600
800
1,000
1,200
1,400
1,600
Mar
-03
Apr
-03
May
-03
Jun-
03Ju
l-03
Aug
-03
Sep-
03O
ct-0
3N
ov-0
3D
ec-0
3Ja
n-04
Feb
-04
Mar
-04
Apr
-04
May
-04
Jun-
04Ju
l-04
Aug
-04
Sep-
04O
ct-0
4N
ov-0
4D
ec-0
4Ja
n-05
Feb
-05
Mar
-05
Apr
-05
May
-05
Jun-
05Ju
l-05
Aug
-05
Sep-
05O
ct-0
5N
ov-0
5D
ec-0
5Ja
n-06
Feb
-06
Mar
-06
Apr
-06
May
-06
Non-Fatal Injuries to Military Personnel Deployed in Iraq
Source: Brookings Institution, Iraq Index Archive, updated June 5, 2006.
Injury counts can fluctuate
dramatically from month to month
18,229 military personnel were reported wounded through May 2006 in Operation Iraqi Freedom. Their
issues have received relatively
little attention.

Injury Rate of Troops Deployed in Iraq May 2003 through May 2006 (Injuries as % of Total Troops Deployed)
0.0
0.2
0.4
0.6
0.8
1.0
1.2
May
-03
Jun-
03Ju
l-03
Aug
-03
Sep-
03O
ct-0
3N
ov-0
3D
ec-0
3Ja
n-04
Feb
-04
Mar
-04
Apr
-04
May
-04
Jun-
04Ju
l-04
Aug
-04
Sep-
04O
ct-0
4N
ov-0
4D
ec-0
4Ja
n-05
Feb
-05
Mar
-05
Apr
-05
May
-05
Jun-
05Ju
l-05
Aug
-05
Sep-
05O
ct-0
5N
ov-0
5D
ec-0
5Ja
n-06
Feb
-06
Mar
-06
Apr
-06
May
-06
Non-Fatal Physical Injury Rates Among Troops in Iraq
Source: Insurance Information Institute calculations based in data from the Brookings Institution, Iraq Index Archive, updated June 5, 2005.
About 1-in-300 troops is wounded in any given month. On an annual
basis, a soldier in Iraq has about a 4.1% chance of
being wounded
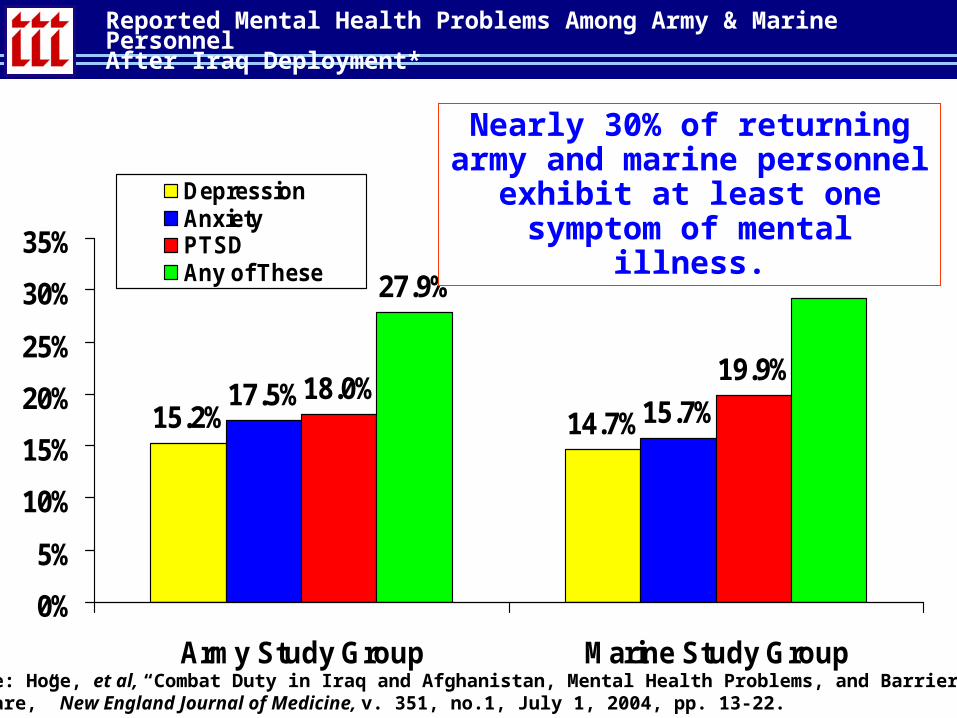
Reported Mental Health Problems Among Army & Marine PersonnelAfter Iraq Deployment*
15.2% 14.7%17.5%
15.7%18.0%
19.9%
27.9% 29.2%
0%
5%
10%
15%
20%
25%
30%
35%
Army Study Group Marine Study Group
DepressionAnxietyPTSDAny of These
Nearly 30% of returning army and marine personnel exhibit at least one symptom of mental illness.
Source: Hoge, et al, “Combat Duty in Iraq and Afghanistan, Mental Health Problems, and Barriers to Care,” New England Journal of Medicine, v. 351, no.1, July 1, 2004, pp. 13-22.
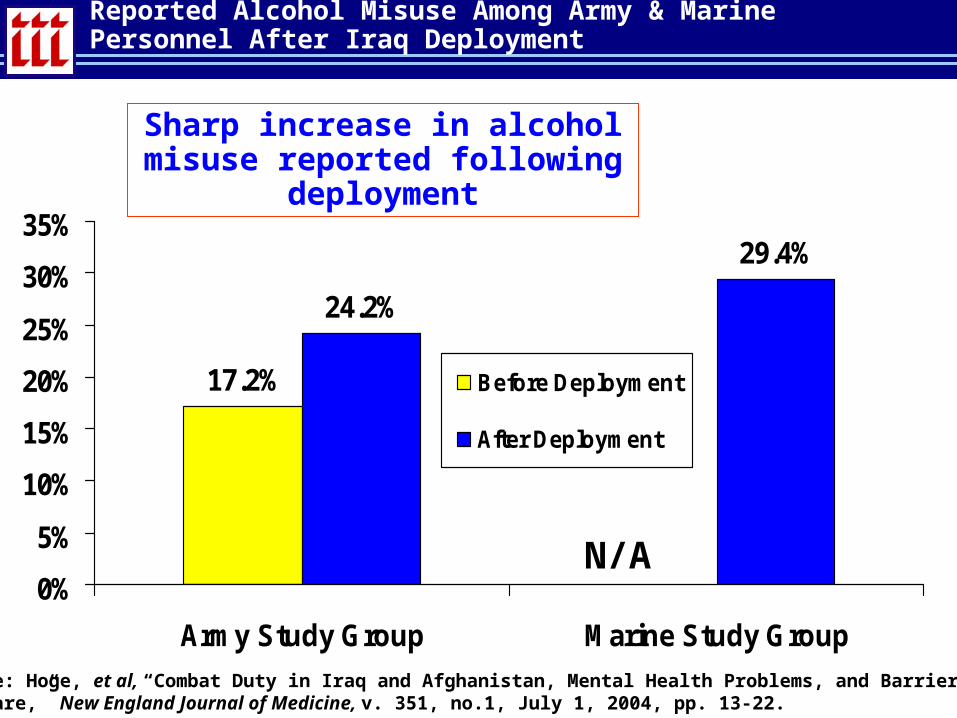
Reported Alcohol Misuse Among Army & Marine Personnel After Iraq Deployment
17.2%
24.2%
29.4%
0%
5%
10%
15%
20%
25%
30%
35%
Army Study Group Marine Study Group
Before Deployment
After Deployment
Sharp increase in alcohol misuse reported following deployment
Source: Hoge, et al, “Combat Duty in Iraq and Afghanistan, Mental Health Problems, and Barriers to Care,” New England Journal of Medicine, v. 351, no.1, July 1, 2004, pp. 13-22.
N/A

Few Troops Who Need Mental Health Help Actually Receive It*
78%
43% 40%
27%
Acknowledged aProblem
Interested inReceiving Help
Received Help (fromany professional in
past year)
Received Help (frommental health prof.
in past year)
Among troops with signs of major depression, generalized anxiety or PTSD,
only about 1-in-4 (27%) will receive treatment from a mental health professional
*Among troops whose survey response met screening criteria for major depression, anxiety or PTSD.Source: Hoge, et al, “Combat Duty in Iraq and Afghanistan, Mental Health Problems, and Barriers to Care,” New England Journal of Medicine, v. 351, no.1, July 1, 2004, pp. 13-22.

What Can/Should Employers, WC Insurers (esp. Claims Staff) Do?
• Be aware of physical injuries sustained in theater by returning/new employees who served in military combat roles or as contractors in war zones
• Be aware of possible mental health issues• Monitoring is probably wise, esp. in stressful jobs or jobs involving operation
of heavy equipment and driving • Most former military will have no major problem readjusting• Some will, so know how to get them help
• Most employers, claims people may mistake root cause of workplace. Not trained to recognize warning signs.
• Veteran’s who were wounded or suffer from service-related mental health problems entitled to lifetime medical benefits from the Veterans Administration• NOTE: Many may be undiagnosed (barely ¼ see MH prof.)
• Be aware of local VA resources: http://www.va.gov/rcs/ • VA Readjustment Counseling Service: 800-905-4675

www.iii.orgIf you would like a copy of this presentation, please give me your business card with e-mail address
Robert P. Hartwig, Ph.D., CPCUEVP & Chief EconomistInsurance Information Institute110 William StreetNew York, NY 10038Tel: (212) 346-5520Fax: (212) [email protected] www.iii.org
INSURANCE INFORMATION INSTITUTE ON-LINE