Rob Baarda - Are Real Test Metrics Predictive for the Future?
21
-
Upload
eurostar-software-testing-conference -
Category
Software
-
view
155 -
download
0
Transcript of Rob Baarda - Are Real Test Metrics Predictive for the Future?

Agenda
• Introduction• Objectives? GQM!• Real metrics• Considerations• Use real metrics in your future
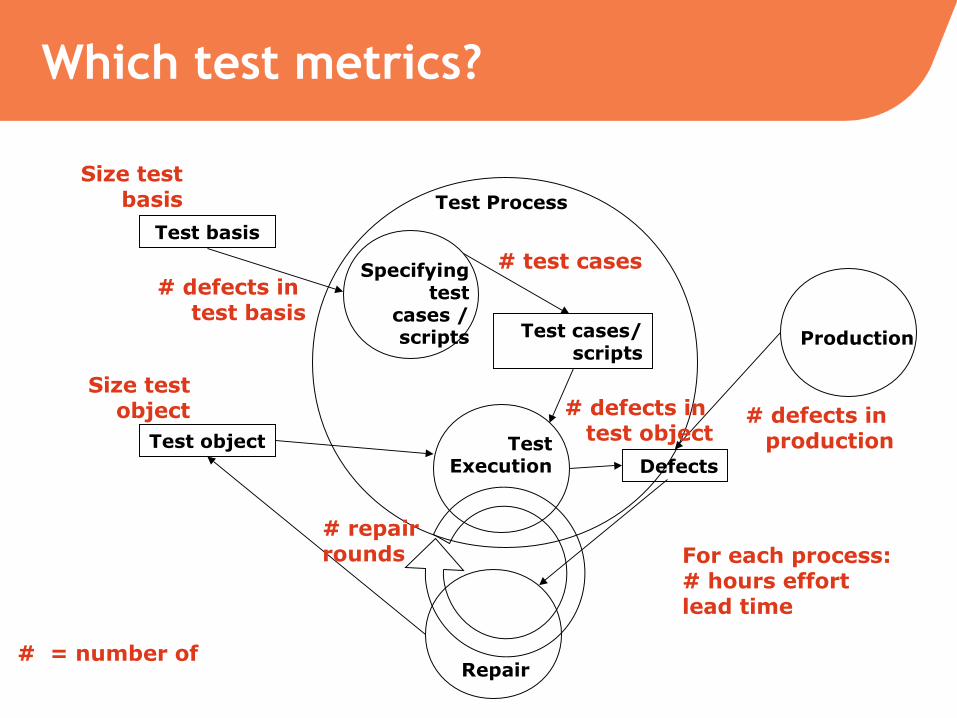
Which test metrics?
Test basis
Test object Test Execution Defects
Repair
Production
Specifying test
cases / scripts Test cases/
scripts
Test ProcessSize test
basis
Size test object # defects in
test object# defects in
production
For each process:# hours effortlead time
# test cases
# = number of
# defects in test basis
# repair rounds

Deductible metrics
• Effort estimation = # hours /size (FP, KLOC)• Productivity = # test cases / # hours• Efficiency =
# defects / (# hours or # test cases)> Specification> Test execution> Retest of repaired defects
• DDP Defect Detection Percentage (Europe)DRE Defect Removal Efficiency (USA)
• Defect injection rate for rework• Damage prevented in €?
HOW to get data?HOW to organize?

Dutch test metrics experiences
• Dutch initiative to gather test metrics• Parties involved>NESMA
Netherlands Software Metrics Association>Testnet
Dutch Testing community>LaQuSO
Laboratory for Software QualityUniversities Eindhoven & Nijmegen
Approach
Goal Question Metrics (GQM)

6
Goals
1. Test manager Support in planning and controlling the testing project
2. Organization Benchmark around 1. Test process2. Test products3. IT-products
To improve test process, IT process

7
Some Questions• Test manager> Number of test cases needed for my project> What percentage of the project team should be
allocated to testing> How many retests are executed
• Organization Benchmark> What is the defect detection & removal efficiency
(at what phase)> What test coverage do I need to ensure adequate
testing> How many defects does development insert
when repair others

What we have - Structure
Project
Test project
Test activity
Incidents/ Defects
Project activity
Be careful using the dataLack of statistical evidence

Feedback example test effort
% test effort / project effort
% test effort / project effort
Project effort (man-day)
0
10
20
30
40
50
60
0 500 1000 1500 2000 2500 3000
Be careful using the data
Lack of statistical evidence

Feedback example test productivity
Test productivity
Size in Function Points
# Test hours / FP
0
2
4
6
8
10
12
14
16
18
0 100 200 300 400 500 600
Be careful using the data
Lack of statistical evidence

Feedback example defects per fp
0
0,2
0,4
0,6
0,8
1
1,2
0 100 200 300 400 500 600 700 800 900
Number of defects / function point
Size in Function Points
# defects / fp
Be careful using the data
Lack of statistical evidence

Defect Detection PercentageDefect Removal Efficiency
DDP(%)
84
85
86
87
88
89
90
91
92
0 100 200 300 400 500 600 700 800 900 1000
Size in SKLOC
Defect Detection PercentageDefect Removal Efficiency
Be careful using the data
Lack of statistical evidence

Processes around metrics
• Collection in a project> Embedded in daily work>Weekly summarisation> Sanity checks> Cost: about 2% project budget
• Distribution• For a benchmark on the level of:> Project releases> Organisation> Country> International: www.ISBSG.org
International Software Benchmarking Standards Group

Some Considerations for future use
1. Accuracy of definitions2. Number of types of defects3. Is a batch test case the same as an online
test case?4. Only testing of functionality or also
security, performance, usability5. How to include regression testing?6. Measure personal productivity?7. Predictive value
average (mean), median, standard deviation, correlations with?Prediction model needed?

10 similar projects
ProjectFunc
Design Construct System testFunction Points
FD-hrs per fp
Constr-hrs per fp
Systemtest-hrs per fp
1 285 465 183 95 3,00 4,89 1,93
2 631 1847 694 305 2,07 6,06 2,28
3 599 845 540 197 3,04 4,29 2,74
4 159 496 185 57 2,79 8,70 3,25
5 81,5 1057 306,5 93 0,88 11,37 3,30
6 416 1017 281,5 80 5,20 12,71 3,52
7 528 1069 605 137 3,85 7,80 4,42
8 566 3118 756 176 3,22 17,72 4,30
9 848 5834 1776 265 3,20 22,02 6,70
10 508 4666 2204 285 1,78 16,37 7,73
Average 4,0

Standard deviation
From wikipedia
Standard deviation =the mean root square (RMS)deviation of the values from their mean(=average): σ

Some statistics for ST hours/fp
• Average = 4.0• Standard deviation = 1.8
As predictor: 68% will be between 2.2 and 5.8• Does not really help as prediction

Additional info
Project Func Design Construct System testFunction Points
FD-hrs per fp
Constr-hrs per fp
Systemtest-hrs per fp
Grafical system
1 285 465 183 95 3,00 4,89 1,93 0
2 631 1847 694 305 2,07 6,06 2,28 0
3 599 845 540 197 3,04 4,29 2,74 0
4 159 496 185 57 2,79 8,70 3,25 0
5 81,5 1057 306,5 93 0,88 11,37 3,30 0
6 416 1017 281,5 80 5,20 12,71 3,52 0
7 528 1069 605 137 3,85 7,80 4,42 0
8 566 3118 756 176 3,22 17,72 4,30 1
9 848 5834 1776 265 3,20 22,02 6,70 1
10 508 4666 2204 285 1,78 16,37 7,73 1

And now
• Non-GIS> Average = 3.1> Standard deviation = 0.8> As predictor: 68% within 2.3 and 3.9
• GIS> Average = 6.2> Standard deviation = 1.4> As predictor: 68% within 4.8 and 7.6
• Overall > Average = 4.0> Standard deviation = 1.8> As predictor: 68% within 2.2 and 5.8
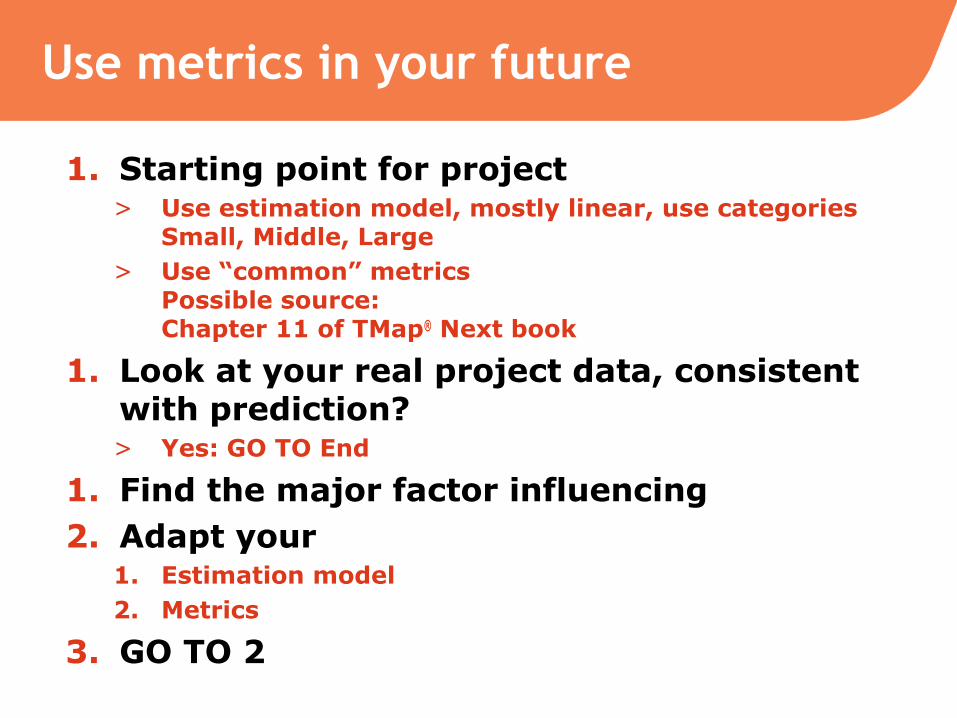
Use metrics in your future
1. Starting point for project> Use estimation model, mostly linear, use categories
Small, Middle, Large> Use “common” metrics
Possible source:Chapter 11 of TMap® Next book
1. Look at your real project data, consistent with prediction?> Yes: GO TO End
1. Find the major factor influencing2. Adapt your
1. Estimation model2. Metrics
3. GO TO 2

Wrap up
• Metrics are possible• Useful to predict• Linear model needs localized fine
tuning
Test Metrics can predict your future!