Impacts of Roadway Condition, Traffic and Manmade ... - IJSER
2
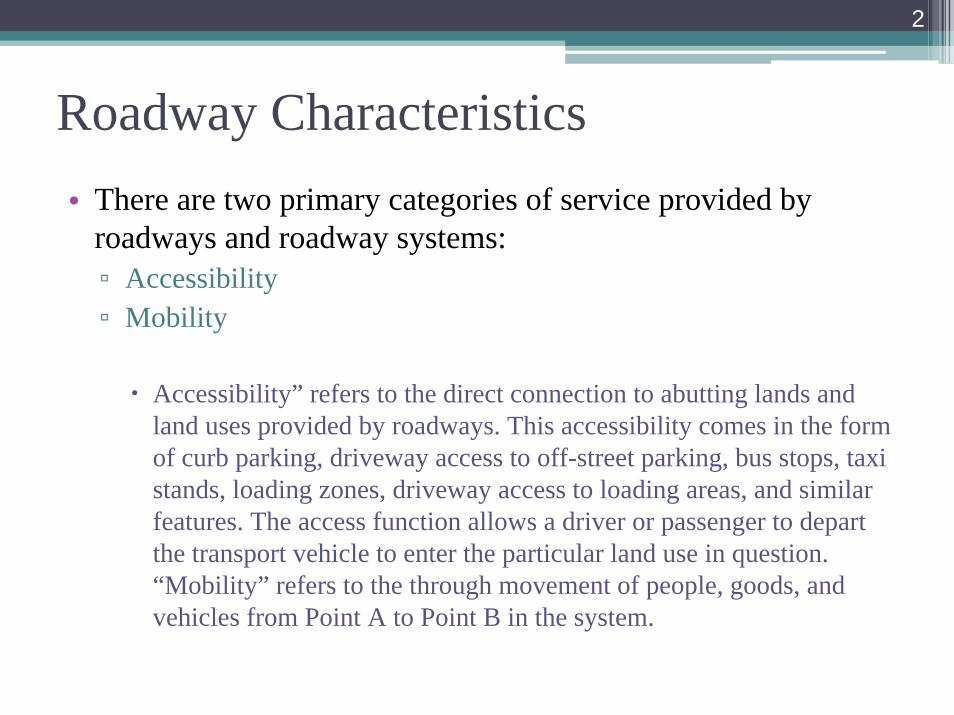
Roadway Characteristics• There are two primary categories of service provided by
roadways and roadway systems:▫ Accessibility▫ Mobility
Accessibility” refers to the direct connection to abutting lands and land uses provided by roadways. This accessibility comes in the form of curb parking, driveway access to off-street parking, bus stops, taxi stands, loading zones, driveway access to loading areas, and similar features. The access function allows a driver or passenger to depart the transport vehicle to enter the particular land use in question. “Mobility” refers to the through movement of people, goods, and vehicles from Point A to Point B in the system.

3
What can we Do?• Highway Classification
• Limited-access facilities• Arterials• Collectors• Local streets

4
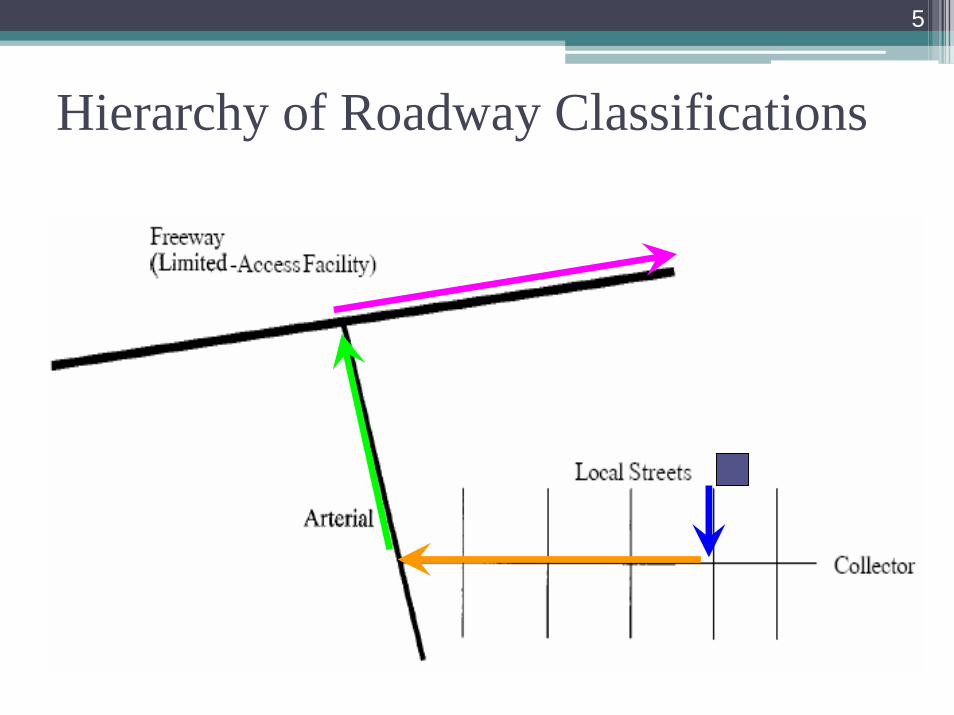
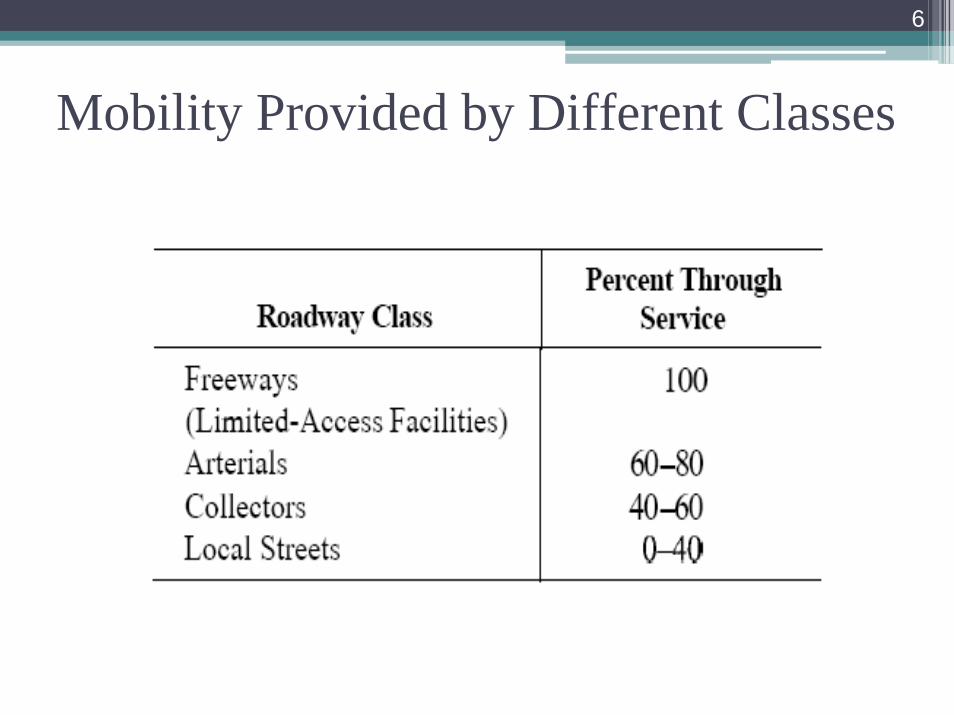
Highway Classification• Limited-access facilities▫ limited-access facility provides for 100% through movement, or
mobility. No direct access to abutting land uses is permitted.• Arterials▫ Surface facilities that are designed primarily for through
movement but permit some access to abutting lands.• Local streets▫ Designed to provide access to abutting land uses with through
movement only a minor function, if provided at all.• Collector▫ An intermediate category between arterials and local streets.
Some measure of both mobility and access is provided. The term “collector” comes from a common use of such facilities to collect vehicles from a number of local streets and deliver them to the nearest arterial or limited access facility.
5
Hierarchy of Roadway Classifications
6
Mobility Provided by Different Classes

7
Preserving the Function of a Facility
8
Reading• Traffic Engineering, Roess, Prassas, McShane, [1]
pp. 38-42
9
Traffic Stream Characteristics• Traffic Stream VS. Fluid Stream ?!
• Traffic streams are made up of individual drivers and vehicles –which vary- interacting with each other and with the physical elements of the roadway and its general environment.
• The consistent range of behaviour would let us design.

10
Traffic Stream Characteristics• In describing traffic streams in quantitative terms, the
purpose is to both understand the inherent variability in their characteristics and to define normal ranges of behavior.
• To do so, key parameters must be defined and measured. Traffic engineers will analyze, evaluate, and ultimately plan improvements in traffic facilities based on such parameters and their knowledge of normal ranges of behavior.

11
Types of Facilities• Uninterrupted flow facilities ▫ Have no external interruptions to the traffic stream. Pure
uninterrupted flow Freeways,
where there are no intersections at grade, traffic signals, STOP or YIELD signs, or other interruptions external to the traffic stream itself. (?)
sections of surface highwaymost often in rural areas, where there are long distances between fixed interruptions. As a very general guideline, it is believed that uninterrupted flow can exist in situations where the distance between traffic signals other significant fixed interruptions is more than two miles.
• It should be remembered that the term “uninterrupted refers to a type of facility, not the quality of operations on that facility.

12
Types of Facilities• Interrupted facilities ▫ Are those that incorporate fixed external
interruptions into their design and operation.Traffic SignalsSTOP and YIELD signsUnsignalized at-grade intersectionsDrivewaysCurb parking maneuversOther land-access operations.

13
Types of Facilities• What is the difference?▫ The major difference between uninterrupted and
interrupted flow facilities is the impact of time. On uninterrupted facilities, the physical facility is available to drivers and vehicles at all times. On a given interrupted flow facility, movement is periodically barred by “red” signals. The signal timing, therefore, limits access to particular segments of the facility in time. Further, rather than a continuously moving traffic stream, at traffic signals, the traffic stream is periodically stopping and starting again.

14
Traffic Stream Parameters• Traffic stream parameters fall into two broad
categories.• Macroscopic parameters ▫ describe the traffic stream as a whole
• Microscopic parameters ▫ describe the behavior of individual vehicles or pairs of
vehicles within the traffic stream.

15
Principal parameters• Macroscopic parameters▫ (1) volume and rate of flow,▫ (2) speed,▫ (3) density
• Microscopic parameters▫ (1) the speed of individual vehicles,▫ (2) headway,▫ (3) spacing.

16
Volume and Rate of Flow• Traffic volume ▫ Is defined as the number of vehicles passing a point
on a highway, or a given lane or direction of a highway, during a specified time interval.
▫ The unit of measurement for volume is simply “vehicles,” although it is often expressed as “vehicles per unit time.” Units of time used most often are “per day” or “per hour.”
17
Volume and Rate of Flow• Rates of flow ▫ generally stated in units of “vehicles per hour,” but
represent flows that exist for periods of time less than one hour.
▫ A volume of 200 vehicles observed over a 15-minute period may be expressed as a rate of 200 * 4 = 800 vpheven though 800 vehicles would not be observed if the full hour were counted. 800 vph becomes a rate of flow that exists a 15-minute interval.

18
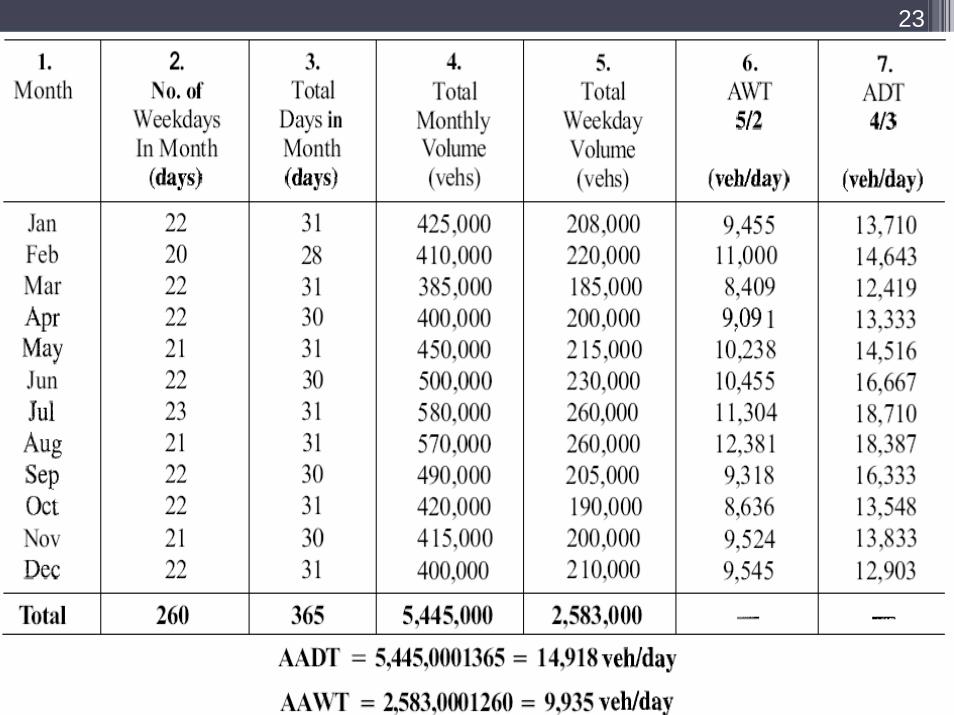
Daily Volumes• Daily volumes are used to establish trends over time,
and for general planning purposes.• There are four daily volume parameters that are
widely used in traffic engineering:
▫ Average annual daily traffic (AADT).▫ Average annual weekday traffic (AAWT).▫ Average daily traffic (ADT).▫ Average weekday traffic (AWT).
19
Daily Volumes• Average annual daily traffic (AADT).• The average 24-hour volume at a given location over
a full 365-day year; the number of vehicles passing site in a year divided by 365 days (366 days in a leap year).

20
Daily Volumes• Average annual weekday traffic (AAWT).• The average 24-hour volume occurring on weekdays
over a full 365-day year; the number of vehicles passing a site on weekdays in a year divided by the number of weekdays (usually 260).

21
Daily Volumes• Average daily traffic (ADT).• The average hour volume at a given location over a
defined time period less than one year; a common application is to measure an ADT for each month of the year.
22
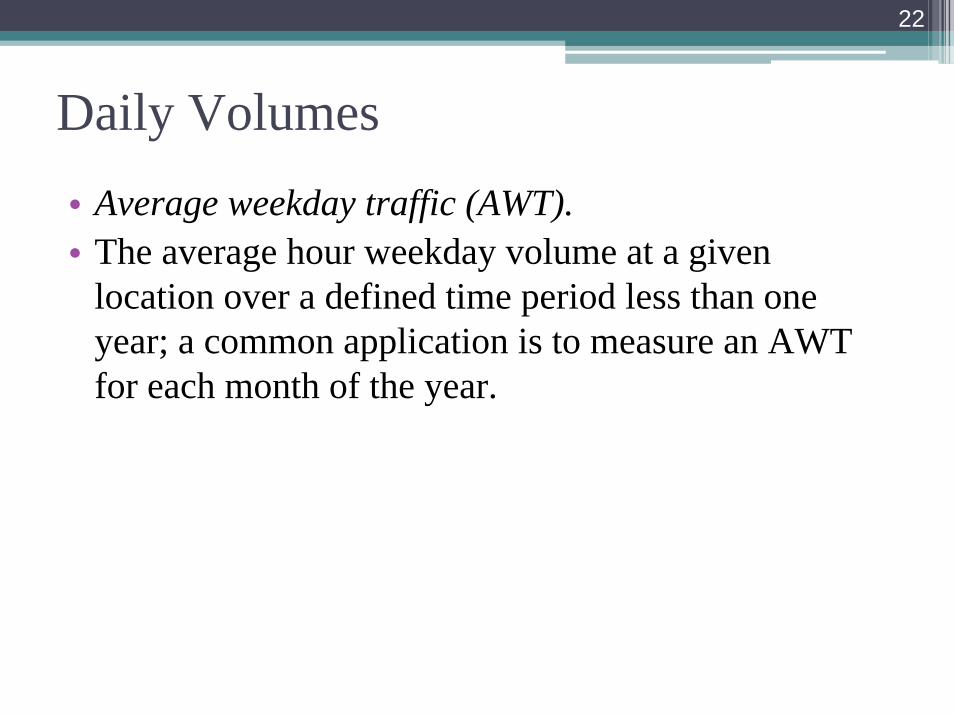
Daily Volumes• Average weekday traffic (AWT).• The average hour weekday volume at a given
location over a defined time period less than one year; a common application is to measure an AWT for each month of the year.
23
24
Daily Volumes• AADT Applications▫ Estimation of highway use▫ Estimation of trends▫ Economic feasibility evaluation▫ Planning▫ Maintenance
• ADT Applications▫ Planning▫ Measurement of current demand
25
Hourly Volumes• Volume varies considerably over the 24 hours of the
day,
• Rush Hours• Peak Hour
• Highways and controls must be designed to adequately serve the peak-hour traffic volume in the peak direction of flow.

26
Design• In design, peak-hour volumes are sometimes
estimated from projections of the AADT. (?)
• Directional Design Hour Volume (DDHV),
• K = Proportion of daily traffic occurring during Peak hour• D = Proportion of peak hour traffic traveling in the peak
direction of flow.

27
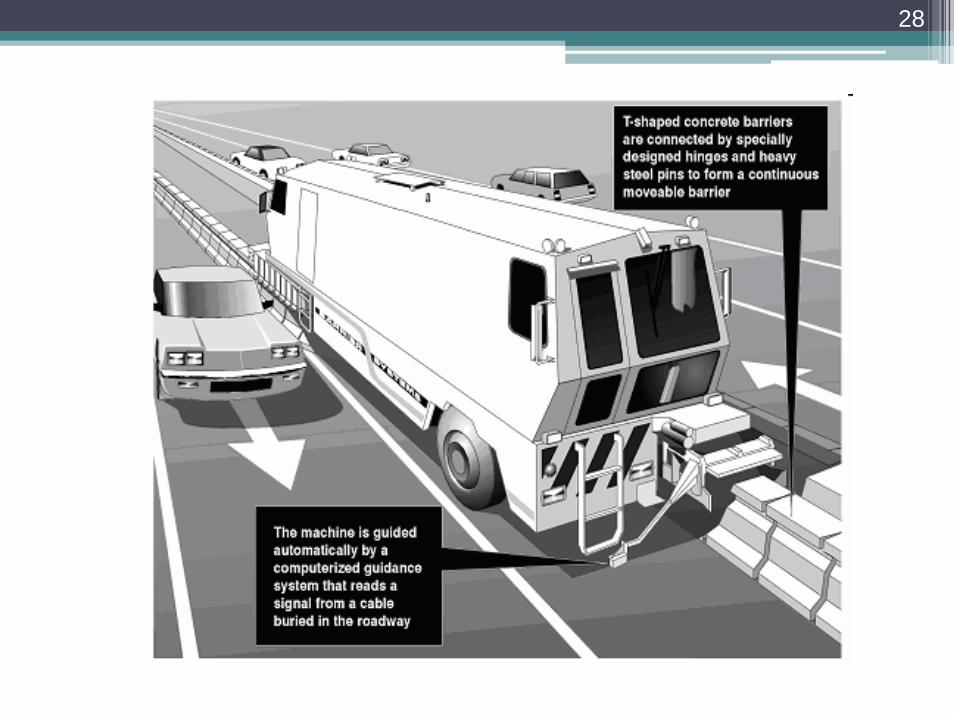
28

29

30
DDHV• 30th peak hour of the year▫ (K represent it)
• D and K would decrease by increasing development density (?)
• K and D should be monitored regularly.

31
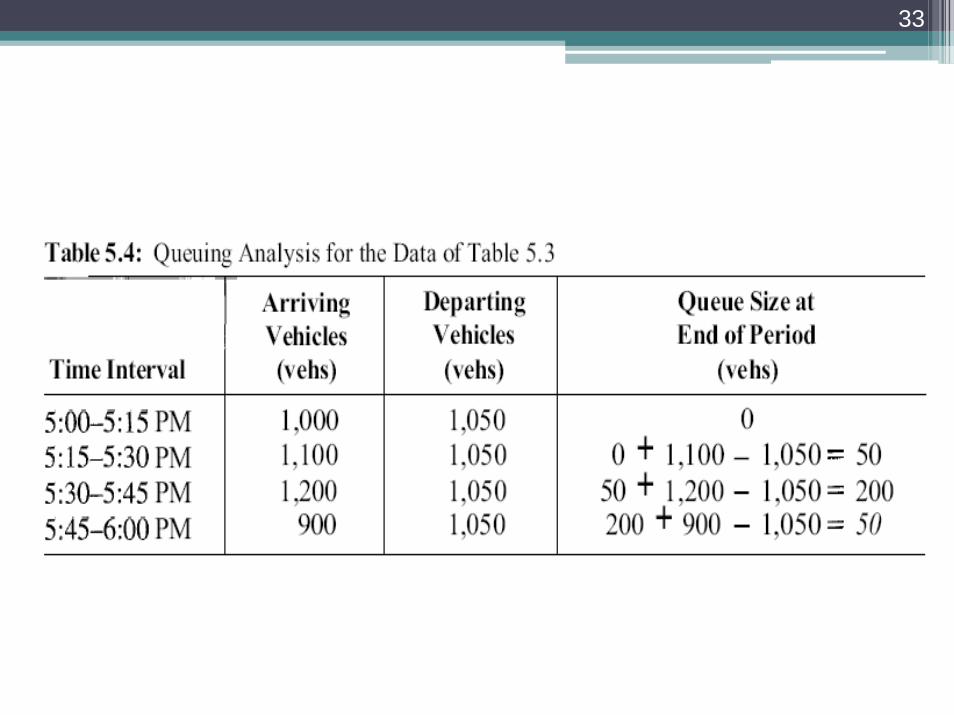
Sub-hourly Volumes and Rates of Flow
• The variation of traffic within a given hour is also of considerable interest. The quality of traffic flow is often related to short-term fluctuations in traffic demand.

32
Rates of Flow
33

34
Hourly volume vs. Rate of Flow • The relationship between the hourly volume and the
maximum rate of flow within the hour is defined by the peak hour factor, (PHF)
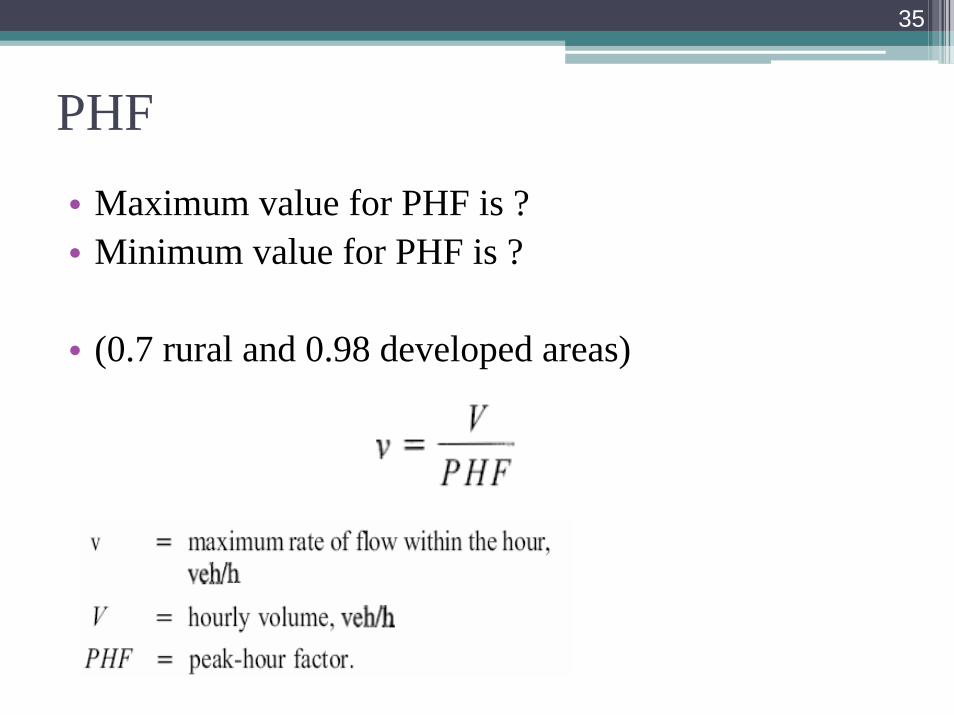
35
PHF• Maximum value for PHF is ?• Minimum value for PHF is ?
• (0.7 rural and 0.98 developed areas)
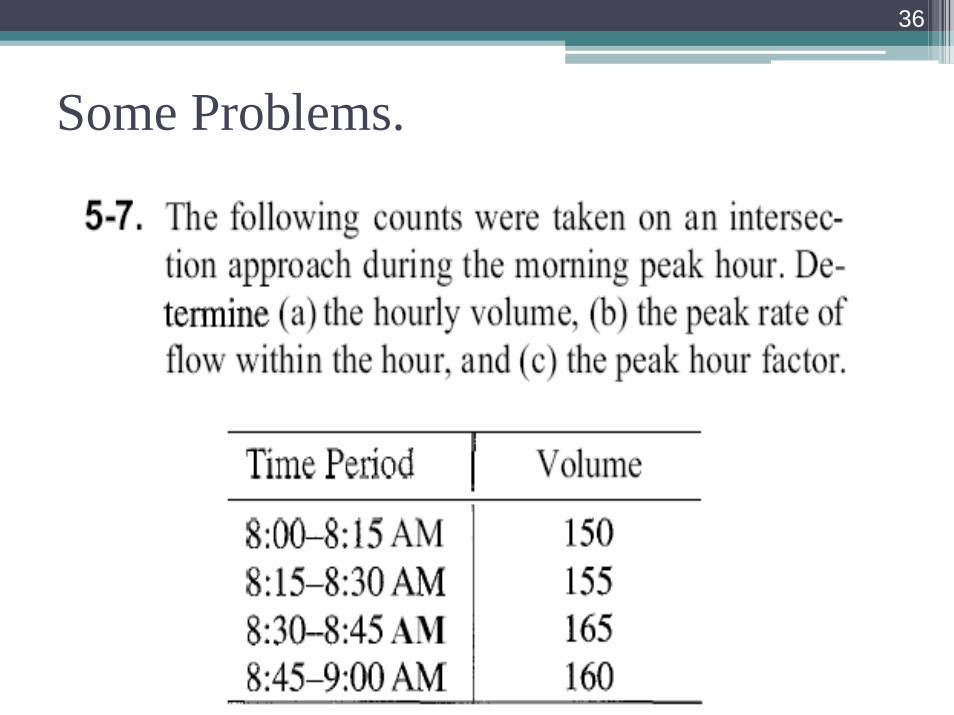
36
Some Problems.

37
Speed and Travel Time• Speed is defined as a rate of motion in distance per
unit time. • Travel time is the time taken to traverse a defined
section of roadway.

38
TMS and SMS• In a moving traffic stream, each vehicle travels at a
different speed. Thus, the traffic stream does not have a single characteristic value,
• Averages
▫ Time Mean Speed (TMS)▫ Space Mean Speed (SMS)
39
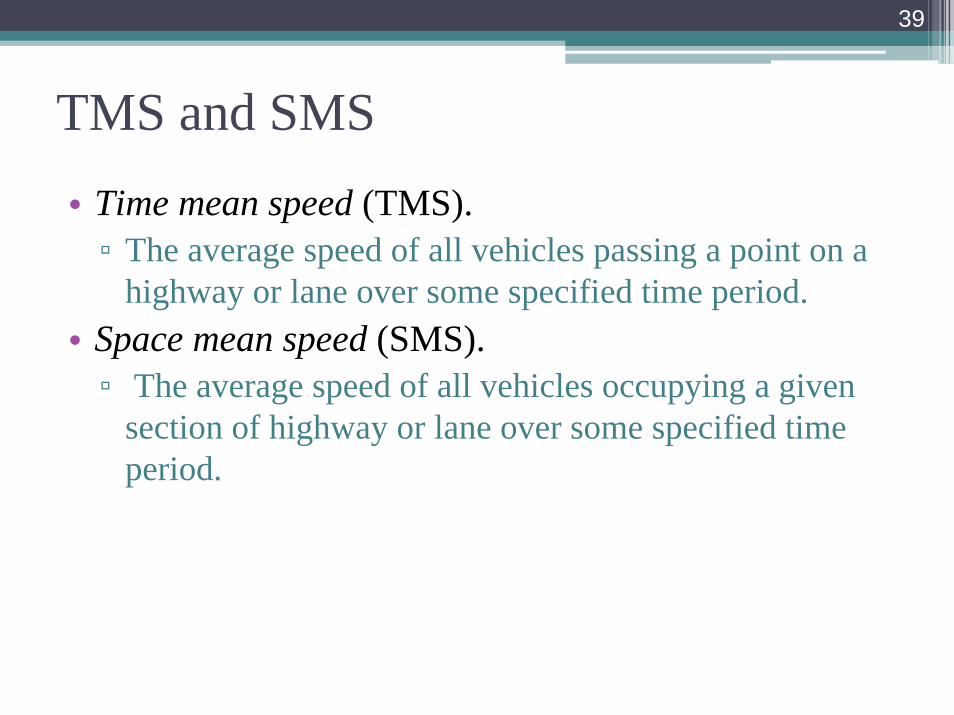
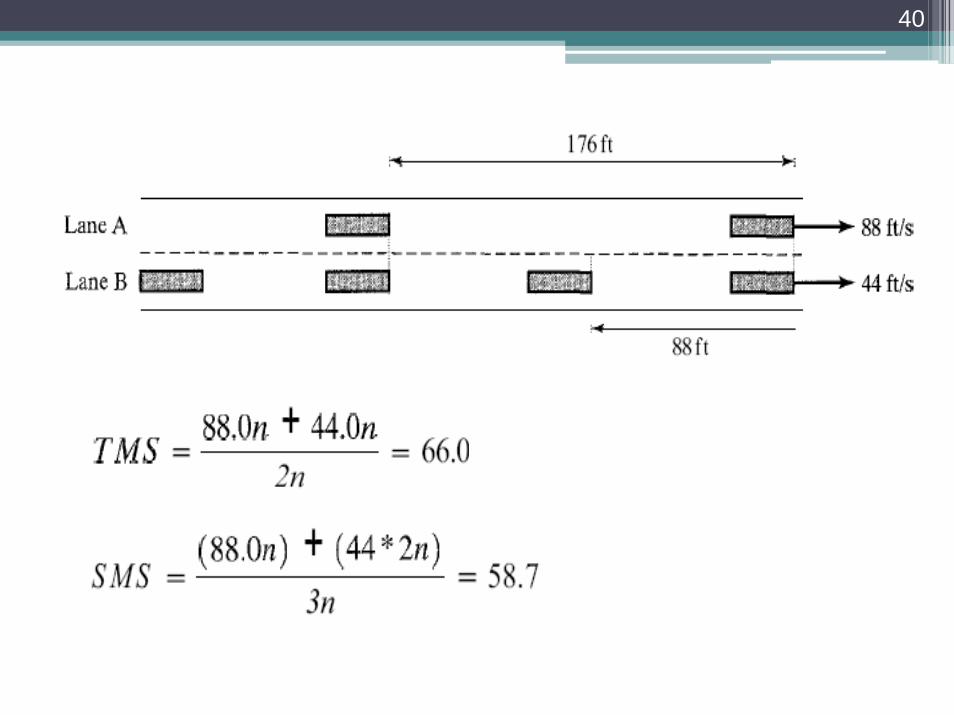
TMS and SMS• Time mean speed (TMS). ▫ The average speed of all vehicles passing a point on a
highway or lane over some specified time period.• Space mean speed (SMS).▫ The average speed of all vehicles occupying a given
section of highway or lane over some specified time period.
40
41
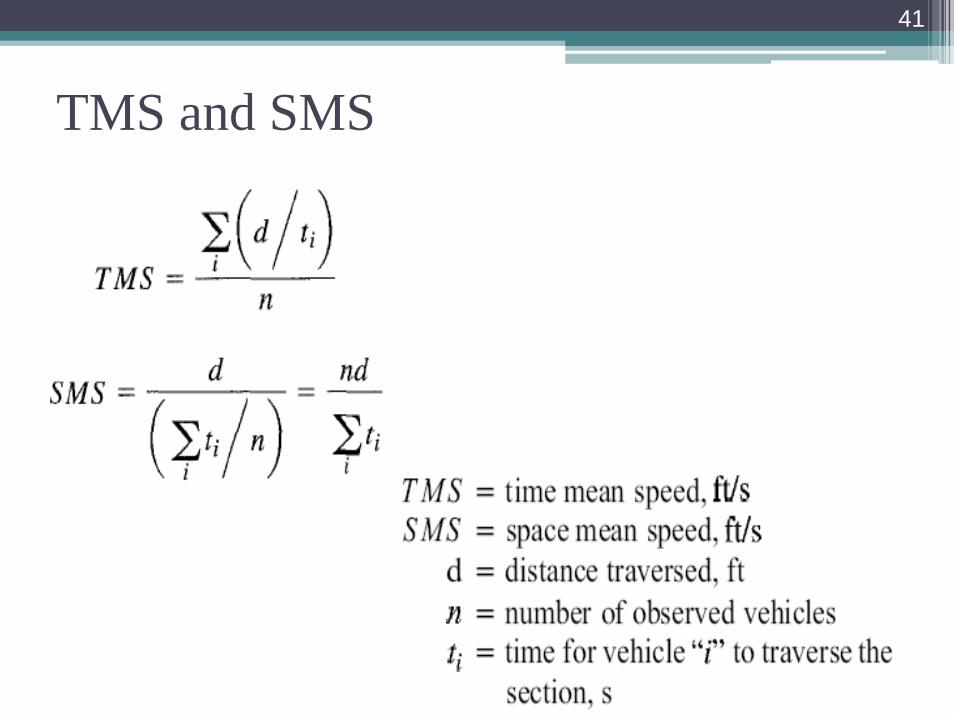
TMS and SMS

42

43
Density and Occupancy• Density, ▫ is defined as the number of vehicles occupying a given
length of highway or lane (veh/km) or (veh/km/lane)▫ Computed from speed and flow rate▫ Quality of traffic flow
Freedom of maneuver
44
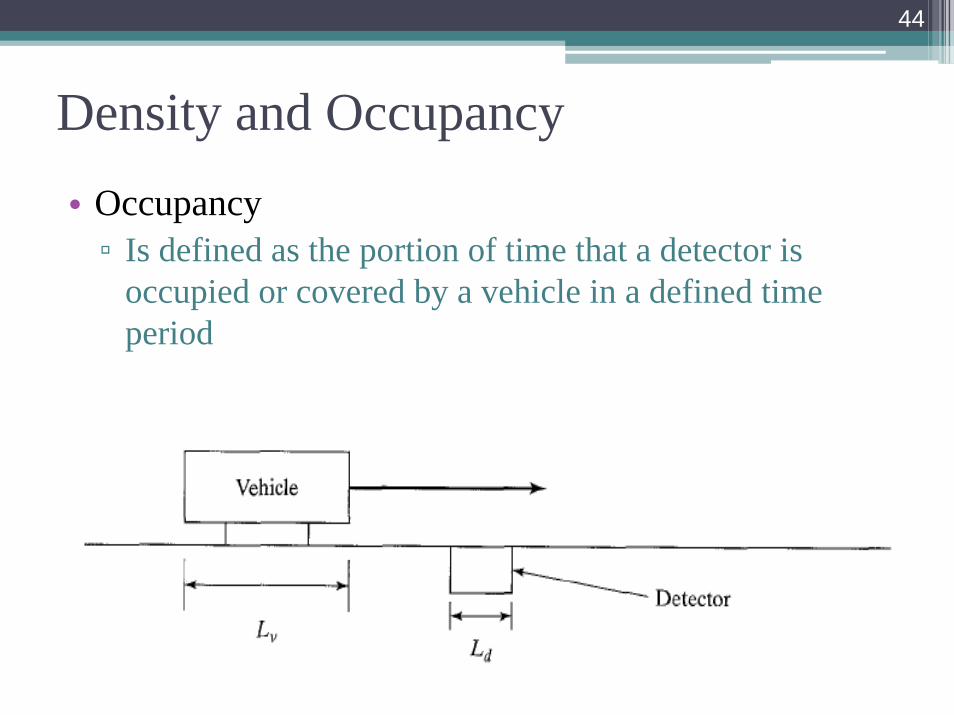
Density and Occupancy• Occupancy ▫ Is defined as the portion of time that a detector is
occupied or covered by a vehicle in a defined time period

45
Density and Occupancy• Density can be calculated as:
dv LLOD
+=
1000
46
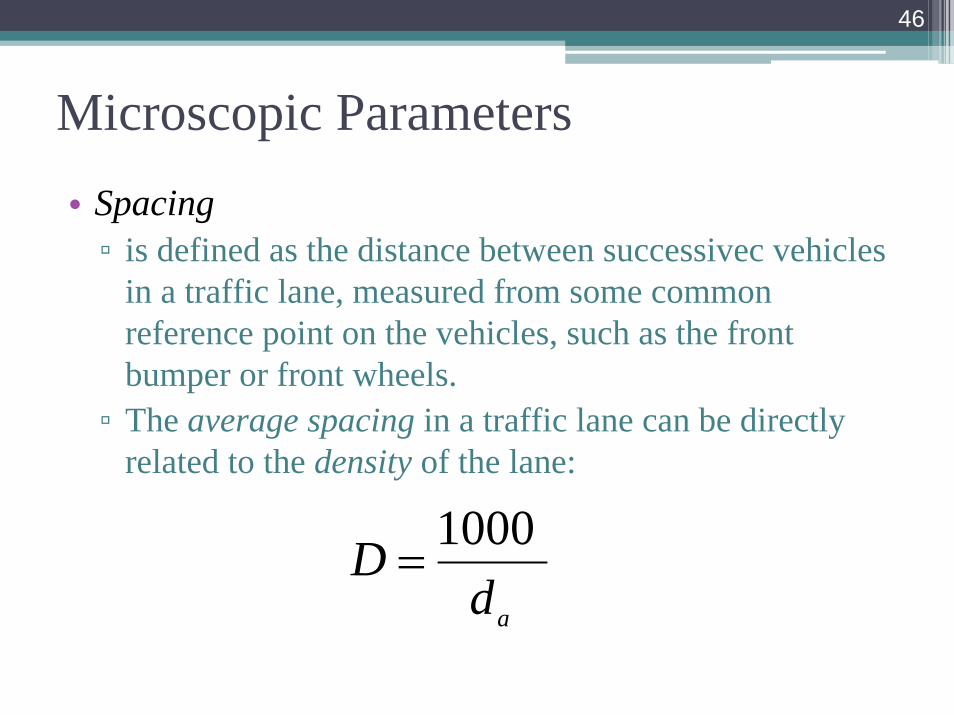
Microscopic Parameters• Spacing ▫ is defined as the distance between successivec vehicles
in a traffic lane, measured from some common reference point on the vehicles, such as the front bumper or front wheels.
▫ The average spacing in a traffic lane can be directly related to the density of the lane:
adD 1000=

47
Microscopic Parameters• Headway ▫ is defined as the time interval between successive
vehicles as they pass a point along the lane, also measured between common reference points on the vehicles.
▫ The average headway in a lane is directly related to the rate of flow:
ahv 3600=

48
Microscopic Parameters• Average speed can also be computed from headway
and spacing measurements as:
a
a
hdS =
49
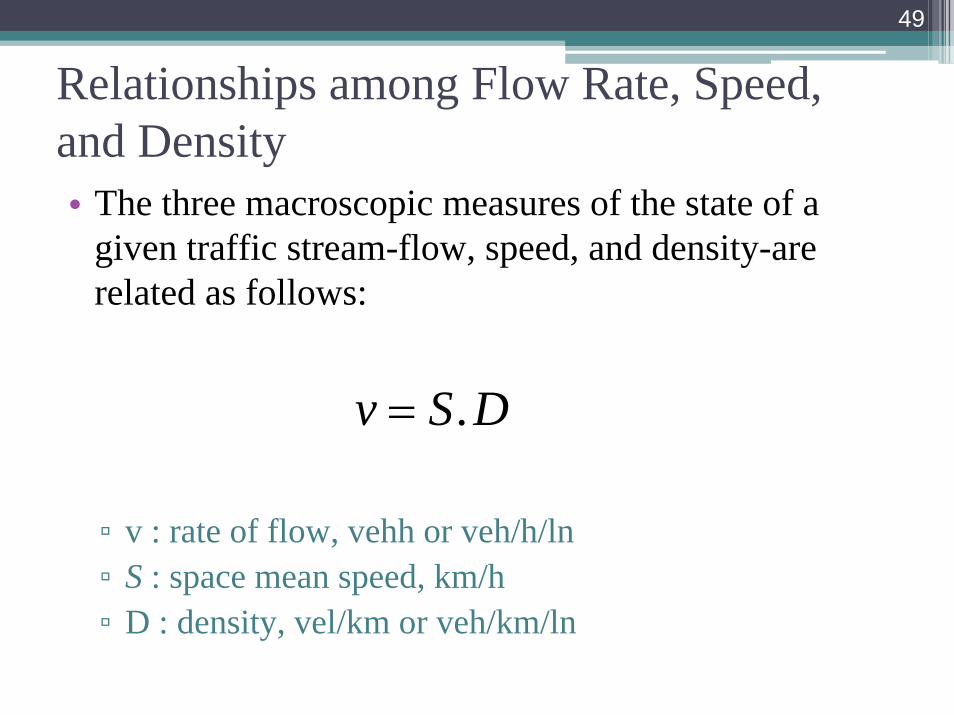
Relationships among Flow Rate, Speed, and Density• The three macroscopic measures of the state of a
given traffic stream-flow, speed, and density-are related as follows:
▫ v : rate of flow, vehh or veh/h/ln▫ S : space mean speed, km/h▫ D : density, vel/km or veh/km/ln
DSv .=
50

51
52

53
2
2
45.055.045.055.0
22.122.245.055.0
45.055.0..
.
DDvDDv
SSvSvS
DSge
DSv
−=⇒−=⎟⎠⎞
⎜⎝⎛
−=⇒⎟⎠⎞
⎜⎝⎛−=
−=
=
54
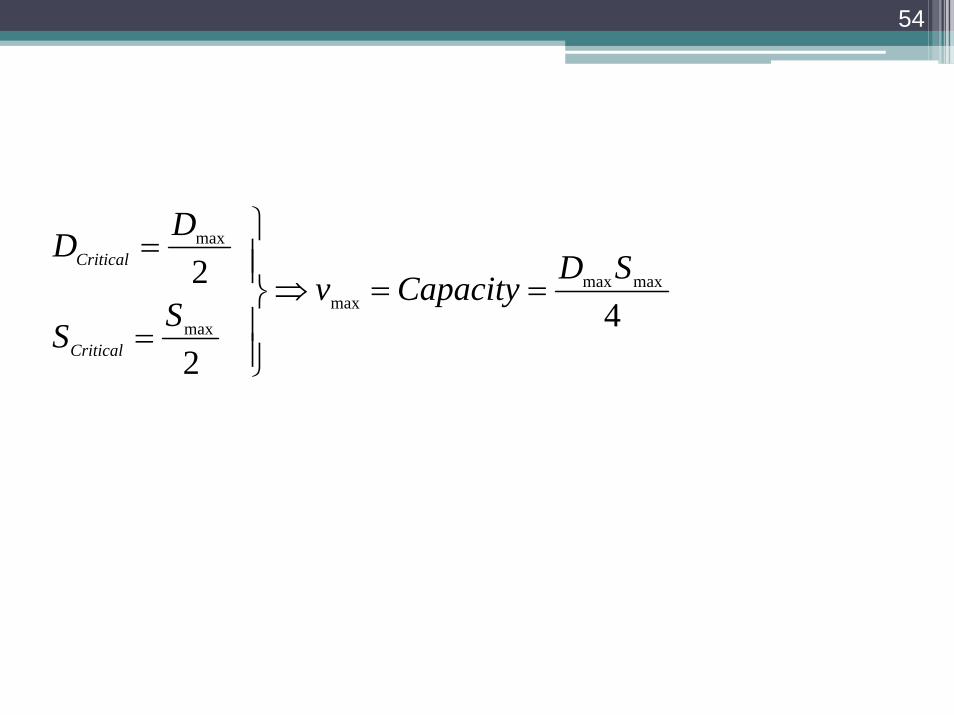
42
2 maxmaxmax
max
max
SDCapacityvSS
DD
Critical
Critical
==⇒
⎪⎪⎭
⎪⎪⎬
⎫
=
=
55
Reading• Traffic Engineering, Roess, Prassas, McShane, [1]
pp. 105-119


![01 - Traffic Stream Characteristics [120809]](https://static.fdocuments.us/doc/165x107/577d2cad1a28ab4e1eac95de/01-traffic-stream-characteristics-120809.jpg)