Roadshow Presentation - Startseite - XING Corporate 10 Aug 10 Sep 10 Oct 10 Nov 10 Dez 10 Jan 11 Feb...
16
Dr. Stefan Gross-Selbeck (CEO) & Ingo Chu (CFO) Hamburg, August 10, 2011 Q2‘2011 Results Presentation XING AG
Transcript of Roadshow Presentation - Startseite - XING Corporate 10 Aug 10 Sep 10 Oct 10 Nov 10 Dez 10 Jan 11 Feb...
Dr. Stefan Gross-Selbeck (CEO) & Ingo Chu (CFO)Hamburg, August 10, 2011
Q2‘2011 Results PresentationXING AG

Q2 highlights
2(1) Germany, Austria & Switzerland
Re-acceleration of D-A-CH1 member growth continues
01
Big product launch successfully implemented
‚Verticals„ contribute 75% to topline growth (yoy)
Ongoing strong financial performance

Q2„2011 Q2„2010 yoy
Subscriptions €m 11.32 10.51 8%
E-Recruiting €m 2.81 1.55 81%
Advertising €m 1.48 0.88 68%
New verticals €m 0.55 0.01 N.A.
Service revenues €m 16.17 12.95 25%
Other* €m 0.17 0.31 -45%
Total revenues €m 16.33 13.26 23%
EBITDA €m 5.67 3.74 70%
EBITDA-Margin % 35 28 7%pts
Net-result €m 2.37 1.35 76%
Q2 financial snapshot02
1 Other revenue & other operating income
3
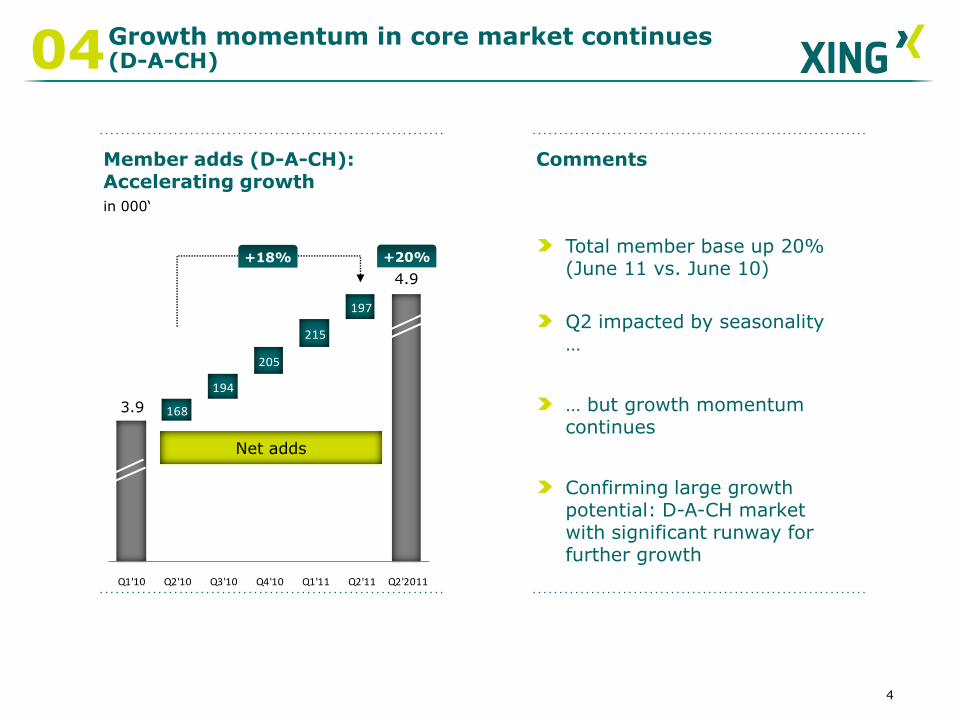
168
194
205
215
197
Q1'10 Q2'10 Q3'10 Q4'10 Q1'11 Q2'11 Q2'2011
Growth momentum in core market continues(D-A-CH)
Member adds (D-A-CH): Accelerating growth
in 000„
Comments
04
+18%
Net adds
Total member base up 20% (June 11 vs. June 10)
Q2 impacted by seasonality …
… but growth momentum continues
Confirming large growth potential: D-A-CH market with significant runway for further growth
3.9
4.9
4
+20%

Payer basein 000„
688 704 716 731 741 769
Q2'10 Q4'10 Q2'11 Total
Payer base growing10k net adds in Q2‟11 despite price increase in April
Payer gross addsD-A-CHin 000„
42 4338
46
38
Q2'10 Q3'10 Q4'10 Q1'11 Q2'11
03
+8%
Payer net addsD-A-CHin 000„
1116
12 1510
Q2'10 Q3'10 Q4'10 Q1'11 Q2'11
28
5
New pricing structure since April 2011 for all new members3m = €7.95 (€6.95 for first 3 months new price after first renewal)
12m = €6.95 (€5.95 for first 12 months new price after first renewal)

‘Verticals’ drive overall growthwith 75% contribution to overall yoy topline growth
„Verticals“: Continued strong growth
Revenues from “verticals” (recruiting, advertising, events & other)
in €m incl. yoy growth in %
2.432.82
3.58
4.28
4.85
Q2'10 Q3'10 Q4'10 Q1'11 Q2'11
54%67%
95% 91%99%
03
>400 new B2B customers & 4 additional FTEs (sales)
Recent study confirms: XING preferred social media channel for corporate recruiting
Successful introduction of new ad format
Additional inventory within different site sections (jobs, groups, events & CP‟s
Amiando integration well on track
Building sales force (9 new FTE‟s)
Deeper platform integration planned for H2
E-Recruiting
Advertising
Events
6
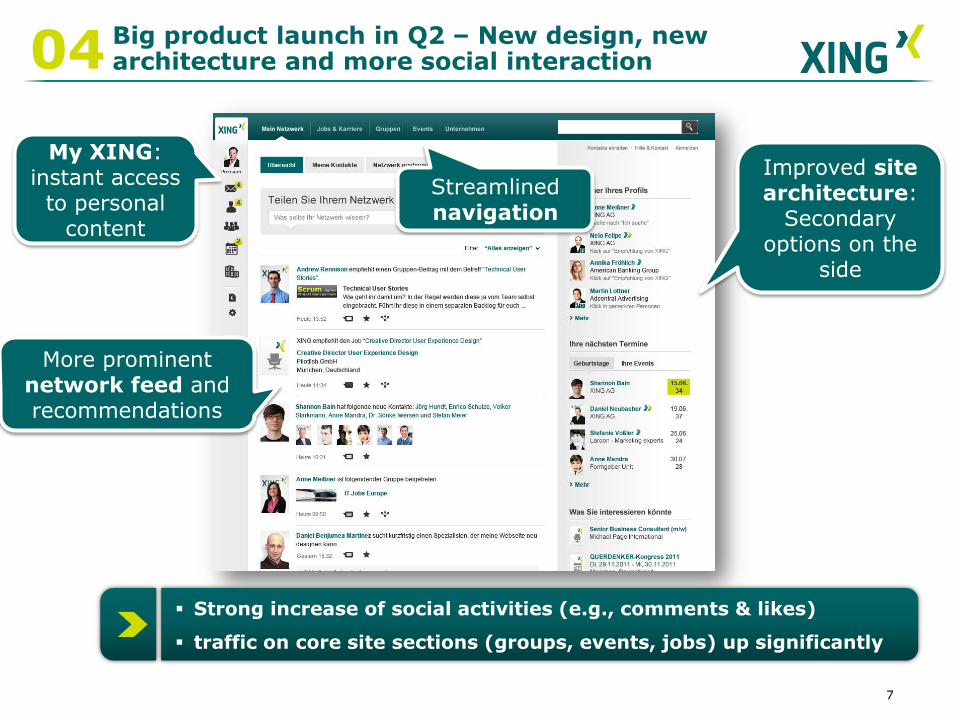
Big product launch in Q2 – New design, new architecture and more social interaction
7
04
Strong increase of social activities (e.g., comments & likes)
traffic on core site sections (groups, events, jobs) up significantly
My XING: instant access
to personal content
More prominent network feed and recommendations
Streamlined navigation
Improved site architecture:
Secondary options on the
side

Financial highlights Q2’2011
8
Continued diversification of revenue base through vertical business
05
Ongoing investment mode, acceleration in H2
23% revenue growth from all revenue streams
Profitable business with EBITDA of €5.7m & 35% margin

Q2‟11 Q1„11 Q2‟11vs.
Q1‟11
Q2„10 Q2‟11 vs. Q2‟10
Abs. Abs. Abs.
Total revenue1 16.3 15.7 +4% 13.3 23%
Costs (10.6) (10.0) (6%) (9.5) (12%)
EBITDA 5.7 5.6 +2% 3.7 53%
Margin 35% 36% -0.1%pt 28% +7%pt
Depreciation (2.2) (1.5) (50%) (1.2) (81%)
Financial result 0.1 0.0 +104% 0.0 231%
Taxes (1.2) (1.5) (19%) (1.2) 1%
Net result 2.4 2.7 (11%) 1.4 78%
Revenues €16.3m, EBITDA €5.7m with 35% margin
(1) Of revenue(2) Including other operating income
P&Lin €m
05
xxx EBITDA margin impacted by start-up investments in events (-4%-points)
Depreciation impacted by one-off write-down (-€0.6m) Financial result improved through new treasury policy
9

„Subscription“in €m
Ongoing diversification of revenue streams
E-Recruitingin €m
Advertising(incl. Company Profiles) in €m
05
Q2'10 Q2'11
1.6
2.8
+81%
Q2'10 Q2'11
0.9
1.5
+68%
10
New Verticals(Events) in €m
Q2'10 Q2'11
0.0
0.6
N/A
Q2'10 Q2'11
10.511.3
+8%
Core Verticals
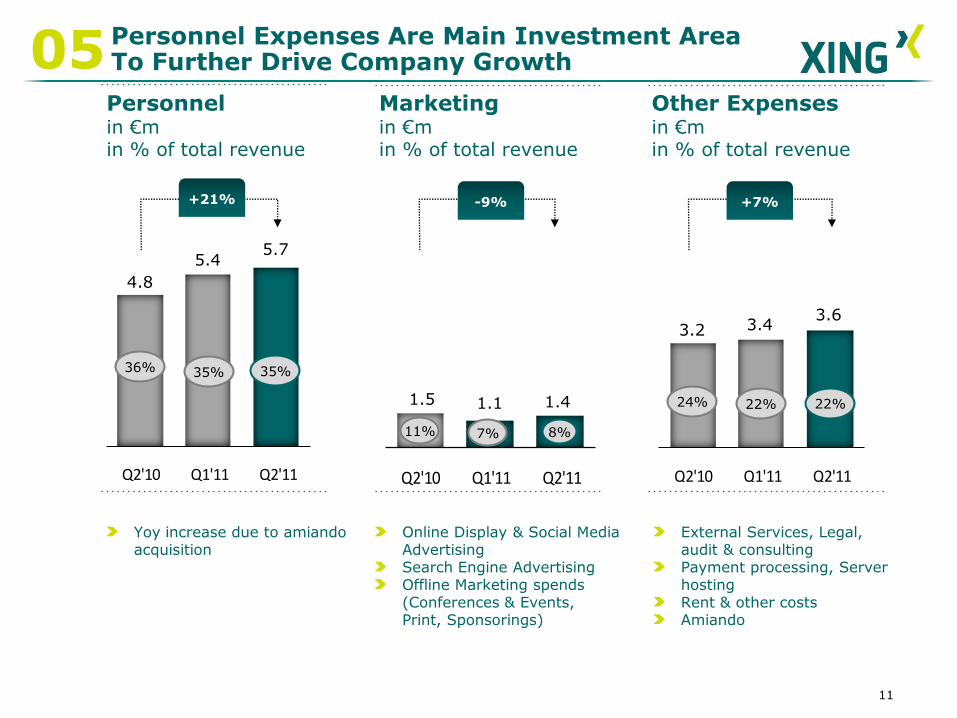
Personnel Expenses Are Main Investment Area To Further Drive Company Growth
Personnelin €min % of total revenue
Marketingin €min % of total revenue
Other Expensesin €min % of total revenue
Yoy increase due to amiandoacquisition
Online Display & Social Media AdvertisingSearch Engine AdvertisingOffline Marketing spends (Conferences & Events, Print, Sponsorings)
External Services, Legal, audit & consultingPayment processing, Server hostingRent & other costsAmiando
05
Q2'10 Q1'11 Q2'11
36% 35%
+21%
Q2'10 Q1'11 Q2'11
11% 7%
-9%
Q2'10 Q1'11 Q2'11
24% 22%
+7%
35%
22%
8%
11
4.8
5.45.7
1.5 1.1 1.4
3.2 3.43.6
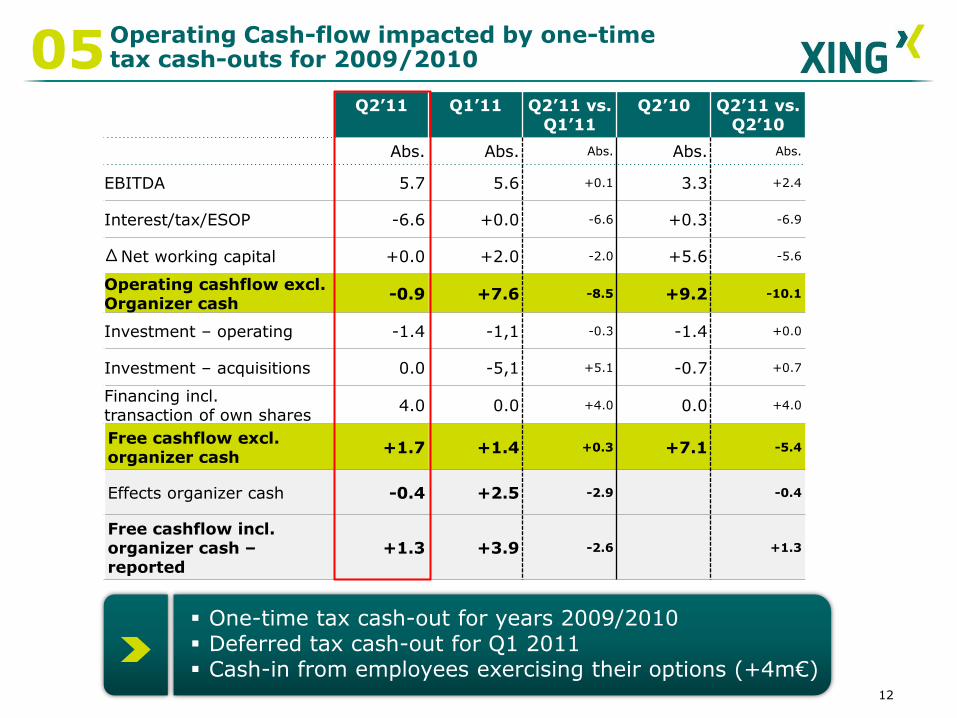
Operating Cash-flow impacted by one-time tax cash-outs for 2009/201005
12
Q2’11 Q1’11 Q2’11 vs. Q1’11
Q2’10 Q2’11 vs. Q2’10
Abs. Abs. Abs. Abs. Abs.
EBITDA 5.7 5.6 +0.1 3.3 +2.4
Interest/tax/ESOP -6.6 +0.0 -6.6 +0.3 -6.9
Net working capital +0.0 +2.0 -2.0 +5.6 -5.6
Operating cashflow excl. Organizer cash
-0.9 +7.6 -8.5 +9.2 -10.1
Investment – operating -1.4 -1,1 -0.3 -1.4 +0.0
Investment – acquisitions 0.0 -5,1 +5.1 -0.7 +0.7
Financing incl. transaction of own shares
4.0 0.0 +4.0 0.0 +4.0
Free cashflow excl. organizer cash
+1.7 +1.4 +0.3 +7.1 -5.4
Effects organizer cash -0.4 +2.5 -2.9 -0.4
Free cashflow incl. organizer cash –reported
+1.3 +3.9 -2.6 +1.3
One-time tax cash-out for years 2009/2010 Deferred tax cash-out for Q1 2011 Cash-in from employees exercising their options (+4m€)

Thank youfor your attention!
POWERING RELATIONSHIPSWWW.XING.COM

XING AG IR statsMarket cap: ~€240m / ~€63m cash / No debt
Average Trading Volume per day (XETRA)2011e 2012e 2013e
Total revenues 65.7 77.3 88.6
EBITDA 20.8 25.6 29,9
Margin 32% 33% 34%
Depreciation -6.0 -6.9 -7.4
EBIT 14.8 18,7 22.5
Margin 22% 24% 25%
Net income 10.0 12.9 15.7
EPS in € 1.89 2.46 2.98
Free cash flow 7.7 15.1 17.0
Analyst coverage
Deutsche Bank, DZ Bank,
Hauck & Aufhäuser, HSBC,
Montega AG, Close Brothers
Shares 5,394,172
Consensus
(August,
2011)
Free float according to Deutsche Börse: 68.8%
TecDax ranking end of July 2011
Market Cap. 27
Turnover 31
38014684
8214
5996
17456
14247
24006
115941350014234
22191
17306
25705
Jul 10 Aug 10 Sep 10 Oct 10 Nov 10 Dez 10 Jan 11 Feb 11 Mrz 11 Apr 11 Mai 11 Jun 11 Jul 11

XING share price since IPO in Dec 2006 (as of August 9, 2011)
+46% 0% -17% -9%
30€
44€
0%
50%
100%
150%
200%
250%
XING AG TecDAX SDAX DAX

Investor RelationsContact details
Patrick Möller
Director Investor Relations
XING AGGänsemarkt 4320354 HamburgGermany
Tel.: +49 (0)40 419 131-793Fax.: +49 (0)40 419 131-44 (Please use this number to submit “WpHG notifications”)
Email.: [email protected]
Website: http://corporate.xing.com/english/investor-relations/
http://www.youtube.com/user/XINGcom
Follow us on twitter:http://twitter.com/xing_ir