Road Safety Unit C – Handling Data Answer a set of related questions by collecting, selecting and...
24
Road Safety Unit C – Handling Data •Answer a set of related questions by collecting, selecting and organising relevant data (Year 5) •Draw conclusions using ICT to present features and identify further questions to ask (Year 5) •Construct frequency tables, pictograms and bar and line graphs to represent the frequencies of events and changes over time (Year 5) •Solve problems by collecting, selecting, processing, presenting and interpreting data, using ICT where appropriate, draw conclusions and identify further questions to ask (Year 6) •Construct and interpret frequency tables, bar charts with grouped discrete data and line graphs; interpret pie charts (Year 6) •Find and interpret mode of a set of data (Year 5) •Describe and interpret results and solutions to problems using the mode, mean, median and range (Year 6)
-
Upload
christina-marshall -
Category
Documents
-
view
215 -
download
0
Transcript of Road Safety Unit C – Handling Data Answer a set of related questions by collecting, selecting and...

Road SafetyUnit C – Handling Data
•Answer a set of related questions by collecting, selecting and organising relevant data (Year 5)•Draw conclusions using ICT to present features and identify further questions to ask (Year 5)•Construct frequency tables, pictograms and bar and line graphs to represent the frequencies of events and changes over time (Year 5)•Solve problems by collecting, selecting, processing, presenting and interpreting data, using ICT where appropriate, draw conclusions and identify further questions to ask (Year 6)•Construct and interpret frequency tables, bar charts with grouped discrete data and line graphs; interpret pie charts (Year 6)•Find and interpret mode of a set of data (Year 5)•Describe and interpret results and solutions to problems using the mode, mean, median and range (Year 6)

freq
uen
cy
types of vehicles
bu
s
0
20
40
60
80
120
100
van
bic
ycle
car
lorr
y
moto
rbik
e

typ
es o
f veh
icle
frequency
20 40 60 80 100
0
bus
van
car
bicycle
lorry
motorbike


Days of the Week
Pictogram to show numbers of bicycles sold in
one week
Mon Tues Wed Thurs Fri Sat
= 10 cycles

Pictogram - Frequency Table
Cycle helmet Number sold
Trailblazer 24
Valhalla 37
Firefox 25
Valkyrie 16
Vixen 44
Rally 35
Roadrunner 41
Sonic III 29
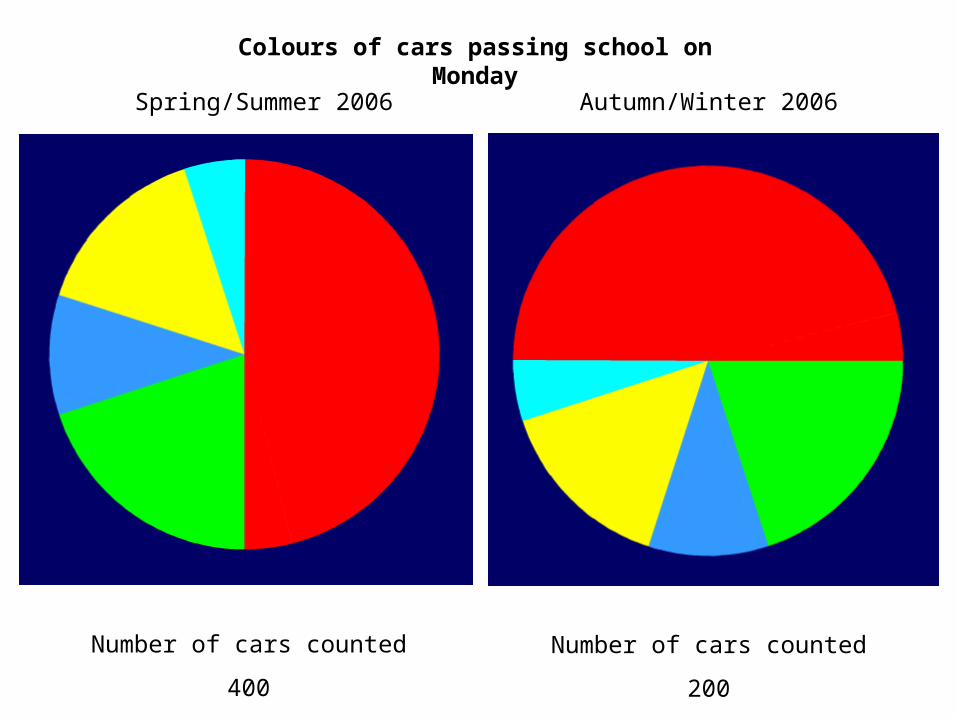
Spring/Summer 2006 Autumn/Winter 2006
Number of cars counted
400
Number of cars counted
200
Colours of cars passing school on Monday

Number of people passing their driving test by gender

Pie Chart Questions
1. What percentage of women passed their driving test in 1975 - 1976?
2. What percentage of men passed their driving tests between 1985 – 1986??
3. How many more men than women passed their driving tests in 2002?
4. Estimate how many men passed their driving tests in the period shown altogether.
5. What might the data look like for 2006? Explain why you think this.

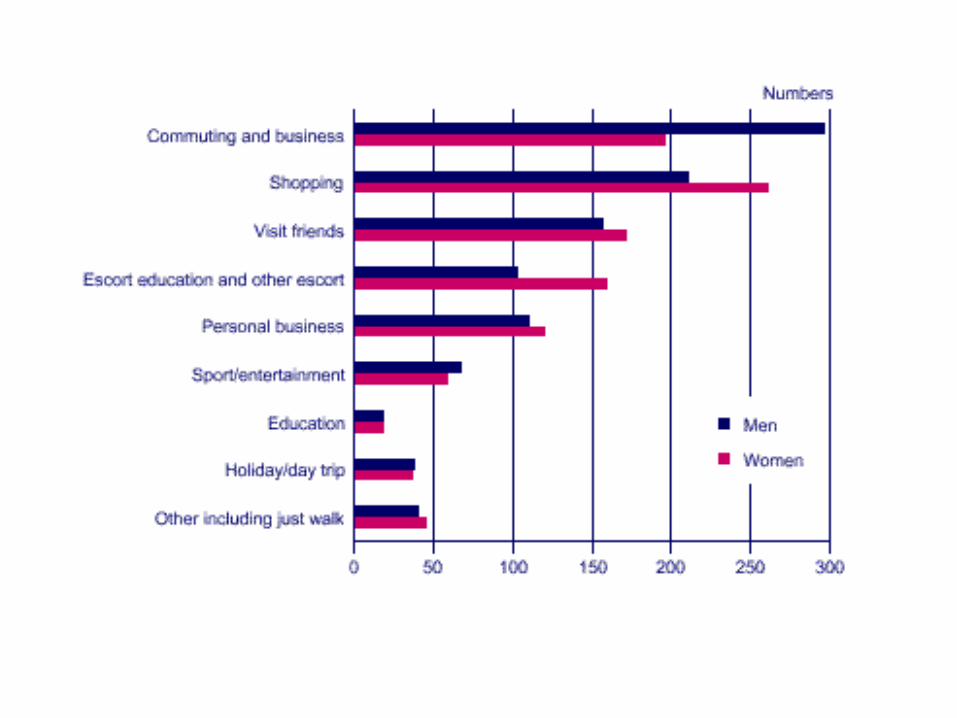
Travelling to school
summer?
Travelling to school
winter?
OR

David climbs up to the top of the slide. He jumps onto the slide, slides down and then jumps up and off at the end.
Lewis walks to the start of the race and then sprints for the next 100 metres after which he sits down and recovers.
The water in the kettle takes 2 minutes to reach boiling point. It boils for another
minute before it’s taken off the heat and the water cools
down.
Graphical Stories

Line graph to show a cyclist’s journey
Time (mins)
Distance (m)
0 10 20 30 40
20
40
60
0 5 10 15 20
20
40
60
80
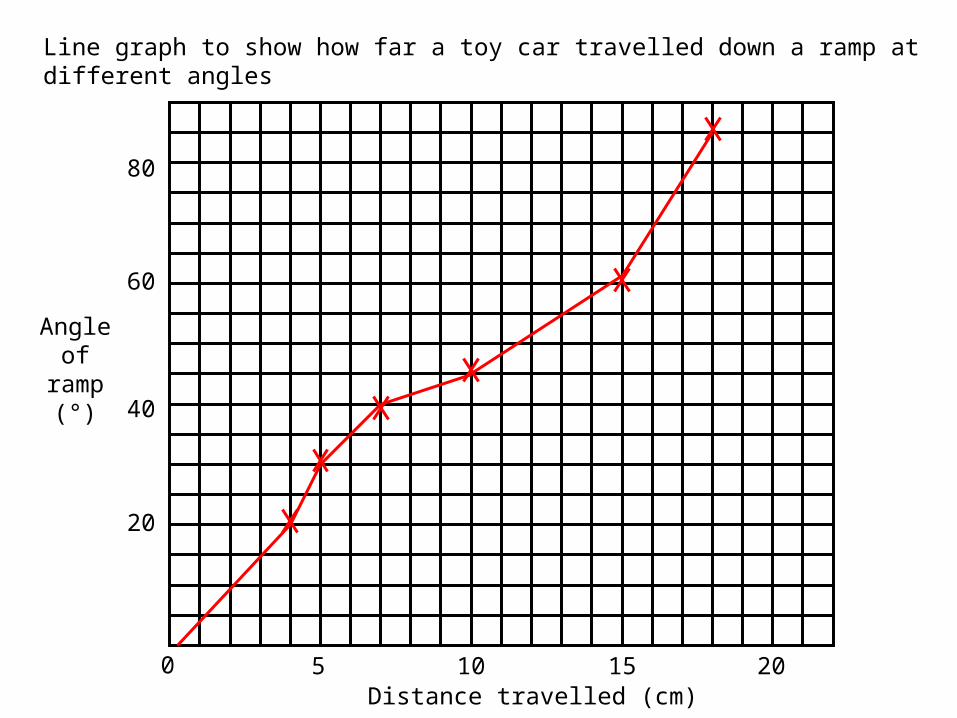
Distance travelled (cm)
Angle of ramp
(°)
Line graph to show how far a toy car travelled down a ramp at different angles
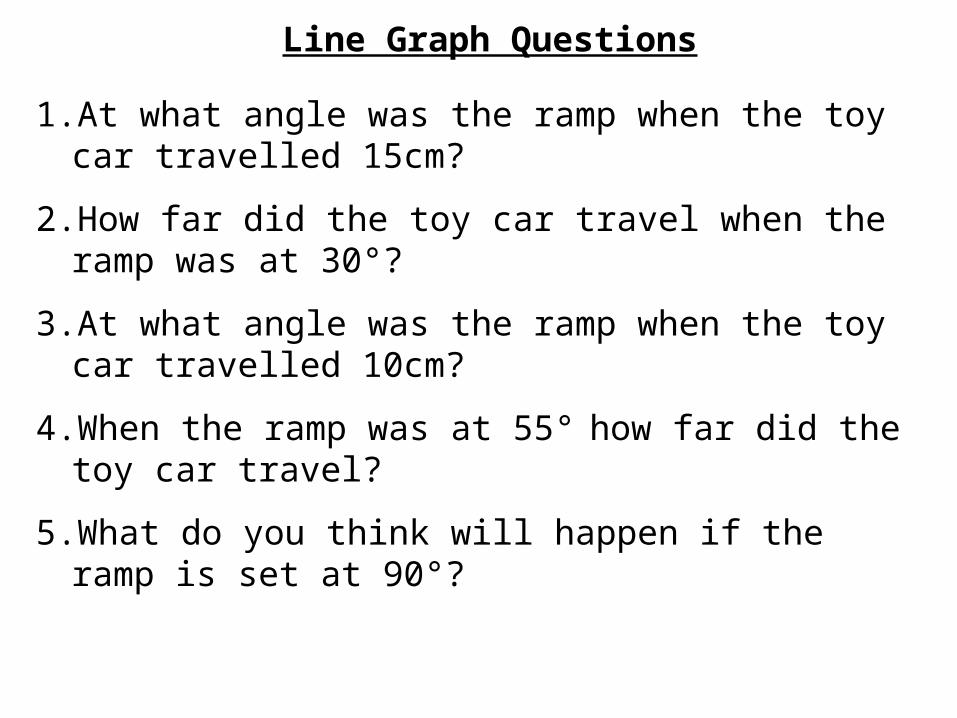
Line Graph Questions
1.At what angle was the ramp when the toy car travelled 15cm?
2.How far did the toy car travel when the ramp was at 30°?
3.At what angle was the ramp when the toy car travelled 10cm?
4.When the ramp was at 55° how far did the toy car travel?
5.What do you think will happen if the ramp is set at 90°?

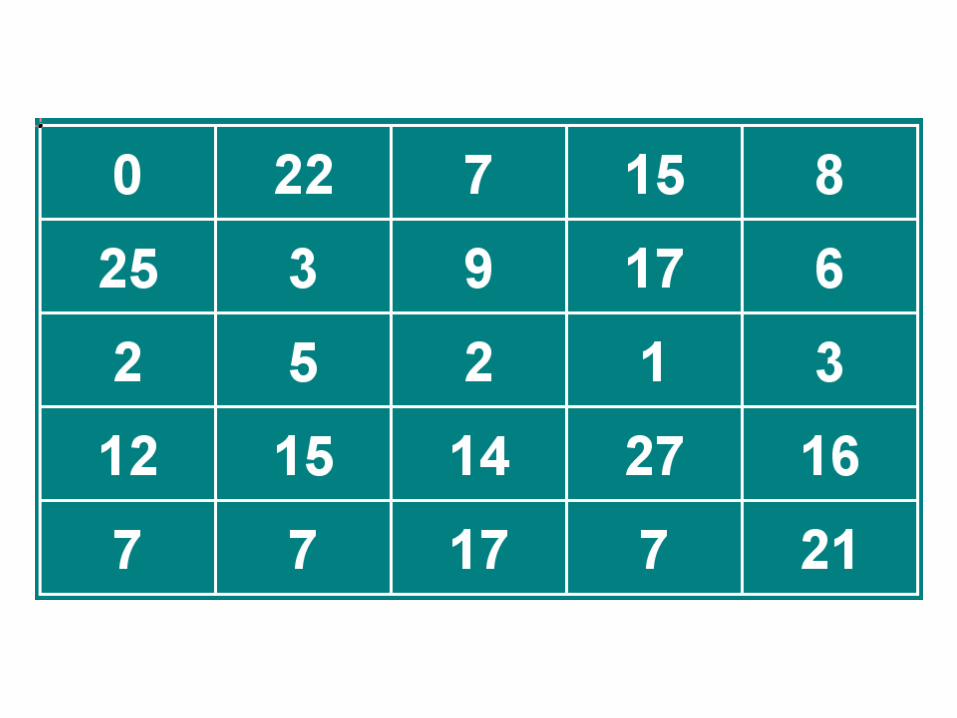
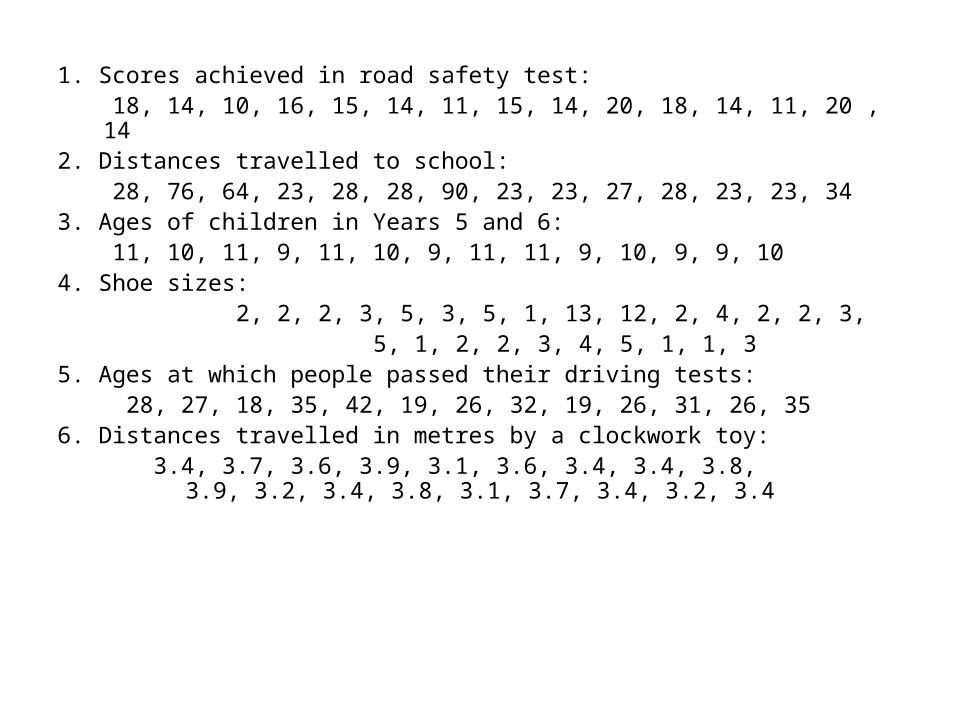
1. Scores achieved in road safety test: 18, 14, 10, 16, 15, 14, 11, 15, 14, 20, 18, 14, 11, 20 , 142. Distances travelled to school: 28, 76, 64, 23, 28, 28, 90, 23, 23, 27, 28, 23, 23, 343. Ages of children in Years 5 and 6: 11, 10, 11, 9, 11, 10, 9, 11, 11, 9, 10, 9, 9, 104. Shoe sizes: 2, 2, 2, 3, 5, 3, 5, 1, 13, 12, 2, 4, 2, 2, 3, 5, 1, 2, 2, 3, 4, 5, 1, 1, 35. Ages at which people passed their driving tests: 28, 27, 18, 35, 42, 19, 26, 32, 19, 26, 31, 26, 356. Distances travelled in metres by a clockwork toy: 3.4, 3.7, 3.6, 3.9, 3.1, 3.6, 3.4, 3.4, 3.8, 3.9, 3.2,
3.4, 3.8, 3.1, 3.7, 3.4, 3.2, 3.4