

Road Safety Strategic Approach in Spain Alvaro Gomez Mendez .pdf · 2019-06-13 · 8. Zero car...
19
Road Safety Strategic Approach in Spain Álvaro Gómez Méndez Head of the National Road Safety Observatory Directorate General for Traffic (DGT) Road Safety Authority Annual International Conference International Best Practice in Road Safety Strategy Development Dublin, 13 June 2019
Transcript of Road Safety Strategic Approach in Spain Alvaro Gomez Mendez .pdf · 2019-06-13 · 8. Zero car...
Road Safety Strategic
Approach in Spain
Álvaro Gómez Méndez
Head of the National Road Safety Observatory
Directorate General for Traffic (DGT)
Road Safety Authority Annual International Conference
International Best Practice in Road Safety Strategy Development
Dublin, 13 June 2019
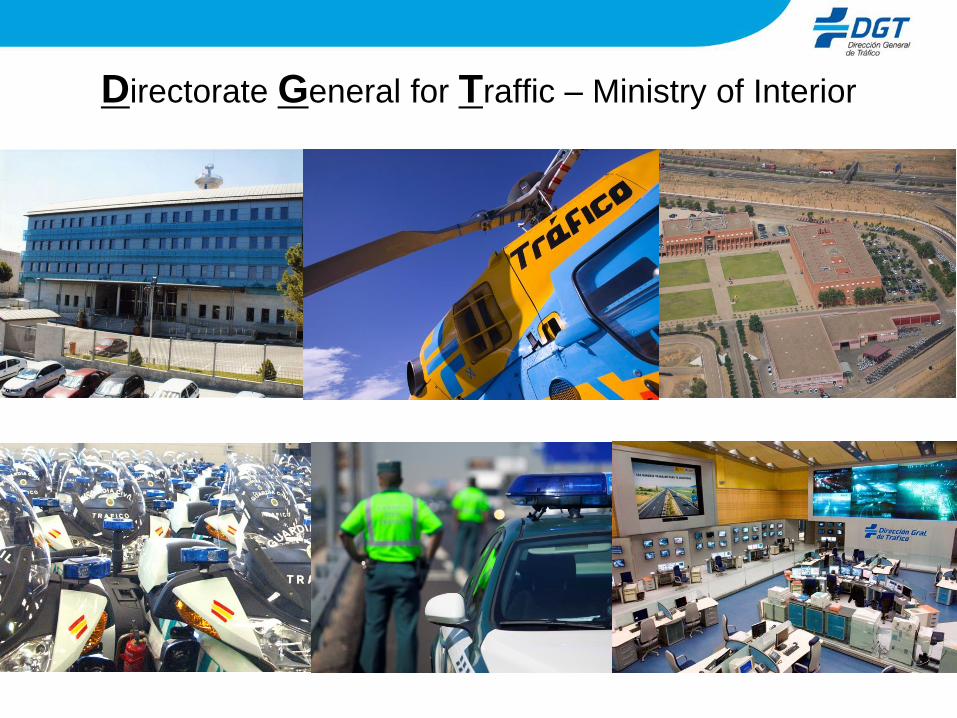
Directorate General for Traffic – Ministry of Interior

DGT: Lead agency for road safety
Road Safety Strategies and Plans.
National Road Safety Council.
Data, indicators, research.
Traffic rules.
Implementation: traffic management and
enforcement, driving licensing, penalty point
system.
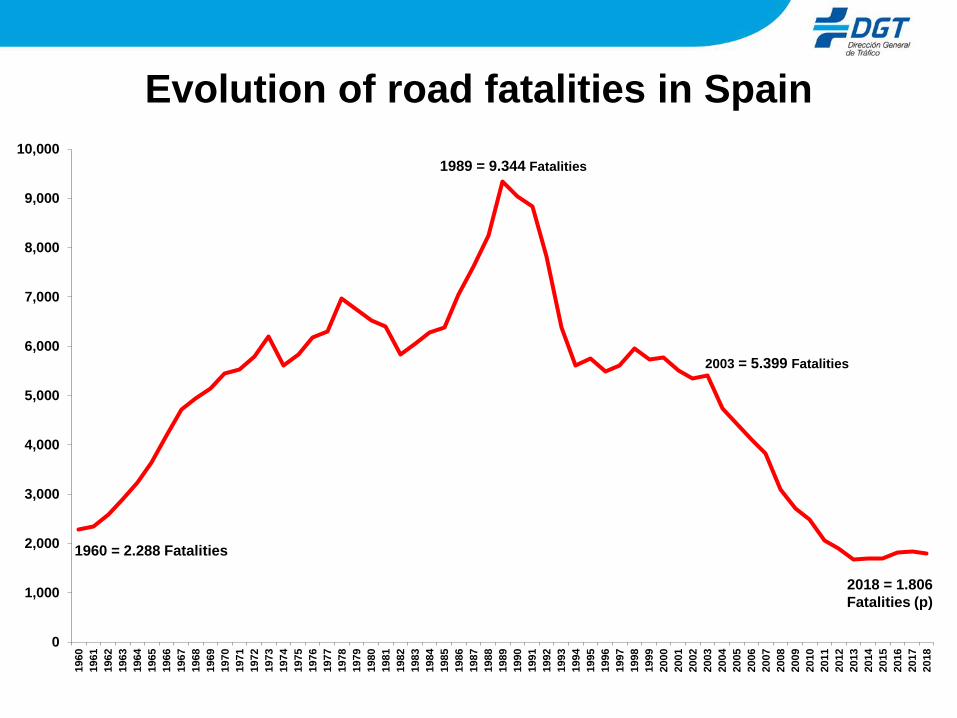
Evolution of road fatalities in Spain
0
1,000
2,000
3,000
4,000
5,000
6,000
7,000
8,000
9,000
10,000
1960
1961
1962
1963
1964
1965
1966
1967
1968
1969
1970
1971
1972
1973
1974
1975
1976
1977
1978
1979
1980
1981
1982
1983
1984
1985
1986
1987
1988
1989
1990
1991
1992
1993
1994
1995
1996
1997
1998
1999
2000
2001
2002
2003
2004
2005
2006
2007
2008
2009
2010
2011
2012
2013
2014
2015
2016
2017
2018
1989 = 9.344 Fatalities
2018 = 1.806
Fatalities (p)
1960 = 2.288 Fatalities
2003 = 5.399 Fatalities

Spain in the UE context
2003
EU average: 104 fatalities mill. pop.
Spain: 126 104 fatalities mill. pop.
2018
EU average : 49 fatalities mill. pop.
Spain: 39 fatalities mill. pop.
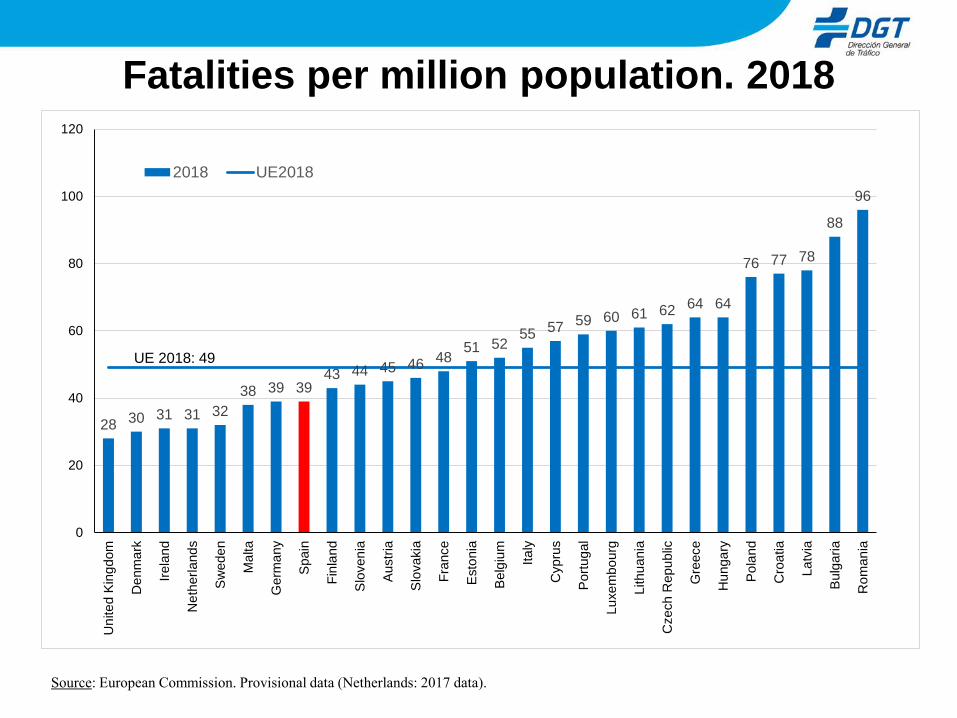
Fatalities per million population. 2018
28 30 31 31 32
38 39 3943 44 45 46 48
51 5255 57 59 60 61 62 64 64
76 77 78
88
96
0
20
40
60
80
100
120
Un
ite
d K
ing
dom
De
nm
ark
Irela
nd
Ne
therl
and
s
Sw
ede
n
Ma
lta
Germ
any
Spain
Fin
land
Slo
ven
ia
Austr
ia
Slo
vakia
Fra
nce
Esto
nia
Belg
ium
Ita
ly
Cypru
s
Port
ug
al
Lu
xe
mbo
urg
Lithu
ania
Czech R
epu
blic
Gre
ece
Hu
nga
ry
Pola
nd
Cro
atia
La
tvia
Bulg
aria
Ro
man
ia
2018 UE2018
UE 2018: 49
Source: European Commission. Provisional data (Netherlands: 2017 data).
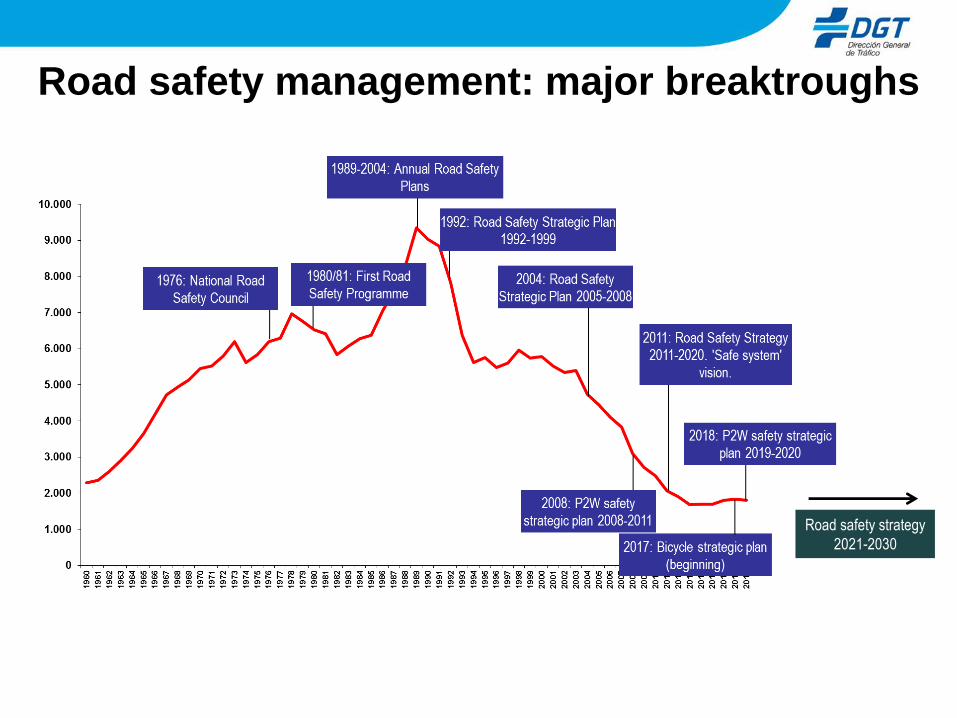
Road safety management: major breaktroughs
Road safety strategy
2021-2030
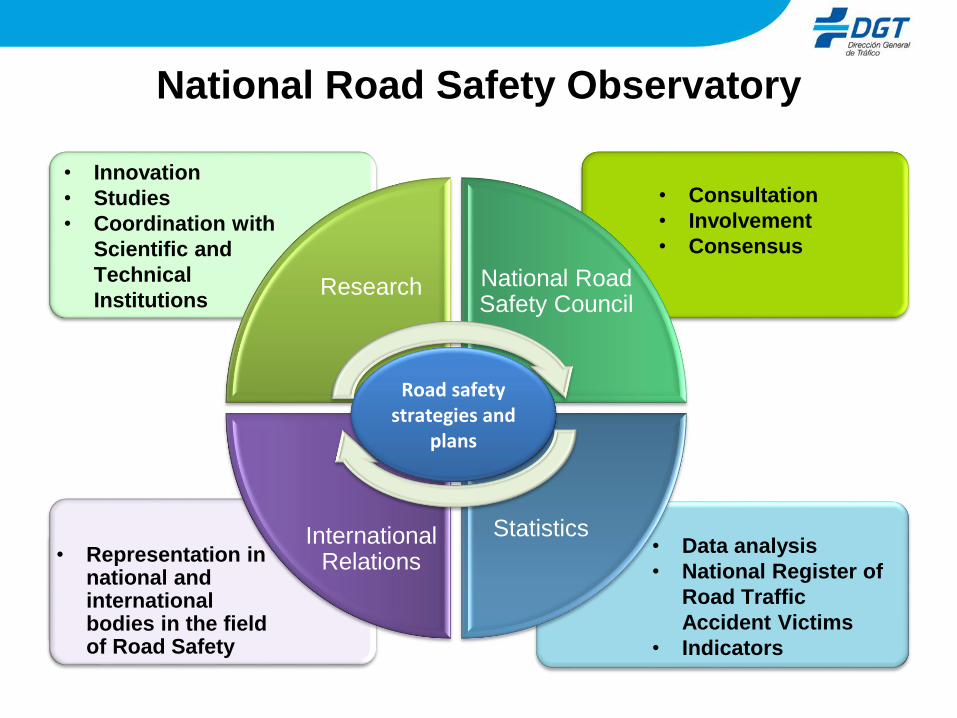
• Consultation
• Involvement
• Consensus
• Innovation
• Studies
• Coordination with
Scientific and
Technical
Institutions
• Data analysis
• National Register of
Road Traffic
Accident Victims
• Indicators
• Representation in national and international bodies in the field of Road Safety
Research National Road Safety Council
StatisticsInternational Relations
Road safety strategies and
plans
National Road Safety Observatory

Road Safety Strategy 2011-2020
Vision: Safe System
“The citizens have the right to a
Safe Mobility System in which
everyone, citizens and agents
involved, has a responsibility”
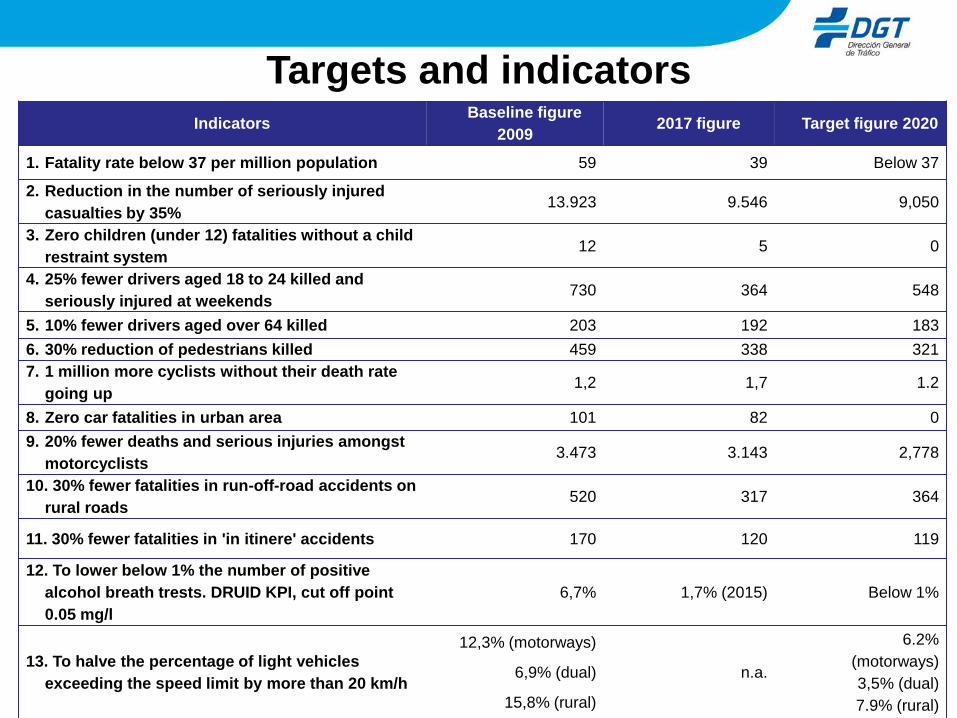
IndicatorsBaseline figure
2009 2017 figure Target figure 2020
1. Fatality rate below 37 per million population 59 39 Below 37
2. Reduction in the number of seriously injured
casualties by 35%13.923 9.546 9,050
3. Zero children (under 12) fatalities without a child
restraint system12 5 0
4. 25% fewer drivers aged 18 to 24 killed and
seriously injured at weekends730 364 548
5. 10% fewer drivers aged over 64 killed 203 192 183
6. 30% reduction of pedestrians killed 459 338 321
7. 1 million more cyclists without their death rate
going up 1,2 1,7 1.2
8. Zero car fatalities in urban area 101 82 0
9. 20% fewer deaths and serious injuries amongst
motorcyclists 3.473 3.143 2,778
10. 30% fewer fatalities in run-off-road accidents on
rural roads 520 317 364
11. 30% fewer fatalities in 'in itinere' accidents 170 120 119
12. To lower below 1% the number of positive
alcohol breath trests. DRUID KPI, cut off point
0.05 mg/l
6,7% 1,7% (2015) Below 1%
13. To halve the percentage of light vehicles
exceeding the speed limit by more than 20 km/h
12,3% (motorways)
6,9% (dual)
15,8% (rural)
n.a.
6.2%
(motorways)
3,5% (dual)
7.9% (rural)
Targets and indicators
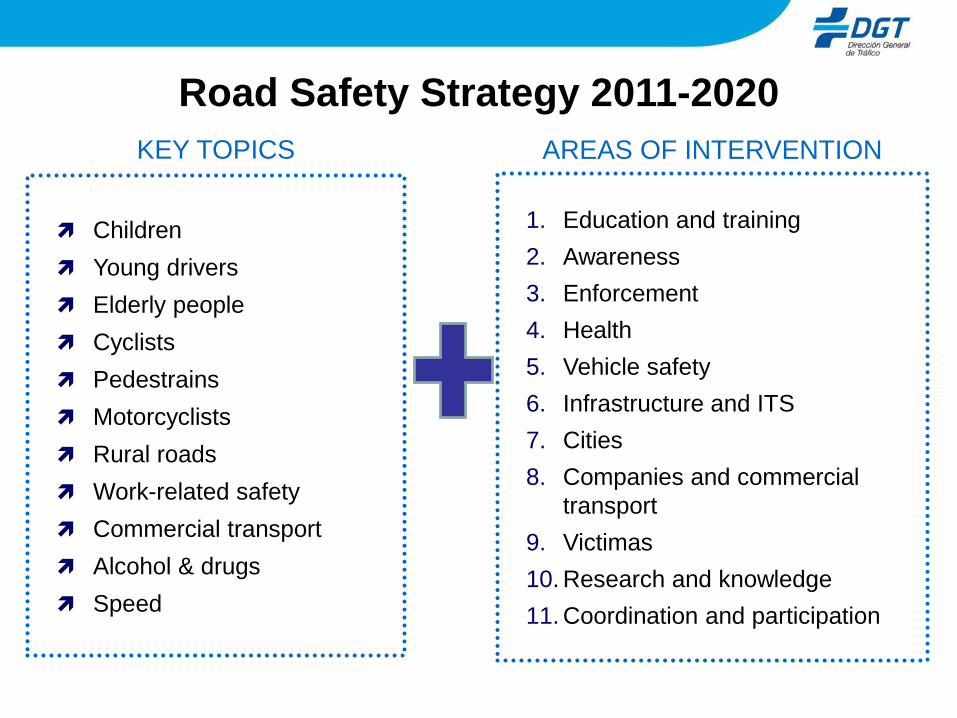
Children
Young drivers
Elderly people
Cyclists
Pedestrains
Motorcyclists
Rural roads
Work-related safety
Commercial transport
Alcohol & drugs
Speed
1. Education and training
2. Awareness
3. Enforcement
4. Health
5. Vehicle safety
6. Infrastructure and ITS
7. Cities
8. Companies and commercial
transport
9. Victimas
10. Research and knowledge
11. Coordination and participation
KEY TOPICS AREAS OF INTERVENTION
Road Safety Strategy 2011-2020

- Mid-term evaluation in 2015: monitoring of strategic
indicators and targets, review of the level of
implementation of actions, update of the strategy.
Results: 84% of actions finalised or initiated.
- Stakeholders meet at different Working Groups of the
National Road Safety Council.
- Monitoring of indicators:
Fatality rate and serious injuries.
Elderly drivers, vulnerable road users, cities,
alcohol, speed.
Road Safety Strategy 2011-2020
So far(2004-2018)
Short term(2019-2020)
New decade(2021-2030)
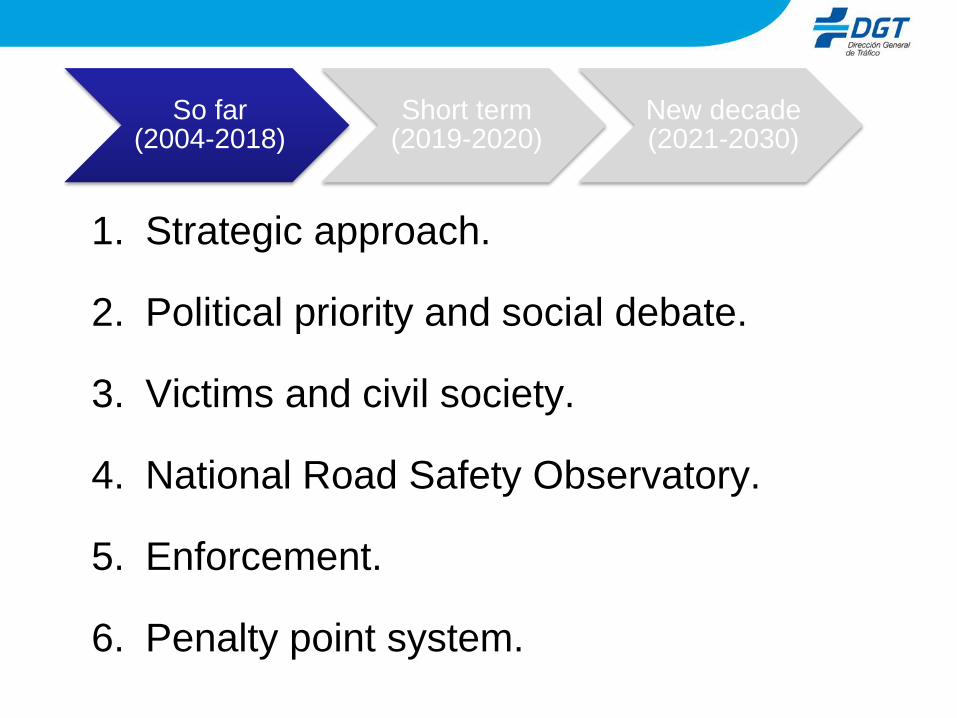
1. Strategic approach.
2. Political priority and social debate.
3. Victims and civil society.
4. National Road Safety Observatory.
5. Enforcement.
6. Penalty point system.
So far(2004-2018)
Short term(2019-2020)
New decade(2021-2030)

7. Crime code, prosecutor.
8. Work-related and urban safety.
9. Powered two wheelers.
10.Fleet renewal and condition.
11.EU RISM.
12.Speed limit rural roads.
So far(2004-2018)
Short term(2019-2020)
New decade(2021-2030)

1. 30 kph.
2. New means of transportation.
3. Driver training.
4. Improvement of PPS.
5. P2Ws.
6. Data and indicators.
So far(2004-2018)
Short term(2019-2020)
New decade(2021-2030)
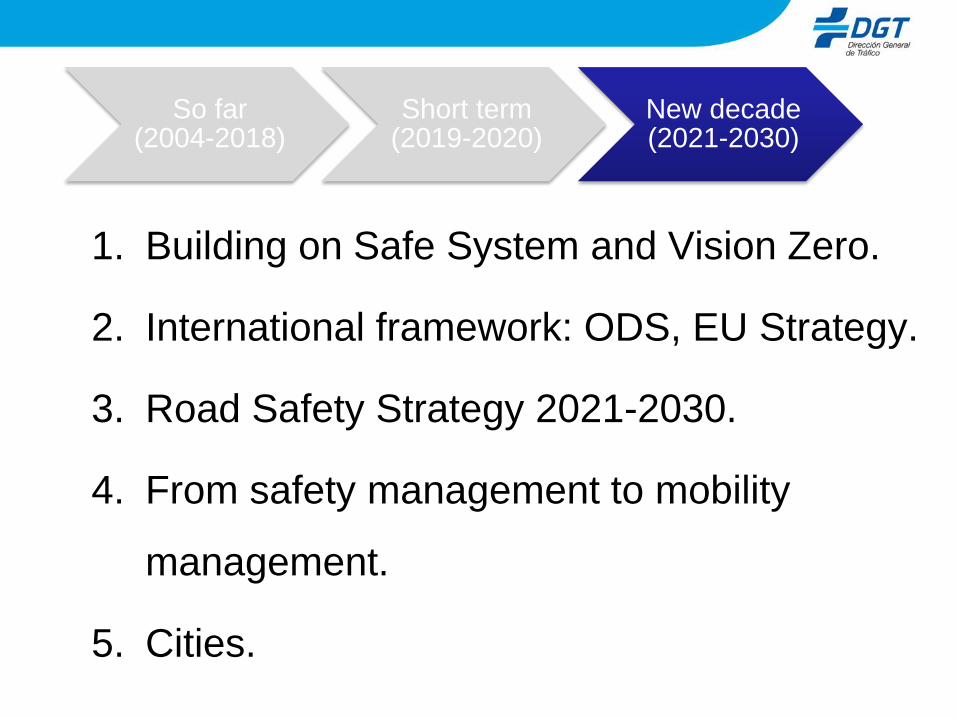
1. Building on Safe System and Vision Zero.
2. International framework: ODS, EU Strategy.
3. Road Safety Strategy 2021-2030.
4. From safety management to mobility
management.
5. Cities.
So far(2004-2018)
Short term(2019-2020)
New decade(2021-2030)
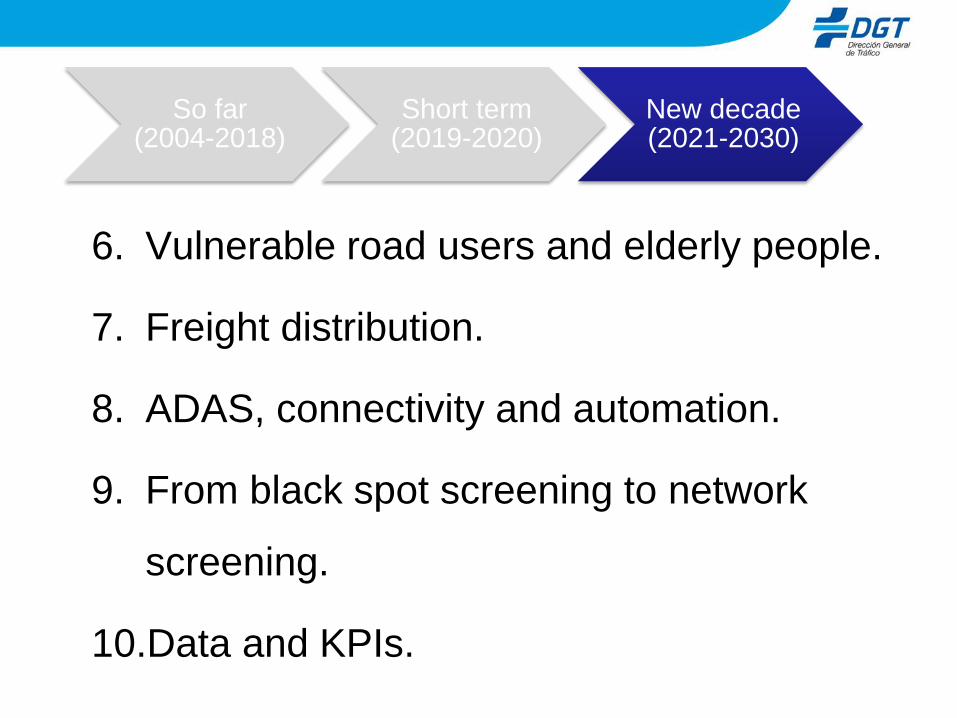
6. Vulnerable road users and elderly people.
7. Freight distribution.
8. ADAS, connectivity and automation.
9. From black spot screening to network
screening.
10.Data and KPIs.
So far(2004-2018)
Short term(2019-2020)
New decade(2021-2030)