Road Accidents, Police Performance, and Modern …police.rajasthan.gov.in/Rajpolice/pdf-files/Drunk...
37
Road Accidents, Police Performance, and Modern Technology A Collaboration Between: The Rajasthan Police and The MIT J-Poverty Action Lab
-
Upload
phungtuong -
Category
Documents
-
view
218 -
download
4
Transcript of Road Accidents, Police Performance, and Modern …police.rajasthan.gov.in/Rajpolice/pdf-files/Drunk...

Road Accidents, Police
Performance, and Modern
Technology
A Collaboration Between:
The Rajasthan Policeand
The MIT J-Poverty Action Lab

Overview
� An old problem
Road accidents killed more than 9100 people in Rajasthan in 2010, and injured more than 31,000.
� A modern solution
Our initiative is India’s first rigorous evaluation of the use of 2 modern technologies in policing:
� Breath analyzer devices� Breath analyzer devices
� GPS monitoring
� Collaboration between Rajasthan Police and Massachusetts Institute of Technology (USA).
� Program conducted in 183 police stations across 11 police districts:
1. Alwar 5. Bhilwara 9. Jodhpur
2. Ajmer 6. Bikaner 10. Sikar
3. Banswada 7. Bundu 11. Udaipur
4. Bharatpur 8. Jaipur Rural

Three Main Questions
1. Are checkpoints with breath analyzers effective in reducing road accidents and deaths?
2. Which personnel should carry out checkpoints?
� Normal thana staffNormal thana staff
� Dedicated staff
3. Which locations should the police target for drunken driving checkpoints?
� Always at the best location to catch drunks
� Alternate locations to maintain element of surprise

Personnel EffectivenessWe tried two different kinds of teams:
1. “Thana” teams:
� Teams from local thana carry out checkpoint (standard Rajasthan Police procedure).
� Monitored by normal police chain of command.� Monitored by normal police chain of command.
2. “Lines” teams:
� Dedicated teams from police lines travelled to thanas to carry out checkpoints.
� Monitored by:
� Normal police chain of command
� GPS device installed in police lines vehicle: Vehicle location visible in real time at SP’s office/control room

GPS Tracking:
J-PAL purchased 22 vehicle-based � J-PAL purchased 22 vehicle-based GPS devices (TrackingGenie)
� Device features:� Provides real-time information about
vehicle location
� Maintains a record of vehicle’s travel history
� Displays GPS information via an online Google Maps portal accessible to District Police, J-PAL researchers

Checkpoint LocationsAll checkpoints held from 7:00pm-10:00pm
1. “Fixed” checkpoints
� Always held at same location.
� Location chosen by SHO as best for reducing drunken driving accidents.accidents.
2. “Surprise” checkpoints
� Location rotates randomly between 3 top locations chosen by SHO for stopping drunk drivers. Example:
District Station Strategy Location 1 Location 2 Location 3
Jaipur Rural
Jobner Surprise College TirayaKalwad Road Thane
ke PaasBaurajTiraya
Jaipur Rural
Samod Surprise Samod Bus Stand MhaurTirayaMaurija Road KaaglyaHanuman Ji Ke Paas
Jaipur Rural Phulera Surprise
Purana PhuleraChuraya
Kaachroda Phatak Bus Stand Ke Paas
Etc… … … …

Strategy: Hard Data
J-PAL and Police collected objective evidence from a variety of sources:
� Police accident data
� Daily accidents from 1/8/2010 to 31/12/2011
� Monthly accident data till February, 2012
Independent checkpoint monitors� Independent checkpoint monitors
� Number and type of vehicles passing, stopped, and given challan for drunk driving.
� Attendance and timing of police at checkpoint.
� Court records on drunk drivers’ legal outcomes
� Date, vehicle type, alcohol level of driver.
� Whether driver acquitted or fined, and fine amount.

Strategy: Randomization
� 183 police thanas randomly assigned to different teams and different strategies, with 60 kept as control.
� Why randomize? Why randomize?
� Treatment and control groups are as similar to each other as possible.
� Outcomes in control group provide accurate comparison for measuring outcomes in treatment group.
� Program can be implemented in any police thana – not just the best or the worst.

Context for Results:
� On average, from August 2010 to December 2011, police stations had:
� 3.7 accidents per month
� 1.5 deaths per month
� Out of these,
� 1.1 accidents occurred at night.
� .54 deaths occurred at night.

Which vehicles should police
stop at checkpoints?
3.0%
3.5%
4.0%
Percentage of Stopped Drivers Found DrunkBy Vehicle Type
0.0%
0.5%
1.0%
1.5%
2.0%
2.5%
3.0%
Motorcycles Cars Trucks Luxury Cars
Overall: 2.23%

What day should
checkpoints be held?
1.5
2%
fou
nd
dru
nk
By Day of Week
Percentage of Stopped Drivers Found Drunk0
.51
% f
ou
nd
dru
nk
Sunday Monday Tuesday WednesdayThursday Friday Saturday
Note: data from surveys held during program period. Absolute percentages may be unreliable.

Results
Accidents & DeathsAccidents & Deaths

Interpreting Graphs
� For each outcome, we have:
1. An estimate of how big the effect is
2. A “confidence interval” around that estimate:
With 95% probability the true effect lies in the confidence interval.interval.
� Example:
-30%
-25%
-20%
-15%
-10%
-5%
0%
Our best estimate of the effect
Effect lies in this range with 95% probability

Accident Results
� Overall Results
� Small effects during program period – max 15% reduction in deaths at night
� Larger effects on all outcomes after the program
Fixed vs. Surprise� Fixed vs. Surprise
� Lines vs. Thanas
� Frequency of checkpoints

Overall Results:
-10%
0%
10%
20%
Accidents Deaths Night accidents Night deaths
-60%
-50%
-40%
-30%
-20%
-10%
During Program 60 Days after

Accident Results
� Overall Results
� Fixed vs. Surprise
� Surprise maybe better than fixed – sample too small to be sure.
� Significant effects on deaths during program and accidents after program.
� Big (>20%) estimated effects of surprise checkpoints on nighttime accidents and deaths.
� Lines vs. Thanas
� Frequency of checkpoints

Fixed vs. Surprise
-10%
0%
10%
20%
Accidents Deaths Night accidents Night deaths
-60%
-50%
-40%
-30%
-20%
-10%
Fixed locations Surprise locations
Fixed, 60 days after Surprise, 60 days after

Accident Results
� Overall Results
� Fixed vs. Surprise
� Lines vs. Thanas
� Thanas consistently have higher estimated effects, but not � Thanas consistently have higher estimated effects, but not significant.
� Frequency of checkpoints

Accident Results
� Overall Results
� Fixed vs. Surprise
� Lines vs. Thanas
� Frequency of checkpoints� Frequency of checkpoints
� Effectiveness clearly highest at 3 checkpoints/week

2.5%
3.0%
3.5%
4.0%
Percentage of Stopped Drivers Found DrunkBy Type of Vehicle and Treatment
For which vehicle types is
enforcement most effective?
0.0%
0.5%
1.0%
1.5%
2.0%
2.5%
Motorcycles Cars Trucks
Control Fixed Surprise

Results
Checkpoint Implementation: Checkpoint Implementation:
Dedicated Lines Teams vs. Thana Staff

Lines vs. Thana Comparison:
Checkpoint Attendance
40%
60%
80%
100%
0%
20%
40%
Checkpoints Completed
On-time for Checkpoint
Stayed at Checkpoint until
10pm
Lines Thanas

Lines vs. Thana Comparison:
Vehicle Checking
20%
25%
30%
Percentage of Passing Vehicles Stopped by Police
0%
5%
10%
15%
20%
Lines Thanas

Lines vs. Thana Comparison:
Catching Drunks
2.5
3
3.5
Drunk Drivers Caught Per Checkpoint
0
0.5
1
1.5
2
Lines Thanas

Program Implementation:
District-wise Comparison
Checkpoints Attended
Lines Thanas
Ajmer 86.8% 65.8%
Alwar 70.7% 11.4%
53.3% 42.9%
Drunk Drivers Per Checkpoint
Lines Thanas
6.4 1.8
2.6 0.3
0.7 0.4
Passing Vehicles Stopped
Lines Thanas
27.8% 17.3%
15.7% 4.9%
30.1% 24.7%Banswada 53.3% 42.9%
Bharatpur* 37.0% 10.7%
Bhilwara 96.6% 40.2%
Bikaner 80.0% 80.0%
Bundi 80.0% 21.3%
Jaipur Rural 98.2% 89.9%
Jodhpur City 61.9% 48.2%
Sikar 76.6% 70.0%
Udaipur 81.1% 73.0%
*Affected by law and order situation
0.7 0.4
0.6 0.0
2.1 0.9
1.5 1.1
1.5 1.0
3.8 3.7
0.8 0.9
2.6 0.6
1.7 0.8
30.1% 24.7%
13.8% 7.2%
23.0% 23.2%
14.0% 8.4%
19.7% 10.7%
38.8% 28.6%
10.9% 2.2%
34.7% 13.8%
16.9% 15.1%

Teams’ Performance Over Time

Teams’ Performance Over Time

Lines vs. Thanas
� Lines consistently outperform thanas
but
� This performance does not translate into significantly greater reductions in accidents and deaths.greater reductions in accidents and deaths.
� Not clear why this is the case. Further analysis may yield more insights.

Results
Public Response to EnforcementPublic Response to Enforcement

Do all drivers learn to avoid
checkpoints?
� We compare the number of vehicles on the road:
� On a night when police are performing a checkpoint
� On a night with no checkpoint at the exact same spot
� Results: 7% fewer vehicle pass by during the � Results: 7% fewer vehicle pass by during the checkpoint.
� Drivers learn to avoid checkpoints
� No significant difference between surprise vs. fixed on passing vehicles.
� Weak evidence that fixed checkpoints have increasingly fewer drivers pass over time.

Do drunk drivers learn to
avoid checkpoints?
� It depends on the type of roadblock:
� Surprise roadblocks: No effect.
� Fixed roadblocks: Number of drunk drivers caught decreases by 3.4% with each previous roadblock.
Effect not due to police burnout.� Effect not due to police burnout.� Police lines teams visited some thanas once, some twice, some
three times per week.
� We compare thanas that have had the same number of check points, done by teams with different experience.
� Results: experience gained from each additional checkpoint increases number of drunks caught by lines teams by 4%.

Results
Court DataCourt Data
Do drunk drivers go to
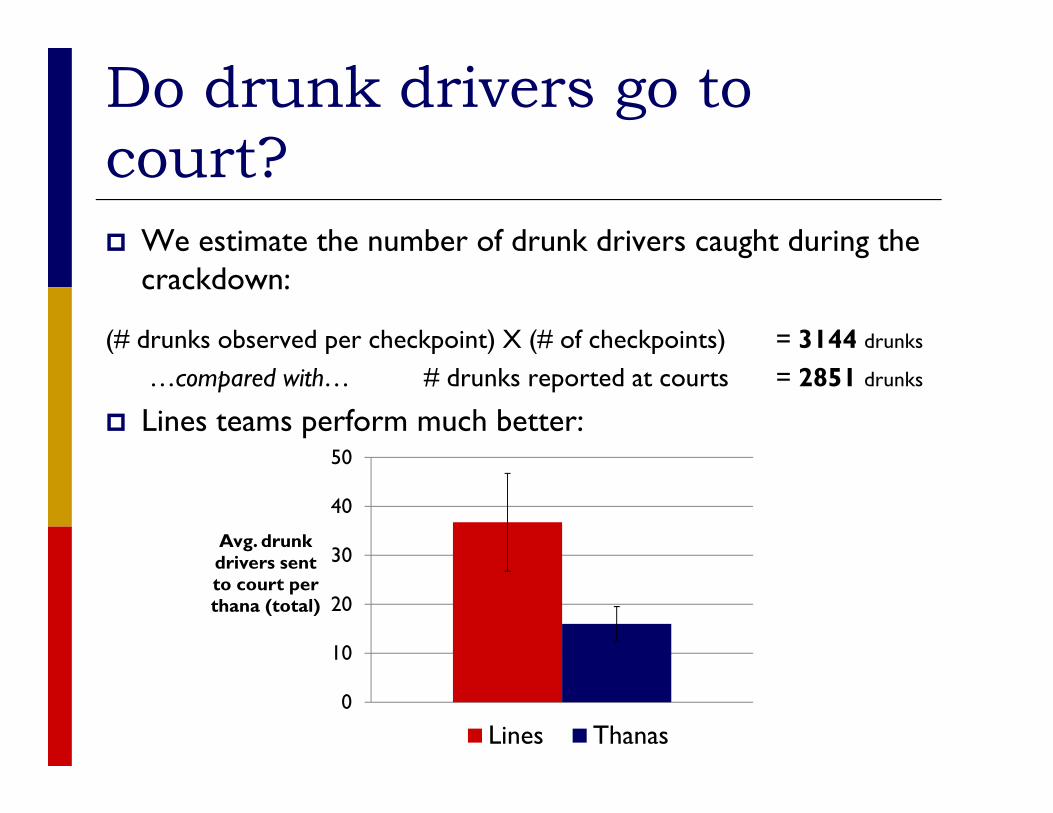
court?
� We estimate the number of drunk drivers caught during the crackdown:
(# drunks observed per checkpoint) X (# of checkpoints) = 3144 drunks
…compared with… # drunks reported at courts = 2851 drunks
Lines teams perform much better:� Lines teams perform much better:
0
10
20
30
40
50
Avg. drunk drivers sent to court per thana (total)
Lines Thanas

What happens when drunken drivers go
to court?
� 93% of drunken drivers pay some fine in court.
� None jailed.
� Average fine is rupees 1094.
Huge variation in fines:
20
Fine Amount
0
5
10
15
Pe
rcen
t
0 1000 2000 3000Fine Amount rs/-

What determines fines?
� Very weak link between severity of drunkeness and amount of fine.
� Slight positive relationship for BAC below 50 mg/100ml. No correlation for higher alcohol levels.
Truck drivers pay more.� Truck drivers pay more.
� Rs. 350 more than motorcyclists, Rs. 200 more than cars.
� Different districts charge very different amounts.
� For the average drunken motorcyclist:
� Highest: Jaipur Rural, Rs. 1608; Alwar, Rs. 1290
� Lowest: Udaipur, Rs. 302; Bikaner, Rs. 380.

Conclusions
� Surprise checkpoints more effective than fixed� Drunks learn about fixed checkpoints and these become
ineffective over time.
� Dedicated teams more effective than thana staff� Combined effect of more focused team, GPS monitoring� Combined effect of more focused team, GPS monitoring
� Caveats:� No clear effect on accidents, deaths
� Difference between dedicated teams and thanas decreases with time
� 3 checkpoints/week most effective, and substantial post-program effects� Suggests that crackdown model may be an efficient way to
allocate police forces.

Thank You