RNA sequencing to detect gene fusions in acute leukaemia ... · RNA sequencing to detect gene...
24
RNA sequencing to detect gene fusions in acute leukaemia: A proof of principle study Melissa Connolly Birmingham Women’s and Children’s NHS trust
Transcript of RNA sequencing to detect gene fusions in acute leukaemia ... · RNA sequencing to detect gene...
RNA sequencing
to detect gene fusions in
acute leukaemia:
A proof of principle study
Melissa ConnollyBirmingham Women’s and Children’s
NHS trust
Acute Leukaemia
• Acquired mutations in haematopoetic stem cell
- Chromosome aberrations
- Gene fusions
- CNVs
- Single base pair mutations
• Results of mutations
- Increased/Decreased expression
- Novel proteins
• Disrupts cell cycle
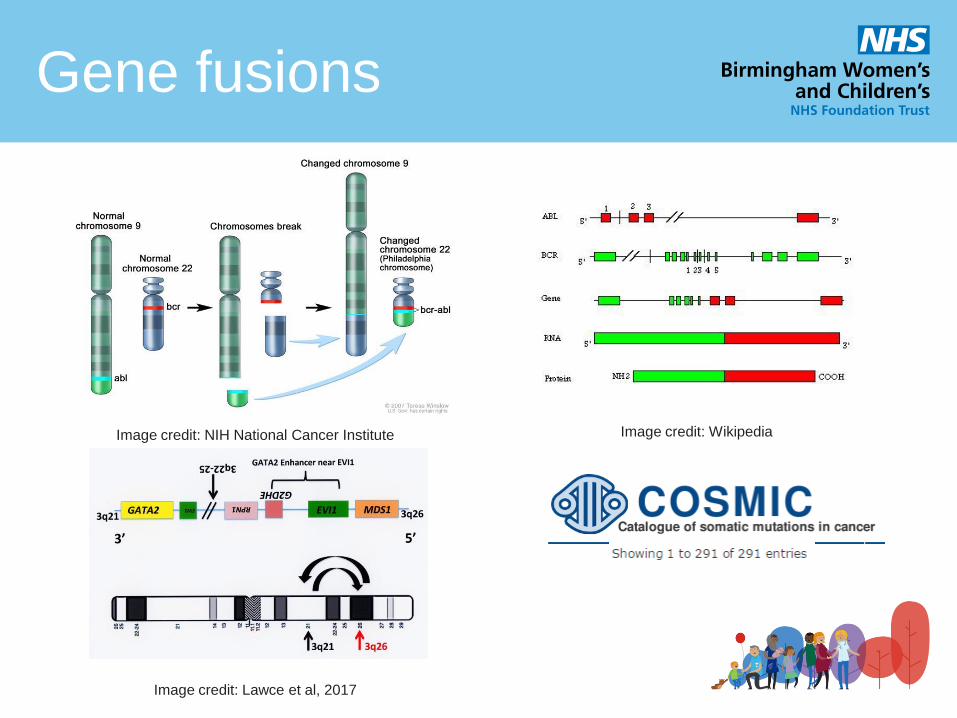
Gene fusions
Image credit: NIH National Cancer Institute Image credit: Wikipedia
Image credit: Lawce et al, 2017
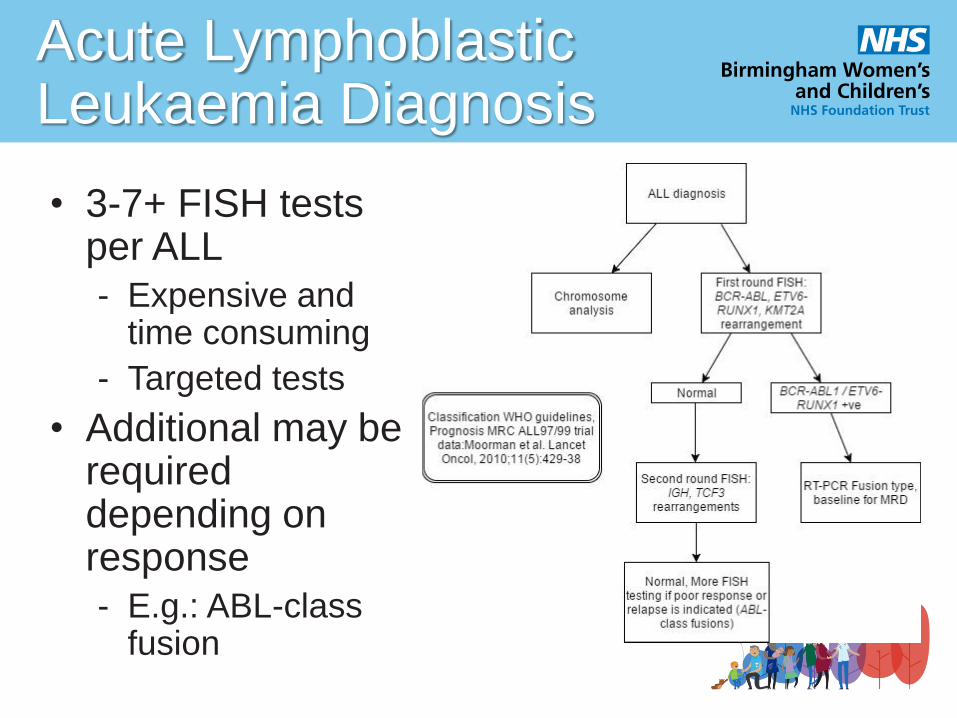
Acute Lymphoblastic Leukaemia Diagnosis
• 3-7+ FISH tests per ALL
- Expensive and time consuming
- Targeted tests
• Additional may be required depending on response
- E.g.: ABL-class fusion
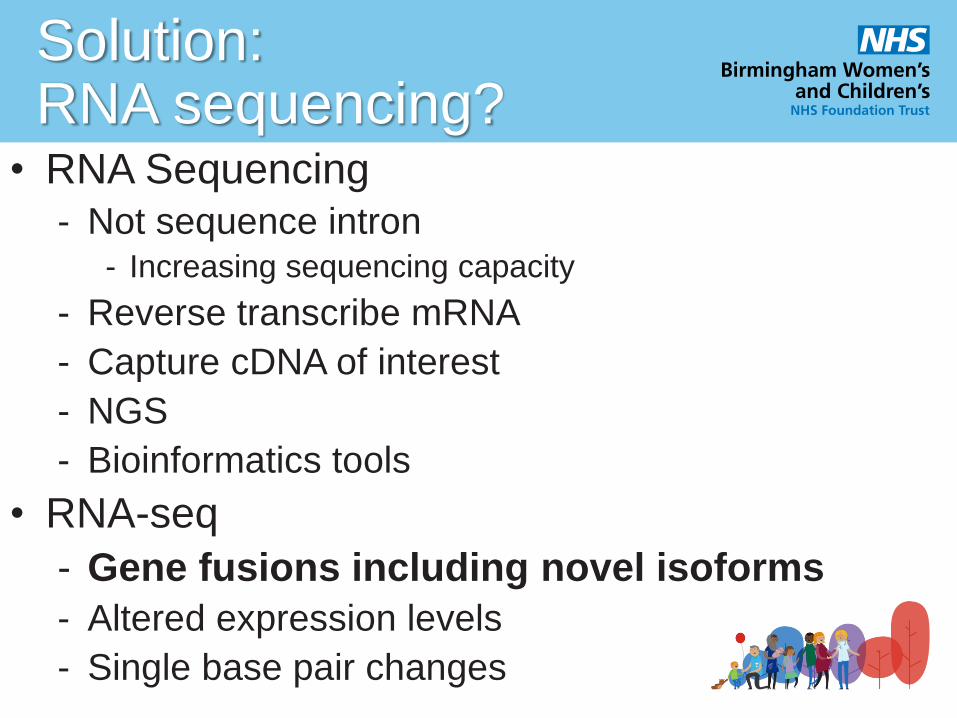
Solution: RNA sequencing?
• RNA Sequencing
- Not sequence intron- Increasing sequencing capacity
- Reverse transcribe mRNA
- Capture cDNA of interest
- NGS
- Bioinformatics tools
• RNA-seq
- Gene fusions including novel isoforms
- Altered expression levels
- Single base pair changes
Project aims
Proof of principle study
Could RNA-seq be used to detect gene
fusions?
What else can it and can’t it detect?
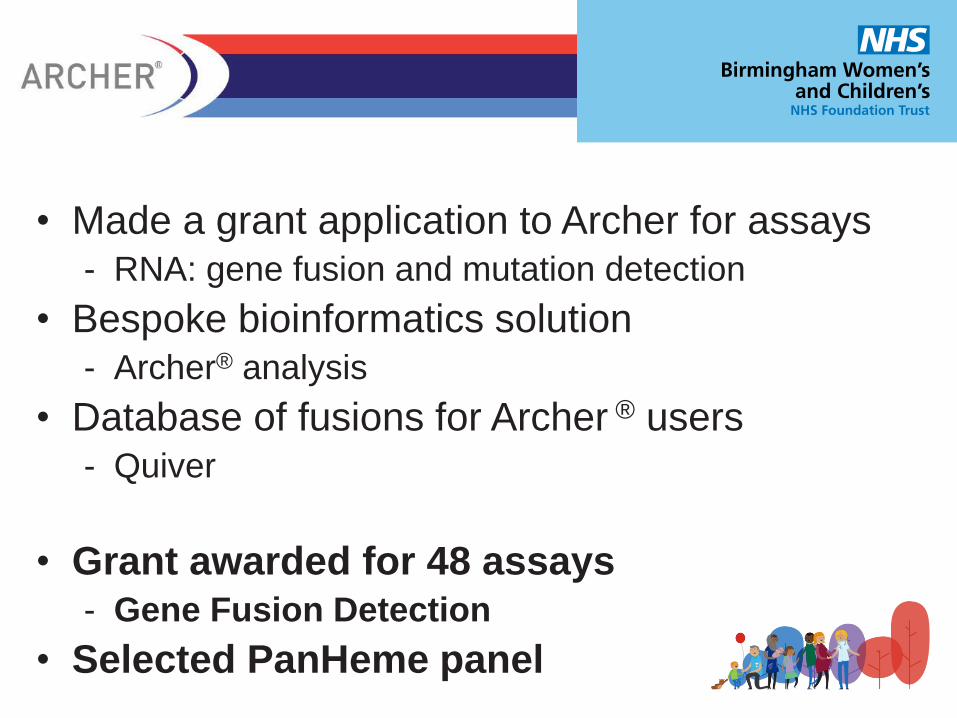
Archer®
• Made a grant application to Archer for assays
- RNA: gene fusion and mutation detection
• Bespoke bioinformatics solution
- Archer® analysis
• Database of fusions for Archer ® users
- Quiver
• Grant awarded for 48 assays
- Gene Fusion Detection
• Selected PanHeme panel
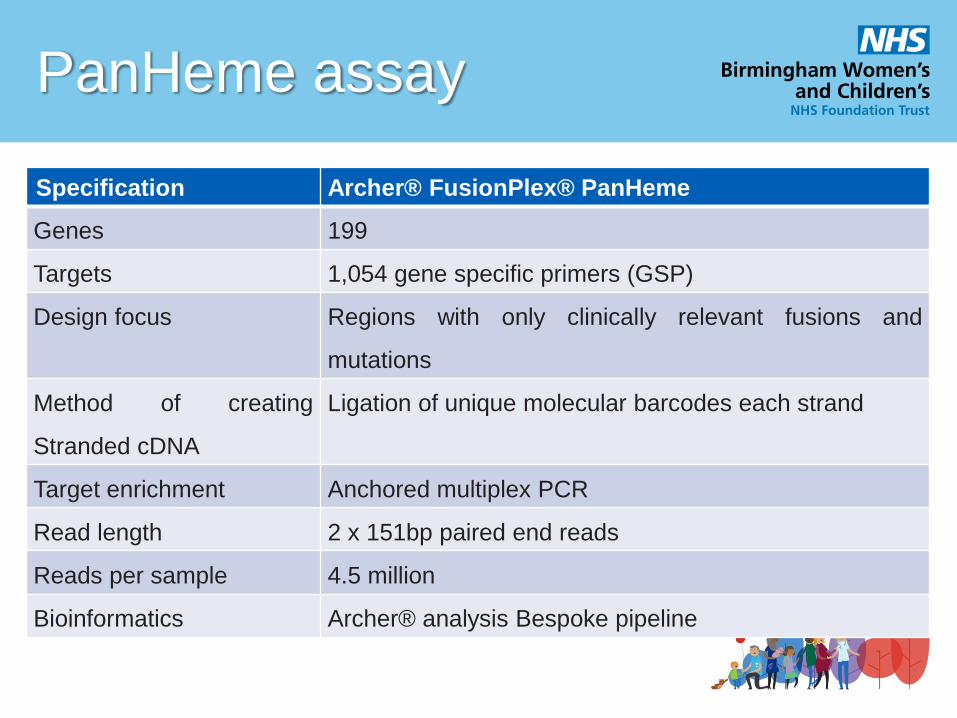
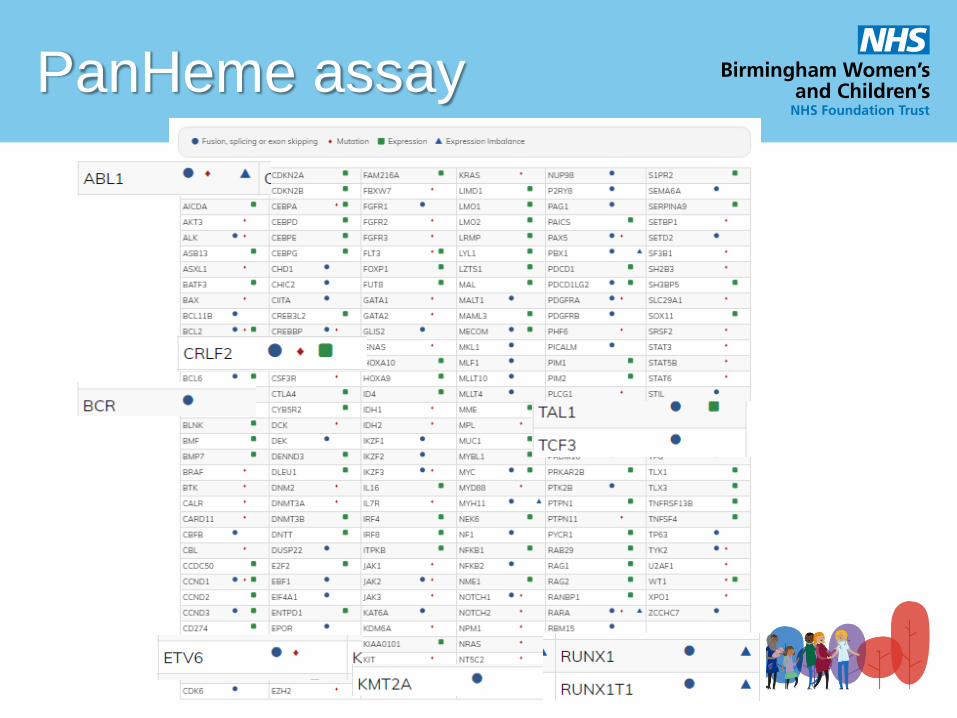
PanHeme assay
Specification Archer® FusionPlex® PanHeme
Genes 199
Targets 1,054 gene specific primers (GSP)
Design focus Regions with only clinically relevant fusions and
mutations
Method of creating
Stranded cDNA
Ligation of unique molecular barcodes each strand
Target enrichment Anchored multiplex PCR
Read length 2 x 151bp paired end reads
Reads per sample 4.5 million
Bioinformatics Archer® analysis Bespoke pipeline
PanHeme assay
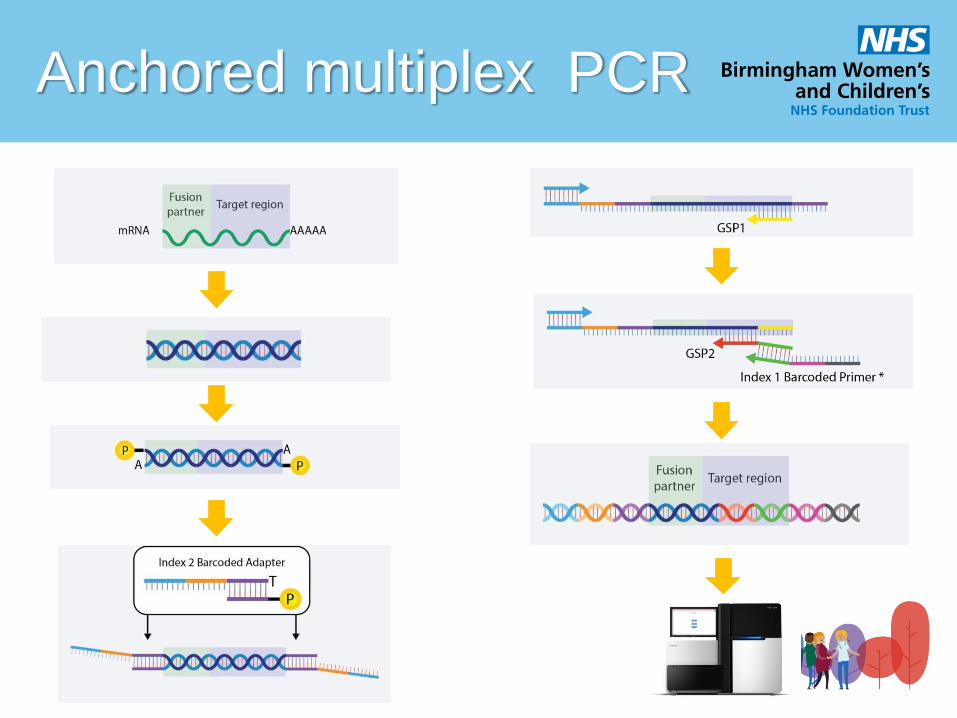
Anchored multiplex PCR
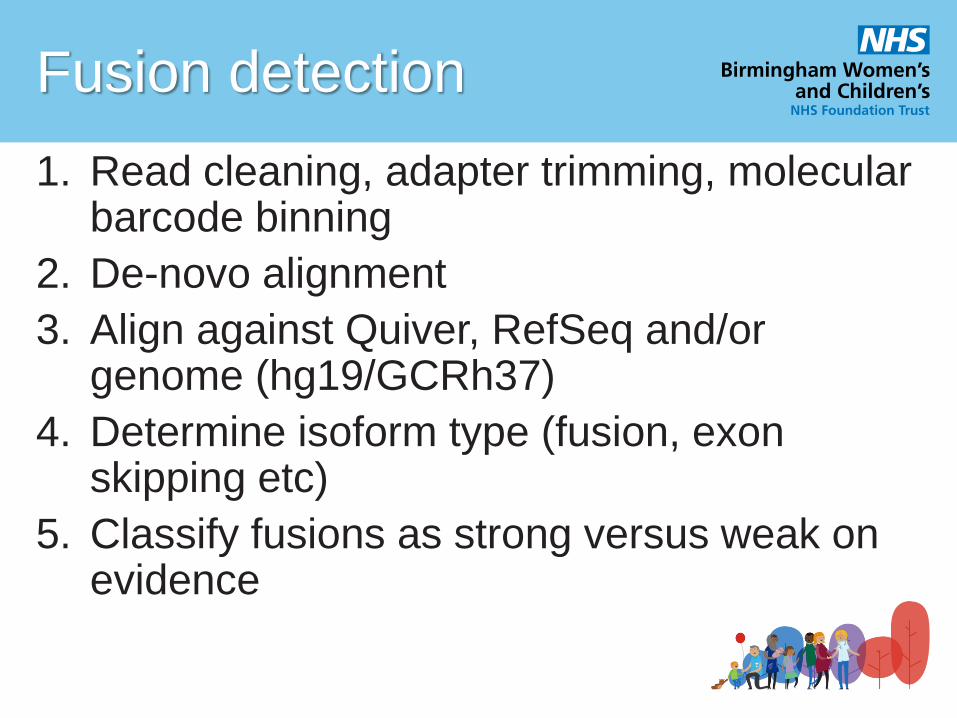
Fusion detection
1. Read cleaning, adapter trimming, molecular barcode binning
2. De-novo alignment
3. Align against Quiver, RefSeq and/or genome (hg19/GCRh37)
4. Determine isoform type (fusion, exon skipping etc)
5. Classify fusions as strong versus weak on evidence
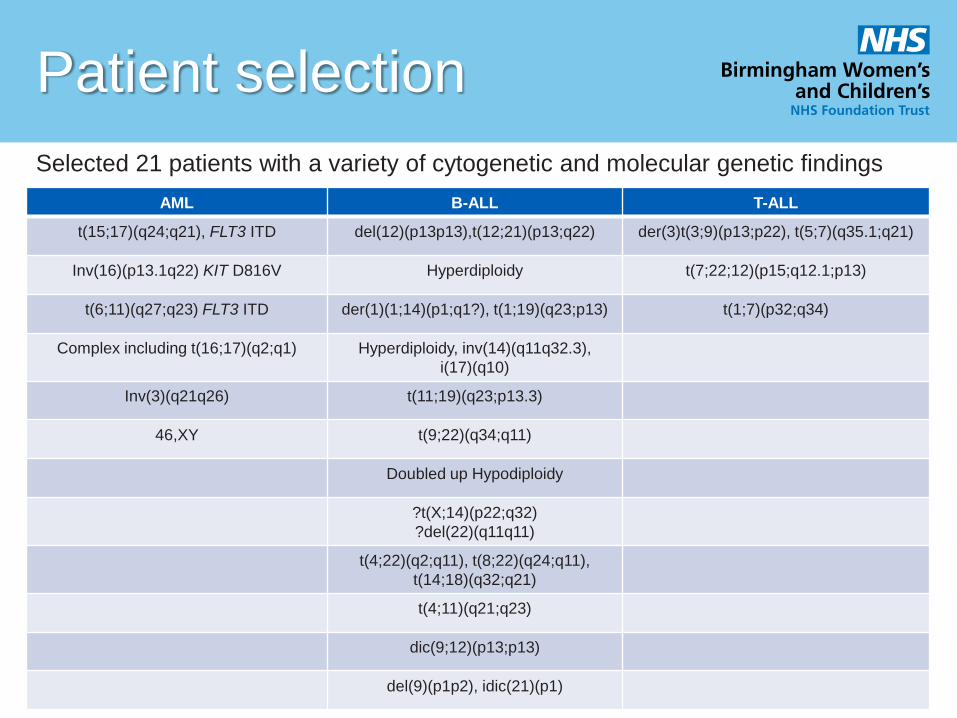
Patient selection
AML B-ALL T-ALL
t(15;17)(q24;q21), FLT3 ITD del(12)(p13p13),t(12;21)(p13;q22) der(3)t(3;9)(p13;p22), t(5;7)(q35.1;q21)
Inv(16)(p13.1q22) KIT D816V Hyperdiploidy t(7;22;12)(p15;q12.1;p13)
t(6;11)(q27;q23) FLT3 ITD der(1)(1;14)(p1;q1?), t(1;19)(q23;p13) t(1;7)(p32;q34)
Complex including t(16;17)(q2;q1) Hyperdiploidy, inv(14)(q11q32.3),
i(17)(q10)
Inv(3)(q21q26) t(11;19)(q23;p13.3)
46,XY t(9;22)(q34;q11)
Doubled up Hypodiploidy
?t(X;14)(p22;q32)
?del(22)(q11q11)
t(4;22)(q2;q11), t(8;22)(q24;q11),
t(14;18)(q32;q21)
t(4;11)(q21;q23)
dic(9;12)(p13;p13)
del(9)(p1p2), idic(21)(p1)
Selected 21 patients with a variety of cytogenetic and molecular genetic findings
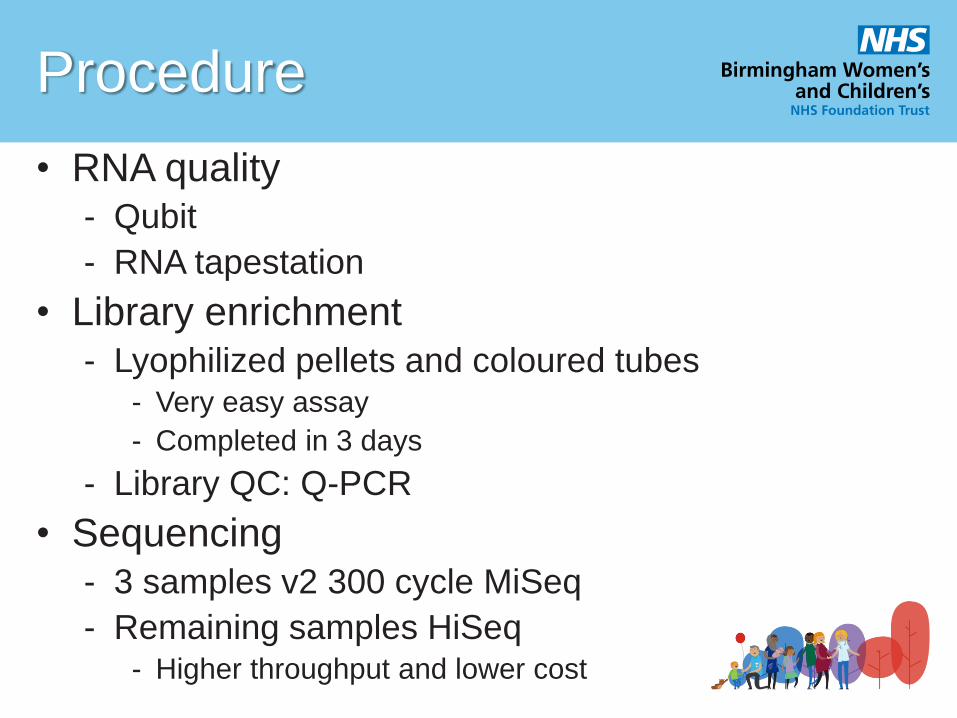
Procedure
• RNA quality
- Qubit
- RNA tapestation
• Library enrichment
- Lyophilized pellets and coloured tubes- Very easy assay
- Completed in 3 days
- Library QC: Q-PCR
• Sequencing
- 3 samples v2 300 cycle MiSeq
- Remaining samples HiSeq- Higher throughput and lower cost
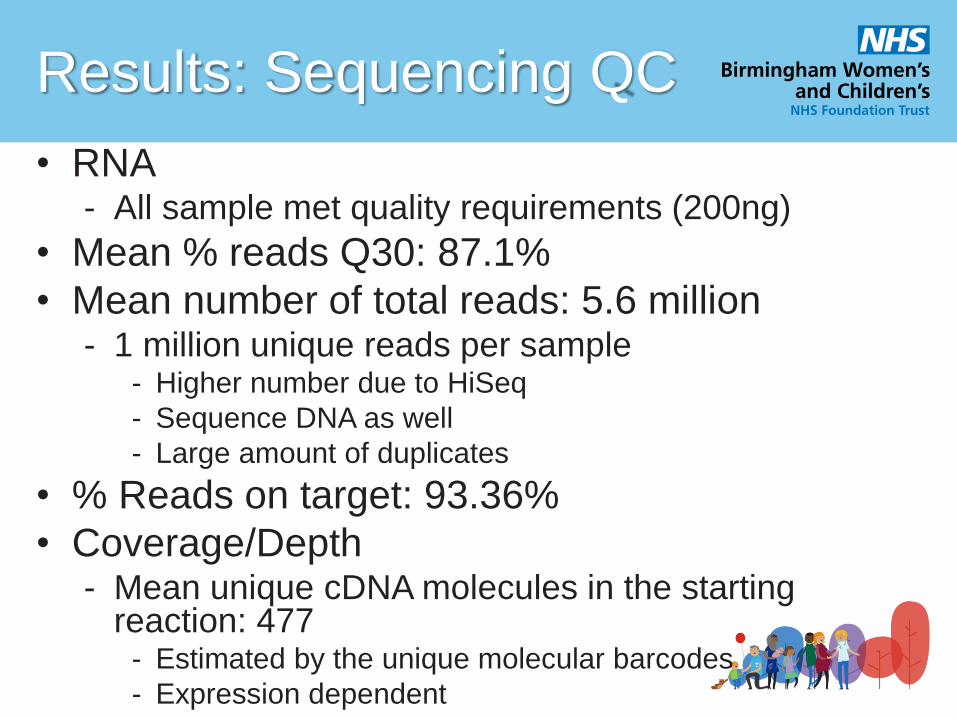
Results: Sequencing QC
• RNA- All sample met quality requirements (200ng)
• Mean % reads Q30: 87.1%
• Mean number of total reads: 5.6 million- 1 million unique reads per sample
- Higher number due to HiSeq
- Sequence DNA as well
- Large amount of duplicates
• % Reads on target: 93.36%
• Coverage/Depth- Mean unique cDNA molecules in the starting
reaction: 477- Estimated by the unique molecular barcodes
- Expression dependent
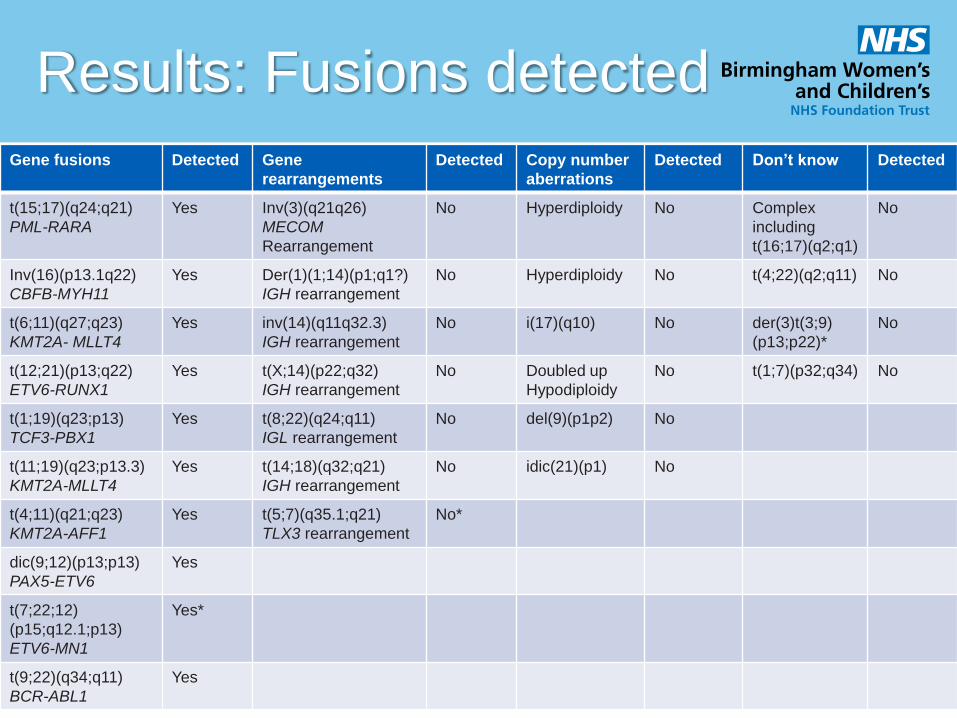
Results: Fusions detected
Gene fusions Detected Gene
rearrangements
Detected Copy number
aberrations
Detected Don’t know Detected
t(15;17)(q24;q21)
PML-RARA
Yes Inv(3)(q21q26)
MECOM
Rearrangement
No Hyperdiploidy No Complex
including
t(16;17)(q2;q1)
No
Inv(16)(p13.1q22)
CBFB-MYH11
Yes Der(1)(1;14)(p1;q1?)
IGH rearrangement
No Hyperdiploidy No t(4;22)(q2;q11) No
t(6;11)(q27;q23)
KMT2A- MLLT4
Yes inv(14)(q11q32.3)
IGH rearrangement
No i(17)(q10) No der(3)t(3;9)
(p13;p22)*
No
t(12;21)(p13;q22)
ETV6-RUNX1
Yes t(X;14)(p22;q32)
IGH rearrangement
No Doubled up
Hypodiploidy
No t(1;7)(p32;q34) No
t(1;19)(q23;p13)
TCF3-PBX1
Yes t(8;22)(q24;q11)
IGL rearrangement
No del(9)(p1p2) No
t(11;19)(q23;p13.3)
KMT2A-MLLT4
Yes t(14;18)(q32;q21)
IGH rearrangement
No idic(21)(p1) No
t(4;11)(q21;q23)
KMT2A-AFF1
Yes t(5;7)(q35.1;q21)
TLX3 rearrangement
No*
dic(9;12)(p13;p13)
PAX5-ETV6
Yes
t(7;22;12)
(p15;q12.1;p13)
ETV6-MN1
Yes*
t(9;22)(q34;q11)
BCR-ABL1
Yes
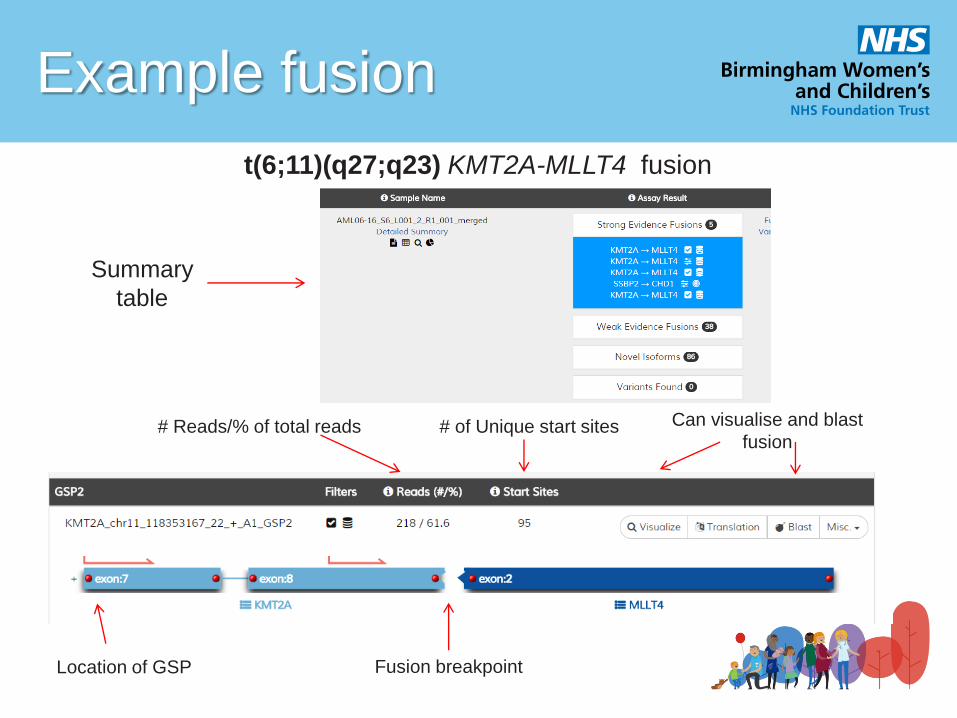
Example fusion
t(6;11)(q27;q23) KMT2A-MLLT4 fusion
Summary
table
# Reads/% of total reads Can visualise and blast
fusion # of Unique start sites
Location of GSP Fusion breakpoint
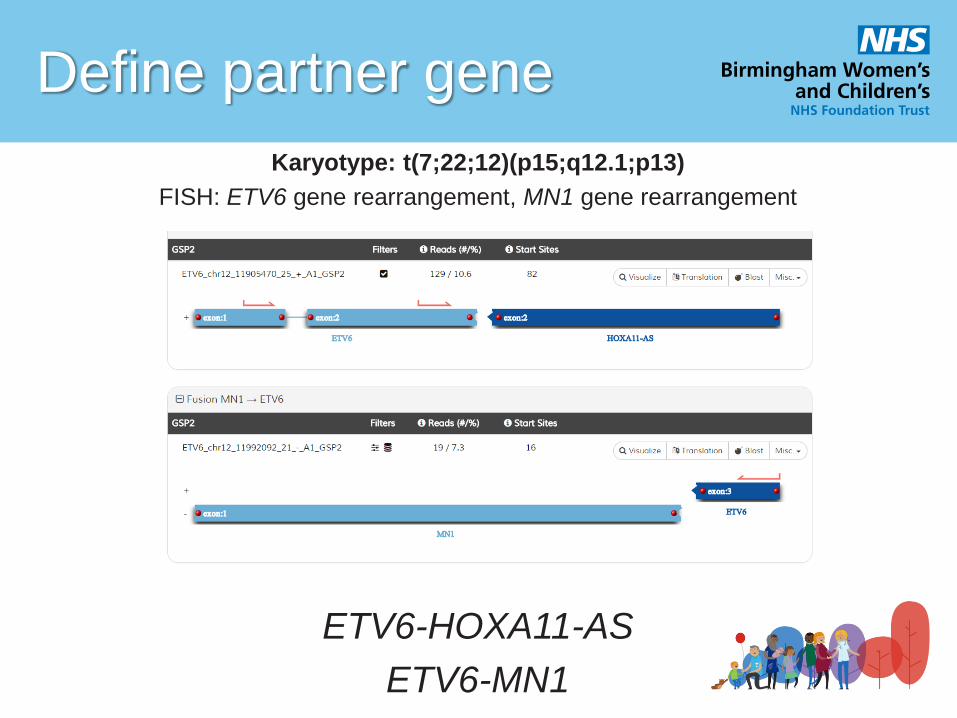
Define partner gene
Karyotype: t(7;22;12)(p15;q12.1;p13)
FISH: ETV6 gene rearrangement, MN1 gene rearrangement
ETV6-HOXA11-AS
ETV6-MN1
Previously undetected gene fusion
Whole karyotype: der(3)t(3;9)(p13;p22), t(5;7)(q35.1;q21)
FISH: partial loss of ABL1
NUP214-ABL1
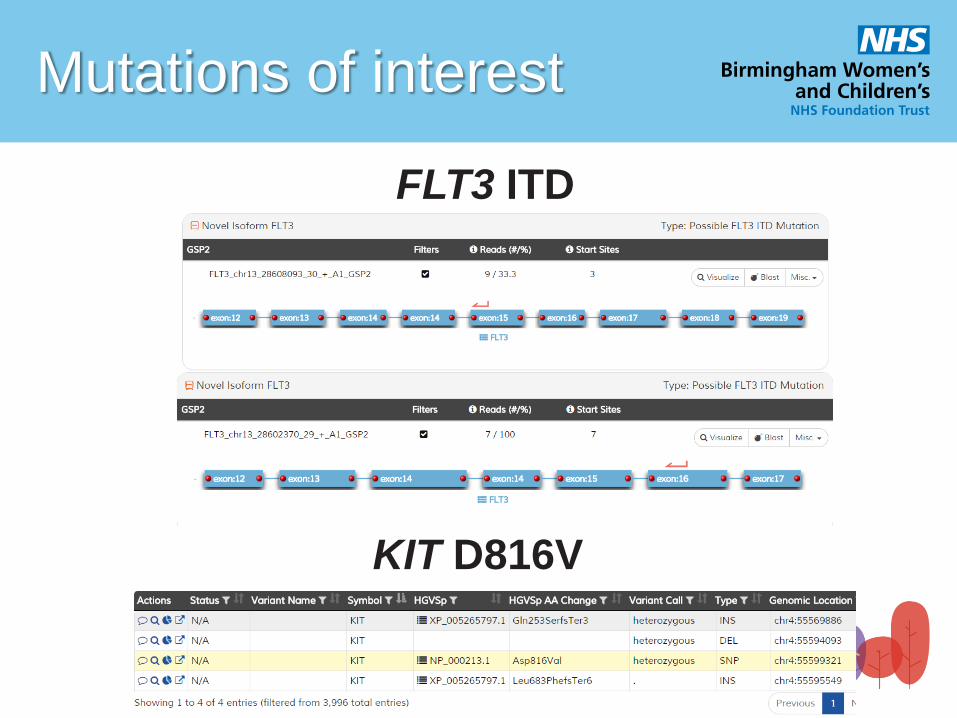
Mutations of interest
FLT3 ITD
KIT D816V
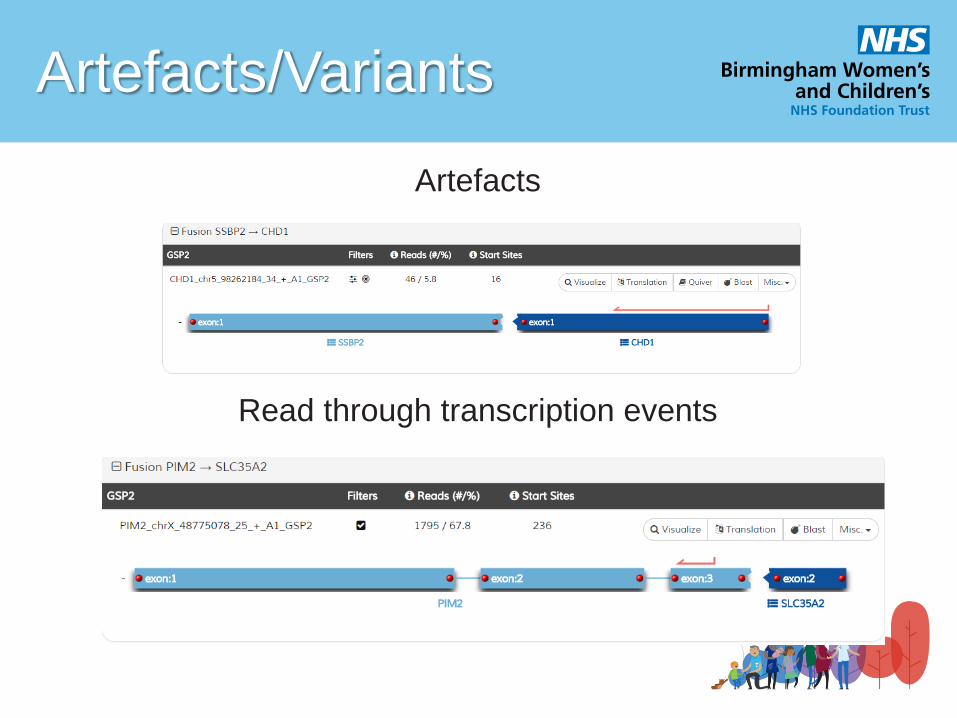
Artefacts/Variants
Artefacts
Read through transcription events
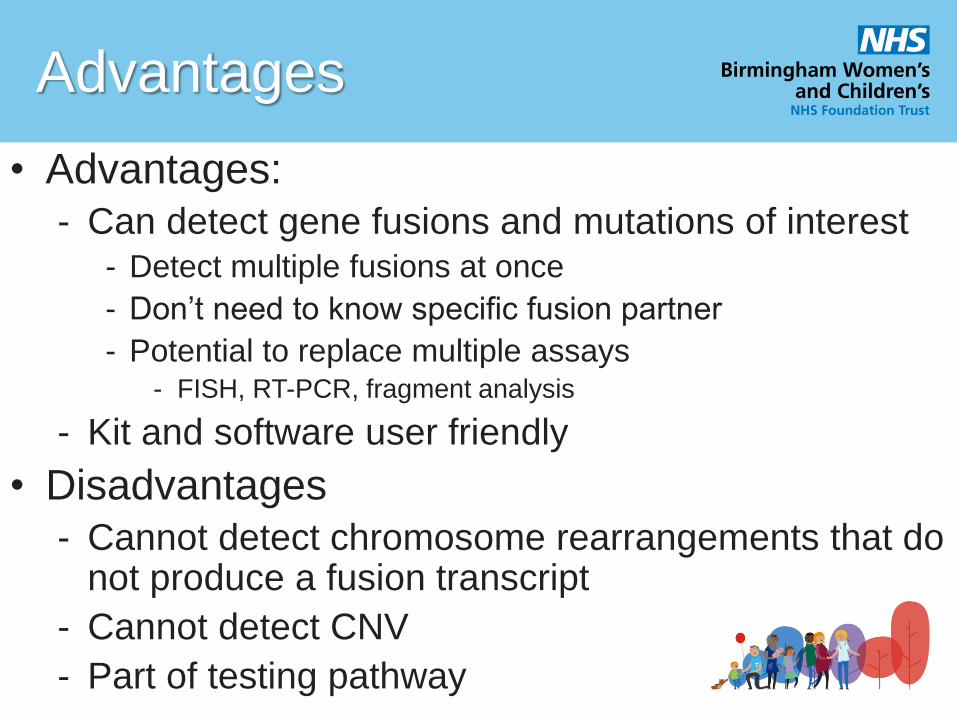
Advantages
• Advantages:
- Can detect gene fusions and mutations of interest- Detect multiple fusions at once
- Don’t need to know specific fusion partner
- Potential to replace multiple assays- FISH, RT-PCR, fragment analysis
- Kit and software user friendly
• Disadvantages
- Cannot detect chromosome rearrangements that do not produce a fusion transcript
- Cannot detect CNV
- Part of testing pathway
Further work
• Validate some of these findings
• Cost benefit analysis
• Collate list of diseases/genes (batching)
- Numbers received and TAT
- Design bespoke panel to fit needs
• Prospective study
- Run assay alongside diagnostic workflow
- Assess TAT
Acknowledgments
• WMRGL
- Sara Dyer
- Sally Jeffries
- Joanne Mason
- Anna Yeung
• Archer
- Laura Griffin
- Chris Celone
• CEHRB Biobank

Any questions???