RK10607 - San Bernardino County - Official Website 1.0 Introduction 1.1 Purpose of Report and Study...
307
Transcript of RK10607 - San Bernardino County - Official Website 1.0 Introduction 1.1 Purpose of Report and Study...


Table of Contents
Section Page 1.0 Introduction ........................................................................................... 1-1 1.1 Purpose of Report and Study Objectives 1-1 1.2 Site Location and Study Area 1-2 1.3 Analysis Methodologies 1-2 1.3.1 Overall Analysis Methodology 1-3 1.3.2 Traffic Operations Analysis 1-4 1.4 Definition of Deficiency and Significant Impact 1-7 2.0 Project Conditions ................................................................................. 2-1 2.1 Existing Roadway System 2-1 2.2 Existing Peak Hour Traffic Volumes 2-1 2.3 Existing Traffic Operations 2-2 2.4 General Plan Circulation Element 2-2 3.0 Project Description ................................................................................ 3-1 3.1 Project Description 3-1 3.2 Project Traffic 3-1 3.2.1 Project Trip Generation 3-1 3.2.2 Project Trip Distribution and Assignment 3-3 3.2.3 Project Traffic Volume Forecasts 3-3 4.0 Future Traffic Conditions ....................................................................... 4-1 4.1 Related Developments 4-1 4.2 Project Opening Year (2017) Conditions 4-1 4.3 Buildout Year (2035) Conditions 4-2 5.0 Future Traffic Operations Analysis ........................................................ 5-1 5.1 Project Opening Year (2017) Traffic Operations 5-1 5.1.1 Project Opening Year (2017) Without Related Projects
Without Project Conditions 5-1 5.1.2 Project Opening Year (2017) Without Related Projects With
Project Conditions 5-2 5.1.3 Project Opening Year (2017) With Related Projects Without Project Conditions 5-3 5.1.4 Project Opening Year (2017) With Related Projects With
Project Conditions 5-4

Table of Contents (continued) Section Page 5.2 Buildout Year (2035) Traffic Operations 5-4 5.2.1 Buildout Year (2035) Without Project Conditions 5-5 5.2.2 Buildout Year (2035) With Project Conditions 5-6 5.3 Summary Traffic Operations 5-6 6.0 Site Access Analysis ............................................................................... 6-1 6.1 Traffic Signal Warrant Analysis 6-1 6.2 Agua Mansa Road at Project Access 2 (Easterly Driveway) 6-2 6.2.1 Sight Distance 6-2 6.2.2 Truck Circulation 6-3 7.0 Recommendations ................................................................................. 7-1 7.1 Site Access 7-1 7.2 Off-Site Improvements 7-1 7.3 Conclusions 7-2

List of Attachments Exhibits Location Map ........................................................................................................... A Site Plan ................................................................................................................... B Existing Lane Geometry and Traffic Controls .............................................................. C Existing Traffic Volumes ............................................................................................ D San Bernardino County Circulation Plan .................................................................... E Project Trip Distribution (Passenger Vehicle) .............................................................. F Project Trip Distribution (Truck) ................................................................................. G Project Traffic Volumes ............................................................................................. H Related Projects Location Map .................................................................................. I Related Projects Zone 1 Trip Distribution ................................................................... J-1 Related Projects Zone 2 Trip Distribution ................................................................... J-2 Related Projects Zone 3 Trip Distribution ................................................................... J-3 Related Projects Zone 4 Trip Distribution ................................................................... J-4 Related Projects Traffic Volumes ................................................................................ K Project Opening Year (2017) Without Related Projects w/o Project Traffic Volumes .... L Project Opening Year (2017) Without Related Projects With Project Traffic Volumes .. M Project Opening Year (2017) With Related Projects Without Project Traffic Volumes .. N Project Opening Year (2017) With Related Projects With Project Traffic Volumes ........ O Buildout Year (2035) Without Project Traffic Volumes ............................................... P Buildout Year (2035) With Project Traffic Volumes .................................................... Q Truck Hauling Routes ................................................................................................ R

List of Attachments (continued)
Sight Distance (North of Project Access) ................................................................... S-1 Sight Distance (South of Project Access) ................................................................... S-2 Truck Turning Templates ........................................................................................... T Recommendations .................................................................................................... U Tables Intersection Analysis For Existing Conditions .............................................................. 1 Trip Generation Rates ............................................................................................... 2 Trip Generation (Passenger Car Equivalents) .............................................................. 3 Other Developments Trip Generation ........................................................................ 4 Intersection Analysis for Project Opening Year (2017) Without Related Projects Without Project Conditions ....................................................................................... 5 Intersection Analysis for Project Opening Year (2017) Without Related Projects With Project Conditions ............................................................................................ 6 Intersection Analysis for Project Opening Year (2017) With Related Projects Without Project Conditions .......................................................................... 7 Intersection Analysis for Project Opening Year (2017) With Related Projects With Project Conditions ................................................................................ 8 Intersection Analysis for Buildout Year (2035) Without Project Conditions ................. 9 Intersection Analysis for Buildout Year (2035) With Project Conditions ....................... 10 Recommended Off-Site Intersection Improvements and Cost Estimates for Project Opening Year (2017) Without Related Project With Project Conditions…….. .. 11 Recommended Off-Site Intersection Improvements and Cost Estimates for Project Opening Year (2017) With Related Project With Project Conditions…….. ....... 12 Recommended Off-Site Intersection Improvements and Cost Estimates for Buildout Year (2035) With Related Project With Project Conditions…….. ................... 13

Project Fair-Share Intersection Contribution for Project Opening Year (2017) With Related Project With Project Conditions………… .. 14 Project Fair-Share Intersection Contribution for Buildout Year (2035) With Related Project With Project Conditions………… .............. 15 Appendices Traffic Count Worksheets ......................................................................................... A Existing Conditions Intersection Analysis Worksheets ................................................ B
San Bernardino Transportation Analysis Model (SBTAM) Plots .................................... C Project Opening Year (2017) Without Related Projects Without Project Conditions Intersection Analysis Worksheets ............................................................................... D Project Opening Year (2017) Without Related Projects With Project Conditions Intersection Analysis Worksheets ................................................................................................. E Project Opening Year (2017) With Related Projects Without Project Conditions Intersection Analysis Worksheets ................................................................................................. F Project Opening Year (2017) With Related Projects With Project Conditions Intersection Analysis Worksheets ............................................................................... G Buildout Year (2035) Without Project Conditions Intersection Analysis Worksheets .... H Buildout Year (2035) With Project Conditions Intersection Analysis Worksheets ......... I Traffic Signal Warrant Worksheets ............................................................................ J Sight Distance Requirements ..................................................................................... K Preliminary Construction Cost Estimates for Congestion Management Plan ................ L Memorandum of Understanding (MOU) ................................................................... M

1-1
1.0 Introduction
1.1 Purpose of Report and Study Objectives
The purpose of this traffic study is to assess the impacts of the proposed Agua
Mansa High-Cube Warehouse development. The project is located north of El
Rivino Road and west of Agua Mansa Road in an unincorporated area of the County
of San Bernardino. The location of the project site is presented on Exhibit A. It
should be noted that this traffic study follows the scope of work detailed in the
Memorandum of Understanding approved by the County of San Bernardino.
A CMP (Congestion Management Program) traffic impact analysis is not required for
this project based on the project’s trip generation. The proposed development is
projected to generate approximately 104 vehicles during the AM peak hour and
112 vehicles during the PM peak hour, which are less than the 250 trips per hour
threshold necessary for requiring a CMP traffic impact analysis. It should be noted
that the project trip generation has been converted to passenger car equivalents
(PCE).
The introduction to this report presents an overview of the project and provides a
brief description of the study area. The analysis methodologies used to evaluate the
impacts of the project are described, and the definitions of roadway system
deficiencies and significant project impacts are presented in the context of
County of San Bernardino requirements.
Subsequent sections of the report will describe the project in detail and provide a
complete description of existing and projected traffic conditions within the study
area.

1-2
1.2 Site Location and Study Area
The project is located north of El Rivino Road and west of Agua Mansa Road in an
unincorporated area of the County of San Bernardino. The project location is
indicated on the Location Map, provided in Exhibit A. The plan for this project
would consist of developing a 475,847 square foot high-cube warehouse building
and 30,059 light industrial building. The site plan is shown on Exhibit B.
Access to the site will be provided via one (1) driveway on Kiningham Drive, one (1)
driveway on El Rivino Road, and one (1) driveway on Agua Mansa Road.
Pursuant to discussions with County of San Bernardino staff, the following study
area intersections have been analyzed in the traffic impact study:
North-South Street East-West Street
Cedar Avenue/Rubidoux Boulevard El Rivino Road
Cactus Avenue El Rivino Road
Hall Avenue El Rivino Road
Kiningham Drive El Rivino Road
Project Access 1 El Rivino Road
Agua Mansa Road El Rivino Road
Agua Mansa Road Project Access 2
Riverside Avenue Agua Mansa Road
1.3 Analysis Methodologies
This section of the report presents the methodologies used to perform the traffic
analyses summarized in this report. This traffic impact study has evaluated project
impacts during AM and PM peak hour conditions. The following analysis years are
considered in this study:

1-3
• Existing Conditions (Year 2014)
• Project Opening Year (2017) Conditions
o With Ambient Growth Only
o With Ambient Growth Plus Project
o With Ambient Growth Plus Related Projects
o With Ambient Growth Plus Related Projects Plus Project
• Project Buildout Year (2035) Conditions (without and with Project)
Both the overall methodologies used to develop future traffic volume forecasts and
the explicit traffic operations analysis methodologies are summarized herein. The
study includes an analysis of traffic impacts without and with the project.
1.3.1 Overall Analysis Methodology
Traffic conditions were evaluated in this report for the following conditions:
• Existing Conditions
• Project Opening Year (2017) Without Related Projects Without Project Conditions
• Project Opening Year (2017) Without Related Projects With Project Conditions
• Project Opening Year (2017) With Related Projects Without Project Conditions
• Project Opening Year (2017) With Related Projects With Project Conditions
• Buildout Year (2035) Without Project Conditions
• Buildout Year (2035) With Project Conditions
Traffic count data at the study area intersections were compiled for RK in June
2014.
To account for area wide growth on roadways, Project Completion (Year 2017)
volumes have been calculated based on a two percent (2%) annual growth rate of
existing traffic volumes over a three-year period. It is estimated that there would be
an approximate 6% increase in traffic for Opening Year (2017) conditions.

1-4
Additionally, traffic from other related developments expected to be in operation
were included for Opening Year (2017) With Related Projects conditions.
Buildout Year (2035) traffic volumes have been obtained from the San Bernardino
Transportation Analysis Model (SBTAM), provided by the San Bernardino Associated
Governments (SANBAG) Planning Department. All related developments have been
have been added to the traffic model to show worst case scenario. Buildout Year
(2035) Peak Hour volumes were converted from Peak Period volumes using the
following conversion model formulas for each intersection movement:
AM Peak Period Volume * 0.38 = AM Peak Hour Volume
PM Peak Period Volume * 0.28 = PM Peak Hour Volume
1.3.2 Traffic Operations Analysis
The current technical guide to the evaluation of traffic operations is the Highway
Capacity Manual (HCM2000) (Transportation Board Special Report 209). The HCM
defines level of service as a qualitative measure which describes operational
conditions within a traffic stream, generally in terms of such factors as speed and
travel time, freedom to maneuver, traffic interruptions, comfort and convenience,
and safety. The criteria used to evaluate LOS (Level of Service) conditions vary based
on the type of roadway and whether the traffic flow is considered interrupted or
uninterrupted.
The definitions of level of service for uninterrupted flow (flow unrestrained by the
existence of traffic control devices) are:
• LOS A represents free flow. Individual users are virtually unaffected by the
presence of others in the traffic stream.

1-5
• LOS B is in the range of stable flow, but the presence of other users in the traffic
stream begins to be noticeable. Freedom to select desired speeds is relatively
unaffected, but there is a slight decline in the freedom to maneuver.
• LOS C is in the range of stable flow, but marks the beginning of the range of
flow in which the operation of individual users becomes significantly affected by
interactions with others in the traffic stream.
• LOS D represents high-density but stable flow. Speed and freedom to maneuver
are severely restricted, and the driver experiences a generally poor level of
comfort and convenience.
• LOS E represents operating conditions at or near the capacity level. All speeds
are reduced to a low, but relatively uniform value. Small increases in flow will
cause breakdowns in traffic movement.
• LOS F is used to define forced or breakdown flow. This condition exists
wherever the amount of traffic approaching a point exceeds the amount which
can traverse the point. Queues form behind such locations.
Uninterrupted flow is generally found only on limited access (freeway) facilities in
urban areas. The level of service is based on Table 3-1 in the Highway Capacity
Manual.
The definitions of the level of service for interrupted traffic flow (flow restrained by
the existence of traffic signals and other traffic control devices) differ slightly
depending on the type of traffic control.
The level of service is typically dependent on the quality of traffic flow at the
intersections along a roadway. The HCM methodology expresses the level of service

1-6
at an intersection in terms of delay time for the various intersection approaches.
The HCM uses different procedures depending on the type of intersection control.
The levels of service determined in this study are calculated using the
HCM methodology.
For signalized intersections, average control delay per vehicle is used to determine
the level of service. Levels of service at signalized study intersections have been
evaluated using the HCM intersection analysis program.
Study area intersections, which are stop sign controlled with stop control on the
minor street only, have been analyzed using the unsignalized intersection
methodology of the HCM. For these intersections, the calculation of level of service
is dependent on the occurrence of gaps occurring in the traffic flow of the main
street. Using data collected, describing the intersection configuration and traffic
volumes at these locations, the level of service has been calculated. The level of
service is determined based on the worst individual movement or movements
sharing a single lane. The relationship between level of service and delay is different
than for signalized intersections.
The levels of service are defined for the various analysis methodologies as follows:
LOS
Average Total Control Delay Per Vehicle (Seconds)
Signalized Unsignalized
A 0.00 - 10.00 0.00 - 10.00
B 10.01 - 20.00 10.01 - 15.00
C 20.01 - 35.00 15.01 - 25.00
D 35.01 - 55.00 25.01 - 35.00
E 55.01 - 80.00 35.01 - 50.00
F >80.01 >50.01

1-7
Signalized intersections are considered deficient (LOS F) if the overall intersection
critical V/C ratio equals to or exceeds 1.0, even if the level of service defined by the
delay value is below the defined LOS standard.
The LOS analysis for signalized intersections has been performed using optimized
signal timing. This analysis has included an assumed lost time of two (2) seconds
per phase in accordance with County of San Bernardino Draft Interim Traffic Impact
Study Guidelines recommended default values. Signal timing optimization has
considered pedestrian safety and signal coordination requirements. Appropriate
times for pedestrian crossings have also been considered in the signalized
intersection analysis. For all movements, a minimum green time of ten (10) seconds
has been used.
Saturation flow rates of 1,800 vehicles per hour of green (vphg) for through and
right turn lanes, 1,700 vehicles for single left turn lanes, and 1,600 vehicles per lane
for dual left turn lanes have been assumed for the capacity analysis.
Existing conditions peak hour factors have been calculated based upon the traffic
counts gathered at the study area intersection within the past 12 months. Existing
peak hour factors have been used for Project Opening Year (2017). For Buildout
Year (2035) conditions, peak hour factors have been adjusted upwards to 0.95 to
account for the more consistent flow of traffic expected as congestion increases.
1.4 Definition of Deficiency and Significant Impact
The following definitions of deficiencies and significant impacts have been
developed in accordance with the County of San Bernardino General Plan
requirements.

1-8
Deficiency
The definition of an intersection deficiency has been obtained from the County of
San Bernardino General Plan guidelines. The guidelines state that peak hour
intersection operations of LOS D or better are generally acceptable during the peak
hours in the Valley Region. Therefore, any intersection operating at LOS E or LOS F
will be considered deficient.
Significant Impact
The County of San Bernardino Draft Interim Traffic Impact Study Guidelines state
that the following criteria shall be used to determine if the addition of project traffic
should be considered to have significant impact and feasible measures must be
identified to mitigate the impacts.
1. Signalized Intersections:
Any study intersection that is operating at LOS A, B, C, or D for any study
scenario without project traffic in which the addition of project traffic causes the
intersection to degrade to LOS E or F shall mitigate the impact to bring the
intersection back to at least LOS D.
Any study intersection that is operating at LOS E or F for any study scenario
without project traffic shall mitigate any impacts so as to bring the intersection
back to the overall level of delay established prior to project traffic being added.
2. Unsignalized Intersections:
An impact is considered significant if the study determines that either section a)
or both sections b) and c) occur.
a) The addition of project related traffic causes the intersection to move
from LOS D or better to LOS E or worse.

1-9
OR
b) The project contributes additional traffic to an intersection that is already
projected to operate at LOS E or F with background traffic.
AND
c) One or both of the following conditions are met:
1. The project adds ten (10) or more peak hour trips to any
approach.
2. The intersection meets the peak hour traffic signal warrant after
the addition of the project traffic.

1-10
THIS PAGE INTENTIONALLY LEFT BLANK

2-1
2.0 Project Conditions
This section of the report summarizes existing roadway and traffic conditions in the study
area. The number of through travel lanes for existing roadways and intersection controls
are presented, along with existing traffic count data collected for this study. This data was
used to analyze existing traffic operations in the study area. Existing plans for roadway
improvements are also described in this section.
2.1 Existing Roadway System
The number of through travel lanes for existing roadways and intersection controls
within the study area are presented on Exhibit C.
2.2 Existing Peak Hour Traffic Volumes
Existing peak hour intersection turning movement volumes are presented on
Exhibit D. Explicit peak hour factors have been calculated using the data collected
for this effort. The average daily traffic (ADT) volumes were estimated by factoring
up from peak hour counts conducted for RK.
Existing conditions intersection level of service calculations are based upon manual
AM and PM peak hour turning movement counts taken in June 2014. The AM peak
hour traffic volumes were determined by counting the two-hour period between
7:00 AM and 9:00 AM. Similarly, the PM peak hour traffic volumes were identified
by counting the two-hour period between 4:00 PM and 6:00 PM. The traffic count
worksheets are included in Appendix A.
RK conducted 24-Hour Two-Way average daily traffic (ADT) volumes counts along El
Rivino Road, west of Kiningham Drive. The ADT traffic count worksheet is provided
in Appendix A, and the counts are provided in Exhibit D.

2-2
Existing ADT on roadways within the study area are also shown on Exhibit D. ADT
volumes were factored up from the PM peak hour counts using the following
formula for each intersection leg:
PM Peak Hour (Approach Volume + Exit Volume) * 12 = Leg Volume
2.3 Existing Traffic Operations
Existing peak hour traffic operations have been evaluated for both the AM and PM
peak hours of traffic at the study area intersections, and represent year 2014
conditions. The results of this analysis are summarized in Table 1, along with the
existing intersection geometrics and traffic control devices at the analysis locations.
All study area intersections are operating at acceptable levels of service during the
peak hours. The operations analysis worksheets for Existing traffic conditions are
included in Appendix B.
2.4 General Plan Circulation Element
The County of San Bernardino Circulation Element in the vicinity of the project is
shown on Exhibit E. The project has direct access to El Rivino Road and it is
classified as a Secondary Highway and has a right-of-way width of 88 feet. The
project also has direct access to Agua Mansa Road and it is classified as a Major
Highway and has a right-of-way width of 104 feet. The development would need to
provide sufficient dedication to accommodate the ultimate buildout width of this
roadway.

3-1
3.0 Project Traffic
This section describes the project land uses and traffic characteristics for each of the future
years analyzed.
3.1 Project Description
The project site plan is presented on Exhibit B. The project will consist of
constructing a 475,847 square foot high-cube warehouse building and a 30,059
sqaure foot light industrial building. The estimated project completion date for this
development is Opening Year 2017.
3.2 Project Traffic
The traffic related to the project has been calculated in accordance with the
following accepted procedural steps:
• Trip Generation
• Trip Distribution
• Trip Assignment
These steps are described in detail below.
3.2.1 Project Trip Generation
Trip generation represents the amount of traffic that is attracted and produced by a
development. The traffic generation for the proposed project is based upon the
specific land uses that have been planned for the development. The trip generation
has been based on a 475,847 square foot high-cube warehouse and a 30,059
sqaure foot light industrial building.

3-2
Trip generation rates for the proposed project’s land uses are shown in Table 2. The
trip generation rates are based upon the Institute of Transportation Engineers (ITE)
Trip Generation, 9th edition, 2012.
This project is expected to attract a significant amount of heavy vehicle traffic due to
the specific operational characteristics of the site. This would be mainly the hauling
of freight by large multi-axle trucks. Large trucks generally occupy more space on
the roadway; therefore, in order to show the equivalent impacts of the trucks at this
site, the project trip generation has been converted to passenger car equivalents
(PCE). The City of Fontana Truck Trip Generation Study for Heavy Warehouse Uses,
August 2003 was used to estimate the heavy vehicle mix for this project. The PCE
factors used for this project are based on County of San Bernardino standards and
are as follows:
Vehicle Type PCE Factor Vehicle Mix
Passenger Car 1.0 0.7957
2 Axle Trucks 1.5 0.0346
3 Axle Trucks 2.0 0.0464
4+ Axle Trucks 3.0 0.1233
The adjusted PCE trip generation rates are shown on Table 2. Both peak hour and
daily project trip generation for the proposed project, with PCE’s, are shown in
Table 3.
The project is projected to generate an adjusted total of 1,321 trip-ends per day,
with 104 vehicles per hour during the AM peak hour and 112 vehicles per hour
during the PM peak hour.

3-3
3.2.2 Project Trip Distribution and Assignment
The trip distribution and assignment process represents the directional orientation
of traffic to and from the project site. The assignment of traffic from the site to the
adjoining roadway system has been based upon the site’s trip generation,
trip distribution, proposed arterial highway, and local street systems that would be
in place by the time of initial occupancy of the project. Detailed routing
assumptions are included on Exhibits F and G (Passenger Vehicles/Truck Trip
Distribution). There are currently weight limit and truck hauling route restrictions
on El Rivino Road; therefore, all trucks must use the Agua Mansa Road driveway to
access the project site.
3.2.3 Project Traffic Volume Forecasts
The project traffic volume forecasts have been developed by applying the trip
generation and distribution calculations. The traffic volumes attributable to the
proposed project are presented on Exhibit H.

3-4
THIS PAGE INTENTIONALLY LEFT BLANK

4-1
4.0 Future Traffic Conditions
This section of the report describes the development of future traffic volume forecasts, and
presents the resulting traffic volumes that will be used in the traffic operations analysis.
Future traffic conditions have been evaluated for Project Opening Year (2017) Without
Related Projects With and Without Project conditions, Project Opening Year (2017) With
Related Projects With and Without Project conditions and Buildout Year (2035) With and
Without Project conditions.
4.1 Related Developments
This project is located within the sphere of influence of the City of Riverside, the City
of Rialto, the City of Fontana, and the City of Jurupa Valley. All potential
development projects within the nearby jurisdictions have been considered as
related projects. Exhibit I shows the locations of the related developments. Table 4
shows the trip generation for the related projects, based on the known project
descriptions. Only the Cities of Jurupa Valley and Rialto had related projects within
the study area.
Exhibits J-1 to J-4 contain the directional distribution and assignment of the Related
Projects traffic. The Related Project’s AM and PM peak hour intersection turning
movement volumes and average daily traffic are shown on Exhibit K.
4.2 Project Opening Year (2017) Conditions
To account for area wide growth on roadways, Project Completion (Year 2017)
volumes have been calculated based on a two percent (2%) annual growth rate of
existing traffic volumes over a three-year period. It is estimated that there would be
an approximate 6% increase in traffic for Opening Year (2017) conditions.

4-2
This growth in traffic has been added to peak hour and daily traffic volumes on
surrounding roadways.
4.3 Buildout Year (2035) Conditions
Buildout Year (2035) traffic volumes have been obtained from the SBTAM, provided
by the SANBAG Planning Department. All related development traffic has been
added to the SBTAM model as a worst case scenario. A copy of the Future Year
2035 SBTAM plots has been included in Appendix C.

5-1
5.0 Future Traffic Operations Analysis
Analysis of Project Opening Year (2017) conditions is presented first, followed by the
analysis of Buildout Year (2035) conditions.
5.1 Project Opening Year (2017) Traffic Operations
The operations analysis for Project Opening Year (2017) conditions examined
four (4) scenarios: Project Opening Year (2017) Without Related Projects Without
Project, Project Opening Year (2017) Without Related Projects With Project, Project
Opening Year (2017) With Related Projects Without Project and Project Buildout
(Year 2017) With Related Projects With Project. Each of these conditions is
discussed in the remainder of this section.
5.1.1 Project Opening Year (2017) Without Related Projects Without
Project Conditions
To account for area wide growth on roadways, Project Completion (Year 2017)
volumes have been calculated based on a two percent (2%) annual growth rate of
existing traffic volumes over a three-year period. It is estimated that there would be
an approximate 6% increase in traffic for Opening Year (2017) conditions. Project
Opening Year (2017) Without Related Projects Without Project peak hour
intersection turning movement volumes are presented on Exhibit L. The intersection
operations analysis for Project Opening Year (2017) Without Related Projects
Without Project traffic conditions is summarized in Table 5. For the Project Opening
Year (2017) Without Related Projects Without Project traffic conditions, the existing
intersection geometrics were used for analysis.

5-2
As shown in Table 5, all study intersections are projected to operate at or above the
acceptable levels of service during Project Opening Year (2017) Without Related
Projects Without Project peak hour traffic conditions, with the expectation of the
following intersection that is operating at an unacceptable level of service during
the peak hours:
North-South Street East-West Street
Delay (sec.) LOS
AM PM AM PM
Agua Mansa Road El Rivino Road 18.7 97.8 C F
The operations analysis worksheets for Project Opening Year (2017) Without Related
Projects Without Project traffic conditions are included in Appendix D.
5.1.2 Project Opening Year (2017) Without Related Projects With Project
Conditions
Project Opening Year (2017) Without Related Projects With Project traffic volumes
were calculated by adding project volumes to Project Opening Year (2017) Without
Related Projects Without Project traffic volumes. Project Opening Year (2017)
Without Related Projects With Project peak hour intersection turning movement
volumes are presented on Exhibit M. The intersection operations analysis for Project
Opening Year (2017) Without Related Projects With Project traffic conditions is
summarized in Table 6. For the Project Opening Year (2017) Without Related
Projects With Project traffic conditions, the improvements from the proposed
project driveways were used for the intersection geometrics.
As shown in Table 6, the following intersection is projected to continue to operate
below the acceptable levels of service during Project Opening Year (2017) Without
Related Projects With Project peak hour traffic conditions.

5-3
• Agua Mansa Road (NS) at El Rivino Road (EW)
.
Recommended improvements have been made to the above listed intersection to
mitigate project impacts and restore the level of delay established prior to project
traffic being added for Opening Year (2017) Without Related Projects conditions.
This impact is considered direct and the project would be responsible for
implementing the recommended improvements to restore the intersection to
acceptable levels of service. The improvement costs are shown in Table 11.
The operations analysis worksheets for Project Opening Year (2017) Without Related
Projects With Project traffic conditions are included in Appendix E.
5.1.3 Project Opening Year (2017) With Related Projects Without Project
Conditions
Project Opening Year (2017) With Related Projects Without Project traffic volumes
have been calculated based on a two percent (2%) annual growth rate of existing
traffic volumes over a three-year period and the addition of other related
developments trip generation in the study area. Project Opening Year (2017) With
Related Projects Without Project peak hour intersection turning movement volumes
are presented on Exhibit N. The intersection operations analysis for Project Opening
Year (2017) With Related Projects Without Project traffic conditions is summarized
in Table 7. For the Project Opening Year (2017) With Related Projects Without
Project traffic conditions, the existing intersection geometrics were used for analysis.
As shown in Table 7, the following intersection is projected to continue to operate
below the acceptable levels of service during Project Opening Year (2017) With
Related Projects Without Project peak hour traffic conditions.
• Agua Mansa Road (NS) at El Rivino Road (EW)

5-4
The operations analysis worksheets for Project Opening Year (2017) With Related
Projects Without Project traffic conditions are included in Appendix F.
5.1.4 Project Opening Year (2017) With Related Projects With Project
Conditions
Project Opening Year (2017) With Related Projects With Project traffic volumes were
calculated by adding project volumes to Project Opening Year (2017) With Related
Projects Without Project traffic volumes. Project Opening Year (2017) With Related
Projects With Project peak hour intersection turning movement volumes are
presented on Exhibit O. The intersection operations analysis for Project Opening
Year (2017) With Related Projects With Project traffic conditions is summarized in
Table 8. For the Project Opening Year (2017) With Related Projects With Project
traffic conditions, the improvements from the proposed project driveways were
used for the intersection geometrics.
As shown in Table 8, the following intersections are projected to continue to
operate below the acceptable levels of service during Project Opening Year (2017)
With Related Projects With Project peak hour traffic conditions.
• Cedar Avenue (NS) at El Rivino Road (EW)
• Agua Mansa Road (NS) at El Rivino Road (EW)
Recommended improvements have been made to the above listed intersections to
mitigate project impacts and restore the level of delay established prior to project
traffic being added for Opening Year (2017) With Related Projects conditions. This
impact is considered cumulative and the project would be responsible to contribute
fair share towards the cost of improvements. The improvement costs and fair share
contributions are shown in Table 12.

5-5
The operations analysis worksheets for Project Opening Year (2017) With Related
Projects With Project traffic conditions are included in Appendix G.
5.2 Buildout Year (2035) Traffic Operations
The operations analysis for Buildout Year (2035) conditions examined two scenarios:
Buildout Year (2035) Without Project and Buildout Year (2035) With Project. Each
of these conditions is discussed in the remainder of this section.
5.2.1 Buildout Year (2035) Without Project Conditions
Buildout Year (2035) Without Project traffic volumes were calculated using traffic
projections from the SBTAM. It is assumed all related developments have been
accounted for in the traffic model. Buildout Year (2035) Without Project peak hour
intersection turning movement volumes are presented on Exhibit P. The intersection
operations analysis for Buildout Year (2035) Without Project traffic conditions is
summarized in Table 9. For the Buildout Year (2035) Without Project traffic
conditions, the existing intersection geometrics were used for analysis.
As shown in Table 9, the following intersections are projected to operate below the
acceptable levels of service during Buildout Year (2035) Without Project peak hour
traffic conditions.
• Cedar Avenue (NS) at El Rivino Road (EW)
• Agua Mansa Road (NS) at El Rivino Road (EW)
• Riverside Avenue (NS) at Agua Mansa Road (EW)
The operations analysis worksheets for Buildout Year (2035) Without Project traffic
conditions are included in Appendix H.

5-6
5.2.2 Buildout Year (2035) With Project Conditions
Buildout Year (2035) With Project traffic volumes were calculated using traffic
projections from the SBTAM. It is assumed all related developments have been
accounted for in the traffic model. Buildout Year (2035) With Project peak hour
intersection turning movement volumes are presented on Exhibit Q. The
intersection operations analysis for Buildout Year (2035) With Project traffic
conditions is summarized in Table 10. For the Buildout Year (2035) With Project
traffic conditions, the improvements from the proposed project driveways were
used for the intersection geometrics.
As shown in Table 10, the following intersections are projected to continue to
operate below the acceptable levels of service during Buildout Year (2035) With
Project peak hour traffic conditions.
• Cedar Avenue (NS) at El Rivino Road (EW)
• Hall Avenue (NS) at El Rivino Road (EW)
• Agua Mansa Road (NS) at El Rivino Road (EW)
• Riverside Avenue (NS) at Agua Mansa Road (EW)
Recommended improvements have been made to the above listed intersections to
mitigate project impacts and restore the level of delay established prior to project
traffic being added for Buildout Year (2035) conditions. This impact is considered
cumulative and the project would be responsible to contribute fair share towards
the cost of improvements. The improvement costs and fair share contributions are
shown in Table 13.
The operations analysis worksheets for Buildout Year (2035) With Project traffic
conditions are included in Appendix I.

5-7
5.3 Truck Hauling Routes
Trucks should use the major arterial highways whenever possible for hauling routes
and avoid smaller collector streets near the project. A truck hauling route map has
been provided to show the preferred path of travel for trucks to the freeway system.
Truck Hailing Routes is provided on Exhibit R. There are currently restrictions for
trucks on El Rivino Road. All trucks must use the project access along Agua Mansa
to access the site.

5-8
THIS PAGE INTENTIONALLY LEFT BLANK

6-1
6.0 Site Access Analysis
The proposed project would have three (3) access driveways to the adjacent roadway
system. The following driveways are proposed
1. Project Access 1 (NS) at El Rivino Road (EW) – Unsignalized, full access
2. Agua Mansa Road (NS) at Project Access 2 (EW) – Signalized, full access
3. Kiningham Drive (NS) at Project Access 3 (EW) – Unsignalized, full access
The project driveways have been reviewed with respect to truck turning movements and
recommendations have been made to accommodate a WB-67 truck classification. Roadway
widening along Agua Mansa Road will need to be provided. Please see Exhibit T for more
details.
6.1 Traffic Signal Warrant Analysis
Traffic signal warrants have been analyzed for the following intersection:
North-South Street East-West Street
Agua Mansa Road Project Access 2
The study area intersection of Agua Mansa Road at Project Access 2 is expected to
provide access to passenger vehicles and all trucks. Based upon the peak hour
signal warrant analysis, this intersection is not projected to warrant a traffic signal
for both Opening Year and Buildout Year With Project conditions due to the low
volume on the minor street approach. However, based on the volume of truck
traffic generated by the site and sight distance restrictions along Agua Mansa Road,
RK recommends installing a traffic signal to increase vehicular safety.

6-2
A traffic signal warrant analysis is also provided for the intersection of El Rivino Road
at Agua Mansa Road. A traffic signal will be required to mitigate impacts under
future cumulative with related project conditions.
The traffic signal warrant worksheets are included in Appendix K.
It should be noted that an additional Caltrans traffic signal warrant analysis can be
done prior to installing the traffic signal.
6.2 Agua Mansa Road at Project Access 2 (Easterly Driveway)
6.2.1 Sight Distance
At unsignalized intersections, a substantially clear line of sight (corner sight
distance) should be maintained between the driver of a vehicle, bicyclist or
pedestrian waiting at the crossroad and the driver of an approaching vehicle (along
the main highway). Line of sight for all users should be included in right of way.
Adequate time must be provided for the waiting user to either cross all lanes of
through traffic, cross the near lanes and turn left, or turn right, without requiring
through traffic to radically alter their speed. Corner sight distance requirements
provide 7 1/2 seconds for the driver on the crossroad to complete the necessary
maneuver while the approaching vehicle travels at the assumed design speed of the
main highway.
Corner sight distance requirements are based on the design speed of the main
highway, not the actual posted speed limit. Agua Mansa Road is designated as a
Major Highway in the County of San Bernardino’s Circulation Element. The design
speed for this roadway would be approximately 45 MPH. Based on
Table 405.11A of the Caltrans Highway Design Manual 2012, the minimum
required corner sight distance to be provided for the unsignalized project
access driveway is 495 feet.

6-3
Exhibits S-1 and S-2 show the sight distance diagrams for the signalized project
access driveway on Agua Mansa Road, and the Caltrans sight distance standards are
provided in Appendix L.
6.2.2 Truck Circulation
Exhibit T shows the truck turning template for WB-67 semi-trucks. As seen in
Exhibit T, the proposed site plan is sufficient for WB-67 trucks, or smaller, to enter
the proposed signalized driveway on Agua Mansa Road. A wide southbound right
turn lane and dedicated northbound left turn lane should be provided to allow
trucks adequate space to complete a turn into the site without conflicting with
exiting vehicles or being required to cross over into the opposite lane of travel. In
order to accommodate this access, Agua Mansa Road would need to be widening
along the easterly side.

6-4
THIS PAGE INTENTIONALLY LEFT BLANK

7-1
7.0 Recommendations
7.1 Site Access
I. Sight distance at all project access points should be reviewed with respect to
Caltrans and County of San Bernardino sight distance standards at the time of
preparation of final grading, landscape, and street improvement plans.
II. Install a traffic signal at Agua Mansa Road at Project Access 2.
III. Install stop signs, stop bars, and stop legends at all unsignalized project access
points.
7.2 Off-Site Improvements
Recommendations for the project are graphically depicted on Exhibits U.
I. Complete any remaining half-section improvements to the east side of Agua
Mansa Road, adjacent to the site. This would require widening Agua Mansa
Road to accommodate the proposed access configuration and may also require
providing designated right-of-way for the ultimate buildout width and
constructing landscaping and parkway improvements.
II. Install northbound left turn lane on Agua Mansa Road at Project Access and
provide additional roadway widening on Agua Mansa to accommodate wider
southbound right turn lane.
III. Additional widening along the east side of Agua Mansa Road, between the
project access and El Rivino Road, will be needed to allow sufficient space for
roadway transition.

7-2
IV. Install northbound thru lane on Agua Mansa Road at El Rivino Road. A traffic
signal will be required at this location under future cumulative with related
project conditions.
V. The project should contribute towards the cost of the recommended off-site
intersection improvements for cumulative impacts on a fair-share or “pro-rata”
basis. Tables 12 and 13 show the recommended off-site intersection
improvements and estimated costs. The estimated cost of improvements is
based on the County of San Bernardino’s Construction Cost Estimate for the
Congestion Management Plan, shown in Appendix L.
7.3 Conclusions
Based upon the results of this analysis, the proposed Agua Mansa High-Cube
Warehouse project can be accommodated within the County of San Bernardino’s
circulation system with the implementation of the recommendations listed in this
report. A copy of the approved Memorandum of Understanding is provided in
Appendix M.

______________________________________________________________________________
______________________________________________________________________________
Exhibits


______________________________________________________________________________
______________________________________________________________________________
Tables

L T R L T R L T R L T R AM PM AM PM
• El Rivino Road (EW) J.V. TS 1.0 1.5 0.5 1.0 1.5 0.5 0.0 1! 0.0 0.5 0.5 1.0 17.3 17.3 B B
• El Rivino Road (EW) S.B.C./J.V./Rialto TS 0.0 0.0 0.0 1.0 0.0 1.0 0.5 0.5 0.0 0.0 0.5 0.5 12.2 11.6 B B
• El Rivino Road (EW) S.B.C./J.V. CSS 0.0 1! 0.0 0.0 1! 0.0 0.0 1! 0.0 0.0 1! 0.0 10.0 10.8 B B
• El Rivino Road (EW) S.B.C./J.V. CSS 0.0 0.0 0.0 0.0 1! 0.0 0.5 0.5 0.0 0.0 0.5 0.5 9.4 9.0 A A
• El Rivino Road (EW) S.B.C. CSS 1.0 1.0 0.0 0.0 0.5 0.5 0.5 0.0 0.5 0.0 0.0 0.0 17.5 67.8 C F
• Agua Mansa Road (EW) Rialto/Colton TS 1.0 1.5 0.5 1.0 2.0 1.0 1.0 1.0 1.0 1.0 1.0 1.0 29.8 32.4 C C
• El Rivino Road (EW) S.B.C. N/A N/A N/A N/A N/A N/A N/A N/A N/A N/A N/A N/A N/A N/A N/A N/A N/A
• Project Access 2 (EW) S.B.C. N/A N/A N/A N/A N/A N/A N/A N/A N/A N/A N/A N/A N/A N/A N/A N/A N/A
1
L = Left; T = Through; R = Right; > = Right Turn Overlap; >> = Free Right Turn; Bold = Improvement
! = Indicates general purpose lane
2
3 TS = Traffic Signal
CSS = Cross-Street Stop4 S.B.C = San Bernardino County; J.V. = Jurupa Valley
TABLE 1
Level of ServiceSouthbound Eastbound Westbound
Intersection Approach Lane(s)1Delay2
(Secs)Northbound
Intersection Analysis for Existing Conditions
Traffic Control3
Analysis Software: Traffix, Version 8.0. Per the 2000 Highway Capacity Manual, overall average intersection delay and level of service are shown forintersections with traffic signal or all-way stop control. For intersections with cross-street stop control, the delay and level of service for the worst individualmovement (or movements sharing a single lane) are shown.
Cactus Avenue (NS) at:
Hall Avenue (NS) at:
Riverside Avenue (NS) at:
Kiningham Drive (NS) at:
Project Access 1 (NS) at:
Agua Mansa Road (NS) at:
Agua Mansa Road (NS) at:
Intersection
Cedar Avenue (NS) at:
When a right turn lane is designated, the lane can either be striped or unstriped. To function as a right turn lane there must be sufficient width for rightturning vehicles to travel outside the through lanes. Where "1" is indicated for the through movement and "0"s are indicated for R/L movements, the R and/orL turns are shared with the through movement.
Jurisdiction4
j:/rktables/RK10607TB.xlsJN:0995-2014-06

Land Use2 Units1 In Out Total In Out Total Daily
High-Cube Warehouse TSF 0.076 0.034 0.110 0.037 0.083 0.120 1.680General Light Industrial TSF 0.810 0.110 0.920 0.116 0.854 0.970 6.970
79.57% 79.57% 79.57% 79.57% 79.57% 79.57% 79.57%
1.0 1.0 1.0 1.0 1.0 1.0 1.0
3.46% 3.46% 3.46% 3.46% 3.46% 3.46% 3.46%
1.5 1.5 1.5 1.5 1.5 1.5 1.5
4.64% 4.64% 4.64% 4.64% 4.64% 4.64% 4.64%
2.0 2.0 2.0 2.0 2.0 2.0 2.0
12.33% 12.33% 12.33% 12.33% 12.33% 12.33% 12.33%3.0 3.0 3.0 3.0 3.0 3.0 3.0
0.060 0.027 0.088 0.030 0.066 0.095 1.337
0.004 0.002 0.006 0.002 0.004 0.006 0.087
0.007 0.003 0.010 0.003 0.008 0.011 0.1560.028 0.013 0.041 0.014 0.031 0.044 0.621
0.644 0.088 0.732 0.093 0.679 0.772 5.546
0.042 0.006 0.048 0.006 0.044 0.050 0.362
0.075 0.010 0.085 0.011 0.079 0.090 0.6470.299 0.041 0.340 0.043 0.316 0.359 2.578
TSFTSF
1 TSF = Thousand Square Feet
2 Source: ITE Trip Generation, 9th Ed./National Association of Industrial and Office Properties (NAIOP) Adjusted Rates
3 Recommended Vehicle Mix Percentages per City of Fontana Truck Trip Generation Study for Heavy Warehouse uses, August 2003 (Page 40)
4 Recommended PCE Factor per San Bernardino County CMP, 2005 Update
Passenger Car Equivalent Rates Calculations
TABLE 2
Trip Generation Rates
AM PM
Peak Hour
Passenger Cars
Recommended Mix (%)3
PCE Factor4
PCE Factor4
2-Axle Trucks
Final Rates High Cube Warehouse Rates (In Passenger Car Equivalents)
3-Axle Trucks
Recommended Mix (%)3
Recommended Mix (%)3
Recommended Mix (%)3
PCE Factor4
3-Axle Trucks
4-Axle Trucks
PCE Factor4
Building B (General Light Industrial) Building Size: 30.059
4-Axle+ Trucks
Passenger Cars
2-Axle Trucks
Final Rates General Light Industrial Rates (In Passenger Car Equivalents)
Passenger Cars
2-Axle Trucks
Building A (High Cube Warehouse) Building Size: 475.847
3-Axle Trucks4-Axle+ Trucks
j:/rktables/RK10607TB.xlsJN:0995-2014-06

In Out Total In Out TotalBuilding A:High Cube Warehouse 475.847 TSF 36 16 52 18 39 57 799Building B:
General Light Industrial 30.059 TSF 24 3 27 3 26 29 210
60 20 79 21 65 86 1,009
In Out Total In Out Total Daily
29 13 42 14 31 45 636
2 1 3 1 2 3 41
3 2 5 2 4 6 74
13 6 19 7 15 22 296
18 9 27 10 21 31 411
47 22 69 24 52 76 1,047
19 3 22 3 20 23 167
1 0 1 0 1 2 11
2 0 2 0 2 3 19
9 1 10 1 9 10 77
12 1 13 1 12 15 107
31 4 35 4 32 36 274
48 16 64 17 51 68 803
3 1 4 1 3 5 52
5 2 7 2 6 9 93
22 7 29 8 24 32 373
30 10 40 11 33 46 518
78 26 104 28 84 112 1,321
1 TSF = Thousand Square Feet
Weekday Peak HourAM PM
Table 3Project Trip Generation in Passenger Car Equivalents (PCE)
Project Trip Generation (Without PCE Adjustment)
DailyAM PM
Weekday Peak Hour
Land Use Quantity
Trucks SubtotalTotal
Project Trip Generation(With PCE Adjustment)
Total Project Trip Generation(Without PCE Adjustment)
Land Use Vehicle Mix
Units1
Bulding A:High Cube Warehouse
Building A Trip Generation(In Passenger Car Equivalents)
4-Axle+ Trucks (3.0 x)
4-Axle+ Trucks (3.0 x)
3-Axle Trucks (2.0 x)
2-Axle Trucks (1.5 x)
Passenger Cars
Passenger Cars
2-Axle Trucks (1.5 x)
3-Axle Trucks (2.0 x)
Project Trip Generation (With PCE Adjustment)
Trucks Subtotal
Trucks Subtotal
TotalProject Trip Generation (With PCE
Adjustment)
Passenger Cars
2-Axle Trucks (1.5 x)
3-Axle Trucks (2.0 x)
4-Axle+ Trucks (3.0 x)
Bulding B:General Light
Industrial
Building B Trip Generation(In Passenger Car Equivalents)
j:/rktables/RK10607TB.xlsJN:0995-2014-06

Land Use Quantity Units2 In Out Total In Out Total Daily
1 Jurupa Valley Kamps Propane General Light Industrial 13.332 TSF 8 2 10 4 6 10 51
2 Jurupa Valley Lytle Development General Light Industrial 120 EMP 50 17 67 24 50 74 986
3 RialtoRialto Commerce
Center 3 Warehouse 3,659.000 TSF 1,749 379 2,128 567 1,656 2,223 23,448
4 Rialto Cap Rock III Warehouse 527.900 TSF 210 55 265 70 212 282 3,151
2,017 453 2,470 665 1,924 2,589 27,636
1 Other Developments provided by the County of San Bernardino, City of Jurupa Valley and City of Rialto.2 TSF = Thousand Square Feet EMP = Employees3 Trip Generation based on Rialto Commerce Center Traffic Impact Study, prepared by Kunzman Associates (1.28.09)
CUMULATIVE DEVELOPMENTSTOTAL TRIP GENERATION
Other Developments Trip Generation1
TABLE 4
AM
Zone Project
Peak HourPM
Jurisdiction
j:/rktables/RK10607TB.xlsJN:0995-2014-06

L T R L T R L T R L T R AM PM AM PM
• El Rivino Road (EW) J.V. TS 1.0 1.5 0.5 1.0 1.5 0.5 0.0 1! 0.0 0.5 0.5 1.0 17.3 17.4 B B
• El Rivino Road (EW) S.B.C./J.V./Rialto TS 0.0 0.0 0.0 1.0 0.0 1.0 0.5 0.5 0.0 0.0 0.5 0.5 12.2 11.7 B B
• El Rivino Road (EW) S.B.C./J.V. CSS 0.0 1! 0.0 0.0 1! 0.0 0.0 1! 0.0 0.0 1! 0.0 10.1 10.9 B B
• El Rivino Road (EW) S.B.C./J.V. CSS 0.0 0.0 0.0 0.0 1! 0.0 0.5 0.5 0.0 0.0 0.5 0.5 9.4 9.1 A A
• El Rivino Road (EW) S.B.C. CSS 1.0 1.0 0.0 0.00 0.5 0.5 0.5 0.0 0.5 0.0 0.0 0.0 18.7 97.8 C F
• Agua Mansa Road (EW) Rialto/Colton TS 1.0 1.5 0.5 1.0 2.0 1.0 1.0 1.0 1.0 1.0 1.0 1.0 31.1 34.8 C C
• El Rivino Road (EW) S.B.C. N/A N/A N/A N/A N/A N/A N/A N/A N/A N/A N/A N/A N/A N/A N/A N/A N/A
• Project Access 2 (EW) S.B.C. N/A N/A N/A N/A N/A N/A N/A N/A N/A N/A N/A N/A N/A N/A N/A N/A N/A
1
L = Left; T = Through; R = Right; > = Right Turn Overlap; >> = Free Right Turn; Bold = Improvement
! = Indicates general purpose lane
2
3 TS = Traffic Signal4 S.B.C = San Bernardino County; J.V. = Jurupa Valley
TABLE 5
Level of ServiceSouthbound Eastbound Westbound
Intersection Analysis for Project Opening Year (2017)
Analysis Software: Traffix, Version 8.0. Per the 2000 Highway Capacity Manual, overall average intersection delay and level of service are shown forintersections with traffic signal or all-way stop control. For intersections with cross-street stop control, the delay and level of service for the worst individualmovement (or movements sharing a single lane) are shown.
Riverside Avenue (NS) at:
Traffic Control3
When a right turn lane is designated, the lane can either be striped or unstriped. To function as a right turn lane there must be sufficient width for rightturning vehicles to travel outside the through lanes. Where "1" is indicated for the through movement and "0"s are indicated for R/L movements, the Rand/or L turns are shared with the through movement.
Intersection Approach Lane(s)1
Kiningham Drive (NS) at:
Project Access 1 (NS) at:
NorthboundJurisdiction4
Hall Avenue (NS) at:
Cedar Avenue (NS) at:
Agua Mansa Road (NS) at:
Delay2
(Secs)
Without Related Projects Without Project Conditions
Agua Mansa Road (NS) at:
Intersection
Cactus Avenue (NS) at:
j:/rktables/RK10607TB.xlsJN:0995-2014-06

L T R L T R L T R L T R AM PM AM PM
• El Rivino Road (EW) J.V. TS 1.0 1.5 0.5 1.0 1.5 0.5 0.0 1! 0.0 0.5 0.5 1.0 17.5 17.6 B B
• El Rivino Road (EW) S.B.C./J.V./Rialto TS 0.0 0.0 0.0 1.0 0.0 1.0 0.5 0.5 0.0 0.0 0.5 0.5 12.0 11.6 B B
• El Rivino Road (EW) S.B.C./J.V. CSS 0.0 1! 0.0 0.0 1! 0.0 0.0 1! 0.0 0.0 1! 0.0 10.4 11.3 B B
• El Rivino Road (EW) S.B.C./J.V. CSS 0.0 0.0 0.0 0.0 1! 0.0 0.5 0.5 0.0 0.0 0.5 0.5 9.1 9.2 A A
• El Rivino Road (EW) S.B.C. CSS 1.0 1.0 0.0 0.0 0.5 0.5 0.5 0.0 0.5 0.0 0.0 0.0 19.5 111.4 C F
CSS 1.0 2.0 0.0 0.0 0.5 0.5 0.5 0.0 0.5 0.0 0.0 0.0 15.6 32.0 C D
• Agua Mansa Road (EW) Rialto/Colton TS 1.0 1.5 0.5 1.0 2.0 1.0 1.0 1.0 1.0 1.0 1.0 1.0 31.7 35.2 C D
• El Rivino Road (EW) S.B.C. CSS 0.0 0.0 0.0 0.0 1! 0.0 0.5 0.5 0.0 0.0 0.5 0.5 7.4 9.1 A A
• Project Access 2 (EW) S.B.C. TS 1.0 1.0 0.0 0.0 1.0 1.0 1.0 0.0 1.0 0.0 0.0 0.0 2.2 3.9 A A
1
L = Left; T = Through; R = Right; > = Right Turn Overlap; >> = Free Right Turn; Bold = Improvement
! = Indicates general purpose lane
2
3 TS = Traffic Signal4 S.B.C = San Bernardino County; J.V. = Jurupa Valley
Analysis Software: Traffix, Version 8.0. Per the 2000 Highway Capacity Manual, overall average intersection delay and level of service are shown for intersectionswith traffic signal or all-way stop control. For intersections with cross-street stop control, the delay and level of service for the worst individual movement (ormovements sharing a single lane) are shown.
TABLE 6
Level of ServiceSouthbound Eastbound Westbound
Intersection
Cedar Avenue (NS) at:
Traffic Control3
Hall Avenue (NS) at:
When a right turn lane is designated, the lane can either be striped or unstriped. To function as a right turn lane there must be sufficient width for right turningvehicles to travel outside the through lanes. Where "1" is indicated for the through movement and "0"s are indicated for R/L movements, the R and/or L turns areshared with the through movement.
Riverside Avenue (NS) at:
Intersection Approach Lane(s)1Delay2
(Secs)NorthboundJurisdiction4
Agua Mansa Road (NS) at:
Intersection Analysis for Project Opening Year (2017)
Without Related Projects With Project Conditions
Project Access 1 (NS) at:
Agua Mansa Road (NS) at:
Cactus Avenue (NS) at:
Kiningham Drive (NS) at:
-With Mitigation
j:/rktables/RK10607TB.xlsJN:0995-2014-06

L T R L T R L T R L T R AM PM AM PM
• El Rivino Road (EW) J.V. TS 1.0 1.5 0.5 1.0 1.5 0.5 0.0 1! 0.0 0.5 0.5 1.0 28.4 54.1 C D
• El Rivino Road (EW) S.B.C./J.V./Rialto TS 0.0 0.0 0.0 1.0 0.0 1.0 0.5 0.5 0.0 0.0 0.5 0.5 23.8 28.1 C C
• El Rivino Road (EW) S.B.C./J.V. CSS 0.0 1! 0.0 0.0 1! 0.0 0.0 1! 0.0 0.0 1! 0.0 12.8 14.5 B B
• El Rivino Road (EW) S.B.C./J.V. CSS 0.0 0.0 0.0 0.0 1! 0.0 0.5 0.5 0.0 0.0 0.5 0.5 11.4 9.9 B A
• El Rivino Road (EW) S.B.C. CSS 1.0 1.0 0.0 0.00 0.5 0.5 0.5 0.0 0.5 0.0 0.0 0.0 40.7 234.3 E F
TS 1.0 1.0 0.0 0.00 0.5 0.5 0.5 0.0 0.5 0.0 0.0 0.0 11.7 17.3 B B
• Agua Mansa Road (EW) Rialto/Colton TS 1.0 1.5 0.5 1.0 2.0 1.0 1.0 1.0 1.0 1.0 1.0 1.0 35.2 37.8 D D
• El Rivino Road (EW) S.B.C. N/A N/A N/A N/A N/A N/A N/A N/A N/A N/A N/A N/A N/A N/A N/A N/A N/A
• Project Access 2 (EW) S.B.C. N/A N/A N/A N/A N/A N/A N/A N/A N/A N/A N/A N/A N/A N/A N/A N/A N/A
1
L = Left; T = Through; R = Right; > = Right Turn Overlap; >> = Free Right Turn; Bold = Improvement
! = Indicates general purpose lane
2
3 TS = Traffic Signal4 S.B.C = San Bernardino County; J.V. = Jurupa Valley
Cedar Avenue (NS) at:
Hall Avenue (NS) at:
Analysis Software: Traffix, Version 8.0. Per the 2000 Highway Capacity Manual, overall average intersection delay and level of service are shown forintersections with traffic signal or all-way stop control. For intersections with cross-street stop control, the delay and level of service for the worstindividual movement (or movements sharing a single lane) are shown.
Eastbound
Agua Mansa Road (NS) at:
Riverside Avenue (NS) at:
When a right turn lane is designated, the lane can either be striped or unstriped. To function as a right turn lane there must be sufficient width for rightturning vehicles to travel outside the through lanes. Where "1" is indicated for the through movement and "0"s are indicated for R/L movements, the Rand/or L turns are shared with the through movement.
Cactus Avenue (NS) at:
Jurisdiction4
Level of Service
Agua Mansa Road (NS) at:
-With Mitigation
Project Access 1 (NS) at:
Kiningham Drive (NS) at:
TABLE 7
Intersection Analysis for Project Opening Year (2017)
With Related Projects Without Project Conditions
IntersectionTraffic
Control3
Delay2
(Secs)Intersection Approach Lane(s)1
SouthboundNorthbound Westbound
j:/rktables/RK10607TB.xlsJN:0995-2014-06

L T R L T R L T R L T R AM PM AM PM
• El Rivino Road (EW) J.V. TS 1.0 1.5 0.5 1.0 1.5 0.5 0.0 1! 0.0 0.5 0.5 1.0 29.4 55.9 C E
TS 1.0 1.5 0.5 1.0 1.5 0.5 0.0 1! 0.0 1.5 0.5 1.0 28.3 22.5 C C
• El Rivino Road (EW) S.B.C./J.V./Rialto TS 0.0 0.0 0.0 1.0 0.0 1.0 0.5 0.5 0.0 0.0 0.5 0.5 24.5 29.9 C C
• El Rivino Road (EW) S.B.C./J.V. CSS 0.0 1! 0.0 0.0 1! 0.0 0.0 1! 0.0 0.0 1! 0.0 14.8 18.0 B B
• El Rivino Road (EW) S.B.C./J.V. CSS 0.0 0.0 0.0 0.0 1! 0.0 0.5 0.5 0.0 0.0 0.5 0.5 11.7 10.1 B B
• El Rivino Road (EW) S.B.C. CSS 1.0 1.0 0.0 0.0 0.5 0.5 0.5 0.0 0.5 0.0 0.0 0.0 60.4 831.5 F F
TS 1.0 1.0 0.0 0.0 0.5 0.5 0.5 0.0 0.5 0.0 0.0 0.0 11.7 17.6 B B
• Agua Mansa Road (EW) Rialto/Colton TS 1.0 1.5 0.5 1.0 2.0 1.0 1.0 1.0 1.0 1.0 1.0 1.0 36.0 38.7 D D
• El Rivino Road (EW) S.B.C. CSS 0.0 0.0 0.0 0.0 1! 0.0 0.5 0.5 0.0 0.0 0.5 0.5 8.0 10.4 A B
• Project Access 2 (EW) S.B.C. TS 1.0 1.0 0.0 0.0 1.0 1.0 1.0 0.0 1.0 0.0 0.0 0.0 2.2 4.3 A A
1
L = Left; T = Through; R = Right; > = Right Turn Overlap; >> = Free Right Turn; Bold = Improvement
! = Indicates general purpose lane
2
3 TS = Traffic Signal4 S.B.C = San Bernardino County; J.V. = Jurupa Valley
TABLE 8
Intersection Analysis for Project Opening Year (2017)
With Related Projects With Project Conditions
IntersectionTraffic
Control3
Intersection Approach Lane(s)1Delay2
(Secs)Level of ServiceEastbound Westbound
Analysis Software: Traffix, Version 8.0. Per the 2000 Highway Capacity Manual, overall average intersection delay and level of service are shown for intersectionswith traffic signal or all-way stop control. For intersections with cross-street stop control, the delay and level of service for the worst individual movement (ormovements sharing a single lane) are shown.
Cedar Avenue (NS) at:
Cactus Avenue (NS) at:
Hall Avenue (NS) at:
Kiningham Drive (NS) at:
When a right turn lane is designated, the lane can either be striped or unstriped. To function as a right turn lane there must be sufficient width for right turningvehicles to travel outside the through lanes. Where "1" is indicated for the through movement and "0"s are indicated for R/L movements, the R and/or L turns areshared with the through movement.
Agua Mansa Road (NS) at:
Project Access 1 (NS) at:
Agua Mansa Road (NS) at:
-With Mitigation
Riverside Avenue (NS) at:
Northbound SouthboundJurisdiction4
-With Mitigation
j:/rktables/RK10607TB.xlsJN:0995-2014-06

L T R L T R L T R L T R AM PM AM PM
• El Rivino Road (EW) J.V. TS 1.0 1.5 0.5 1.0 1.5 0.5 0.0 1! 0.0 0.5 0.5 1.0 25.4 159.6 C F
TS 1.0 1.5 0.5 1.0 2.0 1.0 0.0 1! 0.0 1.5 0.5 1.0 23.2 33.6 C C
• El Rivino Road (EW) S.B.C./J.V./Rialto TS 0.0 0.0 0.0 1.0 0.0 1.0 0.5 0.5 0.0 0.0 0.5 0.5 20.2 37.0 C D
• El Rivino Road (EW) S.B.C./J.V. CSS 0.0 1! 0.0 0.0 1! 0.0 0.0 1! 0.0 0.0 1! 0.0 12.9 33.6 B D
• El Rivino Road (EW) S.B.C./J.V. CSS 0.0 0.0 0.0 0.0 1! 0.0 0.5 0.5 0.0 0.0 0.5 0.5 11.7 10.3 B B
• El Rivino Road (EW) S.B.C. CSS 1.0 1.0 0.0 0.00 0.5 0.5 0.5 0.0 0.5 0.0 0.0 0.0 127.1 1477.2 F F
TS 1.0 2.0 0.0 0.0 0.5 0.5 0.5 0.0 0.5 0.0 0.0 0.0 15.4 16.4 B B
• Agua Mansa Road (EW) Rialto/Colton TS 1.0 1.5 0.5 1.0 2.0 1.0 1.0 1.0 1.0 1.0 1.0 1.0 100.4 244.9 F F
1.0 2.5 0.5 1.0 2.5 0.5 2.0 2.0 1.0 1.0 2.0 1.0 44.1 43.8 D D
• El Rivino Road (EW) S.B.C. N/A N/A N/A N/A N/A N/A N/A N/A N/A N/A N/A N/A N/A N/A N/A N/A N/A
• Project Access 2 (EW) S.B.C. N/A N/A N/A N/A N/A N/A N/A N/A N/A N/A N/A N/A N/A N/A N/A N/A N/A
1
L = Left; T = Through; R = Right; > = Right Turn Overlap; >> = Free Right Turn; Bold = Improvement
! = Indicates general purpose lane
2
3 TS = Traffic Signal4 S.B.C = San Bernardino County; J.V. = Jurupa Valley
TABLE 9
Intersection Analysis for Buildout Year (2035)
With Related Projects Without Project Conditions
IntersectionTraffic
Control3Southbound
Intersection Approach Lane(s)1
Jurisdiction4
Delay2
(Secs)Eastbound
When a right turn lane is designated, the lane can either be striped or unstriped. To function as a right turn lane there must be sufficient width for rightturning vehicles to travel outside the through lanes. Where "1" is indicated for the through movement and "0"s are indicated for R/L movements, the Rand/or L turns are shared with the through movement.
Analysis Software: Traffix, Version 8.0. Per the 2000 Highway Capacity Manual, overall average intersection delay and level of service are shown forintersections with traffic signal or all-way stop control. For intersections with cross-street stop control, the delay and level of service for the worst individualmovement (or movements sharing a single lane) are shown.
Project Access 1 (NS) at:
Level of Service
Hall Avenue (NS) at:
Northbound
Cedar Avenue (NS) at:
Cactus Avenue (NS) at:
Kiningham Drive (NS) at:
Westbound
Agua Mansa Road (NS) at:
-With Mitigation
-With Mitigation
-With Mitigation
Agua Mansa Road (NS) at:
Riverside Avenue (NS) at:
j:/rktables/RK10607TB.xlsJN:0995-2014-06

L T R L T R L T R L T R AM PM AM PM
• El Rivino Road (EW) J.V. TS 1.0 1.5 0.5 1.0 1.5 0.5 0.0 1! 0.0 0.5 0.5 1.0 25.9 162.3 C F
TS 1.0 1.5 0.5 1.0 2.0 1.0 0.0 1! 0.0 1.5 0.5 1.0 24.7 52.1 C D
• El Rivino Road (EW) S.B.C./J.V./Rialto TS 0.0 0.0 0.0 1.0 0.0 1.0 0.5 0.5 0.0 0.0 0.5 0.5 20.4 39.4 C D
• El Rivino Road (EW) S.B.C./J.V. CSS 0.0 1! 0.0 0.0 1! 0.0 0.0 1! 0.0 0.0 1! 0.0 13.1 37.1 B E
CSS 1.0 0.5 0.5 0.0 1! 0.0 0.0 1! 0.0 0.0 1! 0.0 13.2 29.9 B D
• El Rivino Road (EW) S.B.C./J.V. CSS 0.0 0.0 0.0 0.0 1! 0.0 0.5 0.5 0.0 0.0 0.5 0.5 11.2 10.3 B B
• El Rivino Road (EW) S.B.C. CSS 1.0 1.0 0.0 0.0 0.5 0.5 0.5 0.0 0.5 0.0 0.0 0.0 141.3 1560.1 F F
TS 1.0 2.0 0.0 0.0 0.5 0.5 0.5 0.0 0.5 0.0 0.0 0.0 15.7 16.8 B B
• Agua Mansa Road (EW) Rialto/Colton TS 1.0 1.5 0.5 1.0 2.0 1.0 1.0 1.0 1.0 1.0 1.0 1.0 102.6 248.1 F F
TS 1.0 2.5 0.5 1.0 2.5 0.5 2.0 2.0 1.0 1.0 2.0 1.0 45.9 44.6 D D
• El Rivino Road (EW) S.B.C. CSS 0.0 0.0 0.0 0.0 1! 0.0 0.5 0.5 0.0 0.0 0.5 0.5 8.1 10.6 A B
• Project Access 2 (EW) S.B.C. TS 1.0 1.0 0.0 0.0 1.0 1.0 1.0 0.0 1.0 0.0 0.0 0.0 3.0 8.9 A A
1
L = Left; T = Through; R = Right; > = Right Turn Overlap; >> = Free Right Turn; Bold = Improvement
! = Indicates general purpose lane
2
3 TS = Traffic Signal4 S.B.C = San Bernardino County; J.V. = Jurupa Valley
Project Access 1 (NS) at:
Agua Mansa Road (NS) at:
Westbound
-With Mitigation
-With Mitigation
NorthboundJurisdiction4
TABLE 10
Intersection Analysis for Buildout Year (2035)
With Related Projects With Project Conditions
IntersectionTraffic
Control3
Intersection Approach Lane(s)1
Southbound EastboundDelay2
(Secs)Level of Service
When a right turn lane is designated, the lane can either be striped or unstriped. To function as a right turn lane there must be sufficient width for right turningvehicles to travel outside the through lanes. Where "1" is indicated for the through movement and "0"s are indicated for R/L movements, the R and/or L turns areshared with the through movement.
Analysis Software: Traffix, Version 8.0. Per the 2000 Highway Capacity Manual, overall average intersection delay and level of service are shown for intersectionswith traffic signal or all-way stop control. For intersections with cross-street stop control, the delay and level of service for the worst individual movement (ormovements sharing a single lane) are shown.
-With Mitigation
Cedar Avenue (NS) at:
Cactus Avenue (NS) at:
Hall Avenue (NS) at:
Kiningham Drive (NS) at:
Agua Mansa Road (NS) at:
-With Mitigation
Riverside Avenue (NS) at:
j:/rktables/RK10607TB.xlsJN:0995-2014-06

- Install one (1) northbound thru lane- Widen conventional highway, one lane ($1,000,000/mile) x 1,200 feet 227,273$ 100% 227,273$
- Install Traffic Signal - Signalization of local intersection 250,000$ 100% 250,000$
477,273$
1 Recommended improvements would satisfy County of San Bernardino requirements to restore intersection Level of Service to "without project" conditions.2 Project impacts are considered "Direct" and project would be responsible to implement all off-site recommended improvements3
TABLE 11
Project Opening Year (2017) Without Related Projects With Project Conditions(DIRECT IMPACTS)
Intersection
Recommended Improvements forProject Opening Year (2017)
Without Related ProjectsWith Project Conditions2
County of San Bernardino CMPImprovement Description3
ProjectFair Share
Percentage2Estimated
Project Cost
Recommended Off-Site Intersection Improvements and Cost Estimate1
Agua Mansa Road (NS) at:Project Access (EW)
EstimatedTotal Cost
Agua Mansa Road (NS) at:El Rivino Road (EW)
Improvement costs are based on County of San Bernardino Congestion Management Plan Preliminary Construction Cost Estimates, as shown in Appendix L.
Total Estimated Project Cost for Off-Site Intersection Improvements
j:/rktables/RK10607TB.xlsJN:0995-2014-06

- Install one (1) westbound left lane - Construct left-turn lane (240' long) 50,000$ 2.23% 1,117$
- Install Traffic Signal - Signalization of local intersection 598,400$ 6.58% 39,385$
40,502$
1 Recommended improvements would satisfy County of San Bernardino requirements to restore intersection Level of Service to D or better.2 Project impacts are considered "Cumulative" and project would be responsible to contribute fair share towards off-site recommended improvements.3
Agua Mansa Road (NS) at:El Rivino Road (EW)
Total Estimated Project Cost for Off-Site Intersection Improvements
Improvement costs are based on County of San Bernardino Congestion Management Plan Preliminary Construction Cost Estimates, as shown in Appendix L.
Cedar Avenue (NS) at:El Rivino Road (EW)
TABLE 12Recommended Off-Site Intersection Improvements and Cost Estimate1
Project Opening Year (2017) With Related Projects With Project Conditions(CUMULATIVE IMPACTS)
Intersection
Recommended Improvements forProject Opening Year (2017)
With Related ProjectsWith Project Conditions2
County of San Bernardino CMPImprovement Description3
EstimatedTotal Cost3
ProjectFair Share
Percentage4Estimated
Project Cost
j:/rktables/RK10607TB.xlsJN:0995-2014-06

- [Install one (1) westbound left turn lane] - Construct left-turn lane (240' long) 50,000$ 1.21% 607$
- Install one (1) northbound left turn lane - Construct left-turn lane (240' long) 50,000$ 6.02% 3,012$
- [Install Traffic Signal] - Signalization of local intersection 598,400$ 3.07% 18,381$
- Install one (1) northbound thru lane - Signalization of local intersection 250,000$ 2.20% 5,493$ - Reconfigure southbound right lane to be shared thru/right lane
- Widen conventional highway, one lane ($1,000,000/mile) x 1,200 feet 227,273$ 2.20% 4,994$
- Install eastbound left turn lane - Construct left-turn lane (240' long) 50,000$ 2.20% 1,099$
- Install eastbound thru lane- Widen conventional highway, one lane ($1,000,000/mile) x 1,200 feet 227,273$ 2.20% 4,994$
- Install westbound thru lane- Widen conventional highway, one lane ($1,000,000/mile) x 1,200 feet 227,273$ 2.20% 4,994$
43,574$
1 Recommended improvements would satisfy County of San Bernardino requirements to restore intersection Level of Service to D or better.2 Project impacts are considered "Cumulative" and project would be responsible to contribute fair share towards off-site recommended improvements.3
4 Fair share calculations are shown in Table 15.5 [ ] = Previous phase recommendations
TABLE 13Recommended Off-Site Intersection Improvements and Cost Estimate1
Buildout Year (2035) With Related Projects With Project Conditions(CUMULATIVE IMPACTS)
Intersection
Recommended Improvements forProject Opening Year (2017)
With Related ProjectsWith Project Conditions2
County of San Bernardino CMPImprovement Description3
EstimatedCost3
ProjectFair Share
Percentage4Estimated
Project Cost
Cedar Avenue (NS) at:El Rivino Road (EW)5
Total Estimated Project Cost for Off-Site Intersection Improvements
Improvement costs are based on County of San Bernardino Congestion Management Plan Preliminary Construction Cost Estimates, as shown in Appendix L.
Hall Avenue (NS) at:El Rivino Road (EW)
Agua Mansa Road (NS) at:El Rivino Road (EW)5
Riverside Avenue (NS) at:Agua Mansa Road (EW)
j:/rktables/RK10607TB.xlsJN:0995-2014-06

AM PM AM PM AM PM AM PM AM PM
• El Rivino Road (EW) 1,346 1,684 2,358 2,758 1,012 1,074 22 24 2.17% 2.23%
• El Rivino Road (EW) 835 1,189 1,266 1,660 431 471 27 31 6.26% 6.58%
TABLE 14Project Fair-Share Intersection Contribution for
Existing Traffic
Year 2017 With Related Projects
With Project Traffic
Growth in Traffic
Project Traffic
Project % of Year 2017 With
RelatedWith Project
Growth in Traffic
Agua Mansa Road (NS) at:
Project Opening Year (2017) With Related Projects With Project Conditions
Intersection
Cedar Avenue (NS) at:
j:/rktables/RK10607TB.xlsJN:0995-2014-06

AM PM AM PM AM PM AM PM AM PM
• El Rivino Road (EW) 1,346 1,684 3,159 4,194 1,813 2,510 22 24 1.21% 0.96%
• El Rivino Road (EW) 249 300 664 1,043 415 743 25 27 6.02% 3.63%
• El Rivino Road (EW) 835 1,189 1,714 2,338 879 1,149 27 31 3.07% 2.70%
• Agua Mansa Road (EW) 2,799 3,153 5,211 7,087 2,412 3,934 53 55 2.20% 1.40%
Buildout Year (2035) With Related Projects With Project Conditions
Intersection
TABLE 15Project Fair-Share Intersection Contribution for
Existing Traffic
Year 2035 With Related Projects
With Project Traffic
Project Traffic
Project % of Year 2035 With
RelatedWith Project
Growth in TrafficGrowth in
Traffic
Riverside Avenue (NS) at:
Cedar Avenue (NS) at:
Hall Avenue (NS) at:
Agua Mansa Road (NS) at:
j:/rktables/RK10607TB.xlsJN:0995-2014-06

______________________________________________________________________________
______________________________________________________________________________
Appendices

Appendix A
Traffic Count Worksheets

DATE: LOCATION: San Bernardino PROJECT #: SC03996/12/14 NORTH & SOUTH: Cedar LOCATION #: A
THURSDAY EAST & WEST: El Rivino CONTROL: SIGNAL
CLASS 1: NOTES: AM �PASSENGER PM NVEHICLES MD � W E �
OTHER SOTHER �
NORTHBOUND SOUTHBOUND EASTBOUND WESTBOUND
NL NT NR SL ST SR EL ET ER WL WT WR TOTAL NB SB EB WB TTLLANES: 1 2 0 1 2 0 0 1 0 0.5 0.5 1
7:00 AM 0 57 2 7 89 1 1 0 4 8 0 7 176 0 7:15 AM 1 65 9 12 131 2 0 1 2 1 0 3 227 0 7:30 AM 2 91 3 18 156 0 1 0 1 4 0 6 282 0 7:45 AM 2 78 9 12 113 2 1 0 0 5 1 6 229 0 8:00 AM 2 78 9 12 113 2 1 0 0 5 1 6 229 0 8:15 AM 1 72 6 9 90 1 0 0 2 2 1 3 187 0 8:30 AM 0 62 8 12 88 2 5 1 0 5 0 6 189 0 8:45 AM 0 63 7 7 95 2 2 2 0 1 2 9 190 0 9:00 AM 0 0 0 0 0 0 0 0 0 0 0 0 0 0 9:15 AM 0 0 0 0 0 0 0 0 0 0 0 0 0 0 9:30 AM 0 0 0 0 0 0 0 0 0 0 0 0 0 0 9:45 AM 0 0 0 0 0 0 0 0 0 0 0 0 0 0
VOLUMES 8 566 53 89 875 12 11 4 9 31 5 46 1,709 0 0 0 0 0 APPROACH % 1% 90% 8% 9% 90% 1% 46% 17% 38% 38% 6% 56%APP/DEPART 627 / 623 976 / 915 24 / 146 82 / 25 0 BEGIN PEAK HRVOLUMES 7 312 30 54 513 6 3 1 3 15 2 21 967 APPROACH % 2% 89% 9% 9% 90% 1% 43% 14% 43% 39% 5% 55%PEAK HR FACTOR 0.909 0.823 0.583 0.792 0.857 APP/DEPART 349 / 336 573 / 531 7 / 85 38 / 15 0
03:00 PM 0 0 0 0 0 0 0 0 0 0 0 0 0 0 3:15 PM 0 0 0 0 0 0 0 0 0 0 0 0 0 0 3:30 PM 0 0 0 0 0 0 0 0 0 0 0 0 0 0 3:45 PM 0 0 0 0 0 0 0 0 0 0 0 0 0 0 4:00 PM 3 120 7 14 117 0 1 2 0 13 1 32 310 0 4:15 PM 4 146 6 15 108 1 2 0 2 12 0 12 308 0 4:30 PM 1 166 8 14 121 3 0 1 3 13 0 12 342 0 4:45 PM 1 137 16 9 140 2 4 1 1 9 0 13 333 0 5:00 PM 2 127 7 7 142 1 2 1 4 15 2 23 333 0 5:15 PM 1 155 8 8 162 2 0 1 1 11 4 16 369 0 5:30 PM 1 139 9 16 166 1 1 2 3 4 2 13 357 0 5:45 PM 2 143 4 10 163 4 1 1 2 7 1 12 350 0
VOLUMES 15 1,133 65 93 1,119 14 11 9 16 84 10 133 2,702 0 0 0 0 0 APPROACH % 1% 93% 5% 8% 91% 1% 31% 25% 44% 37% 4% 59%APP/DEPART 1,213 / 1,277 1,226 / 1,219 36 / 167 227 / 39 0 BEGIN PEAK HRVOLUMES 6 564 28 41 633 8 4 5 10 37 9 64 1,409 APPROACH % 1% 94% 5% 6% 93% 1% 21% 26% 53% 34% 8% 58%PEAK HR FACTOR 0.912 0.932 0.679 0.688 0.955 APP/DEPART 598 / 632 682 / 680 19 / 74 110 / 23 0
Cedar
NORTH SIDE
El Rivino WEST SIDE EAST SIDE El Rivino
SOUTH SIDE
Cedar
AM
7:15 AM
PM
5:00 PM
INTERSECTION TURNING MOVEMENT COUNTSPREPARED BY: PACIFIC TRAFFIC DATA SERVICES
U-TURNSCedar Cedar El Rivino El Rivino

DATE: LOCATION: San Bernardino PROJECT #: SC03996/12/14 NORTH & SOUTH: Cedar LOCATION #: A
THURSDAY EAST & WEST: El Rivino CONTROL: SIGNAL
CLASS 2: NOTES: AM �2-AXLE PM NWORK MD � W E �
VEHICLES/ OTHER STRUCKS OTHER �
NORTHBOUND SOUTHBOUND EASTBOUND WESTBOUND
NL NT NR SL ST SR EL ET ER WL WT WR TOTAL NB SB EB WB TTLLANES: 1 2 0 1 2 0 0 1 0 0.5 0.5 1
7:00 AM 0 15 2 1 19 0 0 0 0 1 0 4 42 0 7:15 AM 1 14 0 1 10 0 0 0 2 3 0 3 34 0 7:30 AM 1 7 1 3 13 0 0 0 0 3 0 3 31 0 7:45 AM 0 11 0 6 11 0 0 0 0 3 0 3 34 0 8:00 AM 0 11 0 6 11 0 0 0 0 3 0 3 34 0 8:15 AM 1 7 1 0 8 0 0 0 0 2 0 0 19 0 8:30 AM 0 9 2 0 15 0 0 0 1 2 0 0 29 0 8:45 AM 1 6 0 2 11 0 0 0 0 2 0 1 23 0 9:00 AM 0 0 0 0 0 0 0 0 0 0 0 0 0 0 9:15 AM 0 0 0 0 0 0 0 0 0 0 0 0 0 0 9:30 AM 0 0 0 0 0 0 0 0 0 0 0 0 0 0 9:45 AM 0 0 0 0 0 0 0 0 0 0 0 0 0 0
VOLUMES 4 80 6 19 98 0 0 0 3 19 0 17 246 0 0 0 0 0 APPROACH % 4% 89% 7% 16% 84% 0% 0% 0% 100% 53% 0% 47%APP/DEPART 90 / 97 117 / 120 3 / 25 36 / 4 0 BEGIN PEAK HRVOLUMES 2 47 3 11 53 0 0 0 2 10 0 13 141 APPROACH % 4% 90% 6% 17% 83% 0% 0% 0% 100% 43% 0% 57%PEAK HR FACTOR 0.765 0.800 0.250 0.958 0.839 APP/DEPART 52 / 60 64 / 65 2 / 14 23 / 2 0
03:00 PM 0 0 0 0 0 0 0 0 0 0 0 0 0 0 3:15 PM 0 0 0 0 0 0 0 0 0 0 0 0 0 0 3:30 PM 0 0 0 0 0 0 0 0 0 0 0 0 0 0 3:45 PM 0 0 0 0 0 0 0 0 0 0 0 0 0 0 4:00 PM 0 13 3 5 9 0 0 0 0 0 0 1 31 0 4:15 PM 1 9 3 6 6 0 1 0 0 2 0 2 30 0 4:30 PM 0 16 2 1 4 0 0 0 1 1 0 1 26 0 4:45 PM 0 10 1 2 5 0 0 0 1 1 0 5 25 0 5:00 PM 0 12 0 1 7 1 0 0 0 0 0 2 23 0 5:15 PM 0 8 2 1 7 0 0 0 1 1 1 3 24 0 5:30 PM 0 4 0 3 11 0 1 1 0 2 0 1 23 0 5:45 PM 0 5 0 0 7 0 0 0 0 0 0 1 13 0
VOLUMES 1 77 11 19 56 1 2 1 3 7 1 16 195 0 0 0 0 0 APPROACH % 1% 87% 12% 25% 74% 1% 33% 17% 50% 29% 4% 67%APP/DEPART 89 / 95 76 / 66 6 / 31 24 / 3 0 BEGIN PEAK HRVOLUMES 1 48 9 14 24 0 1 0 2 4 0 9 112 APPROACH % 2% 83% 16% 37% 63% 0% 33% 0% 67% 31% 0% 69%PEAK HR FACTOR 0.806 0.679 0.750 0.542 0.903 APP/DEPART 58 / 58 38 / 30 3 / 23 13 / 1 0
Cedar
NORTH SIDE
El Rivino WEST SIDE EAST SIDE El Rivino
SOUTH SIDE
Cedar
AM
7:00 AM
PM
4:00 PM
INTERSECTION TURNING MOVEMENT COUNTSPREPARED BY: PACIFIC TRAFFIC DATA SERVICES
U-TURNSCedar Cedar El Rivino El Rivino

DATE: LOCATION: San Bernardino PROJECT #: SC03996/12/14 NORTH & SOUTH: Cedar LOCATION #: A
THURSDAY EAST & WEST: El Rivino CONTROL: SIGNAL
CLASS 3: NOTES: AM �3-AXLE PM NTRUCKS MD � W E �
OTHER SOTHER �
NORTHBOUND SOUTHBOUND EASTBOUND WESTBOUND
NL NT NR SL ST SR EL ET ER WL WT WR TOTAL NB SB EB WB TTLLANES: 1 2 0 1 2 0 0 1 0 0.5 0.5 1
7:00 AM 0 1 0 0 0 0 0 0 0 0 0 3 4 0 7:15 AM 0 1 0 0 1 0 0 0 0 2 0 0 4 0 7:30 AM 0 3 0 0 3 0 0 0 0 0 0 0 6 0 7:45 AM 0 1 1 0 0 0 0 0 0 1 0 0 3 0 8:00 AM 0 1 1 0 0 0 0 0 0 1 0 0 3 0 8:15 AM 0 1 0 1 3 1 0 0 0 0 0 0 6 0 8:30 AM 0 4 0 0 3 0 0 0 0 0 0 0 7 0 8:45 AM 0 6 0 0 4 0 0 0 0 0 0 0 10 0 9:00 AM 0 0 0 0 0 0 0 0 0 0 0 0 0 0 9:15 AM 0 0 0 0 0 0 0 0 0 0 0 0 0 0 9:30 AM 0 0 0 0 0 0 0 0 0 0 0 0 0 0 9:45 AM 0 0 0 0 0 0 0 0 0 0 0 0 0 0
VOLUMES 0 18 2 1 14 1 0 0 0 4 0 3 43 0 0 0 0 0 APPROACH % 0% 90% 10% 6% 88% 6% 0% 0% 0% 57% 0% 43%APP/DEPART 20 / 21 16 / 18 0 / 3 7 / 1 0 BEGIN PEAK HRVOLUMES 0 12 1 1 10 1 0 0 0 1 0 0 26 APPROACH % 0% 92% 8% 8% 83% 8% 0% 0% 0% 100% 0% 0%PEAK HR FACTOR 0.542 0.600 0.000 0.250 0.650 APP/DEPART 13 / 12 12 / 11 0 / 2 1 / 1 0
3:00 PM 0 0 0 0 0 0 0 0 0 0 0 0 0 0 3:15 PM 0 0 0 0 0 0 0 0 0 0 0 0 0 0 3:30 PM 0 0 0 0 0 0 0 0 0 0 0 0 0 0 3:45 PM 0 0 0 0 0 0 0 0 0 0 0 0 0 0 4:00 PM 0 3 0 0 3 0 0 0 0 0 0 0 6 0 4:15 PM 0 3 0 0 3 0 0 0 0 0 0 0 6 0 4:30 PM 0 7 1 0 3 0 0 0 1 1 0 0 13 0 4:45 PM 1 3 0 1 5 0 0 0 1 0 0 0 11 0 5:00 PM 0 2 0 0 2 0 0 0 0 0 0 0 4 0 5:15 PM 0 3 1 0 2 0 0 0 0 0 0 0 6 0 5:30 PM 0 1 0 1 1 0 0 0 0 0 1 0 4 0 5:45 PM 0 2 0 1 1 0 0 0 0 0 0 0 4 0
VOLUMES 1 24 2 3 20 0 0 0 2 1 1 0 54 0 0 0 0 0 APPROACH % 4% 89% 7% 13% 87% 0% 0% 0% 100% 50% 50% 0%APP/DEPART 27 / 24 23 / 23 2 / 5 2 / 2 0 BEGIN PEAK HRVOLUMES 1 16 1 1 14 0 0 0 2 1 0 0 36 APPROACH % 6% 89% 6% 7% 93% 0% 0% 0% 100% 100% 0% 0%PEAK HR FACTOR 0.563 0.625 0.500 0.250 0.692 APP/DEPART 18 / 16 15 / 17 2 / 2 1 / 1 0
Cedar
NORTH SIDE
El Rivino WEST SIDE EAST SIDE El Rivino
SOUTH SIDE
Cedar
AM
8:00 AM
PM
4:00 PM
INTERSECTION TURNING MOVEMENT COUNTSPREPARED BY: PACIFIC TRAFFIC DATA SERVICES
U-TURNSCedar Cedar El Rivino El Rivino

DATE: LOCATION: San Bernardino PROJECT #: SC03996/12/14 NORTH & SOUTH: Cedar LOCATION #: A
THURSDAY EAST & WEST: El Rivino CONTROL: SIGNAL
CLASS 4: NOTES: AM �4 OR MORE PM N
AXLE MD � W E �TRUCKS OTHER S
OTHER �
NORTHBOUND SOUTHBOUND EASTBOUND WESTBOUND
NL NT NR SL ST SR EL ET ER WL WT WR TOTAL NB SB EB WB TTLLANES: 1 2 0 1 2 0 0 1 0 0.5 0.5 1
7:00 AM 0 3 0 0 0 0 0 0 0 1 0 0 4 0 7:15 AM 0 4 0 1 4 0 0 0 0 1 0 0 10 0 7:30 AM 0 4 1 0 3 0 0 0 0 2 0 0 10 0 7:45 AM 0 5 1 1 7 0 0 0 0 0 0 0 14 0 8:00 AM 0 5 1 1 7 0 0 0 0 0 0 0 14 0 8:15 AM 0 0 0 0 4 0 0 0 0 0 0 1 5 0 8:30 AM 0 5 1 2 5 0 0 0 0 2 0 0 15 0 8:45 AM 0 2 1 2 4 0 0 0 0 0 0 0 9 0 9:00 AM 0 0 0 0 0 0 0 0 0 0 0 0 0 0 9:15 AM 0 0 0 0 0 0 0 0 0 0 0 0 0 0 9:30 AM 0 0 0 0 0 0 0 0 0 0 0 0 0 0 9:45 AM 0 0 0 0 0 0 0 0 0 0 0 0 0 0
VOLUMES 0 28 5 7 34 0 0 0 0 6 0 1 81 0 0 0 0 0 APPROACH % 0% 85% 15% 17% 83% 0% 0% 0% 0% 86% 0% 14%APP/DEPART 33 / 29 41 / 40 0 / 12 7 / 0 0 BEGIN PEAK HRVOLUMES 0 15 3 4 23 0 0 0 0 2 0 1 48 APPROACH % 0% 83% 17% 15% 85% 0% 0% 0% 0% 67% 0% 33%PEAK HR FACTOR 0.750 0.844 0.000 0.375 0.800 APP/DEPART 18 / 16 27 / 25 0 / 7 3 / 0 0
3:00 PM 0 0 0 0 0 0 0 0 0 0 0 0 0 0 3:15 PM 0 0 0 0 0 0 0 0 0 0 0 0 0 0 3:30 PM 0 0 0 0 0 0 0 0 0 0 0 0 0 0 3:45 PM 0 0 0 0 0 0 0 0 0 0 0 0 0 0 4:00 PM 0 8 0 2 1 0 0 0 0 0 0 1 12 0 4:15 PM 0 8 0 0 1 0 0 0 0 0 0 1 10 0 4:30 PM 0 2 0 0 1 0 0 0 0 0 0 0 3 0 4:45 PM 0 2 2 3 2 0 0 0 0 0 0 0 9 0 5:00 PM 0 6 1 1 0 0 0 0 0 0 0 0 8 0 5:15 PM 0 2 0 0 5 0 0 0 0 0 0 1 8 0 5:30 PM 0 4 0 0 2 0 0 0 0 0 0 1 7 0 5:45 PM 0 1 0 0 0 0 0 0 0 0 0 0 1 0
VOLUMES 0 33 3 6 12 0 0 0 0 0 0 4 58 0 0 0 0 0 APPROACH % 0% 92% 8% 33% 67% 0% 0% 0% 0% 0% 0% 100%APP/DEPART 36 / 37 18 / 12 0 / 9 4 / 0 0 BEGIN PEAK HRVOLUMES 0 20 2 5 5 0 0 0 0 0 0 2 34 APPROACH % 0% 91% 9% 50% 50% 0% 0% 0% 0% 0% 0% 100%PEAK HR FACTOR 0.688 0.500 0.000 0.500 0.708 APP/DEPART 22 / 22 10 / 5 0 / 7 2 / 0 0
Cedar
NORTH SIDE
El Rivino WEST SIDE EAST SIDE El Rivino
SOUTH SIDE
Cedar
AM
7:45 AM
PM
4:00 PM
INTERSECTION TURNING MOVEMENT COUNTSPREPARED BY: PACIFIC TRAFFIC DATA SERVICES
U-TURNSCedar Cedar El Rivino El Rivino

DATE: LOCATION: San Bernardino PROJECT #: SC03996/12/14 NORTH & SOUTH: Cedar LOCATION #: A
THURSDAY EAST & WEST: El Rivino CONTROL: SIGNAL
CLASS 5: NOTES: AM �RV PM N
MD � W E �OTHER SOTHER �
NORTHBOUND SOUTHBOUND EASTBOUND WESTBOUND
NL NT NR SL ST SR EL ET ER WL WT WR TOTAL NB SB EB WB TTLLANES: 1 2 0 1 2 0 0 1 0 0.5 0.5 1
7:00 AM 0 0 0 0 0 0 0 0 0 0 0 0 0 0 7:15 AM 0 0 0 0 0 0 0 0 0 0 0 0 0 0 7:30 AM 0 0 1 0 0 0 0 0 0 0 0 0 1 0 7:45 AM 0 0 0 0 0 0 0 0 0 0 0 0 0 0 8:00 AM 0 0 0 0 0 0 0 0 0 0 0 0 0 0 8:15 AM 0 0 0 0 0 0 0 0 0 0 0 0 0 0 8:30 AM 0 0 0 0 0 0 0 0 0 0 0 0 0 0 8:45 AM 0 0 0 0 0 0 0 0 0 0 0 0 0 0 9:00 AM 0 0 0 0 0 0 0 0 0 0 0 0 0 0 9:15 AM 0 0 0 0 0 0 0 0 0 0 0 0 0 0 9:30 AM 0 0 0 0 0 0 0 0 0 0 0 0 0 0 9:45 AM 0 0 0 0 0 0 0 0 0 0 0 0 0 0
VOLUMES 0 0 1 0 0 0 0 0 0 0 0 0 1 0 0 0 0 0 APPROACH % 0% 0% 100% 0% 0% 0% 0% 0% 0% 0% 0% 0%APP/DEPART 1 / 0 0 / 0 0 / 1 0 / 0 0 BEGIN PEAK HRVOLUMES 0 0 1 0 0 0 0 0 0 0 0 0 1 APPROACH % 0% 0% 100% 0% 0% 0% 0% 0% 0% 0% 0% 0%PEAK HR FACTOR 0.250 0.000 0.000 0.000 0.250 APP/DEPART 1 / 0 0 / 0 0 / 1 0 / 0 0
3:00 PM 0 0 0 0 0 0 0 0 0 0 0 0 0 0 3:15 PM 0 0 0 0 0 0 0 0 0 0 0 0 0 0 3:30 PM 0 0 0 0 0 0 0 0 0 0 0 0 0 0 3:45 PM 0 0 0 0 0 0 0 0 0 0 0 0 0 0 4:00 PM 0 0 0 0 0 0 0 0 0 0 0 0 0 0 4:15 PM 0 0 0 0 0 0 0 0 0 0 0 0 0 0 4:30 PM 0 0 0 0 0 0 0 0 0 0 0 0 0 0 4:45 PM 0 0 0 0 0 0 0 0 0 0 0 0 0 0 5:00 PM 0 0 0 0 0 0 0 0 0 0 0 0 0 0 5:15 PM 0 0 0 0 0 0 0 0 0 0 0 0 0 0 5:30 PM 0 0 0 0 0 0 0 0 0 0 0 0 0 0 5:45 PM 0 0 0 0 0 0 0 0 0 0 0 0 0 0
VOLUMES 0 0 0 0 0 0 0 0 0 0 0 0 0 0 0 0 0 0 APPROACH % 0% 0% 0% 0% 0% 0% 0% 0% 0% 0% 0% 0%APP/DEPART 0 / 0 0 / 0 0 / 0 0 / 0 0 BEGIN PEAK HRVOLUMES 0 0 0 0 0 0 0 0 0 0 0 0 0 APPROACH % 0% 0% 0% 0% 0% 0% 0% 0% 0% 0% 0% 0%PEAK HR FACTOR 0.000 0.000 0.000 0.000 0.000 APP/DEPART 0 / 0 0 / 0 0 / 0 0 / 0 0
Cedar
NORTH SIDE
El Rivino WEST SIDE EAST SIDE El Rivino
SOUTH SIDE
Cedar
AM
7:30 AM
PM
5:45 PM
INTERSECTION TURNING MOVEMENT COUNTSPREPARED BY: PACIFIC TRAFFIC DATA SERVICES
U-TURNSCedar Cedar El Rivino El Rivino

DATE: LOCATION: San Bernardino PROJECT #: SC03996/12/14 NORTH & SOUTH: Cedar LOCATION #: A
THURSDAY EAST & WEST: El Rivino CONTROL: SIGNAL
CLASS 6: NOTES: AM �PM N
BUSES MD � W E �OTHER SOTHER �
NORTHBOUND SOUTHBOUND EASTBOUND WESTBOUND
NL NT NR SL ST SR EL ET ER WL WT WR TOTAL NB SB EB WB TTLLANES: 1 2 0 1 2 0 0 1 0 0.5 0.5 1
7:00 AM 0 0 0 0 0 0 0 0 0 0 0 0 0 0 7:15 AM 0 0 0 0 0 0 0 0 0 0 0 0 0 0 7:30 AM 0 0 0 0 0 0 0 0 0 0 0 0 0 0 7:45 AM 0 0 0 0 0 0 0 0 0 0 0 0 0 0 8:00 AM 0 0 0 0 0 0 0 0 0 0 0 0 0 0 8:15 AM 0 0 0 0 0 0 0 0 0 0 0 0 0 0 8:30 AM 0 0 0 0 0 0 0 0 0 0 0 0 0 0 8:45 AM 0 0 0 0 0 0 0 0 0 0 0 0 0 0 9:00 AM 0 0 0 0 0 0 0 0 0 0 0 0 0 0 9:15 AM 0 0 0 0 0 0 0 0 0 0 0 0 0 0 9:30 AM 0 0 0 0 0 0 0 0 0 0 0 0 0 0 9:45 AM 0 0 0 0 0 0 0 0 0 0 0 0 0 0
VOLUMES 0 0 0 0 0 0 0 0 0 0 0 0 0 0 0 0 0 0 APPROACH % 0% 0% 0% 0% 0% 0% 0% 0% 0% 0% 0% 0%APP/DEPART 0 / 0 0 / 0 0 / 0 0 / 0 0 BEGIN PEAK HRVOLUMES 0 0 0 0 0 0 0 0 0 0 0 0 0 APPROACH % 0% 0% 0% 0% 0% 0% 0% 0% 0% 0% 0% 0%PEAK HR FACTOR 0.000 0.000 0.000 0.000 0.000 APP/DEPART 0 / 0 0 / 0 0 / 0 0 / 0 0
3:00 PM 0 0 0 0 0 0 0 0 0 0 0 0 0 0 3:15 PM 0 0 0 0 0 0 0 0 0 0 0 0 0 0 3:30 PM 0 0 0 0 0 0 0 0 0 0 0 0 0 0 3:45 PM 0 0 0 0 0 0 0 0 0 0 0 0 0 0 4:00 PM 0 0 0 0 0 0 0 0 0 0 0 0 0 0 4:15 PM 0 0 0 0 0 0 0 0 0 0 0 0 0 0 4:30 PM 0 0 0 0 0 0 0 0 0 0 0 0 0 0 4:45 PM 0 0 0 0 0 0 0 0 0 0 0 0 0 0 5:00 PM 0 0 0 0 0 0 0 0 0 0 0 0 0 0 5:15 PM 0 0 0 0 0 0 0 0 0 0 0 0 0 0 5:30 PM 0 0 0 0 0 0 0 0 0 0 0 0 0 0 5:45 PM 0 0 0 0 0 0 0 0 0 0 0 0 0 0
VOLUMES 0 0 0 0 0 0 0 0 0 0 0 0 0 0 0 0 0 0 APPROACH % 0% 0% 0% 0% 0% 0% 0% 0% 0% 0% 0% 0%APP/DEPART 0 / 0 0 / 0 0 / 0 0 / 0 0 BEGIN PEAK HRVOLUMES 0 0 0 0 0 0 0 0 0 0 0 0 0 APPROACH % 0% 0% 0% 0% 0% 0% 0% 0% 0% 0% 0% 0%PEAK HR FACTOR 0.000 0.000 0.000 0.000 0.000 APP/DEPART 0 / 0 0 / 0 0 / 0 0 / 0 0
Cedar
NORTH SIDE
El Rivino WEST SIDE EAST SIDE El Rivino
SOUTH SIDE
Cedar
AM
9:45 AM
PM
5:45 PM
INTERSECTION TURNING MOVEMENT COUNTSPREPARED BY: PACIFIC TRAFFIC DATA SERVICES
U-TURNSCedar Cedar El Rivino El Rivino

DATE: LOCATION: PROJECT #: SC0399Thu, Jun 12, 14 NORTH & SOUTH: LOCATION #: A
EAST & WEST: CONTROL: SIGNAL
NOTES: AM �PCE ADJUSTED PM N
MD � W E �OTHER SOTHER �
NORTHBOUND SOUTHBOUND EASTBOUND WESTBOUND
NL NT NR SL ST SR EL ET ER WL WT WR TOTALLANES: 1 2 0 1 2 0 0 1 0 0.5 0.5 1
7:00 AM 0 91 5 9 118 1 1 0 4 13 0 19 259 7:15 AM 3 100 9 17 160 2 0 1 5 13 0 8 316 7:30 AM 4 120 10 23 191 0 1 0 1 15 0 11 373 7:45 AM 2 112 14 24 151 2 1 0 0 12 1 11 328 8:00 AM 2 112 14 24 151 2 1 0 0 12 1 11 328 8:15 AM 3 85 8 11 120 3 0 0 2 5 1 6 243 8:30 AM 0 99 14 18 132 2 5 1 2 14 0 6 292 8:45 AM 2 90 10 16 132 2 2 2 0 4 2 11 272 9:00 AM 0 0 0 0 0 0 0 0 0 0 0 0 0 9:15 AM 0 0 0 0 0 0 0 0 0 0 0 0 0 9:30 AM 0 0 0 0 0 0 0 0 0 0 0 0 0 9:45 AM 0 0 0 0 0 0 0 0 0 0 0 0 0
VOLUMES 14 806 83 141 1,152 14 11 4 14 86 5 81 2,409 APPROACH % 2% 89% 9% 11% 88% 1% 39% 14% 47% 50% 3% 47%APP/DEPART 903 / 898 1,307 / 1,251 29 / 228 171 / 33 0 BEGIN PEAK HRVOLUMES 10 443 47 87 652 6 3 1 6 50 2 39 1,345 APPROACH % 2% 89% 9% 12% 88% 1% 30% 10% 60% 55% 2% 43%PEAK HR FACTOR 0.942 0.874 0.417 0.910 0.902 APP/DEPART 499 / 485 745 / 708 10 / 135 91 / 18 0
03:00 PM 0 0 0 0 0 0 0 0 0 0 0 0 0 3:15 PM 0 0 0 0 0 0 0 0 0 0 0 0 0 3:30 PM 0 0 0 0 0 0 0 0 0 0 0 0 0 3:45 PM 0 0 0 0 0 0 0 0 0 0 0 0 0 4:00 PM 3 170 12 28 140 0 1 2 0 13 1 37 405 4:15 PM 6 190 11 24 126 1 4 0 2 15 0 18 395 4:30 PM 1 210 13 16 136 3 0 1 7 17 0 14 416 4:45 PM 3 164 24 23 164 2 4 1 5 11 0 21 420 5:00 PM 2 167 10 12 157 3 2 1 4 15 2 26 400 5:15 PM 1 179 13 10 192 2 0 1 3 13 6 24 441 5:30 PM 1 159 9 23 191 1 3 4 3 7 4 18 421 5:45 PM 2 158 4 12 176 4 1 1 2 7 1 14 381
VOLUMES 19 1,396 95 146 1,279 16 14 11 25 97 14 169 3,277 APPROACH % 1% 93% 6% 10% 89% 1% 29% 21% 50% 35% 5% 61%APP/DEPART 1,509 / 1,579 1,440 / 1,400 49 / 251 279 / 48 0 BEGIN PEAK HRVOLUMES 7 669 56 67 702 8 9 7 14 45 12 88 1,681 APPROACH % 1% 91% 8% 9% 90% 1% 29% 22% 48% 31% 8% 61%PEAK HR FACTOR 0.948 0.907 0.763 0.837 0.953 APP/DEPART 732 / 765 776 / 761 29 / 129 144 / 26 0
El Rivino
INTERSECTION TURNING MOVEMENT COUNTSPREPARED BY: AimTD LLC tel: 951 249 3226 [email protected]
San BernardinoCedarEl Rivino
AM
7:15 AM
PM
4:45 PM
Cedar Cedar El Rivino

DATE: LOCATION: San Bernardino PROJECT #: SC03996/12/14 NORTH & SOUTH: Cactus LOCATION #: B
THURSDAY EAST & WEST: El Rivino CONTROL: Stop 1way S
CLASS 1: NOTES: AM �PASSENGER PM NVEHICLES MD � W E �
OTHER SOTHER �
NORTHBOUND SOUTHBOUND EASTBOUND WESTBOUND
NL NT NR SL ST SR EL ET ER WL WT WR TOTAL NB SB EB WB TTLLANES: X X X 1 X 1 0 1 X X 1 0
7:00 AM 0 0 0 11 0 5 5 12 0 0 10 3 46 0 7:15 AM 0 0 0 2 0 6 1 8 0 0 7 2 26 0 7:30 AM 0 0 0 4 0 1 6 17 0 0 4 2 34 0 7:45 AM 0 0 0 2 0 6 4 19 0 0 9 4 44 0 8:00 AM 0 0 0 2 0 2 8 18 0 0 9 4 43 0 8:15 AM 0 0 0 4 0 2 2 10 0 0 3 1 22 0 8:30 AM 0 0 0 4 0 1 3 9 0 0 5 2 24 0 8:45 AM 0 0 0 2 0 5 5 15 0 0 12 2 41 0 9:00 AM 0 0 0 0 0 0 0 0 0 0 0 0 0 0 9:15 AM 0 0 0 0 0 0 0 0 0 0 0 0 0 0 9:30 AM 0 0 0 0 0 0 0 0 0 0 0 0 0 0 9:45 AM 0 0 0 0 0 0 0 0 0 0 0 0 0 0
VOLUMES 0 0 0 31 0 28 34 108 0 0 59 20 280 0 0 0 0 0 APPROACH % 0% 0% 0% 53% 0% 47% 24% 76% 0% 0% 75% 25%APP/DEPART 0 / 54 59 / 0 142 / 139 79 / 87 0 BEGIN PEAK HRVOLUMES 0 0 0 19 0 18 16 56 0 0 30 11 150 APPROACH % 0% 0% 0% 51% 0% 49% 22% 78% 0% 0% 73% 27%PEAK HR FACTOR 0.000 0.578 0.783 0.788 0.815 APP/DEPART 0 / 27 37 / 0 72 / 75 41 / 48 0
03:00 PM 0 0 0 0 0 0 0 0 0 0 0 0 0 0 3:15 PM 0 0 0 0 0 0 0 0 0 0 0 0 0 0 3:30 PM 0 0 0 0 0 0 0 0 0 0 0 0 0 0 3:45 PM 0 0 0 0 0 0 0 0 0 0 0 0 0 0 4:00 PM 0 0 0 1 0 8 8 15 0 0 35 17 84 0 4:15 PM 0 0 0 3 0 5 4 20 0 0 13 12 57 0 4:30 PM 0 0 0 4 0 6 3 19 0 0 14 7 53 0 4:45 PM 0 0 0 4 0 4 12 14 0 0 21 7 62 0 5:00 PM 0 0 0 4 0 13 4 13 0 0 27 8 69 0 5:15 PM 0 0 0 0 0 5 1 14 0 0 20 6 46 0 5:30 PM 0 0 0 3 0 3 5 20 0 0 16 4 51 0 5:45 PM 0 0 0 3 0 4 4 14 0 0 14 4 43 0
VOLUMES 0 0 0 22 0 48 41 129 0 0 160 65 465 0 0 0 0 0 APPROACH % 0% 0% 0% 31% 0% 69% 24% 76% 0% 0% 71% 29%APP/DEPART 0 / 106 70 / 0 170 / 151 225 / 208 0 BEGIN PEAK HRVOLUMES 0 0 0 12 0 23 27 68 0 0 83 43 256 APPROACH % 0% 0% 0% 34% 0% 66% 28% 72% 0% 0% 66% 34%PEAK HR FACTOR 0.000 0.875 0.913 0.606 0.762 APP/DEPART 0 / 70 35 / 0 95 / 80 126 / 106 0
Cactus
NORTH SIDE
El Rivino WEST SIDE EAST SIDE El Rivino
SOUTH SIDE
Cactus
U-TURNSCactus Cactus El Rivino El Rivino
AM
7:00 AM
PM
4:00 PM
INTERSECTION TURNING MOVEMENT COUNTSPREPARED BY: PACIFIC TRAFFIC DATA SERVICES

DATE: LOCATION: San Bernardino PROJECT #: SC03996/12/14 NORTH & SOUTH: Cactus LOCATION #: B
THURSDAY EAST & WEST: El Rivino CONTROL: Stop 1way S
CLASS 2: NOTES: AM �2-AXLE PM NWORK MD � W E �
VEHICLES/ OTHER STRUCKS OTHER �
NORTHBOUND SOUTHBOUND EASTBOUND WESTBOUND
NL NT NR SL ST SR EL ET ER WL WT WR TOTAL NB SB EB WB TTLLANES: X X X 1 X 1 0 1 X X 1 0
7:00 AM 0 0 0 2 0 2 0 4 0 0 10 0 18 0 7:15 AM 0 0 0 1 0 0 1 2 0 0 14 1 19 0 7:30 AM 0 0 0 1 0 0 1 1 0 0 5 2 10 0 7:45 AM 0 0 0 0 0 1 0 1 0 0 1 1 4 0 8:00 AM 0 0 0 0 0 2 0 3 0 0 2 0 7 0 8:15 AM 0 0 0 1 0 0 1 0 0 0 0 0 2 0 8:30 AM 0 0 0 1 0 0 0 0 0 0 2 1 4 0 8:45 AM 0 0 0 0 0 1 0 4 0 0 0 1 6 0 9:00 AM 0 0 0 0 0 0 0 0 0 0 0 0 0 0 9:15 AM 0 0 0 0 0 0 0 0 0 0 0 0 0 0 9:30 AM 0 0 0 0 0 0 0 0 0 0 0 0 0 0 9:45 AM 0 0 0 0 0 0 0 0 0 0 0 0 0 0
VOLUMES 0 0 0 6 0 6 3 15 0 0 34 6 70 0 0 0 0 0 APPROACH % 0% 0% 0% 50% 0% 50% 17% 83% 0% 0% 85% 15%APP/DEPART 0 / 9 12 / 0 18 / 21 40 / 40 0 BEGIN PEAK HRVOLUMES 0 0 0 4 0 3 2 8 0 0 30 4 51 APPROACH % 0% 0% 0% 57% 0% 43% 20% 80% 0% 0% 88% 12%PEAK HR FACTOR 0.000 0.438 0.625 0.567 0.671 APP/DEPART 0 / 6 7 / 0 10 / 12 34 / 33 0
03:00 PM 0 0 0 0 0 0 0 0 0 0 0 0 0 0 3:15 PM 0 0 0 0 0 0 0 0 0 0 0 0 0 0 3:30 PM 0 0 0 0 0 0 0 0 0 0 0 0 0 0 3:45 PM 0 0 0 0 0 0 0 0 0 0 0 0 0 0 4:00 PM 0 0 0 0 0 0 1 7 0 0 0 0 8 0 4:15 PM 0 0 0 0 0 1 1 6 0 0 2 3 13 0 4:30 PM 0 0 0 0 0 1 0 2 0 0 2 1 6 0 4:45 PM 0 0 0 0 0 0 1 4 0 0 4 0 9 0 5:00 PM 0 0 0 0 0 1 0 1 0 0 1 1 4 0 5:15 PM 0 0 0 3 0 0 1 2 0 0 2 2 10 0 5:30 PM 0 0 0 0 0 2 1 2 0 0 0 2 7 0 5:45 PM 0 0 0 0 0 0 0 0 0 0 2 3 5 0
VOLUMES 0 0 0 3 0 5 5 24 0 0 13 12 62 0 0 0 0 0 APPROACH % 0% 0% 0% 38% 0% 63% 17% 83% 0% 0% 52% 48%APP/DEPART 0 / 17 8 / 0 29 / 27 25 / 18 0 BEGIN PEAK HRVOLUMES 0 0 0 0 0 2 3 19 0 0 8 4 36 APPROACH % 0% 0% 0% 0% 0% 100% 14% 86% 0% 0% 67% 33%PEAK HR FACTOR 0.000 0.500 0.688 0.600 0.692 APP/DEPART 0 / 7 2 / 0 22 / 19 12 / 10 0
Cactus
NORTH SIDE
El Rivino WEST SIDE EAST SIDE El Rivino
SOUTH SIDE
Cactus
U-TURNSCactus Cactus El Rivino El Rivino
AM
7:00 AM
PM
4:00 PM
INTERSECTION TURNING MOVEMENT COUNTSPREPARED BY: PACIFIC TRAFFIC DATA SERVICES

DATE: LOCATION: San Bernardino PROJECT #: SC03996/12/14 NORTH & SOUTH: Cactus LOCATION #: B
THURSDAY EAST & WEST: El Rivino CONTROL: Stop 1way S
CLASS 3: NOTES: AM �3-AXLE PM NTRUCKS MD � W E �
OTHER SOTHER �
NORTHBOUND SOUTHBOUND EASTBOUND WESTBOUND
NL NT NR SL ST SR EL ET ER WL WT WR TOTAL NB SB EB WB TTLLANES: X X X 1 X 1 0 1 X X 1 0
7:00 AM 0 0 0 0 0 0 0 0 0 0 1 0 1 0 7:15 AM 0 0 0 0 0 0 0 0 0 0 0 0 0 0 7:30 AM 0 0 0 0 0 1 0 0 0 0 1 0 2 0 7:45 AM 0 0 0 0 0 0 0 0 0 0 1 0 1 0 8:00 AM 0 0 0 0 0 0 0 0 0 0 0 1 1 0 8:15 AM 0 0 0 0 0 0 0 0 0 0 2 0 2 0 8:30 AM 0 0 0 0 0 0 0 1 0 0 0 0 1 0 8:45 AM 0 0 0 0 0 0 0 0 0 0 0 0 0 0 9:00 AM 0 0 0 0 0 0 0 0 0 0 0 0 0 0 9:15 AM 0 0 0 0 0 0 0 0 0 0 0 0 0 0 9:30 AM 0 0 0 0 0 0 0 0 0 0 0 0 0 0 9:45 AM 0 0 0 0 0 0 0 0 0 0 0 0 0 0
VOLUMES 0 0 0 0 0 1 0 1 0 0 5 1 8 0 0 0 0 0 APPROACH % 0% 0% 0% 0% 0% 100% 0% 100% 0% 0% 83% 17%APP/DEPART 0 / 1 1 / 0 1 / 1 6 / 6 0 BEGIN PEAK HRVOLUMES 0 0 0 0 0 1 0 0 0 0 4 1 6 APPROACH % 0% 0% 0% 0% 0% 100% 0% 0% 0% 0% 80% 20%PEAK HR FACTOR 0.000 0.250 0.000 0.625 0.750 APP/DEPART 0 / 1 1 / 0 0 / 0 5 / 5 0
3:00 PM 0 0 0 0 0 0 0 0 0 0 0 0 0 0 3:15 PM 0 0 0 0 0 0 0 0 0 0 0 0 0 0 3:30 PM 0 0 0 0 0 0 0 0 0 0 0 0 0 0 3:45 PM 0 0 0 0 0 0 0 0 0 0 0 0 0 0 4:00 PM 0 0 0 0 0 0 0 0 0 0 0 1 1 0 4:15 PM 0 0 0 0 0 0 1 0 0 0 0 0 1 0 4:30 PM 0 0 0 1 0 0 1 0 0 0 1 0 3 0 4:45 PM 0 0 0 0 0 0 1 1 0 0 0 1 3 0 5:00 PM 0 0 0 0 0 0 0 1 0 0 0 0 1 0 5:15 PM 0 0 0 0 0 0 0 0 0 0 0 0 0 0 5:30 PM 0 0 0 0 0 0 0 1 0 0 0 1 2 0 5:45 PM 0 0 0 0 0 0 0 1 0 0 0 0 1 0
VOLUMES 0 0 0 1 0 0 3 4 0 0 1 3 12 0 0 0 0 0 APPROACH % 0% 0% 0% 100% 0% 0% 43% 57% 0% 0% 25% 75%APP/DEPART 0 / 6 1 / 0 7 / 5 4 / 1 0 BEGIN PEAK HRVOLUMES 0 0 0 1 0 0 3 2 0 0 1 1 8 APPROACH % 0% 0% 0% 100% 0% 0% 60% 40% 0% 0% 50% 50%PEAK HR FACTOR 0.000 0.250 0.625 0.500 0.667 APP/DEPART 0 / 4 1 / 0 5 / 3 2 / 1 0
Cactus
NORTH SIDE
El Rivino WEST SIDE EAST SIDE El Rivino
SOUTH SIDE
Cactus
U-TURNSCactus Cactus El Rivino El Rivino
AM
7:30 AM
PM
4:15 PM
INTERSECTION TURNING MOVEMENT COUNTSPREPARED BY: PACIFIC TRAFFIC DATA SERVICES

DATE: LOCATION: San Bernardino PROJECT #: SC03996/12/14 NORTH & SOUTH: Cactus LOCATION #: B
THURSDAY EAST & WEST: El Rivino CONTROL: Stop 1way S
CLASS 4: NOTES: AM �4 OR MORE PM N
AXLE MD � W E �TRUCKS OTHER S
OTHER �
NORTHBOUND SOUTHBOUND EASTBOUND WESTBOUND
NL NT NR SL ST SR EL ET ER WL WT WR TOTAL NB SB EB WB TTLLANES: X X X 1 X 1 0 1 X X 1 0
7:00 AM 0 0 0 0 0 0 0 0 0 0 0 0 0 0 7:15 AM 0 0 0 0 0 1 0 0 0 0 0 0 1 0 7:30 AM 0 0 0 0 0 1 0 0 0 0 0 1 2 0 7:45 AM 0 0 0 0 0 0 0 0 0 0 0 0 0 0 8:00 AM 0 0 0 0 0 0 0 0 0 0 0 0 0 0 8:15 AM 0 0 0 0 0 0 2 1 0 0 0 0 3 0 8:30 AM 0 0 0 0 0 0 0 0 0 0 0 0 0 0 8:45 AM 0 0 0 0 0 0 0 0 0 0 0 0 0 0 9:00 AM 0 0 0 0 0 0 0 0 0 0 0 0 0 0 9:15 AM 0 0 0 0 0 0 0 0 0 0 0 0 0 0 9:30 AM 0 0 0 0 0 0 0 0 0 0 0 0 0 0 9:45 AM 0 0 0 0 0 0 0 0 0 0 0 0 0 0
VOLUMES 0 0 0 0 0 2 2 1 0 0 0 1 6 0 0 0 0 0 APPROACH % 0% 0% 0% 0% 0% 100% 67% 33% 0% 0% 0% 100%APP/DEPART 0 / 3 2 / 0 3 / 1 1 / 2 0 BEGIN PEAK HRVOLUMES 0 0 0 0 0 1 2 1 0 0 0 1 5 APPROACH % 0% 0% 0% 0% 0% 100% 67% 33% 0% 0% 0% 100%PEAK HR FACTOR 0.000 0.250 0.250 0.250 0.417 APP/DEPART 0 / 3 1 / 0 3 / 1 1 / 1 0
3:00 PM 0 0 0 0 0 0 0 0 0 0 0 0 0 0 3:15 PM 0 0 0 0 0 0 0 0 0 0 0 0 0 0 3:30 PM 0 0 0 0 0 0 0 0 0 0 0 0 0 0 3:45 PM 0 0 0 0 0 0 0 0 0 0 0 0 0 0 4:00 PM 0 0 0 0 0 0 0 0 0 0 0 0 0 0 4:15 PM 0 0 0 0 0 0 0 0 0 0 0 0 0 0 4:30 PM 0 0 0 0 0 0 0 0 0 0 0 0 0 0 4:45 PM 0 0 0 0 0 0 1 0 0 0 0 0 1 0 5:00 PM 0 0 0 0 0 0 1 0 0 0 0 0 1 0 5:15 PM 0 0 0 0 0 0 0 0 0 0 0 0 0 0 5:30 PM 0 0 0 0 0 0 0 0 0 0 0 0 0 0 5:45 PM 0 0 0 0 0 0 0 0 0 0 0 0 0 0
VOLUMES 0 0 0 0 0 0 2 0 0 0 0 0 2 0 0 0 0 0 APPROACH % 0% 0% 0% 0% 0% 0% 100% 0% 0% 0% 0% 0%APP/DEPART 0 / 2 0 / 0 2 / 0 0 / 0 0 BEGIN PEAK HRVOLUMES 0 0 0 0 0 0 2 0 0 0 0 0 2 APPROACH % 0% 0% 0% 0% 0% 0% 100% 0% 0% 0% 0% 0%PEAK HR FACTOR 0.000 0.000 0.500 0.000 0.500 APP/DEPART 0 / 2 0 / 0 2 / 0 0 / 0 0
Cactus
NORTH SIDE
El Rivino WEST SIDE EAST SIDE El Rivino
SOUTH SIDE
Cactus
U-TURNSCactus Cactus El Rivino El Rivino
AM
7:30 AM
PM
4:45 PM
INTERSECTION TURNING MOVEMENT COUNTSPREPARED BY: PACIFIC TRAFFIC DATA SERVICES

DATE: LOCATION: San Bernardino PROJECT #: SC03996/12/14 NORTH & SOUTH: Cactus LOCATION #: B
THURSDAY EAST & WEST: El Rivino CONTROL: Stop 1way S
CLASS 5: NOTES: AM �RV PM N
MD � W E �OTHER SOTHER �
NORTHBOUND SOUTHBOUND EASTBOUND WESTBOUND
NL NT NR SL ST SR EL ET ER WL WT WR TOTAL NB SB EB WB TTLLANES: X X X 1 X 1 0 1 X X 1 0
7:00 AM 0 0 0 0 0 0 0 0 0 0 0 0 0 0 7:15 AM 0 0 0 0 0 0 0 0 0 0 0 0 0 0 7:30 AM 0 0 0 0 0 0 0 0 0 0 0 0 0 0 7:45 AM 0 0 0 0 0 0 0 0 0 0 0 0 0 0 8:00 AM 0 0 0 0 0 0 0 0 0 0 0 0 0 0 8:15 AM 0 0 0 0 0 0 0 0 0 0 0 0 0 0 8:30 AM 0 0 0 0 0 0 0 0 0 0 0 0 0 0 8:45 AM 0 0 0 0 0 0 0 0 0 0 0 0 0 0 9:00 AM 0 0 0 0 0 0 0 0 0 0 0 0 0 0 9:15 AM 0 0 0 0 0 0 0 0 0 0 0 0 0 0 9:30 AM 0 0 0 0 0 0 0 0 0 0 0 0 0 0 9:45 AM 0 0 0 0 0 0 0 0 0 0 0 0 0 0
VOLUMES 0 0 0 0 0 0 0 0 0 0 0 0 0 0 0 0 0 0 APPROACH % 0% 0% 0% 0% 0% 0% 0% 0% 0% 0% 0% 0%APP/DEPART 0 / 0 0 / 0 0 / 0 0 / 0 0 BEGIN PEAK HRVOLUMES 0 0 0 0 0 0 0 0 0 0 0 0 0 APPROACH % 0% 0% 0% 0% 0% 0% 0% 0% 0% 0% 0% 0%PEAK HR FACTOR 0.000 0.000 0.000 0.000 0.000 APP/DEPART 0 / 0 0 / 0 0 / 0 0 / 0 0
3:00 PM 0 0 0 0 0 0 0 0 0 0 0 0 0 0 3:15 PM 0 0 0 0 0 0 0 0 0 0 0 0 0 0 3:30 PM 0 0 0 0 0 0 0 0 0 0 0 0 0 0 3:45 PM 0 0 0 0 0 0 0 0 0 0 0 0 0 0 4:00 PM 0 0 0 0 0 0 0 0 0 0 0 0 0 0 4:15 PM 0 0 0 0 0 0 0 0 0 0 0 0 0 0 4:30 PM 0 0 0 0 0 0 0 0 0 0 0 0 0 0 4:45 PM 0 0 0 0 0 0 0 0 0 0 0 0 0 0 5:00 PM 0 0 0 0 0 0 0 0 0 0 0 0 0 0 5:15 PM 0 0 0 0 0 0 0 0 0 0 0 0 0 0 5:30 PM 0 0 0 0 0 0 0 0 0 0 0 0 0 0 5:45 PM 0 0 0 0 0 0 0 0 0 0 0 0 0 0
VOLUMES 0 0 0 0 0 0 0 0 0 0 0 0 0 0 0 0 0 0 APPROACH % 0% 0% 0% 0% 0% 0% 0% 0% 0% 0% 0% 0%APP/DEPART 0 / 0 0 / 0 0 / 0 0 / 0 0 BEGIN PEAK HRVOLUMES 0 0 0 0 0 0 0 0 0 0 0 0 0 APPROACH % 0% 0% 0% 0% 0% 0% 0% 0% 0% 0% 0% 0%PEAK HR FACTOR 0.000 0.000 0.000 0.000 0.000 APP/DEPART 0 / 0 0 / 0 0 / 0 0 / 0 0
Cactus
NORTH SIDE
El Rivino WEST SIDE EAST SIDE El Rivino
SOUTH SIDE
Cactus
U-TURNSCactus Cactus El Rivino El Rivino
AM
9:45 AM
PM
5:45 PM
INTERSECTION TURNING MOVEMENT COUNTSPREPARED BY: PACIFIC TRAFFIC DATA SERVICES

DATE: LOCATION: San Bernardino PROJECT #: SC03996/12/14 NORTH & SOUTH: Cactus LOCATION #: B
THURSDAY EAST & WEST: El Rivino CONTROL: Stop 1way S
CLASS 6: NOTES: AM �PM N
BUSES MD � W E �OTHER SOTHER �
NORTHBOUND SOUTHBOUND EASTBOUND WESTBOUND
NL NT NR SL ST SR EL ET ER WL WT WR TOTAL NB SB EB WB TTLLANES: X X X 1 X 1 0 1 X X 1 0
7:00 AM 0 0 0 0 0 0 0 0 0 0 0 0 0 0 7:15 AM 0 0 0 0 0 0 0 0 0 0 0 0 0 0 7:30 AM 0 0 0 0 0 0 0 0 0 0 0 0 0 0 7:45 AM 0 0 0 0 0 0 0 0 0 0 0 0 0 0 8:00 AM 0 0 0 0 0 0 0 0 0 0 0 0 0 0 8:15 AM 0 0 0 0 0 0 0 0 0 0 0 0 0 0 8:30 AM 0 0 0 0 0 0 0 0 0 0 0 0 0 0 8:45 AM 0 0 0 0 0 0 0 0 0 0 0 0 0 0 9:00 AM 0 0 0 0 0 0 0 0 0 0 0 0 0 0 9:15 AM 0 0 0 0 0 0 0 0 0 0 0 0 0 0 9:30 AM 0 0 0 0 0 0 0 0 0 0 0 0 0 0 9:45 AM 0 0 0 0 0 0 0 0 0 0 0 0 0 0
VOLUMES 0 0 0 0 0 0 0 0 0 0 0 0 0 0 0 0 0 0 APPROACH % 0% 0% 0% 0% 0% 0% 0% 0% 0% 0% 0% 0%APP/DEPART 0 / 0 0 / 0 0 / 0 0 / 0 0 BEGIN PEAK HRVOLUMES 0 0 0 0 0 0 0 0 0 0 0 0 0 APPROACH % 0% 0% 0% 0% 0% 0% 0% 0% 0% 0% 0% 0%PEAK HR FACTOR 0.000 0.000 0.000 0.000 0.000 APP/DEPART 0 / 0 0 / 0 0 / 0 0 / 0 0
3:00 PM 0 0 0 0 0 0 0 0 0 0 0 0 0 0 3:15 PM 0 0 0 0 0 0 0 0 0 0 0 0 0 0 3:30 PM 0 0 0 0 0 0 0 0 0 0 0 0 0 0 3:45 PM 0 0 0 0 0 0 0 0 0 0 0 0 0 0 4:00 PM 0 0 0 0 0 0 0 0 0 0 0 0 0 0 4:15 PM 0 0 0 0 0 0 0 0 0 0 0 0 0 0 4:30 PM 0 0 0 0 0 0 0 0 0 0 0 0 0 0 4:45 PM 0 0 0 0 0 0 0 0 0 0 0 0 0 0 5:00 PM 0 0 0 0 0 0 0 0 0 0 0 0 0 0 5:15 PM 0 0 0 0 0 0 0 0 0 0 0 0 0 0 5:30 PM 0 0 0 0 0 0 0 0 0 0 0 0 0 0 5:45 PM 0 0 0 0 0 0 0 0 0 0 0 0 0 0
VOLUMES 0 0 0 0 0 0 0 0 0 0 0 0 0 0 0 0 0 0 APPROACH % 0% 0% 0% 0% 0% 0% 0% 0% 0% 0% 0% 0%APP/DEPART 0 / 0 0 / 0 0 / 0 0 / 0 0 BEGIN PEAK HRVOLUMES 0 0 0 0 0 0 0 0 0 0 0 0 0 APPROACH % 0% 0% 0% 0% 0% 0% 0% 0% 0% 0% 0% 0%PEAK HR FACTOR 0.000 0.000 0.000 0.000 0.000 APP/DEPART 0 / 0 0 / 0 0 / 0 0 / 0 0
Cactus
NORTH SIDE
El Rivino WEST SIDE EAST SIDE El Rivino
SOUTH SIDE
Cactus
U-TURNSCactus Cactus El Rivino El Rivino
AM
9:45 AM
PM
5:45 PM
INTERSECTION TURNING MOVEMENT COUNTSPREPARED BY: PACIFIC TRAFFIC DATA SERVICES

DATE: LOCATION: PROJECT #: SC0399Thu, Jun 12, 14 NORTH & SOUTH: LOCATION #: B
EAST & WEST: CONTROL: SIGNAL
NOTES: AM �PM NMD � W E �
OTHER SOTHER �
NORTHBOUND SOUTHBOUND EASTBOUND WESTBOUND
NL NT NR SL ST SR EL ET ER WL WT WR TOTALLANES: 1 2 0 1 2 0 0 1 0 0.5 0.5 1
7:00 AM 0 0 0 14 0 8 5 18 0 0 27 3 75 7:15 AM 0 0 0 4 0 9 3 11 0 0 28 4 58 7:30 AM 0 0 0 6 0 6 8 19 0 0 14 8 59 7:45 AM 0 0 0 2 0 8 4 21 0 0 13 6 52 8:00 AM 0 0 0 2 0 5 8 23 0 0 12 6 56 8:15 AM 0 0 0 6 0 2 10 13 0 0 7 1 38 8:30 AM 0 0 0 6 0 1 3 11 0 0 8 4 32 8:45 AM 0 0 0 2 0 7 5 21 0 0 12 4 50 9:00 AM 0 0 0 0 0 0 0 0 0 0 0 0 0 9:15 AM 0 0 0 0 0 0 0 0 0 0 0 0 0 9:30 AM 0 0 0 0 0 0 0 0 0 0 0 0 0 9:45 AM 0 0 0 0 0 0 0 0 0 0 0 0 0
VOLUMES 0 0 0 40 0 45 45 136 0 0 120 34 419 APPROACH % 0% 0% 0% 47% 0% 53% 25% 75% 0% 0% 78% 22%APP/DEPART 0 / 79 85 / 0 180 / 176 154 / 165 0 BEGIN PEAK HRVOLUMES 0 0 0 25 0 31 19 68 0 0 81 20 244 APPROACH % 0% 0% 0% 45% 0% 55% 22% 78% 0% 0% 80% 20%PEAK HR FACTOR 0.000 0.631 0.837 0.802 0.812 APP/DEPART 0 / 39 56 / 0 87 / 93 101 / 112 0
03:00 PM 0 0 0 0 0 0 0 0 0 0 0 0 0 3:15 PM 0 0 0 0 0 0 0 0 0 0 0 0 0 3:30 PM 0 0 0 0 0 0 0 0 0 0 0 0 0 3:45 PM 0 0 0 0 0 0 0 0 0 0 0 0 0 4:00 PM 0 0 0 1 0 8 10 26 0 0 35 19 98 4:15 PM 0 0 0 3 0 7 8 29 0 0 16 17 79 4:30 PM 0 0 0 6 0 8 5 22 0 0 19 9 68 4:45 PM 0 0 0 4 0 4 19 22 0 0 27 9 85 5:00 PM 0 0 0 4 0 15 7 17 0 0 29 10 80 5:15 PM 0 0 0 5 0 5 3 17 0 0 23 9 61 5:30 PM 0 0 0 3 0 6 7 25 0 0 16 9 66 5:45 PM 0 0 0 3 0 4 4 16 0 0 17 9 53
VOLUMES 0 0 0 29 0 56 61 173 0 0 182 89 588 APPROACH % 0% 0% 0% 34% 0% 66% 26% 74% 0% 0% 67% 33%APP/DEPART 0 / 150 84 / 0 234 / 202 271 / 237 0 BEGIN PEAK HRVOLUMES 0 0 0 14 0 26 41 99 0 0 97 53 329 APPROACH % 0% 0% 0% 35% 0% 65% 29% 71% 0% 0% 65% 35%PEAK HR FACTOR 0.000 0.741 0.858 0.694 0.839 APP/DEPART 0 / 94 40 / 0 139 / 113 150 / 123 0
Cactus
NORTH SIDE
El Rivino WEST SIDE EAST SIDE El Rivino
SOUTH SIDE
Cactus
El Rivino
INTERSECTION TURNING MOVEMENT COUNTSPREPARED BY: AimTD LLC tel: 951 249 3226 [email protected]
San BernardinoCactusEl Rivino
AM
7:00 AM
PM
4:00 PM
Cactus Cactus El Rivino
PCE ADJUSTED

DATE: LOCATION: San Bernardino PROJECT #: SC03996/12/14 NORTH & SOUTH: Hall LOCATION #: C
THURSDAY EAST & WEST: El Rivino CONTROL: Stop 2way S/N
CLASS 1: NOTES: AM �PASSENGER PM NVEHICLES MD � W E �
OTHER SOTHER �
NORTHBOUND SOUTHBOUND EASTBOUND WESTBOUND
NL NT NR SL ST SR EL ET ER WL WT WR TOTAL NB SB EB WB TTLLANES: 0 1 0 0 1 0 0 1 0 0 1 0
7:00 AM 1 0 0 3 1 0 0 10 6 0 11 1 33 0 7:15 AM 2 0 0 1 0 1 2 0 7 1 7 1 22 0 7:30 AM 3 0 0 1 1 1 0 9 1 0 2 0 18 0 7:45 AM 0 1 1 3 1 2 0 11 8 0 10 1 38 0 8:00 AM 0 0 1 3 2 1 0 12 4 1 11 2 37 0 8:15 AM 0 0 0 1 2 0 0 8 4 0 3 1 19 0 8:30 AM 0 0 0 0 0 0 0 11 2 0 6 2 21 0 8:45 AM 2 1 0 0 0 0 1 9 3 0 12 0 28 0 9:00 AM 0 0 0 0 0 0 0 0 0 0 0 0 0 0 9:15 AM 0 0 0 0 0 0 0 0 0 0 0 0 0 0 9:30 AM 0 0 0 0 0 0 0 0 0 0 0 0 0 0 9:45 AM 0 0 0 0 0 0 0 0 0 0 0 0 0 0
VOLUMES 8 2 2 12 7 5 3 70 35 2 62 8 216 0 0 0 0 0 APPROACH % 67% 17% 17% 50% 29% 21% 3% 65% 32% 3% 86% 11%APP/DEPART 12 / 13 24 / 44 108 / 84 72 / 75 0 BEGIN PEAK HRVOLUMES 0 1 2 7 5 3 0 42 18 1 30 6 115 APPROACH % 0% 33% 67% 47% 33% 20% 0% 70% 30% 3% 81% 16%PEAK HR FACTOR 0.250 0.625 0.789 0.661 0.757 APP/DEPART 3 / 7 15 / 24 60 / 51 37 / 33 0
03:00 PM 0 0 0 0 0 0 0 0 0 0 0 0 0 0 3:15 PM 0 0 0 0 0 0 0 0 0 0 0 0 0 0 3:30 PM 0 0 0 0 0 0 0 0 0 0 0 0 0 0 3:45 PM 0 0 0 0 0 0 0 0 0 0 0 0 0 0 4:00 PM 17 0 2 1 1 0 0 18 4 0 36 3 82 0 4:15 PM 6 1 0 0 0 0 1 22 0 0 21 2 53 0 4:30 PM 6 1 1 2 3 1 0 20 1 0 15 2 52 0 4:45 PM 6 0 0 4 0 0 2 19 1 0 24 3 59 0 5:00 PM 14 3 1 5 1 4 1 15 1 0 15 4 64 0 5:15 PM 5 3 1 2 0 3 0 17 1 0 16 2 50 0 5:30 PM 4 1 0 3 0 1 3 18 1 0 15 3 49 0 5:45 PM 3 1 0 3 2 2 1 13 3 0 11 1 40 0
VOLUMES 61 10 5 20 7 11 8 142 12 0 153 20 449 0 0 0 0 0 APPROACH % 80% 13% 7% 53% 18% 29% 5% 88% 7% 0% 88% 12%APP/DEPART 76 / 38 38 / 19 162 / 167 173 / 225 0 BEGIN PEAK HRVOLUMES 35 2 3 7 4 1 3 79 6 0 96 10 246 APPROACH % 88% 5% 8% 58% 33% 8% 3% 90% 7% 0% 91% 9%PEAK HR FACTOR 0.526 0.500 0.957 0.679 0.750 APP/DEPART 40 / 15 12 / 10 88 / 89 106 / 132 0
Hall
NORTH SIDE
El Rivino WEST SIDE EAST SIDE El Rivino
SOUTH SIDE
Hall
AM
7:45 AM
PM
4:00 PM
INTERSECTION TURNING MOVEMENT COUNTSPREPARED BY: PACIFIC TRAFFIC DATA SERVICES
U-TURNSHall Hall El Rivino El Rivino

DATE: LOCATION: San Bernardino PROJECT #: SC03996/12/14 NORTH & SOUTH: Hall LOCATION #: C
THURSDAY EAST & WEST: El Rivino CONTROL: Stop 2way S/N
CLASS 2: NOTES: AM �2-AXLE PM NWORK MD � W E �
VEHICLES/ OTHER STRUCKS OTHER �
NORTHBOUND SOUTHBOUND EASTBOUND WESTBOUND
NL NT NR SL ST SR EL ET ER WL WT WR TOTAL NB SB EB WB TTLLANES: 0 1 0 0 1 0 0 1 0 0 1 0
7:00 AM 3 0 1 0 0 0 0 11 1 0 7 0 23 0 7:15 AM 1 0 1 0 0 0 0 15 0 0 14 0 31 0 7:30 AM 2 0 0 1 0 0 0 5 1 0 5 0 14 0 7:45 AM 1 0 0 0 0 0 1 0 1 0 1 0 4 0 8:00 AM 2 0 0 0 0 0 0 2 0 0 0 0 4 0 8:15 AM 0 0 0 0 0 0 0 1 0 0 0 0 1 0 8:30 AM 1 0 0 0 0 0 0 3 0 1 2 0 7 0 8:45 AM 1 0 0 0 0 0 0 0 1 0 0 0 2 0 9:00 AM 0 0 0 0 0 0 0 0 0 0 0 0 0 0 9:15 AM 0 0 0 0 0 0 0 0 0 0 0 0 0 0 9:30 AM 0 0 0 0 0 0 0 0 0 0 0 0 0 0 9:45 AM 0 0 0 0 0 0 0 0 0 0 0 0 0 0
VOLUMES 11 0 2 1 0 0 1 37 4 1 29 0 86 0 0 0 0 0 APPROACH % 85% 0% 15% 100% 0% 0% 2% 88% 10% 3% 97% 0%APP/DEPART 13 / 1 1 / 5 42 / 40 30 / 40 0 BEGIN PEAK HRVOLUMES 7 0 2 1 0 0 1 31 3 0 27 0 72 APPROACH % 78% 0% 22% 100% 0% 0% 3% 89% 9% 0% 100% 0%PEAK HR FACTOR 0.563 0.250 0.583 0.482 0.581 APP/DEPART 9 / 1 1 / 3 35 / 34 27 / 34 0
03:00 PM 0 0 0 0 0 0 0 0 0 0 0 0 0 0 3:15 PM 0 0 0 0 0 0 0 0 0 0 0 0 0 0 3:30 PM 0 0 0 0 0 0 0 0 0 0 0 0 0 0 3:45 PM 0 0 0 0 0 0 0 0 0 0 0 0 0 0 4:00 PM 0 0 0 0 0 0 0 0 1 0 0 1 2 0 4:15 PM 2 0 0 0 0 0 0 1 1 0 3 0 7 0 4:30 PM 0 0 0 1 0 0 1 1 0 0 3 0 6 0 4:45 PM 2 0 0 0 0 0 0 3 1 0 2 0 8 0 5:00 PM 0 0 0 0 0 1 1 0 0 0 1 0 3 0 5:15 PM 1 0 0 0 0 0 0 5 0 0 3 1 10 0 5:30 PM 1 1 0 1 0 0 0 0 2 0 1 0 6 0 5:45 PM 1 0 0 0 0 0 0 2 0 0 4 0 7 0
VOLUMES 7 1 0 2 0 1 2 12 5 0 17 2 49 0 0 0 0 0 APPROACH % 88% 13% 0% 67% 0% 33% 11% 63% 26% 0% 89% 11%APP/DEPART 8 / 5 3 / 5 19 / 14 19 / 25 0 BEGIN PEAK HRVOLUMES 4 1 0 1 0 1 1 8 3 0 7 1 27 APPROACH % 80% 20% 0% 50% 0% 50% 8% 67% 25% 0% 88% 13%PEAK HR FACTOR 0.625 0.500 0.600 0.500 0.675 APP/DEPART 5 / 3 2 / 3 12 / 9 8 / 12 0
Hall
NORTH SIDE
El Rivino WEST SIDE EAST SIDE El Rivino
SOUTH SIDE
Hall
AM
7:00 AM
PM
4:45 PM
INTERSECTION TURNING MOVEMENT COUNTSPREPARED BY: PACIFIC TRAFFIC DATA SERVICES
U-TURNSHall Hall El Rivino El Rivino

DATE: LOCATION: San Bernardino PROJECT #: SC03996/12/14 NORTH & SOUTH: Hall LOCATION #: C
THURSDAY EAST & WEST: El Rivino CONTROL: Stop 2way S/N
CLASS 3: NOTES: AM �3-AXLE PM NTRUCKS MD � W E �
OTHER SOTHER �
NORTHBOUND SOUTHBOUND EASTBOUND WESTBOUND
NL NT NR SL ST SR EL ET ER WL WT WR TOTAL NB SB EB WB TTLLANES: 0 1 0 0 1 0 0 1 0 0 1 0
7:00 AM 0 0 0 0 0 0 0 1 0 0 1 0 2 0 7:15 AM 0 0 0 0 0 0 0 0 0 0 0 0 0 0 7:30 AM 0 0 0 1 0 0 0 1 0 0 1 0 3 0 7:45 AM 0 0 0 0 0 0 0 1 0 0 1 0 2 0 8:00 AM 0 0 0 0 0 0 0 0 0 0 1 0 1 0 8:15 AM 0 0 0 0 0 0 0 2 0 0 2 0 4 0 8:30 AM 0 0 0 0 0 0 0 0 0 0 0 0 0 0 8:45 AM 0 0 0 0 1 0 0 0 1 0 0 0 2 0 9:00 AM 0 0 0 0 0 0 0 0 0 0 0 0 0 0 9:15 AM 0 0 0 0 0 0 0 0 0 0 0 0 0 0 9:30 AM 0 0 0 0 0 0 0 0 0 0 0 0 0 0 9:45 AM 0 0 0 0 0 0 0 0 0 0 0 0 0 0
VOLUMES 0 0 0 1 1 0 0 5 1 0 6 0 14 0 0 0 0 0 APPROACH % 0% 0% 0% 50% 50% 0% 0% 83% 17% 0% 100% 0%APP/DEPART 0 / 0 2 / 2 6 / 6 6 / 6 0 BEGIN PEAK HRVOLUMES 0 0 0 1 0 0 0 4 0 0 5 0 10 APPROACH % 0% 0% 0% 100% 0% 0% 0% 100% 0% 0% 100% 0%PEAK HR FACTOR 0.000 0.250 0.500 0.625 0.625 APP/DEPART 0 / 0 1 / 0 4 / 5 5 / 5 0
3:00 PM 0 0 0 0 0 0 0 0 0 0 0 0 0 0 3:15 PM 0 0 0 0 0 0 0 0 0 0 0 0 0 0 3:30 PM 0 0 0 0 0 0 0 0 0 0 0 0 0 0 3:45 PM 0 0 0 0 0 0 0 0 0 0 0 0 0 0 4:00 PM 1 0 0 0 0 0 0 0 0 0 0 0 1 0 4:15 PM 0 0 0 0 0 0 0 0 0 0 0 0 0 0 4:30 PM 0 1 1 0 0 0 0 1 1 0 1 0 5 0 4:45 PM 1 0 0 0 0 0 0 0 0 0 0 0 1 0 5:00 PM 0 0 0 0 0 0 0 0 0 0 0 0 0 0 5:15 PM 0 0 0 0 0 0 0 0 0 0 0 0 0 0 5:30 PM 0 0 0 0 0 0 0 0 0 0 1 0 1 0 5:45 PM 0 1 0 0 0 0 1 0 1 0 0 0 3 0
VOLUMES 2 2 1 0 0 0 1 1 2 0 2 0 11 0 0 0 0 0 APPROACH % 40% 40% 20% 0% 0% 0% 25% 25% 50% 0% 100% 0%APP/DEPART 5 / 3 0 / 2 4 / 2 2 / 4 0 BEGIN PEAK HRVOLUMES 2 1 1 0 0 0 0 1 1 0 1 0 7 APPROACH % 50% 25% 25% 0% 0% 0% 0% 50% 50% 0% 100% 0%PEAK HR FACTOR 0.500 0.000 0.250 0.250 0.350 APP/DEPART 4 / 1 0 / 1 2 / 2 1 / 3 0
Hall
NORTH SIDE
El Rivino WEST SIDE EAST SIDE El Rivino
SOUTH SIDE
Hall
AM
7:30 AM
PM
4:00 PM
INTERSECTION TURNING MOVEMENT COUNTSPREPARED BY: PACIFIC TRAFFIC DATA SERVICES
U-TURNSHall Hall El Rivino El Rivino

DATE: LOCATION: San Bernardino PROJECT #: SC03996/12/14 NORTH & SOUTH: Hall LOCATION #: C
THURSDAY EAST & WEST: El Rivino CONTROL: Stop 2way S/N
CLASS 4: NOTES: AM �4 OR MORE PM N
AXLE MD � W E �TRUCKS OTHER S
OTHER �
NORTHBOUND SOUTHBOUND EASTBOUND WESTBOUND
NL NT NR SL ST SR EL ET ER WL WT WR TOTAL NB SB EB WB TTLLANES: 0 1 0 0 1 0 0 1 0 0 1 0
7:00 AM 0 0 0 0 0 0 0 0 0 0 0 0 0 0 7:15 AM 0 0 0 0 0 0 0 0 0 0 0 0 0 0 7:30 AM 0 0 0 0 0 0 0 0 0 0 1 0 1 0 7:45 AM 0 0 0 0 0 0 0 0 0 0 0 0 0 0 8:00 AM 0 0 0 0 0 0 0 0 0 0 0 0 0 0 8:15 AM 0 0 0 0 0 0 0 0 0 0 0 0 0 0 8:30 AM 0 0 0 0 0 0 0 0 0 0 0 0 0 0 8:45 AM 0 0 0 0 0 0 0 0 1 0 0 0 1 0 9:00 AM 0 0 0 0 0 0 0 0 0 0 0 0 0 0 9:15 AM 0 0 0 0 0 0 0 0 0 0 0 0 0 0 9:30 AM 0 0 0 0 0 0 0 0 0 0 0 0 0 0 9:45 AM 0 0 0 0 0 0 0 0 0 0 0 0 0 0
VOLUMES 0 0 0 0 0 0 0 0 1 0 1 0 2 0 0 0 0 0 APPROACH % 0% 0% 0% 0% 0% 0% 0% 0% 100% 0% 100% 0%APP/DEPART 0 / 0 0 / 1 1 / 0 1 / 1 0 BEGIN PEAK HRVOLUMES 0 0 0 0 0 0 0 0 1 0 0 0 1 APPROACH % 0% 0% 0% 0% 0% 0% 0% 0% 100% 0% 0% 0%PEAK HR FACTOR 0.000 0.000 0.250 0.000 0.250 APP/DEPART 0 / 0 0 / 1 1 / 0 0 / 0 0
3:00 PM 0 0 0 0 0 0 0 0 0 0 0 0 0 0 3:15 PM 0 0 0 0 0 0 0 0 0 0 0 0 0 0 3:30 PM 0 0 0 0 0 0 0 0 0 0 0 0 0 0 3:45 PM 0 0 0 0 0 0 0 0 0 0 0 0 0 0 4:00 PM 0 0 0 0 0 0 0 0 0 0 0 1 1 0 4:15 PM 0 0 0 0 0 0 0 0 0 0 0 0 0 0 4:30 PM 0 0 0 0 0 0 0 0 0 0 0 0 0 0 4:45 PM 0 0 0 0 0 0 0 0 0 0 0 0 0 0 5:00 PM 0 0 0 0 0 0 0 0 0 0 0 0 0 0 5:15 PM 0 0 0 0 0 0 0 0 0 0 0 0 0 0 5:30 PM 0 0 0 0 0 0 0 0 0 0 0 0 0 0 5:45 PM 0 0 0 0 0 0 0 0 0 0 0 0 0 0
VOLUMES 0 0 0 0 0 0 0 0 0 0 0 1 1 0 0 0 0 0 APPROACH % 0% 0% 0% 0% 0% 0% 0% 0% 0% 0% 0% 100%APP/DEPART 0 / 1 0 / 0 0 / 0 1 / 0 0 BEGIN PEAK HRVOLUMES 0 0 0 0 0 0 0 0 0 0 0 1 1 APPROACH % 0% 0% 0% 0% 0% 0% 0% 0% 0% 0% 0% 100%PEAK HR FACTOR 0.000 0.000 0.000 0.250 0.250 APP/DEPART 0 / 1 0 / 0 0 / 0 1 / 0 0
Hall
NORTH SIDE
El Rivino WEST SIDE EAST SIDE El Rivino
SOUTH SIDE
Hall
AM
8:45 AM
PM
4:00 PM
INTERSECTION TURNING MOVEMENT COUNTSPREPARED BY: PACIFIC TRAFFIC DATA SERVICES
U-TURNSHall Hall El Rivino El Rivino

DATE: LOCATION: San Bernardino PROJECT #: SC03996/12/14 NORTH & SOUTH: Hall LOCATION #: C
THURSDAY EAST & WEST: El Rivino CONTROL: Stop 2way S/N
CLASS 5: NOTES: AM �RV PM N
MD � W E �OTHER SOTHER �
NORTHBOUND SOUTHBOUND EASTBOUND WESTBOUND
NL NT NR SL ST SR EL ET ER WL WT WR TOTAL NB SB EB WB TTLLANES: 0 1 0 0 1 0 0 1 0 0 1 0
7:00 AM 0 0 0 0 0 0 0 0 0 0 0 0 0 0 7:15 AM 0 0 0 0 0 0 0 0 0 0 0 0 0 0 7:30 AM 0 0 0 0 0 0 0 0 0 0 0 0 0 0 7:45 AM 0 0 0 0 0 0 0 0 0 0 0 0 0 0 8:00 AM 0 0 0 0 0 0 0 0 0 0 0 0 0 0 8:15 AM 0 0 0 0 0 0 0 0 0 0 0 0 0 0 8:30 AM 0 0 0 0 0 0 0 0 0 0 0 0 0 0 8:45 AM 0 0 0 0 0 0 0 0 0 0 0 0 0 0 9:00 AM 0 0 0 0 0 0 0 0 0 0 0 0 0 0 9:15 AM 0 0 0 0 0 0 0 0 0 0 0 0 0 0 9:30 AM 0 0 0 0 0 0 0 0 0 0 0 0 0 0 9:45 AM 0 0 0 0 0 0 0 0 0 0 0 0 0 0
VOLUMES 0 0 0 0 0 0 0 0 0 0 0 0 0 0 0 0 0 0 APPROACH % 0% 0% 0% 0% 0% 0% 0% 0% 0% 0% 0% 0%APP/DEPART 0 / 0 0 / 0 0 / 0 0 / 0 0 BEGIN PEAK HRVOLUMES 0 0 0 0 0 0 0 0 0 0 0 0 0 APPROACH % 0% 0% 0% 0% 0% 0% 0% 0% 0% 0% 0% 0%PEAK HR FACTOR 0.000 0.000 0.000 0.000 0.000 APP/DEPART 0 / 0 0 / 0 0 / 0 0 / 0 0
3:00 PM 0 0 0 0 0 0 0 0 0 0 0 0 0 0 3:15 PM 0 0 0 0 0 0 0 0 0 0 0 0 0 0 3:30 PM 0 0 0 0 0 0 0 0 0 0 0 0 0 0 3:45 PM 0 0 0 0 0 0 0 0 0 0 0 0 0 0 4:00 PM 0 0 0 0 0 0 0 0 0 0 0 0 0 0 4:15 PM 0 0 0 0 0 0 0 0 0 0 0 0 0 0 4:30 PM 0 0 0 0 0 0 0 0 0 0 0 0 0 0 4:45 PM 0 0 0 0 0 0 0 0 0 0 0 0 0 0 5:00 PM 0 0 0 0 0 0 0 0 0 0 0 0 0 0 5:15 PM 0 0 0 0 0 0 0 0 0 0 0 0 0 0 5:30 PM 0 0 0 0 0 0 0 0 0 0 0 0 0 0 5:45 PM 0 0 0 0 0 0 0 0 0 0 0 0 0 0
VOLUMES 0 0 0 0 0 0 0 0 0 0 0 0 0 0 0 0 0 0 APPROACH % 0% 0% 0% 0% 0% 0% 0% 0% 0% 0% 0% 0%APP/DEPART 0 / 0 0 / 0 0 / 0 0 / 0 0 BEGIN PEAK HRVOLUMES 0 0 0 0 0 0 0 0 0 0 0 0 0 APPROACH % 0% 0% 0% 0% 0% 0% 0% 0% 0% 0% 0% 0%PEAK HR FACTOR 0.000 0.000 0.000 0.000 0.000 APP/DEPART 0 / 0 0 / 0 0 / 0 0 / 0 0
Hall
NORTH SIDE
El Rivino WEST SIDE EAST SIDE El Rivino
SOUTH SIDE
Hall
AM
9:45 AM
PM
5:45 PM
INTERSECTION TURNING MOVEMENT COUNTSPREPARED BY: PACIFIC TRAFFIC DATA SERVICES
U-TURNSHall Hall El Rivino El Rivino

DATE: LOCATION: San Bernardino PROJECT #: SC03996/12/14 NORTH & SOUTH: Hall LOCATION #: C
THURSDAY EAST & WEST: El Rivino CONTROL: Stop 2way S/N
CLASS 6: NOTES: AM �PM N
BUSES MD � W E �OTHER SOTHER �
NORTHBOUND SOUTHBOUND EASTBOUND WESTBOUND
NL NT NR SL ST SR EL ET ER WL WT WR TOTAL NB SB EB WB TTLLANES: 0 1 0 0 1 0 0 1 0 0 1 0
7:00 AM 0 0 0 0 0 0 0 0 0 0 0 0 0 0 7:15 AM 0 0 0 0 0 0 0 0 0 0 0 0 0 0 7:30 AM 0 0 0 0 0 0 0 0 0 0 0 0 0 0 7:45 AM 0 0 0 0 0 0 0 0 0 0 0 0 0 0 8:00 AM 0 0 0 0 0 0 0 0 0 0 0 0 0 0 8:15 AM 0 0 0 0 0 0 0 0 0 0 0 0 0 0 8:30 AM 0 0 0 0 0 0 0 0 0 0 0 0 0 0 8:45 AM 0 0 0 0 0 0 0 0 0 0 0 0 0 0 9:00 AM 0 0 0 0 0 0 0 0 0 0 0 0 0 0 9:15 AM 0 0 0 0 0 0 0 0 0 0 0 0 0 0 9:30 AM 0 0 0 0 0 0 0 0 0 0 0 0 0 0 9:45 AM 0 0 0 0 0 0 0 0 0 0 0 0 0 0
VOLUMES 0 0 0 0 0 0 0 0 0 0 0 0 0 0 0 0 0 0 APPROACH % 0% 0% 0% 0% 0% 0% 0% 0% 0% 0% 0% 0%APP/DEPART 0 / 0 0 / 0 0 / 0 0 / 0 0 BEGIN PEAK HRVOLUMES 0 0 0 0 0 0 0 0 0 0 0 0 0 APPROACH % 0% 0% 0% 0% 0% 0% 0% 0% 0% 0% 0% 0%PEAK HR FACTOR 0.000 0.000 0.000 0.000 0.000 APP/DEPART 0 / 0 0 / 0 0 / 0 0 / 0 0
3:00 PM 0 0 0 0 0 0 0 0 0 0 0 0 0 0 3:15 PM 0 0 0 0 0 0 0 0 0 0 0 0 0 0 3:30 PM 0 0 0 0 0 0 0 0 0 0 0 0 0 0 3:45 PM 0 0 0 0 0 0 0 0 0 0 0 0 0 0 4:00 PM 0 0 0 0 0 0 0 0 0 0 0 0 0 0 4:15 PM 0 0 0 0 0 0 0 0 0 0 0 0 0 0 4:30 PM 0 0 0 0 0 0 0 0 0 0 0 0 0 0 4:45 PM 0 0 0 0 0 0 0 0 0 0 0 0 0 0 5:00 PM 0 0 0 0 0 0 0 0 0 0 0 0 0 0 5:15 PM 0 0 0 0 0 0 0 0 0 0 0 0 0 0 5:30 PM 0 0 0 0 0 0 0 0 0 0 0 0 0 0 5:45 PM 0 0 0 0 0 0 0 0 0 0 0 0 0 0
VOLUMES 0 0 0 0 0 0 0 0 0 0 0 0 0 0 0 0 0 0 APPROACH % 0% 0% 0% 0% 0% 0% 0% 0% 0% 0% 0% 0%APP/DEPART 0 / 0 0 / 0 0 / 0 0 / 0 0 BEGIN PEAK HRVOLUMES 0 0 0 0 0 0 0 0 0 0 0 0 0 APPROACH % 0% 0% 0% 0% 0% 0% 0% 0% 0% 0% 0% 0%PEAK HR FACTOR 0.000 0.000 0.000 0.000 0.000 APP/DEPART 0 / 0 0 / 0 0 / 0 0 / 0 0
Hall
NORTH SIDE
El Rivino WEST SIDE EAST SIDE El Rivino
SOUTH SIDE
Hall
AM
9:45 AM
PM
5:45 PM
INTERSECTION TURNING MOVEMENT COUNTSPREPARED BY: PACIFIC TRAFFIC DATA SERVICES
U-TURNSHall Hall El Rivino El Rivino

DATE: LOCATION: PROJECT #: SC0399Thu, Jun 12, 14 NORTH & SOUTH: LOCATION #: C
EAST & WEST: CONTROL: Stop 2way S/N
NOTES: AM �PM NMD � W E �
OTHER SOTHER �
NORTHBOUND SOUTHBOUND EASTBOUND WESTBOUND
NL NT NR SL ST SR EL ET ER WL WT WR TOTALLANES: 1 2 0 1 2 0 0 1 0 0.5 0.5 1
7:00 AM 6 0 2 3 1 0 0 29 8 0 24 1 72 7:15 AM 4 0 2 1 0 1 2 23 7 1 28 1 69 7:30 AM 6 0 0 5 1 1 0 19 3 0 15 0 48 7:45 AM 2 1 1 3 1 2 2 13 10 0 14 1 48 8:00 AM 3 0 1 3 2 1 0 15 4 1 13 2 45 8:15 AM 0 0 0 1 2 0 0 14 4 0 7 1 29 8:30 AM 2 0 0 0 0 0 0 16 2 2 9 2 32 8:45 AM 4 1 0 0 2 0 1 9 10 0 12 0 38 9:00 AM 0 0 0 0 0 0 0 0 0 0 0 0 0 9:15 AM 0 0 0 0 0 0 0 0 0 0 0 0 0 9:30 AM 0 0 0 0 0 0 0 0 0 0 0 0 0 9:45 AM 0 0 0 0 0 0 0 0 0 0 0 0 0
VOLUMES 25 2 5 16 9 5 5 136 46 4 121 8 379 APPROACH % 78% 6% 16% 53% 31% 17% 2% 73% 25% 3% 91% 6%APP/DEPART 32 / 15 30 / 59 186 / 156 132 / 150 0 BEGIN PEAK HRVOLUMES 17 1 4 12 3 4 4 83 27 1 80 3 236 APPROACH % 77% 5% 19% 62% 16% 22% 3% 73% 24% 1% 95% 4%PEAK HR FACTOR 0.768 0.712 0.781 0.696 0.825 APP/DEPART 22 / 8 19 / 31 113 / 98 84 / 100 0
03:00 PM 0 0 0 0 0 0 0 0 0 0 0 0 0 3:15 PM 0 0 0 0 0 0 0 0 0 0 0 0 0 3:30 PM 0 0 0 0 0 0 0 0 0 0 0 0 0 3:45 PM 0 0 0 0 0 0 0 0 0 0 0 0 0 4:00 PM 19 0 2 1 1 0 0 18 6 0 36 8 90 4:15 PM 9 1 0 0 0 0 1 24 2 0 26 2 64 4:30 PM 6 3 3 4 3 1 2 24 3 0 22 2 71 4:45 PM 11 0 0 4 0 0 2 24 3 0 27 3 73 5:00 PM 14 3 1 5 1 6 3 15 1 0 17 4 69 5:15 PM 7 3 1 2 0 3 0 25 1 0 21 4 65 5:30 PM 6 3 0 5 0 1 3 18 4 0 19 3 60 5:45 PM 5 3 0 3 2 2 3 16 5 0 17 1 57
VOLUMES 76 16 7 23 7 13 13 162 24 0 183 26 548 APPROACH % 77% 16% 7% 54% 16% 29% 7% 82% 12% 0% 88% 12%APP/DEPART 98 / 55 43 / 31 199 / 192 209 / 271 0 BEGIN PEAK HRVOLUMES 45 4 5 9 4 1 5 89 13 0 110 15 298 APPROACH % 83% 7% 9% 63% 30% 7% 4% 84% 12% 0% 88% 12%PEAK HR FACTOR 0.643 0.450 0.942 0.716 0.826 APP/DEPART 54 / 23 14 / 17 106 / 102 125 / 156 0
INTERSECTION TURNING MOVEMENT COUNTSPREPARED BY: AimTD LLC tel: 951 249 3226 [email protected]
San BernardinoHallEl Rivino
Hall Hall El Rivino El Rivino
AM
7:00 AM
PM
4:00 PM
PCE ADJUSTED

DATE: LOCATION: San Bernardino PROJECT #: SC03996/12/14 NORTH & SOUTH: Kiningham LOCATION #: D
THURSDAY EAST & WEST: El Rivino CONTROL: Stop 1way S
CLASS 1: NOTES: AM �PASSENGER PM NVEHICLES MD � W E �
OTHER SOTHER �
NORTHBOUND SOUTHBOUND EASTBOUND WESTBOUND
NL NT NR SL ST SR EL ET ER WL WT WR TOTAL NB SB EB WB TTLLANES: X X X 0.5 X 0.5 0 1 X X 1 0
7:00 AM 0 0 0 0 0 0 0 13 0 0 8 0 21 0 7:15 AM 0 0 0 0 0 0 1 0 0 0 9 1 11 0 7:30 AM 0 0 0 0 0 0 1 8 0 0 1 0 10 0 7:45 AM 0 0 0 0 0 1 1 14 0 0 9 0 25 0 8:00 AM 0 0 0 0 0 0 1 15 0 0 15 0 31 0 8:15 AM 0 0 0 0 0 0 0 9 0 0 5 1 15 0 8:30 AM 0 0 0 1 0 0 0 11 0 0 8 0 20 0 8:45 AM 0 0 0 1 0 0 0 9 0 0 7 0 17 0 9:00 AM 0 0 0 0 0 0 0 0 0 0 0 0 0 0 9:15 AM 0 0 0 0 0 0 0 0 0 0 0 0 0 0 9:30 AM 0 0 0 0 0 0 0 0 0 0 0 0 0 0 9:45 AM 0 0 0 0 0 0 0 0 0 0 0 0 0 0
VOLUMES 0 0 0 2 0 1 4 79 0 0 62 2 150 0 0 0 0 0 APPROACH % 0% 0% 0% 67% 0% 33% 5% 95% 0% 0% 97% 3%APP/DEPART 0 / 6 3 / 0 83 / 81 64 / 63 0 BEGIN PEAK HRVOLUMES 0 0 0 1 0 1 2 49 0 0 37 1 91 APPROACH % 0% 0% 0% 50% 0% 50% 4% 96% 0% 0% 97% 3%PEAK HR FACTOR 0.000 0.500 0.797 0.633 0.734 APP/DEPART 0 / 3 2 / 0 51 / 50 38 / 38 0
03:00 PM 0 0 0 0 0 0 0 0 0 0 0 0 0 0 3:15 PM 0 0 0 0 0 0 0 0 0 0 0 0 0 0 3:30 PM 0 0 0 0 0 0 0 0 0 0 0 0 0 0 3:45 PM 0 0 0 0 0 0 0 0 0 0 0 0 0 0 4:00 PM 0 0 0 0 0 0 1 20 0 0 19 0 40 0 4:15 PM 0 0 0 0 0 0 0 22 0 0 23 1 46 0 4:30 PM 0 0 0 0 0 1 0 22 0 0 16 0 39 0 4:45 PM 0 0 0 0 0 0 3 20 0 0 27 2 52 0 5:00 PM 0 0 0 2 0 0 2 19 0 0 19 2 44 0 5:15 PM 0 0 0 1 0 1 2 18 0 0 17 1 40 0 5:30 PM 0 0 0 2 0 3 0 20 0 0 15 0 40 0 5:45 PM 0 0 0 0 0 0 0 16 0 0 11 2 29 0
VOLUMES 0 0 0 5 0 5 8 157 0 0 147 8 330 0 0 0 0 0 APPROACH % 0% 0% 0% 50% 0% 50% 5% 95% 0% 0% 95% 5%APP/DEPART 0 / 16 10 / 0 165 / 162 155 / 152 0 BEGIN PEAK HRVOLUMES 0 0 0 2 0 1 5 83 0 0 85 5 181 APPROACH % 0% 0% 0% 67% 0% 33% 6% 94% 0% 0% 94% 6%PEAK HR FACTOR 0.000 0.150 0.957 0.776 0.870 APP/DEPART 0 / 10 3 / 0 88 / 85 90 / 86 0
Kiningham
NORTH SIDE
El Rivino WEST SIDE EAST SIDE El Rivino
SOUTH SIDE
Kiningham
AM
7:45 AM
PM
4:15 PM
INTERSECTION TURNING MOVEMENT COUNTSPREPARED BY: PACIFIC TRAFFIC DATA SERVICES
U-TURNSKiningham Kiningham El Rivino El Rivino

DATE: LOCATION: San Bernardino PROJECT #: SC03996/12/14 NORTH & SOUTH: Kiningham LOCATION #: D
THURSDAY EAST & WEST: El Rivino CONTROL: Stop 1way S
CLASS 2: NOTES: AM �2-AXLE PM NWORK MD � W E �
VEHICLES/ OTHER STRUCKS OTHER �
NORTHBOUND SOUTHBOUND EASTBOUND WESTBOUND
NL NT NR SL ST SR EL ET ER WL WT WR TOTAL NB SB EB WB TTLLANES: X X X 0.5 X 0.5 0 1 X X 1 0
7:00 AM 0 0 0 0 0 0 0 8 0 0 7 0 15 0 7:15 AM 0 0 0 0 0 0 0 15 0 0 14 0 29 0 7:30 AM 0 0 0 1 0 0 0 5 0 0 5 0 11 0 7:45 AM 0 0 0 0 0 0 0 1 0 0 1 0 2 0 8:00 AM 0 0 0 0 0 1 2 0 0 0 0 0 3 0 8:15 AM 0 0 0 0 0 0 0 0 0 0 0 0 0 0 8:30 AM 0 0 0 0 0 1 1 1 0 0 2 0 5 0 8:45 AM 0 0 0 0 0 2 0 0 0 0 0 0 2 0 9:00 AM 0 0 0 0 0 0 0 0 0 0 0 0 0 0 9:15 AM 0 0 0 0 0 0 0 0 0 0 0 0 0 0 9:30 AM 0 0 0 0 0 0 0 0 0 0 0 0 0 0 9:45 AM 0 0 0 0 0 0 0 0 0 0 0 0 0 0
VOLUMES 0 0 0 1 0 4 3 30 0 0 29 0 67 0 0 0 0 0 APPROACH % 0% 0% 0% 20% 0% 80% 9% 91% 0% 0% 100% 0%APP/DEPART 0 / 3 5 / 0 33 / 31 29 / 33 0 BEGIN PEAK HRVOLUMES 0 0 0 1 0 0 0 29 0 0 27 0 57 APPROACH % 0% 0% 0% 100% 0% 0% 0% 100% 0% 0% 100% 0%PEAK HR FACTOR 0.000 0.250 0.483 0.482 0.491 APP/DEPART 0 / 0 1 / 0 29 / 30 27 / 27 0
03:00 PM 0 0 0 0 0 0 0 0 0 0 0 0 0 0 3:15 PM 0 0 0 0 0 0 0 0 0 0 0 0 0 0 3:30 PM 0 0 0 0 0 0 0 0 0 0 0 0 0 0 3:45 PM 0 0 0 0 0 0 0 0 0 0 0 0 0 0 4:00 PM 0 0 0 0 0 0 0 0 0 0 1 1 2 0 4:15 PM 0 0 0 0 0 0 2 1 0 0 3 0 6 0 4:30 PM 0 0 0 0 0 2 0 4 0 0 1 2 9 0 4:45 PM 0 0 0 0 0 2 0 2 0 0 0 1 5 0 5:00 PM 0 0 0 0 0 1 1 0 0 0 0 0 2 0 5:15 PM 0 0 0 0 0 2 0 3 0 0 2 0 7 0 5:30 PM 0 0 0 1 0 0 0 2 0 0 1 0 4 0 5:45 PM 0 0 0 0 0 0 0 4 0 0 4 1 9 0
VOLUMES 0 0 0 1 0 7 3 16 0 0 12 5 44 0 0 0 0 0 APPROACH % 0% 0% 0% 13% 0% 88% 16% 84% 0% 0% 71% 29%APP/DEPART 0 / 8 8 / 0 19 / 17 17 / 19 0 BEGIN PEAK HRVOLUMES 0 0 0 0 0 7 1 9 0 0 3 3 23 APPROACH % 0% 0% 0% 0% 0% 100% 10% 90% 0% 0% 50% 50%PEAK HR FACTOR 0.000 0.875 0.625 0.500 0.639 APP/DEPART 0 / 4 7 / 0 10 / 9 6 / 10 0
Kiningham
NORTH SIDE
El Rivino WEST SIDE EAST SIDE El Rivino
SOUTH SIDE
Kiningham
AM
7:00 AM
PM
4:30 PM
INTERSECTION TURNING MOVEMENT COUNTSPREPARED BY: PACIFIC TRAFFIC DATA SERVICES
U-TURNSKiningham Kiningham El Rivino El Rivino

DATE: LOCATION: San Bernardino PROJECT #: SC03996/12/14 NORTH & SOUTH: Kiningham LOCATION #: D
THURSDAY EAST & WEST: El Rivino CONTROL: Stop 1way S
CLASS 3: NOTES: AM �3-AXLE PM NTRUCKS MD � W E �
OTHER SOTHER �
NORTHBOUND SOUTHBOUND EASTBOUND WESTBOUND
NL NT NR SL ST SR EL ET ER WL WT WR TOTAL NB SB EB WB TTLLANES: X X X 0.5 X 0.5 0 1 X X 1 0
7:00 AM 0 0 0 0 0 0 0 1 0 0 1 0 2 0 7:15 AM 0 0 0 0 0 0 0 0 0 0 0 0 0 0 7:30 AM 0 0 0 0 0 0 0 2 0 0 1 0 3 0 7:45 AM 0 0 0 0 0 0 0 1 0 0 1 0 2 0 8:00 AM 0 0 0 0 0 0 0 1 0 0 1 0 2 0 8:15 AM 0 0 0 0 0 0 0 2 0 0 2 0 4 0 8:30 AM 0 0 0 0 0 0 0 0 0 0 0 0 0 0 8:45 AM 0 0 0 0 0 0 0 0 0 0 0 0 0 0 9:00 AM 0 0 0 0 0 0 0 0 0 0 0 0 0 0 9:15 AM 0 0 0 0 0 0 0 0 0 0 0 0 0 0 9:30 AM 0 0 0 0 0 0 0 0 0 0 0 0 0 0 9:45 AM 0 0 0 0 0 0 0 0 0 0 0 0 0 0
VOLUMES 0 0 0 0 0 0 0 7 0 0 6 0 13 0 0 0 0 0 APPROACH % 0% 0% 0% 0% 0% 0% 0% 100% 0% 0% 100% 0%APP/DEPART 0 / 0 0 / 0 7 / 7 6 / 6 0 BEGIN PEAK HRVOLUMES 0 0 0 0 0 0 0 6 0 0 5 0 11 APPROACH % 0% 0% 0% 0% 0% 0% 0% 100% 0% 0% 100% 0%PEAK HR FACTOR 0.000 0.000 0.750 0.625 0.688 APP/DEPART 0 / 0 0 / 0 6 / 6 5 / 5 0
3:00 PM 0 0 0 0 0 0 0 0 0 0 0 0 0 0 3:15 PM 0 0 0 0 0 0 0 0 0 0 0 0 0 0 3:30 PM 0 0 0 0 0 0 0 0 0 0 0 0 0 0 3:45 PM 0 0 0 0 0 0 0 0 0 0 0 0 0 0 4:00 PM 0 0 0 0 0 0 0 0 0 0 0 0 0 0 4:15 PM 0 0 0 0 0 0 0 0 0 0 0 0 0 0 4:30 PM 0 0 0 0 0 0 0 1 0 0 1 0 2 0 4:45 PM 0 0 0 0 0 0 1 0 0 0 0 0 1 0 5:00 PM 0 0 0 0 0 0 0 0 0 0 0 0 0 0 5:15 PM 0 0 0 0 0 0 0 0 0 0 0 0 0 0 5:30 PM 0 0 0 1 0 0 0 1 0 0 1 0 3 0 5:45 PM 0 0 0 0 0 0 0 0 0 0 0 0 0 0
VOLUMES 0 0 0 1 0 0 1 2 0 0 2 0 6 0 0 0 0 0 APPROACH % 0% 0% 0% 100% 0% 0% 33% 67% 0% 0% 100% 0%APP/DEPART 0 / 1 1 / 0 3 / 3 2 / 2 0 BEGIN PEAK HRVOLUMES 0 0 0 1 0 0 1 1 0 0 1 0 4 APPROACH % 0% 0% 0% 100% 0% 0% 50% 50% 0% 0% 100% 0%PEAK HR FACTOR 0.000 0.250 0.500 0.250 0.333 APP/DEPART 0 / 1 1 / 0 2 / 2 1 / 1 0
Kiningham
NORTH SIDE
El Rivino WEST SIDE EAST SIDE El Rivino
SOUTH SIDE
Kiningham
AM
7:30 AM
PM
4:45 PM
INTERSECTION TURNING MOVEMENT COUNTSPREPARED BY: PACIFIC TRAFFIC DATA SERVICES
U-TURNSKiningham Kiningham El Rivino El Rivino

DATE: LOCATION: San Bernardino PROJECT #: SC03996/12/14 NORTH & SOUTH: Kiningham LOCATION #: D
THURSDAY EAST & WEST: El Rivino CONTROL: Stop 1way S
CLASS 4: NOTES: AM �4 OR MORE PM N
AXLE MD � W E �TRUCKS OTHER S
OTHER �
NORTHBOUND SOUTHBOUND EASTBOUND WESTBOUND
NL NT NR SL ST SR EL ET ER WL WT WR TOTAL NB SB EB WB TTLLANES: X X X 0.5 X 0.5 0 1 X X 1 0
7:00 AM 0 0 0 0 0 0 0 0 0 0 0 0 0 0 7:15 AM 0 0 0 0 0 0 0 0 0 0 0 0 0 0 7:30 AM 0 0 0 0 0 0 0 1 0 0 1 0 2 0 7:45 AM 0 0 0 0 0 0 0 0 0 0 0 0 0 0 8:00 AM 0 0 0 0 0 0 0 0 0 0 0 0 0 0 8:15 AM 0 0 0 0 0 0 0 0 0 0 0 0 0 0 8:30 AM 0 0 0 0 0 0 0 0 0 0 0 0 0 0 8:45 AM 0 0 0 0 0 0 0 0 0 0 0 0 0 0 9:00 AM 0 0 0 0 0 0 0 0 0 0 0 0 0 0 9:15 AM 0 0 0 0 0 0 0 0 0 0 0 0 0 0 9:30 AM 0 0 0 0 0 0 0 0 0 0 0 0 0 0 9:45 AM 0 0 0 0 0 0 0 0 0 0 0 0 0 0
VOLUMES 0 0 0 0 0 0 0 1 0 0 1 0 2 0 0 0 0 0 APPROACH % 0% 0% 0% 0% 0% 0% 0% 100% 0% 0% 100% 0%APP/DEPART 0 / 0 0 / 0 1 / 1 1 / 1 0 BEGIN PEAK HRVOLUMES 0 0 0 0 0 0 0 1 0 0 1 0 2 APPROACH % 0% 0% 0% 0% 0% 0% 0% 100% 0% 0% 100% 0%PEAK HR FACTOR 0.000 0.000 0.250 0.250 0.250 APP/DEPART 0 / 0 0 / 0 1 / 1 1 / 1 0
3:00 PM 0 0 0 0 0 0 0 0 0 0 0 0 0 0 3:15 PM 0 0 0 0 0 0 0 0 0 0 0 0 0 0 3:30 PM 0 0 0 0 0 0 0 0 0 0 0 0 0 0 3:45 PM 0 0 0 0 0 0 0 0 0 0 0 0 0 0 4:00 PM 0 0 0 0 0 0 0 0 0 0 1 0 1 0 4:15 PM 0 0 0 0 0 0 0 0 0 0 0 0 0 0 4:30 PM 0 0 0 0 0 0 0 0 0 0 0 0 0 0 4:45 PM 0 0 0 0 0 0 0 0 0 0 0 0 0 0 5:00 PM 0 0 0 0 0 0 0 0 0 0 0 0 0 0 5:15 PM 0 0 0 0 0 0 0 0 0 0 0 0 0 0 5:30 PM 0 0 0 0 0 0 0 0 0 0 0 0 0 0 5:45 PM 0 0 0 0 0 0 0 0 0 0 0 0 0 0
VOLUMES 0 0 0 0 0 0 0 0 0 0 1 0 1 0 0 0 0 0 APPROACH % 0% 0% 0% 0% 0% 0% 0% 0% 0% 0% 100% 0%APP/DEPART 0 / 0 0 / 0 0 / 0 1 / 1 0 BEGIN PEAK HRVOLUMES 0 0 0 0 0 0 0 0 0 0 1 0 1 APPROACH % 0% 0% 0% 0% 0% 0% 0% 0% 0% 0% 100% 0%PEAK HR FACTOR 0.000 0.000 0.000 0.250 0.250 APP/DEPART 0 / 0 0 / 0 0 / 0 1 / 1 0
Kiningham
NORTH SIDE
El Rivino WEST SIDE EAST SIDE El Rivino
SOUTH SIDE
Kiningham
AM
7:30 AM
PM
4:00 PM
INTERSECTION TURNING MOVEMENT COUNTSPREPARED BY: PACIFIC TRAFFIC DATA SERVICES
U-TURNSKiningham Kiningham El Rivino El Rivino

DATE: LOCATION: San Bernardino PROJECT #: SC03996/12/14 NORTH & SOUTH: Kiningham LOCATION #: D
THURSDAY EAST & WEST: El Rivino CONTROL: Stop 1way S
CLASS 5: NOTES: AM �RV PM N
MD � W E �OTHER SOTHER �
NORTHBOUND SOUTHBOUND EASTBOUND WESTBOUND
NL NT NR SL ST SR EL ET ER WL WT WR TOTAL NB SB EB WB TTLLANES: X X X 0.5 X 0.5 0 1 X X 1 0
7:00 AM 0 0 0 0 0 0 0 0 0 0 0 0 0 0 7:15 AM 0 0 0 0 0 0 0 0 0 0 0 0 0 0 7:30 AM 0 0 0 0 0 0 0 0 0 0 0 0 0 0 7:45 AM 0 0 0 0 0 0 0 0 0 0 0 0 0 0 8:00 AM 0 0 0 0 0 0 0 0 0 0 0 0 0 0 8:15 AM 0 0 0 0 0 0 0 0 0 0 0 0 0 0 8:30 AM 0 0 0 0 0 0 0 0 0 0 0 0 0 0 8:45 AM 0 0 0 0 0 0 0 0 0 0 0 0 0 0 9:00 AM 0 0 0 0 0 0 0 0 0 0 0 0 0 0 9:15 AM 0 0 0 0 0 0 0 0 0 0 0 0 0 0 9:30 AM 0 0 0 0 0 0 0 0 0 0 0 0 0 0 9:45 AM 0 0 0 0 0 0 0 0 0 0 0 0 0 0
VOLUMES 0 0 0 0 0 0 0 0 0 0 0 0 0 0 0 0 0 0 APPROACH % 0% 0% 0% 0% 0% 0% 0% 0% 0% 0% 0% 0%APP/DEPART 0 / 0 0 / 0 0 / 0 0 / 0 0 BEGIN PEAK HRVOLUMES 0 0 0 0 0 0 0 0 0 0 0 0 0 APPROACH % 0% 0% 0% 0% 0% 0% 0% 0% 0% 0% 0% 0%PEAK HR FACTOR 0.000 0.000 0.000 0.000 0.000 APP/DEPART 0 / 0 0 / 0 0 / 0 0 / 0 0
3:00 PM 0 0 0 0 0 0 0 0 0 0 0 0 0 0 3:15 PM 0 0 0 0 0 0 0 0 0 0 0 0 0 0 3:30 PM 0 0 0 0 0 0 0 0 0 0 0 0 0 0 3:45 PM 0 0 0 0 0 0 0 0 0 0 0 0 0 0 4:00 PM 0 0 0 0 0 0 0 0 0 0 0 0 0 0 4:15 PM 0 0 0 0 0 0 0 0 0 0 0 0 0 0 4:30 PM 0 0 0 0 0 0 0 0 0 0 0 0 0 0 4:45 PM 0 0 0 0 0 0 0 0 0 0 0 0 0 0 5:00 PM 0 0 0 0 0 0 0 0 0 0 0 0 0 0 5:15 PM 0 0 0 0 0 0 0 0 0 0 0 0 0 0 5:30 PM 0 0 0 0 0 0 0 0 0 0 0 0 0 0 5:45 PM 0 0 0 0 0 0 0 0 0 0 0 0 0 0
VOLUMES 0 0 0 0 0 0 0 0 0 0 0 0 0 0 0 0 0 0 APPROACH % 0% 0% 0% 0% 0% 0% 0% 0% 0% 0% 0% 0%APP/DEPART 0 / 0 0 / 0 0 / 0 0 / 0 0 BEGIN PEAK HRVOLUMES 0 0 0 0 0 0 0 0 0 0 0 0 0 APPROACH % 0% 0% 0% 0% 0% 0% 0% 0% 0% 0% 0% 0%PEAK HR FACTOR 0.000 0.000 0.000 0.000 0.000 APP/DEPART 0 / 0 0 / 0 0 / 0 0 / 0 0
Kiningham
NORTH SIDE
El Rivino WEST SIDE EAST SIDE El Rivino
SOUTH SIDE
Kiningham
AM
9:45 AM
PM
5:45 PM
INTERSECTION TURNING MOVEMENT COUNTSPREPARED BY: PACIFIC TRAFFIC DATA SERVICES
U-TURNSKiningham Kiningham El Rivino El Rivino

DATE: LOCATION: San Bernardino PROJECT #: SC03996/12/14 NORTH & SOUTH: Kiningham LOCATION #: D
THURSDAY EAST & WEST: El Rivino CONTROL: Stop 1way S
CLASS 6: NOTES: AM �PM N
BUSES MD � W E �OTHER SOTHER �
NORTHBOUND SOUTHBOUND EASTBOUND WESTBOUND
NL NT NR SL ST SR EL ET ER WL WT WR TOTAL NB SB EB WB TTLLANES: X X X 0.5 X 0.5 0 1 X X 1 0
7:00 AM 0 0 0 0 0 0 0 0 0 0 0 0 0 0 7:15 AM 0 0 0 0 0 0 0 0 0 0 0 0 0 0 7:30 AM 0 0 0 0 0 0 0 0 0 0 0 0 0 0 7:45 AM 0 0 0 0 0 0 0 0 0 0 0 0 0 0 8:00 AM 0 0 0 0 0 0 0 0 0 0 0 0 0 0 8:15 AM 0 0 0 0 0 0 0 0 0 0 0 0 0 0 8:30 AM 0 0 0 0 0 0 0 0 0 0 0 0 0 0 8:45 AM 0 0 0 0 0 0 0 0 0 0 0 0 0 0 9:00 AM 0 0 0 0 0 0 0 0 0 0 0 0 0 0 9:15 AM 0 0 0 0 0 0 0 0 0 0 0 0 0 0 9:30 AM 0 0 0 0 0 0 0 0 0 0 0 0 0 0 9:45 AM 0 0 0 0 0 0 0 0 0 0 0 0 0 0
VOLUMES 0 0 0 0 0 0 0 0 0 0 0 0 0 0 0 0 0 0 APPROACH % 0% 0% 0% 0% 0% 0% 0% 0% 0% 0% 0% 0%APP/DEPART 0 / 0 0 / 0 0 / 0 0 / 0 0 BEGIN PEAK HRVOLUMES 0 0 0 0 0 0 0 0 0 0 0 0 0 APPROACH % 0% 0% 0% 0% 0% 0% 0% 0% 0% 0% 0% 0%PEAK HR FACTOR 0.000 0.000 0.000 0.000 0.000 APP/DEPART 0 / 0 0 / 0 0 / 0 0 / 0 0
3:00 PM 0 0 0 0 0 0 0 0 0 0 0 0 0 0 3:15 PM 0 0 0 0 0 0 0 0 0 0 0 0 0 0 3:30 PM 0 0 0 0 0 0 0 0 0 0 0 0 0 0 3:45 PM 0 0 0 0 0 0 0 0 0 0 0 0 0 0 4:00 PM 0 0 0 0 0 0 0 0 0 0 0 0 0 0 4:15 PM 0 0 0 0 0 0 0 0 0 0 0 0 0 0 4:30 PM 0 0 0 0 0 0 0 0 0 0 0 0 0 0 4:45 PM 0 0 0 0 0 0 0 0 0 0 0 0 0 0 5:00 PM 0 0 0 0 0 0 0 0 0 0 0 0 0 0 5:15 PM 0 0 0 0 0 0 0 0 0 0 0 0 0 0 5:30 PM 0 0 0 0 0 0 0 0 0 0 0 0 0 0 5:45 PM 0 0 0 0 0 0 0 0 0 0 0 0 0 0
VOLUMES 0 0 0 0 0 0 0 0 0 0 0 0 0 0 0 0 0 0 APPROACH % 0% 0% 0% 0% 0% 0% 0% 0% 0% 0% 0% 0%APP/DEPART 0 / 0 0 / 0 0 / 0 0 / 0 0 BEGIN PEAK HRVOLUMES 0 0 0 0 0 0 0 0 0 0 0 0 0 APPROACH % 0% 0% 0% 0% 0% 0% 0% 0% 0% 0% 0% 0%PEAK HR FACTOR 0.000 0.000 0.000 0.000 0.000 APP/DEPART 0 / 0 0 / 0 0 / 0 0 / 0 0
Kiningham
NORTH SIDE
El Rivino WEST SIDE EAST SIDE El Rivino
SOUTH SIDE
Kiningham
AM
9:45 AM
PM
5:45 PM
INTERSECTION TURNING MOVEMENT COUNTSPREPARED BY: PACIFIC TRAFFIC DATA SERVICES
U-TURNSKiningham Kiningham El Rivino El Rivino

DATE: LOCATION: PROJECT #: SC0399Thu, Jun 12, 14 NORTH & SOUTH: LOCATION #: D
EAST & WEST: CONTROL: Stop 1way S
NOTES: AM �PM NMD � W E �
OTHER SOTHER �
NORTHBOUND SOUTHBOUND EASTBOUND WESTBOUND
NL NT NR SL ST SR EL ET ER WL WT WR TOTALLANES: 1 2 0 1 2 0 0 1 0 0.5 0.5 1
7:00 AM 0 0 0 0 0 0 0 27 0 0 21 0 48 7:15 AM 0 0 0 0 0 0 1 23 0 0 30 1 55 7:30 AM 0 0 0 2 0 0 1 23 0 0 14 0 39 7:45 AM 0 0 0 0 0 1 1 18 0 0 13 0 32 8:00 AM 0 0 0 0 0 2 4 17 0 0 17 0 40 8:15 AM 0 0 0 0 0 0 0 13 0 0 9 1 23 8:30 AM 0 0 0 1 0 2 2 13 0 0 11 0 28 8:45 AM 0 0 0 1 0 3 0 9 0 0 7 0 20 9:00 AM 0 0 0 0 0 0 0 0 0 0 0 0 0 9:15 AM 0 0 0 0 0 0 0 0 0 0 0 0 0 9:30 AM 0 0 0 0 0 0 0 0 0 0 0 0 0 9:45 AM 0 0 0 0 0 0 0 0 0 0 0 0 0
VOLUMES 0 0 0 4 0 7 9 141 0 0 121 2 283 APPROACH % 0% 0% 0% 33% 0% 67% 6% 94% 0% 0% 98% 2%APP/DEPART 0 / 11 11 / 0 150 / 145 123 / 128 0 BEGIN PEAK HRVOLUMES 0 0 0 2 0 1 3 90 0 0 77 1 173 APPROACH % 0% 0% 0% 60% 0% 40% 3% 97% 0% 0% 99% 1%PEAK HR FACTOR 0.000 0.417 0.856 0.625 0.791 APP/DEPART 0 / 4 3 / 0 93 / 91 78 / 78 0
03:00 PM 0 0 0 0 0 0 0 0 0 0 0 0 0 3:15 PM 0 0 0 0 0 0 0 0 0 0 0 0 0 3:30 PM 0 0 0 0 0 0 0 0 0 0 0 0 0 3:45 PM 0 0 0 0 0 0 0 0 0 0 0 0 0 4:00 PM 0 0 0 0 0 0 1 20 0 0 24 2 46 4:15 PM 0 0 0 0 0 0 3 24 0 0 28 1 55 4:30 PM 0 0 0 0 0 4 0 30 0 0 20 3 57 4:45 PM 0 0 0 0 0 3 5 23 0 0 27 4 62 5:00 PM 0 0 0 2 0 2 4 19 0 0 19 2 47 5:15 PM 0 0 0 1 0 4 2 23 0 0 20 1 51 5:30 PM 0 0 0 6 0 3 0 25 0 0 19 0 52 5:45 PM 0 0 0 0 0 0 0 22 0 0 17 4 43
VOLUMES 0 0 0 9 0 16 15 185 0 0 172 16 411 APPROACH % 0% 0% 0% 35% 0% 65% 7% 93% 0% 0% 92% 8%APP/DEPART 0 / 30 24 / 0 200 / 194 188 / 188 0 BEGIN PEAK HRVOLUMES 0 0 0 2 0 9 12 96 0 0 93 10 220 APPROACH % 0% 0% 0% 19% 0% 81% 11% 89% 0% 0% 91% 9%PEAK HR FACTOR 0.000 0.656 0.892 0.840 0.894 APP/DEPART 0 / 21 11 / 0 107 / 98 103 / 102 0
INTERSECTION TURNING MOVEMENT COUNTSPREPARED BY: AimTD LLC tel: 951 249 3226 [email protected]
San BernardinoKininghamEl Rivino
Kiningham Kiningham El Rivino El Rivino
AM
7:00 AM
PM
4:15 PM
PCE ADJUSTED

DATE: LOCATION: San Bernardino PROJECT #: SC03996/12/14 NORTH & SOUTH: Agua Mansa LOCATION #: E
THURSDAY EAST & WEST: El Rivino CONTROL: Stop 1way E
CLASS 1: NOTES: AM �PASSENGER PM NVEHICLES MD � W E �
OTHER SOTHER �
NORTHBOUND SOUTHBOUND EASTBOUND WESTBOUND
NL NT NR SL ST SR EL ET ER WL WT WR TOTAL NB SB EB WB TTLLANES: 1 1 X X 1 0 1 X 1 X X X
7:00 AM 2 35 0 0 53 9 11 0 1 0 0 0 111 0 7:15 AM 0 37 0 0 63 5 7 0 4 0 0 0 116 0 7:30 AM 1 31 0 0 38 4 13 0 2 0 0 0 89 0 7:45 AM 2 50 0 0 48 11 12 0 6 0 0 0 129 0 8:00 AM 0 39 0 0 31 6 11 0 1 0 0 0 88 0 8:15 AM 1 40 0 0 25 6 4 0 2 0 0 0 78 0 8:30 AM 2 33 0 0 25 7 8 0 1 0 0 0 76 0 8:45 AM 0 31 0 0 28 3 13 0 0 0 0 0 75 0 9:00 AM 0 0 0 0 0 0 0 0 0 0 0 0 0 0 9:15 AM 0 0 0 0 0 0 0 0 0 0 0 0 0 0 9:30 AM 0 0 0 0 0 0 0 0 0 0 0 0 0 0 9:45 AM 0 0 0 0 0 0 0 0 0 0 0 0 0 0
VOLUMES 8 296 0 0 311 51 79 0 17 0 0 0 762 0 0 0 0 0 APPROACH % 3% 97% 0% 0% 86% 14% 82% 0% 18% 0% 0% 0%APP/DEPART 304 / 375 362 / 328 96 / 0 0 / 59 0 BEGIN PEAK HRVOLUMES 5 153 0 0 202 29 43 0 13 0 0 0 445 APPROACH % 3% 97% 0% 0% 87% 13% 77% 0% 23% 0% 0% 0%PEAK HR FACTOR 0.760 0.849 0.778 0.000 0.862 APP/DEPART 158 / 196 231 / 215 56 / 0 0 / 34 0
03:00 PM 0 0 0 0 0 0 0 0 0 0 0 0 0 0 3:15 PM 0 0 0 0 0 0 0 0 0 0 0 0 0 0 3:30 PM 0 0 0 0 0 0 0 0 0 0 0 0 0 0 3:45 PM 0 0 0 0 0 0 0 0 0 0 0 0 0 0 4:00 PM 16 153 0 0 31 11 20 0 2 0 0 0 233 0 4:15 PM 7 95 0 0 31 18 21 0 0 0 0 0 172 0 4:30 PM 3 97 0 0 33 16 29 0 3 0 0 0 181 0 4:45 PM 3 72 0 0 32 16 22 0 1 0 0 0 146 0 5:00 PM 3 113 0 0 33 12 19 0 5 0 0 0 185 0 5:15 PM 5 89 0 0 38 22 11 0 2 0 0 0 167 0 5:30 PM 0 78 0 0 36 7 17 0 6 0 0 0 144 0 5:45 PM 7 64 0 0 28 10 12 0 1 0 0 0 122 0
VOLUMES 44 761 0 0 262 112 151 0 20 0 0 0 1,350 0 0 0 0 0 APPROACH % 5% 95% 0% 0% 70% 30% 88% 0% 12% 0% 0% 0%APP/DEPART 805 / 912 374 / 282 171 / 0 0 / 156 0 BEGIN PEAK HRVOLUMES 29 417 0 0 127 61 92 0 6 0 0 0 732 APPROACH % 7% 93% 0% 0% 68% 32% 94% 0% 6% 0% 0% 0%PEAK HR FACTOR 0.660 0.783 0.766 0.000 0.785 APP/DEPART 446 / 509 188 / 133 98 / 0 0 / 90 0
Agua Mansa
NORTH SIDE
El Rivino WEST SIDE EAST SIDE El Rivino
SOUTH SIDE
Agua Mansa
AM
7:00 AM
PM
4:00 PM
INTERSECTION TURNING MOVEMENT COUNTSPREPARED BY: PACIFIC TRAFFIC DATA SERVICES
U-TURNSAgua Mansa Agua Mansa El Rivino El Rivino

DATE: LOCATION: San Bernardino PROJECT #: SC03996/12/14 NORTH & SOUTH: Agua Mansa LOCATION #: E
THURSDAY EAST & WEST: El Rivino CONTROL: Stop 1way E
CLASS 2: NOTES: AM �2-AXLE PM NWORK MD � W E �
VEHICLES/ OTHER STRUCKS OTHER �
NORTHBOUND SOUTHBOUND EASTBOUND WESTBOUND
NL NT NR SL ST SR EL ET ER WL WT WR TOTAL NB SB EB WB TTLLANES: 1 1 X X 1 0 1 X 1 X X X
7:00 AM 0 6 0 0 4 2 8 0 1 0 0 0 21 0 7:15 AM 1 4 0 0 6 2 0 0 0 0 0 0 13 0 7:30 AM 0 5 0 0 9 3 2 0 2 0 0 0 21 0 7:45 AM 1 5 0 0 7 0 2 0 0 0 0 0 15 0 8:00 AM 0 6 0 0 9 0 1 0 1 0 0 0 17 0 8:15 AM 0 8 0 0 14 2 1 0 0 0 0 0 25 0 8:30 AM 0 5 0 0 15 3 2 0 0 0 0 0 25 0 8:45 AM 0 6 0 0 7 2 1 0 0 0 0 0 16 0 9:00 AM 0 0 0 0 0 0 0 0 0 0 0 0 0 0 9:15 AM 0 0 0 0 0 0 0 0 0 0 0 0 0 0 9:30 AM 0 0 0 0 0 0 0 0 0 0 0 0 0 0 9:45 AM 0 0 0 0 0 0 0 0 0 0 0 0 0 0
VOLUMES 2 45 0 0 71 14 17 0 4 0 0 0 153 0 0 0 0 0 APPROACH % 4% 96% 0% 0% 84% 16% 81% 0% 19% 0% 0% 0%APP/DEPART 47 / 62 85 / 75 21 / 0 0 / 16 0 BEGIN PEAK HRVOLUMES 0 25 0 0 45 7 5 0 1 0 0 0 83 APPROACH % 0% 100% 0% 0% 87% 13% 83% 0% 17% 0% 0% 0%PEAK HR FACTOR 0.781 0.722 0.750 0.000 0.830 APP/DEPART 25 / 30 52 / 46 6 / 0 0 / 7 0
03:00 PM 0 0 0 0 0 0 0 0 0 0 0 0 0 0 3:15 PM 0 0 0 0 0 0 0 0 0 0 0 0 0 0 3:30 PM 0 0 0 0 0 0 0 0 0 0 0 0 0 0 3:45 PM 0 0 0 0 0 0 0 0 0 0 0 0 0 0 4:00 PM 0 12 0 0 7 2 1 0 0 0 0 0 22 0 4:15 PM 0 8 0 0 7 3 2 0 1 0 0 0 21 0 4:30 PM 2 6 0 0 4 2 0 0 1 0 0 0 15 0 4:45 PM 1 9 0 0 4 3 1 0 0 0 0 0 18 0 5:00 PM 0 7 0 0 2 1 1 0 0 0 0 0 11 0 5:15 PM 0 5 0 0 1 0 3 0 0 0 0 0 9 0 5:30 PM 0 6 0 0 2 1 2 0 1 0 0 0 12 0 5:45 PM 0 3 0 0 3 0 1 0 0 0 0 0 7 0
VOLUMES 3 56 0 0 30 12 11 0 3 0 0 0 115 0 0 0 0 0 APPROACH % 5% 95% 0% 0% 71% 29% 79% 0% 21% 0% 0% 0%APP/DEPART 59 / 67 42 / 33 14 / 0 0 / 15 0 BEGIN PEAK HRVOLUMES 3 35 0 0 22 10 4 0 2 0 0 0 76 APPROACH % 8% 92% 0% 0% 69% 31% 67% 0% 33% 0% 0% 0%PEAK HR FACTOR 0.792 0.800 0.500 0.000 0.864 APP/DEPART 38 / 39 32 / 24 6 / 0 0 / 13 0
Agua Mansa
NORTH SIDE
El Rivino WEST SIDE EAST SIDE El Rivino
SOUTH SIDE
Agua Mansa
AM
8:00 AM
PM
4:00 PM
INTERSECTION TURNING MOVEMENT COUNTSPREPARED BY: PACIFIC TRAFFIC DATA SERVICES
U-TURNSAgua Mansa Agua Mansa El Rivino El Rivino

DATE: LOCATION: San Bernardino PROJECT #: SC03996/12/14 NORTH & SOUTH: Agua Mansa LOCATION #: E
THURSDAY EAST & WEST: El Rivino CONTROL: Stop 1way E
CLASS 3: NOTES: AM �3-AXLE PM NTRUCKS MD � W E �
OTHER SOTHER �
NORTHBOUND SOUTHBOUND EASTBOUND WESTBOUND
NL NT NR SL ST SR EL ET ER WL WT WR TOTAL NB SB EB WB TTLLANES: 1 1 X X 1 0 1 X 1 X X X
7:00 AM 0 2 0 0 3 0 2 0 2 0 0 0 9 0 7:15 AM 0 1 0 0 5 0 0 0 0 0 0 0 6 0 7:30 AM 0 1 0 0 3 0 2 0 0 0 0 0 6 0 7:45 AM 0 0 0 0 0 0 0 0 0 0 0 0 0 0 8:00 AM 0 4 0 0 4 0 0 0 0 0 0 0 8 0 8:15 AM 0 1 0 0 1 0 0 0 0 0 0 0 2 0 8:30 AM 0 1 0 0 5 0 0 0 0 0 0 0 6 0 8:45 AM 0 2 0 0 4 0 1 0 0 0 0 0 7 0 9:00 AM 0 0 0 0 0 0 0 0 0 0 0 0 0 0 9:15 AM 0 0 0 0 0 0 0 0 0 0 0 0 0 0 9:30 AM 0 0 0 0 0 0 0 0 0 0 0 0 0 0 9:45 AM 0 0 0 0 0 0 0 0 0 0 0 0 0 0
VOLUMES 0 12 0 0 25 0 5 0 2 0 0 0 44 0 0 0 0 0 APPROACH % 0% 100% 0% 0% 100% 0% 71% 0% 29% 0% 0% 0%APP/DEPART 12 / 17 25 / 27 7 / 0 0 / 0 0 BEGIN PEAK HRVOLUMES 0 8 0 0 14 0 1 0 0 0 0 0 23 APPROACH % 0% 100% 0% 0% 100% 0% 100% 0% 0% 0% 0% 0%PEAK HR FACTOR 0.500 0.700 0.250 0.000 0.719 APP/DEPART 8 / 9 14 / 14 1 / 0 0 / 0 0
3:00 PM 0 0 0 0 0 0 0 0 0 0 0 0 0 0 3:15 PM 0 0 0 0 0 0 0 0 0 0 0 0 0 0 3:30 PM 0 0 0 0 0 0 0 0 0 0 0 0 0 0 3:45 PM 0 0 0 0 0 0 0 0 0 0 0 0 0 0 4:00 PM 0 2 0 0 3 1 0 0 0 0 0 0 6 0 4:15 PM 0 6 0 0 6 0 0 0 0 0 0 0 12 0 4:30 PM 0 6 0 0 4 0 0 0 0 0 0 0 10 0 4:45 PM 0 5 0 0 3 0 0 0 0 0 0 0 8 0 5:00 PM 0 5 0 0 2 0 0 0 0 0 0 0 7 0 5:15 PM 0 2 0 0 4 0 0 0 0 0 0 0 6 0 5:30 PM 0 7 0 0 4 0 0 0 0 0 0 0 11 0 5:45 PM 0 8 0 0 4 0 0 0 1 0 0 0 13 0
VOLUMES 0 41 0 0 30 1 0 0 1 0 0 0 73 0 0 0 0 0 APPROACH % 0% 100% 0% 0% 97% 3% 0% 0% 100% 0% 0% 0%APP/DEPART 41 / 41 31 / 31 1 / 0 0 / 1 0 BEGIN PEAK HRVOLUMES 0 22 0 0 14 0 0 0 1 0 0 0 37 APPROACH % 0% 100% 0% 0% 100% 0% 0% 0% 100% 0% 0% 0%PEAK HR FACTOR 0.688 0.583 0.250 0.000 0.712 APP/DEPART 22 / 22 14 / 15 1 / 0 0 / 0 0
Agua Mansa
NORTH SIDE
El Rivino WEST SIDE EAST SIDE El Rivino
SOUTH SIDE
Agua Mansa
AM
8:00 AM
PM
5:00 PM
INTERSECTION TURNING MOVEMENT COUNTSPREPARED BY: PACIFIC TRAFFIC DATA SERVICES
U-TURNSAgua Mansa Agua Mansa El Rivino El Rivino

DATE: LOCATION: San Bernardino PROJECT #: SC03996/12/14 NORTH & SOUTH: Agua Mansa LOCATION #: E
THURSDAY EAST & WEST: El Rivino CONTROL: Stop 1way E
CLASS 4: NOTES: AM �4 OR MORE PM N
AXLE MD � W E �TRUCKS OTHER S
OTHER �
NORTHBOUND SOUTHBOUND EASTBOUND WESTBOUND
NL NT NR SL ST SR EL ET ER WL WT WR TOTAL NB SB EB WB TTLLANES: 1 1 X X 1 0 1 X 1 X X X
7:00 AM 0 9 0 0 10 0 0 0 0 0 0 0 19 0 7:15 AM 0 8 0 0 8 0 0 0 0 0 0 0 16 0 7:30 AM 0 12 0 0 10 0 0 0 0 0 0 0 22 0 7:45 AM 0 7 0 0 14 0 0 0 0 0 0 0 21 0 8:00 AM 0 4 0 0 11 0 0 0 0 0 0 0 15 0 8:15 AM 0 15 0 0 12 0 0 0 0 0 0 0 27 0 8:30 AM 0 14 0 0 9 0 0 0 0 0 0 0 23 0 8:45 AM 1 8 0 0 8 0 0 0 0 0 0 0 17 0 9:00 AM 0 0 0 0 0 0 0 0 0 0 0 0 0 0 9:15 AM 0 0 0 0 0 0 0 0 0 0 0 0 0 0 9:30 AM 0 0 0 0 0 0 0 0 0 0 0 0 0 0 9:45 AM 0 0 0 0 0 0 0 0 0 0 0 0 0 0
VOLUMES 1 77 0 0 82 0 0 0 0 0 0 0 160 0 0 0 0 0 APPROACH % 1% 99% 0% 0% 100% 0% 0% 0% 0% 0% 0% 0%APP/DEPART 78 / 77 82 / 82 0 / 0 0 / 1 0 BEGIN PEAK HRVOLUMES 0 40 0 0 46 0 0 0 0 0 0 0 86 APPROACH % 0% 100% 0% 0% 100% 0% 0% 0% 0% 0% 0% 0%PEAK HR FACTOR 0.667 0.821 0.000 0.000 0.796 APP/DEPART 40 / 40 46 / 46 0 / 0 0 / 0 0
3:00 PM 0 0 0 0 0 0 0 0 0 0 0 0 0 0 3:15 PM 0 0 0 0 0 0 0 0 0 0 0 0 0 0 3:30 PM 0 0 0 0 0 0 0 0 0 0 0 0 0 0 3:45 PM 0 0 0 0 0 0 0 0 0 0 0 0 0 0 4:00 PM 1 14 0 0 14 0 0 0 0 0 0 0 29 0 4:15 PM 0 17 0 0 8 0 0 0 0 0 0 0 25 0 4:30 PM 0 9 0 0 8 0 0 0 0 0 0 0 17 0 4:45 PM 0 8 0 0 11 0 0 0 0 0 0 0 19 0 5:00 PM 0 12 0 0 6 1 1 0 0 0 0 0 20 0 5:15 PM 0 9 0 0 6 0 0 0 0 0 0 0 15 0 5:30 PM 0 14 0 0 9 0 0 0 0 0 0 0 23 0 5:45 PM 0 11 0 0 7 1 0 0 0 0 0 0 19 0
VOLUMES 1 94 0 0 69 2 1 0 0 0 0 0 167 0 0 0 0 0 APPROACH % 1% 99% 0% 0% 97% 3% 100% 0% 0% 0% 0% 0%APP/DEPART 95 / 95 71 / 69 1 / 0 0 / 3 0 BEGIN PEAK HRVOLUMES 1 48 0 0 41 0 0 0 0 0 0 0 90 APPROACH % 2% 98% 0% 0% 100% 0% 0% 0% 0% 0% 0% 0%PEAK HR FACTOR 0.721 0.732 0.000 0.000 0.776 APP/DEPART 49 / 48 41 / 41 0 / 0 0 / 1 0
Agua Mansa
NORTH SIDE
El Rivino WEST SIDE EAST SIDE El Rivino
SOUTH SIDE
Agua Mansa
AM
7:45 AM
PM
4:00 PM
INTERSECTION TURNING MOVEMENT COUNTSPREPARED BY: PACIFIC TRAFFIC DATA SERVICES
U-TURNSAgua Mansa Agua Mansa El Rivino El Rivino

DATE: LOCATION: San Bernardino PROJECT #: SC03996/12/14 NORTH & SOUTH: Agua Mansa LOCATION #: E
THURSDAY EAST & WEST: El Rivino CONTROL: Stop 1way E
CLASS 5: NOTES: AM �RV PM N
MD � W E �OTHER SOTHER �
NORTHBOUND SOUTHBOUND EASTBOUND WESTBOUND
NL NT NR SL ST SR EL ET ER WL WT WR TOTAL NB SB EB WB TTLLANES: 1 1 X X 1 0 1 X 1 X X X
7:00 AM 0 0 0 0 0 0 0 0 0 0 0 0 0 0 7:15 AM 0 0 0 0 0 0 0 0 0 0 0 0 0 0 7:30 AM 0 0 0 0 0 0 0 0 0 0 0 0 0 0 7:45 AM 0 0 0 0 0 0 0 0 0 0 0 0 0 0 8:00 AM 0 0 0 0 0 0 0 0 0 0 0 0 0 0 8:15 AM 0 0 0 0 0 0 0 0 0 0 0 0 0 0 8:30 AM 0 0 0 0 0 0 0 0 0 0 0 0 0 0 8:45 AM 0 0 0 0 0 0 0 0 0 0 0 0 0 0 9:00 AM 0 0 0 0 0 0 0 0 0 0 0 0 0 0 9:15 AM 0 0 0 0 0 0 0 0 0 0 0 0 0 0 9:30 AM 0 0 0 0 0 0 0 0 0 0 0 0 0 0 9:45 AM 0 0 0 0 0 0 0 0 0 0 0 0 0 0
VOLUMES 0 0 0 0 0 0 0 0 0 0 0 0 0 0 0 0 0 0 APPROACH % 0% 0% 0% 0% 0% 0% 0% 0% 0% 0% 0% 0%APP/DEPART 0 / 0 0 / 0 0 / 0 0 / 0 0 BEGIN PEAK HRVOLUMES 0 0 0 0 0 0 0 0 0 0 0 0 0 APPROACH % 0% 0% 0% 0% 0% 0% 0% 0% 0% 0% 0% 0%PEAK HR FACTOR 0.000 0.000 0.000 0.000 0.000 APP/DEPART 0 / 0 0 / 0 0 / 0 0 / 0 0
3:00 PM 0 0 0 0 0 0 0 0 0 0 0 0 0 0 3:15 PM 0 0 0 0 0 0 0 0 0 0 0 0 0 0 3:30 PM 0 0 0 0 0 0 0 0 0 0 0 0 0 0 3:45 PM 0 0 0 0 0 0 0 0 0 0 0 0 0 0 4:00 PM 0 0 0 0 0 0 0 0 0 0 0 0 0 0 4:15 PM 0 0 0 0 0 0 0 0 0 0 0 0 0 0 4:30 PM 0 0 0 0 0 0 0 0 0 0 0 0 0 0 4:45 PM 0 0 0 0 0 0 0 0 0 0 0 0 0 0 5:00 PM 0 0 0 0 0 0 0 0 0 0 0 0 0 0 5:15 PM 0 0 0 0 0 0 0 0 0 0 0 0 0 0 5:30 PM 0 0 0 0 0 0 0 0 0 0 0 0 0 0 5:45 PM 0 0 0 0 0 0 0 0 0 0 0 0 0 0
VOLUMES 0 0 0 0 0 0 0 0 0 0 0 0 0 0 0 0 0 0 APPROACH % 0% 0% 0% 0% 0% 0% 0% 0% 0% 0% 0% 0%APP/DEPART 0 / 0 0 / 0 0 / 0 0 / 0 0 BEGIN PEAK HRVOLUMES 0 0 0 0 0 0 0 0 0 0 0 0 0 APPROACH % 0% 0% 0% 0% 0% 0% 0% 0% 0% 0% 0% 0%PEAK HR FACTOR 0.000 0.000 0.000 0.000 0.000 APP/DEPART 0 / 0 0 / 0 0 / 0 0 / 0 0
Agua Mansa
NORTH SIDE
El Rivino WEST SIDE EAST SIDE El Rivino
SOUTH SIDE
Agua Mansa
AM
9:45 AM
PM
5:45 PM
INTERSECTION TURNING MOVEMENT COUNTSPREPARED BY: PACIFIC TRAFFIC DATA SERVICES
U-TURNSAgua Mansa Agua Mansa El Rivino El Rivino

DATE: LOCATION: San Bernardino PROJECT #: SC03996/12/14 NORTH & SOUTH: Agua Mansa LOCATION #: E
THURSDAY EAST & WEST: El Rivino CONTROL: Stop 1way E
CLASS 6: NOTES: AM �PM N
BUSES MD � W E �OTHER SOTHER �
NORTHBOUND SOUTHBOUND EASTBOUND WESTBOUND
NL NT NR SL ST SR EL ET ER WL WT WR TOTAL NB SB EB WB TTLLANES: 1 1 X X 1 0 1 X 1 X X X
7:00 AM 0 1 0 0 2 0 0 0 0 0 0 0 3 0 7:15 AM 0 0 0 0 0 0 0 0 0 0 0 0 0 0 7:30 AM 0 0 0 0 0 0 0 0 0 0 0 0 0 0 7:45 AM 0 1 0 0 0 0 0 0 0 0 0 0 1 0 8:00 AM 0 0 0 0 0 0 0 0 0 0 0 0 0 0 8:15 AM 0 0 0 0 0 0 0 0 0 0 0 0 0 0 8:30 AM 0 0 0 0 0 0 0 0 0 0 0 0 0 0 8:45 AM 0 0 0 0 0 0 0 0 0 0 0 0 0 0 9:00 AM 0 0 0 0 0 0 0 0 0 0 0 0 0 0 9:15 AM 0 0 0 0 0 0 0 0 0 0 0 0 0 0 9:30 AM 0 0 0 0 0 0 0 0 0 0 0 0 0 0 9:45 AM 0 0 0 0 0 0 0 0 0 0 0 0 0 0
VOLUMES 0 2 0 0 2 0 0 0 0 0 0 0 4 0 0 0 0 0 APPROACH % 0% 100% 0% 0% 100% 0% 0% 0% 0% 0% 0% 0%APP/DEPART 2 / 2 2 / 2 0 / 0 0 / 0 0 BEGIN PEAK HRVOLUMES 0 2 0 0 2 0 0 0 0 0 0 0 4 APPROACH % 0% 100% 0% 0% 100% 0% 0% 0% 0% 0% 0% 0%PEAK HR FACTOR 0.500 0.250 0.000 0.000 0.333 APP/DEPART 2 / 2 2 / 2 0 / 0 0 / 0 0
3:00 PM 0 0 0 0 0 0 0 0 0 0 0 0 0 0 3:15 PM 0 0 0 0 0 0 0 0 0 0 0 0 0 0 3:30 PM 0 0 0 0 0 0 0 0 0 0 0 0 0 0 3:45 PM 0 0 0 0 0 0 0 0 0 0 0 0 0 0 4:00 PM 0 0 0 0 0 0 0 0 0 0 0 0 0 0 4:15 PM 0 0 0 0 0 0 0 0 0 0 0 0 0 0 4:30 PM 0 0 0 0 0 0 0 0 0 0 0 0 0 0 4:45 PM 0 0 0 0 0 0 0 0 0 0 0 0 0 0 5:00 PM 0 0 0 0 0 0 0 0 0 0 0 0 0 0 5:15 PM 0 0 0 0 0 0 0 0 0 0 0 0 0 0 5:30 PM 0 0 0 0 0 0 0 0 0 0 0 0 0 0 5:45 PM 0 0 0 0 0 0 0 0 0 0 0 0 0 0
VOLUMES 0 0 0 0 0 0 0 0 0 0 0 0 0 0 0 0 0 0 APPROACH % 0% 0% 0% 0% 0% 0% 0% 0% 0% 0% 0% 0%APP/DEPART 0 / 0 0 / 0 0 / 0 0 / 0 0 BEGIN PEAK HRVOLUMES 0 0 0 0 0 0 0 0 0 0 0 0 0 APPROACH % 0% 0% 0% 0% 0% 0% 0% 0% 0% 0% 0% 0%PEAK HR FACTOR 0.000 0.000 0.000 0.000 0.000 APP/DEPART 0 / 0 0 / 0 0 / 0 0 / 0 0
Agua Mansa
NORTH SIDE
El Rivino WEST SIDE EAST SIDE El Rivino
SOUTH SIDE
Agua Mansa
AM
7:00 AM
PM
5:45 PM
INTERSECTION TURNING MOVEMENT COUNTSPREPARED BY: PACIFIC TRAFFIC DATA SERVICES
U-TURNSAgua Mansa Agua Mansa El Rivino El Rivino

DATE: LOCATION: PROJECT #: SC0399Thu, Jun 12, 14 NORTH & SOUTH: LOCATION #: E
EAST & WEST: CONTROL: Stop 1way E
NOTES: AM �PM NMD � W E �
OTHER SOTHER �
NORTHBOUND SOUTHBOUND EASTBOUND WESTBOUND
NL NT NR SL ST SR EL ET ER WL WT WR TOTALLANES: 1 2 0 1 2 0 0 1 0 0.5 0.5 1
7:00 AM 2 77 0 0 99 12 27 0 7 0 0 0 224 7:15 AM 2 69 0 0 106 8 7 0 4 0 0 0 196 7:30 AM 1 77 0 0 88 9 20 0 5 0 0 0 199 7:45 AM 4 81 0 0 101 11 15 0 6 0 0 0 217 8:00 AM 0 68 0 0 86 6 13 0 3 0 0 0 175 8:15 AM 1 99 0 0 84 9 6 0 2 0 0 0 201 8:30 AM 2 85 0 0 85 12 11 0 1 0 0 0 195 8:45 AM 3 68 0 0 71 6 17 0 0 0 0 0 164 9:00 AM 0 0 0 0 0 0 0 0 0 0 0 0 0 9:15 AM 0 0 0 0 0 0 0 0 0 0 0 0 0 9:30 AM 0 0 0 0 0 0 0 0 0 0 0 0 0 9:45 AM 0 0 0 0 0 0 0 0 0 0 0 0 0
VOLUMES 14 623 0 0 718 72 115 0 27 0 0 0 1,568 APPROACH % 2% 98% 0% 0% 91% 9% 81% 0% 19% 0% 0% 0%APP/DEPART 637 / 737 790 / 745 142 / 0 0 / 86 0 BEGIN PEAK HRVOLUMES 8 303 0 0 393 40 69 0 22 0 0 0 834 APPROACH % 3% 97% 0% 0% 91% 9% 76% 0% 24% 0% 0% 0%PEAK HR FACTOR 0.926 0.948 0.675 0.000 0.933 APP/DEPART 311 / 372 433 / 415 91 / 0 0 / 48 0
03:00 PM 0 0 0 0 0 0 0 0 0 0 0 0 0 3:15 PM 0 0 0 0 0 0 0 0 0 0 0 0 0 3:30 PM 0 0 0 0 0 0 0 0 0 0 0 0 0 3:45 PM 0 0 0 0 0 0 0 0 0 0 0 0 0 4:00 PM 19 217 0 0 90 16 22 0 2 0 0 0 365 4:15 PM 7 170 0 0 78 23 24 0 2 0 0 0 303 4:30 PM 6 145 0 0 71 19 29 0 5 0 0 0 275 4:45 PM 5 120 0 0 77 21 24 0 1 0 0 0 246 5:00 PM 3 170 0 0 58 17 24 0 5 0 0 0 276 5:15 PM 5 128 0 0 66 22 16 0 2 0 0 0 238 5:30 PM 0 143 0 0 74 9 20 0 8 0 0 0 253 5:45 PM 7 118 0 0 62 13 14 0 3 0 0 0 216
VOLUMES 52 1,209 0 0 574 138 171 0 27 0 0 0 2,170 APPROACH % 4% 96% 0% 0% 81% 19% 87% 0% 13% 0% 0% 0%APP/DEPART 1,261 / 1,380 712 / 601 197 / 0 0 / 190 0 BEGIN PEAK HRVOLUMES 37 652 0 0 315 78 98 0 9 0 0 0 1,188 APPROACH % 5% 95% 0% 0% 80% 20% 92% 0% 8% 0% 0% 0%PEAK HR FACTOR 0.729 0.931 0.799 0.000 0.814 APP/DEPART 688 / 750 393 / 324 107 / 0 0 / 115 0
INTERSECTION TURNING MOVEMENT COUNTSPREPARED BY: AimTD LLC tel: 951 249 3226 [email protected]
San BernardinoAgua MansaEl Rivino
Agua Mansa Agua Mansa El Rivino El Rivino
AM
7:00 AM
PM
4:00 PM
PCE ADJUSTED

DATE: LOCATION: San Bernardino PROJECT #: SC03676/12/14 NORTH & SOUTH: Riverside LOCATION #: F
THURSDAY EAST & WEST: Agua Mansa CONTROL: SIGNAL
CLASS 1: NOTES: AM ▲PASSENGER PM NVEHICLES MD ◄ W E ►
OTHER SOTHER ▼
NORTHBOUND SOUTHBOUND EASTBOUND WESTBOUND
NL NT NR SL ST SR EL ET ER WL WT WR TOTALLANES: 1 2 0 1 2 1 1 1 1 1 1 1
7:00 AM 23 168 7 4 149 23 21 22 4 11 44 3 479 7:15 AM 23 139 8 3 152 20 24 30 11 7 37 7 461 7:30 AM 12 173 16 4 170 26 16 29 7 14 44 1 512 7:45 AM 21 165 7 8 182 21 13 23 11 17 52 4 524 8:00 AM 18 162 12 4 122 16 19 18 13 12 20 6 422 8:15 AM 16 95 7 3 142 18 27 18 9 5 17 7 364 8:30 AM 11 118 15 4 90 14 22 21 9 10 16 3 333 8:45 AM 12 106 6 9 102 23 29 13 10 6 13 1 330 9:00 AM 0 0 0 0 0 0 0 0 0 0 0 0 0 9:15 AM 0 0 0 0 0 0 0 0 0 0 0 0 0 9:30 AM 0 0 0 0 0 0 0 0 0 0 0 0 0 9:45 AM 0 0 0 0 0 0 0 0 0 0 0 0 0
VOLUMES 136 1,126 78 39 1,109 161 171 174 74 82 243 32 3,425 APPROACH % 10% 84% 6% 3% 85% 12% 41% 42% 18% 23% 68% 9%APP/DEPART 1,340 / 1,329 1,309 / 1,265 419 / 291 357 / 540 0 BEGIN PEAK HRVOLUMES 79 645 38 19 653 90 74 104 33 49 177 15 1,976 APPROACH % 10% 85% 5% 2% 86% 12% 35% 49% 16% 20% 73% 6%PEAK HR FACTOR 0.948 0.903 0.812 0.825 0.943 APP/DEPART 762 / 734 762 / 735 211 / 161 241 / 346 0
03:00 PM 0 0 0 0 0 0 0 0 0 0 0 0 0 3:15 PM 0 0 0 0 0 0 0 0 0 0 0 0 0 3:30 PM 0 0 0 0 0 0 0 0 0 0 0 0 0 3:45 PM 0 0 0 0 0 0 0 0 0 0 0 0 0 4:00 PM 16 187 11 13 154 20 33 96 50 9 27 5 621 4:15 PM 18 174 17 11 176 20 14 74 16 10 20 4 554 4:30 PM 15 166 11 11 204 20 28 95 18 2 20 4 594 4:45 PM 19 195 15 9 204 16 27 92 13 5 21 3 619 5:00 PM 13 139 18 15 193 21 28 105 24 8 22 8 594 5:15 PM 13 204 10 8 220 28 21 112 16 12 34 -2 676 5:30 PM 17 178 18 14 185 14 29 85 12 5 24 5 586 5:45 PM 8 186 20 5 170 18 27 75 18 10 18 3 558
VOLUMES 119 1,429 120 86 1,506 157 207 734 167 61 186 30 4,802 APPROACH % 7% 86% 7% 5% 86% 9% 19% 66% 15% 22% 67% 11%APP/DEPART 1,668 / 1,666 1,749 / 1,734 1,108 / 940 277 / 462 0 BEGIN PEAK HRVOLUMES 60 704 54 43 821 85 104 404 71 27 97 13 2,483 APPROACH % 7% 86% 7% 5% 87% 9% 18% 70% 12% 20% 71% 9%PEAK HR FACTOR 0.893 0.927 0.922 0.778 0.918 APP/DEPART 818 / 821 949 / 919 579 / 501 137 / 242 0
Riverside
NORTH SIDE
Agua Mansa WEST SIDE EAST SIDE Agua Mansa
SOUTH SIDE
Riverside
Riverside Riverside Agua Mansa Agua Mansa
AM
7:00 AM
PM
4:30 PM
INTERSECTION TURNING MOVEMENT COUNTSPREPARED BY: PACIFIC TRAFFIC DATA SERVICES

DATE: LOCATION: San Bernardino PROJECT #: SC03676/12/14 NORTH & SOUTH: Riverside LOCATION #: F
THURSDAY EAST & WEST: Agua Mansa CONTROL: SIGNAL
CLASS 2: NOTES: AM �2-AXLE PM NWORK MD � W E �
VEHICLES/ OTHER STRUCKS OTHER �
NORTHBOUND SOUTHBOUND EASTBOUND WESTBOUND
NL NT NR SL ST SR EL ET ER WL WT WR TOTAL NB SB EB WB TTLLANES: 1 2 0 1 2 1 1 1 1 1 1 1
7:00 AM 4 1 1 0 15 3 3 4 1 2 6 1 41 0 7:15 AM 2 6 2 0 7 2 4 3 2 0 0 3 31 0 7:30 AM 3 7 1 0 14 0 3 7 0 0 1 1 37 0 7:45 AM 4 2 0 1 16 1 1 4 1 1 5 0 36 0 8:00 AM 5 6 0 1 15 5 0 7 0 0 8 0 47 0 8:15 AM 3 11 2 1 21 1 3 4 3 0 2 1 52 0 8:30 AM 2 5 1 3 18 2 0 3 6 1 2 0 43 0 8:45 AM 8 5 1 1 15 4 6 7 4 1 1 0 53 0 9:00 AM 0 0 0 0 0 0 0 0 0 0 0 0 0 0 9:15 AM 0 0 0 0 0 0 0 0 0 0 0 0 0 0 9:30 AM 0 0 0 0 0 0 0 0 0 0 0 0 0 0 9:45 AM 0 0 0 0 0 0 0 0 0 0 0 0 0 0
VOLUMES 31 43 8 7 121 18 20 39 17 5 25 6 340 0 0 0 0 0 APPROACH % 38% 52% 10% 5% 83% 12% 26% 51% 22% 14% 69% 17%APP/DEPART 82 / 69 146 / 143 76 / 54 36 / 74 0 BEGIN PEAK HRVOLUMES 18 27 4 6 69 12 9 21 13 2 13 1 195 APPROACH % 37% 55% 8% 7% 79% 14% 21% 49% 30% 13% 81% 6%PEAK HR FACTOR 0.766 0.946 0.632 0.500 0.920 APP/DEPART 49 / 37 87 / 84 43 / 31 16 / 43 0
03:00 PM 0 0 0 0 0 0 0 0 0 0 0 0 0 0 3:15 PM 0 0 0 0 0 0 0 0 0 0 0 0 0 0 3:30 PM 0 0 0 0 0 0 0 0 0 0 0 0 0 0 3:45 PM 0 0 0 0 0 0 0 0 0 0 0 0 0 0 4:00 PM 5 0 1 0 9 3 3 6 1 1 5 1 35 0 4:15 PM 3 9 0 1 7 0 2 5 2 1 3 0 33 0 4:30 PM 0 6 2 0 11 3 0 10 2 2 1 3 40 0 4:45 PM 4 6 0 0 9 1 3 13 4 0 4 1 45 0 5:00 PM 3 6 1 2 15 2 1 6 1 1 1 3 42 0 5:15 PM 5 4 0 0 7 0 2 5 3 0 1 0 27 0 5:30 PM 3 13 0 0 11 1 2 5 1 0 0 0 36 0 5:45 PM 4 7 2 0 11 0 1 1 0 1 0 0 27 0
VOLUMES 27 51 6 3 80 10 14 51 14 6 15 8 285 0 0 0 0 0 APPROACH % 32% 61% 7% 3% 86% 11% 18% 65% 18% 21% 52% 28%APP/DEPART 84 / 73 93 / 100 79 / 60 29 / 52 0 BEGIN PEAK HRVOLUMES 10 27 3 3 42 6 6 34 9 4 9 7 160 APPROACH % 25% 68% 8% 6% 82% 12% 12% 69% 18% 20% 45% 35%PEAK HR FACTOR 0.833 0.671 0.613 0.833 0.889 APP/DEPART 40 / 40 51 / 55 49 / 40 20 / 25 0
Riverside
NORTH SIDE
Agua Mansa WEST SIDE EAST SIDE Agua Mansa
SOUTH SIDE
Riverside
U-TURNSRiverside Riverside Agua Mansa Agua Mansa
AM
8:00 AM
PM
4:15 PM
INTERSECTION TURNING MOVEMENT COUNTSPREPARED BY: PACIFIC TRAFFIC DATA SERVICES

DATE: LOCATION: San Bernardino PROJECT #: SC03676/12/14 NORTH & SOUTH: Riverside LOCATION #: F
THURSDAY EAST & WEST: Agua Mansa CONTROL: SIGNAL
CLASS 3: NOTES: AM �3-AXLE PM NTRUCKS MD � W E �
OTHER SOTHER �
NORTHBOUND SOUTHBOUND EASTBOUND WESTBOUND
NL NT NR SL ST SR EL ET ER WL WT WR TOTAL NB SB EB WB TTLLANES: 1 2 0 1 2 1 1 1 1 1 1 1
7:00 AM 1 3 1 1 2 1 0 1 1 1 0 1 13 0 7:15 AM 2 0 1 0 3 4 1 2 1 0 1 0 15 0 7:30 AM 3 0 2 1 4 0 1 2 0 0 1 1 15 0 7:45 AM 1 4 0 1 4 1 1 0 3 0 3 0 18 0 8:00 AM 2 8 0 3 5 3 1 5 0 0 1 1 29 0 8:15 AM 2 2 0 2 3 2 1 2 3 0 3 0 20 0 8:30 AM 2 1 2 3 5 2 0 1 0 0 3 0 19 0 8:45 AM 1 5 0 2 3 2 2 2 2 0 1 0 20 0 9:00 AM 0 0 0 0 0 0 0 0 0 0 0 0 0 0 9:15 AM 0 0 0 0 0 0 0 0 0 0 0 0 0 0 9:30 AM 0 0 0 0 0 0 0 0 0 0 0 0 0 0 9:45 AM 0 0 0 0 0 0 0 0 0 0 0 0 0 0
VOLUMES 14 23 6 13 29 15 7 15 10 1 13 3 149 0 0 0 0 0 APPROACH % 33% 53% 14% 23% 51% 26% 22% 47% 31% 6% 76% 18%APP/DEPART 43 / 33 57 / 40 32 / 34 17 / 42 0 BEGIN PEAK HRVOLUMES 7 16 2 10 16 9 4 10 5 0 8 1 88 APPROACH % 28% 64% 8% 29% 46% 26% 21% 53% 26% 0% 89% 11%PEAK HR FACTOR 0.625 0.795 0.792 0.750 0.759 APP/DEPART 25 / 21 35 / 21 19 / 22 9 / 24 0
3:00 PM 0 0 0 0 0 0 0 0 0 0 0 0 0 0 3:15 PM 0 0 0 0 0 0 0 0 0 0 0 0 0 0 3:30 PM 0 0 0 0 0 0 0 0 0 0 0 0 0 0 3:45 PM 0 0 0 0 0 0 0 0 0 0 0 0 0 0 4:00 PM 4 4 1 0 5 1 2 0 2 0 3 1 23 0 4:15 PM 3 2 0 2 10 2 0 1 1 0 0 0 21 0 4:30 PM 1 8 1 0 11 0 2 0 1 0 0 0 24 0 4:45 PM 0 3 0 0 3 1 1 1 1 0 2 1 13 0 5:00 PM 2 3 1 0 8 1 1 1 3 0 0 0 20 0 5:15 PM 0 2 1 1 5 2 0 0 1 0 3 0 15 0 5:30 PM 0 4 0 3 2 2 2 1 3 0 0 0 17 0 5:45 PM 0 5 1 0 10 2 1 3 1 0 0 0 23 0
VOLUMES 10 31 5 6 54 11 9 7 13 0 8 2 156 0 0 0 0 0 APPROACH % 22% 67% 11% 8% 76% 15% 31% 24% 45% 0% 80% 20%APP/DEPART 46 / 42 71 / 67 29 / 18 10 / 29 0 BEGIN PEAK HRVOLUMES 8 17 2 2 29 4 5 2 5 0 5 2 81 APPROACH % 30% 63% 7% 6% 83% 11% 42% 17% 42% 0% 71% 29%PEAK HR FACTOR 0.675 0.625 0.750 0.438 0.844 APP/DEPART 27 / 24 35 / 34 12 / 6 7 / 17 0
Riverside
NORTH SIDE
Agua Mansa WEST SIDE EAST SIDE Agua Mansa
SOUTH SIDE
Riverside
U-TURNSRiverside Riverside Agua Mansa Agua Mansa
AM
8:00 AM
PM
4:00 PM
INTERSECTION TURNING MOVEMENT COUNTSPREPARED BY: PACIFIC TRAFFIC DATA SERVICES

DATE: LOCATION: San Bernardino PROJECT #: SC03676/12/14 NORTH & SOUTH: Riverside LOCATION #: F
THURSDAY EAST & WEST: Agua Mansa CONTROL: SIGNAL
CLASS 4: NOTES: AM �4 OR MORE PM N
AXLE MD � W E �TRUCKS OTHER S
OTHER �
NORTHBOUND SOUTHBOUND EASTBOUND WESTBOUND
NL NT NR SL ST SR EL ET ER WL WT WR TOTAL NB SB EB WB TTLLANES: 1 2 0 1 2 1 1 1 1 1 1 1
7:00 AM 1 1 0 3 13 6 3 3 2 0 5 3 40 0 7:15 AM 2 1 2 1 5 5 3 3 3 1 1 0 27 0 7:30 AM 3 3 0 8 8 4 7 0 3 0 1 1 38 0 7:45 AM 7 5 1 5 3 11 7 2 3 0 3 3 50 0 8:00 AM 1 5 0 1 7 8 5 4 2 2 3 3 41 0 8:15 AM 2 0 1 2 5 10 4 3 4 1 3 4 39 0 8:30 AM 2 10 0 2 9 3 8 4 4 1 0 6 49 0 8:45 AM 5 7 0 5 8 4 6 0 1 0 9 0 45 0 9:00 AM 0 0 0 0 0 0 0 0 0 0 0 0 0 0 9:15 AM 0 0 0 0 0 0 0 0 0 0 0 0 0 0 9:30 AM 0 0 0 0 0 0 0 0 0 0 0 0 0 0 9:45 AM 0 0 0 0 0 0 0 0 0 0 0 0 0 0
VOLUMES 23 32 4 27 58 51 43 19 22 5 25 20 329 0 0 0 0 0 APPROACH % 39% 54% 7% 20% 43% 38% 51% 23% 26% 10% 50% 40%APP/DEPART 59 / 95 136 / 85 84 / 50 50 / 99 0 BEGIN PEAK HRVOLUMES 12 20 2 10 24 32 24 13 13 4 9 16 179 APPROACH % 35% 59% 6% 15% 36% 48% 48% 26% 26% 14% 31% 55%PEAK HR FACTOR 0.654 0.868 0.781 0.906 0.895 APP/DEPART 34 / 60 66 / 41 50 / 25 29 / 53 0
3:00 PM 0 0 0 0 0 0 0 0 0 0 0 0 0 0 3:15 PM 0 0 0 0 0 0 0 0 0 0 0 0 0 0 3:30 PM 0 0 0 0 0 0 0 0 0 0 0 0 0 0 3:45 PM 0 0 0 0 0 0 0 0 0 0 0 0 0 0 4:00 PM 1 1 1 3 0 5 4 1 3 0 0 1 20 0 4:15 PM 2 3 0 2 1 2 11 1 4 0 1 3 30 0 4:30 PM 2 2 0 1 0 3 5 1 2 0 1 1 18 0 4:45 PM 0 2 1 0 9 4 6 3 1 0 1 2 29 0 5:00 PM 0 2 0 1 3 3 7 3 2 0 3 0 24 0 5:15 PM 2 3 0 2 4 2 7 1 2 1 1 1 26 0 5:30 PM 2 2 0 1 5 1 7 1 1 1 1 2 24 0 5:45 PM 0 5 1 4 2 5 9 1 4 0 2 0 33 0
VOLUMES 9 20 3 14 24 25 56 12 19 2 10 10 204 0 0 0 0 0 APPROACH % 28% 63% 9% 22% 38% 40% 64% 14% 22% 9% 45% 45%APP/DEPART 32 / 86 63 / 45 87 / 29 22 / 44 0 BEGIN PEAK HRVOLUMES 4 12 1 8 14 11 30 6 9 2 7 3 107 APPROACH % 24% 71% 6% 24% 42% 33% 67% 13% 20% 17% 58% 25%PEAK HR FACTOR 0.708 0.750 0.804 0.750 0.811 APP/DEPART 17 / 45 33 / 25 45 / 15 12 / 22 0
Riverside
NORTH SIDE
Agua Mansa WEST SIDE EAST SIDE Agua Mansa
SOUTH SIDE
Riverside
U-TURNSRiverside Riverside Agua Mansa Agua Mansa
AM
7:45 AM
PM
5:00 PM
INTERSECTION TURNING MOVEMENT COUNTSPREPARED BY: PACIFIC TRAFFIC DATA SERVICES

DATE: LOCATION: San Bernardino PROJECT #: SC03676/12/14 NORTH & SOUTH: Riverside LOCATION #: F
THURSDAY EAST & WEST: Agua Mansa CONTROL: SIGNAL
CLASS 5: NOTES: AM �RV PM N
MD � W E �OTHER SOTHER �
NORTHBOUND SOUTHBOUND EASTBOUND WESTBOUND
NL NT NR SL ST SR EL ET ER WL WT WR TOTAL NB SB EB WB TTLLANES: 1 2 0 1 2 1 1 1 1 1 1 1
7:00 AM 0 0 0 0 0 0 0 0 0 0 0 0 0 0 7:15 AM 0 0 0 0 0 0 0 0 0 0 1 0 1 0 7:30 AM 0 0 0 0 0 0 0 0 0 0 0 0 0 0 7:45 AM 0 0 0 0 0 0 0 0 0 0 0 0 0 0 8:00 AM 0 0 0 0 0 0 0 0 0 0 0 0 0 0 8:15 AM 0 0 0 0 0 0 0 0 0 0 0 0 0 0 8:30 AM 0 0 0 0 0 0 0 0 0 0 1 0 1 0 8:45 AM 0 0 0 0 0 0 0 0 0 0 0 0 0 0 9:00 AM 0 0 0 0 0 0 0 0 0 0 0 0 0 0 9:15 AM 0 0 0 0 0 0 0 0 0 0 0 0 0 0 9:30 AM 0 0 0 0 0 0 0 0 0 0 0 0 0 0 9:45 AM 0 0 0 0 0 0 0 0 0 0 0 0 0 0
VOLUMES 0 0 0 0 0 0 0 0 0 0 2 0 2 0 0 0 0 0 APPROACH % 0% 0% 0% 0% 0% 0% 0% 0% 0% 0% 100% 0%APP/DEPART 0 / 0 0 / 0 0 / 0 2 / 2 0 BEGIN PEAK HRVOLUMES 0 0 0 0 0 0 0 0 0 0 1 0 1 APPROACH % 0% 0% 0% 0% 0% 0% 0% 0% 0% 0% 100% 0%PEAK HR FACTOR 0.000 0.000 0.000 0.250 0.250 APP/DEPART 0 / 0 0 / 0 0 / 0 1 / 1 0
3:00 PM 0 0 0 0 0 0 0 0 0 0 0 0 0 0 3:15 PM 0 0 0 0 0 0 0 0 0 0 0 0 0 0 3:30 PM 0 0 0 0 0 0 0 0 0 0 0 0 0 0 3:45 PM 0 0 0 0 0 0 0 0 0 0 0 0 0 0 4:00 PM 0 1 0 0 1 0 0 0 0 0 0 0 2 0 4:15 PM 0 0 0 0 0 0 0 0 0 0 0 0 0 0 4:30 PM 0 0 0 0 0 0 0 0 0 0 0 0 0 0 4:45 PM 0 0 0 0 0 0 0 0 0 0 0 0 0 0 5:00 PM 0 0 0 0 0 0 0 0 0 0 0 0 0 0 5:15 PM 0 0 0 0 0 0 0 0 0 0 0 0 0 0 5:30 PM 0 0 0 0 0 0 0 0 0 0 0 0 0 0 5:45 PM 0 0 0 0 0 0 0 0 0 0 0 0 0 0
VOLUMES 0 1 0 0 1 0 0 0 0 0 0 0 2 0 0 0 0 0 APPROACH % 0% 100% 0% 0% 100% 0% 0% 0% 0% 0% 0% 0%APP/DEPART 1 / 1 1 / 1 0 / 0 0 / 0 0 BEGIN PEAK HRVOLUMES 0 1 0 0 1 0 0 0 0 0 0 0 2 APPROACH % 0% 100% 0% 0% 100% 0% 0% 0% 0% 0% 0% 0%PEAK HR FACTOR 0.250 0.250 0.000 0.000 0.250 APP/DEPART 1 / 1 1 / 1 0 / 0 0 / 0 0
Riverside
NORTH SIDE
Agua Mansa WEST SIDE EAST SIDE Agua Mansa
SOUTH SIDE
Riverside
U-TURNSRiverside Riverside Agua Mansa Agua Mansa
AM
8:30 AM
PM
4:00 PM
INTERSECTION TURNING MOVEMENT COUNTSPREPARED BY: PACIFIC TRAFFIC DATA SERVICES

DATE: LOCATION: San Bernardino PROJECT #: SC03676/12/14 NORTH & SOUTH: Riverside LOCATION #: F
THURSDAY EAST & WEST: Agua Mansa CONTROL: SIGNAL
CLASS 6: NOTES: AM �PM N
BUSES MD � W E �OTHER SOTHER �
NORTHBOUND SOUTHBOUND EASTBOUND WESTBOUND
NL NT NR SL ST SR EL ET ER WL WT WR TOTAL NB SB EB WB TTLLANES: 1 2 0 1 2 1 1 1 1 1 1 1
7:00 AM 0 0 0 0 0 1 0 0 0 0 1 0 2 0 7:15 AM 0 0 0 0 0 1 0 0 0 0 0 1 2 0 7:30 AM 0 0 0 0 1 0 0 0 0 0 0 0 1 0 7:45 AM 0 0 0 0 0 0 1 0 0 0 1 0 2 0 8:00 AM 0 0 0 0 0 0 1 0 0 0 0 0 1 0 8:15 AM 0 0 0 0 0 0 0 0 0 0 0 0 0 0 8:30 AM 0 0 0 0 0 1 1 0 0 1 0 0 3 0 8:45 AM 0 0 0 0 0 0 1 0 0 0 0 0 1 0 9:00 AM 0 0 0 0 0 0 0 0 0 0 0 0 0 0 9:15 AM 0 0 0 0 0 0 0 0 0 0 0 0 0 0 9:30 AM 0 0 0 0 0 0 0 0 0 0 0 0 0 0 9:45 AM 0 0 0 0 0 0 0 0 0 0 0 0 0 0
VOLUMES 0 0 0 0 1 3 4 0 0 1 2 1 12 0 0 0 0 0 APPROACH % 0% 0% 0% 0% 25% 75% 100% 0% 0% 25% 50% 25%APP/DEPART 0 / 5 4 / 2 4 / 0 4 / 5 0 BEGIN PEAK HRVOLUMES 0 0 0 0 1 2 1 0 0 0 2 1 7 APPROACH % 0% 0% 0% 0% 33% 67% 100% 0% 0% 0% 67% 33%PEAK HR FACTOR 0.000 0.750 0.250 0.750 0.875 APP/DEPART 0 / 2 3 / 1 1 / 0 3 / 4 0
3:00 PM 0 0 0 0 0 0 0 0 0 0 0 0 0 0 3:15 PM 0 0 0 0 0 0 0 0 0 0 0 0 0 0 3:30 PM 0 0 0 0 0 0 0 0 0 0 0 0 0 0 3:45 PM 0 0 0 0 0 0 0 0 0 0 0 0 0 0 4:00 PM 0 0 0 0 0 0 0 0 0 0 0 0 0 0 4:15 PM 0 0 0 0 0 0 0 0 0 0 0 0 0 0 4:30 PM 0 0 0 0 0 0 0 0 0 0 0 0 0 0 4:45 PM 0 0 0 0 0 0 0 1 0 0 0 0 1 0 5:00 PM 0 0 0 0 0 0 0 0 0 0 0 0 0 0 5:15 PM 0 0 0 0 0 0 0 0 0 0 0 0 0 0 5:30 PM 0 0 0 0 0 0 0 0 0 0 0 0 0 0 5:45 PM 0 0 0 0 0 1 0 0 0 0 0 0 1 0
VOLUMES 0 0 0 0 0 1 0 1 0 0 0 0 2 0 0 0 0 0 APPROACH % 0% 0% 0% 0% 0% 100% 0% 100% 0% 0% 0% 0%APP/DEPART 0 / 0 1 / 0 1 / 1 0 / 1 0 BEGIN PEAK HRVOLUMES 0 0 0 0 0 1 1 2 1 0 0 0 5 APPROACH % 0% 0% 0% 0% 0% 100% 25% 50% 25% 0% 0% 0%PEAK HR FACTOR 0.000 0.250 1.000 0.000 1.250 APP/DEPART 0 / 1 1 / 1 4 / 2 0 / 1 0
Riverside
NORTH SIDE
Agua Mansa WEST SIDE EAST SIDE Agua Mansa
SOUTH SIDE
Riverside
U-TURNSRiverside Riverside Agua Mansa Agua Mansa
AM
7:00 AM
PM
4:00 PM
INTERSECTION TURNING MOVEMENT COUNTSPREPARED BY: PACIFIC TRAFFIC DATA SERVICES

DATE: LOCATION: PROJECT #: SC0399Thu, Jun 12, 14 NORTH & SOUTH: LOCATION #: F
EAST & WEST: CONTROL: SIGNAL
NOTES: AM �PM NMD � W E �
OTHER SOTHER �
NORTHBOUND SOUTHBOUND EASTBOUND WESTBOUND
NL NT NR SL ST SR EL ET ER WL WT WR TOTALLANES: 1 2 0 1 2 0 0 1 0 0.5 0.5 1
7:00 AM 34 179 11 15 215 50 35 39 14 16 70 16 691 7:15 AM 36 151 19 6 184 48 41 48 25 10 44 14 625 7:30 AM 32 193 22 30 225 38 44 44 16 14 51 8 714 7:45 AM 50 191 10 27 223 58 40 35 28 19 77 13 768 8:00 AM 33 202 12 15 176 54 38 51 19 18 43 17 676 8:15 AM 31 116 13 15 195 54 46 37 32 8 35 21 599 8:30 AM 24 158 21 21 154 32 48 40 30 17 27 21 591 8:45 AM 41 145 8 30 155 45 62 28 23 8 44 1 587 9:00 AM 0 0 0 0 0 0 0 0 0 0 0 0 0 9:15 AM 0 0 0 0 0 0 0 0 0 0 0 0 0 9:30 AM 0 0 0 0 0 0 0 0 0 0 0 0 0 9:45 AM 0 0 0 0 0 0 0 0 0 0 0 0 0
VOLUMES 280 1,333 114 157 1,525 377 352 320 186 109 390 109 5,248 APPROACH % 16% 77% 7% 8% 74% 18% 41% 37% 22% 18% 64% 18%APP/DEPART 1,726 / 1,794 2,058 / 1,819 857 / 590 607 / 1,046 0 BEGIN PEAK HRVOLUMES 152 713 61 78 846 193 159 165 82 59 241 50 2,797 APPROACH % 16% 77% 7% 7% 76% 17% 39% 41% 20% 17% 69% 14%PEAK HR FACTOR 0.922 0.909 0.893 0.808 0.910 APP/DEPART 926 / 921 1,117 / 987 406 / 304 349 / 586 0
03:00 PM 0 0 0 0 0 0 0 0 0 0 0 0 0 3:15 PM 0 0 0 0 0 0 0 0 0 0 0 0 0 3:30 PM 0 0 0 0 0 0 0 0 0 0 0 0 0 3:45 PM 0 0 0 0 0 0 0 0 0 0 0 0 0 4:00 PM 35 200 18 22 180 42 54 108 65 11 41 12 784 4:15 PM 35 201 17 23 210 30 50 87 33 12 28 13 736 4:30 PM 23 197 16 14 243 34 47 113 29 5 25 12 756 4:45 PM 25 216 18 9 251 32 52 125 24 5 34 13 802 5:00 PM 22 160 22 21 241 35 53 125 38 10 33 13 769 5:15 PM 27 223 12 16 253 38 45 123 29 15 45 1 825 5:30 PM 28 212 18 23 221 23 57 98 23 8 27 11 746 5:45 PM 14 222 28 17 213 39 58 86 32 12 24 3 746
VOLUMES 207 1,630 148 145 1,808 271 414 863 271 76 255 76 6,162 APPROACH % 10% 82% 7% 6% 81% 12% 27% 56% 18% 19% 63% 19%APP/DEPART 1,984 / 2,120 2,224 / 2,155 1,548 / 1,155 407 / 732 0 BEGIN PEAK HRVOLUMES 96 796 68 60 986 138 196 485 119 35 136 38 3,151 APPROACH % 10% 83% 7% 5% 83% 12% 25% 61% 15% 17% 65% 18%PEAK HR FACTOR 0.917 0.966 0.930 0.857 0.955 APP/DEPART 960 / 1,030 1,184 / 1,140 800 / 613 208 / 370 0
INTERSECTION TURNING MOVEMENT COUNTSPREPARED BY: AimTD LLC tel: 951 249 3226 [email protected]
San BernardinoRiversideAgua Mansa
Riverside Riverside Agua Mansa Agua Mansa
AM
7:00 AM
PM
4:30 PM
PCE ADJUSTED

Appendix B
Existing Conditions Intersection Analysis Worksheets

EX (AM) Tue May 12, 2015 14:31:39 Page 2-1 -------------------------------------------------------------------------------- AGUA MANSA HIGH CUBE WAREHOUSE COUNTY OF SAN BERNARDINO EXISTING CONDITIONS -------------------------------------------------------------------------------- Level Of Service Computation Report 2000 HCM Operations Method (Base Volume Alternative) ********************************************************************************Intersection #1 CEDAR AVENUE (NS) AT EL RAVINO ROAD (EW) ********************************************************************************Cycle (sec): 110 Critical Vol./Cap.(X): 0.274Loss Time (sec): 8 Average Delay (sec/veh): 17.3Optimal Cycle: OPTIMIZED Level Of Service: B********************************************************************************Approach: North Bound South Bound East Bound West Bound Movement: L - T - R L - T - R L - T - R L - T - R ------------|---------------||---------------||---------------||---------------|Control: Protected Protected Permitted Permitted Rights: Include Include Include Include Min. Green: 10 0 0 10 23 23 10 14 14 10 24 24 Y+R: 4.0 4.0 4.0 4.0 4.0 4.0 4.0 4.0 4.0 4.0 4.0 4.0 Lanes: 1 0 1 1 0 1 0 1 1 0 0 0 1! 0 0 0 1 0 0 1 ------------|---------------||---------------||---------------||---------------|Volume Module:Base Vol: 10 443 47 87 652 6 3 1 6 50 2 39 Growth Adj: 1.00 1.00 1.00 1.00 1.00 1.00 1.00 1.00 1.00 1.00 1.00 1.00 Initial Bse: 10 443 47 87 652 6 3 1 6 50 2 39 User Adj: 1.00 1.00 1.00 1.00 1.00 1.00 1.00 1.00 1.00 1.00 1.00 1.00 PHF Adj: 0.90 0.90 0.90 0.90 0.90 0.90 0.90 0.90 0.90 0.90 0.90 0.90 PHF Volume: 11 491 52 96 723 7 3 1 7 55 2 43 Reduct Vol: 0 0 0 0 0 0 0 0 0 0 0 0 Reduced Vol: 11 491 52 96 723 7 3 1 7 55 2 43 PCE Adj: 1.00 1.00 1.00 1.00 1.00 1.00 1.00 1.00 1.00 1.00 1.00 1.00 MLF Adj: 1.00 1.00 1.00 1.00 1.00 1.00 1.00 1.00 1.00 1.00 1.00 1.00 FinalVolume: 11 491 52 96 723 7 3 1 7 55 2 43 ------------|---------------||---------------||---------------||---------------|Saturation Flow Module:Sat/Lane: 1800 1800 1800 1800 1800 1800 1800 1800 1800 1800 1800 1800 Adjustment: 0.90 0.99 0.99 0.90 1.00 1.00 0.83 0.88 0.88 0.71 0.76 0.85 Lanes: 1.00 1.81 0.19 1.00 1.98 0.02 0.31 0.10 0.59 0.96 0.04 1.00 Final Sat.: 1615 3209 340 1615 3564 33 466 155 932 1240 50 1530 ------------|---------------||---------------||---------------||---------------|Capacity Analysis Module:Vol/Sat: 0.01 0.15 0.15 0.06 0.20 0.20 0.01 0.01 0.01 0.04 0.04 0.03 Crit Moves: **** **** **** Green/Cycle: 0.09 0.44 0.44 0.26 0.62 0.62 0.22 0.22 0.22 0.22 0.22 0.22 Volume/Cap: 0.08 0.34 0.34 0.23 0.33 0.33 0.03 0.03 0.03 0.20 0.20 0.13 Delay/Veh: 46.0 20.1 20.1 31.9 10.1 10.1 33.9 33.9 33.9 35.6 35.6 34.8 User DelAdj: 1.00 1.00 1.00 1.00 1.00 1.00 1.00 1.00 1.00 1.00 1.00 1.00 AdjDel/Veh: 46.0 20.1 20.1 31.9 10.1 10.1 33.9 33.9 33.9 35.6 35.6 34.8 LOS by Move: D C C C B B C C C D D C HCM2kAvgQ: 0 6 6 3 6 6 0 0 0 2 2 1 ********************************************************************************Note: Queue reported is the number of cars per lane.********************************************************************************
Traffix 8.0.0715 (c) 2008 Dowling Assoc. Licensed to RK ENGINEERING GROUP

EX (PM) Tue May 12, 2015 14:32:24 Page 2-1 -------------------------------------------------------------------------------- AGUA MANSA HIGH CUBE WAREHOUSE COUNTY OF SAN BERNARDINO EXISTING CONDITIONS -------------------------------------------------------------------------------- Level Of Service Computation Report 2000 HCM Operations Method (Base Volume Alternative) ********************************************************************************Intersection #1 CEDAR AVENUE (NS) AT EL RAVINO ROAD (EW) ********************************************************************************Cycle (sec): 105 Critical Vol./Cap.(X): 0.295Loss Time (sec): 8 Average Delay (sec/veh): 17.3Optimal Cycle: OPTIMIZED Level Of Service: B********************************************************************************Approach: North Bound South Bound East Bound West Bound Movement: L - T - R L - T - R L - T - R L - T - R ------------|---------------||---------------||---------------||---------------|Control: Protected Protected Permitted Permitted Rights: Include Include Include Include Min. Green: 10 0 0 10 23 23 10 14 14 10 24 24 Y+R: 4.0 4.0 4.0 4.0 4.0 4.0 4.0 4.0 4.0 4.0 4.0 4.0 Lanes: 1 0 1 1 0 1 0 1 1 0 0 0 1! 0 0 0 1 0 0 1 ------------|---------------||---------------||---------------||---------------|Volume Module:Base Vol: 7 669 56 67 702 8 9 7 14 45 12 88 Growth Adj: 1.00 1.00 1.00 1.00 1.00 1.00 1.00 1.00 1.00 1.00 1.00 1.00 Initial Bse: 7 669 56 67 702 8 9 7 14 45 12 88 User Adj: 1.00 1.00 1.00 1.00 1.00 1.00 1.00 1.00 1.00 1.00 1.00 1.00 PHF Adj: 0.95 0.95 0.95 0.95 0.95 0.95 0.95 0.95 0.95 0.95 0.95 0.95 PHF Volume: 7 702 59 70 737 8 9 7 15 47 13 92 Reduct Vol: 0 0 0 0 0 0 0 0 0 0 0 0 Reduced Vol: 7 702 59 70 737 8 9 7 15 47 13 92 PCE Adj: 1.00 1.00 1.00 1.00 1.00 1.00 1.00 1.00 1.00 1.00 1.00 1.00 MLF Adj: 1.00 1.00 1.00 1.00 1.00 1.00 1.00 1.00 1.00 1.00 1.00 1.00 FinalVolume: 7 702 59 70 737 8 9 7 15 47 13 92 ------------|---------------||---------------||---------------||---------------|Saturation Flow Module:Sat/Lane: 1800 1800 1800 1800 1800 1800 1800 1800 1800 1800 1800 1800 Adjustment: 0.90 0.99 0.99 0.90 1.00 1.00 0.83 0.88 0.88 0.75 0.79 0.85 Lanes: 1.00 1.85 0.15 1.00 1.98 0.02 0.31 0.23 0.46 0.80 0.20 1.00 Final Sat.: 1615 3282 275 1615 3552 40 467 364 727 1076 287 1530 ------------|---------------||---------------||---------------||---------------|Capacity Analysis Module:Vol/Sat: 0.00 0.21 0.21 0.04 0.21 0.21 0.02 0.02 0.02 0.04 0.04 0.06 Crit Moves: **** **** ****Green/Cycle: 0.10 0.48 0.48 0.21 0.60 0.60 0.23 0.23 0.23 0.23 0.23 0.23 Volume/Cap: 0.05 0.44 0.44 0.20 0.35 0.35 0.09 0.09 0.09 0.19 0.19 0.26 Delay/Veh: 43.3 18.2 18.2 34.2 10.7 10.7 32.0 32.0 32.0 33.0 33.0 33.7 User DelAdj: 1.00 1.00 1.00 1.00 1.00 1.00 1.00 1.00 1.00 1.00 1.00 1.00 AdjDel/Veh: 43.3 18.2 18.2 34.2 10.7 10.7 32.0 32.0 32.0 33.0 33.0 33.7 LOS by Move: D B B C B B C C C C C C HCM2kAvgQ: 0 8 8 2 6 6 1 1 1 2 2 3 ********************************************************************************Note: Queue reported is the number of cars per lane.********************************************************************************
Traffix 8.0.0715 (c) 2008 Dowling Assoc. Licensed to RK ENGINEERING GROUP

EX (AM) Tue May 12, 2015 14:31:39 Page 3-1 -------------------------------------------------------------------------------- AGUA MANSA HIGH CUBE WAREHOUSE COUNTY OF SAN BERNARDINO EXISTING CONDITIONS -------------------------------------------------------------------------------- Level Of Service Computation Report 2000 HCM Operations Method (Base Volume Alternative) ********************************************************************************Intersection #2 CACTUS AVENUE (NS) AT EL RAVINO ROAD (EW) ********************************************************************************Cycle (sec): 60 Critical Vol./Cap.(X): 0.174Loss Time (sec): 8 Average Delay (sec/veh): 12.2Optimal Cycle: OPTIMIZED Level Of Service: B********************************************************************************Approach: North Bound South Bound East Bound West Bound Movement: L - T - R L - T - R L - T - R L - T - R ------------|---------------||---------------||---------------||---------------|Control: Protected Protected Protected Permitted Rights: Include Include Include Include Min. Green: 0 0 0 10 0 0 10 0 0 0 0 0 Y+R: 4.0 4.0 4.0 4.0 4.0 4.0 4.0 4.0 4.0 4.0 4.0 4.0 Lanes: 0 0 0 0 0 1 0 0 0 1 0 1 0 0 0 0 0 0 1 0 ------------|---------------||---------------||---------------||---------------|Volume Module:Base Vol: 0 0 0 25 0 31 19 68 0 0 81 20 Growth Adj: 1.00 1.00 1.00 1.00 1.00 1.00 1.00 1.00 1.00 1.00 1.00 1.00 Initial Bse: 0 0 0 25 0 31 19 68 0 0 81 20 User Adj: 1.00 1.00 1.00 1.00 1.00 1.00 1.00 1.00 1.00 1.00 1.00 1.00 PHF Adj: 0.81 0.81 0.81 0.81 0.81 0.81 0.81 0.81 0.81 0.81 0.81 0.81 PHF Volume: 0 0 0 31 0 38 23 84 0 0 100 25 Reduct Vol: 0 0 0 0 0 0 0 0 0 0 0 0 Reduced Vol: 0 0 0 31 0 38 23 84 0 0 100 25 PCE Adj: 1.00 1.00 1.00 1.00 1.00 1.00 1.00 1.00 1.00 1.00 1.00 1.00 MLF Adj: 1.00 1.00 1.00 1.00 1.00 1.00 1.00 1.00 1.00 1.00 1.00 1.00 FinalVolume: 0 0 0 31 0 38 23 84 0 0 100 25 ------------|---------------||---------------||---------------||---------------|Saturation Flow Module:Sat/Lane: 1800 1800 1800 1800 1800 1800 1800 1800 1800 1800 1800 1800 Adjustment: 0.94 1.00 1.00 0.90 1.00 0.85 0.93 0.99 1.00 0.94 0.97 0.97 Lanes: 0.00 0.00 0.00 1.00 0.00 1.00 0.23 0.77 0.00 0.00 0.80 0.20 Final Sat.: 0 0 0 1615 0 1530 384 1374 0 0 1405 347 ------------|---------------||---------------||---------------||---------------|Capacity Analysis Module:Vol/Sat: 0.00 0.00 0.00 0.02 0.00 0.02 0.06 0.06 0.00 0.00 0.07 0.07 Crit Moves: **** **** **** Green/Cycle: 0.00 0.00 0.00 0.17 0.00 0.17 0.32 0.70 0.00 0.00 0.38 0.38 Volume/Cap: 0.00 0.00 0.00 0.11 0.00 0.15 0.19 0.09 0.00 0.00 0.19 0.19 Delay/Veh: 0.0 0.0 0.0 21.4 0.0 21.6 14.8 2.9 0.0 0.0 12.7 12.7 User DelAdj: 1.00 1.00 1.00 1.00 1.00 1.00 1.00 1.00 1.00 1.00 1.00 1.00 AdjDel/Veh: 0.0 0.0 0.0 21.4 0.0 21.6 14.8 2.9 0.0 0.0 12.7 12.7 LOS by Move: A A A C A C B A A A B B HCM2kAvgQ: 0 0 0 1 0 1 1 1 0 0 2 2 ********************************************************************************Note: Queue reported is the number of cars per lane.********************************************************************************
Traffix 8.0.0715 (c) 2008 Dowling Assoc. Licensed to RK ENGINEERING GROUP

EX (PM) Tue May 12, 2015 14:32:24 Page 3-1 -------------------------------------------------------------------------------- AGUA MANSA HIGH CUBE WAREHOUSE COUNTY OF SAN BERNARDINO EXISTING CONDITIONS -------------------------------------------------------------------------------- Level Of Service Computation Report 2000 HCM Operations Method (Base Volume Alternative) ********************************************************************************Intersection #2 CACTUS AVENUE (NS) AT EL RAVINO ROAD (EW) ********************************************************************************Cycle (sec): 60 Critical Vol./Cap.(X): 0.243Loss Time (sec): 8 Average Delay (sec/veh): 11.6Optimal Cycle: OPTIMIZED Level Of Service: B********************************************************************************Approach: North Bound South Bound East Bound West Bound Movement: L - T - R L - T - R L - T - R L - T - R ------------|---------------||---------------||---------------||---------------|Control: Protected Protected Protected Permitted Rights: Include Include Include Include Min. Green: 0 0 0 10 0 0 10 0 0 0 0 0 Y+R: 4.0 4.0 4.0 4.0 4.0 4.0 4.0 4.0 4.0 4.0 4.0 4.0 Lanes: 0 0 0 0 0 1 0 0 0 1 0 1 0 0 0 0 0 0 1 0 ------------|---------------||---------------||---------------||---------------|Volume Module:Base Vol: 0 0 0 14 0 26 41 99 0 0 97 53 Growth Adj: 1.00 1.00 1.00 1.00 1.00 1.00 1.00 1.00 1.00 1.00 1.00 1.00 Initial Bse: 0 0 0 14 0 26 41 99 0 0 97 53 User Adj: 1.00 1.00 1.00 1.00 1.00 1.00 1.00 1.00 1.00 1.00 1.00 1.00 PHF Adj: 0.84 0.84 0.84 0.84 0.84 0.84 0.84 0.84 0.84 0.84 0.84 0.84 PHF Volume: 0 0 0 17 0 31 49 118 0 0 116 63 Reduct Vol: 0 0 0 0 0 0 0 0 0 0 0 0 Reduced Vol: 0 0 0 17 0 31 49 118 0 0 116 63 PCE Adj: 1.00 1.00 1.00 1.00 1.00 1.00 1.00 1.00 1.00 1.00 1.00 1.00 MLF Adj: 1.00 1.00 1.00 1.00 1.00 1.00 1.00 1.00 1.00 1.00 1.00 1.00 FinalVolume: 0 0 0 17 0 31 49 118 0 0 116 63 ------------|---------------||---------------||---------------||---------------|Saturation Flow Module:Sat/Lane: 1800 1800 1800 1800 1800 1800 1800 1800 1800 1800 1800 1800 Adjustment: 0.94 1.00 1.00 0.90 1.00 0.85 0.93 0.99 1.00 0.94 0.95 0.95 Lanes: 0.00 0.00 0.00 1.00 0.00 1.00 0.30 0.70 0.00 0.00 0.65 0.35 Final Sat.: 0 0 0 1615 0 1530 511 1234 0 0 1108 605 ------------|---------------||---------------||---------------||---------------|Capacity Analysis Module:Vol/Sat: 0.00 0.00 0.00 0.01 0.00 0.02 0.10 0.10 0.00 0.00 0.10 0.10 Crit Moves: **** **** **** Green/Cycle: 0.00 0.00 0.00 0.17 0.00 0.17 0.33 0.70 0.00 0.00 0.37 0.37 Volume/Cap: 0.00 0.00 0.00 0.06 0.00 0.12 0.29 0.14 0.00 0.00 0.29 0.29 Delay/Veh: 0.0 0.0 0.0 21.1 0.0 21.5 14.9 3.0 0.0 0.0 13.8 13.8 User DelAdj: 1.00 1.00 1.00 1.00 1.00 1.00 1.00 1.00 1.00 1.00 1.00 1.00 AdjDel/Veh: 0.0 0.0 0.0 21.1 0.0 21.5 14.9 3.0 0.0 0.0 13.8 13.8 LOS by Move: A A A C A C B A A A B B HCM2kAvgQ: 0 0 0 0 0 1 1 1 0 0 3 3 ********************************************************************************Note: Queue reported is the number of cars per lane.********************************************************************************
Traffix 8.0.0715 (c) 2008 Dowling Assoc. Licensed to RK ENGINEERING GROUP

EX (AM) Tue May 12, 2015 14:31:39 Page 4-1 -------------------------------------------------------------------------------- AGUA MANSA HIGH CUBE WAREHOUSE COUNTY OF SAN BERNARDINO EXISTING CONDITIONS -------------------------------------------------------------------------------- Level Of Service Computation Report 2000 HCM Unsignalized Method (Base Volume Alternative) ********************************************************************************Intersection #3 HALL AVENUE (NS) AT EL RAVINO ROAD (EW) ********************************************************************************Average Delay (sec/veh): 2.2 Worst Case Level Of Service: B[ 10.0]********************************************************************************Approach: North Bound South Bound East Bound West Bound Movement: L - T - R L - T - R L - T - R L - T - R ------------|---------------||---------------||---------------||---------------|Control: Stop Sign Stop Sign Uncontrolled UncontrolledRights: Include Include Include Include Lanes: 0 0 1! 0 0 0 0 1! 0 0 0 0 1! 0 0 0 0 1! 0 0 ------------|---------------||---------------||---------------||---------------|Volume Module:Base Vol: 17 1 14 12 3 4 4 83 27 1 80 3 Growth Adj: 1.00 1.00 1.00 1.00 1.00 1.00 1.00 1.00 1.00 1.00 1.00 1.00 Initial Bse: 17 1 14 12 3 4 4 83 27 1 80 3 User Adj: 1.00 1.00 1.00 1.00 1.00 1.00 1.00 1.00 1.00 1.00 1.00 1.00 PHF Adj: 0.83 0.83 0.83 0.83 0.83 0.83 0.83 0.83 0.83 0.83 0.83 0.83 PHF Volume: 21 1 17 15 4 5 5 101 33 1 97 4 Reduct Vol: 0 0 0 0 0 0 0 0 0 0 0 0 FinalVolume: 21 1 17 15 4 5 5 101 33 1 97 4 ------------|---------------||---------------||---------------||---------------|Critical Gap Module:Critical Gp: 7.1 6.5 6.2 7.1 6.5 6.2 4.1 xxxx xxxxx 4.1 xxxx xxxxx FollowUpTim: 3.5 4.0 3.3 3.5 4.0 3.3 2.2 xxxx xxxxx 2.2 xxxx xxxxx ------------|---------------||---------------||---------------||---------------|Capacity Module:Cnflict Vol: 232 230 117 237 244 99 101 xxxx xxxxx 133 xxxx xxxxx Potent Cap.: 727 674 941 722 661 963 1505 xxxx xxxxx 1464 xxxx xxxxx Move Cap.: 718 671 941 705 658 963 1505 xxxx xxxxx 1464 xxxx xxxxx Volume/Cap: 0.03 0.00 0.02 0.02 0.01 0.01 0.00 xxxx xxxx 0.00 xxxx xxxx ------------|---------------||---------------||---------------||---------------|Level Of Service Module:2Way95thQ: xxxx xxxx xxxxx xxxx xxxx xxxxx 0.0 xxxx xxxxx 0.0 xxxx xxxxx Control Del:xxxxx xxxx xxxxx xxxxx xxxx xxxxx 7.4 xxxx xxxxx 7.5 xxxx xxxxx LOS by Move: * * * * * * A * * A * * Movement: LT - LTR - RT LT - LTR - RT LT - LTR - RT LT - LTR - RT Shared Cap.: xxxx 799 xxxxx xxxx 739 xxxxx xxxx xxxx xxxxx xxxx xxxx xxxxx SharedQueue:xxxxx 0.2 xxxxx xxxxx 0.1 xxxxx xxxxx xxxx xxxxx xxxxx xxxx xxxxx Shrd ConDel:xxxxx 9.7 xxxxx xxxxx 10.0 xxxxx xxxxx xxxx xxxxx xxxxx xxxx xxxxx Shared LOS: * A * * B * * * * * * * ApproachDel: 9.7 10.0 xxxxxx xxxxxxApproachLOS: A B * * ********************************************************************************Note: Queue reported is the number of cars per lane.********************************************************************************
Traffix 8.0.0715 (c) 2008 Dowling Assoc. Licensed to RK ENGINEERING GROUP

EX (PM) Tue May 12, 2015 14:32:24 Page 4-1 -------------------------------------------------------------------------------- AGUA MANSA HIGH CUBE WAREHOUSE COUNTY OF SAN BERNARDINO EXISTING CONDITIONS -------------------------------------------------------------------------------- Level Of Service Computation Report 2000 HCM Unsignalized Method (Base Volume Alternative) ********************************************************************************Intersection #3 HALL AVENUE (NS) AT EL RAVINO ROAD (EW) ********************************************************************************Average Delay (sec/veh): 2.6 Worst Case Level Of Service: B[ 10.8]********************************************************************************Approach: North Bound South Bound East Bound West Bound Movement: L - T - R L - T - R L - T - R L - T - R ------------|---------------||---------------||---------------||---------------|Control: Stop Sign Stop Sign Uncontrolled UncontrolledRights: Include Include Include Include Lanes: 0 0 1! 0 0 0 0 1! 0 0 0 0 1! 0 0 0 0 0 1 0 ------------|---------------||---------------||---------------||---------------|Volume Module:Base Vol: 45 4 5 9 4 1 5 89 13 0 110 15 Growth Adj: 1.00 1.00 1.00 1.00 1.00 1.00 1.00 1.00 1.00 1.00 1.00 1.00 Initial Bse: 45 4 5 9 4 1 5 89 13 0 110 15 User Adj: 1.00 1.00 1.00 1.00 1.00 1.00 1.00 1.00 1.00 1.00 1.00 1.00 PHF Adj: 0.83 0.83 0.83 0.83 0.83 0.83 0.83 0.83 0.83 0.83 0.83 0.83 PHF Volume: 54 5 6 11 5 1 6 108 16 0 133 18 Reduct Vol: 0 0 0 0 0 0 0 0 0 0 0 0 FinalVolume: 54 5 6 11 5 1 6 108 16 0 133 18 ------------|---------------||---------------||---------------||---------------|Critical Gap Module:Critical Gp: 7.1 6.5 6.2 7.1 6.5 6.2 4.1 xxxx xxxxx xxxxx xxxx xxxxx FollowUpTim: 3.5 4.0 3.3 3.5 4.0 3.3 2.2 xxxx xxxxx xxxxx xxxx xxxxx ------------|---------------||---------------||---------------||---------------|Capacity Module:Cnflict Vol: 273 279 116 275 278 142 151 xxxx xxxxx xxxx xxxx xxxxx Potent Cap.: 684 632 942 681 633 911 1442 xxxx xxxxx xxxx xxxx xxxxx Move Cap.: 676 630 942 671 631 911 1442 xxxx xxxxx xxxx xxxx xxxxx Volume/Cap: 0.08 0.01 0.01 0.02 0.01 0.00 0.00 xxxx xxxx xxxx xxxx xxxx ------------|---------------||---------------||---------------||---------------|Level Of Service Module:2Way95thQ: xxxx xxxx xxxxx xxxx xxxx xxxxx 0.0 xxxx xxxxx xxxx xxxx xxxxx Control Del:xxxxx xxxx xxxxx xxxxx xxxx xxxxx 7.5 xxxx xxxxx xxxxx xxxx xxxxx LOS by Move: * * * * * * A * * * * * Movement: LT - LTR - RT LT - LTR - RT LT - LTR - RT LT - LTR - RT Shared Cap.: xxxx 691 xxxxx xxxx 671 xxxxx xxxx xxxx xxxxx xxxx xxxx xxxxx SharedQueue:xxxxx 0.3 xxxxx xxxxx 0.1 xxxxx xxxxx xxxx xxxxx xxxxx xxxx xxxxx Shrd ConDel:xxxxx 10.8 xxxxx xxxxx 10.5 xxxxx xxxxx xxxx xxxxx xxxxx xxxx xxxxx Shared LOS: * B * * B * * * * * * * ApproachDel: 10.8 10.5 xxxxxx xxxxxxApproachLOS: B B * * ********************************************************************************Note: Queue reported is the number of cars per lane.********************************************************************************
Traffix 8.0.0715 (c) 2008 Dowling Assoc. Licensed to RK ENGINEERING GROUP

EX (AM) Tue May 12, 2015 14:31:39 Page 5-1 -------------------------------------------------------------------------------- AGUA MANSA HIGH CUBE WAREHOUSE COUNTY OF SAN BERNARDINO EXISTING CONDITIONS -------------------------------------------------------------------------------- Level Of Service Computation Report 2000 HCM Unsignalized Method (Base Volume Alternative) ********************************************************************************Intersection #4 KININGHAM DRIVE (NS) AT EL RAVINO ROAD (EW) ********************************************************************************Average Delay (sec/veh): 0.3 Worst Case Level Of Service: A[ 9.4]********************************************************************************Approach: North Bound South Bound East Bound West Bound Movement: L - T - R L - T - R L - T - R L - T - R ------------|---------------||---------------||---------------||---------------|Control: Stop Sign Stop Sign Uncontrolled UncontrolledRights: Include Include Include Include Lanes: 0 0 0 0 0 0 0 1! 0 0 0 1 0 0 0 0 0 0 1 0 ------------|---------------||---------------||---------------||---------------|Volume Module:Base Vol: 0 0 0 2 0 1 3 90 0 0 77 1 Growth Adj: 1.00 1.00 1.00 1.00 1.00 1.00 1.00 1.00 1.00 1.00 1.00 1.00 Initial Bse: 0 0 0 2 0 1 3 90 0 0 77 1 User Adj: 1.00 1.00 1.00 1.00 1.00 1.00 1.00 1.00 1.00 1.00 1.00 1.00 PHF Adj: 0.79 0.79 0.79 0.79 0.79 0.79 0.79 0.79 0.79 0.79 0.79 0.79 PHF Volume: 0 0 0 3 0 1 4 114 0 0 97 1 Reduct Vol: 0 0 0 0 0 0 0 0 0 0 0 0 FinalVolume: 0 0 0 3 0 1 4 114 0 0 97 1 ------------|---------------||---------------||---------------||---------------|Critical Gap Module:Critical Gp:xxxxx xxxx xxxxx 6.4 6.5 6.2 4.1 xxxx xxxxx xxxxx xxxx xxxxx FollowUpTim:xxxxx xxxx xxxxx 3.5 4.0 3.3 2.2 xxxx xxxxx xxxxx xxxx xxxxx ------------|---------------||---------------||---------------||---------------|Capacity Module:Cnflict Vol: xxxx xxxx xxxxx 219 219 98 99 xxxx xxxxx xxxx xxxx xxxxx Potent Cap.: xxxx xxxx xxxxx 773 682 964 1507 xxxx xxxxx xxxx xxxx xxxxx Move Cap.: xxxx xxxx xxxxx 772 681 964 1507 xxxx xxxxx xxxx xxxx xxxxx Volume/Cap: xxxx xxxx xxxx 0.00 0.00 0.00 0.00 xxxx xxxx xxxx xxxx xxxx ------------|---------------||---------------||---------------||---------------|Level Of Service Module:2Way95thQ: xxxx xxxx xxxxx xxxx xxxx xxxxx 0.0 xxxx xxxxx xxxx xxxx xxxxx Control Del:xxxxx xxxx xxxxx xxxxx xxxx xxxxx 7.4 xxxx xxxxx xxxxx xxxx xxxxx LOS by Move: * * * * * * A * * * * * Movement: LT - LTR - RT LT - LTR - RT LT - LTR - RT LT - LTR - RT Shared Cap.: xxxx xxxx xxxxx xxxx 827 xxxxx xxxx xxxx xxxxx xxxx xxxx xxxxx SharedQueue:xxxxx xxxx xxxxx xxxxx 0.0 xxxxx 0.0 xxxx xxxxx xxxxx xxxx xxxxx Shrd ConDel:xxxxx xxxx xxxxx xxxxx 9.4 xxxxx 7.4 xxxx xxxxx xxxxx xxxx xxxxx Shared LOS: * * * * A * A * * * * * ApproachDel: xxxxxx 9.4 xxxxxx xxxxxxApproachLOS: * A * * ********************************************************************************Note: Queue reported is the number of cars per lane.********************************************************************************
Traffix 8.0.0715 (c) 2008 Dowling Assoc. Licensed to RK ENGINEERING GROUP

EX (PM) Tue May 12, 2015 14:32:24 Page 5-1 -------------------------------------------------------------------------------- AGUA MANSA HIGH CUBE WAREHOUSE COUNTY OF SAN BERNARDINO EXISTING CONDITIONS -------------------------------------------------------------------------------- Level Of Service Computation Report 2000 HCM Unsignalized Method (Base Volume Alternative) ********************************************************************************Intersection #4 KININGHAM DRIVE (NS) AT EL RAVINO ROAD (EW) ********************************************************************************Average Delay (sec/veh): 0.9 Worst Case Level Of Service: A[ 9.0]********************************************************************************Approach: North Bound South Bound East Bound West Bound Movement: L - T - R L - T - R L - T - R L - T - R ------------|---------------||---------------||---------------||---------------|Control: Stop Sign Stop Sign Uncontrolled UncontrolledRights: Include Include Include Include Lanes: 0 0 0 0 0 0 0 1! 0 0 0 1 0 0 0 0 0 0 1 0 ------------|---------------||---------------||---------------||---------------|Volume Module:Base Vol: 0 0 0 2 0 9 12 96 0 0 93 10 Growth Adj: 1.00 1.00 1.00 1.00 1.00 1.00 1.00 1.00 1.00 1.00 1.00 1.00 Initial Bse: 0 0 0 2 0 9 12 96 0 0 93 10 User Adj: 1.00 1.00 1.00 1.00 1.00 1.00 1.00 1.00 1.00 1.00 1.00 1.00 PHF Adj: 0.89 0.89 0.89 0.89 0.89 0.89 0.89 0.89 0.89 0.89 0.89 0.89 PHF Volume: 0 0 0 2 0 10 13 107 0 0 104 11 Reduct Vol: 0 0 0 0 0 0 0 0 0 0 0 0 FinalVolume: 0 0 0 2 0 10 13 107 0 0 104 11 ------------|---------------||---------------||---------------||---------------|Critical Gap Module:Critical Gp:xxxxx xxxx xxxxx 6.4 6.5 6.2 4.1 xxxx xxxxx xxxxx xxxx xxxxx FollowUpTim:xxxxx xxxx xxxxx 3.5 4.0 3.3 2.2 xxxx xxxxx xxxxx xxxx xxxxx ------------|---------------||---------------||---------------||---------------|Capacity Module:Cnflict Vol: xxxx xxxx xxxxx 244 244 110 115 xxxx xxxxx xxxx xxxx xxxxx Potent Cap.: xxxx xxxx xxxxx 749 662 949 1486 xxxx xxxxx xxxx xxxx xxxxx Move Cap.: xxxx xxxx xxxxx 744 655 949 1486 xxxx xxxxx xxxx xxxx xxxxx Volume/Cap: xxxx xxxx xxxx 0.00 0.00 0.01 0.01 xxxx xxxx xxxx xxxx xxxx ------------|---------------||---------------||---------------||---------------|Level Of Service Module:2Way95thQ: xxxx xxxx xxxxx xxxx xxxx xxxxx 0.0 xxxx xxxxx xxxx xxxx xxxxx Control Del:xxxxx xxxx xxxxx xxxxx xxxx xxxxx 7.4 xxxx xxxxx xxxxx xxxx xxxxx LOS by Move: * * * * * * A * * * * * Movement: LT - LTR - RT LT - LTR - RT LT - LTR - RT LT - LTR - RT Shared Cap.: xxxx xxxx xxxxx xxxx 904 xxxxx xxxx xxxx xxxxx xxxx xxxx xxxxx SharedQueue:xxxxx xxxx xxxxx xxxxx 0.0 xxxxx 0.0 xxxx xxxxx xxxxx xxxx xxxxx Shrd ConDel:xxxxx xxxx xxxxx xxxxx 9.0 xxxxx 7.4 xxxx xxxxx xxxxx xxxx xxxxx Shared LOS: * * * * A * A * * * * * ApproachDel: xxxxxx 9.0 xxxxxx xxxxxxApproachLOS: * A * * ********************************************************************************Note: Queue reported is the number of cars per lane.********************************************************************************
Traffix 8.0.0715 (c) 2008 Dowling Assoc. Licensed to RK ENGINEERING GROUP
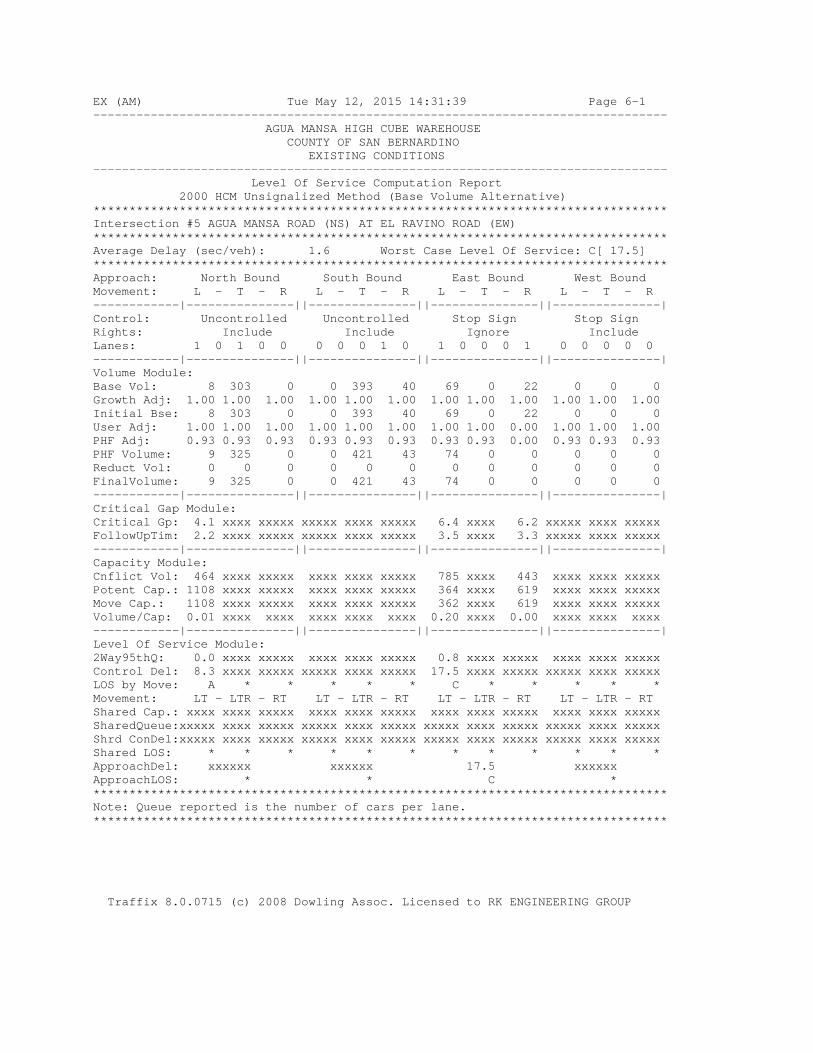
EX (AM) Tue May 12, 2015 14:31:39 Page 6-1 -------------------------------------------------------------------------------- AGUA MANSA HIGH CUBE WAREHOUSE COUNTY OF SAN BERNARDINO EXISTING CONDITIONS -------------------------------------------------------------------------------- Level Of Service Computation Report 2000 HCM Unsignalized Method (Base Volume Alternative) ********************************************************************************Intersection #5 AGUA MANSA ROAD (NS) AT EL RAVINO ROAD (EW) ********************************************************************************Average Delay (sec/veh): 1.6 Worst Case Level Of Service: C[ 17.5]********************************************************************************Approach: North Bound South Bound East Bound West Bound Movement: L - T - R L - T - R L - T - R L - T - R ------------|---------------||---------------||---------------||---------------|Control: Uncontrolled Uncontrolled Stop Sign Stop Sign Rights: Include Include Ignore Include Lanes: 1 0 1 0 0 0 0 0 1 0 1 0 0 0 1 0 0 0 0 0 ------------|---------------||---------------||---------------||---------------|Volume Module:Base Vol: 8 303 0 0 393 40 69 0 22 0 0 0 Growth Adj: 1.00 1.00 1.00 1.00 1.00 1.00 1.00 1.00 1.00 1.00 1.00 1.00 Initial Bse: 8 303 0 0 393 40 69 0 22 0 0 0 User Adj: 1.00 1.00 1.00 1.00 1.00 1.00 1.00 1.00 0.00 1.00 1.00 1.00 PHF Adj: 0.93 0.93 0.93 0.93 0.93 0.93 0.93 0.93 0.00 0.93 0.93 0.93 PHF Volume: 9 325 0 0 421 43 74 0 0 0 0 0 Reduct Vol: 0 0 0 0 0 0 0 0 0 0 0 0 FinalVolume: 9 325 0 0 421 43 74 0 0 0 0 0 ------------|---------------||---------------||---------------||---------------|Critical Gap Module:Critical Gp: 4.1 xxxx xxxxx xxxxx xxxx xxxxx 6.4 xxxx 6.2 xxxxx xxxx xxxxx FollowUpTim: 2.2 xxxx xxxxx xxxxx xxxx xxxxx 3.5 xxxx 3.3 xxxxx xxxx xxxxx ------------|---------------||---------------||---------------||---------------|Capacity Module:Cnflict Vol: 464 xxxx xxxxx xxxx xxxx xxxxx 785 xxxx 443 xxxx xxxx xxxxx Potent Cap.: 1108 xxxx xxxxx xxxx xxxx xxxxx 364 xxxx 619 xxxx xxxx xxxxx Move Cap.: 1108 xxxx xxxxx xxxx xxxx xxxxx 362 xxxx 619 xxxx xxxx xxxxx Volume/Cap: 0.01 xxxx xxxx xxxx xxxx xxxx 0.20 xxxx 0.00 xxxx xxxx xxxx ------------|---------------||---------------||---------------||---------------|Level Of Service Module:2Way95thQ: 0.0 xxxx xxxxx xxxx xxxx xxxxx 0.8 xxxx xxxxx xxxx xxxx xxxxx Control Del: 8.3 xxxx xxxxx xxxxx xxxx xxxxx 17.5 xxxx xxxxx xxxxx xxxx xxxxx LOS by Move: A * * * * * C * * * * * Movement: LT - LTR - RT LT - LTR - RT LT - LTR - RT LT - LTR - RT Shared Cap.: xxxx xxxx xxxxx xxxx xxxx xxxxx xxxx xxxx xxxxx xxxx xxxx xxxxx SharedQueue:xxxxx xxxx xxxxx xxxxx xxxx xxxxx xxxxx xxxx xxxxx xxxxx xxxx xxxxx Shrd ConDel:xxxxx xxxx xxxxx xxxxx xxxx xxxxx xxxxx xxxx xxxxx xxxxx xxxx xxxxx Shared LOS: * * * * * * * * * * * * ApproachDel: xxxxxx xxxxxx 17.5 xxxxxxApproachLOS: * * C * ********************************************************************************Note: Queue reported is the number of cars per lane.********************************************************************************
Traffix 8.0.0715 (c) 2008 Dowling Assoc. Licensed to RK ENGINEERING GROUP

EX (PM) Tue May 12, 2015 14:32:24 Page 6-1 -------------------------------------------------------------------------------- AGUA MANSA HIGH CUBE WAREHOUSE COUNTY OF SAN BERNARDINO EXISTING CONDITIONS -------------------------------------------------------------------------------- Level Of Service Computation Report 2000 HCM Unsignalized Method (Base Volume Alternative) ********************************************************************************Intersection #5 AGUA MANSA ROAD (NS) AT EL RAVINO ROAD (EW) ********************************************************************************Average Delay (sec/veh): 5.9 Worst Case Level Of Service: F[ 67.8]********************************************************************************Approach: North Bound South Bound East Bound West Bound Movement: L - T - R L - T - R L - T - R L - T - R ------------|---------------||---------------||---------------||---------------|Control: Uncontrolled Uncontrolled Stop Sign Stop Sign Rights: Include Include Ignore Include Lanes: 1 0 1 0 0 0 0 0 1 0 1 0 0 0 1 0 0 0 0 0 ------------|---------------||---------------||---------------||---------------|Volume Module:Base Vol: 37 652 0 0 315 78 98 0 9 0 0 0 Growth Adj: 1.00 1.00 1.00 1.00 1.00 1.00 1.00 1.00 1.00 1.00 1.00 1.00 Initial Bse: 37 652 0 0 315 78 98 0 9 0 0 0 User Adj: 1.00 1.00 1.00 1.00 1.00 1.00 1.00 1.00 0.00 1.00 1.00 1.00 PHF Adj: 0.81 0.81 0.81 0.81 0.81 0.81 0.81 0.81 0.00 0.81 0.81 0.81 PHF Volume: 45 801 0 0 387 96 120 0 0 0 0 0 Reduct Vol: 0 0 0 0 0 0 0 0 0 0 0 0 FinalVolume: 45 801 0 0 387 96 120 0 0 0 0 0 ------------|---------------||---------------||---------------||---------------|Critical Gap Module:Critical Gp: 4.1 xxxx xxxxx xxxxx xxxx xxxxx 6.4 xxxx 6.2 xxxxx xxxx xxxxx FollowUpTim: 2.2 xxxx xxxxx xxxxx xxxx xxxxx 3.5 xxxx 3.3 xxxxx xxxx xxxxx ------------|---------------||---------------||---------------||---------------|Capacity Module:Cnflict Vol: 483 xxxx xxxxx xxxx xxxx xxxxx 1327 xxxx 435 xxxx xxxx xxxxx Potent Cap.: 1090 xxxx xxxxx xxxx xxxx xxxxx 173 xxxx 625 xxxx xxxx xxxxx Move Cap.: 1090 xxxx xxxxx xxxx xxxx xxxxx 168 xxxx 625 xxxx xxxx xxxxx Volume/Cap: 0.04 xxxx xxxx xxxx xxxx xxxx 0.72 xxxx 0.00 xxxx xxxx xxxx ------------|---------------||---------------||---------------||---------------|Level Of Service Module:2Way95thQ: 0.1 xxxx xxxxx xxxx xxxx xxxxx 4.4 xxxx xxxxx xxxx xxxx xxxxx Control Del: 8.4 xxxx xxxxx xxxxx xxxx xxxxx 67.8 xxxx xxxxx xxxxx xxxx xxxxx LOS by Move: A * * * * * F * * * * * Movement: LT - LTR - RT LT - LTR - RT LT - LTR - RT LT - LTR - RT Shared Cap.: xxxx xxxx xxxxx xxxx xxxx xxxxx xxxx xxxx xxxxx xxxx xxxx xxxxx SharedQueue:xxxxx xxxx xxxxx xxxxx xxxx xxxxx xxxxx xxxx xxxxx xxxxx xxxx xxxxx Shrd ConDel:xxxxx xxxx xxxxx xxxxx xxxx xxxxx xxxxx xxxx xxxxx xxxxx xxxx xxxxx Shared LOS: * * * * * * * * * * * * ApproachDel: xxxxxx xxxxxx 67.8 xxxxxxApproachLOS: * * F * ********************************************************************************Note: Queue reported is the number of cars per lane.********************************************************************************
Traffix 8.0.0715 (c) 2008 Dowling Assoc. Licensed to RK ENGINEERING GROUP

EX (AM) Tue May 12, 2015 14:31:39 Page 7-1 -------------------------------------------------------------------------------- AGUA MANSA HIGH CUBE WAREHOUSE COUNTY OF SAN BERNARDINO EXISTING CONDITIONS -------------------------------------------------------------------------------- Level Of Service Computation Report 2000 HCM Operations Method (Base Volume Alternative) ********************************************************************************Intersection #6 RIVERSIDE AVENUE (NS) AT AGUA MANSA ROAD (EW) ********************************************************************************Cycle (sec): 90 Critical Vol./Cap.(X): 0.552Loss Time (sec): 8 Average Delay (sec/veh): 29.8Optimal Cycle: OPTIMIZED Level Of Service: C********************************************************************************Approach: North Bound South Bound East Bound West Bound Movement: L - T - R L - T - R L - T - R L - T - R ------------|---------------||---------------||---------------||---------------|Control: Protected Protected Protected Protected Rights: Include Include Include Include Min. Green: 10 29 29 10 32 32 10 27 27 10 23 23 Y+R: 4.0 4.0 4.0 4.0 4.0 4.0 4.0 4.0 4.0 4.0 4.0 4.0 Lanes: 1 0 1 1 0 1 0 2 0 1 1 0 1 0 1 1 0 1 0 1 ------------|---------------||---------------||---------------||---------------|Volume Module:Base Vol: 152 713 61 78 846 193 159 165 82 59 241 50 Growth Adj: 1.00 1.00 1.00 1.00 1.00 1.00 1.00 1.00 1.00 1.00 1.00 1.00 Initial Bse: 152 713 61 78 846 193 159 165 82 59 241 50 User Adj: 1.00 1.00 1.00 1.00 1.00 1.00 1.00 1.00 1.00 1.00 1.00 1.00 PHF Adj: 0.91 0.91 0.91 0.91 0.91 0.91 0.91 0.91 0.91 0.91 0.91 0.91 PHF Volume: 167 784 67 86 930 212 175 181 90 65 265 55 Reduct Vol: 0 0 0 0 0 0 0 0 0 0 0 0 Reduced Vol: 167 784 67 86 930 212 175 181 90 65 265 55 PCE Adj: 1.00 1.00 1.00 1.00 1.00 1.00 1.00 1.00 1.00 1.00 1.00 1.00 MLF Adj: 1.00 1.00 1.00 1.00 1.00 1.00 1.00 1.00 1.00 1.00 1.00 1.00 FinalVolume: 167 784 67 86 930 212 175 181 90 65 265 55 ------------|---------------||---------------||---------------||---------------|Saturation Flow Module:Sat/Lane: 1800 1800 1800 1800 1800 1800 1800 1800 1800 1800 1800 1800 Adjustment: 0.90 0.99 0.99 0.90 1.00 0.85 0.90 1.00 0.85 0.90 1.00 0.85 Lanes: 1.00 1.84 0.16 1.00 2.00 1.00 1.00 1.00 1.00 1.00 1.00 1.00 Final Sat.: 1615 3276 280 1615 3600 1530 1615 1800 1530 1615 1800 1530 ------------|---------------||---------------||---------------||---------------|Capacity Analysis Module:Vol/Sat: 0.10 0.24 0.24 0.05 0.26 0.14 0.11 0.10 0.06 0.04 0.15 0.04 Crit Moves: **** **** **** **** Green/Cycle: 0.14 0.37 0.37 0.13 0.36 0.36 0.12 0.30 0.30 0.11 0.29 0.29 Volume/Cap: 0.72 0.64 0.64 0.41 0.72 0.39 0.87 0.34 0.20 0.36 0.51 0.13 Delay/Veh: 47.6 24.4 24.4 37.5 27.1 22.1 69.4 24.9 23.6 38.3 27.7 23.9 User DelAdj: 1.00 1.00 1.00 1.00 1.00 1.00 1.00 1.00 1.00 1.00 1.00 1.00 AdjDel/Veh: 47.6 24.4 24.4 37.5 27.1 22.1 69.4 24.9 23.6 38.3 27.7 23.9 LOS by Move: D C C D C C E C C D C C HCM2kAvgQ: 6 10 10 3 12 5 8 4 2 2 7 1 ********************************************************************************Note: Queue reported is the number of cars per lane.********************************************************************************
Traffix 8.0.0715 (c) 2008 Dowling Assoc. Licensed to RK ENGINEERING GROUP

EX (PM) Tue May 12, 2015 14:32:24 Page 7-1 -------------------------------------------------------------------------------- AGUA MANSA HIGH CUBE WAREHOUSE COUNTY OF SAN BERNARDINO EXISTING CONDITIONS -------------------------------------------------------------------------------- Level Of Service Computation Report 2000 HCM Operations Method (Base Volume Alternative) ********************************************************************************Intersection #6 RIVERSIDE AVENUE (NS) AT AGUA MANSA ROAD (EW) ********************************************************************************Cycle (sec): 90 Critical Vol./Cap.(X): 0.718Loss Time (sec): 8 Average Delay (sec/veh): 32.4Optimal Cycle: OPTIMIZED Level Of Service: C********************************************************************************Approach: North Bound South Bound East Bound West Bound Movement: L - T - R L - T - R L - T - R L - T - R ------------|---------------||---------------||---------------||---------------|Control: Protected Protected Protected Protected Rights: Include Include Include Include Min. Green: 10 29 29 10 32 32 10 27 27 10 23 23 Y+R: 4.0 4.0 4.0 4.0 4.0 4.0 4.0 4.0 4.0 4.0 4.0 4.0 Lanes: 1 0 1 1 0 1 0 2 0 1 1 0 1 0 1 1 0 1 0 1 ------------|---------------||---------------||---------------||---------------|Volume Module:Base Vol: 96 796 68 60 986 138 196 485 119 35 136 38 Growth Adj: 1.00 1.00 1.00 1.00 1.00 1.00 1.00 1.00 1.00 1.00 1.00 1.00 Initial Bse: 96 796 68 60 986 138 196 485 119 35 136 38 User Adj: 1.00 1.00 1.00 1.00 1.00 1.00 1.00 1.00 1.00 1.00 1.00 1.00 PHF Adj: 0.96 0.96 0.96 0.96 0.96 0.96 0.96 0.96 0.96 0.96 0.96 0.96 PHF Volume: 101 834 71 63 1032 145 205 508 125 37 142 40 Reduct Vol: 0 0 0 0 0 0 0 0 0 0 0 0 Reduced Vol: 101 834 71 63 1032 145 205 508 125 37 142 40 PCE Adj: 1.00 1.00 1.00 1.00 1.00 1.00 1.00 1.00 1.00 1.00 1.00 1.00 MLF Adj: 1.00 1.00 1.00 1.00 1.00 1.00 1.00 1.00 1.00 1.00 1.00 1.00 FinalVolume: 101 834 71 63 1032 145 205 508 125 37 142 40 ------------|---------------||---------------||---------------||---------------|Saturation Flow Module:Sat/Lane: 1800 1800 1800 1800 1800 1800 1800 1800 1800 1800 1800 1800 Adjustment: 0.90 0.99 0.99 0.90 1.00 0.85 0.90 1.00 0.85 0.90 1.00 0.85 Lanes: 1.00 1.84 0.16 1.00 2.00 1.00 1.00 1.00 1.00 1.00 1.00 1.00 Final Sat.: 1615 3277 280 1615 3600 1530 1615 1800 1530 1615 1800 1530 ------------|---------------||---------------||---------------||---------------|Capacity Analysis Module:Vol/Sat: 0.06 0.25 0.25 0.04 0.29 0.09 0.13 0.28 0.08 0.02 0.08 0.03 Crit Moves: **** **** **** **** Green/Cycle: 0.11 0.35 0.35 0.12 0.36 0.36 0.15 0.33 0.33 0.11 0.30 0.30 Volume/Cap: 0.56 0.73 0.73 0.33 0.81 0.27 0.86 0.85 0.24 0.20 0.27 0.09 Delay/Veh: 41.9 28.0 28.0 37.3 30.1 20.9 63.2 38.6 22.0 36.9 24.4 22.9 User DelAdj: 1.00 1.00 1.00 1.00 1.00 1.00 1.00 1.00 1.00 1.00 1.00 1.00 AdjDel/Veh: 41.9 28.0 28.0 37.3 30.1 20.9 63.2 38.6 22.0 36.9 24.4 22.9 LOS by Move: D C C D C C E D C D C C HCM2kAvgQ: 4 12 12 2 15 3 9 16 3 1 3 1 ********************************************************************************Note: Queue reported is the number of cars per lane.********************************************************************************
Traffix 8.0.0715 (c) 2008 Dowling Assoc. Licensed to RK ENGINEERING GROUP

Appendix C
San Bernardino Transportation Analysis Mode (SBTAM) Plots

AM Traffic Volumes
W A
GUA
MAN
SA
EL RIVINO RD
W A
GUA MANSA
RD
2,28
5
1,05
4
129
155
533
1,057
262,2
33

PM Traffic Volumes
Total Traffic
W A
GUA
MAN
SA
EL RIVINO RD
WAGUA M
ANSA R
D
2,34
53,
780
576
601
513
3,782
24 1,832

Daily Traffic Volumes
Total Volume
W A
GUA
MAN
SA
EL RIVINO RD
WAGUA M
ANSA R
D
7,99
08,
388
946
1,022
78128
8,417
76 7,208

AM Traffic Volumes
S RIVERSIDE AVE
W AGUA MANSA RD
W AGUA MANSA RD
S RIVERSIDE AVE
6,067
233,150221
1,781
42280099
1,206
7031,363
386
3,9581855,265
394

PM Traffic Volumes
Total Traffic
S RIVERSIDE AVE W AGUA MANSA RD
W AGUA MANSA RD
S RIVERSIDE AVE
8,178
1038,1661,131
2,375
6502,90726
4,671
2501,868
405
9,2216337,901
404

Daily Traffic Volumes
Total Volume
S RIVERSIDE AVE W AGUA MANSA RD
W AGUA MANSA RD
S RIVERSIDE AVE
25,520
26220,719
2,573 7,579
2,5055,883279
9,878
2,021
5,133
1,385
24,608
1,42223,219
2,184

AM Traffic Volumes
CA
CTU
S AVE
EL RIVINO RDEL RIVINO RD
352
440
64
239
333279
1960

PM Traffic Volumes
Total Traffic
CA
CTU
S AVE
EL RIVINO RDEL RIVINO RD
366
690135
1,335
370175505
191645

Daily Traffic Volumes
Total Volume
CA
CTU
S AVE
EL RIVINO RDEL RIVINO RD
775
721202
1,699
9075361,109
239978

AM Traffic Volumes
EL RIVINO RD
HA
LL AVE
EL RIVINO RD 56155
8417
572
568

PM Traffic Volumes
Total Traffic
EL RIVINO RD
HA
LL AVE
EL RIVINO RD
516
301300
1,120
245
545
516819

Daily Traffic Volumes
Total Volume
EL RIVINO RD
HA
LL AVE
EL RIVINO RD
810
1,203721
2,092
722
1,443
810889

AM Traffic Volumes
EL RIVINO RD
CEDAR AVE
RUBIDOUX BLVD
210
124168
3,598
361,809
1,9323,430174

PM Traffic Volumes
Total Traffic
EL RIVINO RD
CEDAR AVE
RUBIDOUX BLVD
857
479166
4,4442455,415
5,8934,279612

Daily Traffic Volumes
Total Volume
EL RIVINO RD
CEDAR AVE
RUBIDOUX BLVD
1,528
932490
14,65241613,231
14,16314,1621,112

Appendix D
Project Opening Year (2017) Without Related Projects Without Project Conditions
Intersection Analysis Worksheets

EX + A (AM) Tue May 12, 2015 14:33:10 Page 2-1 -------------------------------------------------------------------------------- AGUA MANSA HIGH CUBE WAREHOUSE COUNTY OF SAN BERNARDINO OPENING YEAR (2017) WITHOUT RELATED PROJ WITHOUT PROJ CONDITIONS -------------------------------------------------------------------------------- Level Of Service Computation Report 2000 HCM Operations Method (Future Volume Alternative) ********************************************************************************Intersection #1 CEDAR AVENUE (NS) AT EL RAVINO ROAD (EW) ********************************************************************************Cycle (sec): 110 Critical Vol./Cap.(X): 0.291Loss Time (sec): 8 Average Delay (sec/veh): 17.3Optimal Cycle: OPTIMIZED Level Of Service: B********************************************************************************Approach: North Bound South Bound East Bound West Bound Movement: L - T - R L - T - R L - T - R L - T - R ------------|---------------||---------------||---------------||---------------|Control: Protected Protected Permitted Permitted Rights: Include Include Include Include Min. Green: 10 0 0 10 23 23 10 14 14 10 24 24 Y+R: 4.0 4.0 4.0 4.0 4.0 4.0 4.0 4.0 4.0 4.0 4.0 4.0 Lanes: 1 0 1 1 0 1 0 1 1 0 0 0 1! 0 0 0 1 0 0 1 ------------|---------------||---------------||---------------||---------------|Volume Module:Base Vol: 10 443 47 87 652 6 3 1 6 50 2 39 Growth Adj: 1.06 1.06 1.06 1.06 1.06 1.06 1.06 1.06 1.06 1.06 1.06 1.06 Initial Bse: 11 470 50 92 691 6 3 1 6 53 2 41 Added Vol: 0 0 0 0 0 0 0 0 0 0 0 0 PasserByVol: 0 0 0 0 0 0 0 0 0 0 0 0 Initial Fut: 11 470 50 92 691 6 3 1 6 53 2 41 User Adj: 1.00 1.00 1.00 1.00 1.00 1.00 1.00 1.00 1.00 1.00 1.00 1.00 PHF Adj: 0.90 0.90 0.90 0.90 0.90 0.90 0.90 0.90 0.90 0.90 0.90 0.90 PHF Volume: 12 521 55 102 766 7 4 1 7 59 2 46 Reduct Vol: 0 0 0 0 0 0 0 0 0 0 0 0 Reduced Vol: 12 521 55 102 766 7 4 1 7 59 2 46 PCE Adj: 1.00 1.00 1.00 1.00 1.00 1.00 1.00 1.00 1.00 1.00 1.00 1.00 MLF Adj: 1.00 1.00 1.00 1.00 1.00 1.00 1.00 1.00 1.00 1.00 1.00 1.00 FinalVolume: 12 521 55 102 766 7 4 1 7 59 2 46 ------------|---------------||---------------||---------------||---------------|Saturation Flow Module:Sat/Lane: 1800 1800 1800 1800 1800 1800 1800 1800 1800 1800 1800 1800 Adjustment: 0.90 0.99 0.99 0.90 1.00 1.00 0.83 0.88 0.88 0.71 0.75 0.85 Lanes: 1.00 1.81 0.19 1.00 1.98 0.02 0.31 0.10 0.59 0.96 0.04 1.00 Final Sat.: 1615 3209 340 1615 3564 33 466 155 931 1234 49 1530 ------------|---------------||---------------||---------------||---------------|Capacity Analysis Module:Vol/Sat: 0.01 0.16 0.16 0.06 0.22 0.22 0.01 0.01 0.01 0.05 0.05 0.03 Crit Moves: **** **** **** Green/Cycle: 0.09 0.45 0.45 0.25 0.62 0.62 0.22 0.22 0.22 0.22 0.22 0.22 Volume/Cap: 0.08 0.36 0.36 0.25 0.35 0.35 0.03 0.03 0.03 0.22 0.22 0.14 Delay/Veh: 46.0 19.7 19.7 32.9 10.3 10.3 33.9 33.9 33.9 35.7 35.7 34.8 User DelAdj: 1.00 1.00 1.00 1.00 1.00 1.00 1.00 1.00 1.00 1.00 1.00 1.00 AdjDel/Veh: 46.0 19.7 19.7 32.9 10.3 10.3 33.9 33.9 33.9 35.7 35.7 34.8 LOS by Move: D B B C B B C C C D D C HCM2kAvgQ: 0 6 6 3 6 6 0 0 0 2 2 1 ********************************************************************************Note: Queue reported is the number of cars per lane.
Traffix 8.0.0715 (c) 2008 Dowling Assoc. Licensed to RK ENGINEERING GROUP

EX + A (PM) Tue May 12, 2015 14:34:00 Page 2-1 -------------------------------------------------------------------------------- AGUA MANSA HIGH CUBE WAREHOUSE COUNTY OF SAN BERNARDINO OPENING YEAR (2017) WITHOUT RELATED PROJ WITHOUT PROJ CONDITIONS -------------------------------------------------------------------------------- Level Of Service Computation Report 2000 HCM Operations Method (Future Volume Alternative) ********************************************************************************Intersection #1 CEDAR AVENUE (NS) AT EL RAVINO ROAD (EW) ********************************************************************************Cycle (sec): 95 Critical Vol./Cap.(X): 0.315Loss Time (sec): 8 Average Delay (sec/veh): 17.4Optimal Cycle: OPTIMIZED Level Of Service: B********************************************************************************Approach: North Bound South Bound East Bound West Bound Movement: L - T - R L - T - R L - T - R L - T - R ------------|---------------||---------------||---------------||---------------|Control: Protected Protected Permitted Permitted Rights: Include Include Include Include Min. Green: 10 0 0 10 23 23 10 14 14 10 24 24 Y+R: 4.0 4.0 4.0 4.0 4.0 4.0 4.0 4.0 4.0 4.0 4.0 4.0 Lanes: 1 0 1 1 0 1 0 1 1 0 0 0 1! 0 0 0 1 0 0 1 ------------|---------------||---------------||---------------||---------------|Volume Module:Base Vol: 7 669 56 67 702 8 9 7 14 45 12 88 Growth Adj: 1.06 1.06 1.06 1.06 1.06 1.06 1.06 1.06 1.06 1.06 1.06 1.06 Initial Bse: 7 709 59 71 744 8 10 7 15 48 13 93 Added Vol: 0 0 0 0 0 0 0 0 0 0 0 0 PasserByVol: 0 0 0 0 0 0 0 0 0 0 0 0 Initial Fut: 7 709 59 71 744 8 10 7 15 48 13 93 User Adj: 1.00 1.00 1.00 1.00 1.00 1.00 1.00 1.00 1.00 1.00 1.00 1.00 PHF Adj: 0.95 0.95 0.95 0.95 0.95 0.95 0.95 0.95 0.95 0.95 0.95 0.95 PHF Volume: 8 744 62 75 781 9 10 8 16 50 13 98 Reduct Vol: 0 0 0 0 0 0 0 0 0 0 0 0 Reduced Vol: 8 744 62 75 781 9 10 8 16 50 13 98 PCE Adj: 1.00 1.00 1.00 1.00 1.00 1.00 1.00 1.00 1.00 1.00 1.00 1.00 MLF Adj: 1.00 1.00 1.00 1.00 1.00 1.00 1.00 1.00 1.00 1.00 1.00 1.00 FinalVolume: 8 744 62 75 781 9 10 8 16 50 13 98 ------------|---------------||---------------||---------------||---------------|Saturation Flow Module:Sat/Lane: 1800 1800 1800 1800 1800 1800 1800 1800 1800 1800 1800 1800 Adjustment: 0.90 0.99 0.99 0.90 1.00 1.00 0.83 0.88 0.88 0.75 0.79 0.85 Lanes: 1.00 1.85 0.15 1.00 1.98 0.02 0.31 0.23 0.46 0.80 0.20 1.00 Final Sat.: 1615 3282 275 1615 3552 40 468 364 728 1077 287 1530 ------------|---------------||---------------||---------------||---------------|Capacity Analysis Module:Vol/Sat: 0.00 0.23 0.23 0.05 0.22 0.22 0.02 0.02 0.02 0.05 0.05 0.06 Crit Moves: **** **** ****Green/Cycle: 0.11 0.45 0.45 0.21 0.56 0.56 0.25 0.25 0.25 0.25 0.25 0.25 Volume/Cap: 0.05 0.50 0.50 0.22 0.39 0.39 0.08 0.08 0.08 0.18 0.18 0.25 Delay/Veh: 38.3 18.6 18.6 31.4 12.0 12.0 27.2 27.2 27.2 28.1 28.1 28.7 User DelAdj: 1.00 1.00 1.00 1.00 1.00 1.00 1.00 1.00 1.00 1.00 1.00 1.00 AdjDel/Veh: 38.3 18.6 18.6 31.4 12.0 12.0 27.2 27.2 27.2 28.1 28.1 28.7 LOS by Move: D B B C B B C C C C C C HCM2kAvgQ: 0 9 9 2 7 7 1 1 1 2 2 2 ********************************************************************************Note: Queue reported is the number of cars per lane.
Traffix 8.0.0715 (c) 2008 Dowling Assoc. Licensed to RK ENGINEERING GROUP

EX + A (AM) Tue May 12, 2015 14:33:10 Page 3-1 -------------------------------------------------------------------------------- AGUA MANSA HIGH CUBE WAREHOUSE COUNTY OF SAN BERNARDINO OPENING YEAR (2017) WITHOUT RELATED PROJ WITHOUT PROJ CONDITIONS -------------------------------------------------------------------------------- Level Of Service Computation Report 2000 HCM Operations Method (Future Volume Alternative) ********************************************************************************Intersection #2 CACTUS AVENUE (NS) AT EL RAVINO ROAD (EW) ********************************************************************************Cycle (sec): 60 Critical Vol./Cap.(X): 0.185Loss Time (sec): 8 Average Delay (sec/veh): 12.2Optimal Cycle: OPTIMIZED Level Of Service: B********************************************************************************Approach: North Bound South Bound East Bound West Bound Movement: L - T - R L - T - R L - T - R L - T - R ------------|---------------||---------------||---------------||---------------|Control: Protected Protected Protected Permitted Rights: Include Include Include Include Min. Green: 0 0 0 10 0 0 10 0 0 0 0 0 Y+R: 4.0 4.0 4.0 4.0 4.0 4.0 4.0 4.0 4.0 4.0 4.0 4.0 Lanes: 0 0 0 0 0 1 0 0 0 1 0 1 0 0 0 0 0 0 1 0 ------------|---------------||---------------||---------------||---------------|Volume Module:Base Vol: 0 0 0 25 0 31 19 68 0 0 81 20 Growth Adj: 1.06 1.06 1.06 1.06 1.06 1.06 1.06 1.06 1.06 1.06 1.06 1.06 Initial Bse: 0 0 0 27 0 33 20 72 0 0 86 21 Added Vol: 0 0 0 0 0 0 0 0 0 0 0 0 PasserByVol: 0 0 0 0 0 0 0 0 0 0 0 0 Initial Fut: 0 0 0 27 0 33 20 72 0 0 86 21 User Adj: 1.00 1.00 1.00 1.00 1.00 1.00 1.00 1.00 1.00 1.00 1.00 1.00 PHF Adj: 0.81 0.81 0.81 0.81 0.81 0.81 0.81 0.81 0.81 0.81 0.81 0.81 PHF Volume: 0 0 0 33 0 40 25 89 0 0 106 26 Reduct Vol: 0 0 0 0 0 0 0 0 0 0 0 0 Reduced Vol: 0 0 0 33 0 40 25 89 0 0 106 26 PCE Adj: 1.00 1.00 1.00 1.00 1.00 1.00 1.00 1.00 1.00 1.00 1.00 1.00 MLF Adj: 1.00 1.00 1.00 1.00 1.00 1.00 1.00 1.00 1.00 1.00 1.00 1.00 FinalVolume: 0 0 0 33 0 40 25 89 0 0 106 26 ------------|---------------||---------------||---------------||---------------|Saturation Flow Module:Sat/Lane: 1800 1800 1800 1800 1800 1800 1800 1800 1800 1800 1800 1800 Adjustment: 0.94 1.00 1.00 0.90 1.00 0.85 0.93 0.99 1.00 0.94 0.97 0.97 Lanes: 0.00 0.00 0.00 1.00 0.00 1.00 0.23 0.77 0.00 0.00 0.80 0.20 Final Sat.: 0 0 0 1615 0 1530 384 1374 0 0 1405 347 ------------|---------------||---------------||---------------||---------------|Capacity Analysis Module:Vol/Sat: 0.00 0.00 0.00 0.02 0.00 0.03 0.06 0.06 0.00 0.00 0.08 0.08 Crit Moves: **** **** **** Green/Cycle: 0.00 0.00 0.00 0.17 0.00 0.17 0.32 0.70 0.00 0.00 0.38 0.38 Volume/Cap: 0.00 0.00 0.00 0.12 0.00 0.16 0.20 0.09 0.00 0.00 0.20 0.20 Delay/Veh: 0.0 0.0 0.0 21.5 0.0 21.7 14.9 2.9 0.0 0.0 12.8 12.8 User DelAdj: 1.00 1.00 1.00 1.00 1.00 1.00 1.00 1.00 1.00 1.00 1.00 1.00 AdjDel/Veh: 0.0 0.0 0.0 21.5 0.0 21.7 14.9 2.9 0.0 0.0 12.8 12.8 LOS by Move: A A A C A C B A A A B B HCM2kAvgQ: 0 0 0 1 0 1 1 1 0 0 2 2 ********************************************************************************Note: Queue reported is the number of cars per lane.
Traffix 8.0.0715 (c) 2008 Dowling Assoc. Licensed to RK ENGINEERING GROUP

EX + A (PM) Tue May 12, 2015 14:34:00 Page 3-1 -------------------------------------------------------------------------------- AGUA MANSA HIGH CUBE WAREHOUSE COUNTY OF SAN BERNARDINO OPENING YEAR (2017) WITHOUT RELATED PROJ WITHOUT PROJ CONDITIONS -------------------------------------------------------------------------------- Level Of Service Computation Report 2000 HCM Operations Method (Future Volume Alternative) ********************************************************************************Intersection #2 CACTUS AVENUE (NS) AT EL RAVINO ROAD (EW) ********************************************************************************Cycle (sec): 60 Critical Vol./Cap.(X): 0.257Loss Time (sec): 8 Average Delay (sec/veh): 11.7Optimal Cycle: OPTIMIZED Level Of Service: B********************************************************************************Approach: North Bound South Bound East Bound West Bound Movement: L - T - R L - T - R L - T - R L - T - R ------------|---------------||---------------||---------------||---------------|Control: Protected Protected Protected Permitted Rights: Include Include Include Include Min. Green: 0 0 0 10 0 0 10 0 0 0 0 0 Y+R: 4.0 4.0 4.0 4.0 4.0 4.0 4.0 4.0 4.0 4.0 4.0 4.0 Lanes: 0 0 0 0 0 1 0 0 0 1 0 1 0 0 0 0 0 0 1 0 ------------|---------------||---------------||---------------||---------------|Volume Module:Base Vol: 0 0 0 14 0 26 41 99 0 0 97 53 Growth Adj: 1.06 1.06 1.06 1.06 1.06 1.06 1.06 1.06 1.06 1.06 1.06 1.06 Initial Bse: 0 0 0 15 0 28 43 105 0 0 103 56 Added Vol: 0 0 0 0 0 0 0 0 0 0 0 0 PasserByVol: 0 0 0 0 0 0 0 0 0 0 0 0 Initial Fut: 0 0 0 15 0 28 43 105 0 0 103 56 User Adj: 1.00 1.00 1.00 1.00 1.00 1.00 1.00 1.00 1.00 1.00 1.00 1.00 PHF Adj: 0.84 0.84 0.84 0.84 0.84 0.84 0.84 0.84 0.84 0.84 0.84 0.84 PHF Volume: 0 0 0 18 0 33 52 125 0 0 123 67 Reduct Vol: 0 0 0 0 0 0 0 0 0 0 0 0 Reduced Vol: 0 0 0 18 0 33 52 125 0 0 123 67 PCE Adj: 1.00 1.00 1.00 1.00 1.00 1.00 1.00 1.00 1.00 1.00 1.00 1.00 MLF Adj: 1.00 1.00 1.00 1.00 1.00 1.00 1.00 1.00 1.00 1.00 1.00 1.00 FinalVolume: 0 0 0 18 0 33 52 125 0 0 123 67 ------------|---------------||---------------||---------------||---------------|Saturation Flow Module:Sat/Lane: 1800 1800 1800 1800 1800 1800 1800 1800 1800 1800 1800 1800 Adjustment: 0.94 1.00 1.00 0.90 1.00 0.85 0.93 0.99 1.00 0.94 0.95 0.95 Lanes: 0.00 0.00 0.00 1.00 0.00 1.00 0.30 0.70 0.00 0.00 0.65 0.35 Final Sat.: 0 0 0 1615 0 1530 511 1234 0 0 1108 605 ------------|---------------||---------------||---------------||---------------|Capacity Analysis Module:Vol/Sat: 0.00 0.00 0.00 0.01 0.00 0.02 0.10 0.10 0.00 0.00 0.11 0.11 Crit Moves: **** **** **** Green/Cycle: 0.00 0.00 0.00 0.17 0.00 0.17 0.33 0.70 0.00 0.00 0.37 0.37 Volume/Cap: 0.00 0.00 0.00 0.07 0.00 0.13 0.30 0.14 0.00 0.00 0.30 0.30 Delay/Veh: 0.0 0.0 0.0 21.2 0.0 21.5 15.1 3.1 0.0 0.0 13.9 13.9 User DelAdj: 1.00 1.00 1.00 1.00 1.00 1.00 1.00 1.00 1.00 1.00 1.00 1.00 AdjDel/Veh: 0.0 0.0 0.0 21.2 0.0 21.5 15.1 3.1 0.0 0.0 13.9 13.9 LOS by Move: A A A C A C B A A A B B HCM2kAvgQ: 0 0 0 0 0 1 1 1 0 0 3 3 ********************************************************************************Note: Queue reported is the number of cars per lane.
Traffix 8.0.0715 (c) 2008 Dowling Assoc. Licensed to RK ENGINEERING GROUP

EX + A (AM) Tue May 12, 2015 14:33:10 Page 4-1 -------------------------------------------------------------------------------- AGUA MANSA HIGH CUBE WAREHOUSE COUNTY OF SAN BERNARDINO OPENING YEAR (2017) WITHOUT RELATED PROJ WITHOUT PROJ CONDITIONS -------------------------------------------------------------------------------- Level Of Service Computation Report 2000 HCM Unsignalized Method (Future Volume Alternative) ********************************************************************************Intersection #3 HALL AVENUE (NS) AT EL RAVINO ROAD (EW) ********************************************************************************Average Delay (sec/veh): 2.2 Worst Case Level Of Service: B[ 10.1]********************************************************************************Approach: North Bound South Bound East Bound West Bound Movement: L - T - R L - T - R L - T - R L - T - R ------------|---------------||---------------||---------------||---------------|Control: Stop Sign Stop Sign Uncontrolled UncontrolledRights: Include Include Include Include Lanes: 0 0 1! 0 0 0 0 1! 0 0 0 0 1! 0 0 0 0 1! 0 0 ------------|---------------||---------------||---------------||---------------|Volume Module:Base Vol: 17 1 14 12 3 4 4 83 27 1 80 3 Growth Adj: 1.06 1.06 1.06 1.06 1.06 1.06 1.06 1.06 1.06 1.06 1.06 1.06 Initial Bse: 18 1 15 13 3 4 4 88 29 1 85 3 Added Vol: 0 0 0 0 0 0 0 0 0 0 0 0 PasserByVol: 0 0 0 0 0 0 0 0 0 0 0 0 Initial Fut: 18 1 15 13 3 4 4 88 29 1 85 3 User Adj: 1.00 1.00 1.00 1.00 1.00 1.00 1.00 1.00 1.00 1.00 1.00 1.00 PHF Adj: 0.83 0.83 0.83 0.83 0.83 0.83 0.83 0.83 0.83 0.83 0.83 0.83 PHF Volume: 22 1 18 15 4 5 5 107 35 1 103 4 Reduct Vol: 0 0 0 0 0 0 0 0 0 0 0 0 FinalVolume: 22 1 18 15 4 5 5 107 35 1 103 4 ------------|---------------||---------------||---------------||---------------|Critical Gap Module:Critical Gp: 7.1 6.5 6.2 7.1 6.5 6.2 4.1 xxxx xxxxx 4.1 xxxx xxxxx FollowUpTim: 3.5 4.0 3.3 3.5 4.0 3.3 2.2 xxxx xxxxx 2.2 xxxx xxxxx ------------|---------------||---------------||---------------||---------------|Capacity Module:Cnflict Vol: 246 243 124 251 259 105 107 xxxx xxxxx 141 xxxx xxxxx Potent Cap.: 712 662 932 706 649 955 1497 xxxx xxxxx 1454 xxxx xxxxx Move Cap.: 702 659 932 689 646 955 1497 xxxx xxxxx 1454 xxxx xxxxx Volume/Cap: 0.03 0.00 0.02 0.02 0.01 0.01 0.00 xxxx xxxx 0.00 xxxx xxxx ------------|---------------||---------------||---------------||---------------|Level Of Service Module:2Way95thQ: xxxx xxxx xxxxx xxxx xxxx xxxxx 0.0 xxxx xxxxx 0.0 xxxx xxxxx Control Del:xxxxx xxxx xxxxx xxxxx xxxx xxxxx 7.4 xxxx xxxxx 7.5 xxxx xxxxx LOS by Move: * * * * * * A * * A * * Movement: LT - LTR - RT LT - LTR - RT LT - LTR - RT LT - LTR - RT Shared Cap.: xxxx 786 xxxxx xxxx 724 xxxxx xxxx xxxx xxxxx xxxx xxxx xxxxx SharedQueue:xxxxx 0.2 xxxxx xxxxx 0.1 xxxxx xxxxx xxxx xxxxx xxxxx xxxx xxxxx Shrd ConDel:xxxxx 9.8 xxxxx xxxxx 10.1 xxxxx xxxxx xxxx xxxxx xxxxx xxxx xxxxx Shared LOS: * A * * B * * * * * * * ApproachDel: 9.8 10.1 xxxxxx xxxxxxApproachLOS: A B * * ********************************************************************************Note: Queue reported is the number of cars per lane.********************************************************************************
Traffix 8.0.0715 (c) 2008 Dowling Assoc. Licensed to RK ENGINEERING GROUP

EX + A (PM) Tue May 12, 2015 14:34:00 Page 4-1 -------------------------------------------------------------------------------- AGUA MANSA HIGH CUBE WAREHOUSE COUNTY OF SAN BERNARDINO OPENING YEAR (2017) WITHOUT RELATED PROJ WITHOUT PROJ CONDITIONS -------------------------------------------------------------------------------- Level Of Service Computation Report 2000 HCM Unsignalized Method (Future Volume Alternative) ********************************************************************************Intersection #3 HALL AVENUE (NS) AT EL RAVINO ROAD (EW) ********************************************************************************Average Delay (sec/veh): 2.6 Worst Case Level Of Service: B[ 10.9]********************************************************************************Approach: North Bound South Bound East Bound West Bound Movement: L - T - R L - T - R L - T - R L - T - R ------------|---------------||---------------||---------------||---------------|Control: Stop Sign Stop Sign Uncontrolled UncontrolledRights: Include Include Include Include Lanes: 0 0 1! 0 0 0 0 1! 0 0 0 0 1! 0 0 0 0 0 1 0 ------------|---------------||---------------||---------------||---------------|Volume Module:Base Vol: 45 4 5 9 4 1 5 89 13 0 110 15 Growth Adj: 1.06 1.06 1.06 1.06 1.06 1.06 1.06 1.06 1.06 1.06 1.06 1.06 Initial Bse: 48 4 5 10 4 1 5 94 14 0 117 16 Added Vol: 0 0 0 0 0 0 0 0 0 0 0 0 PasserByVol: 0 0 0 0 0 0 0 0 0 0 0 0 Initial Fut: 48 4 5 10 4 1 5 94 14 0 117 16 User Adj: 1.00 1.00 1.00 1.00 1.00 1.00 1.00 1.00 1.00 1.00 1.00 1.00 PHF Adj: 0.83 0.83 0.83 0.83 0.83 0.83 0.83 0.83 0.83 0.83 0.83 0.83 PHF Volume: 58 5 6 12 5 1 6 114 17 0 141 19 Reduct Vol: 0 0 0 0 0 0 0 0 0 0 0 0 FinalVolume: 58 5 6 12 5 1 6 114 17 0 141 19 ------------|---------------||---------------||---------------||---------------|Critical Gap Module:Critical Gp: 7.1 6.5 6.2 7.1 6.5 6.2 4.1 xxxx xxxxx xxxxx xxxx xxxxx FollowUpTim: 3.5 4.0 3.3 3.5 4.0 3.3 2.2 xxxx xxxxx xxxxx xxxx xxxxx ------------|---------------||---------------||---------------||---------------|Capacity Module:Cnflict Vol: 289 296 123 292 295 151 160 xxxx xxxxx xxxx xxxx xxxxx Potent Cap.: 667 619 934 664 620 901 1431 xxxx xxxxx xxxx xxxx xxxxx Move Cap.: 659 616 934 653 617 901 1431 xxxx xxxxx xxxx xxxx xxxxx Volume/Cap: 0.09 0.01 0.01 0.02 0.01 0.00 0.00 xxxx xxxx xxxx xxxx xxxx ------------|---------------||---------------||---------------||---------------|Level Of Service Module:2Way95thQ: xxxx xxxx xxxxx xxxx xxxx xxxxx 0.0 xxxx xxxxx xxxx xxxx xxxxx Control Del:xxxxx xxxx xxxxx xxxxx xxxx xxxxx 7.5 xxxx xxxxx xxxxx xxxx xxxxx LOS by Move: * * * * * * A * * * * * Movement: LT - LTR - RT LT - LTR - RT LT - LTR - RT LT - LTR - RT Shared Cap.: xxxx 674 xxxxx xxxx 655 xxxxx xxxx xxxx xxxxx xxxx xxxx xxxxx SharedQueue:xxxxx 0.3 xxxxx xxxxx 0.1 xxxxx xxxxx xxxx xxxxx xxxxx xxxx xxxxx Shrd ConDel:xxxxx 10.9 xxxxx xxxxx 10.6 xxxxx xxxxx xxxx xxxxx xxxxx xxxx xxxxx Shared LOS: * B * * B * * * * * * * ApproachDel: 10.9 10.6 xxxxxx xxxxxxApproachLOS: B B * * ********************************************************************************Note: Queue reported is the number of cars per lane.********************************************************************************
Traffix 8.0.0715 (c) 2008 Dowling Assoc. Licensed to RK ENGINEERING GROUP

EX + A (AM) Tue May 12, 2015 14:33:10 Page 5-1 -------------------------------------------------------------------------------- AGUA MANSA HIGH CUBE WAREHOUSE COUNTY OF SAN BERNARDINO OPENING YEAR (2017) WITHOUT RELATED PROJ WITHOUT PROJ CONDITIONS -------------------------------------------------------------------------------- Level Of Service Computation Report 2000 HCM Unsignalized Method (Future Volume Alternative) ********************************************************************************Intersection #4 KININGHAM DRIVE (NS) AT EL RAVINO ROAD (EW) ********************************************************************************Average Delay (sec/veh): 0.3 Worst Case Level Of Service: A[ 9.4]********************************************************************************Approach: North Bound South Bound East Bound West Bound Movement: L - T - R L - T - R L - T - R L - T - R ------------|---------------||---------------||---------------||---------------|Control: Stop Sign Stop Sign Uncontrolled UncontrolledRights: Include Include Include Include Lanes: 0 0 0 0 0 0 0 1! 0 0 0 1 0 0 0 0 0 0 1 0 ------------|---------------||---------------||---------------||---------------|Volume Module:Base Vol: 0 0 0 2 0 1 3 90 0 0 77 1 Growth Adj: 1.06 1.06 1.06 1.06 1.06 1.06 1.06 1.06 1.06 1.06 1.06 1.06 Initial Bse: 0 0 0 2 0 1 3 95 0 0 82 1 Added Vol: 0 0 0 0 0 0 0 0 0 0 0 0 PasserByVol: 0 0 0 0 0 0 0 0 0 0 0 0 Initial Fut: 0 0 0 2 0 1 3 95 0 0 82 1 User Adj: 1.00 1.00 1.00 1.00 1.00 1.00 1.00 1.00 1.00 1.00 1.00 1.00 PHF Adj: 0.79 0.79 0.79 0.79 0.79 0.79 0.79 0.79 0.79 0.79 0.79 0.79 PHF Volume: 0 0 0 3 0 1 4 121 0 0 103 1 Reduct Vol: 0 0 0 0 0 0 0 0 0 0 0 0 FinalVolume: 0 0 0 3 0 1 4 121 0 0 103 1 ------------|---------------||---------------||---------------||---------------|Critical Gap Module:Critical Gp:xxxxx xxxx xxxxx 6.4 6.5 6.2 4.1 xxxx xxxxx xxxxx xxxx xxxxx FollowUpTim:xxxxx xxxx xxxxx 3.5 4.0 3.3 2.2 xxxx xxxxx xxxxx xxxx xxxxx ------------|---------------||---------------||---------------||---------------|Capacity Module:Cnflict Vol: xxxx xxxx xxxxx 233 233 104 105 xxxx xxxxx xxxx xxxx xxxxx Potent Cap.: xxxx xxxx xxxxx 760 671 956 1500 xxxx xxxxx xxxx xxxx xxxxx Move Cap.: xxxx xxxx xxxxx 759 669 956 1500 xxxx xxxxx xxxx xxxx xxxxx Volume/Cap: xxxx xxxx xxxx 0.00 0.00 0.00 0.00 xxxx xxxx xxxx xxxx xxxx ------------|---------------||---------------||---------------||---------------|Level Of Service Module:2Way95thQ: xxxx xxxx xxxxx xxxx xxxx xxxxx 0.0 xxxx xxxxx xxxx xxxx xxxxx Control Del:xxxxx xxxx xxxxx xxxxx xxxx xxxxx 7.4 xxxx xxxxx xxxxx xxxx xxxxx LOS by Move: * * * * * * A * * * * * Movement: LT - LTR - RT LT - LTR - RT LT - LTR - RT LT - LTR - RT Shared Cap.: xxxx xxxx xxxxx xxxx 815 xxxxx xxxx xxxx xxxxx xxxx xxxx xxxxx SharedQueue:xxxxx xxxx xxxxx xxxxx 0.0 xxxxx 0.0 xxxx xxxxx xxxxx xxxx xxxxx Shrd ConDel:xxxxx xxxx xxxxx xxxxx 9.4 xxxxx 7.4 xxxx xxxxx xxxxx xxxx xxxxx Shared LOS: * * * * A * A * * * * * ApproachDel: xxxxxx 9.4 xxxxxx xxxxxxApproachLOS: * A * * ********************************************************************************Note: Queue reported is the number of cars per lane.********************************************************************************
Traffix 8.0.0715 (c) 2008 Dowling Assoc. Licensed to RK ENGINEERING GROUP

EX + A (PM) Tue May 12, 2015 14:34:00 Page 5-1 -------------------------------------------------------------------------------- AGUA MANSA HIGH CUBE WAREHOUSE COUNTY OF SAN BERNARDINO OPENING YEAR (2017) WITHOUT RELATED PROJ WITHOUT PROJ CONDITIONS -------------------------------------------------------------------------------- Level Of Service Computation Report 2000 HCM Unsignalized Method (Future Volume Alternative) ********************************************************************************Intersection #4 KININGHAM DRIVE (NS) AT EL RAVINO ROAD (EW) ********************************************************************************Average Delay (sec/veh): 0.9 Worst Case Level Of Service: A[ 9.1]********************************************************************************Approach: North Bound South Bound East Bound West Bound Movement: L - T - R L - T - R L - T - R L - T - R ------------|---------------||---------------||---------------||---------------|Control: Stop Sign Stop Sign Uncontrolled UncontrolledRights: Include Include Include Include Lanes: 0 0 0 0 0 0 0 1! 0 0 0 1 0 0 0 0 0 0 1 0 ------------|---------------||---------------||---------------||---------------|Volume Module:Base Vol: 0 0 0 2 0 9 12 96 0 0 93 10 Growth Adj: 1.06 1.06 1.06 1.06 1.06 1.06 1.06 1.06 1.06 1.06 1.06 1.06 Initial Bse: 0 0 0 2 0 10 13 102 0 0 99 11 Added Vol: 0 0 0 0 0 0 0 0 0 0 0 0 PasserByVol: 0 0 0 0 0 0 0 0 0 0 0 0 Initial Fut: 0 0 0 2 0 10 13 102 0 0 99 11 User Adj: 1.00 1.00 1.00 1.00 1.00 1.00 1.00 1.00 1.00 1.00 1.00 1.00 PHF Adj: 0.89 0.89 0.89 0.89 0.89 0.89 0.89 0.89 0.89 0.89 0.89 0.89 PHF Volume: 0 0 0 2 0 11 14 114 0 0 110 12 Reduct Vol: 0 0 0 0 0 0 0 0 0 0 0 0 FinalVolume: 0 0 0 2 0 11 14 114 0 0 110 12 ------------|---------------||---------------||---------------||---------------|Critical Gap Module:Critical Gp:xxxxx xxxx xxxxx 6.4 6.5 6.2 4.1 xxxx xxxxx xxxxx xxxx xxxxx FollowUpTim:xxxxx xxxx xxxxx 3.5 4.0 3.3 2.2 xxxx xxxxx xxxxx xxxx xxxxx ------------|---------------||---------------||---------------||---------------|Capacity Module:Cnflict Vol: xxxx xxxx xxxxx 258 258 116 122 xxxx xxxxx xxxx xxxx xxxxx Potent Cap.: xxxx xxxx xxxxx 735 649 941 1478 xxxx xxxxx xxxx xxxx xxxxx Move Cap.: xxxx xxxx xxxxx 729 643 941 1478 xxxx xxxxx xxxx xxxx xxxxx Volume/Cap: xxxx xxxx xxxx 0.00 0.00 0.01 0.01 xxxx xxxx xxxx xxxx xxxx ------------|---------------||---------------||---------------||---------------|Level Of Service Module:2Way95thQ: xxxx xxxx xxxxx xxxx xxxx xxxxx 0.0 xxxx xxxxx xxxx xxxx xxxxx Control Del:xxxxx xxxx xxxxx xxxxx xxxx xxxxx 7.5 xxxx xxxxx xxxxx xxxx xxxxx LOS by Move: * * * * * * A * * * * * Movement: LT - LTR - RT LT - LTR - RT LT - LTR - RT LT - LTR - RT Shared Cap.: xxxx xxxx xxxxx xxxx 894 xxxxx xxxx xxxx xxxxx xxxx xxxx xxxxx SharedQueue:xxxxx xxxx xxxxx xxxxx 0.0 xxxxx 0.0 xxxx xxxxx xxxxx xxxx xxxxx Shrd ConDel:xxxxx xxxx xxxxx xxxxx 9.1 xxxxx 7.5 xxxx xxxxx xxxxx xxxx xxxxx Shared LOS: * * * * A * A * * * * * ApproachDel: xxxxxx 9.1 xxxxxx xxxxxxApproachLOS: * A * * ********************************************************************************Note: Queue reported is the number of cars per lane.********************************************************************************
Traffix 8.0.0715 (c) 2008 Dowling Assoc. Licensed to RK ENGINEERING GROUP

EX + A (AM) Tue May 12, 2015 14:33:10 Page 6-1 -------------------------------------------------------------------------------- AGUA MANSA HIGH CUBE WAREHOUSE COUNTY OF SAN BERNARDINO OPENING YEAR (2017) WITHOUT RELATED PROJ WITHOUT PROJ CONDITIONS -------------------------------------------------------------------------------- Level Of Service Computation Report 2000 HCM Unsignalized Method (Future Volume Alternative) ********************************************************************************Intersection #5 AGUA MANSA ROAD (NS) AT EL RAVINO ROAD (EW) ********************************************************************************Average Delay (sec/veh): 1.7 Worst Case Level Of Service: C[ 18.7]********************************************************************************Approach: North Bound South Bound East Bound West Bound Movement: L - T - R L - T - R L - T - R L - T - R ------------|---------------||---------------||---------------||---------------|Control: Uncontrolled Uncontrolled Stop Sign Stop Sign Rights: Include Include Ignore Include Lanes: 1 0 1 0 0 0 0 0 1 0 1 0 0 0 1 0 0 0 0 0 ------------|---------------||---------------||---------------||---------------|Volume Module:Base Vol: 8 303 0 0 393 40 69 0 22 0 0 0 Growth Adj: 1.06 1.06 1.06 1.06 1.06 1.06 1.06 1.06 1.06 1.06 1.06 1.06 Initial Bse: 8 321 0 0 417 42 73 0 23 0 0 0 Added Vol: 0 0 0 0 0 0 0 0 0 0 0 0 PasserByVol: 0 0 0 0 0 0 0 0 0 0 0 0 Initial Fut: 8 321 0 0 417 42 73 0 23 0 0 0 User Adj: 1.00 1.00 1.00 1.00 1.00 1.00 1.00 1.00 0.00 1.00 1.00 1.00 PHF Adj: 0.93 0.93 0.93 0.93 0.93 0.93 0.93 0.93 0.00 0.93 0.93 0.93 PHF Volume: 9 344 0 0 446 45 78 0 0 0 0 0 Reduct Vol: 0 0 0 0 0 0 0 0 0 0 0 0 FinalVolume: 9 344 0 0 446 45 78 0 0 0 0 0 ------------|---------------||---------------||---------------||---------------|Critical Gap Module:Critical Gp: 4.1 xxxx xxxxx xxxxx xxxx xxxxx 6.4 xxxx 6.2 xxxxx xxxx xxxxx FollowUpTim: 2.2 xxxx xxxxx xxxxx xxxx xxxxx 3.5 xxxx 3.3 xxxxx xxxx xxxxx ------------|---------------||---------------||---------------||---------------|Capacity Module:Cnflict Vol: 492 xxxx xxxxx xxxx xxxx xxxxx 832 xxxx 469 xxxx xxxx xxxxx Potent Cap.: 1082 xxxx xxxxx xxxx xxxx xxxxx 342 xxxx 598 xxxx xxxx xxxxx Move Cap.: 1082 xxxx xxxxx xxxx xxxx xxxxx 340 xxxx 598 xxxx xxxx xxxxx Volume/Cap: 0.01 xxxx xxxx xxxx xxxx xxxx 0.23 xxxx 0.00 xxxx xxxx xxxx ------------|---------------||---------------||---------------||---------------|Level Of Service Module:2Way95thQ: 0.0 xxxx xxxxx xxxx xxxx xxxxx 0.9 xxxx xxxxx xxxx xxxx xxxxx Control Del: 8.4 xxxx xxxxx xxxxx xxxx xxxxx 18.7 xxxx xxxxx xxxxx xxxx xxxxx LOS by Move: A * * * * * C * * * * * Movement: LT - LTR - RT LT - LTR - RT LT - LTR - RT LT - LTR - RT Shared Cap.: xxxx xxxx xxxxx xxxx xxxx xxxxx xxxx xxxx xxxxx xxxx xxxx xxxxx SharedQueue:xxxxx xxxx xxxxx xxxxx xxxx xxxxx xxxxx xxxx xxxxx xxxxx xxxx xxxxx Shrd ConDel:xxxxx xxxx xxxxx xxxxx xxxx xxxxx xxxxx xxxx xxxxx xxxxx xxxx xxxxx Shared LOS: * * * * * * * * * * * * ApproachDel: xxxxxx xxxxxx 18.7 xxxxxxApproachLOS: * * C * ********************************************************************************Note: Queue reported is the number of cars per lane.********************************************************************************
Traffix 8.0.0715 (c) 2008 Dowling Assoc. Licensed to RK ENGINEERING GROUP

EX + A (PM) Tue May 12, 2015 14:34:00 Page 6-1 -------------------------------------------------------------------------------- AGUA MANSA HIGH CUBE WAREHOUSE COUNTY OF SAN BERNARDINO OPENING YEAR (2017) WITHOUT RELATED PROJ WITHOUT PROJ CONDITIONS -------------------------------------------------------------------------------- Level Of Service Computation Report 2000 HCM Unsignalized Method (Future Volume Alternative) ********************************************************************************Intersection #5 AGUA MANSA ROAD (NS) AT EL RAVINO ROAD (EW) ********************************************************************************Average Delay (sec/veh): 8.4 Worst Case Level Of Service: F[ 97.8]********************************************************************************Approach: North Bound South Bound East Bound West Bound Movement: L - T - R L - T - R L - T - R L - T - R ------------|---------------||---------------||---------------||---------------|Control: Uncontrolled Uncontrolled Stop Sign Stop Sign Rights: Include Include Ignore Include Lanes: 1 0 1 0 0 0 0 0 1 0 1 0 0 0 1 0 0 0 0 0 ------------|---------------||---------------||---------------||---------------|Volume Module:Base Vol: 37 652 0 0 315 78 98 0 9 0 0 0 Growth Adj: 1.06 1.06 1.06 1.06 1.06 1.06 1.06 1.06 1.06 1.06 1.06 1.06 Initial Bse: 39 691 0 0 334 83 104 0 10 0 0 0 Added Vol: 0 0 0 0 0 0 0 0 0 0 0 0 PasserByVol: 0 0 0 0 0 0 0 0 0 0 0 0 Initial Fut: 39 691 0 0 334 83 104 0 10 0 0 0 User Adj: 1.00 1.00 1.00 1.00 1.00 1.00 1.00 1.00 0.00 1.00 1.00 1.00 PHF Adj: 0.81 0.81 0.81 0.81 0.81 0.81 0.81 0.81 0.00 0.81 0.81 0.81 PHF Volume: 48 849 0 0 410 102 128 0 0 0 0 0 Reduct Vol: 0 0 0 0 0 0 0 0 0 0 0 0 FinalVolume: 48 849 0 0 410 102 128 0 0 0 0 0 ------------|---------------||---------------||---------------||---------------|Critical Gap Module:Critical Gp: 4.1 xxxx xxxxx xxxxx xxxx xxxxx 6.4 xxxx 6.2 xxxxx xxxx xxxxx FollowUpTim: 2.2 xxxx xxxxx xxxxx xxxx xxxxx 3.5 xxxx 3.3 xxxxx xxxx xxxxx ------------|---------------||---------------||---------------||---------------|Capacity Module:Cnflict Vol: 512 xxxx xxxxx xxxx xxxx xxxxx 1406 xxxx 461 xxxx xxxx xxxxx Potent Cap.: 1064 xxxx xxxxx xxxx xxxx xxxxx 155 xxxx 605 xxxx xxxx xxxxx Move Cap.: 1064 xxxx xxxxx xxxx xxxx xxxxx 150 xxxx 605 xxxx xxxx xxxxx Volume/Cap: 0.05 xxxx xxxx xxxx xxxx xxxx 0.85 xxxx 0.00 xxxx xxxx xxxx ------------|---------------||---------------||---------------||---------------|Level Of Service Module:2Way95thQ: 0.1 xxxx xxxxx xxxx xxxx xxxxx 5.7 xxxx xxxxx xxxx xxxx xxxxx Control Del: 8.5 xxxx xxxxx xxxxx xxxx xxxxx 97.8 xxxx xxxxx xxxxx xxxx xxxxx LOS by Move: A * * * * * F * * * * * Movement: LT - LTR - RT LT - LTR - RT LT - LTR - RT LT - LTR - RT Shared Cap.: xxxx xxxx xxxxx xxxx xxxx xxxxx xxxx xxxx xxxxx xxxx xxxx xxxxx SharedQueue:xxxxx xxxx xxxxx xxxxx xxxx xxxxx xxxxx xxxx xxxxx xxxxx xxxx xxxxx Shrd ConDel:xxxxx xxxx xxxxx xxxxx xxxx xxxxx xxxxx xxxx xxxxx xxxxx xxxx xxxxx Shared LOS: * * * * * * * * * * * * ApproachDel: xxxxxx xxxxxx 97.8 xxxxxxApproachLOS: * * F * ********************************************************************************Note: Queue reported is the number of cars per lane.********************************************************************************
Traffix 8.0.0715 (c) 2008 Dowling Assoc. Licensed to RK ENGINEERING GROUP

EX + A (AM) Tue May 12, 2015 14:33:10 Page 7-1 -------------------------------------------------------------------------------- AGUA MANSA HIGH CUBE WAREHOUSE COUNTY OF SAN BERNARDINO OPENING YEAR (2017) WITHOUT RELATED PROJ WITHOUT PROJ CONDITIONS -------------------------------------------------------------------------------- Level Of Service Computation Report 2000 HCM Operations Method (Future Volume Alternative) ********************************************************************************Intersection #6 RIVERSIDE AVENUE (NS) AT AGUA MANSA ROAD (EW) ********************************************************************************Cycle (sec): 90 Critical Vol./Cap.(X): 0.585Loss Time (sec): 8 Average Delay (sec/veh): 31.1Optimal Cycle: OPTIMIZED Level Of Service: C********************************************************************************Approach: North Bound South Bound East Bound West Bound Movement: L - T - R L - T - R L - T - R L - T - R ------------|---------------||---------------||---------------||---------------|Control: Protected Protected Protected Protected Rights: Include Include Include Include Min. Green: 10 29 29 10 32 32 10 27 27 10 23 23 Y+R: 4.0 4.0 4.0 4.0 4.0 4.0 4.0 4.0 4.0 4.0 4.0 4.0 Lanes: 1 0 1 1 0 1 0 2 0 1 1 0 1 0 1 1 0 1 0 1 ------------|---------------||---------------||---------------||---------------|Volume Module:Base Vol: 152 713 61 78 846 193 159 165 82 59 241 50 Growth Adj: 1.06 1.06 1.06 1.06 1.06 1.06 1.06 1.06 1.06 1.06 1.06 1.06 Initial Bse: 161 756 65 83 897 205 169 175 87 63 255 53 Added Vol: 0 0 0 0 0 0 0 0 0 0 0 0 PasserByVol: 0 0 0 0 0 0 0 0 0 0 0 0 Initial Fut: 161 756 65 83 897 205 169 175 87 63 255 53 User Adj: 1.00 1.00 1.00 1.00 1.00 1.00 1.00 1.00 1.00 1.00 1.00 1.00 PHF Adj: 0.91 0.91 0.91 0.91 0.91 0.91 0.91 0.91 0.91 0.91 0.91 0.91 PHF Volume: 177 831 71 91 985 225 185 192 96 69 281 58 Reduct Vol: 0 0 0 0 0 0 0 0 0 0 0 0 Reduced Vol: 177 831 71 91 985 225 185 192 96 69 281 58 PCE Adj: 1.00 1.00 1.00 1.00 1.00 1.00 1.00 1.00 1.00 1.00 1.00 1.00 MLF Adj: 1.00 1.00 1.00 1.00 1.00 1.00 1.00 1.00 1.00 1.00 1.00 1.00 FinalVolume: 177 831 71 91 985 225 185 192 96 69 281 58 ------------|---------------||---------------||---------------||---------------|Saturation Flow Module:Sat/Lane: 1800 1800 1800 1800 1800 1800 1800 1800 1800 1800 1800 1800 Adjustment: 0.90 0.99 0.99 0.90 1.00 0.85 0.90 1.00 0.85 0.90 1.00 0.85 Lanes: 1.00 1.84 0.16 1.00 2.00 1.00 1.00 1.00 1.00 1.00 1.00 1.00 Final Sat.: 1615 3276 280 1615 3600 1530 1615 1800 1530 1615 1800 1530 ------------|---------------||---------------||---------------||---------------|Capacity Analysis Module:Vol/Sat: 0.11 0.25 0.25 0.06 0.27 0.15 0.11 0.11 0.06 0.04 0.16 0.04 Crit Moves: **** **** **** **** Green/Cycle: 0.14 0.37 0.37 0.13 0.36 0.36 0.13 0.30 0.30 0.11 0.28 0.28 Volume/Cap: 0.77 0.68 0.68 0.44 0.77 0.41 0.90 0.36 0.21 0.38 0.55 0.13 Delay/Veh: 51.4 25.3 25.3 37.7 28.5 22.3 75.4 25.1 23.7 38.5 28.6 24.1 User DelAdj: 1.00 1.00 1.00 1.00 1.00 1.00 1.00 1.00 1.00 1.00 1.00 1.00 AdjDel/Veh: 51.4 25.3 25.3 37.7 28.5 22.3 75.4 25.1 23.7 38.5 28.6 24.1 LOS by Move: D C C D C C E C C D C C HCM2kAvgQ: 7 11 11 3 14 5 9 4 2 2 7 1 ********************************************************************************Note: Queue reported is the number of cars per lane.
Traffix 8.0.0715 (c) 2008 Dowling Assoc. Licensed to RK ENGINEERING GROUP

EX + A (PM) Tue May 12, 2015 14:34:00 Page 7-1 -------------------------------------------------------------------------------- AGUA MANSA HIGH CUBE WAREHOUSE COUNTY OF SAN BERNARDINO OPENING YEAR (2017) WITHOUT RELATED PROJ WITHOUT PROJ CONDITIONS -------------------------------------------------------------------------------- Level Of Service Computation Report 2000 HCM Operations Method (Future Volume Alternative) ********************************************************************************Intersection #6 RIVERSIDE AVENUE (NS) AT AGUA MANSA ROAD (EW) ********************************************************************************Cycle (sec): 90 Critical Vol./Cap.(X): 0.761Loss Time (sec): 8 Average Delay (sec/veh): 34.8Optimal Cycle: OPTIMIZED Level Of Service: C********************************************************************************Approach: North Bound South Bound East Bound West Bound Movement: L - T - R L - T - R L - T - R L - T - R ------------|---------------||---------------||---------------||---------------|Control: Protected Protected Protected Protected Rights: Include Include Include Include Min. Green: 10 29 29 10 32 32 10 27 27 10 23 23 Y+R: 4.0 4.0 4.0 4.0 4.0 4.0 4.0 4.0 4.0 4.0 4.0 4.0 Lanes: 1 0 1 1 0 1 0 2 0 1 1 0 1 0 1 1 0 1 0 1 ------------|---------------||---------------||---------------||---------------|Volume Module:Base Vol: 96 796 68 60 986 138 196 485 119 35 136 38 Growth Adj: 1.06 1.06 1.06 1.06 1.06 1.06 1.06 1.06 1.06 1.06 1.06 1.06 Initial Bse: 102 844 72 64 1045 146 208 514 126 37 144 40 Added Vol: 0 0 0 0 0 0 0 0 0 0 0 0 PasserByVol: 0 0 0 0 0 0 0 0 0 0 0 0 Initial Fut: 102 844 72 64 1045 146 208 514 126 37 144 40 User Adj: 1.00 1.00 1.00 1.00 1.00 1.00 1.00 1.00 1.00 1.00 1.00 1.00 PHF Adj: 0.96 0.96 0.96 0.96 0.96 0.96 0.96 0.96 0.96 0.96 0.96 0.96 PHF Volume: 107 884 75 67 1094 153 218 538 132 39 151 42 Reduct Vol: 0 0 0 0 0 0 0 0 0 0 0 0 Reduced Vol: 107 884 75 67 1094 153 218 538 132 39 151 42 PCE Adj: 1.00 1.00 1.00 1.00 1.00 1.00 1.00 1.00 1.00 1.00 1.00 1.00 MLF Adj: 1.00 1.00 1.00 1.00 1.00 1.00 1.00 1.00 1.00 1.00 1.00 1.00 FinalVolume: 107 884 75 67 1094 153 218 538 132 39 151 42 ------------|---------------||---------------||---------------||---------------|Saturation Flow Module:Sat/Lane: 1800 1800 1800 1800 1800 1800 1800 1800 1800 1800 1800 1800 Adjustment: 0.90 0.99 0.99 0.90 1.00 0.85 0.90 1.00 0.85 0.90 1.00 0.85 Lanes: 1.00 1.84 0.16 1.00 2.00 1.00 1.00 1.00 1.00 1.00 1.00 1.00 Final Sat.: 1615 3277 280 1615 3600 1530 1615 1800 1530 1615 1800 1530 ------------|---------------||---------------||---------------||---------------|Capacity Analysis Module:Vol/Sat: 0.07 0.27 0.27 0.04 0.30 0.10 0.13 0.30 0.09 0.02 0.08 0.03 Crit Moves: **** **** **** **** Green/Cycle: 0.11 0.35 0.35 0.12 0.36 0.36 0.15 0.33 0.33 0.11 0.29 0.29 Volume/Cap: 0.59 0.78 0.78 0.34 0.86 0.28 0.88 0.90 0.26 0.22 0.29 0.09 Delay/Veh: 43.3 29.5 29.5 37.4 32.7 21.1 65.2 44.7 22.2 37.0 25.0 23.4 User DelAdj: 1.00 1.00 1.00 1.00 1.00 1.00 1.00 1.00 1.00 1.00 1.00 1.00 AdjDel/Veh: 43.3 29.5 29.5 37.4 32.7 21.1 65.2 44.7 22.2 37.0 25.0 23.4 LOS by Move: D C C D C C E D C D C C HCM2kAvgQ: 4 14 14 2 17 3 9 18 3 1 3 1 ********************************************************************************Note: Queue reported is the number of cars per lane.
Traffix 8.0.0715 (c) 2008 Dowling Assoc. Licensed to RK ENGINEERING GROUP

Appendix E
Project Opening Year (2017) Without Related Projects With Project Conditions
Intersection Analysis Worksheets

EX + A + P (AM) Tue May 12, 2015 14:35:04 Page 2-1 -------------------------------------------------------------------------------- AGUA MANSA HIGH CUBE WAREHOUSE COUNTY OF SAN BERNARDINO OPENING YEAR (2017) WITH PROJECT W/O RELATED PROJECTS CONDITIONS -------------------------------------------------------------------------------- Level Of Service Computation Report 2000 HCM Operations Method (Future Volume Alternative) ********************************************************************************Intersection #1 CEDAR AVENUE (NS) AT EL RAVINO ROAD (EW) ********************************************************************************Cycle (sec): 110 Critical Vol./Cap.(X): 0.293Loss Time (sec): 8 Average Delay (sec/veh): 17.5Optimal Cycle: OPTIMIZED Level Of Service: B********************************************************************************Approach: North Bound South Bound East Bound West Bound Movement: L - T - R L - T - R L - T - R L - T - R ------------|---------------||---------------||---------------||---------------|Control: Protected Protected Permitted Permitted Rights: Include Include Include Include Min. Green: 10 0 0 10 23 23 10 14 14 10 24 24 Y+R: 4.0 4.0 4.0 4.0 4.0 4.0 4.0 4.0 4.0 4.0 4.0 4.0 Lanes: 1 0 1 1 0 1 0 1 1 0 0 0 1! 0 0 0 1 0 0 1 ------------|---------------||---------------||---------------||---------------|Volume Module:Base Vol: 10 443 47 87 652 6 3 1 6 50 2 39 Growth Adj: 1.06 1.06 1.06 1.06 1.06 1.06 1.06 1.06 1.06 1.06 1.06 1.06 Initial Bse: 11 470 50 92 691 6 3 1 6 53 2 41 Added Vol: 0 0 7 10 0 0 0 0 0 2 0 3 PasserByVol: 0 0 0 0 0 0 0 0 0 0 0 0 Initial Fut: 11 470 57 102 691 6 3 1 6 55 2 44 User Adj: 1.00 1.00 1.00 1.00 1.00 1.00 1.00 1.00 1.00 1.00 1.00 1.00 PHF Adj: 0.90 0.90 0.90 0.90 0.90 0.90 0.90 0.90 0.90 0.90 0.90 0.90 PHF Volume: 12 521 63 113 766 7 4 1 7 61 2 49 Reduct Vol: 0 0 0 0 0 0 0 0 0 0 0 0 Reduced Vol: 12 521 63 113 766 7 4 1 7 61 2 49 PCE Adj: 1.00 1.00 1.00 1.00 1.00 1.00 1.00 1.00 1.00 1.00 1.00 1.00 MLF Adj: 1.00 1.00 1.00 1.00 1.00 1.00 1.00 1.00 1.00 1.00 1.00 1.00 FinalVolume: 12 521 63 113 766 7 4 1 7 61 2 49 ------------|---------------||---------------||---------------||---------------|Saturation Flow Module:Sat/Lane: 1800 1800 1800 1800 1800 1800 1800 1800 1800 1800 1800 1800 Adjustment: 0.90 0.98 0.98 0.90 1.00 1.00 0.83 0.88 0.88 0.71 0.75 0.85 Lanes: 1.00 1.78 0.22 1.00 1.98 0.02 0.31 0.10 0.59 0.96 0.04 1.00 Final Sat.: 1615 3160 382 1615 3564 33 466 155 931 1230 47 1530 ------------|---------------||---------------||---------------||---------------|Capacity Analysis Module:Vol/Sat: 0.01 0.16 0.16 0.07 0.22 0.22 0.01 0.01 0.01 0.05 0.05 0.03 Crit Moves: **** **** **** Green/Cycle: 0.09 0.46 0.46 0.25 0.62 0.62 0.22 0.22 0.22 0.22 0.22 0.22 Volume/Cap: 0.08 0.36 0.36 0.28 0.35 0.35 0.03 0.03 0.03 0.23 0.23 0.15 Delay/Veh: 46.0 19.6 19.6 33.5 10.3 10.3 33.9 33.9 33.9 35.8 35.8 34.9 User DelAdj: 1.00 1.00 1.00 1.00 1.00 1.00 1.00 1.00 1.00 1.00 1.00 1.00 AdjDel/Veh: 46.0 19.6 19.6 33.5 10.3 10.3 33.9 33.9 33.9 35.8 35.8 34.9 LOS by Move: D B B C B B C C C D D C HCM2kAvgQ: 0 6 6 3 6 6 0 0 0 2 2 1 ********************************************************************************Note: Queue reported is the number of cars per lane.
Traffix 8.0.0715 (c) 2008 Dowling Assoc. Licensed to RK ENGINEERING GROUP

EX + A + P (PM) Tue May 12, 2015 14:35:46 Page 2-1 -------------------------------------------------------------------------------- AGUA MANSA HIGH CUBE WAREHOUSE COUNTY OF SAN BERNARDINO OPENING YEAR (2017) WITH PROJECT W/O RELATED PROJECTS CONDITIONS -------------------------------------------------------------------------------- Level Of Service Computation Report 2000 HCM Operations Method (Future Volume Alternative) ********************************************************************************Intersection #1 CEDAR AVENUE (NS) AT EL RAVINO ROAD (EW) ********************************************************************************Cycle (sec): 95 Critical Vol./Cap.(X): 0.323Loss Time (sec): 8 Average Delay (sec/veh): 17.6Optimal Cycle: OPTIMIZED Level Of Service: B********************************************************************************Approach: North Bound South Bound East Bound West Bound Movement: L - T - R L - T - R L - T - R L - T - R ------------|---------------||---------------||---------------||---------------|Control: Protected Protected Permitted Permitted Rights: Include Include Include Include Min. Green: 10 0 0 10 23 23 10 14 14 10 24 24 Y+R: 4.0 4.0 4.0 4.0 4.0 4.0 4.0 4.0 4.0 4.0 4.0 4.0 Lanes: 1 0 1 1 0 1 0 1 1 0 0 0 1! 0 0 0 1 0 0 1 ------------|---------------||---------------||---------------||---------------|Volume Module:Base Vol: 7 669 56 67 702 8 9 7 14 45 12 88 Growth Adj: 1.06 1.06 1.06 1.06 1.06 1.06 1.06 1.06 1.06 1.06 1.06 1.06 Initial Bse: 7 709 59 71 744 8 10 7 15 48 13 93 Added Vol: 0 0 3 3 0 0 0 0 0 8 0 10 PasserByVol: 0 0 0 0 0 0 0 0 0 0 0 0 Initial Fut: 7 709 62 74 744 8 10 7 15 56 13 103 User Adj: 1.00 1.00 1.00 1.00 1.00 1.00 1.00 1.00 1.00 1.00 1.00 1.00 PHF Adj: 0.95 0.95 0.95 0.95 0.95 0.95 0.95 0.95 0.95 0.95 0.95 0.95 PHF Volume: 8 744 65 78 781 9 10 8 16 58 13 108 Reduct Vol: 0 0 0 0 0 0 0 0 0 0 0 0 Reduced Vol: 8 744 65 78 781 9 10 8 16 58 13 108 PCE Adj: 1.00 1.00 1.00 1.00 1.00 1.00 1.00 1.00 1.00 1.00 1.00 1.00 MLF Adj: 1.00 1.00 1.00 1.00 1.00 1.00 1.00 1.00 1.00 1.00 1.00 1.00 FinalVolume: 8 744 65 78 781 9 10 8 16 58 13 108 ------------|---------------||---------------||---------------||---------------|Saturation Flow Module:Sat/Lane: 1800 1800 1800 1800 1800 1800 1800 1800 1800 1800 1800 1800 Adjustment: 0.90 0.99 0.99 0.90 1.00 1.00 0.83 0.88 0.88 0.74 0.78 0.85 Lanes: 1.00 1.84 0.16 1.00 1.98 0.02 0.31 0.23 0.46 0.82 0.18 1.00 Final Sat.: 1615 3269 287 1615 3552 40 467 363 726 1089 249 1530 ------------|---------------||---------------||---------------||---------------|Capacity Analysis Module:Vol/Sat: 0.00 0.23 0.23 0.05 0.22 0.22 0.02 0.02 0.02 0.05 0.05 0.07 Crit Moves: **** **** ****Green/Cycle: 0.11 0.45 0.45 0.21 0.56 0.56 0.25 0.25 0.25 0.25 0.25 0.25 Volume/Cap: 0.05 0.50 0.50 0.23 0.39 0.39 0.08 0.08 0.08 0.21 0.21 0.28 Delay/Veh: 38.3 18.6 18.6 31.5 12.0 12.0 27.2 27.2 27.2 28.4 28.4 29.0 User DelAdj: 1.00 1.00 1.00 1.00 1.00 1.00 1.00 1.00 1.00 1.00 1.00 1.00 AdjDel/Veh: 38.3 18.6 18.6 31.5 12.0 12.0 27.2 27.2 27.2 28.4 28.4 29.0 LOS by Move: D B B C B B C C C C C C HCM2kAvgQ: 0 9 9 2 7 7 1 1 1 2 2 3 ********************************************************************************Note: Queue reported is the number of cars per lane.
Traffix 8.0.0715 (c) 2008 Dowling Assoc. Licensed to RK ENGINEERING GROUP

EX + A + P (AM) Tue May 12, 2015 14:35:04 Page 3-1 -------------------------------------------------------------------------------- AGUA MANSA HIGH CUBE WAREHOUSE COUNTY OF SAN BERNARDINO OPENING YEAR (2017) WITH PROJECT W/O RELATED PROJECTS CONDITIONS -------------------------------------------------------------------------------- Level Of Service Computation Report 2000 HCM Operations Method (Future Volume Alternative) ********************************************************************************Intersection #2 CACTUS AVENUE (NS) AT EL RAVINO ROAD (EW) ********************************************************************************Cycle (sec): 60 Critical Vol./Cap.(X): 0.205Loss Time (sec): 8 Average Delay (sec/veh): 12.0Optimal Cycle: OPTIMIZED Level Of Service: B********************************************************************************Approach: North Bound South Bound East Bound West Bound Movement: L - T - R L - T - R L - T - R L - T - R ------------|---------------||---------------||---------------||---------------|Control: Protected Protected Protected Permitted Rights: Include Include Include Include Min. Green: 0 0 0 10 0 0 10 0 0 0 0 0 Y+R: 4.0 4.0 4.0 4.0 4.0 4.0 4.0 4.0 4.0 4.0 4.0 4.0 Lanes: 0 0 0 0 0 1 0 0 0 1 0 1 0 0 0 0 0 0 1 0 ------------|---------------||---------------||---------------||---------------|Volume Module:Base Vol: 0 0 0 25 0 31 19 68 0 0 81 20 Growth Adj: 1.06 1.06 1.06 1.06 1.06 1.06 1.06 1.06 1.06 1.06 1.06 1.06 Initial Bse: 0 0 0 27 0 33 20 72 0 0 86 21 Added Vol: 0 0 0 2 0 0 0 17 0 0 6 1 PasserByVol: 0 0 0 0 0 0 0 0 0 0 0 0 Initial Fut: 0 0 0 29 0 33 20 89 0 0 92 22 User Adj: 1.00 1.00 1.00 1.00 1.00 1.00 1.00 1.00 1.00 1.00 1.00 1.00 PHF Adj: 0.81 0.81 0.81 0.81 0.81 0.81 0.81 0.81 0.81 0.81 0.81 0.81 PHF Volume: 0 0 0 35 0 40 25 110 0 0 113 27 Reduct Vol: 0 0 0 0 0 0 0 0 0 0 0 0 Reduced Vol: 0 0 0 35 0 40 25 110 0 0 113 27 PCE Adj: 1.00 1.00 1.00 1.00 1.00 1.00 1.00 1.00 1.00 1.00 1.00 1.00 MLF Adj: 1.00 1.00 1.00 1.00 1.00 1.00 1.00 1.00 1.00 1.00 1.00 1.00 FinalVolume: 0 0 0 35 0 40 25 110 0 0 113 27 ------------|---------------||---------------||---------------||---------------|Saturation Flow Module:Sat/Lane: 1800 1800 1800 1800 1800 1800 1800 1800 1800 1800 1800 1800 Adjustment: 0.94 1.00 1.00 0.90 1.00 0.85 0.94 0.99 1.00 0.94 0.97 0.97 Lanes: 0.00 0.00 0.00 1.00 0.00 1.00 0.19 0.81 0.00 0.00 0.81 0.19 Final Sat.: 0 0 0 1615 0 1530 325 1439 0 0 1412 341 ------------|---------------||---------------||---------------||---------------|Capacity Analysis Module:Vol/Sat: 0.00 0.00 0.00 0.02 0.00 0.03 0.08 0.08 0.00 0.00 0.08 0.08 Crit Moves: **** **** **** Green/Cycle: 0.00 0.00 0.00 0.17 0.00 0.17 0.34 0.70 0.00 0.00 0.36 0.36 Volume/Cap: 0.00 0.00 0.00 0.13 0.00 0.16 0.22 0.11 0.00 0.00 0.22 0.22 Delay/Veh: 0.0 0.0 0.0 21.5 0.0 21.7 14.3 3.0 0.0 0.0 13.6 13.6 User DelAdj: 1.00 1.00 1.00 1.00 1.00 1.00 1.00 1.00 1.00 1.00 1.00 1.00 AdjDel/Veh: 0.0 0.0 0.0 21.5 0.0 21.7 14.3 3.0 0.0 0.0 13.6 13.6 LOS by Move: A A A C A C B A A A B B HCM2kAvgQ: 0 0 0 1 0 1 1 1 0 0 2 2 ********************************************************************************Note: Queue reported is the number of cars per lane.
Traffix 8.0.0715 (c) 2008 Dowling Assoc. Licensed to RK ENGINEERING GROUP

EX + A + P (PM) Tue May 12, 2015 14:35:46 Page 3-1 -------------------------------------------------------------------------------- AGUA MANSA HIGH CUBE WAREHOUSE COUNTY OF SAN BERNARDINO OPENING YEAR (2017) WITH PROJECT W/O RELATED PROJECTS CONDITIONS -------------------------------------------------------------------------------- Level Of Service Computation Report 2000 HCM Operations Method (Future Volume Alternative) ********************************************************************************Intersection #2 CACTUS AVENUE (NS) AT EL RAVINO ROAD (EW) ********************************************************************************Cycle (sec): 60 Critical Vol./Cap.(X): 0.279Loss Time (sec): 8 Average Delay (sec/veh): 11.6Optimal Cycle: OPTIMIZED Level Of Service: B********************************************************************************Approach: North Bound South Bound East Bound West Bound Movement: L - T - R L - T - R L - T - R L - T - R ------------|---------------||---------------||---------------||---------------|Control: Protected Protected Protected Permitted Rights: Include Include Include Include Min. Green: 0 0 0 10 0 0 10 0 0 0 0 0 Y+R: 4.0 4.0 4.0 4.0 4.0 4.0 4.0 4.0 4.0 4.0 4.0 4.0 Lanes: 0 0 0 0 0 1 0 0 0 1 0 1 0 0 0 0 0 0 1 0 ------------|---------------||---------------||---------------||---------------|Volume Module:Base Vol: 0 0 0 14 0 26 41 99 0 0 97 53 Growth Adj: 1.06 1.06 1.06 1.06 1.06 1.06 1.06 1.06 1.06 1.06 1.06 1.06 Initial Bse: 0 0 0 15 0 28 43 105 0 0 103 56 Added Vol: 0 0 0 1 0 0 0 6 0 0 18 3 PasserByVol: 0 0 0 0 0 0 0 0 0 0 0 0 Initial Fut: 0 0 0 16 0 28 43 111 0 0 121 59 User Adj: 1.00 1.00 1.00 1.00 1.00 1.00 1.00 1.00 1.00 1.00 1.00 1.00 PHF Adj: 0.84 0.84 0.84 0.84 0.84 0.84 0.84 0.84 0.84 0.84 0.84 0.84 PHF Volume: 0 0 0 19 0 33 52 132 0 0 144 71 Reduct Vol: 0 0 0 0 0 0 0 0 0 0 0 0 Reduced Vol: 0 0 0 19 0 33 52 132 0 0 144 71 PCE Adj: 1.00 1.00 1.00 1.00 1.00 1.00 1.00 1.00 1.00 1.00 1.00 1.00 MLF Adj: 1.00 1.00 1.00 1.00 1.00 1.00 1.00 1.00 1.00 1.00 1.00 1.00 FinalVolume: 0 0 0 19 0 33 52 132 0 0 144 71 ------------|---------------||---------------||---------------||---------------|Saturation Flow Module:Sat/Lane: 1800 1800 1800 1800 1800 1800 1800 1800 1800 1800 1800 1800 Adjustment: 0.94 1.00 1.00 0.90 1.00 0.85 0.93 0.99 1.00 0.94 0.96 0.96 Lanes: 0.00 0.00 0.00 1.00 0.00 1.00 0.29 0.71 0.00 0.00 0.67 0.33 Final Sat.: 0 0 0 1615 0 1530 491 1254 0 0 1155 566 ------------|---------------||---------------||---------------||---------------|Capacity Analysis Module:Vol/Sat: 0.00 0.00 0.00 0.01 0.00 0.02 0.11 0.11 0.00 0.00 0.12 0.12 Crit Moves: **** **** **** Green/Cycle: 0.00 0.00 0.00 0.17 0.00 0.17 0.32 0.70 0.00 0.00 0.38 0.38 Volume/Cap: 0.00 0.00 0.00 0.07 0.00 0.13 0.33 0.15 0.00 0.00 0.33 0.33 Delay/Veh: 0.0 0.0 0.0 21.2 0.0 21.5 15.8 3.1 0.0 0.0 13.5 13.5 User DelAdj: 1.00 1.00 1.00 1.00 1.00 1.00 1.00 1.00 1.00 1.00 1.00 1.00 AdjDel/Veh: 0.0 0.0 0.0 21.2 0.0 21.5 15.8 3.1 0.0 0.0 13.5 13.5 LOS by Move: A A A C A C B A A A B B HCM2kAvgQ: 0 0 0 0 0 1 1 1 0 0 3 3 ********************************************************************************Note: Queue reported is the number of cars per lane.
Traffix 8.0.0715 (c) 2008 Dowling Assoc. Licensed to RK ENGINEERING GROUP

EX + A + P (AM) Tue May 12, 2015 14:35:04 Page 4-1 -------------------------------------------------------------------------------- AGUA MANSA HIGH CUBE WAREHOUSE COUNTY OF SAN BERNARDINO OPENING YEAR (2017) WITH PROJECT W/O RELATED PROJECTS CONDITIONS -------------------------------------------------------------------------------- Level Of Service Computation Report 2000 HCM Unsignalized Method (Future Volume Alternative) ********************************************************************************Intersection #3 HALL AVENUE (NS) AT EL RAVINO ROAD (EW) ********************************************************************************Average Delay (sec/veh): 2.0 Worst Case Level Of Service: B[ 10.4]********************************************************************************Approach: North Bound South Bound East Bound West Bound Movement: L - T - R L - T - R L - T - R L - T - R ------------|---------------||---------------||---------------||---------------|Control: Stop Sign Stop Sign Uncontrolled UncontrolledRights: Include Include Include Include Lanes: 0 0 1! 0 0 0 0 1! 0 0 0 0 1! 0 0 0 0 1! 0 0 ------------|---------------||---------------||---------------||---------------|Volume Module:Base Vol: 17 1 14 12 3 4 4 83 27 1 80 3 Growth Adj: 1.06 1.06 1.06 1.06 1.06 1.06 1.06 1.06 1.06 1.06 1.06 1.06 Initial Bse: 18 1 15 13 3 4 4 88 29 1 85 3 Added Vol: 0 0 0 0 0 0 0 19 0 0 6 0 PasserByVol: 0 0 0 0 0 0 0 0 0 0 0 0 Initial Fut: 18 1 15 13 3 4 4 107 29 1 91 3 User Adj: 1.00 1.00 1.00 1.00 1.00 1.00 1.00 1.00 1.00 1.00 1.00 1.00 PHF Adj: 0.83 0.83 0.83 0.83 0.83 0.83 0.83 0.83 0.83 0.83 0.83 0.83 PHF Volume: 22 1 18 15 4 5 5 130 35 1 110 4 Reduct Vol: 0 0 0 0 0 0 0 0 0 0 0 0 FinalVolume: 22 1 18 15 4 5 5 130 35 1 110 4 ------------|---------------||---------------||---------------||---------------|Critical Gap Module:Critical Gp: 7.1 6.5 6.2 7.1 6.5 6.2 4.1 xxxx xxxxx 4.1 xxxx xxxxx FollowUpTim: 3.5 4.0 3.3 3.5 4.0 3.3 2.2 xxxx xxxxx 2.2 xxxx xxxxx ------------|---------------||---------------||---------------||---------------|Capacity Module:Cnflict Vol: 276 274 147 281 289 112 114 xxxx xxxxx 164 xxxx xxxxx Potent Cap.: 680 637 905 675 624 947 1488 xxxx xxxxx 1426 xxxx xxxxx Move Cap.: 671 634 905 658 622 947 1488 xxxx xxxxx 1426 xxxx xxxxx Volume/Cap: 0.03 0.00 0.02 0.02 0.01 0.01 0.00 xxxx xxxx 0.00 xxxx xxxx ------------|---------------||---------------||---------------||---------------|Level Of Service Module:2Way95thQ: xxxx xxxx xxxxx xxxx xxxx xxxxx 0.0 xxxx xxxxx 0.0 xxxx xxxxx Control Del:xxxxx xxxx xxxxx xxxxx xxxx xxxxx 7.4 xxxx xxxxx 7.5 xxxx xxxxx LOS by Move: * * * * * * A * * A * * Movement: LT - LTR - RT LT - LTR - RT LT - LTR - RT LT - LTR - RT Shared Cap.: xxxx 755 xxxxx xxxx 696 xxxxx xxxx xxxx xxxxx xxxx xxxx xxxxx SharedQueue:xxxxx 0.2 xxxxx xxxxx 0.1 xxxxx xxxxx xxxx xxxxx xxxxx xxxx xxxxx Shrd ConDel:xxxxx 10.0 xxxxx xxxxx 10.4 xxxxx xxxxx xxxx xxxxx xxxxx xxxx xxxxx Shared LOS: * B * * B * * * * * * * ApproachDel: 10.0 10.4 xxxxxx xxxxxxApproachLOS: B B * * ********************************************************************************Note: Queue reported is the number of cars per lane.********************************************************************************
Traffix 8.0.0715 (c) 2008 Dowling Assoc. Licensed to RK ENGINEERING GROUP
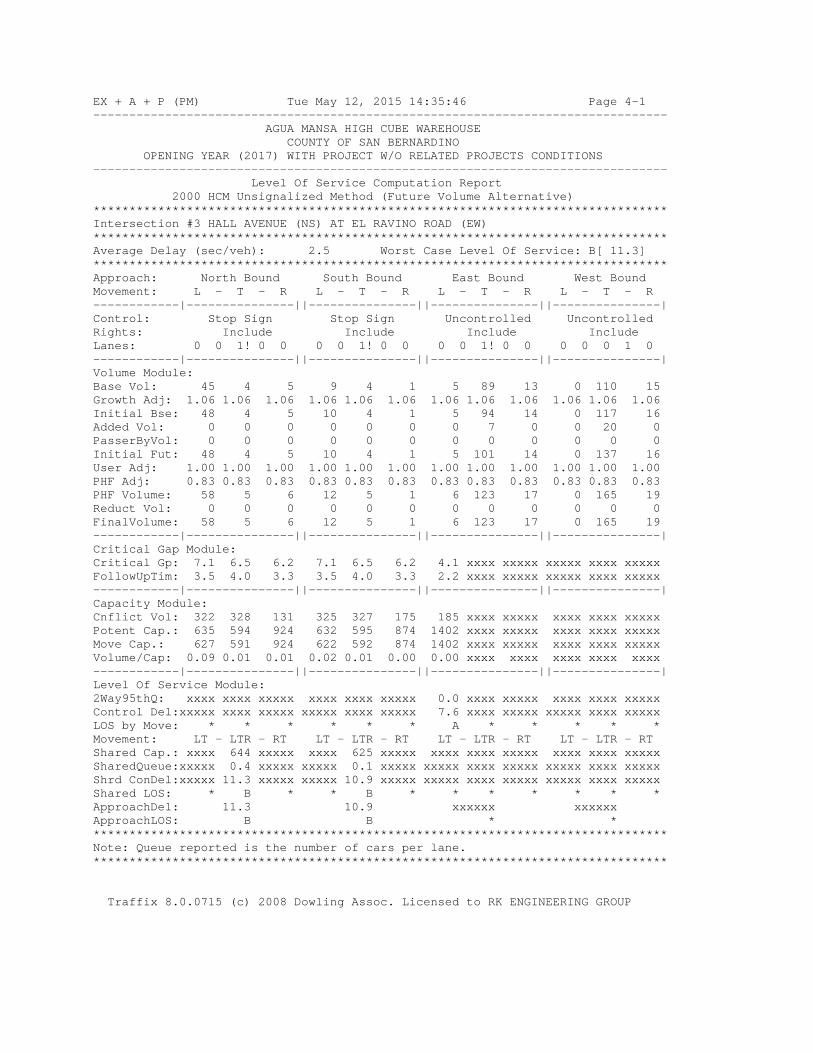
EX + A + P (PM) Tue May 12, 2015 14:35:46 Page 4-1 -------------------------------------------------------------------------------- AGUA MANSA HIGH CUBE WAREHOUSE COUNTY OF SAN BERNARDINO OPENING YEAR (2017) WITH PROJECT W/O RELATED PROJECTS CONDITIONS -------------------------------------------------------------------------------- Level Of Service Computation Report 2000 HCM Unsignalized Method (Future Volume Alternative) ********************************************************************************Intersection #3 HALL AVENUE (NS) AT EL RAVINO ROAD (EW) ********************************************************************************Average Delay (sec/veh): 2.5 Worst Case Level Of Service: B[ 11.3]********************************************************************************Approach: North Bound South Bound East Bound West Bound Movement: L - T - R L - T - R L - T - R L - T - R ------------|---------------||---------------||---------------||---------------|Control: Stop Sign Stop Sign Uncontrolled UncontrolledRights: Include Include Include Include Lanes: 0 0 1! 0 0 0 0 1! 0 0 0 0 1! 0 0 0 0 0 1 0 ------------|---------------||---------------||---------------||---------------|Volume Module:Base Vol: 45 4 5 9 4 1 5 89 13 0 110 15 Growth Adj: 1.06 1.06 1.06 1.06 1.06 1.06 1.06 1.06 1.06 1.06 1.06 1.06 Initial Bse: 48 4 5 10 4 1 5 94 14 0 117 16 Added Vol: 0 0 0 0 0 0 0 7 0 0 20 0 PasserByVol: 0 0 0 0 0 0 0 0 0 0 0 0 Initial Fut: 48 4 5 10 4 1 5 101 14 0 137 16 User Adj: 1.00 1.00 1.00 1.00 1.00 1.00 1.00 1.00 1.00 1.00 1.00 1.00 PHF Adj: 0.83 0.83 0.83 0.83 0.83 0.83 0.83 0.83 0.83 0.83 0.83 0.83 PHF Volume: 58 5 6 12 5 1 6 123 17 0 165 19 Reduct Vol: 0 0 0 0 0 0 0 0 0 0 0 0 FinalVolume: 58 5 6 12 5 1 6 123 17 0 165 19 ------------|---------------||---------------||---------------||---------------|Critical Gap Module:Critical Gp: 7.1 6.5 6.2 7.1 6.5 6.2 4.1 xxxx xxxxx xxxxx xxxx xxxxx FollowUpTim: 3.5 4.0 3.3 3.5 4.0 3.3 2.2 xxxx xxxxx xxxxx xxxx xxxxx ------------|---------------||---------------||---------------||---------------|Capacity Module:Cnflict Vol: 322 328 131 325 327 175 185 xxxx xxxxx xxxx xxxx xxxxx Potent Cap.: 635 594 924 632 595 874 1402 xxxx xxxxx xxxx xxxx xxxxx Move Cap.: 627 591 924 622 592 874 1402 xxxx xxxxx xxxx xxxx xxxxx Volume/Cap: 0.09 0.01 0.01 0.02 0.01 0.00 0.00 xxxx xxxx xxxx xxxx xxxx ------------|---------------||---------------||---------------||---------------|Level Of Service Module:2Way95thQ: xxxx xxxx xxxxx xxxx xxxx xxxxx 0.0 xxxx xxxxx xxxx xxxx xxxxx Control Del:xxxxx xxxx xxxxx xxxxx xxxx xxxxx 7.6 xxxx xxxxx xxxxx xxxx xxxxx LOS by Move: * * * * * * A * * * * * Movement: LT - LTR - RT LT - LTR - RT LT - LTR - RT LT - LTR - RT Shared Cap.: xxxx 644 xxxxx xxxx 625 xxxxx xxxx xxxx xxxxx xxxx xxxx xxxxx SharedQueue:xxxxx 0.4 xxxxx xxxxx 0.1 xxxxx xxxxx xxxx xxxxx xxxxx xxxx xxxxx Shrd ConDel:xxxxx 11.3 xxxxx xxxxx 10.9 xxxxx xxxxx xxxx xxxxx xxxxx xxxx xxxxx Shared LOS: * B * * B * * * * * * * ApproachDel: 11.3 10.9 xxxxxx xxxxxxApproachLOS: B B * * ********************************************************************************Note: Queue reported is the number of cars per lane.********************************************************************************
Traffix 8.0.0715 (c) 2008 Dowling Assoc. Licensed to RK ENGINEERING GROUP

EX + A + P (AM) Tue May 12, 2015 14:35:04 Page 5-1 -------------------------------------------------------------------------------- AGUA MANSA HIGH CUBE WAREHOUSE COUNTY OF SAN BERNARDINO OPENING YEAR (2017) WITH PROJECT W/O RELATED PROJECTS CONDITIONS -------------------------------------------------------------------------------- Level Of Service Computation Report 2000 HCM Unsignalized Method (Future Volume Alternative) ********************************************************************************Intersection #4 KININGHAM DRIVE (NS) AT EL RAVINO ROAD (EW) ********************************************************************************Average Delay (sec/veh): 1.1 Worst Case Level Of Service: A[ 9.1]********************************************************************************Approach: North Bound South Bound East Bound West Bound Movement: L - T - R L - T - R L - T - R L - T - R ------------|---------------||---------------||---------------||---------------|Control: Stop Sign Stop Sign Uncontrolled UncontrolledRights: Include Include Include Include Lanes: 0 0 0 0 0 0 0 1! 0 0 0 1 0 0 0 0 0 0 1 0 ------------|---------------||---------------||---------------||---------------|Volume Module:Base Vol: 0 0 0 2 0 1 3 90 0 0 77 1 Growth Adj: 1.06 1.06 1.06 1.06 1.06 1.06 1.06 1.06 1.06 1.06 1.06 1.06 Initial Bse: 0 0 0 2 0 1 3 95 0 0 82 1 Added Vol: 0 0 0 0 0 6 18 1 0 0 0 1 PasserByVol: 0 0 0 0 0 0 0 0 0 0 0 0 Initial Fut: 0 0 0 2 0 7 21 96 0 0 82 2 User Adj: 1.00 1.00 1.00 1.00 1.00 1.00 1.00 1.00 1.00 1.00 1.00 1.00 PHF Adj: 0.79 0.79 0.79 0.79 0.79 0.79 0.79 0.79 0.79 0.79 0.79 0.79 PHF Volume: 0 0 0 3 0 9 27 122 0 0 103 3 Reduct Vol: 0 0 0 0 0 0 0 0 0 0 0 0 FinalVolume: 0 0 0 3 0 9 27 122 0 0 103 3 ------------|---------------||---------------||---------------||---------------|Critical Gap Module:Critical Gp:xxxxx xxxx xxxxx 6.4 6.5 6.2 4.1 xxxx xxxxx xxxxx xxxx xxxxx FollowUpTim:xxxxx xxxx xxxxx 3.5 4.0 3.3 2.2 xxxx xxxxx xxxxx xxxx xxxxx ------------|---------------||---------------||---------------||---------------|Capacity Module:Cnflict Vol: xxxx xxxx xxxxx 280 280 104 106 xxxx xxxxx xxxx xxxx xxxxx Potent Cap.: xxxx xxxx xxxxx 714 632 956 1498 xxxx xxxxx xxxx xxxx xxxxx Move Cap.: xxxx xxxx xxxxx 704 620 956 1498 xxxx xxxxx xxxx xxxx xxxxx Volume/Cap: xxxx xxxx xxxx 0.00 0.00 0.01 0.02 xxxx xxxx xxxx xxxx xxxx ------------|---------------||---------------||---------------||---------------|Level Of Service Module:2Way95thQ: xxxx xxxx xxxxx xxxx xxxx xxxxx 0.1 xxxx xxxxx xxxx xxxx xxxxx Control Del:xxxxx xxxx xxxxx xxxxx xxxx xxxxx 7.4 xxxx xxxxx xxxxx xxxx xxxxx LOS by Move: * * * * * * A * * * * * Movement: LT - LTR - RT LT - LTR - RT LT - LTR - RT LT - LTR - RT Shared Cap.: xxxx xxxx xxxxx xxxx 883 xxxxx xxxx xxxx xxxxx xxxx xxxx xxxxx SharedQueue:xxxxx xxxx xxxxx xxxxx 0.0 xxxxx 0.1 xxxx xxxxx xxxxx xxxx xxxxx Shrd ConDel:xxxxx xxxx xxxxx xxxxx 9.1 xxxxx 7.4 xxxx xxxxx xxxxx xxxx xxxxx Shared LOS: * * * * A * A * * * * * ApproachDel: xxxxxx 9.1 xxxxxx xxxxxxApproachLOS: * A * * ********************************************************************************Note: Queue reported is the number of cars per lane.********************************************************************************
Traffix 8.0.0715 (c) 2008 Dowling Assoc. Licensed to RK ENGINEERING GROUP

EX + A + P (PM) Tue May 12, 2015 14:35:46 Page 5-1 -------------------------------------------------------------------------------- AGUA MANSA HIGH CUBE WAREHOUSE COUNTY OF SAN BERNARDINO OPENING YEAR (2017) WITH PROJECT W/O RELATED PROJECTS CONDITIONS -------------------------------------------------------------------------------- Level Of Service Computation Report 2000 HCM Unsignalized Method (Future Volume Alternative) ********************************************************************************Intersection #4 KININGHAM DRIVE (NS) AT EL RAVINO ROAD (EW) ********************************************************************************Average Delay (sec/veh): 1.6 Worst Case Level Of Service: A[ 9.2]********************************************************************************Approach: North Bound South Bound East Bound West Bound Movement: L - T - R L - T - R L - T - R L - T - R ------------|---------------||---------------||---------------||---------------|Control: Stop Sign Stop Sign Uncontrolled UncontrolledRights: Include Include Include Include Lanes: 0 0 0 0 0 0 0 1! 0 0 0 1 0 0 0 0 0 0 1 0 ------------|---------------||---------------||---------------||---------------|Volume Module:Base Vol: 0 0 0 2 0 9 12 96 0 0 93 10 Growth Adj: 1.06 1.06 1.06 1.06 1.06 1.06 1.06 1.06 1.06 1.06 1.06 1.06 Initial Bse: 0 0 0 2 0 10 13 102 0 0 99 11 Added Vol: 0 0 0 2 0 19 6 1 0 0 2 1 PasserByVol: 0 0 0 0 0 0 0 0 0 0 0 0 Initial Fut: 0 0 0 4 0 29 19 103 0 0 101 12 User Adj: 1.00 1.00 1.00 1.00 1.00 1.00 1.00 1.00 1.00 1.00 1.00 1.00 PHF Adj: 0.89 0.89 0.89 0.89 0.89 0.89 0.89 0.89 0.89 0.89 0.89 0.89 PHF Volume: 0 0 0 5 0 32 21 115 0 0 113 13 Reduct Vol: 0 0 0 0 0 0 0 0 0 0 0 0 FinalVolume: 0 0 0 5 0 32 21 115 0 0 113 13 ------------|---------------||---------------||---------------||---------------|Critical Gap Module:Critical Gp:xxxxx xxxx xxxxx 6.4 6.5 6.2 4.1 xxxx xxxxx xxxxx xxxx xxxxx FollowUpTim:xxxxx xxxx xxxxx 3.5 4.0 3.3 2.2 xxxx xxxxx xxxxx xxxx xxxxx ------------|---------------||---------------||---------------||---------------|Capacity Module:Cnflict Vol: xxxx xxxx xxxxx 276 276 119 125 xxxx xxxxx xxxx xxxx xxxxx Potent Cap.: xxxx xxxx xxxxx 718 635 938 1474 xxxx xxxxx xxxx xxxx xxxxx Move Cap.: xxxx xxxx xxxxx 710 626 938 1474 xxxx xxxxx xxxx xxxx xxxxx Volume/Cap: xxxx xxxx xxxx 0.01 0.00 0.03 0.01 xxxx xxxx xxxx xxxx xxxx ------------|---------------||---------------||---------------||---------------|Level Of Service Module:2Way95thQ: xxxx xxxx xxxxx xxxx xxxx xxxxx 0.0 xxxx xxxxx xxxx xxxx xxxxx Control Del:xxxxx xxxx xxxxx xxxxx xxxx xxxxx 7.5 xxxx xxxxx xxxxx xxxx xxxxx LOS by Move: * * * * * * A * * * * * Movement: LT - LTR - RT LT - LTR - RT LT - LTR - RT LT - LTR - RT Shared Cap.: xxxx xxxx xxxxx xxxx 902 xxxxx xxxx xxxx xxxxx xxxx xxxx xxxxx SharedQueue:xxxxx xxxx xxxxx xxxxx 0.1 xxxxx 0.0 xxxx xxxxx xxxxx xxxx xxxxx Shrd ConDel:xxxxx xxxx xxxxx xxxxx 9.2 xxxxx 7.5 xxxx xxxxx xxxxx xxxx xxxxx Shared LOS: * * * * A * A * * * * * ApproachDel: xxxxxx 9.2 xxxxxx xxxxxxApproachLOS: * A * * ********************************************************************************Note: Queue reported is the number of cars per lane.********************************************************************************
Traffix 8.0.0715 (c) 2008 Dowling Assoc. Licensed to RK ENGINEERING GROUP

EX + A + P (AM) Tue May 12, 2015 14:35:04 Page 6-1 -------------------------------------------------------------------------------- AGUA MANSA HIGH CUBE WAREHOUSE COUNTY OF SAN BERNARDINO OPENING YEAR (2017) WITH PROJECT W/O RELATED PROJECTS CONDITIONS -------------------------------------------------------------------------------- Level Of Service Computation Report 2000 HCM Unsignalized Method (Future Volume Alternative) ********************************************************************************Intersection #5 AGUA MANSA ROAD (NS) AT EL RAVINO ROAD (EW) ********************************************************************************Average Delay (sec/veh): 1.7 Worst Case Level Of Service: C[ 19.5]********************************************************************************Approach: North Bound South Bound East Bound West Bound Movement: L - T - R L - T - R L - T - R L - T - R ------------|---------------||---------------||---------------||---------------|Control: Uncontrolled Uncontrolled Stop Sign Stop Sign Rights: Include Include Ignore Include Lanes: 1 0 1 0 0 0 0 0 1 0 1 0 0 0 1 0 0 0 0 0 ------------|---------------||---------------||---------------||---------------|Volume Module:Base Vol: 8 303 0 0 393 40 69 0 22 0 0 0 Growth Adj: 1.06 1.06 1.06 1.06 1.06 1.06 1.06 1.06 1.06 1.06 1.06 1.06 Initial Bse: 8 321 0 0 417 42 73 0 23 0 0 0 Added Vol: 2 18 0 0 6 0 0 0 1 0 0 0 PasserByVol: 0 0 0 0 0 0 0 0 0 0 0 0 Initial Fut: 10 339 0 0 423 42 73 0 24 0 0 0 User Adj: 1.00 1.00 1.00 1.00 1.00 1.00 1.00 1.00 0.00 1.00 1.00 1.00 PHF Adj: 0.93 0.93 0.93 0.93 0.93 0.93 0.93 0.93 0.00 0.93 0.93 0.93 PHF Volume: 11 364 0 0 453 45 78 0 0 0 0 0 Reduct Vol: 0 0 0 0 0 0 0 0 0 0 0 0 FinalVolume: 11 364 0 0 453 45 78 0 0 0 0 0 ------------|---------------||---------------||---------------||---------------|Critical Gap Module:Critical Gp: 4.1 xxxx xxxxx xxxxx xxxx xxxxx 6.4 xxxx 6.2 xxxxx xxxx xxxxx FollowUpTim: 2.2 xxxx xxxxx xxxxx xxxx xxxxx 3.5 xxxx 3.3 xxxxx xxxx xxxxx ------------|---------------||---------------||---------------||---------------|Capacity Module:Cnflict Vol: 498 xxxx xxxxx xxxx xxxx xxxxx 862 xxxx 476 xxxx xxxx xxxxx Potent Cap.: 1076 xxxx xxxxx xxxx xxxx xxxxx 328 xxxx 593 xxxx xxxx xxxxx Move Cap.: 1076 xxxx xxxxx xxxx xxxx xxxxx 326 xxxx 593 xxxx xxxx xxxxx Volume/Cap: 0.01 xxxx xxxx xxxx xxxx xxxx 0.24 xxxx 0.00 xxxx xxxx xxxx ------------|---------------||---------------||---------------||---------------|Level Of Service Module:2Way95thQ: 0.0 xxxx xxxxx xxxx xxxx xxxxx 0.9 xxxx xxxxx xxxx xxxx xxxxx Control Del: 8.4 xxxx xxxxx xxxxx xxxx xxxxx 19.5 xxxx xxxxx xxxxx xxxx xxxxx LOS by Move: A * * * * * C * * * * * Movement: LT - LTR - RT LT - LTR - RT LT - LTR - RT LT - LTR - RT Shared Cap.: xxxx xxxx xxxxx xxxx xxxx xxxxx xxxx xxxx xxxxx xxxx xxxx xxxxx SharedQueue:xxxxx xxxx xxxxx xxxxx xxxx xxxxx xxxxx xxxx xxxxx xxxxx xxxx xxxxx Shrd ConDel:xxxxx xxxx xxxxx xxxxx xxxx xxxxx xxxxx xxxx xxxxx xxxxx xxxx xxxxx Shared LOS: * * * * * * * * * * * * ApproachDel: xxxxxx xxxxxx 19.5 xxxxxxApproachLOS: * * C * ********************************************************************************Note: Queue reported is the number of cars per lane.********************************************************************************
Traffix 8.0.0715 (c) 2008 Dowling Assoc. Licensed to RK ENGINEERING GROUP

EX + A + P (PM) Tue May 12, 2015 14:35:46 Page 6-1 -------------------------------------------------------------------------------- AGUA MANSA HIGH CUBE WAREHOUSE COUNTY OF SAN BERNARDINO OPENING YEAR (2017) WITH PROJECT W/O RELATED PROJECTS CONDITIONS -------------------------------------------------------------------------------- Level Of Service Computation Report 2000 HCM Unsignalized Method (Future Volume Alternative) ********************************************************************************Intersection #5 AGUA MANSA ROAD (NS) AT EL RAVINO ROAD (EW) ********************************************************************************Average Delay (sec/veh): 9.3 Worst Case Level Of Service: F[111.4]********************************************************************************Approach: North Bound South Bound East Bound West Bound Movement: L - T - R L - T - R L - T - R L - T - R ------------|---------------||---------------||---------------||---------------|Control: Uncontrolled Uncontrolled Stop Sign Stop Sign Rights: Include Include Ignore Include Lanes: 1 0 1 0 0 0 0 0 1 0 1 0 0 0 1 0 0 0 0 0 ------------|---------------||---------------||---------------||---------------|Volume Module:Base Vol: 37 652 0 0 315 78 98 0 9 0 0 0 Growth Adj: 1.06 1.06 1.06 1.06 1.06 1.06 1.06 1.06 1.06 1.06 1.06 1.06 Initial Bse: 39 691 0 0 334 83 104 0 10 0 0 0 Added Vol: 1 7 0 0 20 0 0 0 3 0 0 0 PasserByVol: 0 0 0 0 0 0 0 0 0 0 0 0 Initial Fut: 40 698 0 0 354 83 104 0 13 0 0 0 User Adj: 1.00 1.00 1.00 1.00 1.00 1.00 1.00 1.00 0.00 1.00 1.00 1.00 PHF Adj: 0.81 0.81 0.81 0.81 0.81 0.81 0.81 0.81 0.00 0.81 0.81 0.81 PHF Volume: 49 858 0 0 435 102 128 0 0 0 0 0 Reduct Vol: 0 0 0 0 0 0 0 0 0 0 0 0 FinalVolume: 49 858 0 0 435 102 128 0 0 0 0 0 ------------|---------------||---------------||---------------||---------------|Critical Gap Module:Critical Gp: 4.1 xxxx xxxxx xxxxx xxxx xxxxx 6.4 xxxx 6.2 xxxxx xxxx xxxxx FollowUpTim: 2.2 xxxx xxxxx xxxxx xxxx xxxxx 3.5 xxxx 3.3 xxxxx xxxx xxxxx ------------|---------------||---------------||---------------||---------------|Capacity Module:Cnflict Vol: 536 xxxx xxxxx xxxx xxxx xxxxx 1442 xxxx 486 xxxx xxxx xxxxx Potent Cap.: 1042 xxxx xxxxx xxxx xxxx xxxxx 147 xxxx 586 xxxx xxxx xxxxx Move Cap.: 1042 xxxx xxxxx xxxx xxxx xxxxx 142 xxxx 586 xxxx xxxx xxxxx Volume/Cap: 0.05 xxxx xxxx xxxx xxxx xxxx 0.90 xxxx 0.00 xxxx xxxx xxxx ------------|---------------||---------------||---------------||---------------|Level Of Service Module:2Way95thQ: 0.1 xxxx xxxxx xxxx xxxx xxxxx 6.1 xxxx xxxxx xxxx xxxx xxxxx Control Del: 8.6 xxxx xxxxx xxxxx xxxx xxxxx 111.4 xxxx xxxxx xxxxx xxxx xxxxx LOS by Move: A * * * * * F * * * * * Movement: LT - LTR - RT LT - LTR - RT LT - LTR - RT LT - LTR - RT Shared Cap.: xxxx xxxx xxxxx xxxx xxxx xxxxx xxxx xxxx xxxxx xxxx xxxx xxxxx SharedQueue:xxxxx xxxx xxxxx xxxxx xxxx xxxxx xxxxx xxxx xxxxx xxxxx xxxx xxxxx Shrd ConDel:xxxxx xxxx xxxxx xxxxx xxxx xxxxx xxxxx xxxx xxxxx xxxxx xxxx xxxxx Shared LOS: * * * * * * * * * * * * ApproachDel: xxxxxx xxxxxx 111.4 xxxxxxApproachLOS: * * F * ********************************************************************************Note: Queue reported is the number of cars per lane.********************************************************************************
Traffix 8.0.0715 (c) 2008 Dowling Assoc. Licensed to RK ENGINEERING GROUP

MITIG8 - EX + A + P (AM) Tue May 12, 2015 14:59:09 Page 1-1 -------------------------------------------------------------------------------- AGUA MANSA HIGH CUBE WAREHOUSE COUNTY OF SAN BERNARDINO OPENING YEAR (2017) WITH PROJECT W/O RELATED PROJECTS CONDITIONS -------------------------------------------------------------------------------- Level Of Service Computation Report 2000 HCM Unsignalized Method (Future Volume Alternative) ********************************************************************************Intersection #5 AGUA MANSA ROAD (NS) AT EL RAVINO ROAD (EW) ********************************************************************************Average Delay (sec/veh): 1.4 Worst Case Level Of Service: C[ 15.6]********************************************************************************Approach: North Bound South Bound East Bound West Bound Movement: L - T - R L - T - R L - T - R L - T - R ------------|---------------||---------------||---------------||---------------|Control: Uncontrolled Uncontrolled Stop Sign Stop Sign Rights: Include Include Ignore Include Lanes: 1 0 2 0 0 0 0 0 1 0 1 0 0 0 1 0 0 0 0 0 ------------|---------------||---------------||---------------||---------------|Volume Module:Base Vol: 8 303 0 0 393 40 69 0 22 0 0 0 Growth Adj: 1.06 1.06 1.06 1.06 1.06 1.06 1.06 1.06 1.06 1.06 1.06 1.06 Initial Bse: 8 321 0 0 417 42 73 0 23 0 0 0 Added Vol: 2 18 0 0 6 0 0 0 1 0 0 0 PasserByVol: 0 0 0 0 0 0 0 0 0 0 0 0 Initial Fut: 10 339 0 0 423 42 73 0 24 0 0 0 User Adj: 1.00 1.00 1.00 1.00 1.00 1.00 1.00 1.00 0.00 1.00 1.00 1.00 PHF Adj: 0.93 0.93 0.93 0.93 0.93 0.93 0.93 0.93 0.00 0.93 0.93 0.93 PHF Volume: 11 364 0 0 453 45 78 0 0 0 0 0 Reduct Vol: 0 0 0 0 0 0 0 0 0 0 0 0 FinalVolume: 11 364 0 0 453 45 78 0 0 0 0 0 ------------|---------------||---------------||---------------||---------------|Critical Gap Module:Critical Gp: 4.1 xxxx xxxxx xxxxx xxxx xxxxx 6.4 xxxx 6.2 xxxxx xxxx xxxxx FollowUpTim: 2.2 xxxx xxxxx xxxxx xxxx xxxxx 3.5 xxxx 3.3 xxxxx xxxx xxxxx ------------|---------------||---------------||---------------||---------------|Capacity Module:Cnflict Vol: 498 xxxx xxxxx xxxx xxxx xxxxx 680 xxxx 476 xxxx xxxx xxxxx Potent Cap.: 1076 xxxx xxxxx xxxx xxxx xxxxx 420 xxxx 593 xxxx xxxx xxxxx Move Cap.: 1076 xxxx xxxxx xxxx xxxx xxxxx 416 xxxx 593 xxxx xxxx xxxxx Volume/Cap: 0.01 xxxx xxxx xxxx xxxx xxxx 0.19 xxxx 0.00 xxxx xxxx xxxx ------------|---------------||---------------||---------------||---------------|Level Of Service Module:2Way95thQ: 0.0 xxxx xxxxx xxxx xxxx xxxxx 0.7 xxxx xxxxx xxxx xxxx xxxxx Control Del: 8.4 xxxx xxxxx xxxxx xxxx xxxxx 15.6 xxxx xxxxx xxxxx xxxx xxxxx LOS by Move: A * * * * * C * * * * * Movement: LT - LTR - RT LT - LTR - RT LT - LTR - RT LT - LTR - RT Shared Cap.: xxxx xxxx xxxxx xxxx xxxx xxxxx xxxx xxxx xxxxx xxxx xxxx xxxxx SharedQueue:xxxxx xxxx xxxxx xxxxx xxxx xxxxx xxxxx xxxx xxxxx xxxxx xxxx xxxxx Shrd ConDel:xxxxx xxxx xxxxx xxxxx xxxx xxxxx xxxxx xxxx xxxxx xxxxx xxxx xxxxx Shared LOS: * * * * * * * * * * * * ApproachDel: xxxxxx xxxxxx 15.6 xxxxxxApproachLOS: * * C * ********************************************************************************Note: Queue reported is the number of cars per lane.********************************************************************************
Traffix 8.0.0715 (c) 2008 Dowling Assoc. Licensed to RK ENGINEERING GROUP

MITIG8 - EX + A + P (PM) Tue May 12, 2015 14:58:12 Page 1-1 -------------------------------------------------------------------------------- AGUA MANSA HIGH CUBE WAREHOUSE COUNTY OF SAN BERNARDINO OPENING YEAR (2017) WITH PROJECT W/O RELATED PROJECTS CONDITIONS -------------------------------------------------------------------------------- Level Of Service Computation Report 2000 HCM Unsignalized Method (Future Volume Alternative) ********************************************************************************Intersection #5 AGUA MANSA ROAD (NS) AT EL RAVINO ROAD (EW) ********************************************************************************Average Delay (sec/veh): 2.9 Worst Case Level Of Service: D[ 32.0]********************************************************************************Approach: North Bound South Bound East Bound West Bound Movement: L - T - R L - T - R L - T - R L - T - R ------------|---------------||---------------||---------------||---------------|Control: Uncontrolled Uncontrolled Stop Sign Stop Sign Rights: Include Include Ignore Include Lanes: 1 0 2 0 0 0 0 0 1 0 1 0 0 0 1 0 0 0 0 0 ------------|---------------||---------------||---------------||---------------|Volume Module:Base Vol: 37 652 0 0 315 78 98 0 9 0 0 0 Growth Adj: 1.06 1.06 1.06 1.06 1.06 1.06 1.06 1.06 1.06 1.06 1.06 1.06 Initial Bse: 39 691 0 0 334 83 104 0 10 0 0 0 Added Vol: 1 7 0 0 20 0 0 0 3 0 0 0 PasserByVol: 0 0 0 0 0 0 0 0 0 0 0 0 Initial Fut: 40 698 0 0 354 83 104 0 13 0 0 0 User Adj: 1.00 1.00 1.00 1.00 1.00 1.00 1.00 1.00 0.00 1.00 1.00 1.00 PHF Adj: 0.81 0.81 0.81 0.81 0.81 0.81 0.81 0.81 0.00 0.81 0.81 0.81 PHF Volume: 49 858 0 0 435 102 128 0 0 0 0 0 Reduct Vol: 0 0 0 0 0 0 0 0 0 0 0 0 FinalVolume: 49 858 0 0 435 102 128 0 0 0 0 0 ------------|---------------||---------------||---------------||---------------|Critical Gap Module:Critical Gp: 4.1 xxxx xxxxx xxxxx xxxx xxxxx 6.4 xxxx 6.2 xxxxx xxxx xxxxx FollowUpTim: 2.2 xxxx xxxxx xxxxx xxxx xxxxx 3.5 xxxx 3.3 xxxxx xxxx xxxxx ------------|---------------||---------------||---------------||---------------|Capacity Module:Cnflict Vol: 536 xxxx xxxxx xxxx xxxx xxxxx 1013 xxxx 486 xxxx xxxx xxxxx Potent Cap.: 1042 xxxx xxxxx xxxx xxxx xxxxx 267 xxxx 586 xxxx xxxx xxxxx Move Cap.: 1042 xxxx xxxxx xxxx xxxx xxxxx 257 xxxx 586 xxxx xxxx xxxxx Volume/Cap: 0.05 xxxx xxxx xxxx xxxx xxxx 0.50 xxxx 0.00 xxxx xxxx xxxx ------------|---------------||---------------||---------------||---------------|Level Of Service Module:2Way95thQ: 0.1 xxxx xxxxx xxxx xxxx xxxxx 2.6 xxxx xxxxx xxxx xxxx xxxxx Control Del: 8.6 xxxx xxxxx xxxxx xxxx xxxxx 32.0 xxxx xxxxx xxxxx xxxx xxxxx LOS by Move: A * * * * * D * * * * * Movement: LT - LTR - RT LT - LTR - RT LT - LTR - RT LT - LTR - RT Shared Cap.: xxxx xxxx xxxxx xxxx xxxx xxxxx xxxx xxxx xxxxx xxxx xxxx xxxxx SharedQueue:xxxxx xxxx xxxxx xxxxx xxxx xxxxx xxxxx xxxx xxxxx xxxxx xxxx xxxxx Shrd ConDel:xxxxx xxxx xxxxx xxxxx xxxx xxxxx xxxxx xxxx xxxxx xxxxx xxxx xxxxx Shared LOS: * * * * * * * * * * * * ApproachDel: xxxxxx xxxxxx 32.0 xxxxxxApproachLOS: * * D * ********************************************************************************Note: Queue reported is the number of cars per lane.********************************************************************************
Traffix 8.0.0715 (c) 2008 Dowling Assoc. Licensed to RK ENGINEERING GROUP

EX + A + P (AM) Tue May 12, 2015 14:35:04 Page 7-1 -------------------------------------------------------------------------------- AGUA MANSA HIGH CUBE WAREHOUSE COUNTY OF SAN BERNARDINO OPENING YEAR (2017) WITH PROJECT W/O RELATED PROJECTS CONDITIONS -------------------------------------------------------------------------------- Level Of Service Computation Report 2000 HCM Operations Method (Future Volume Alternative) ********************************************************************************Intersection #6 RIVERSIDE AVENUE (NS) AT AGUA MANSA ROAD (EW) ********************************************************************************Cycle (sec): 90 Critical Vol./Cap.(X): 0.592Loss Time (sec): 8 Average Delay (sec/veh): 31.7Optimal Cycle: OPTIMIZED Level Of Service: C********************************************************************************Approach: North Bound South Bound East Bound West Bound Movement: L - T - R L - T - R L - T - R L - T - R ------------|---------------||---------------||---------------||---------------|Control: Protected Protected Protected Protected Rights: Include Include Include Include Min. Green: 10 29 29 10 32 32 10 27 27 10 23 23 Y+R: 4.0 4.0 4.0 4.0 4.0 4.0 4.0 4.0 4.0 4.0 4.0 4.0 Lanes: 1 0 1 1 0 1 0 2 0 1 1 0 1 0 1 1 0 1 0 1 ------------|---------------||---------------||---------------||---------------|Volume Module:Base Vol: 152 713 61 78 846 193 159 165 82 59 241 50 Growth Adj: 1.06 1.06 1.06 1.06 1.06 1.06 1.06 1.06 1.06 1.06 1.06 1.06 Initial Bse: 161 756 65 83 897 205 169 175 87 63 255 53 Added Vol: 8 0 0 0 0 26 9 2 3 0 5 0 PasserByVol: 0 0 0 0 0 0 0 0 0 0 0 0 Initial Fut: 169 756 65 83 897 231 178 177 90 63 260 53 User Adj: 1.00 1.00 1.00 1.00 1.00 1.00 1.00 1.00 1.00 1.00 1.00 1.00 PHF Adj: 0.91 0.91 0.91 0.91 0.91 0.91 0.91 0.91 0.91 0.91 0.91 0.91 PHF Volume: 186 831 71 91 985 253 195 194 99 69 286 58 Reduct Vol: 0 0 0 0 0 0 0 0 0 0 0 0 Reduced Vol: 186 831 71 91 985 253 195 194 99 69 286 58 PCE Adj: 1.00 1.00 1.00 1.00 1.00 1.00 1.00 1.00 1.00 1.00 1.00 1.00 MLF Adj: 1.00 1.00 1.00 1.00 1.00 1.00 1.00 1.00 1.00 1.00 1.00 1.00 FinalVolume: 186 831 71 91 985 253 195 194 99 69 286 58 ------------|---------------||---------------||---------------||---------------|Saturation Flow Module:Sat/Lane: 1800 1800 1800 1800 1800 1800 1800 1800 1800 1800 1800 1800 Adjustment: 0.90 0.99 0.99 0.90 1.00 0.85 0.90 1.00 0.85 0.90 1.00 0.85 Lanes: 1.00 1.84 0.16 1.00 2.00 1.00 1.00 1.00 1.00 1.00 1.00 1.00 Final Sat.: 1615 3276 280 1615 3600 1530 1615 1800 1530 1615 1800 1530 ------------|---------------||---------------||---------------||---------------|Capacity Analysis Module:Vol/Sat: 0.12 0.25 0.25 0.06 0.27 0.17 0.12 0.11 0.06 0.04 0.16 0.04 Crit Moves: **** **** **** **** Green/Cycle: 0.14 0.37 0.37 0.13 0.36 0.36 0.13 0.30 0.30 0.11 0.28 0.28 Volume/Cap: 0.80 0.68 0.68 0.44 0.77 0.47 0.92 0.36 0.22 0.38 0.57 0.14 Delay/Veh: 54.4 25.3 25.3 37.7 28.7 23.0 77.6 25.1 23.8 38.5 29.4 24.5 User DelAdj: 1.00 1.00 1.00 1.00 1.00 1.00 1.00 1.00 1.00 1.00 1.00 1.00 AdjDel/Veh: 54.4 25.3 25.3 37.7 28.7 23.0 77.6 25.1 23.8 38.5 29.4 24.5 LOS by Move: D C C D C C E C C D C C HCM2kAvgQ: 7 11 11 3 14 6 9 4 2 2 7 1 ********************************************************************************Note: Queue reported is the number of cars per lane.
Traffix 8.0.0715 (c) 2008 Dowling Assoc. Licensed to RK ENGINEERING GROUP

EX + A + P (PM) Tue May 12, 2015 14:35:46 Page 7-1 -------------------------------------------------------------------------------- AGUA MANSA HIGH CUBE WAREHOUSE COUNTY OF SAN BERNARDINO OPENING YEAR (2017) WITH PROJECT W/O RELATED PROJECTS CONDITIONS -------------------------------------------------------------------------------- Level Of Service Computation Report 2000 HCM Operations Method (Future Volume Alternative) ********************************************************************************Intersection #6 RIVERSIDE AVENUE (NS) AT AGUA MANSA ROAD (EW) ********************************************************************************Cycle (sec): 90 Critical Vol./Cap.(X): 0.669Loss Time (sec): 8 Average Delay (sec/veh): 35.2Optimal Cycle: OPTIMIZED Level Of Service: D********************************************************************************Approach: North Bound South Bound East Bound West Bound Movement: L - T - R L - T - R L - T - R L - T - R ------------|---------------||---------------||---------------||---------------|Control: Protected Protected Protected Protected Rights: Include Include Include Include Min. Green: 10 29 29 10 32 32 10 27 27 10 23 23 Y+R: 4.0 4.0 4.0 4.0 4.0 4.0 4.0 4.0 4.0 4.0 4.0 4.0 Lanes: 1 0 1 1 0 1 0 2 0 1 1 0 1 0 1 1 0 1 0 1 ------------|---------------||---------------||---------------||---------------|Volume Module:Base Vol: 96 796 68 60 986 138 196 485 119 35 136 38 Growth Adj: 1.06 1.06 1.06 1.06 1.06 1.06 1.06 1.06 1.06 1.06 1.06 1.06 Initial Bse: 102 844 72 64 1045 146 208 514 126 37 144 40 Added Vol: 3 0 0 0 0 9 28 5 8 0 2 0 PasserByVol: 0 0 0 0 0 0 0 0 0 0 0 0 Initial Fut: 105 844 72 64 1045 155 236 519 134 37 146 40 User Adj: 1.00 1.00 1.00 1.00 1.00 1.00 1.00 1.00 1.00 1.00 1.00 1.00 PHF Adj: 0.96 0.96 0.96 0.96 0.96 0.96 0.96 0.96 0.96 0.96 0.96 0.96 PHF Volume: 110 884 75 67 1094 163 247 544 140 39 153 42 Reduct Vol: 0 0 0 0 0 0 0 0 0 0 0 0 Reduced Vol: 110 884 75 67 1094 163 247 544 140 39 153 42 PCE Adj: 1.00 1.00 1.00 1.00 1.00 1.00 1.00 1.00 1.00 1.00 1.00 1.00 MLF Adj: 1.00 1.00 1.00 1.00 1.00 1.00 1.00 1.00 1.00 1.00 1.00 1.00 FinalVolume: 110 884 75 67 1094 163 247 544 140 39 153 42 ------------|---------------||---------------||---------------||---------------|Saturation Flow Module:Sat/Lane: 1800 1800 1800 1800 1800 1800 1800 1800 1800 1800 1800 1800 Adjustment: 0.90 0.99 0.99 0.90 1.00 0.85 0.90 1.00 0.85 0.90 1.00 0.85 Lanes: 1.00 1.84 0.16 1.00 2.00 1.00 1.00 1.00 1.00 1.00 1.00 1.00 Final Sat.: 1615 3277 280 1615 3600 1530 1615 1800 1530 1615 1800 1530 ------------|---------------||---------------||---------------||---------------|Capacity Analysis Module:Vol/Sat: 0.07 0.27 0.27 0.04 0.30 0.11 0.15 0.30 0.09 0.02 0.09 0.03 Crit Moves: **** **** **** **** Green/Cycle: 0.11 0.35 0.35 0.12 0.36 0.36 0.18 0.32 0.32 0.12 0.26 0.26 Volume/Cap: 0.61 0.77 0.77 0.34 0.84 0.29 0.84 0.94 0.29 0.20 0.33 0.11 Delay/Veh: 44.2 28.8 28.8 37.3 31.3 20.8 54.3 54.1 23.2 36.4 27.7 25.8 User DelAdj: 1.00 1.00 1.00 1.00 1.00 1.00 1.00 1.00 1.00 1.00 1.00 1.00 AdjDel/Veh: 44.2 28.8 28.8 37.3 31.3 20.8 54.3 54.1 23.2 36.4 27.7 25.8 LOS by Move: D C C D C C D D C D C C HCM2kAvgQ: 4 13 13 2 17 3 10 20 3 1 4 1 ********************************************************************************Note: Queue reported is the number of cars per lane.
Traffix 8.0.0715 (c) 2008 Dowling Assoc. Licensed to RK ENGINEERING GROUP

EX + A + P (AM) Tue May 12, 2015 14:35:04 Page 8-1 -------------------------------------------------------------------------------- AGUA MANSA HIGH CUBE WAREHOUSE COUNTY OF SAN BERNARDINO OPENING YEAR (2017) WITH PROJECT W/O RELATED PROJECTS CONDITIONS -------------------------------------------------------------------------------- Level Of Service Computation Report 2000 HCM Unsignalized Method (Future Volume Alternative) ********************************************************************************Intersection #7 PROJECT ACCESS 1 (NS) AT EL RAVINO ROAD (EW) ********************************************************************************Average Delay (sec/veh): 0.0 Worst Case Level Of Service: A[ 7.4]********************************************************************************Approach: North Bound South Bound East Bound West Bound Movement: L - T - R L - T - R L - T - R L - T - R ------------|---------------||---------------||---------------||---------------|Control: Stop Sign Stop Sign Uncontrolled UncontrolledRights: Include Include Include Include Lanes: 0 0 0 0 0 0 0 1! 0 0 0 1 0 0 0 0 0 0 1 0 ------------|---------------||---------------||---------------||---------------|Volume Module:Base Vol: 0 0 0 0 0 0 0 90 0 0 77 0 Growth Adj: 1.06 1.06 1.06 1.06 1.06 1.06 1.06 1.06 1.06 1.06 1.06 1.06 Initial Bse: 0 0 0 0 0 0 0 95 0 0 82 0 Added Vol: 0 0 0 0 0 0 1 0 0 0 1 1 PasserByVol: 0 0 0 0 0 0 0 0 0 0 0 0 Initial Fut: 0 0 0 0 0 0 1 95 0 0 83 1 User Adj: 1.00 1.00 1.00 1.00 1.00 1.00 1.00 1.00 1.00 1.00 1.00 1.00 PHF Adj: 0.92 0.92 0.92 0.92 0.92 0.92 0.92 0.92 0.92 0.92 0.92 0.92 PHF Volume: 0 0 0 0 0 0 1 104 0 0 90 1 Reduct Vol: 0 0 0 0 0 0 0 0 0 0 0 0 FinalVolume: 0 0 0 0 0 0 1 104 0 0 90 1 ------------|---------------||---------------||---------------||---------------|Critical Gap Module:Critical Gp:xxxxx xxxx xxxxx 6.4 6.5 6.2 4.1 xxxx xxxxx xxxxx xxxx xxxxx FollowUpTim:xxxxx xxxx xxxxx 3.5 4.0 3.3 2.2 xxxx xxxxx xxxxx xxxx xxxxx ------------|---------------||---------------||---------------||---------------|Capacity Module:Cnflict Vol: xxxx xxxx xxxxx 196 196 90 91 xxxx xxxxx xxxx xxxx xxxxx Potent Cap.: xxxx xxxx xxxxx 797 703 973 1517 xxxx xxxxx xxxx xxxx xxxxx Move Cap.: xxxx xxxx xxxxx 797 702 973 1517 xxxx xxxxx xxxx xxxx xxxxx Volume/Cap: xxxx xxxx xxxx 0.00 0.00 0.00 0.00 xxxx xxxx xxxx xxxx xxxx ------------|---------------||---------------||---------------||---------------|Level Of Service Module:2Way95thQ: xxxx xxxx xxxxx xxxx xxxx xxxxx 0.0 xxxx xxxxx xxxx xxxx xxxxx Control Del:xxxxx xxxx xxxxx xxxxx xxxx xxxxx 7.4 xxxx xxxxx xxxxx xxxx xxxxx LOS by Move: * * * * * * A * * * * * Movement: LT - LTR - RT LT - LTR - RT LT - LTR - RT LT - LTR - RT Shared Cap.: xxxx xxxx xxxxx xxxx 0 xxxxx xxxx xxxx xxxxx xxxx xxxx xxxxx SharedQueue:xxxxx xxxx xxxxx xxxxx xxxx xxxxx 0.0 xxxx xxxxx xxxxx xxxx xxxxx Shrd ConDel:xxxxx xxxx xxxxx xxxxx xxxx xxxxx 7.4 xxxx xxxxx xxxxx xxxx xxxxx Shared LOS: * * * * * * A * * * * * ApproachDel: xxxxxx xxxxxx xxxxxx xxxxxxApproachLOS: * * * * ********************************************************************************Note: Queue reported is the number of cars per lane.********************************************************************************
Traffix 8.0.0715 (c) 2008 Dowling Assoc. Licensed to RK ENGINEERING GROUP

EX + A + P (PM) Tue May 12, 2015 14:35:46 Page 8-1 -------------------------------------------------------------------------------- AGUA MANSA HIGH CUBE WAREHOUSE COUNTY OF SAN BERNARDINO OPENING YEAR (2017) WITH PROJECT W/O RELATED PROJECTS CONDITIONS -------------------------------------------------------------------------------- Level Of Service Computation Report 2000 HCM Unsignalized Method (Future Volume Alternative) ********************************************************************************Intersection #7 PROJECT ACCESS 1 (NS) AT EL RAVINO ROAD (EW) ********************************************************************************Average Delay (sec/veh): 0.2 Worst Case Level Of Service: A[ 9.1]********************************************************************************Approach: North Bound South Bound East Bound West Bound Movement: L - T - R L - T - R L - T - R L - T - R ------------|---------------||---------------||---------------||---------------|Control: Stop Sign Stop Sign Uncontrolled UncontrolledRights: Include Include Include Include Lanes: 0 0 0 0 0 0 0 1! 0 0 0 1 0 0 0 0 0 1 0 0 ------------|---------------||---------------||---------------||---------------|Volume Module:Base Vol: 0 0 0 0 0 0 0 96 0 0 93 0 Growth Adj: 1.06 1.06 1.06 1.06 1.06 1.06 1.06 1.06 1.06 1.06 1.06 1.06 Initial Bse: 0 0 0 0 0 0 0 102 0 0 99 0 Added Vol: 0 0 0 1 0 2 1 2 0 0 1 0 PasserByVol: 0 0 0 0 0 0 0 0 0 0 0 0 Initial Fut: 0 0 0 1 0 2 1 104 0 0 100 0 User Adj: 1.00 1.00 1.00 1.00 1.00 1.00 1.00 1.00 1.00 1.00 1.00 1.00 PHF Adj: 0.92 0.92 0.92 0.92 0.92 0.92 0.92 0.92 0.92 0.92 0.92 0.92 PHF Volume: 0 0 0 1 0 2 1 113 0 0 108 0 Reduct Vol: 0 0 0 0 0 0 0 0 0 0 0 0 FinalVolume: 0 0 0 1 0 2 1 113 0 0 108 0 ------------|---------------||---------------||---------------||---------------|Critical Gap Module:Critical Gp:xxxxx xxxx xxxxx 6.4 6.5 6.2 4.1 xxxx xxxxx xxxxx xxxx xxxxx FollowUpTim:xxxxx xxxx xxxxx 3.5 4.0 3.3 2.2 xxxx xxxxx xxxxx xxxx xxxxx ------------|---------------||---------------||---------------||---------------|Capacity Module:Cnflict Vol: xxxx xxxx xxxxx 223 223 108 108 xxxx xxxxx xxxx xxxx xxxxx Potent Cap.: xxxx xxxx xxxxx 769 679 951 1495 xxxx xxxxx xxxx xxxx xxxxx Move Cap.: xxxx xxxx xxxxx 769 679 951 1495 xxxx xxxxx xxxx xxxx xxxxx Volume/Cap: xxxx xxxx xxxx 0.00 0.00 0.00 0.00 xxxx xxxx xxxx xxxx xxxx ------------|---------------||---------------||---------------||---------------|Level Of Service Module:2Way95thQ: xxxx xxxx xxxxx xxxx xxxx xxxxx 0.0 xxxx xxxxx xxxx xxxx xxxxx Control Del:xxxxx xxxx xxxxx xxxxx xxxx xxxxx 7.4 xxxx xxxxx xxxxx xxxx xxxxx LOS by Move: * * * * * * A * * * * * Movement: LT - LTR - RT LT - LTR - RT LT - LTR - RT LT - LTR - RT Shared Cap.: xxxx xxxx xxxxx xxxx 881 xxxxx xxxx xxxx xxxxx xxxx xxxx xxxxx SharedQueue:xxxxx xxxx xxxxx xxxxx 0.0 xxxxx 0.0 xxxx xxxxx xxxxx xxxx xxxxx Shrd ConDel:xxxxx xxxx xxxxx xxxxx 9.1 xxxxx 7.4 xxxx xxxxx xxxxx xxxx xxxxx Shared LOS: * * * * A * A * * * * * ApproachDel: xxxxxx 9.1 xxxxxx xxxxxxApproachLOS: * A * * ********************************************************************************Note: Queue reported is the number of cars per lane.********************************************************************************
Traffix 8.0.0715 (c) 2008 Dowling Assoc. Licensed to RK ENGINEERING GROUP

EX + A + P (AM) Tue May 12, 2015 14:35:04 Page 9-1 -------------------------------------------------------------------------------- AGUA MANSA HIGH CUBE WAREHOUSE COUNTY OF SAN BERNARDINO OPENING YEAR (2017) WITH PROJECT W/O RELATED PROJECTS CONDITIONS -------------------------------------------------------------------------------- Level Of Service Computation Report 2000 HCM Operations Method (Future Volume Alternative) ********************************************************************************Intersection #8 AGUA MANSA ROAD (NS) AT PROJECT ACCESS 2 (EW) ********************************************************************************Cycle (sec): 115 Critical Vol./Cap.(X): 0.296Loss Time (sec): 4 Average Delay (sec/veh): 2.2Optimal Cycle: OPTIMIZED Level Of Service: A********************************************************************************Approach: North Bound South Bound East Bound West Bound Movement: L - T - R L - T - R L - T - R L - T - R ------------|---------------||---------------||---------------||---------------|Control: Permitted Permitted Protected Protected Rights: Include Include Include Include Min. Green: 10 10 0 0 10 10 10 0 10 0 0 0 Y+R: 4.0 4.0 4.0 4.0 4.0 4.0 4.0 4.0 4.0 4.0 4.0 4.0 Lanes: 1 0 1 0 0 0 0 1 0 1 1 0 0 0 1 0 0 0 0 0 ------------|---------------||---------------||---------------||---------------|Volume Module:Base Vol: 0 372 0 0 433 0 0 0 0 0 0 0 Growth Adj: 1.06 1.06 1.06 1.06 1.06 1.06 1.06 1.06 1.06 1.06 1.06 1.06 Initial Bse: 0 394 0 0 459 0 0 0 0 0 0 0 Added Vol: 18 0 0 0 0 38 13 0 6 0 0 0 PasserByVol: 0 0 0 0 0 0 0 0 0 0 0 0 Initial Fut: 18 394 0 0 459 38 13 0 6 0 0 0 User Adj: 1.00 1.00 1.00 1.00 1.00 1.00 1.00 1.00 1.00 1.00 1.00 1.00 PHF Adj: 0.92 0.92 0.92 0.92 0.92 0.92 0.92 0.92 0.92 0.92 0.92 0.92 PHF Volume: 20 429 0 0 499 41 14 0 7 0 0 0 Reduct Vol: 0 0 0 0 0 0 0 0 0 0 0 0 Reduced Vol: 20 429 0 0 499 41 14 0 7 0 0 0 PCE Adj: 1.00 1.00 1.00 1.00 1.00 1.00 1.00 1.00 1.00 1.00 1.00 1.00 MLF Adj: 1.00 1.00 1.00 1.00 1.00 1.00 1.00 1.00 1.00 1.00 1.00 1.00 FinalVolume: 20 429 0 0 499 41 14 0 7 0 0 0 ------------|---------------||---------------||---------------||---------------|Saturation Flow Module:Sat/Lane: 1800 1800 1800 1800 1800 1800 1800 1800 1800 1800 1800 1800 Adjustment: 0.44 1.00 1.00 0.94 1.00 0.85 0.90 1.00 0.85 0.94 1.00 1.00 Lanes: 1.00 1.00 0.00 0.00 1.00 1.00 1.00 0.00 1.00 0.00 0.00 0.00 Final Sat.: 784 1800 0 0 1800 1530 1615 0 1530 0 0 0 ------------|---------------||---------------||---------------||---------------|Capacity Analysis Module:Vol/Sat: 0.02 0.24 0.00 0.00 0.28 0.03 0.01 0.00 0.00 0.00 0.00 0.00 Crit Moves: **** **** Green/Cycle: 0.88 0.88 0.00 0.00 0.88 0.88 0.09 0.00 0.09 0.00 0.00 0.00 Volume/Cap: 0.03 0.27 0.00 0.00 0.32 0.03 0.10 0.00 0.05 0.00 0.00 0.00 Delay/Veh: 0.9 1.2 0.0 0.0 1.3 0.9 48.7 0.0 48.3 0.0 0.0 0.0 User DelAdj: 1.00 1.00 1.00 1.00 1.00 1.00 1.00 1.00 1.00 1.00 1.00 1.00 AdjDel/Veh: 0.9 1.2 0.0 0.0 1.3 0.9 48.7 0.0 48.3 0.0 0.0 0.0 LOS by Move: A A A A A A D A D A A A HCM2kAvgQ: 0 3 0 0 3 0 1 0 0 0 0 0 ********************************************************************************Note: Queue reported is the number of cars per lane.
Traffix 8.0.0715 (c) 2008 Dowling Assoc. Licensed to RK ENGINEERING GROUP

EX + A + P (PM) Tue May 12, 2015 14:35:46 Page 9-1 -------------------------------------------------------------------------------- AGUA MANSA HIGH CUBE WAREHOUSE COUNTY OF SAN BERNARDINO OPENING YEAR (2017) WITH PROJECT W/O RELATED PROJECTS CONDITIONS -------------------------------------------------------------------------------- Level Of Service Computation Report 2000 HCM Operations Method (Future Volume Alternative) ********************************************************************************Intersection #8 AGUA MANSA ROAD (NS) AT PROJECT ACCESS 2 (EW) ********************************************************************************Cycle (sec): 90 Critical Vol./Cap.(X): 0.531Loss Time (sec): 4 Average Delay (sec/veh): 3.9Optimal Cycle: OPTIMIZED Level Of Service: A********************************************************************************Approach: North Bound South Bound East Bound West Bound Movement: L - T - R L - T - R L - T - R L - T - R ------------|---------------||---------------||---------------||---------------|Control: Permitted Permitted Protected Protected Rights: Include Include Include Include Min. Green: 10 10 0 0 10 10 10 0 10 0 0 0 Y+R: 4.0 4.0 4.0 4.0 4.0 4.0 4.0 4.0 4.0 4.0 4.0 4.0 Lanes: 1 0 1 0 0 0 0 1 0 1 1 0 0 0 1 0 0 0 0 0 ------------|---------------||---------------||---------------||---------------|Volume Module:Base Vol: 0 750 0 0 393 0 0 0 0 0 0 0 Growth Adj: 1.06 1.06 1.06 1.06 1.06 1.06 1.06 1.06 1.06 1.06 1.06 1.06 Initial Bse: 0 795 0 0 417 0 0 0 0 0 0 0 Added Vol: 7 0 0 0 0 14 41 0 20 0 0 0 PasserByVol: 0 0 0 0 0 0 0 0 0 0 0 0 Initial Fut: 7 795 0 0 417 14 41 0 20 0 0 0 User Adj: 1.00 1.00 1.00 1.00 1.00 1.00 1.00 1.00 1.00 1.00 1.00 1.00 PHF Adj: 0.92 0.92 0.92 0.92 0.92 0.92 0.92 0.92 0.92 0.92 0.92 0.92 PHF Volume: 8 864 0 0 453 15 45 0 22 0 0 0 Reduct Vol: 0 0 0 0 0 0 0 0 0 0 0 0 Reduced Vol: 8 864 0 0 453 15 45 0 22 0 0 0 PCE Adj: 1.00 1.00 1.00 1.00 1.00 1.00 1.00 1.00 1.00 1.00 1.00 1.00 MLF Adj: 1.00 1.00 1.00 1.00 1.00 1.00 1.00 1.00 1.00 1.00 1.00 1.00 FinalVolume: 8 864 0 0 453 15 45 0 22 0 0 0 ------------|---------------||---------------||---------------||---------------|Saturation Flow Module:Sat/Lane: 1800 1800 1800 1800 1800 1800 1800 1800 1800 1800 1800 1800 Adjustment: 0.45 1.00 1.00 0.94 1.00 0.85 0.90 1.00 0.85 0.94 1.00 1.00 Lanes: 1.00 1.00 0.00 0.00 1.00 1.00 1.00 0.00 1.00 0.00 0.00 0.00 Final Sat.: 818 1800 0 0 1800 1530 1615 0 1530 0 0 0 ------------|---------------||---------------||---------------||---------------|Capacity Analysis Module:Vol/Sat: 0.01 0.48 0.00 0.00 0.25 0.01 0.03 0.00 0.01 0.00 0.00 0.00 Crit Moves: **** **** Green/Cycle: 0.84 0.84 0.00 0.00 0.84 0.84 0.11 0.00 0.11 0.00 0.00 0.00 Volume/Cap: 0.01 0.57 0.00 0.00 0.30 0.01 0.25 0.00 0.13 0.00 0.00 0.00 Delay/Veh: 1.1 2.6 0.0 0.0 1.6 1.1 37.3 0.0 36.4 0.0 0.0 0.0 User DelAdj: 1.00 1.00 1.00 1.00 1.00 1.00 1.00 1.00 1.00 1.00 1.00 1.00 AdjDel/Veh: 1.1 2.6 0.0 0.0 1.6 1.1 37.3 0.0 36.4 0.0 0.0 0.0 LOS by Move: A A A A A A D A D A A A HCM2kAvgQ: 0 8 0 0 3 0 1 0 1 0 0 0 ********************************************************************************Note: Queue reported is the number of cars per lane.
Traffix 8.0.0715 (c) 2008 Dowling Assoc. Licensed to RK ENGINEERING GROUP
Appendix F
Project Opening Year (2017) With Related Projects Without Project Conditions
Intersection Analysis Worksheets

OPENING YEAR (AM) Tue May 12, 2015 14:36:37 Page 2-1 -------------------------------------------------------------------------------- AGUA MANSA HIGH CUBE WAREHOUSE COUNTY OF SAN BERNARDINO OPENING YEAR (2017) WITH RELATED PROJ WITHOUT PROJ CONDITIONS -------------------------------------------------------------------------------- Level Of Service Computation Report 2000 HCM Operations Method (Future Volume Alternative) ********************************************************************************Intersection #1 CEDAR AVENUE (NS) AT EL RAVINO ROAD (EW) ********************************************************************************Cycle (sec): 100 Critical Vol./Cap.(X): 0.826Loss Time (sec): 8 Average Delay (sec/veh): 28.4Optimal Cycle: OPTIMIZED Level Of Service: C********************************************************************************Approach: North Bound South Bound East Bound West Bound Movement: L - T - R L - T - R L - T - R L - T - R ------------|---------------||---------------||---------------||---------------|Control: Protected Protected Permitted Permitted Rights: Include Include Include Include Min. Green: 10 0 0 10 23 23 10 14 14 10 24 24 Y+R: 4.0 4.0 4.0 4.0 4.0 4.0 4.0 4.0 4.0 4.0 4.0 4.0 Lanes: 1 0 1 1 0 1 0 1 1 0 0 0 1! 0 0 0 1 0 0 1 ------------|---------------||---------------||---------------||---------------|Volume Module:Base Vol: 10 443 47 87 652 6 3 1 6 50 2 39 Growth Adj: 1.06 1.06 1.06 1.06 1.06 1.06 1.06 1.06 1.06 1.06 1.06 1.06 Initial Bse: 11 470 50 92 691 6 3 1 6 53 2 41 Added Vol: 0 2 575 155 6 0 0 10 0 125 2 34 PasserByVol: 0 0 0 0 0 0 0 0 0 0 0 0 Initial Fut: 11 472 625 247 697 6 3 11 6 178 4 75 User Adj: 1.00 1.00 1.00 1.00 1.00 1.00 1.00 1.00 1.00 1.00 1.00 1.00 PHF Adj: 0.90 0.90 0.90 0.90 0.90 0.90 0.90 0.90 0.90 0.90 0.90 0.90 PHF Volume: 12 523 693 274 773 7 4 12 7 197 5 84 Reduct Vol: 0 0 0 0 0 0 0 0 0 0 0 0 Reduced Vol: 12 523 693 274 773 7 4 12 7 197 5 84 PCE Adj: 1.00 1.00 1.00 1.00 1.00 1.00 1.00 1.00 1.00 1.00 1.00 1.00 MLF Adj: 1.00 1.00 1.00 1.00 1.00 1.00 1.00 1.00 1.00 1.00 1.00 1.00 FinalVolume: 12 523 693 274 773 7 4 12 7 197 5 84 ------------|---------------||---------------||---------------||---------------|Saturation Flow Module:Sat/Lane: 1800 1800 1800 1800 1800 1800 1800 1800 1800 1800 1800 1800 Adjustment: 0.90 0.92 0.92 0.90 1.00 1.00 0.88 0.93 0.93 0.66 0.70 0.85 Lanes: 1.00 1.00 1.00 1.00 1.98 0.02 0.16 0.53 0.31 0.98 0.02 1.00 Final Sat.: 1615 1647 1647 1615 3564 33 255 888 511 1166 27 1530 ------------|---------------||---------------||---------------||---------------|Capacity Analysis Module:Vol/Sat: 0.01 0.32 0.42 0.17 0.22 0.22 0.01 0.01 0.01 0.17 0.17 0.05 Crit Moves: **** **** **** Green/Cycle: 0.21 0.48 0.48 0.20 0.47 0.47 0.24 0.24 0.24 0.24 0.24 0.24 Volume/Cap: 0.04 0.66 0.87 0.87 0.46 0.46 0.06 0.06 0.06 0.71 0.71 0.23 Delay/Veh: 31.8 20.3 29.0 60.7 17.9 17.9 29.3 29.3 29.3 42.5 42.5 30.9 User DelAdj: 1.00 1.00 1.00 1.00 1.00 1.00 1.00 1.00 1.00 1.00 1.00 1.00 AdjDel/Veh: 31.8 20.3 29.0 60.7 17.9 17.9 29.3 29.3 29.3 42.5 42.5 30.9 LOS by Move: C C C E B B C C C D D C HCM2kAvgQ: 0 13 22 12 8 8 1 1 1 7 7 2 ********************************************************************************Note: Queue reported is the number of cars per lane.
Traffix 8.0.0715 (c) 2008 Dowling Assoc. Licensed to RK ENGINEERING GROUP

OPENING YEAR (PM) Tue May 12, 2015 14:38:39 Page 2-1 -------------------------------------------------------------------------------- AGUA MANSA HIGH CUBE WAREHOUSE COUNTY OF SAN BERNARDINO OPENING YEAR (2017) WITH RELATED PROJ WITHOUT PROJ CONDITIONS -------------------------------------------------------------------------------- Level Of Service Computation Report 2000 HCM Operations Method (Future Volume Alternative) ********************************************************************************Intersection #1 CEDAR AVENUE (NS) AT EL RAVINO ROAD (EW) ********************************************************************************Cycle (sec): 100 Critical Vol./Cap.(X): 0.994Loss Time (sec): 8 Average Delay (sec/veh): 54.1Optimal Cycle: OPTIMIZED Level Of Service: D********************************************************************************Approach: North Bound South Bound East Bound West Bound Movement: L - T - R L - T - R L - T - R L - T - R ------------|---------------||---------------||---------------||---------------|Control: Protected Protected Permitted Permitted Rights: Include Include Include Include Min. Green: 10 0 0 10 23 23 10 14 14 10 24 24 Y+R: 4.0 4.0 4.0 4.0 4.0 4.0 4.0 4.0 4.0 4.0 4.0 4.0 Lanes: 1 0 1 1 0 1 0 1 1 0 0 0 1! 0 0 0 1 0 0 1 ------------|---------------||---------------||---------------||---------------|Volume Module:Base Vol: 7 669 56 67 702 8 9 7 14 45 12 88 Growth Adj: 1.06 1.06 1.06 1.06 1.06 1.06 1.06 1.06 1.06 1.06 1.06 1.06 Initial Bse: 7 709 59 71 744 8 10 7 15 48 13 93 Added Vol: 0 6 186 50 3 0 0 3 0 544 9 147 PasserByVol: 0 0 0 0 0 0 0 0 0 0 0 0 Initial Fut: 7 715 245 121 747 8 10 10 15 592 22 240 User Adj: 1.00 1.00 1.00 1.00 1.00 1.00 1.00 1.00 1.00 1.00 1.00 1.00 PHF Adj: 0.95 0.95 0.95 0.95 0.95 0.95 0.95 0.95 0.95 0.95 0.95 0.95 PHF Volume: 8 750 257 127 784 9 10 11 16 621 23 252 Reduct Vol: 0 0 0 0 0 0 0 0 0 0 0 0 Reduced Vol: 8 750 257 127 784 9 10 11 16 621 23 252 PCE Adj: 1.00 1.00 1.00 1.00 1.00 1.00 1.00 1.00 1.00 1.00 1.00 1.00 MLF Adj: 1.00 1.00 1.00 1.00 1.00 1.00 1.00 1.00 1.00 1.00 1.00 1.00 FinalVolume: 8 750 257 127 784 9 10 11 16 621 23 252 ------------|---------------||---------------||---------------||---------------|Saturation Flow Module:Sat/Lane: 1800 1800 1800 1800 1800 1800 1800 1800 1800 1800 1800 1800 Adjustment: 0.90 0.96 0.96 0.90 1.00 1.00 0.78 0.83 0.83 0.66 0.69 0.85 Lanes: 1.00 1.49 0.51 1.00 1.98 0.02 0.29 0.29 0.42 0.97 0.03 1.00 Final Sat.: 1615 2579 885 1615 3552 40 403 441 628 1140 42 1530 ------------|---------------||---------------||---------------||---------------|Capacity Analysis Module:Vol/Sat: 0.00 0.29 0.29 0.08 0.22 0.22 0.02 0.02 0.02 0.54 0.54 0.16 Crit Moves: **** **** **** Green/Cycle: 0.12 0.29 0.29 0.10 0.27 0.27 0.53 0.53 0.53 0.53 0.53 0.53 Volume/Cap: 0.04 1.02 1.02 0.79 0.82 0.82 0.05 0.05 0.05 1.02 1.02 0.31 Delay/Veh: 39.3 69.2 69.2 66.0 40.0 40.0 11.1 11.1 11.1 63.9 63.9 13.2 User DelAdj: 1.00 1.00 1.00 1.00 1.00 1.00 1.00 1.00 1.00 1.00 1.00 1.00 AdjDel/Veh: 39.3 69.2 69.2 66.0 40.0 40.0 11.1 11.1 11.1 63.9 63.9 13.2 LOS by Move: D E E E D D B B B E E B HCM2kAvgQ: 0 23 23 6 14 14 1 1 1 29 29 4 ********************************************************************************Note: Queue reported is the number of cars per lane.
Traffix 8.0.0715 (c) 2008 Dowling Assoc. Licensed to RK ENGINEERING GROUP

OPENING YEAR (AM) Tue May 12, 2015 14:36:38 Page 3-1 -------------------------------------------------------------------------------- AGUA MANSA HIGH CUBE WAREHOUSE COUNTY OF SAN BERNARDINO OPENING YEAR (2017) WITH RELATED PROJ WITHOUT PROJ CONDITIONS -------------------------------------------------------------------------------- Level Of Service Computation Report 2000 HCM Operations Method (Future Volume Alternative) ********************************************************************************Intersection #2 CACTUS AVENUE (NS) AT EL RAVINO ROAD (EW) ********************************************************************************Cycle (sec): 60 Critical Vol./Cap.(X): 0.775Loss Time (sec): 8 Average Delay (sec/veh): 23.8Optimal Cycle: OPTIMIZED Level Of Service: C********************************************************************************Approach: North Bound South Bound East Bound West Bound Movement: L - T - R L - T - R L - T - R L - T - R ------------|---------------||---------------||---------------||---------------|Control: Protected Protected Protected Permitted Rights: Include Include Include Include Min. Green: 0 0 0 10 0 0 10 0 0 0 0 0 Y+R: 4.0 4.0 4.0 4.0 4.0 4.0 4.0 4.0 4.0 4.0 4.0 4.0 Lanes: 0 0 0 0 0 1 0 0 0 1 0 1 0 0 0 0 0 0 1 0 ------------|---------------||---------------||---------------||---------------|Volume Module:Base Vol: 0 0 0 25 0 31 19 68 0 0 81 20 Growth Adj: 1.06 1.06 1.06 1.06 1.06 1.06 1.06 1.06 1.06 1.06 1.06 1.06 Initial Bse: 0 0 0 27 0 33 20 72 0 0 86 21 Added Vol: 0 0 0 12 0 216 143 47 0 0 217 54 PasserByVol: 0 0 0 0 0 0 0 0 0 0 0 0 Initial Fut: 0 0 0 39 0 249 163 119 0 0 303 75 User Adj: 1.00 1.00 1.00 1.00 1.00 1.00 1.00 1.00 1.00 1.00 1.00 1.00 PHF Adj: 0.81 0.81 0.81 0.81 0.81 0.81 0.81 0.81 0.81 0.81 0.81 0.81 PHF Volume: 0 0 0 47 0 306 201 147 0 0 373 93 Reduct Vol: 0 0 0 0 0 0 0 0 0 0 0 0 Reduced Vol: 0 0 0 47 0 306 201 147 0 0 373 93 PCE Adj: 1.00 1.00 1.00 1.00 1.00 1.00 1.00 1.00 1.00 1.00 1.00 1.00 MLF Adj: 1.00 1.00 1.00 1.00 1.00 1.00 1.00 1.00 1.00 1.00 1.00 1.00 FinalVolume: 0 0 0 47 0 306 201 147 0 0 373 93 ------------|---------------||---------------||---------------||---------------|Saturation Flow Module:Sat/Lane: 1800 1800 1800 1800 1800 1800 1800 1800 1800 1800 1800 1800 Adjustment: 0.94 1.00 1.00 0.90 1.00 0.85 0.92 0.97 1.00 0.94 0.97 0.97 Lanes: 0.00 0.00 0.00 1.00 0.00 1.00 0.59 0.41 0.00 0.00 0.80 0.20 Final Sat.: 0 0 0 1615 0 1530 978 714 0 0 1403 348 ------------|---------------||---------------||---------------||---------------|Capacity Analysis Module:Vol/Sat: 0.00 0.00 0.00 0.03 0.00 0.20 0.21 0.21 0.00 0.00 0.27 0.27 Crit Moves: **** **** **** Green/Cycle: 0.00 0.00 0.00 0.26 0.00 0.26 0.27 0.61 0.00 0.00 0.34 0.34 Volume/Cap: 0.00 0.00 0.00 0.11 0.00 0.77 0.77 0.34 0.00 0.00 0.77 0.77 Delay/Veh: 0.0 0.0 0.0 17.1 0.0 29.9 28.6 6.0 0.0 0.0 23.9 23.9 User DelAdj: 1.00 1.00 1.00 1.00 1.00 1.00 1.00 1.00 1.00 1.00 1.00 1.00 AdjDel/Veh: 0.0 0.0 0.0 17.1 0.0 29.9 28.6 6.0 0.0 0.0 23.9 23.9 LOS by Move: A A A B A C C A A A C C HCM2kAvgQ: 0 0 0 1 0 7 6 2 0 0 10 10 ********************************************************************************Note: Queue reported is the number of cars per lane.
Traffix 8.0.0715 (c) 2008 Dowling Assoc. Licensed to RK ENGINEERING GROUP

OPENING YEAR (PM) Tue May 12, 2015 14:38:39 Page 3-1 -------------------------------------------------------------------------------- AGUA MANSA HIGH CUBE WAREHOUSE COUNTY OF SAN BERNARDINO OPENING YEAR (2017) WITH RELATED PROJ WITHOUT PROJ CONDITIONS -------------------------------------------------------------------------------- Level Of Service Computation Report 2000 HCM Operations Method (Future Volume Alternative) ********************************************************************************Intersection #2 CACTUS AVENUE (NS) AT EL RAVINO ROAD (EW) ********************************************************************************Cycle (sec): 65 Critical Vol./Cap.(X): 0.862Loss Time (sec): 8 Average Delay (sec/veh): 28.1Optimal Cycle: OPTIMIZED Level Of Service: C********************************************************************************Approach: North Bound South Bound East Bound West Bound Movement: L - T - R L - T - R L - T - R L - T - R ------------|---------------||---------------||---------------||---------------|Control: Protected Protected Protected Permitted Rights: Include Include Include Include Min. Green: 0 0 0 10 0 0 10 0 0 0 0 0 Y+R: 4.0 4.0 4.0 4.0 4.0 4.0 4.0 4.0 4.0 4.0 4.0 4.0 Lanes: 0 0 0 0 0 1 0 0 0 1 0 1 0 0 0 0 0 0 1 0 ------------|---------------||---------------||---------------||---------------|Volume Module:Base Vol: 0 0 0 14 0 26 41 99 0 0 97 53 Growth Adj: 1.06 1.06 1.06 1.06 1.06 1.06 1.06 1.06 1.06 1.06 1.06 1.06 Initial Bse: 0 0 0 15 0 28 43 105 0 0 103 56 Added Vol: 0 0 0 51 0 186 247 206 0 0 70 18 PasserByVol: 0 0 0 0 0 0 0 0 0 0 0 0 Initial Fut: 0 0 0 66 0 214 290 311 0 0 173 74 User Adj: 1.00 1.00 1.00 1.00 1.00 1.00 1.00 1.00 1.00 1.00 1.00 1.00 PHF Adj: 0.84 0.84 0.84 0.84 0.84 0.84 0.84 0.84 0.84 0.84 0.84 0.84 PHF Volume: 0 0 0 78 0 255 346 371 0 0 206 88 Reduct Vol: 0 0 0 0 0 0 0 0 0 0 0 0 Reduced Vol: 0 0 0 78 0 255 346 371 0 0 206 88 PCE Adj: 1.00 1.00 1.00 1.00 1.00 1.00 1.00 1.00 1.00 1.00 1.00 1.00 MLF Adj: 1.00 1.00 1.00 1.00 1.00 1.00 1.00 1.00 1.00 1.00 1.00 1.00 FinalVolume: 0 0 0 78 0 255 346 371 0 0 206 88 ------------|---------------||---------------||---------------||---------------|Saturation Flow Module:Sat/Lane: 1800 1800 1800 1800 1800 1800 1800 1800 1800 1800 1800 1800 Adjustment: 0.94 1.00 1.00 0.90 1.00 0.85 0.92 0.98 1.00 0.94 0.96 0.96 Lanes: 0.00 0.00 0.00 1.00 0.00 1.00 0.50 0.50 0.00 0.00 0.70 0.30 Final Sat.: 0 0 0 1615 0 1530 825 883 0 0 1209 519 ------------|---------------||---------------||---------------||---------------|Capacity Analysis Module:Vol/Sat: 0.00 0.00 0.00 0.05 0.00 0.17 0.42 0.42 0.00 0.00 0.17 0.17 Crit Moves: **** **** **** Green/Cycle: 0.00 0.00 0.00 0.19 0.00 0.19 0.49 0.68 0.00 0.00 0.20 0.20 Volume/Cap: 0.00 0.00 0.00 0.25 0.00 0.86 0.86 0.61 0.00 0.00 0.86 0.86 Delay/Veh: 0.0 0.0 0.0 22.7 0.0 47.4 24.0 6.6 0.0 0.0 44.8 44.8 User DelAdj: 1.00 1.00 1.00 1.00 1.00 1.00 1.00 1.00 1.00 1.00 1.00 1.00 AdjDel/Veh: 0.0 0.0 0.0 22.7 0.0 47.4 24.0 6.6 0.0 0.0 44.8 44.8 LOS by Move: A A A C A D C A A A D D HCM2kAvgQ: 0 0 0 2 0 8 10 5 0 0 9 9 ********************************************************************************Note: Queue reported is the number of cars per lane.
Traffix 8.0.0715 (c) 2008 Dowling Assoc. Licensed to RK ENGINEERING GROUP

OPENING YEAR (AM) Tue May 12, 2015 14:36:38 Page 4-1 -------------------------------------------------------------------------------- AGUA MANSA HIGH CUBE WAREHOUSE COUNTY OF SAN BERNARDINO OPENING YEAR (2017) WITH RELATED PROJ WITHOUT PROJ CONDITIONS -------------------------------------------------------------------------------- Level Of Service Computation Report 2000 HCM Unsignalized Method (Future Volume Alternative) ********************************************************************************Intersection #3 HALL AVENUE (NS) AT EL RAVINO ROAD (EW) ********************************************************************************Average Delay (sec/veh): 1.3 Worst Case Level Of Service: B[ 14.3]********************************************************************************Approach: North Bound South Bound East Bound West Bound Movement: L - T - R L - T - R L - T - R L - T - R ------------|---------------||---------------||---------------||---------------|Control: Stop Sign Stop Sign Uncontrolled UncontrolledRights: Include Include Include Include Lanes: 0 0 1! 0 0 0 0 1! 0 0 0 0 1! 0 0 0 0 1! 0 0 ------------|---------------||---------------||---------------||---------------|Volume Module:Base Vol: 17 1 14 12 3 4 4 83 27 1 80 3 Growth Adj: 1.06 1.06 1.06 1.06 1.06 1.06 1.06 1.06 1.06 1.06 1.06 1.06 Initial Bse: 18 1 15 13 3 4 4 88 29 1 85 3 Added Vol: 0 0 0 0 0 0 0 59 0 0 272 0 PasserByVol: 0 0 0 0 0 0 0 0 0 0 0 0 Initial Fut: 18 1 15 13 3 4 4 147 29 1 357 3 User Adj: 1.00 1.00 1.00 1.00 1.00 1.00 1.00 1.00 1.00 1.00 1.00 1.00 PHF Adj: 0.83 0.83 0.83 0.83 0.83 0.83 0.83 0.83 0.83 0.83 0.83 0.83 PHF Volume: 22 1 18 15 4 5 5 178 35 1 432 4 Reduct Vol: 0 0 0 0 0 0 0 0 0 0 0 0 FinalVolume: 22 1 18 15 4 5 5 178 35 1 432 4 ------------|---------------||---------------||---------------||---------------|Critical Gap Module:Critical Gp: 7.1 6.5 6.2 7.1 6.5 6.2 4.1 xxxx xxxxx 4.1 xxxx xxxxx FollowUpTim: 3.5 4.0 3.3 3.5 4.0 3.3 2.2 xxxx xxxxx 2.2 xxxx xxxxx ------------|---------------||---------------||---------------||---------------|Capacity Module:Cnflict Vol: 647 645 196 652 660 434 436 xxxx xxxxx 213 xxxx xxxxx Potent Cap.: 387 394 851 384 386 626 1134 xxxx xxxxx 1369 xxxx xxxxx Move Cap.: 379 391 851 373 384 626 1134 xxxx xxxxx 1369 xxxx xxxxx Volume/Cap: 0.06 0.00 0.02 0.04 0.01 0.01 0.00 xxxx xxxx 0.00 xxxx xxxx ------------|---------------||---------------||---------------||---------------|Level Of Service Module:2Way95thQ: xxxx xxxx xxxxx xxxx xxxx xxxxx 0.0 xxxx xxxxx 0.0 xxxx xxxxx Control Del:xxxxx xxxx xxxxx xxxxx xxxx xxxxx 8.2 xxxx xxxxx 7.6 xxxx xxxxx LOS by Move: * * * * * * A * * A * * Movement: LT - LTR - RT LT - LTR - RT LT - LTR - RT LT - LTR - RT Shared Cap.: xxxx 501 xxxxx xxxx 410 xxxxx xxxx xxxx xxxxx xxxx xxxx xxxxx SharedQueue:xxxxx 0.3 xxxxx xxxxx 0.2 xxxxx xxxxx xxxx xxxxx xxxxx xxxx xxxxx Shrd ConDel:xxxxx 12.8 xxxxx xxxxx 14.3 xxxxx xxxxx xxxx xxxxx xxxxx xxxx xxxxx Shared LOS: * B * * B * * * * * * * ApproachDel: 12.8 14.3 xxxxxx xxxxxxApproachLOS: B B * * ********************************************************************************Note: Queue reported is the number of cars per lane.********************************************************************************
Traffix 8.0.0715 (c) 2008 Dowling Assoc. Licensed to RK ENGINEERING GROUP

OPENING YEAR (PM) Tue May 12, 2015 14:38:39 Page 4-1 -------------------------------------------------------------------------------- AGUA MANSA HIGH CUBE WAREHOUSE COUNTY OF SAN BERNARDINO OPENING YEAR (2017) WITH RELATED PROJ WITHOUT PROJ CONDITIONS -------------------------------------------------------------------------------- Level Of Service Computation Report 2000 HCM Unsignalized Method (Future Volume Alternative) ********************************************************************************Intersection #3 HALL AVENUE (NS) AT EL RAVINO ROAD (EW) ********************************************************************************Average Delay (sec/veh): 1.9 Worst Case Level Of Service: C[ 17.3]********************************************************************************Approach: North Bound South Bound East Bound West Bound Movement: L - T - R L - T - R L - T - R L - T - R ------------|---------------||---------------||---------------||---------------|Control: Stop Sign Stop Sign Uncontrolled UncontrolledRights: Include Include Include Include Lanes: 0 0 1! 0 0 0 0 1! 0 0 0 0 1! 0 0 0 0 0 1 0 ------------|---------------||---------------||---------------||---------------|Volume Module:Base Vol: 45 4 5 9 4 1 5 89 13 0 110 15 Growth Adj: 1.06 1.06 1.06 1.06 1.06 1.06 1.06 1.06 1.06 1.06 1.06 1.06 Initial Bse: 48 4 5 10 4 1 5 94 14 0 117 16 Added Vol: 0 0 0 0 0 0 0 257 0 0 88 0 PasserByVol: 0 0 0 0 0 0 0 0 0 0 0 0 Initial Fut: 48 4 5 10 4 1 5 351 14 0 205 16 User Adj: 1.00 1.00 1.00 1.00 1.00 1.00 1.00 1.00 1.00 1.00 1.00 1.00 PHF Adj: 0.83 0.83 0.83 0.83 0.83 0.83 0.83 0.83 0.83 0.83 0.83 0.83 PHF Volume: 58 5 6 12 5 1 6 425 17 0 248 19 Reduct Vol: 0 0 0 0 0 0 0 0 0 0 0 0 FinalVolume: 58 5 6 12 5 1 6 425 17 0 248 19 ------------|---------------||---------------||---------------||---------------|Critical Gap Module:Critical Gp: 7.1 6.5 6.2 7.1 6.5 6.2 4.1 xxxx xxxxx xxxxx xxxx xxxxx FollowUpTim: 3.5 4.0 3.3 3.5 4.0 3.3 2.2 xxxx xxxxx xxxxx xxxx xxxxx ------------|---------------||---------------||---------------||---------------|Capacity Module:Cnflict Vol: 707 713 434 710 712 257 267 xxxx xxxxx xxxx xxxx xxxxx Potent Cap.: 353 359 626 351 360 786 1309 xxxx xxxxx xxxx xxxx xxxxx Move Cap.: 347 358 626 343 358 786 1309 xxxx xxxxx xxxx xxxx xxxxx Volume/Cap: 0.17 0.01 0.01 0.03 0.01 0.00 0.00 xxxx xxxx xxxx xxxx xxxx ------------|---------------||---------------||---------------||---------------|Level Of Service Module:2Way95thQ: xxxx xxxx xxxxx xxxx xxxx xxxxx 0.0 xxxx xxxxx xxxx xxxx xxxxx Control Del:xxxxx xxxx xxxxx xxxxx xxxx xxxxx 7.8 xxxx xxxxx xxxxx xxxx xxxxx LOS by Move: * * * * * * A * * * * * Movement: LT - LTR - RT LT - LTR - RT LT - LTR - RT LT - LTR - RT Shared Cap.: xxxx 363 xxxxx xxxx 362 xxxxx xxxx xxxx xxxxx xxxx xxxx xxxxx SharedQueue:xxxxx 0.7 xxxxx xxxxx 0.2 xxxxx xxxxx xxxx xxxxx xxxxx xxxx xxxxx Shrd ConDel:xxxxx 17.3 xxxxx xxxxx 15.5 xxxxx xxxxx xxxx xxxxx xxxxx xxxx xxxxx Shared LOS: * C * * C * * * * * * * ApproachDel: 17.3 15.5 xxxxxx xxxxxxApproachLOS: C C * * ********************************************************************************Note: Queue reported is the number of cars per lane.********************************************************************************
Traffix 8.0.0715 (c) 2008 Dowling Assoc. Licensed to RK ENGINEERING GROUP

OPENING YEAR (AM) Tue May 12, 2015 14:36:38 Page 5-1 -------------------------------------------------------------------------------- AGUA MANSA HIGH CUBE WAREHOUSE COUNTY OF SAN BERNARDINO OPENING YEAR (2017) WITH RELATED PROJ WITHOUT PROJ CONDITIONS -------------------------------------------------------------------------------- Level Of Service Computation Report 2000 HCM Unsignalized Method (Future Volume Alternative) ********************************************************************************Intersection #4 KININGHAM DRIVE (NS) AT EL RAVINO ROAD (EW) ********************************************************************************Average Delay (sec/veh): 0.1 Worst Case Level Of Service: B[ 12.5]********************************************************************************Approach: North Bound South Bound East Bound West Bound Movement: L - T - R L - T - R L - T - R L - T - R ------------|---------------||---------------||---------------||---------------|Control: Stop Sign Stop Sign Uncontrolled UncontrolledRights: Include Include Include Include Lanes: 0 0 0 0 0 0 0 1! 0 0 0 1 0 0 0 0 0 0 1 0 ------------|---------------||---------------||---------------||---------------|Volume Module:Base Vol: 0 0 0 2 0 1 3 90 0 0 77 1 Growth Adj: 1.06 1.06 1.06 1.06 1.06 1.06 1.06 1.06 1.06 1.06 1.06 1.06 Initial Bse: 0 0 0 2 0 1 3 95 0 0 82 1 Added Vol: 0 0 0 0 0 0 0 59 0 0 272 0 PasserByVol: 0 0 0 0 0 0 0 0 0 0 0 0 Initial Fut: 0 0 0 2 0 1 3 154 0 0 354 1 User Adj: 1.00 1.00 1.00 1.00 1.00 1.00 1.00 1.00 1.00 1.00 1.00 1.00 PHF Adj: 0.79 0.79 0.79 0.79 0.79 0.79 0.79 0.79 0.79 0.79 0.79 0.79 PHF Volume: 0 0 0 3 0 1 4 195 0 0 447 1 Reduct Vol: 0 0 0 0 0 0 0 0 0 0 0 0 FinalVolume: 0 0 0 3 0 1 4 195 0 0 447 1 ------------|---------------||---------------||---------------||---------------|Critical Gap Module:Critical Gp:xxxxx xxxx xxxxx 6.4 6.5 6.2 4.1 xxxx xxxxx xxxxx xxxx xxxxx FollowUpTim:xxxxx xxxx xxxxx 3.5 4.0 3.3 2.2 xxxx xxxxx xxxxx xxxx xxxxx ------------|---------------||---------------||---------------||---------------|Capacity Module:Cnflict Vol: xxxx xxxx xxxxx 651 651 448 448 xxxx xxxxx xxxx xxxx xxxxx Potent Cap.: xxxx xxxx xxxxx 436 390 615 1123 xxxx xxxxx xxxx xxxx xxxxx Move Cap.: xxxx xxxx xxxxx 435 389 615 1123 xxxx xxxxx xxxx xxxx xxxxx Volume/Cap: xxxx xxxx xxxx 0.01 0.00 0.00 0.00 xxxx xxxx xxxx xxxx xxxx ------------|---------------||---------------||---------------||---------------|Level Of Service Module:2Way95thQ: xxxx xxxx xxxxx xxxx xxxx xxxxx 0.0 xxxx xxxxx xxxx xxxx xxxxx Control Del:xxxxx xxxx xxxxx xxxxx xxxx xxxxx 8.2 xxxx xxxxx xxxxx xxxx xxxxx LOS by Move: * * * * * * A * * * * * Movement: LT - LTR - RT LT - LTR - RT LT - LTR - RT LT - LTR - RT Shared Cap.: xxxx xxxx xxxxx xxxx 482 xxxxx xxxx xxxx xxxxx xxxx xxxx xxxxx SharedQueue:xxxxx xxxx xxxxx xxxxx 0.0 xxxxx 0.0 xxxx xxxxx xxxxx xxxx xxxxx Shrd ConDel:xxxxx xxxx xxxxx xxxxx 12.5 xxxxx 8.2 xxxx xxxxx xxxxx xxxx xxxxx Shared LOS: * * * * B * A * * * * * ApproachDel: xxxxxx 12.5 xxxxxx xxxxxxApproachLOS: * B * * ********************************************************************************Note: Queue reported is the number of cars per lane.********************************************************************************
Traffix 8.0.0715 (c) 2008 Dowling Assoc. Licensed to RK ENGINEERING GROUP

OPENING YEAR (PM) Tue May 12, 2015 14:38:39 Page 5-1 -------------------------------------------------------------------------------- AGUA MANSA HIGH CUBE WAREHOUSE COUNTY OF SAN BERNARDINO OPENING YEAR (2017) WITH RELATED PROJ WITHOUT PROJ CONDITIONS -------------------------------------------------------------------------------- Level Of Service Computation Report 2000 HCM Unsignalized Method (Future Volume Alternative) ********************************************************************************Intersection #4 KININGHAM DRIVE (NS) AT EL RAVINO ROAD (EW) ********************************************************************************Average Delay (sec/veh): 0.4 Worst Case Level Of Service: B[ 10.1]********************************************************************************Approach: North Bound South Bound East Bound West Bound Movement: L - T - R L - T - R L - T - R L - T - R ------------|---------------||---------------||---------------||---------------|Control: Stop Sign Stop Sign Uncontrolled UncontrolledRights: Include Include Include Include Lanes: 0 0 0 0 0 0 0 1! 0 0 0 1 0 0 0 0 0 0 1 0 ------------|---------------||---------------||---------------||---------------|Volume Module:Base Vol: 0 0 0 2 0 9 12 96 0 0 93 10 Growth Adj: 1.06 1.06 1.06 1.06 1.06 1.06 1.06 1.06 1.06 1.06 1.06 1.06 Initial Bse: 0 0 0 2 0 10 13 102 0 0 99 11 Added Vol: 0 0 0 0 0 0 0 257 0 0 88 0 PasserByVol: 0 0 0 0 0 0 0 0 0 0 0 0 Initial Fut: 0 0 0 2 0 10 13 359 0 0 187 11 User Adj: 1.00 1.00 1.00 1.00 1.00 1.00 1.00 1.00 1.00 1.00 1.00 1.00 PHF Adj: 0.89 0.89 0.89 0.89 0.89 0.89 0.89 0.89 0.89 0.89 0.89 0.89 PHF Volume: 0 0 0 2 0 11 14 401 0 0 209 12 Reduct Vol: 0 0 0 0 0 0 0 0 0 0 0 0 FinalVolume: 0 0 0 2 0 11 14 401 0 0 209 12 ------------|---------------||---------------||---------------||---------------|Critical Gap Module:Critical Gp:xxxxx xxxx xxxxx 6.4 6.5 6.2 4.1 xxxx xxxxx xxxxx xxxx xxxxx FollowUpTim:xxxxx xxxx xxxxx 3.5 4.0 3.3 2.2 xxxx xxxxx xxxxx xxxx xxxxx ------------|---------------||---------------||---------------||---------------|Capacity Module:Cnflict Vol: xxxx xxxx xxxxx 644 644 215 221 xxxx xxxxx xxxx xxxx xxxxx Potent Cap.: xxxx xxxx xxxxx 440 394 830 1361 xxxx xxxxx xxxx xxxx xxxxx Move Cap.: xxxx xxxx xxxxx 437 390 830 1361 xxxx xxxxx xxxx xxxx xxxxx Volume/Cap: xxxx xxxx xxxx 0.01 0.00 0.01 0.01 xxxx xxxx xxxx xxxx xxxx ------------|---------------||---------------||---------------||---------------|Level Of Service Module:2Way95thQ: xxxx xxxx xxxxx xxxx xxxx xxxxx 0.0 xxxx xxxxx xxxx xxxx xxxxx Control Del:xxxxx xxxx xxxxx xxxxx xxxx xxxxx 7.7 xxxx xxxxx xxxxx xxxx xxxxx LOS by Move: * * * * * * A * * * * * Movement: LT - LTR - RT LT - LTR - RT LT - LTR - RT LT - LTR - RT Shared Cap.: xxxx xxxx xxxxx xxxx 713 xxxxx xxxx xxxx xxxxx xxxx xxxx xxxxx SharedQueue:xxxxx xxxx xxxxx xxxxx 0.1 xxxxx 0.0 xxxx xxxxx xxxxx xxxx xxxxx Shrd ConDel:xxxxx xxxx xxxxx xxxxx 10.1 xxxxx 7.7 xxxx xxxxx xxxxx xxxx xxxxx Shared LOS: * * * * B * A * * * * * ApproachDel: xxxxxx 10.1 xxxxxx xxxxxxApproachLOS: * B * * ********************************************************************************Note: Queue reported is the number of cars per lane.********************************************************************************
Traffix 8.0.0715 (c) 2008 Dowling Assoc. Licensed to RK ENGINEERING GROUP

OPENING YEAR (AM) Tue May 12, 2015 14:36:38 Page 6-1 -------------------------------------------------------------------------------- AGUA MANSA HIGH CUBE WAREHOUSE COUNTY OF SAN BERNARDINO OPENING YEAR (2017) WITH RELATED PROJ WITHOUT PROJ CONDITIONS -------------------------------------------------------------------------------- Level Of Service Computation Report 2000 HCM Unsignalized Method (Future Volume Alternative) ********************************************************************************Intersection #5 AGUA MANSA ROAD (NS) AT EL RAVINO ROAD (EW) ********************************************************************************Average Delay (sec/veh): 5.9 Worst Case Level Of Service: F[ 54.6]********************************************************************************Approach: North Bound South Bound East Bound West Bound Movement: L - T - R L - T - R L - T - R L - T - R ------------|---------------||---------------||---------------||---------------|Control: Uncontrolled Uncontrolled Stop Sign Stop Sign Rights: Include Include Ignore Include Lanes: 1 0 1 0 0 0 0 0 1 0 1 0 0 0 1 0 0 0 0 0 ------------|---------------||---------------||---------------||---------------|Volume Module:Base Vol: 8 303 0 0 393 40 69 0 22 0 0 0 Growth Adj: 1.06 1.06 1.06 1.06 1.06 1.06 1.06 1.06 1.06 1.06 1.06 1.06 Initial Bse: 8 321 0 0 417 42 73 0 23 0 0 0 Added Vol: 136 6 0 0 17 135 29 0 30 0 0 0 PasserByVol: 0 0 0 0 0 0 0 0 0 0 0 0 Initial Fut: 144 327 0 0 434 177 102 0 53 0 0 0 User Adj: 1.00 1.00 1.00 1.00 1.00 1.00 1.00 1.00 0.00 1.00 1.00 1.00 PHF Adj: 0.93 0.93 0.93 0.93 0.93 0.93 0.93 0.93 0.00 0.93 0.93 0.93 PHF Volume: 155 351 0 0 465 190 109 0 0 0 0 0 Reduct Vol: 0 0 0 0 0 0 0 0 0 0 0 0 FinalVolume: 155 351 0 0 465 190 109 0 0 0 0 0 ------------|---------------||---------------||---------------||---------------|Critical Gap Module:Critical Gp: 4.1 xxxx xxxxx xxxxx xxxx xxxxx 6.4 xxxx 6.2 xxxxx xxxx xxxxx FollowUpTim: 2.2 xxxx xxxxx xxxxx xxxx xxxxx 3.5 xxxx 3.3 xxxxx xxxx xxxxx ------------|---------------||---------------||---------------||---------------|Capacity Module:Cnflict Vol: 655 xxxx xxxxx xxxx xxxx xxxxx 1220 xxxx 560 xxxx xxxx xxxxx Potent Cap.: 942 xxxx xxxxx xxxx xxxx xxxxx 201 xxxx 532 xxxx xxxx xxxxx Move Cap.: 942 xxxx xxxxx xxxx xxxx xxxxx 175 xxxx 532 xxxx xxxx xxxxx Volume/Cap: 0.16 xxxx xxxx xxxx xxxx xxxx 0.62 xxxx 0.00 xxxx xxxx xxxx ------------|---------------||---------------||---------------||---------------|Level Of Service Module:2Way95thQ: 0.6 xxxx xxxxx xxxx xxxx xxxxx 3.5 xxxx xxxxx xxxx xxxx xxxxx Control Del: 9.6 xxxx xxxxx xxxxx xxxx xxxxx 54.6 xxxx xxxxx xxxxx xxxx xxxxx LOS by Move: A * * * * * F * * * * * Movement: LT - LTR - RT LT - LTR - RT LT - LTR - RT LT - LTR - RT Shared Cap.: xxxx xxxx xxxxx xxxx xxxx xxxxx xxxx xxxx xxxxx xxxx xxxx xxxxx SharedQueue:xxxxx xxxx xxxxx xxxxx xxxx xxxxx xxxxx xxxx xxxxx xxxxx xxxx xxxxx Shrd ConDel:xxxxx xxxx xxxxx xxxxx xxxx xxxxx xxxxx xxxx xxxxx xxxxx xxxx xxxxx Shared LOS: * * * * * * * * * * * * ApproachDel: xxxxxx xxxxxx 54.6 xxxxxxApproachLOS: * * F * ********************************************************************************Note: Queue reported is the number of cars per lane.********************************************************************************
Traffix 8.0.0715 (c) 2008 Dowling Assoc. Licensed to RK ENGINEERING GROUP

OPENING YEAR (PM) Tue May 12, 2015 14:38:39 Page 6-1 -------------------------------------------------------------------------------- AGUA MANSA HIGH CUBE WAREHOUSE COUNTY OF SAN BERNARDINO OPENING YEAR (2017) WITH RELATED PROJ WITHOUT PROJ CONDITIONS -------------------------------------------------------------------------------- Level Of Service Computation Report 2000 HCM Unsignalized Method (Future Volume Alternative) ********************************************************************************Intersection #5 AGUA MANSA ROAD (NS) AT EL RAVINO ROAD (EW) ********************************************************************************Average Delay (sec/veh): 120.0 Worst Case Level Of Service: F[768.9]********************************************************************************Approach: North Bound South Bound East Bound West Bound Movement: L - T - R L - T - R L - T - R L - T - R ------------|---------------||---------------||---------------||---------------|Control: Uncontrolled Uncontrolled Stop Sign Stop Sign Rights: Include Include Ignore Include Lanes: 1 0 1 0 0 0 0 0 1 0 1 0 0 0 1 0 0 0 0 0 ------------|---------------||---------------||---------------||---------------|Volume Module:Base Vol: 37 652 0 0 315 78 98 0 9 0 0 0 Growth Adj: 1.06 1.06 1.06 1.06 1.06 1.06 1.06 1.06 1.06 1.06 1.06 1.06 Initial Bse: 39 691 0 0 334 83 104 0 10 0 0 0 Added Vol: 44 17 0 0 8 44 128 0 129 0 0 0 PasserByVol: 0 0 0 0 0 0 0 0 0 0 0 0 Initial Fut: 83 708 0 0 342 127 232 0 139 0 0 0 User Adj: 1.00 1.00 1.00 1.00 1.00 1.00 1.00 1.00 0.00 1.00 1.00 1.00 PHF Adj: 0.81 0.81 0.81 0.81 0.81 0.81 0.81 0.81 0.00 0.81 0.81 0.81 PHF Volume: 102 870 0 0 420 156 285 0 0 0 0 0 Reduct Vol: 0 0 0 0 0 0 0 0 0 0 0 0 FinalVolume: 102 870 0 0 420 156 285 0 0 0 0 0 ------------|---------------||---------------||---------------||---------------|Critical Gap Module:Critical Gp: 4.1 xxxx xxxxx xxxxx xxxx xxxxx 6.4 xxxx 6.2 xxxxx xxxx xxxxx FollowUpTim: 2.2 xxxx xxxxx xxxxx xxxx xxxxx 3.5 xxxx 3.3 xxxxx xxxx xxxxx ------------|---------------||---------------||---------------||---------------|Capacity Module:Cnflict Vol: 576 xxxx xxxxx xxxx xxxx xxxxx 1572 xxxx 498 xxxx xxxx xxxxx Potent Cap.: 1008 xxxx xxxxx xxxx xxxx xxxxx 123 xxxx 576 xxxx xxxx xxxxx Move Cap.: 1008 xxxx xxxxx xxxx xxxx xxxxx 113 xxxx 576 xxxx xxxx xxxxx Volume/Cap: 0.10 xxxx xxxx xxxx xxxx xxxx 2.52 xxxx 0.00 xxxx xxxx xxxx ------------|---------------||---------------||---------------||---------------|Level Of Service Module:2Way95thQ: 0.3 xxxx xxxxx xxxx xxxx xxxxx 25.6 xxxx xxxxx xxxx xxxx xxxxx Control Del: 9.0 xxxx xxxxx xxxxx xxxx xxxxx 768.9 xxxx xxxxx xxxxx xxxx xxxxx LOS by Move: A * * * * * F * * * * * Movement: LT - LTR - RT LT - LTR - RT LT - LTR - RT LT - LTR - RT Shared Cap.: xxxx xxxx xxxxx xxxx xxxx xxxxx xxxx xxxx xxxxx xxxx xxxx xxxxx SharedQueue:xxxxx xxxx xxxxx xxxxx xxxx xxxxx xxxxx xxxx xxxxx xxxxx xxxx xxxxx Shrd ConDel:xxxxx xxxx xxxxx xxxxx xxxx xxxxx xxxxx xxxx xxxxx xxxxx xxxx xxxxx Shared LOS: * * * * * * * * * * * * ApproachDel: xxxxxx xxxxxx 768.9 xxxxxxApproachLOS: * * F * ********************************************************************************Note: Queue reported is the number of cars per lane.********************************************************************************
Traffix 8.0.0715 (c) 2008 Dowling Assoc. Licensed to RK ENGINEERING GROUP

MITIG8 - OPENING YEAR (AM) Tue May 12, 2015 15:10:17 Page 1-1 -------------------------------------------------------------------------------- AGUA MANSA HIGH CUBE WAREHOUSE COUNTY OF SAN BERNARDINO OPENING YEAR (2017) WITH RELATED PROJ WITHOUT PROJ CONDITIONS -------------------------------------------------------------------------------- Level Of Service Computation Report 2000 HCM Operations Method (Future Volume Alternative) ********************************************************************************Intersection #5 AGUA MANSA ROAD (NS) AT EL RAVINO ROAD (EW) ********************************************************************************Cycle (sec): 60 Critical Vol./Cap.(X): 0.620Loss Time (sec): 6 Average Delay (sec/veh): 11.7Optimal Cycle: OPTIMIZED Level Of Service: B********************************************************************************Approach: North Bound South Bound East Bound West Bound Movement: L - T - R L - T - R L - T - R L - T - R ------------|---------------||---------------||---------------||---------------|Control: Protected Permitted Permitted Permitted Rights: Include Include Ignore Include Min. Green: 10 10 0 0 10 10 10 0 10 0 0 0 Y+R: 4.0 4.0 4.0 4.0 4.0 4.0 4.0 4.0 4.0 4.0 4.0 4.0 Lanes: 1 0 1 0 0 0 0 0 1 0 1 0 0 0 1 0 0 0 0 0 ------------|---------------||---------------||---------------||---------------|Volume Module:Base Vol: 8 303 0 0 393 40 69 0 22 0 0 0 Growth Adj: 1.06 1.06 1.06 1.06 1.06 1.06 1.06 1.06 1.06 1.06 1.06 1.06 Initial Bse: 8 321 0 0 417 42 73 0 23 0 0 0 Added Vol: 136 6 0 0 17 135 29 0 30 0 0 0 PasserByVol: 0 0 0 0 0 0 0 0 0 0 0 0 Initial Fut: 144 327 0 0 434 177 102 0 53 0 0 0 User Adj: 1.00 1.00 1.00 1.00 1.00 1.00 1.00 1.00 0.00 1.00 1.00 1.00 PHF Adj: 0.93 0.93 0.93 0.93 0.93 0.93 0.93 0.93 0.00 0.93 0.93 0.93 PHF Volume: 155 351 0 0 465 190 109 0 0 0 0 0 Reduct Vol: 0 0 0 0 0 0 0 0 0 0 0 0 Reduced Vol: 155 351 0 0 465 190 109 0 0 0 0 0 PCE Adj: 1.00 1.00 1.00 1.00 1.00 1.00 1.00 1.00 0.00 1.00 1.00 1.00 MLF Adj: 1.00 1.00 1.00 1.00 1.00 1.00 1.00 1.00 0.00 1.00 1.00 1.00 FinalVolume: 155 351 0 0 465 190 109 0 0 0 0 0 ------------|---------------||---------------||---------------||---------------|Saturation Flow Module:Sat/Lane: 1800 1800 1800 1800 1800 1800 1800 1800 1800 1800 1800 1800 Adjustment: 0.90 1.00 1.00 0.94 0.96 0.96 0.73 1.00 1.00 0.94 1.00 1.00 Lanes: 1.00 1.00 0.00 0.00 0.71 0.29 1.00 0.00 1.00 0.00 0.00 0.00 Final Sat.: 1615 1800 0 0 1228 502 1311 0 1800 0 0 0 ------------|---------------||---------------||---------------||---------------|Capacity Analysis Module:Vol/Sat: 0.10 0.19 0.00 0.00 0.38 0.38 0.08 0.00 0.00 0.00 0.00 0.00 Crit Moves: **** **** **** Green/Cycle: 0.17 0.73 0.00 0.00 0.57 0.57 0.17 0.00 0.00 0.00 0.00 0.00 Volume/Cap: 0.58 0.27 0.00 0.00 0.67 0.67 0.50 0.00 0.00 0.00 0.00 0.00 Delay/Veh: 26.1 2.8 0.0 0.0 10.8 10.8 24.5 0.0 0.0 0.0 0.0 0.0 User DelAdj: 1.00 1.00 1.00 1.00 1.00 1.00 1.00 1.00 1.00 1.00 1.00 1.00 AdjDel/Veh: 26.1 2.8 0.0 0.0 10.8 10.8 24.5 0.0 0.0 0.0 0.0 0.0 LOS by Move: C A A A B B C A A A A A HCM2kAvgQ: 4 2 0 0 9 9 2 0 0 0 0 0 ********************************************************************************Note: Queue reported is the number of cars per lane.
Traffix 8.0.0715 (c) 2008 Dowling Assoc. Licensed to RK ENGINEERING GROUP

MITIG8 - OPENING YEAR (PM) Tue May 12, 2015 15:09:14 Page 1-1 -------------------------------------------------------------------------------- AGUA MANSA HIGH CUBE WAREHOUSE COUNTY OF SAN BERNARDINO OPENING YEAR (2017) WITH RELATED PROJ WITHOUT PROJ CONDITIONS -------------------------------------------------------------------------------- Level Of Service Computation Report 2000 HCM Operations Method (Future Volume Alternative) ********************************************************************************Intersection #5 AGUA MANSA ROAD (NS) AT EL RAVINO ROAD (EW) ********************************************************************************Cycle (sec): 60 Critical Vol./Cap.(X): 0.681Loss Time (sec): 6 Average Delay (sec/veh): 17.3Optimal Cycle: OPTIMIZED Level Of Service: B********************************************************************************Approach: North Bound South Bound East Bound West Bound Movement: L - T - R L - T - R L - T - R L - T - R ------------|---------------||---------------||---------------||---------------|Control: Protected Permitted Permitted Permitted Rights: Include Include Ignore Include Min. Green: 10 10 0 0 10 10 10 0 10 0 0 0 Y+R: 4.0 4.0 4.0 4.0 4.0 4.0 4.0 4.0 4.0 4.0 4.0 4.0 Lanes: 1 0 1 0 0 0 0 0 1 0 1 0 0 0 1 0 0 0 0 0 ------------|---------------||---------------||---------------||---------------|Volume Module:Base Vol: 37 652 0 0 315 78 98 0 9 0 0 0 Growth Adj: 1.06 1.06 1.06 1.06 1.06 1.06 1.06 1.06 1.06 1.06 1.06 1.06 Initial Bse: 39 691 0 0 334 83 104 0 10 0 0 0 Added Vol: 44 17 0 0 8 44 128 0 129 0 0 0 PasserByVol: 0 0 0 0 0 0 0 0 0 0 0 0 Initial Fut: 83 708 0 0 342 127 232 0 139 0 0 0 User Adj: 1.00 1.00 1.00 1.00 1.00 1.00 1.00 1.00 0.00 1.00 1.00 1.00 PHF Adj: 0.81 0.81 0.81 0.81 0.81 0.81 0.81 0.81 0.00 0.81 0.81 0.81 PHF Volume: 102 870 0 0 420 156 285 0 0 0 0 0 Reduct Vol: 0 0 0 0 0 0 0 0 0 0 0 0 Reduced Vol: 102 870 0 0 420 156 285 0 0 0 0 0 PCE Adj: 1.00 1.00 1.00 1.00 1.00 1.00 1.00 1.00 0.00 1.00 1.00 1.00 MLF Adj: 1.00 1.00 1.00 1.00 1.00 1.00 1.00 1.00 0.00 1.00 1.00 1.00 FinalVolume: 102 870 0 0 420 156 285 0 0 0 0 0 ------------|---------------||---------------||---------------||---------------|Saturation Flow Module:Sat/Lane: 1800 1800 1800 1800 1800 1800 1800 1800 1800 1800 1800 1800 Adjustment: 0.90 1.00 1.00 0.94 0.96 0.96 0.73 1.00 1.00 0.94 1.00 1.00 Lanes: 1.00 1.00 0.00 0.00 0.73 0.27 1.00 0.00 1.00 0.00 0.00 0.00 Final Sat.: 1615 1800 0 0 1266 469 1307 0 1800 0 0 0 ------------|---------------||---------------||---------------||---------------|Capacity Analysis Module:Vol/Sat: 0.06 0.48 0.00 0.00 0.33 0.33 0.22 0.00 0.00 0.00 0.00 0.00 Crit Moves: **** **** **** Green/Cycle: 0.17 0.61 0.00 0.00 0.44 0.44 0.29 0.00 0.00 0.00 0.00 0.00 Volume/Cap: 0.38 0.79 0.00 0.00 0.75 0.75 0.75 0.00 0.00 0.00 0.00 0.00 Delay/Veh: 23.1 12.9 0.0 0.0 18.1 18.1 27.4 0.0 0.0 0.0 0.0 0.0 User DelAdj: 1.00 1.00 1.00 1.00 1.00 1.00 1.00 1.00 1.00 1.00 1.00 1.00 AdjDel/Veh: 23.1 12.9 0.0 0.0 18.1 18.1 27.4 0.0 0.0 0.0 0.0 0.0 LOS by Move: C B A A B B C A A A A A HCM2kAvgQ: 2 14 0 0 9 9 5 0 0 0 0 0 ********************************************************************************Note: Queue reported is the number of cars per lane.
Traffix 8.0.0715 (c) 2008 Dowling Assoc. Licensed to RK ENGINEERING GROUP

OPENING YEAR (AM) Tue May 12, 2015 14:36:38 Page 7-1 -------------------------------------------------------------------------------- AGUA MANSA HIGH CUBE WAREHOUSE COUNTY OF SAN BERNARDINO OPENING YEAR (2017) WITH RELATED PROJ WITHOUT PROJ CONDITIONS -------------------------------------------------------------------------------- Level Of Service Computation Report 2000 HCM Operations Method (Future Volume Alternative) ********************************************************************************Intersection #6 RIVERSIDE AVENUE (NS) AT AGUA MANSA ROAD (EW) ********************************************************************************Cycle (sec): 95 Critical Vol./Cap.(X): 0.646Loss Time (sec): 8 Average Delay (sec/veh): 35.2Optimal Cycle: OPTIMIZED Level Of Service: D********************************************************************************Approach: North Bound South Bound East Bound West Bound Movement: L - T - R L - T - R L - T - R L - T - R ------------|---------------||---------------||---------------||---------------|Control: Protected Protected Protected Protected Rights: Include Include Include Include Min. Green: 10 29 29 10 32 32 10 27 27 10 23 23 Y+R: 4.0 4.0 4.0 4.0 4.0 4.0 4.0 4.0 4.0 4.0 4.0 4.0 Lanes: 1 0 1 1 0 1 0 2 0 1 1 0 1 0 1 1 0 1 0 1 ------------|---------------||---------------||---------------||---------------|Volume Module:Base Vol: 152 713 61 78 846 193 159 165 82 59 241 50 Growth Adj: 1.06 1.06 1.06 1.06 1.06 1.06 1.06 1.06 1.06 1.06 1.06 1.06 Initial Bse: 161 756 65 83 897 205 169 175 87 63 255 53 Added Vol: 77 21 0 0 6 37 10 8 17 0 39 0 PasserByVol: 0 0 0 0 0 0 0 0 0 0 0 0 Initial Fut: 238 777 65 83 903 242 179 183 104 63 294 53 User Adj: 1.00 1.00 1.00 1.00 1.00 1.00 1.00 1.00 1.00 1.00 1.00 1.00 PHF Adj: 0.91 0.91 0.91 0.91 0.91 0.91 0.91 0.91 0.91 0.91 0.91 0.91 PHF Volume: 262 854 71 91 992 265 196 201 114 69 324 58 Reduct Vol: 0 0 0 0 0 0 0 0 0 0 0 0 Reduced Vol: 262 854 71 91 992 265 196 201 114 69 324 58 PCE Adj: 1.00 1.00 1.00 1.00 1.00 1.00 1.00 1.00 1.00 1.00 1.00 1.00 MLF Adj: 1.00 1.00 1.00 1.00 1.00 1.00 1.00 1.00 1.00 1.00 1.00 1.00 FinalVolume: 262 854 71 91 992 265 196 201 114 69 324 58 ------------|---------------||---------------||---------------||---------------|Saturation Flow Module:Sat/Lane: 1800 1800 1800 1800 1800 1800 1800 1800 1800 1800 1800 1800 Adjustment: 0.90 0.99 0.99 0.90 1.00 0.85 0.90 1.00 0.85 0.90 1.00 0.85 Lanes: 1.00 1.85 0.15 1.00 2.00 1.00 1.00 1.00 1.00 1.00 1.00 1.00 Final Sat.: 1615 3283 273 1615 3600 1530 1615 1800 1530 1615 1800 1530 ------------|---------------||---------------||---------------||---------------|Capacity Analysis Module:Vol/Sat: 0.16 0.26 0.26 0.06 0.28 0.17 0.12 0.11 0.07 0.04 0.18 0.04 Crit Moves: **** **** **** **** Green/Cycle: 0.19 0.39 0.39 0.13 0.34 0.34 0.13 0.28 0.28 0.11 0.26 0.26 Volume/Cap: 0.86 0.66 0.66 0.42 0.82 0.52 0.93 0.39 0.26 0.40 0.69 0.15 Delay/Veh: 57.6 25.0 25.0 39.0 33.3 26.2 84.6 27.9 26.6 41.3 36.2 27.3 User DelAdj: 1.00 1.00 1.00 1.00 1.00 1.00 1.00 1.00 1.00 1.00 1.00 1.00 AdjDel/Veh: 57.6 25.0 25.0 39.0 33.3 26.2 84.6 27.9 26.6 41.3 36.2 27.3 LOS by Move: E C C D C C F C C D D C HCM2kAvgQ: 11 12 12 3 16 7 10 5 3 2 10 1 ********************************************************************************Note: Queue reported is the number of cars per lane.
Traffix 8.0.0715 (c) 2008 Dowling Assoc. Licensed to RK ENGINEERING GROUP

OPENING YEAR (PM) Tue May 12, 2015 14:38:39 Page 7-1 -------------------------------------------------------------------------------- AGUA MANSA HIGH CUBE WAREHOUSE COUNTY OF SAN BERNARDINO OPENING YEAR (2017) WITH RELATED PROJ WITHOUT PROJ CONDITIONS -------------------------------------------------------------------------------- Level Of Service Computation Report 2000 HCM Operations Method (Future Volume Alternative) ********************************************************************************Intersection #6 RIVERSIDE AVENUE (NS) AT AGUA MANSA ROAD (EW) ********************************************************************************Cycle (sec): 95 Critical Vol./Cap.(X): 0.805Loss Time (sec): 8 Average Delay (sec/veh): 37.8Optimal Cycle: OPTIMIZED Level Of Service: D********************************************************************************Approach: North Bound South Bound East Bound West Bound Movement: L - T - R L - T - R L - T - R L - T - R ------------|---------------||---------------||---------------||---------------|Control: Protected Protected Protected Protected Rights: Include Include Include Include Min. Green: 10 29 29 10 32 32 10 27 27 10 23 23 Y+R: 4.0 4.0 4.0 4.0 4.0 4.0 4.0 4.0 4.0 4.0 4.0 4.0 Lanes: 1 0 1 1 0 1 0 2 0 1 1 0 1 0 1 1 0 1 0 1 ------------|---------------||---------------||---------------||---------------|Volume Module:Base Vol: 96 796 68 60 986 138 196 485 119 35 136 38 Growth Adj: 1.06 1.06 1.06 1.06 1.06 1.06 1.06 1.06 1.06 1.06 1.06 1.06 Initial Bse: 102 844 72 64 1045 146 208 514 126 37 144 40 Added Vol: 25 7 0 0 21 15 35 37 73 0 13 0 PasserByVol: 0 0 0 0 0 0 0 0 0 0 0 0 Initial Fut: 127 851 72 64 1066 161 243 551 199 37 157 40 User Adj: 1.00 1.00 1.00 1.00 1.00 1.00 1.00 1.00 1.00 1.00 1.00 1.00 PHF Adj: 0.96 0.96 0.96 0.96 0.96 0.96 0.96 0.96 0.96 0.96 0.96 0.96 PHF Volume: 133 891 75 67 1116 169 254 577 209 39 165 42 Reduct Vol: 0 0 0 0 0 0 0 0 0 0 0 0 Reduced Vol: 133 891 75 67 1116 169 254 577 209 39 165 42 PCE Adj: 1.00 1.00 1.00 1.00 1.00 1.00 1.00 1.00 1.00 1.00 1.00 1.00 MLF Adj: 1.00 1.00 1.00 1.00 1.00 1.00 1.00 1.00 1.00 1.00 1.00 1.00 FinalVolume: 133 891 75 67 1116 169 254 577 209 39 165 42 ------------|---------------||---------------||---------------||---------------|Saturation Flow Module:Sat/Lane: 1800 1800 1800 1800 1800 1800 1800 1800 1800 1800 1800 1800 Adjustment: 0.90 0.99 0.99 0.90 1.00 0.85 0.90 1.00 0.85 0.90 1.00 0.85 Lanes: 1.00 1.84 0.16 1.00 2.00 1.00 1.00 1.00 1.00 1.00 1.00 1.00 Final Sat.: 1615 3279 278 1615 3600 1530 1615 1800 1530 1615 1800 1530 ------------|---------------||---------------||---------------||---------------|Capacity Analysis Module:Vol/Sat: 0.08 0.27 0.27 0.04 0.31 0.11 0.16 0.32 0.14 0.02 0.09 0.03 Crit Moves: **** **** **** **** Green/Cycle: 0.11 0.34 0.34 0.12 0.35 0.35 0.18 0.36 0.36 0.11 0.28 0.28 Volume/Cap: 0.78 0.81 0.81 0.36 0.89 0.32 0.86 0.89 0.38 0.23 0.33 0.10 Delay/Veh: 61.8 32.9 32.9 39.9 38.0 23.1 59.5 43.7 23.1 39.7 27.4 25.3 User DelAdj: 1.00 1.00 1.00 1.00 1.00 1.00 1.00 1.00 1.00 1.00 1.00 1.00 AdjDel/Veh: 61.8 32.9 32.9 39.9 38.0 23.1 59.5 43.7 23.1 39.7 27.4 25.3 LOS by Move: E C C D D C E D C D C C HCM2kAvgQ: 6 15 15 2 19 4 11 20 5 1 4 1 ********************************************************************************Note: Queue reported is the number of cars per lane.
Traffix 8.0.0715 (c) 2008 Dowling Assoc. Licensed to RK ENGINEERING GROUP

Appendix G
Project Opening Year (2017) With Related Projects With Project Conditions
Intersection Analysis Worksheets

OPENING YEAR + PROJ (AM) Tue May 12, 2015 14:41:10 Page 2-1 -------------------------------------------------------------------------------- AGUA MANSA HIGH CUBE WAREHOUSE COUNTY OF SAN BERNARDINO OPENING YEAR (2017) W RELATED PROJ W PROJ CONDITIONS -------------------------------------------------------------------------------- Level Of Service Computation Report 2000 HCM Operations Method (Future Volume Alternative) ********************************************************************************Intersection #1 CEDAR AVENUE (NS) AT EL RAVINO ROAD (EW) ********************************************************************************Cycle (sec): 100 Critical Vol./Cap.(X): 0.841Loss Time (sec): 8 Average Delay (sec/veh): 29.4Optimal Cycle: OPTIMIZED Level Of Service: C********************************************************************************Approach: North Bound South Bound East Bound West Bound Movement: L - T - R L - T - R L - T - R L - T - R ------------|---------------||---------------||---------------||---------------|Control: Protected Protected Permitted Permitted Rights: Include Include Include Include Min. Green: 10 0 0 10 23 23 10 14 14 10 24 24 Y+R: 4.0 4.0 4.0 4.0 4.0 4.0 4.0 4.0 4.0 4.0 4.0 4.0 Lanes: 1 0 1 1 0 1 0 1 1 0 0 0 1! 0 0 0 1 0 0 1 ------------|---------------||---------------||---------------||---------------|Volume Module:Base Vol: 10 443 47 87 652 6 3 1 6 50 2 39 Growth Adj: 1.06 1.06 1.06 1.06 1.06 1.06 1.06 1.06 1.06 1.06 1.06 1.06 Initial Bse: 11 470 50 92 691 6 3 1 6 53 2 41 Added Vol: 0 2 582 165 6 0 0 10 0 127 2 37 PasserByVol: 0 0 0 0 0 0 0 0 0 0 0 0 Initial Fut: 11 472 632 257 697 6 3 11 6 180 4 78 User Adj: 1.00 1.00 1.00 1.00 1.00 1.00 1.00 1.00 1.00 1.00 1.00 1.00 PHF Adj: 0.90 0.90 0.90 0.90 0.90 0.90 0.90 0.90 0.90 0.90 0.90 0.90 PHF Volume: 12 523 700 285 773 7 4 12 7 200 5 87 Reduct Vol: 0 0 0 0 0 0 0 0 0 0 0 0 Reduced Vol: 12 523 700 285 773 7 4 12 7 200 5 87 PCE Adj: 1.00 1.00 1.00 1.00 1.00 1.00 1.00 1.00 1.00 1.00 1.00 1.00 MLF Adj: 1.00 1.00 1.00 1.00 1.00 1.00 1.00 1.00 1.00 1.00 1.00 1.00 FinalVolume: 12 523 700 285 773 7 4 12 7 200 5 87 ------------|---------------||---------------||---------------||---------------|Saturation Flow Module:Sat/Lane: 1800 1800 1800 1800 1800 1800 1800 1800 1800 1800 1800 1800 Adjustment: 0.90 0.91 0.91 0.90 1.00 1.00 0.88 0.93 0.93 0.66 0.70 0.85 Lanes: 1.00 1.00 1.00 1.00 1.98 0.02 0.16 0.53 0.31 0.98 0.02 1.00 Final Sat.: 1615 1645 1645 1615 3564 33 255 888 511 1166 27 1530 ------------|---------------||---------------||---------------||---------------|Capacity Analysis Module:Vol/Sat: 0.01 0.32 0.43 0.18 0.22 0.22 0.01 0.01 0.01 0.17 0.17 0.06 Crit Moves: **** **** **** Green/Cycle: 0.21 0.48 0.48 0.20 0.47 0.47 0.24 0.24 0.24 0.24 0.24 0.24 Volume/Cap: 0.04 0.66 0.89 0.89 0.46 0.46 0.06 0.06 0.06 0.71 0.71 0.24 Delay/Veh: 31.8 20.7 30.7 63.0 17.9 17.9 29.3 29.3 29.3 43.0 43.0 31.0 User DelAdj: 1.00 1.00 1.00 1.00 1.00 1.00 1.00 1.00 1.00 1.00 1.00 1.00 AdjDel/Veh: 31.8 20.7 30.7 63.0 17.9 17.9 29.3 29.3 29.3 43.0 43.0 31.0 LOS by Move: C C C E B B C C C D D C HCM2kAvgQ: 0 13 23 12 8 8 1 1 1 8 8 2 ********************************************************************************Note: Queue reported is the number of cars per lane.
Traffix 8.0.0715 (c) 2008 Dowling Assoc. Licensed to RK ENGINEERING GROUP

OPENING YEAR + PROJ (PM) Tue May 12, 2015 14:41:51 Page 2-1 -------------------------------------------------------------------------------- AGUA MANSA HIGH CUBE WAREHOUSE COUNTY OF SAN BERNARDINO OPENING YEAR (2017) W RELATED PROJ W PROJ CONDITIONS -------------------------------------------------------------------------------- Level Of Service Computation Report 2000 HCM Operations Method (Future Volume Alternative) ********************************************************************************Intersection #1 CEDAR AVENUE (NS) AT EL RAVINO ROAD (EW) ********************************************************************************Cycle (sec): 100 Critical Vol./Cap.(X): 1.006Loss Time (sec): 8 Average Delay (sec/veh): 55.9Optimal Cycle: OPTIMIZED Level Of Service: E********************************************************************************Approach: North Bound South Bound East Bound West Bound Movement: L - T - R L - T - R L - T - R L - T - R ------------|---------------||---------------||---------------||---------------|Control: Protected Protected Permitted Permitted Rights: Include Include Include Include Min. Green: 10 0 0 10 23 23 10 14 14 10 24 24 Y+R: 4.0 4.0 4.0 4.0 4.0 4.0 4.0 4.0 4.0 4.0 4.0 4.0 Lanes: 1 0 1 1 0 1 0 1 1 0 0 0 1! 0 0 0 1 0 0 1 ------------|---------------||---------------||---------------||---------------|Volume Module:Base Vol: 7 669 56 67 702 8 9 7 14 45 12 88 Growth Adj: 1.06 1.06 1.06 1.06 1.06 1.06 1.06 1.06 1.06 1.06 1.06 1.06 Initial Bse: 7 709 59 71 744 8 10 7 15 48 13 93 Added Vol: 0 6 189 54 3 0 0 3 0 552 9 157 PasserByVol: 0 0 0 0 0 0 0 0 0 0 0 0 Initial Fut: 7 715 248 125 747 8 10 10 15 600 22 250 User Adj: 1.00 1.00 1.00 1.00 1.00 1.00 1.00 1.00 1.00 1.00 1.00 1.00 PHF Adj: 0.95 0.95 0.95 0.95 0.95 0.95 0.95 0.95 0.95 0.95 0.95 0.95 PHF Volume: 8 750 261 131 784 9 10 11 16 629 23 263 Reduct Vol: 0 0 0 0 0 0 0 0 0 0 0 0 Reduced Vol: 8 750 261 131 784 9 10 11 16 629 23 263 PCE Adj: 1.00 1.00 1.00 1.00 1.00 1.00 1.00 1.00 1.00 1.00 1.00 1.00 MLF Adj: 1.00 1.00 1.00 1.00 1.00 1.00 1.00 1.00 1.00 1.00 1.00 1.00 FinalVolume: 8 750 261 131 784 9 10 11 16 629 23 263 ------------|---------------||---------------||---------------||---------------|Saturation Flow Module:Sat/Lane: 1800 1800 1800 1800 1800 1800 1800 1800 1800 1800 1800 1800 Adjustment: 0.90 0.96 0.96 0.90 1.00 1.00 0.78 0.83 0.83 0.66 0.69 0.85 Lanes: 1.00 1.48 0.52 1.00 1.98 0.02 0.29 0.29 0.42 0.97 0.03 1.00 Final Sat.: 1615 2568 892 1615 3552 40 403 440 627 1141 41 1530 ------------|---------------||---------------||---------------||---------------|Capacity Analysis Module:Vol/Sat: 0.00 0.29 0.29 0.08 0.22 0.22 0.02 0.02 0.02 0.55 0.55 0.17 Crit Moves: **** **** **** Green/Cycle: 0.12 0.28 0.28 0.10 0.27 0.27 0.54 0.54 0.54 0.54 0.54 0.54 Volume/Cap: 0.04 1.03 1.03 0.81 0.82 0.82 0.05 0.05 0.05 1.03 1.03 0.32 Delay/Veh: 39.3 72.2 72.2 69.9 40.3 40.3 11.1 11.1 11.1 66.6 66.6 13.2 User DelAdj: 1.00 1.00 1.00 1.00 1.00 1.00 1.00 1.00 1.00 1.00 1.00 1.00 AdjDel/Veh: 39.3 72.2 72.2 69.9 40.3 40.3 11.1 11.1 11.1 66.6 66.6 13.2 LOS by Move: D E E E D D B B B E E B HCM2kAvgQ: 0 23 23 6 14 14 1 1 1 30 30 5 ********************************************************************************Note: Queue reported is the number of cars per lane.
Traffix 8.0.0715 (c) 2008 Dowling Assoc. Licensed to RK ENGINEERING GROUP

MITIG8 - OPENING YEAR + PROTue May 12, 2015 15:27:45 Page 1-1 -------------------------------------------------------------------------------- AGUA MANSA HIGH CUBE WAREHOUSE COUNTY OF SAN BERNARDINO OPENING YEAR (2017) W RELATED PROJ W PROJ CONDITIONS -------------------------------------------------------------------------------- Level Of Service Computation Report 2000 HCM Operations Method (Future Volume Alternative) ********************************************************************************Intersection #1 CEDAR AVENUE (NS) AT EL RAVINO ROAD (EW) ********************************************************************************Cycle (sec): 110 Critical Vol./Cap.(X): 0.740Loss Time (sec): 8 Average Delay (sec/veh): 28.3Optimal Cycle: OPTIMIZED Level Of Service: C********************************************************************************Approach: North Bound South Bound East Bound West Bound Movement: L - T - R L - T - R L - T - R L - T - R ------------|---------------||---------------||---------------||---------------|Control: Protected Protected Permitted Permitted Rights: Include Include Include Include Min. Green: 10 0 0 10 23 23 10 14 14 10 24 24 Y+R: 4.0 4.0 4.0 4.0 4.0 4.0 4.0 4.0 4.0 4.0 4.0 4.0 Lanes: 1 0 1 1 0 1 0 1 1 0 0 0 1! 0 0 1 1 0 0 1 ------------|---------------||---------------||---------------||---------------|Volume Module:Base Vol: 10 443 47 87 652 6 3 1 6 50 2 39 Growth Adj: 1.06 1.06 1.06 1.06 1.06 1.06 1.06 1.06 1.06 1.06 1.06 1.06 Initial Bse: 11 470 50 92 691 6 3 1 6 53 2 41 Added Vol: 0 2 582 165 6 0 0 10 0 127 2 37 PasserByVol: 0 0 0 0 0 0 0 0 0 0 0 0 Initial Fut: 11 472 632 257 697 6 3 11 6 180 4 78 User Adj: 1.00 1.00 1.00 1.00 1.00 1.00 1.00 1.00 1.00 1.00 1.00 1.00 PHF Adj: 0.90 0.90 0.90 0.90 0.90 0.90 0.90 0.90 0.90 0.90 0.90 0.90 PHF Volume: 12 523 700 285 773 7 4 12 7 200 5 87 Reduct Vol: 0 0 0 0 0 0 0 0 0 0 0 0 Reduced Vol: 12 523 700 285 773 7 4 12 7 200 5 87 PCE Adj: 1.00 1.00 1.00 1.00 1.00 1.00 1.00 1.00 1.00 1.00 1.00 1.00 MLF Adj: 1.00 1.00 1.00 1.00 1.00 1.00 1.00 1.00 1.00 1.00 1.00 1.00 FinalVolume: 12 523 700 285 773 7 4 12 7 200 5 87 ------------|---------------||---------------||---------------||---------------|Saturation Flow Module:Sat/Lane: 1800 1800 1800 1800 1800 1800 1800 1800 1800 1800 1800 1800 Adjustment: 0.90 0.91 0.91 0.90 1.00 1.00 0.89 0.94 0.94 0.68 0.72 0.85 Lanes: 1.00 1.00 1.00 1.00 1.98 0.02 0.16 0.53 0.31 1.96 0.04 1.00 Final Sat.: 1615 1645 1645 1615 3564 33 259 899 517 2390 55 1530 ------------|---------------||---------------||---------------||---------------|Capacity Analysis Module:Vol/Sat: 0.01 0.32 0.43 0.18 0.22 0.22 0.01 0.01 0.01 0.08 0.08 0.06 Crit Moves: **** **** **** Green/Cycle: 0.21 0.50 0.50 0.21 0.50 0.50 0.22 0.22 0.22 0.22 0.22 0.22 Volume/Cap: 0.03 0.63 0.85 0.85 0.43 0.43 0.06 0.06 0.06 0.38 0.38 0.26 Delay/Veh: 34.7 20.8 28.8 60.0 17.8 17.8 34.2 34.2 34.2 37.1 37.1 36.1 User DelAdj: 1.00 1.00 1.00 1.00 1.00 1.00 1.00 1.00 1.00 1.00 1.00 1.00 AdjDel/Veh: 34.7 20.8 28.8 60.0 17.8 17.8 34.2 34.2 34.2 37.1 37.1 36.1 LOS by Move: C C C E B B C C C D D D HCM2kAvgQ: 0 13 23 13 8 8 1 1 1 3 3 3 ********************************************************************************Note: Queue reported is the number of cars per lane.
Traffix 8.0.0715 (c) 2008 Dowling Assoc. Licensed to RK ENGINEERING GROUP
Bryan Estrada
Typewritten Text
AM PEAK HOUR

MITIG8 - OPENING YEAR + PROTue May 12, 2015 15:26:26 Page 1-1 -------------------------------------------------------------------------------- AGUA MANSA HIGH CUBE WAREHOUSE COUNTY OF SAN BERNARDINO OPENING YEAR (2017) W RELATED PROJ W PROJ CONDITIONS -------------------------------------------------------------------------------- Level Of Service Computation Report 2000 HCM Operations Method (Future Volume Alternative) ********************************************************************************Intersection #1 CEDAR AVENUE (NS) AT EL RAVINO ROAD (EW) ********************************************************************************Cycle (sec): 65 Critical Vol./Cap.(X): 0.564Loss Time (sec): 8 Average Delay (sec/veh): 22.5Optimal Cycle: OPTIMIZED Level Of Service: C********************************************************************************Approach: North Bound South Bound East Bound West Bound Movement: L - T - R L - T - R L - T - R L - T - R ------------|---------------||---------------||---------------||---------------|Control: Protected Protected Permitted Permitted Rights: Include Include Include Include Min. Green: 10 0 0 10 23 23 10 14 14 10 24 24 Y+R: 4.0 4.0 4.0 4.0 4.0 4.0 4.0 4.0 4.0 4.0 4.0 4.0 Lanes: 1 0 1 1 0 1 0 1 1 0 0 0 1! 0 0 1 1 0 0 1 ------------|---------------||---------------||---------------||---------------|Volume Module:Base Vol: 7 669 56 67 702 8 9 7 14 45 12 88 Growth Adj: 1.06 1.06 1.06 1.06 1.06 1.06 1.06 1.06 1.06 1.06 1.06 1.06 Initial Bse: 7 709 59 71 744 8 10 7 15 48 13 93 Added Vol: 0 6 189 54 3 0 0 3 0 552 9 157 PasserByVol: 0 0 0 0 0 0 0 0 0 0 0 0 Initial Fut: 7 715 248 125 747 8 10 10 15 600 22 250 User Adj: 1.00 1.00 1.00 1.00 1.00 1.00 1.00 1.00 1.00 1.00 1.00 1.00 PHF Adj: 0.95 0.95 0.95 0.95 0.95 0.95 0.95 0.95 0.95 0.95 0.95 0.95 PHF Volume: 8 750 261 131 784 9 10 11 16 629 23 263 Reduct Vol: 0 0 0 0 0 0 0 0 0 0 0 0 Reduced Vol: 8 750 261 131 784 9 10 11 16 629 23 263 PCE Adj: 1.00 1.00 1.00 1.00 1.00 1.00 1.00 1.00 1.00 1.00 1.00 1.00 MLF Adj: 1.00 1.00 1.00 1.00 1.00 1.00 1.00 1.00 1.00 1.00 1.00 1.00 FinalVolume: 8 750 261 131 784 9 10 11 16 629 23 263 ------------|---------------||---------------||---------------||---------------|Saturation Flow Module:Sat/Lane: 1800 1800 1800 1800 1800 1800 1800 1800 1800 1800 1800 1800 Adjustment: 0.90 0.96 0.96 0.90 1.00 1.00 0.85 0.90 0.90 0.67 0.71 0.85 Lanes: 1.00 1.48 0.52 1.00 1.98 0.02 0.29 0.29 0.42 1.93 0.07 1.00 Final Sat.: 1615 2568 892 1615 3552 40 438 478 681 2341 85 1530 ------------|---------------||---------------||---------------||---------------|Capacity Analysis Module:Vol/Sat: 0.00 0.29 0.29 0.08 0.22 0.22 0.02 0.02 0.02 0.27 0.27 0.17 Crit Moves: **** **** **** Green/Cycle: 0.15 0.33 0.33 0.18 0.35 0.35 0.37 0.37 0.37 0.37 0.37 0.37 Volume/Cap: 0.03 0.88 0.88 0.46 0.62 0.62 0.06 0.06 0.06 0.73 0.73 0.46 Delay/Veh: 23.4 28.4 28.4 25.3 18.4 18.4 13.3 13.3 13.3 20.7 20.7 16.2 User DelAdj: 1.00 1.00 1.00 1.00 1.00 1.00 1.00 1.00 1.00 1.00 1.00 1.00 AdjDel/Veh: 23.4 28.4 28.4 25.3 18.4 18.4 13.3 13.3 13.3 20.7 20.7 16.2 LOS by Move: C C C C B B B B B C C B HCM2kAvgQ: 0 13 13 3 8 8 0 0 0 8 8 4 ********************************************************************************Note: Queue reported is the number of cars per lane.
Traffix 8.0.0715 (c) 2008 Dowling Assoc. Licensed to RK ENGINEERING GROUP
Bryan Estrada
Typewritten Text
PM PEAK HOUR

OPENING YEAR + PROJ (AM) Tue May 12, 2015 14:41:10 Page 3-1 -------------------------------------------------------------------------------- AGUA MANSA HIGH CUBE WAREHOUSE COUNTY OF SAN BERNARDINO OPENING YEAR (2017) W RELATED PROJ W PROJ CONDITIONS -------------------------------------------------------------------------------- Level Of Service Computation Report 2000 HCM Operations Method (Future Volume Alternative) ********************************************************************************Intersection #2 CACTUS AVENUE (NS) AT EL RAVINO ROAD (EW) ********************************************************************************Cycle (sec): 60 Critical Vol./Cap.(X): 0.794Loss Time (sec): 8 Average Delay (sec/veh): 24.5Optimal Cycle: OPTIMIZED Level Of Service: C********************************************************************************Approach: North Bound South Bound East Bound West Bound Movement: L - T - R L - T - R L - T - R L - T - R ------------|---------------||---------------||---------------||---------------|Control: Protected Protected Protected Permitted Rights: Include Include Include Include Min. Green: 0 0 0 10 0 0 10 0 0 0 0 0 Y+R: 4.0 4.0 4.0 4.0 4.0 4.0 4.0 4.0 4.0 4.0 4.0 4.0 Lanes: 0 0 0 0 0 1 0 0 0 1 0 1 0 0 0 0 0 0 1 0 ------------|---------------||---------------||---------------||---------------|Volume Module:Base Vol: 0 0 0 25 0 31 19 68 0 0 81 20 Growth Adj: 1.06 1.06 1.06 1.06 1.06 1.06 1.06 1.06 1.06 1.06 1.06 1.06 Initial Bse: 0 0 0 27 0 33 20 72 0 0 86 21 Added Vol: 0 0 0 14 0 216 143 64 0 0 223 55 PasserByVol: 0 0 0 0 0 0 0 0 0 0 0 0 Initial Fut: 0 0 0 41 0 249 163 136 0 0 309 76 User Adj: 1.00 1.00 1.00 1.00 1.00 1.00 1.00 1.00 1.00 1.00 1.00 1.00 PHF Adj: 0.81 0.81 0.81 0.81 0.81 0.81 0.81 0.81 0.81 0.81 0.81 0.81 PHF Volume: 0 0 0 50 0 306 201 168 0 0 380 94 Reduct Vol: 0 0 0 0 0 0 0 0 0 0 0 0 Reduced Vol: 0 0 0 50 0 306 201 168 0 0 380 94 PCE Adj: 1.00 1.00 1.00 1.00 1.00 1.00 1.00 1.00 1.00 1.00 1.00 1.00 MLF Adj: 1.00 1.00 1.00 1.00 1.00 1.00 1.00 1.00 1.00 1.00 1.00 1.00 FinalVolume: 0 0 0 50 0 306 201 168 0 0 380 94 ------------|---------------||---------------||---------------||---------------|Saturation Flow Module:Sat/Lane: 1800 1800 1800 1800 1800 1800 1800 1800 1800 1800 1800 1800 Adjustment: 0.94 1.00 1.00 0.90 1.00 0.85 0.92 0.97 1.00 0.94 0.97 0.97 Lanes: 0.00 0.00 0.00 1.00 0.00 1.00 0.56 0.44 0.00 0.00 0.80 0.20 Final Sat.: 0 0 0 1615 0 1530 925 772 0 0 1405 347 ------------|---------------||---------------||---------------||---------------|Capacity Analysis Module:Vol/Sat: 0.00 0.00 0.00 0.03 0.00 0.20 0.22 0.22 0.00 0.00 0.27 0.27 Crit Moves: **** **** **** Green/Cycle: 0.00 0.00 0.00 0.25 0.00 0.25 0.27 0.61 0.00 0.00 0.34 0.34 Volume/Cap: 0.00 0.00 0.00 0.12 0.00 0.79 0.79 0.35 0.00 0.00 0.79 0.79 Delay/Veh: 0.0 0.0 0.0 17.4 0.0 31.8 29.4 5.9 0.0 0.0 25.1 25.1 User DelAdj: 1.00 1.00 1.00 1.00 1.00 1.00 1.00 1.00 1.00 1.00 1.00 1.00 AdjDel/Veh: 0.0 0.0 0.0 17.4 0.0 31.8 29.4 5.9 0.0 0.0 25.1 25.1 LOS by Move: A A A B A C C A A A C C HCM2kAvgQ: 0 0 0 1 0 8 6 2 0 0 10 10 ********************************************************************************Note: Queue reported is the number of cars per lane.
Traffix 8.0.0715 (c) 2008 Dowling Assoc. Licensed to RK ENGINEERING GROUP

OPENING YEAR + PROJ (PM) Tue May 12, 2015 14:41:51 Page 3-1 -------------------------------------------------------------------------------- AGUA MANSA HIGH CUBE WAREHOUSE COUNTY OF SAN BERNARDINO OPENING YEAR (2017) W RELATED PROJ W PROJ CONDITIONS -------------------------------------------------------------------------------- Level Of Service Computation Report 2000 HCM Operations Method (Future Volume Alternative) ********************************************************************************Intersection #2 CACTUS AVENUE (NS) AT EL RAVINO ROAD (EW) ********************************************************************************Cycle (sec): 65 Critical Vol./Cap.(X): 0.882Loss Time (sec): 8 Average Delay (sec/veh): 29.9Optimal Cycle: OPTIMIZED Level Of Service: C********************************************************************************Approach: North Bound South Bound East Bound West Bound Movement: L - T - R L - T - R L - T - R L - T - R ------------|---------------||---------------||---------------||---------------|Control: Protected Protected Protected Permitted Rights: Include Include Include Include Min. Green: 0 0 0 10 0 0 10 0 0 0 0 0 Y+R: 4.0 4.0 4.0 4.0 4.0 4.0 4.0 4.0 4.0 4.0 4.0 4.0 Lanes: 0 0 0 0 0 1 0 0 0 1 0 1 0 0 0 0 0 0 1 0 ------------|---------------||---------------||---------------||---------------|Volume Module:Base Vol: 0 0 0 14 0 26 41 99 0 0 97 53 Growth Adj: 1.06 1.06 1.06 1.06 1.06 1.06 1.06 1.06 1.06 1.06 1.06 1.06 Initial Bse: 0 0 0 15 0 28 43 105 0 0 103 56 Added Vol: 0 0 0 52 0 186 247 212 0 0 88 20 PasserByVol: 0 0 0 0 0 0 0 0 0 0 0 0 Initial Fut: 0 0 0 67 0 214 290 317 0 0 191 76 User Adj: 1.00 1.00 1.00 1.00 1.00 1.00 1.00 1.00 1.00 1.00 1.00 1.00 PHF Adj: 0.84 0.84 0.84 0.84 0.84 0.84 0.84 0.84 0.84 0.84 0.84 0.84 PHF Volume: 0 0 0 80 0 255 346 378 0 0 227 91 Reduct Vol: 0 0 0 0 0 0 0 0 0 0 0 0 Reduced Vol: 0 0 0 80 0 255 346 378 0 0 227 91 PCE Adj: 1.00 1.00 1.00 1.00 1.00 1.00 1.00 1.00 1.00 1.00 1.00 1.00 MLF Adj: 1.00 1.00 1.00 1.00 1.00 1.00 1.00 1.00 1.00 1.00 1.00 1.00 FinalVolume: 0 0 0 80 0 255 346 378 0 0 227 91 ------------|---------------||---------------||---------------||---------------|Saturation Flow Module:Sat/Lane: 1800 1800 1800 1800 1800 1800 1800 1800 1800 1800 1800 1800 Adjustment: 0.94 1.00 1.00 0.90 1.00 0.85 0.92 0.98 1.00 0.94 0.96 0.96 Lanes: 0.00 0.00 0.00 1.00 0.00 1.00 0.49 0.51 0.00 0.00 0.71 0.29 Final Sat.: 0 0 0 1615 0 1530 818 893 0 0 1238 494 ------------|---------------||---------------||---------------||---------------|Capacity Analysis Module:Vol/Sat: 0.00 0.00 0.00 0.05 0.00 0.17 0.42 0.42 0.00 0.00 0.18 0.18 Crit Moves: **** **** **** Green/Cycle: 0.00 0.00 0.00 0.19 0.00 0.19 0.48 0.69 0.00 0.00 0.21 0.21 Volume/Cap: 0.00 0.00 0.00 0.26 0.00 0.88 0.88 0.61 0.00 0.00 0.88 0.88 Delay/Veh: 0.0 0.0 0.0 23.0 0.0 51.2 26.3 6.5 0.0 0.0 46.5 46.5 User DelAdj: 1.00 1.00 1.00 1.00 1.00 1.00 1.00 1.00 1.00 1.00 1.00 1.00 AdjDel/Veh: 0.0 0.0 0.0 23.0 0.0 51.2 26.3 6.5 0.0 0.0 46.5 46.5 LOS by Move: A A A C A D C A A A D D HCM2kAvgQ: 0 0 0 2 0 8 10 5 0 0 10 10 ********************************************************************************Note: Queue reported is the number of cars per lane.
Traffix 8.0.0715 (c) 2008 Dowling Assoc. Licensed to RK ENGINEERING GROUP

OPENING YEAR + PROJ (AM) Tue May 12, 2015 14:41:10 Page 4-1 -------------------------------------------------------------------------------- AGUA MANSA HIGH CUBE WAREHOUSE COUNTY OF SAN BERNARDINO OPENING YEAR (2017) W RELATED PROJ W PROJ CONDITIONS -------------------------------------------------------------------------------- Level Of Service Computation Report 2000 HCM Unsignalized Method (Future Volume Alternative) ********************************************************************************Intersection #3 HALL AVENUE (NS) AT EL RAVINO ROAD (EW) ********************************************************************************Average Delay (sec/veh): 1.3 Worst Case Level Of Service: B[ 14.8]********************************************************************************Approach: North Bound South Bound East Bound West Bound Movement: L - T - R L - T - R L - T - R L - T - R ------------|---------------||---------------||---------------||---------------|Control: Stop Sign Stop Sign Uncontrolled UncontrolledRights: Include Include Include Include Lanes: 0 0 1! 0 0 0 0 1! 0 0 0 0 1! 0 0 0 0 1! 0 0 ------------|---------------||---------------||---------------||---------------|Volume Module:Base Vol: 17 1 14 12 3 4 4 83 27 1 80 3 Growth Adj: 1.06 1.06 1.06 1.06 1.06 1.06 1.06 1.06 1.06 1.06 1.06 1.06 Initial Bse: 18 1 15 13 3 4 4 88 29 1 85 3 Added Vol: 0 0 0 0 0 0 0 78 0 0 278 0 PasserByVol: 0 0 0 0 0 0 0 0 0 0 0 0 Initial Fut: 18 1 15 13 3 4 4 166 29 1 363 3 User Adj: 1.00 1.00 1.00 1.00 1.00 1.00 1.00 1.00 1.00 1.00 1.00 1.00 PHF Adj: 0.83 0.83 0.83 0.83 0.83 0.83 0.83 0.83 0.83 0.83 0.83 0.83 PHF Volume: 22 1 18 15 4 5 5 201 35 1 440 4 Reduct Vol: 0 0 0 0 0 0 0 0 0 0 0 0 FinalVolume: 22 1 18 15 4 5 5 201 35 1 440 4 ------------|---------------||---------------||---------------||---------------|Critical Gap Module:Critical Gp: 7.1 6.5 6.2 7.1 6.5 6.2 4.1 xxxx xxxxx 4.1 xxxx xxxxx FollowUpTim: 3.5 4.0 3.3 3.5 4.0 3.3 2.2 xxxx xxxxx 2.2 xxxx xxxxx ------------|---------------||---------------||---------------||---------------|Capacity Module:Cnflict Vol: 678 675 219 683 690 442 444 xxxx xxxxx 236 xxxx xxxxx Potent Cap.: 369 378 826 366 371 620 1127 xxxx xxxxx 1343 xxxx xxxxx Move Cap.: 362 376 826 356 368 620 1127 xxxx xxxxx 1343 xxxx xxxxx Volume/Cap: 0.06 0.00 0.02 0.04 0.01 0.01 0.00 xxxx xxxx 0.00 xxxx xxxx ------------|---------------||---------------||---------------||---------------|Level Of Service Module:2Way95thQ: xxxx xxxx xxxxx xxxx xxxx xxxxx 0.0 xxxx xxxxx 0.0 xxxx xxxxx Control Del:xxxxx xxxx xxxxx xxxxx xxxx xxxxx 8.2 xxxx xxxxx 7.7 xxxx xxxxx LOS by Move: * * * * * * A * * A * * Movement: LT - LTR - RT LT - LTR - RT LT - LTR - RT LT - LTR - RT Shared Cap.: xxxx 480 xxxxx xxxx 393 xxxxx xxxx xxxx xxxxx xxxx xxxx xxxxx SharedQueue:xxxxx 0.3 xxxxx xxxxx 0.2 xxxxx xxxxx xxxx xxxxx xxxxx xxxx xxxxx Shrd ConDel:xxxxx 13.2 xxxxx xxxxx 14.8 xxxxx xxxxx xxxx xxxxx xxxxx xxxx xxxxx Shared LOS: * B * * B * * * * * * * ApproachDel: 13.2 14.8 xxxxxx xxxxxxApproachLOS: B B * * ********************************************************************************Note: Queue reported is the number of cars per lane.********************************************************************************
Traffix 8.0.0715 (c) 2008 Dowling Assoc. Licensed to RK ENGINEERING GROUP

OPENING YEAR + PROJ (PM) Tue May 12, 2015 14:41:51 Page 4-1 -------------------------------------------------------------------------------- AGUA MANSA HIGH CUBE WAREHOUSE COUNTY OF SAN BERNARDINO OPENING YEAR (2017) W RELATED PROJ W PROJ CONDITIONS -------------------------------------------------------------------------------- Level Of Service Computation Report 2000 HCM Unsignalized Method (Future Volume Alternative) ********************************************************************************Intersection #3 HALL AVENUE (NS) AT EL RAVINO ROAD (EW) ********************************************************************************Average Delay (sec/veh): 1.9 Worst Case Level Of Service: C[ 18.0]********************************************************************************Approach: North Bound South Bound East Bound West Bound Movement: L - T - R L - T - R L - T - R L - T - R ------------|---------------||---------------||---------------||---------------|Control: Stop Sign Stop Sign Uncontrolled UncontrolledRights: Include Include Include Include Lanes: 0 0 1! 0 0 0 0 1! 0 0 0 0 1! 0 0 0 0 0 1 0 ------------|---------------||---------------||---------------||---------------|Volume Module:Base Vol: 45 4 5 9 4 1 5 89 13 0 110 15 Growth Adj: 1.06 1.06 1.06 1.06 1.06 1.06 1.06 1.06 1.06 1.06 1.06 1.06 Initial Bse: 48 4 5 10 4 1 5 94 14 0 117 16 Added Vol: 0 0 0 0 0 0 0 264 0 0 109 0 PasserByVol: 0 0 0 0 0 0 0 0 0 0 0 0 Initial Fut: 48 4 5 10 4 1 5 358 14 0 226 16 User Adj: 1.00 1.00 1.00 1.00 1.00 1.00 1.00 1.00 1.00 1.00 1.00 1.00 PHF Adj: 0.83 0.83 0.83 0.83 0.83 0.83 0.83 0.83 0.83 0.83 0.83 0.83 PHF Volume: 58 5 6 12 5 1 6 434 17 0 273 19 Reduct Vol: 0 0 0 0 0 0 0 0 0 0 0 0 FinalVolume: 58 5 6 12 5 1 6 434 17 0 273 19 ------------|---------------||---------------||---------------||---------------|Critical Gap Module:Critical Gp: 7.1 6.5 6.2 7.1 6.5 6.2 4.1 xxxx xxxxx xxxxx xxxx xxxxx FollowUpTim: 3.5 4.0 3.3 3.5 4.0 3.3 2.2 xxxx xxxxx xxxxx xxxx xxxxx ------------|---------------||---------------||---------------||---------------|Capacity Module:Cnflict Vol: 741 747 442 744 746 283 292 xxxx xxxxx xxxx xxxx xxxxx Potent Cap.: 335 344 620 333 344 761 1281 xxxx xxxxx xxxx xxxx xxxxx Move Cap.: 329 342 620 325 342 761 1281 xxxx xxxxx xxxx xxxx xxxxx Volume/Cap: 0.18 0.02 0.01 0.04 0.01 0.00 0.01 xxxx xxxx xxxx xxxx xxxx ------------|---------------||---------------||---------------||---------------|Level Of Service Module:2Way95thQ: xxxx xxxx xxxxx xxxx xxxx xxxxx 0.0 xxxx xxxxx xxxx xxxx xxxxx Control Del:xxxxx xxxx xxxxx xxxxx xxxx xxxxx 7.8 xxxx xxxxx xxxxx xxxx xxxxx LOS by Move: * * * * * * A * * * * * Movement: LT - LTR - RT LT - LTR - RT LT - LTR - RT LT - LTR - RT Shared Cap.: xxxx 345 xxxxx xxxx 344 xxxxx xxxx xxxx xxxxx xxxx xxxx xxxxx SharedQueue:xxxxx 0.7 xxxxx xxxxx 0.2 xxxxx xxxxx xxxx xxxxx xxxxx xxxx xxxxx Shrd ConDel:xxxxx 18.0 xxxxx xxxxx 16.0 xxxxx xxxxx xxxx xxxxx xxxxx xxxx xxxxx Shared LOS: * C * * C * * * * * * * ApproachDel: 18.0 16.0 xxxxxx xxxxxxApproachLOS: C C * * ********************************************************************************Note: Queue reported is the number of cars per lane.********************************************************************************
Traffix 8.0.0715 (c) 2008 Dowling Assoc. Licensed to RK ENGINEERING GROUP

OPENING YEAR + PROJ (AM) Tue May 12, 2015 14:41:10 Page 5-1 -------------------------------------------------------------------------------- AGUA MANSA HIGH CUBE WAREHOUSE COUNTY OF SAN BERNARDINO OPENING YEAR (2017) W RELATED PROJ W PROJ CONDITIONS -------------------------------------------------------------------------------- Level Of Service Computation Report 2000 HCM Unsignalized Method (Future Volume Alternative) ********************************************************************************Intersection #4 KININGHAM DRIVE (NS) AT EL RAVINO ROAD (EW) ********************************************************************************Average Delay (sec/veh): 0.5 Worst Case Level Of Service: B[ 11.7]********************************************************************************Approach: North Bound South Bound East Bound West Bound Movement: L - T - R L - T - R L - T - R L - T - R ------------|---------------||---------------||---------------||---------------|Control: Stop Sign Stop Sign Uncontrolled UncontrolledRights: Include Include Include Include Lanes: 0 0 0 0 0 0 0 1! 0 0 0 1 0 0 0 0 0 0 1 0 ------------|---------------||---------------||---------------||---------------|Volume Module:Base Vol: 0 0 0 2 0 1 3 90 0 0 77 1 Growth Adj: 1.06 1.06 1.06 1.06 1.06 1.06 1.06 1.06 1.06 1.06 1.06 1.06 Initial Bse: 0 0 0 2 0 1 3 95 0 0 82 1 Added Vol: 0 0 0 0 0 6 18 60 0 0 272 1 PasserByVol: 0 0 0 0 0 0 0 0 0 0 0 0 Initial Fut: 0 0 0 2 0 7 21 155 0 0 354 2 User Adj: 1.00 1.00 1.00 1.00 1.00 1.00 1.00 1.00 1.00 1.00 1.00 1.00 PHF Adj: 0.79 0.79 0.79 0.79 0.79 0.79 0.79 0.79 0.79 0.79 0.79 0.79 PHF Volume: 0 0 0 3 0 9 27 196 0 0 447 3 Reduct Vol: 0 0 0 0 0 0 0 0 0 0 0 0 FinalVolume: 0 0 0 3 0 9 27 196 0 0 447 3 ------------|---------------||---------------||---------------||---------------|Critical Gap Module:Critical Gp:xxxxx xxxx xxxxx 6.4 6.5 6.2 4.1 xxxx xxxxx xxxxx xxxx xxxxx FollowUpTim:xxxxx xxxx xxxxx 3.5 4.0 3.3 2.2 xxxx xxxxx xxxxx xxxx xxxxx ------------|---------------||---------------||---------------||---------------|Capacity Module:Cnflict Vol: xxxx xxxx xxxxx 698 698 448 450 xxxx xxxxx xxxx xxxx xxxxx Potent Cap.: xxxx xxxx xxxxx 409 367 615 1121 xxxx xxxxx xxxx xxxx xxxxx Move Cap.: xxxx xxxx xxxxx 402 358 615 1121 xxxx xxxxx xxxx xxxx xxxxx Volume/Cap: xxxx xxxx xxxx 0.01 0.00 0.01 0.02 xxxx xxxx xxxx xxxx xxxx ------------|---------------||---------------||---------------||---------------|Level Of Service Module:2Way95thQ: xxxx xxxx xxxxx xxxx xxxx xxxxx 0.1 xxxx xxxxx xxxx xxxx xxxxx Control Del:xxxxx xxxx xxxxx xxxxx xxxx xxxxx 8.3 xxxx xxxxx xxxxx xxxx xxxxx LOS by Move: * * * * * * A * * * * * Movement: LT - LTR - RT LT - LTR - RT LT - LTR - RT LT - LTR - RT Shared Cap.: xxxx xxxx xxxxx xxxx 548 xxxxx xxxx xxxx xxxxx xxxx xxxx xxxxx SharedQueue:xxxxx xxxx xxxxx xxxxx 0.1 xxxxx 0.1 xxxx xxxxx xxxxx xxxx xxxxx Shrd ConDel:xxxxx xxxx xxxxx xxxxx 11.7 xxxxx 8.3 xxxx xxxxx xxxxx xxxx xxxxx Shared LOS: * * * * B * A * * * * * ApproachDel: xxxxxx 11.7 xxxxxx xxxxxxApproachLOS: * B * * ********************************************************************************Note: Queue reported is the number of cars per lane.********************************************************************************
Traffix 8.0.0715 (c) 2008 Dowling Assoc. Licensed to RK ENGINEERING GROUP

OPENING YEAR + PROJ (PM) Tue May 12, 2015 14:41:51 Page 5-1 -------------------------------------------------------------------------------- AGUA MANSA HIGH CUBE WAREHOUSE COUNTY OF SAN BERNARDINO OPENING YEAR (2017) W RELATED PROJ W PROJ CONDITIONS -------------------------------------------------------------------------------- Level Of Service Computation Report 2000 HCM Unsignalized Method (Future Volume Alternative) ********************************************************************************Intersection #4 KININGHAM DRIVE (NS) AT EL RAVINO ROAD (EW) ********************************************************************************Average Delay (sec/veh): 0.8 Worst Case Level Of Service: B[ 10.1]********************************************************************************Approach: North Bound South Bound East Bound West Bound Movement: L - T - R L - T - R L - T - R L - T - R ------------|---------------||---------------||---------------||---------------|Control: Stop Sign Stop Sign Uncontrolled UncontrolledRights: Include Include Include Include Lanes: 0 0 0 0 0 0 0 1! 0 0 0 1 0 0 0 0 0 0 1 0 ------------|---------------||---------------||---------------||---------------|Volume Module:Base Vol: 0 0 0 2 0 9 12 96 0 0 93 10 Growth Adj: 1.06 1.06 1.06 1.06 1.06 1.06 1.06 1.06 1.06 1.06 1.06 1.06 Initial Bse: 0 0 0 2 0 10 13 102 0 0 99 11 Added Vol: 0 0 0 2 0 19 6 258 0 0 90 1 PasserByVol: 0 0 0 0 0 0 0 0 0 0 0 0 Initial Fut: 0 0 0 4 0 29 19 360 0 0 189 12 User Adj: 1.00 1.00 1.00 1.00 1.00 1.00 1.00 1.00 1.00 1.00 1.00 1.00 PHF Adj: 0.89 0.89 0.89 0.89 0.89 0.89 0.89 0.89 0.89 0.89 0.89 0.89 PHF Volume: 0 0 0 5 0 32 21 402 0 0 211 13 Reduct Vol: 0 0 0 0 0 0 0 0 0 0 0 0 FinalVolume: 0 0 0 5 0 32 21 402 0 0 211 13 ------------|---------------||---------------||---------------||---------------|Critical Gap Module:Critical Gp:xxxxx xxxx xxxxx 6.4 6.5 6.2 4.1 xxxx xxxxx xxxxx xxxx xxxxx FollowUpTim:xxxxx xxxx xxxxx 3.5 4.0 3.3 2.2 xxxx xxxxx xxxxx xxxx xxxxx ------------|---------------||---------------||---------------||---------------|Capacity Module:Cnflict Vol: xxxx xxxx xxxxx 662 662 217 224 xxxx xxxxx xxxx xxxx xxxxx Potent Cap.: xxxx xxxx xxxxx 430 385 827 1357 xxxx xxxxx xxxx xxxx xxxxx Move Cap.: xxxx xxxx xxxxx 425 379 827 1357 xxxx xxxxx xxxx xxxx xxxxx Volume/Cap: xxxx xxxx xxxx 0.01 0.00 0.04 0.02 xxxx xxxx xxxx xxxx xxxx ------------|---------------||---------------||---------------||---------------|Level Of Service Module:2Way95thQ: xxxx xxxx xxxxx xxxx xxxx xxxxx 0.0 xxxx xxxxx xxxx xxxx xxxxx Control Del:xxxxx xxxx xxxxx xxxxx xxxx xxxxx 7.7 xxxx xxxxx xxxxx xxxx xxxxx LOS by Move: * * * * * * A * * * * * Movement: LT - LTR - RT LT - LTR - RT LT - LTR - RT LT - LTR - RT Shared Cap.: xxxx xxxx xxxxx xxxx 739 xxxxx xxxx xxxx xxxxx xxxx xxxx xxxxx SharedQueue:xxxxx xxxx xxxxx xxxxx 0.2 xxxxx 0.0 xxxx xxxxx xxxxx xxxx xxxxx Shrd ConDel:xxxxx xxxx xxxxx xxxxx 10.1 xxxxx 7.7 xxxx xxxxx xxxxx xxxx xxxxx Shared LOS: * * * * B * A * * * * * ApproachDel: xxxxxx 10.1 xxxxxx xxxxxxApproachLOS: * B * * ********************************************************************************Note: Queue reported is the number of cars per lane.********************************************************************************
Traffix 8.0.0715 (c) 2008 Dowling Assoc. Licensed to RK ENGINEERING GROUP

OPENING YEAR + PROJ (AM) Tue May 12, 2015 14:41:10 Page 6-1 -------------------------------------------------------------------------------- AGUA MANSA HIGH CUBE WAREHOUSE COUNTY OF SAN BERNARDINO OPENING YEAR (2017) W RELATED PROJ W PROJ CONDITIONS -------------------------------------------------------------------------------- Level Of Service Computation Report 2000 HCM Unsignalized Method (Future Volume Alternative) ********************************************************************************Intersection #5 AGUA MANSA ROAD (NS) AT EL RAVINO ROAD (EW) ********************************************************************************Average Delay (sec/veh): 6.3 Worst Case Level Of Service: F[ 60.4]********************************************************************************Approach: North Bound South Bound East Bound West Bound Movement: L - T - R L - T - R L - T - R L - T - R ------------|---------------||---------------||---------------||---------------|Control: Uncontrolled Uncontrolled Stop Sign Stop Sign Rights: Include Include Ignore Include Lanes: 1 0 1 0 0 0 0 0 1 0 1 0 0 0 1 0 0 0 0 0 ------------|---------------||---------------||---------------||---------------|Volume Module:Base Vol: 8 303 0 0 393 40 69 0 22 0 0 0 Growth Adj: 1.06 1.06 1.06 1.06 1.06 1.06 1.06 1.06 1.06 1.06 1.06 1.06 Initial Bse: 8 321 0 0 417 42 73 0 23 0 0 0 Added Vol: 139 24 0 0 24 135 29 0 30 0 0 0 PasserByVol: 0 0 0 0 0 0 0 0 0 0 0 0 Initial Fut: 147 345 0 0 441 177 102 0 53 0 0 0 User Adj: 1.00 1.00 1.00 1.00 1.00 1.00 1.00 1.00 0.00 1.00 1.00 1.00 PHF Adj: 0.93 0.93 0.93 0.93 0.93 0.93 0.93 0.93 0.00 0.93 0.93 0.93 PHF Volume: 158 370 0 0 472 190 109 0 0 0 0 0 Reduct Vol: 0 0 0 0 0 0 0 0 0 0 0 0 FinalVolume: 158 370 0 0 472 190 109 0 0 0 0 0 ------------|---------------||---------------||---------------||---------------|Critical Gap Module:Critical Gp: 4.1 xxxx xxxxx xxxxx xxxx xxxxx 6.4 xxxx 6.2 xxxxx xxxx xxxxx FollowUpTim: 2.2 xxxx xxxxx xxxxx xxxx xxxxx 3.5 xxxx 3.3 xxxxx xxxx xxxxx ------------|---------------||---------------||---------------||---------------|Capacity Module:Cnflict Vol: 662 xxxx xxxxx xxxx xxxx xxxxx 1253 xxxx 567 xxxx xxxx xxxxx Potent Cap.: 936 xxxx xxxxx xxxx xxxx xxxxx 192 xxxx 527 xxxx xxxx xxxxx Move Cap.: 936 xxxx xxxxx xxxx xxxx xxxxx 167 xxxx 527 xxxx xxxx xxxxx Volume/Cap: 0.17 xxxx xxxx xxxx xxxx xxxx 0.66 xxxx 0.00 xxxx xxxx xxxx ------------|---------------||---------------||---------------||---------------|Level Of Service Module:2Way95thQ: 0.6 xxxx xxxxx xxxx xxxx xxxxx 3.8 xxxx xxxxx xxxx xxxx xxxxx Control Del: 9.6 xxxx xxxxx xxxxx xxxx xxxxx 60.4 xxxx xxxxx xxxxx xxxx xxxxx LOS by Move: A * * * * * F * * * * * Movement: LT - LTR - RT LT - LTR - RT LT - LTR - RT LT - LTR - RT Shared Cap.: xxxx xxxx xxxxx xxxx xxxx xxxxx xxxx xxxx xxxxx xxxx xxxx xxxxx SharedQueue:xxxxx xxxx xxxxx xxxxx xxxx xxxxx xxxxx xxxx xxxxx xxxxx xxxx xxxxx Shrd ConDel:xxxxx xxxx xxxxx xxxxx xxxx xxxxx xxxxx xxxx xxxxx xxxxx xxxx xxxxx Shared LOS: * * * * * * * * * * * * ApproachDel: xxxxxx xxxxxx 60.4 xxxxxxApproachLOS: * * F * ********************************************************************************Note: Queue reported is the number of cars per lane.********************************************************************************
Traffix 8.0.0715 (c) 2008 Dowling Assoc. Licensed to RK ENGINEERING GROUP

OPENING YEAR + PROJ (PM) Tue May 12, 2015 14:41:51 Page 6-1 -------------------------------------------------------------------------------- AGUA MANSA HIGH CUBE WAREHOUSE COUNTY OF SAN BERNARDINO OPENING YEAR (2017) W RELATED PROJ W PROJ CONDITIONS -------------------------------------------------------------------------------- Level Of Service Computation Report 2000 HCM Unsignalized Method (Future Volume Alternative) ********************************************************************************Intersection #5 AGUA MANSA ROAD (NS) AT EL RAVINO ROAD (EW) ********************************************************************************Average Delay (sec/veh): 127.5 Worst Case Level Of Service: F[831.5]********************************************************************************Approach: North Bound South Bound East Bound West Bound Movement: L - T - R L - T - R L - T - R L - T - R ------------|---------------||---------------||---------------||---------------|Control: Uncontrolled Uncontrolled Stop Sign Stop Sign Rights: Include Include Ignore Include Lanes: 1 0 1 0 0 0 0 0 1 0 1 0 0 0 1 0 0 0 0 0 ------------|---------------||---------------||---------------||---------------|Volume Module:Base Vol: 37 652 0 0 315 78 98 0 9 0 0 0 Growth Adj: 1.06 1.06 1.06 1.06 1.06 1.06 1.06 1.06 1.06 1.06 1.06 1.06 Initial Bse: 39 691 0 0 334 83 104 0 10 0 0 0 Added Vol: 45 23 0 0 28 44 128 0 132 0 0 0 PasserByVol: 0 0 0 0 0 0 0 0 0 0 0 0 Initial Fut: 84 714 0 0 362 127 232 0 142 0 0 0 User Adj: 1.00 1.00 1.00 1.00 1.00 1.00 1.00 1.00 0.00 1.00 1.00 1.00 PHF Adj: 0.81 0.81 0.81 0.81 0.81 0.81 0.81 0.81 0.00 0.81 0.81 0.81 PHF Volume: 103 877 0 0 445 156 285 0 0 0 0 0 Reduct Vol: 0 0 0 0 0 0 0 0 0 0 0 0 FinalVolume: 103 877 0 0 445 156 285 0 0 0 0 0 ------------|---------------||---------------||---------------||---------------|Critical Gap Module:Critical Gp: 4.1 xxxx xxxxx xxxxx xxxx xxxxx 6.4 xxxx 6.2 xxxxx xxxx xxxxx FollowUpTim: 2.2 xxxx xxxxx xxxxx xxxx xxxxx 3.5 xxxx 3.3 xxxxx xxxx xxxxx ------------|---------------||---------------||---------------||---------------|Capacity Module:Cnflict Vol: 600 xxxx xxxxx xxxx xxxx xxxxx 1607 xxxx 522 xxxx xxxx xxxxx Potent Cap.: 987 xxxx xxxxx xxxx xxxx xxxxx 117 xxxx 558 xxxx xxxx xxxxx Move Cap.: 987 xxxx xxxxx xxxx xxxx xxxxx 107 xxxx 558 xxxx xxxx xxxxx Volume/Cap: 0.10 xxxx xxxx xxxx xxxx xxxx 2.65 xxxx 0.00 xxxx xxxx xxxx ------------|---------------||---------------||---------------||---------------|Level Of Service Module:2Way95thQ: 0.4 xxxx xxxxx xxxx xxxx xxxxx 26.2 xxxx xxxxx xxxx xxxx xxxxx Control Del: 9.1 xxxx xxxxx xxxxx xxxx xxxxx 831.5 xxxx xxxxx xxxxx xxxx xxxxx LOS by Move: A * * * * * F * * * * * Movement: LT - LTR - RT LT - LTR - RT LT - LTR - RT LT - LTR - RT Shared Cap.: xxxx xxxx xxxxx xxxx xxxx xxxxx xxxx xxxx xxxxx xxxx xxxx xxxxx SharedQueue:xxxxx xxxx xxxxx xxxxx xxxx xxxxx xxxxx xxxx xxxxx xxxxx xxxx xxxxx Shrd ConDel:xxxxx xxxx xxxxx xxxxx xxxx xxxxx xxxxx xxxx xxxxx xxxxx xxxx xxxxx Shared LOS: * * * * * * * * * * * * ApproachDel: xxxxxx xxxxxx 831.5 xxxxxxApproachLOS: * * F * ********************************************************************************Note: Queue reported is the number of cars per lane.********************************************************************************
Traffix 8.0.0715 (c) 2008 Dowling Assoc. Licensed to RK ENGINEERING GROUP

MITIG8 - OPENING YEAR + PROTue May 12, 2015 15:16:19 Page 1-1 -------------------------------------------------------------------------------- AGUA MANSA HIGH CUBE WAREHOUSE COUNTY OF SAN BERNARDINO OPENING YEAR (2017) W RELATED PROJ W PROJ CONDITIONS -------------------------------------------------------------------------------- Level Of Service Computation Report 2000 HCM Operations Method (Future Volume Alternative) ********************************************************************************Intersection #5 AGUA MANSA ROAD (NS) AT EL RAVINO ROAD (EW) ********************************************************************************Cycle (sec): 60 Critical Vol./Cap.(X): 0.627Loss Time (sec): 6 Average Delay (sec/veh): 11.7Optimal Cycle: OPTIMIZED Level Of Service: B********************************************************************************Approach: North Bound South Bound East Bound West Bound Movement: L - T - R L - T - R L - T - R L - T - R ------------|---------------||---------------||---------------||---------------|Control: Protected Permitted Permitted Permitted Rights: Include Include Ignore Include Min. Green: 10 10 0 0 10 10 10 0 10 0 0 0 Y+R: 4.0 4.0 4.0 4.0 4.0 4.0 4.0 4.0 4.0 4.0 4.0 4.0 Lanes: 1 0 1 0 0 0 0 0 1 0 1 0 0 0 1 0 0 0 0 0 ------------|---------------||---------------||---------------||---------------|Volume Module:Base Vol: 8 303 0 0 393 40 69 0 22 0 0 0 Growth Adj: 1.06 1.06 1.06 1.06 1.06 1.06 1.06 1.06 1.06 1.06 1.06 1.06 Initial Bse: 8 321 0 0 417 42 73 0 23 0 0 0 Added Vol: 139 24 0 0 24 135 29 0 30 0 0 0 PasserByVol: 0 0 0 0 0 0 0 0 0 0 0 0 Initial Fut: 147 345 0 0 441 177 102 0 53 0 0 0 User Adj: 1.00 1.00 1.00 1.00 1.00 1.00 1.00 1.00 0.00 1.00 1.00 1.00 PHF Adj: 0.93 0.93 0.93 0.93 0.93 0.93 0.93 0.93 0.00 0.93 0.93 0.93 PHF Volume: 158 370 0 0 472 190 109 0 0 0 0 0 Reduct Vol: 0 0 0 0 0 0 0 0 0 0 0 0 Reduced Vol: 158 370 0 0 472 190 109 0 0 0 0 0 PCE Adj: 1.00 1.00 1.00 1.00 1.00 1.00 1.00 1.00 0.00 1.00 1.00 1.00 MLF Adj: 1.00 1.00 1.00 1.00 1.00 1.00 1.00 1.00 0.00 1.00 1.00 1.00 FinalVolume: 158 370 0 0 472 190 109 0 0 0 0 0 ------------|---------------||---------------||---------------||---------------|Saturation Flow Module:Sat/Lane: 1800 1800 1800 1800 1800 1800 1800 1800 1800 1800 1800 1800 Adjustment: 0.90 1.00 1.00 0.94 0.96 0.96 0.73 1.00 1.00 0.94 1.00 1.00 Lanes: 1.00 1.00 0.00 0.00 0.71 0.29 1.00 0.00 1.00 0.00 0.00 0.00 Final Sat.: 1615 1800 0 0 1233 497 1311 0 1800 0 0 0 ------------|---------------||---------------||---------------||---------------|Capacity Analysis Module:Vol/Sat: 0.10 0.21 0.00 0.00 0.38 0.38 0.08 0.00 0.00 0.00 0.00 0.00 Crit Moves: **** **** **** Green/Cycle: 0.17 0.73 0.00 0.00 0.57 0.57 0.17 0.00 0.00 0.00 0.00 0.00 Volume/Cap: 0.59 0.28 0.00 0.00 0.68 0.68 0.50 0.00 0.00 0.00 0.00 0.00 Delay/Veh: 26.4 2.8 0.0 0.0 11.0 11.0 24.5 0.0 0.0 0.0 0.0 0.0 User DelAdj: 1.00 1.00 1.00 1.00 1.00 1.00 1.00 1.00 1.00 1.00 1.00 1.00 AdjDel/Veh: 26.4 2.8 0.0 0.0 11.0 11.0 24.5 0.0 0.0 0.0 0.0 0.0 LOS by Move: C A A A B B C A A A A A HCM2kAvgQ: 4 2 0 0 9 9 2 0 0 0 0 0 ********************************************************************************Note: Queue reported is the number of cars per lane.
Traffix 8.0.0715 (c) 2008 Dowling Assoc. Licensed to RK ENGINEERING GROUP
Bryan Estrada
Typewritten Text
AM PEAK HOUR

MITIG8 - OPENING YEAR + PROTue May 12, 2015 15:15:49 Page 1-1 -------------------------------------------------------------------------------- AGUA MANSA HIGH CUBE WAREHOUSE COUNTY OF SAN BERNARDINO OPENING YEAR (2017) W RELATED PROJ W PROJ CONDITIONS -------------------------------------------------------------------------------- Level Of Service Computation Report 2000 HCM Operations Method (Future Volume Alternative) ********************************************************************************Intersection #5 AGUA MANSA ROAD (NS) AT EL RAVINO ROAD (EW) ********************************************************************************Cycle (sec): 60 Critical Vol./Cap.(X): 0.697Loss Time (sec): 6 Average Delay (sec/veh): 17.6Optimal Cycle: OPTIMIZED Level Of Service: B********************************************************************************Approach: North Bound South Bound East Bound West Bound Movement: L - T - R L - T - R L - T - R L - T - R ------------|---------------||---------------||---------------||---------------|Control: Protected Permitted Permitted Permitted Rights: Include Include Ignore Include Min. Green: 10 10 0 0 10 10 10 0 10 0 0 0 Y+R: 4.0 4.0 4.0 4.0 4.0 4.0 4.0 4.0 4.0 4.0 4.0 4.0 Lanes: 1 0 1 0 0 0 0 0 1 0 1 0 0 0 1 0 0 0 0 0 ------------|---------------||---------------||---------------||---------------|Volume Module:Base Vol: 37 652 0 0 315 78 98 0 9 0 0 0 Growth Adj: 1.06 1.06 1.06 1.06 1.06 1.06 1.06 1.06 1.06 1.06 1.06 1.06 Initial Bse: 39 691 0 0 334 83 104 0 10 0 0 0 Added Vol: 45 23 0 0 28 44 128 0 132 0 0 0 PasserByVol: 0 0 0 0 0 0 0 0 0 0 0 0 Initial Fut: 84 714 0 0 362 127 232 0 142 0 0 0 User Adj: 1.00 1.00 1.00 1.00 1.00 1.00 1.00 1.00 0.00 1.00 1.00 1.00 PHF Adj: 0.81 0.81 0.81 0.81 0.81 0.81 0.81 0.81 0.00 0.81 0.81 0.81 PHF Volume: 103 877 0 0 445 156 285 0 0 0 0 0 Reduct Vol: 0 0 0 0 0 0 0 0 0 0 0 0 Reduced Vol: 103 877 0 0 445 156 285 0 0 0 0 0 PCE Adj: 1.00 1.00 1.00 1.00 1.00 1.00 1.00 1.00 0.00 1.00 1.00 1.00 MLF Adj: 1.00 1.00 1.00 1.00 1.00 1.00 1.00 1.00 0.00 1.00 1.00 1.00 FinalVolume: 103 877 0 0 445 156 285 0 0 0 0 0 ------------|---------------||---------------||---------------||---------------|Saturation Flow Module:Sat/Lane: 1800 1800 1800 1800 1800 1800 1800 1800 1800 1800 1800 1800 Adjustment: 0.90 1.00 1.00 0.94 0.97 0.97 0.73 1.00 1.00 0.94 1.00 1.00 Lanes: 1.00 1.00 0.00 0.00 0.74 0.26 1.00 0.00 1.00 0.00 0.00 0.00 Final Sat.: 1615 1800 0 0 1287 450 1307 0 1800 0 0 0 ------------|---------------||---------------||---------------||---------------|Capacity Analysis Module:Vol/Sat: 0.06 0.49 0.00 0.00 0.35 0.35 0.22 0.00 0.00 0.00 0.00 0.00 Crit Moves: **** **** **** Green/Cycle: 0.17 0.62 0.00 0.00 0.45 0.45 0.28 0.00 0.00 0.00 0.00 0.00 Volume/Cap: 0.38 0.79 0.00 0.00 0.77 0.77 0.77 0.00 0.00 0.00 0.00 0.00 Delay/Veh: 23.2 12.5 0.0 0.0 18.5 18.5 29.1 0.0 0.0 0.0 0.0 0.0 User DelAdj: 1.00 1.00 1.00 1.00 1.00 1.00 1.00 1.00 1.00 1.00 1.00 1.00 AdjDel/Veh: 23.2 12.5 0.0 0.0 18.5 18.5 29.1 0.0 0.0 0.0 0.0 0.0 LOS by Move: C B A A B B C A A A A A HCM2kAvgQ: 2 14 0 0 10 10 5 0 0 0 0 0 ********************************************************************************Note: Queue reported is the number of cars per lane.
Traffix 8.0.0715 (c) 2008 Dowling Assoc. Licensed to RK ENGINEERING GROUP
Bryan Estrada
Typewritten Text
PM PEAK HOUR

OPENING YEAR + PROJ (AM) Tue May 12, 2015 14:41:10 Page 7-1 -------------------------------------------------------------------------------- AGUA MANSA HIGH CUBE WAREHOUSE COUNTY OF SAN BERNARDINO OPENING YEAR (2017) W RELATED PROJ W PROJ CONDITIONS -------------------------------------------------------------------------------- Level Of Service Computation Report 2000 HCM Operations Method (Future Volume Alternative) ********************************************************************************Intersection #6 RIVERSIDE AVENUE (NS) AT AGUA MANSA ROAD (EW) ********************************************************************************Cycle (sec): 95 Critical Vol./Cap.(X): 0.654Loss Time (sec): 8 Average Delay (sec/veh): 36.0Optimal Cycle: OPTIMIZED Level Of Service: D********************************************************************************Approach: North Bound South Bound East Bound West Bound Movement: L - T - R L - T - R L - T - R L - T - R ------------|---------------||---------------||---------------||---------------|Control: Protected Protected Protected Protected Rights: Include Include Include Include Min. Green: 10 29 29 10 32 32 10 27 27 10 23 23 Y+R: 4.0 4.0 4.0 4.0 4.0 4.0 4.0 4.0 4.0 4.0 4.0 4.0 Lanes: 1 0 1 1 0 1 0 2 0 1 1 0 1 0 1 1 0 1 0 1 ------------|---------------||---------------||---------------||---------------|Volume Module:Base Vol: 152 713 61 78 846 193 159 165 82 59 241 50 Growth Adj: 1.06 1.06 1.06 1.06 1.06 1.06 1.06 1.06 1.06 1.06 1.06 1.06 Initial Bse: 161 756 65 83 897 205 169 175 87 63 255 53 Added Vol: 85 21 0 0 6 62 18 10 19 0 43 0 PasserByVol: 0 0 0 0 0 0 0 0 0 0 0 0 Initial Fut: 246 777 65 83 903 267 187 185 106 63 298 53 User Adj: 1.00 1.00 1.00 1.00 1.00 1.00 1.00 1.00 1.00 1.00 1.00 1.00 PHF Adj: 0.91 0.91 0.91 0.91 0.91 0.91 0.91 0.91 0.91 0.91 0.91 0.91 PHF Volume: 270 854 71 91 992 293 205 203 116 69 328 58 Reduct Vol: 0 0 0 0 0 0 0 0 0 0 0 0 Reduced Vol: 270 854 71 91 992 293 205 203 116 69 328 58 PCE Adj: 1.00 1.00 1.00 1.00 1.00 1.00 1.00 1.00 1.00 1.00 1.00 1.00 MLF Adj: 1.00 1.00 1.00 1.00 1.00 1.00 1.00 1.00 1.00 1.00 1.00 1.00 FinalVolume: 270 854 71 91 992 293 205 203 116 69 328 58 ------------|---------------||---------------||---------------||---------------|Saturation Flow Module:Sat/Lane: 1800 1800 1800 1800 1800 1800 1800 1800 1800 1800 1800 1800 Adjustment: 0.90 0.99 0.99 0.90 1.00 0.85 0.90 1.00 0.85 0.90 1.00 0.85 Lanes: 1.00 1.85 0.15 1.00 2.00 1.00 1.00 1.00 1.00 1.00 1.00 1.00 Final Sat.: 1615 3283 273 1615 3600 1530 1615 1800 1530 1615 1800 1530 ------------|---------------||---------------||---------------||---------------|Capacity Analysis Module:Vol/Sat: 0.17 0.26 0.26 0.06 0.28 0.19 0.13 0.11 0.08 0.04 0.18 0.04 Crit Moves: **** **** **** **** Green/Cycle: 0.19 0.39 0.39 0.13 0.34 0.34 0.13 0.28 0.28 0.11 0.26 0.26 Volume/Cap: 0.88 0.66 0.66 0.42 0.82 0.57 0.95 0.40 0.27 0.40 0.71 0.15 Delay/Veh: 62.2 25.0 25.0 39.0 33.3 27.3 87.2 27.9 26.7 41.3 37.4 27.5 User DelAdj: 1.00 1.00 1.00 1.00 1.00 1.00 1.00 1.00 1.00 1.00 1.00 1.00 AdjDel/Veh: 62.2 25.0 25.0 39.0 33.3 27.3 87.2 27.9 26.7 41.3 37.4 27.5 LOS by Move: E C C D C C F C C D D C HCM2kAvgQ: 11 12 12 3 16 8 10 5 3 2 10 1 ********************************************************************************Note: Queue reported is the number of cars per lane.
Traffix 8.0.0715 (c) 2008 Dowling Assoc. Licensed to RK ENGINEERING GROUP

OPENING YEAR + PROJ (PM) Tue May 12, 2015 14:41:51 Page 7-1 -------------------------------------------------------------------------------- AGUA MANSA HIGH CUBE WAREHOUSE COUNTY OF SAN BERNARDINO OPENING YEAR (2017) W RELATED PROJ W PROJ CONDITIONS -------------------------------------------------------------------------------- Level Of Service Computation Report 2000 HCM Operations Method (Future Volume Alternative) ********************************************************************************Intersection #6 RIVERSIDE AVENUE (NS) AT AGUA MANSA ROAD (EW) ********************************************************************************Cycle (sec): 95 Critical Vol./Cap.(X): 0.810Loss Time (sec): 8 Average Delay (sec/veh): 38.7Optimal Cycle: OPTIMIZED Level Of Service: D********************************************************************************Approach: North Bound South Bound East Bound West Bound Movement: L - T - R L - T - R L - T - R L - T - R ------------|---------------||---------------||---------------||---------------|Control: Protected Protected Protected Protected Rights: Include Include Include Include Min. Green: 10 29 29 10 32 32 10 27 27 10 23 23 Y+R: 4.0 4.0 4.0 4.0 4.0 4.0 4.0 4.0 4.0 4.0 4.0 4.0 Lanes: 1 0 1 1 0 1 0 2 0 1 1 0 1 0 1 1 0 1 0 1 ------------|---------------||---------------||---------------||---------------|Volume Module:Base Vol: 96 796 68 60 986 138 196 485 119 35 136 38 Growth Adj: 1.06 1.06 1.06 1.06 1.06 1.06 1.06 1.06 1.06 1.06 1.06 1.06 Initial Bse: 102 844 72 64 1045 146 208 514 126 37 144 40 Added Vol: 28 7 0 0 21 24 63 42 82 0 14 0 PasserByVol: 0 0 0 0 0 0 0 0 0 0 0 0 Initial Fut: 130 851 72 64 1066 170 271 556 208 37 158 40 User Adj: 1.00 1.00 1.00 1.00 1.00 1.00 1.00 1.00 1.00 1.00 1.00 1.00 PHF Adj: 0.96 0.96 0.96 0.96 0.96 0.96 0.96 0.96 0.96 0.96 0.96 0.96 PHF Volume: 136 891 75 67 1116 178 284 582 218 39 166 42 Reduct Vol: 0 0 0 0 0 0 0 0 0 0 0 0 Reduced Vol: 136 891 75 67 1116 178 284 582 218 39 166 42 PCE Adj: 1.00 1.00 1.00 1.00 1.00 1.00 1.00 1.00 1.00 1.00 1.00 1.00 MLF Adj: 1.00 1.00 1.00 1.00 1.00 1.00 1.00 1.00 1.00 1.00 1.00 1.00 FinalVolume: 136 891 75 67 1116 178 284 582 218 39 166 42 ------------|---------------||---------------||---------------||---------------|Saturation Flow Module:Sat/Lane: 1800 1800 1800 1800 1800 1800 1800 1800 1800 1800 1800 1800 Adjustment: 0.90 0.99 0.99 0.90 1.00 0.85 0.90 1.00 0.85 0.90 1.00 0.85 Lanes: 1.00 1.84 0.16 1.00 2.00 1.00 1.00 1.00 1.00 1.00 1.00 1.00 Final Sat.: 1615 3279 278 1615 3600 1530 1615 1800 1530 1615 1800 1530 ------------|---------------||---------------||---------------||---------------|Capacity Analysis Module:Vol/Sat: 0.08 0.27 0.27 0.04 0.31 0.12 0.18 0.32 0.14 0.02 0.09 0.03 Crit Moves: **** **** **** **** Green/Cycle: 0.11 0.33 0.33 0.12 0.35 0.35 0.20 0.36 0.36 0.11 0.27 0.27 Volume/Cap: 0.80 0.81 0.81 0.36 0.90 0.34 0.90 0.90 0.40 0.23 0.34 0.10 Delay/Veh: 64.4 33.2 33.2 39.9 38.5 23.4 63.8 44.1 23.2 39.7 28.3 26.2 User DelAdj: 1.00 1.00 1.00 1.00 1.00 1.00 1.00 1.00 1.00 1.00 1.00 1.00 AdjDel/Veh: 64.4 33.2 33.2 39.9 38.5 23.4 63.8 44.1 23.2 39.7 28.3 26.2 LOS by Move: E C C D D C E D C D C C HCM2kAvgQ: 6 15 15 2 19 4 12 20 5 1 4 1 ********************************************************************************Note: Queue reported is the number of cars per lane.
Traffix 8.0.0715 (c) 2008 Dowling Assoc. Licensed to RK ENGINEERING GROUP

OPENING YEAR + PROJ (AM) Tue May 12, 2015 14:41:10 Page 8-1 -------------------------------------------------------------------------------- AGUA MANSA HIGH CUBE WAREHOUSE COUNTY OF SAN BERNARDINO OPENING YEAR (2017) W RELATED PROJ W PROJ CONDITIONS -------------------------------------------------------------------------------- Level Of Service Computation Report 2000 HCM Unsignalized Method (Future Volume Alternative) ********************************************************************************Intersection #7 PROJECT ACCESS 1 (NS) AT EL RAVINO ROAD (EW) ********************************************************************************Average Delay (sec/veh): 0.0 Worst Case Level Of Service: A[ 8.0]********************************************************************************Approach: North Bound South Bound East Bound West Bound Movement: L - T - R L - T - R L - T - R L - T - R ------------|---------------||---------------||---------------||---------------|Control: Stop Sign Stop Sign Uncontrolled UncontrolledRights: Include Include Include Include Lanes: 0 0 0 0 0 0 0 1! 0 0 0 1 0 0 0 0 0 0 1 0 ------------|---------------||---------------||---------------||---------------|Volume Module:Base Vol: 0 0 0 0 0 0 0 90 0 0 77 0 Growth Adj: 1.06 1.06 1.06 1.06 1.06 1.06 1.06 1.06 1.06 1.06 1.06 1.06 Initial Bse: 0 0 0 0 0 0 0 95 0 0 82 0 Added Vol: 0 0 0 0 0 0 1 59 0 0 273 1 PasserByVol: 0 0 0 0 0 0 0 0 0 0 0 0 Initial Fut: 0 0 0 0 0 0 1 154 0 0 355 1 User Adj: 1.00 1.00 1.00 1.00 1.00 1.00 1.00 1.00 1.00 1.00 1.00 1.00 PHF Adj: 0.92 0.92 0.92 0.92 0.92 0.92 0.92 0.92 0.92 0.92 0.92 0.92 PHF Volume: 0 0 0 0 0 0 1 168 0 0 385 1 Reduct Vol: 0 0 0 0 0 0 0 0 0 0 0 0 FinalVolume: 0 0 0 0 0 0 1 168 0 0 385 1 ------------|---------------||---------------||---------------||---------------|Critical Gap Module:Critical Gp:xxxxx xxxx xxxxx 6.4 6.5 6.2 4.1 xxxx xxxxx xxxxx xxxx xxxxx FollowUpTim:xxxxx xxxx xxxxx 3.5 4.0 3.3 2.2 xxxx xxxxx xxxxx xxxx xxxxx ------------|---------------||---------------||---------------||---------------|Capacity Module:Cnflict Vol: xxxx xxxx xxxxx 556 556 386 387 xxxx xxxxx xxxx xxxx xxxxx Potent Cap.: xxxx xxxx xxxxx 496 442 666 1183 xxxx xxxxx xxxx xxxx xxxxx Move Cap.: xxxx xxxx xxxxx 495 442 666 1183 xxxx xxxxx xxxx xxxx xxxxx Volume/Cap: xxxx xxxx xxxx 0.00 0.00 0.00 0.00 xxxx xxxx xxxx xxxx xxxx ------------|---------------||---------------||---------------||---------------|Level Of Service Module:2Way95thQ: xxxx xxxx xxxxx xxxx xxxx xxxxx 0.0 xxxx xxxxx xxxx xxxx xxxxx Control Del:xxxxx xxxx xxxxx xxxxx xxxx xxxxx 8.0 xxxx xxxxx xxxxx xxxx xxxxx LOS by Move: * * * * * * A * * * * * Movement: LT - LTR - RT LT - LTR - RT LT - LTR - RT LT - LTR - RT Shared Cap.: xxxx xxxx xxxxx xxxx 0 xxxxx xxxx xxxx xxxxx xxxx xxxx xxxxx SharedQueue:xxxxx xxxx xxxxx xxxxx xxxx xxxxx 0.0 xxxx xxxxx xxxxx xxxx xxxxx Shrd ConDel:xxxxx xxxx xxxxx xxxxx xxxx xxxxx 8.0 xxxx xxxxx xxxxx xxxx xxxxx Shared LOS: * * * * * * A * * * * * ApproachDel: xxxxxx xxxxxx xxxxxx xxxxxxApproachLOS: * * * * ********************************************************************************Note: Queue reported is the number of cars per lane.********************************************************************************
Traffix 8.0.0715 (c) 2008 Dowling Assoc. Licensed to RK ENGINEERING GROUP

OPENING YEAR + PROJ (PM) Tue May 12, 2015 14:41:51 Page 8-1 -------------------------------------------------------------------------------- AGUA MANSA HIGH CUBE WAREHOUSE COUNTY OF SAN BERNARDINO OPENING YEAR (2017) W RELATED PROJ W PROJ CONDITIONS -------------------------------------------------------------------------------- Level Of Service Computation Report 2000 HCM Unsignalized Method (Future Volume Alternative) ********************************************************************************Intersection #7 PROJECT ACCESS 1 (NS) AT EL RAVINO ROAD (EW) ********************************************************************************Average Delay (sec/veh): 0.1 Worst Case Level Of Service: B[ 10.4]********************************************************************************Approach: North Bound South Bound East Bound West Bound Movement: L - T - R L - T - R L - T - R L - T - R ------------|---------------||---------------||---------------||---------------|Control: Stop Sign Stop Sign Uncontrolled UncontrolledRights: Include Include Include Include Lanes: 0 0 0 0 0 0 0 1! 0 0 0 1 0 0 0 0 0 1 0 0 ------------|---------------||---------------||---------------||---------------|Volume Module:Base Vol: 0 0 0 0 0 0 0 96 0 0 93 0 Growth Adj: 1.06 1.06 1.06 1.06 1.06 1.06 1.06 1.06 1.06 1.06 1.06 1.06 Initial Bse: 0 0 0 0 0 0 0 102 0 0 99 0 Added Vol: 0 0 0 1 0 2 1 259 0 0 89 0 PasserByVol: 0 0 0 0 0 0 0 0 0 0 0 0 Initial Fut: 0 0 0 1 0 2 1 361 0 0 188 0 User Adj: 1.00 1.00 1.00 1.00 1.00 1.00 1.00 1.00 1.00 1.00 1.00 1.00 PHF Adj: 0.92 0.92 0.92 0.92 0.92 0.92 0.92 0.92 0.92 0.92 0.92 0.92 PHF Volume: 0 0 0 1 0 2 1 392 0 0 204 0 Reduct Vol: 0 0 0 0 0 0 0 0 0 0 0 0 FinalVolume: 0 0 0 1 0 2 1 392 0 0 204 0 ------------|---------------||---------------||---------------||---------------|Critical Gap Module:Critical Gp:xxxxx xxxx xxxxx 6.4 6.5 6.2 4.1 xxxx xxxxx xxxxx xxxx xxxxx FollowUpTim:xxxxx xxxx xxxxx 3.5 4.0 3.3 2.2 xxxx xxxxx xxxxx xxxx xxxxx ------------|---------------||---------------||---------------||---------------|Capacity Module:Cnflict Vol: xxxx xxxx xxxxx 598 598 204 204 xxxx xxxxx xxxx xxxx xxxxx Potent Cap.: xxxx xxxx xxxxx 468 418 842 1380 xxxx xxxxx xxxx xxxx xxxxx Move Cap.: xxxx xxxx xxxxx 468 418 842 1380 xxxx xxxxx xxxx xxxx xxxxx Volume/Cap: xxxx xxxx xxxx 0.00 0.00 0.00 0.00 xxxx xxxx xxxx xxxx xxxx ------------|---------------||---------------||---------------||---------------|Level Of Service Module:2Way95thQ: xxxx xxxx xxxxx xxxx xxxx xxxxx 0.0 xxxx xxxxx xxxx xxxx xxxxx Control Del:xxxxx xxxx xxxxx xxxxx xxxx xxxxx 7.6 xxxx xxxxx xxxxx xxxx xxxxx LOS by Move: * * * * * * A * * * * * Movement: LT - LTR - RT LT - LTR - RT LT - LTR - RT LT - LTR - RT Shared Cap.: xxxx xxxx xxxxx xxxx 665 xxxxx xxxx xxxx xxxxx xxxx xxxx xxxxx SharedQueue:xxxxx xxxx xxxxx xxxxx 0.0 xxxxx 0.0 xxxx xxxxx xxxxx xxxx xxxxx Shrd ConDel:xxxxx xxxx xxxxx xxxxx 10.4 xxxxx 7.6 xxxx xxxxx xxxxx xxxx xxxxx Shared LOS: * * * * B * A * * * * * ApproachDel: xxxxxx 10.4 xxxxxx xxxxxxApproachLOS: * B * * ********************************************************************************Note: Queue reported is the number of cars per lane.********************************************************************************
Traffix 8.0.0715 (c) 2008 Dowling Assoc. Licensed to RK ENGINEERING GROUP

OPENING YEAR + PROJ (AM) Tue May 12, 2015 14:41:10 Page 9-1 -------------------------------------------------------------------------------- AGUA MANSA HIGH CUBE WAREHOUSE COUNTY OF SAN BERNARDINO OPENING YEAR (2017) W RELATED PROJ W PROJ CONDITIONS -------------------------------------------------------------------------------- Level Of Service Computation Report 2000 HCM Operations Method (Future Volume Alternative) ********************************************************************************Intersection #8 AGUA MANSA ROAD (NS) AT PROJECT ACCESS 2 (EW) ********************************************************************************Cycle (sec): 130 Critical Vol./Cap.(X): 0.390Loss Time (sec): 4 Average Delay (sec/veh): 2.2Optimal Cycle: OPTIMIZED Level Of Service: A********************************************************************************Approach: North Bound South Bound East Bound West Bound Movement: L - T - R L - T - R L - T - R L - T - R ------------|---------------||---------------||---------------||---------------|Control: Permitted Permitted Protected Protected Rights: Include Include Include Include Min. Green: 10 10 0 0 10 10 10 0 10 0 0 0 Y+R: 4.0 4.0 4.0 4.0 4.0 4.0 4.0 4.0 4.0 4.0 4.0 4.0 Lanes: 1 0 1 0 0 0 0 1 0 1 1 0 0 0 1 0 0 0 0 0 ------------|---------------||---------------||---------------||---------------|Volume Module:Base Vol: 0 372 0 0 433 0 0 0 0 0 0 0 Growth Adj: 1.06 1.06 1.06 1.06 1.06 1.06 1.06 1.06 1.06 1.06 1.06 1.06 Initial Bse: 0 394 0 0 459 0 0 0 0 0 0 0 Added Vol: 18 35 0 0 153 38 13 0 6 0 0 0 PasserByVol: 0 0 0 0 0 0 0 0 0 0 0 0 Initial Fut: 18 429 0 0 612 38 13 0 6 0 0 0 User Adj: 1.00 1.00 1.00 1.00 1.00 1.00 1.00 1.00 1.00 1.00 1.00 1.00 PHF Adj: 0.92 0.92 0.92 0.92 0.92 0.92 0.92 0.92 0.92 0.92 0.92 0.92 PHF Volume: 20 467 0 0 665 41 14 0 7 0 0 0 Reduct Vol: 0 0 0 0 0 0 0 0 0 0 0 0 Reduced Vol: 20 467 0 0 665 41 14 0 7 0 0 0 PCE Adj: 1.00 1.00 1.00 1.00 1.00 1.00 1.00 1.00 1.00 1.00 1.00 1.00 MLF Adj: 1.00 1.00 1.00 1.00 1.00 1.00 1.00 1.00 1.00 1.00 1.00 1.00 FinalVolume: 20 467 0 0 665 41 14 0 7 0 0 0 ------------|---------------||---------------||---------------||---------------|Saturation Flow Module:Sat/Lane: 1800 1800 1800 1800 1800 1800 1800 1800 1800 1800 1800 1800 Adjustment: 0.36 1.00 1.00 0.94 1.00 0.85 0.90 1.00 0.85 0.94 1.00 1.00 Lanes: 1.00 1.00 0.00 0.00 1.00 1.00 1.00 0.00 1.00 0.00 0.00 0.00 Final Sat.: 653 1800 0 0 1800 1530 1615 0 1530 0 0 0 ------------|---------------||---------------||---------------||---------------|Capacity Analysis Module:Vol/Sat: 0.03 0.26 0.00 0.00 0.37 0.03 0.01 0.00 0.00 0.00 0.00 0.00 Crit Moves: **** **** Green/Cycle: 0.89 0.89 0.00 0.00 0.89 0.89 0.08 0.00 0.08 0.00 0.00 0.00 Volume/Cap: 0.03 0.29 0.00 0.00 0.41 0.03 0.11 0.00 0.06 0.00 0.00 0.00 Delay/Veh: 0.8 1.1 0.0 0.0 1.4 0.8 56.3 0.0 55.8 0.0 0.0 0.0 User DelAdj: 1.00 1.00 1.00 1.00 1.00 1.00 1.00 1.00 1.00 1.00 1.00 1.00 AdjDel/Veh: 0.8 1.1 0.0 0.0 1.4 0.8 56.3 0.0 55.8 0.0 0.0 0.0 LOS by Move: A A A A A A E A E A A A HCM2kAvgQ: 0 3 0 0 5 0 1 0 0 0 0 0 ********************************************************************************Note: Queue reported is the number of cars per lane.
Traffix 8.0.0715 (c) 2008 Dowling Assoc. Licensed to RK ENGINEERING GROUP

OPENING YEAR + PROJ (PM) Tue May 12, 2015 14:41:51 Page 9-1 -------------------------------------------------------------------------------- AGUA MANSA HIGH CUBE WAREHOUSE COUNTY OF SAN BERNARDINO OPENING YEAR (2017) W RELATED PROJ W PROJ CONDITIONS -------------------------------------------------------------------------------- Level Of Service Computation Report 2000 HCM Operations Method (Future Volume Alternative) ********************************************************************************Intersection #8 AGUA MANSA ROAD (NS) AT PROJECT ACCESS 2 (EW) ********************************************************************************Cycle (sec): 110 Critical Vol./Cap.(X): 0.618Loss Time (sec): 4 Average Delay (sec/veh): 4.3Optimal Cycle: OPTIMIZED Level Of Service: A********************************************************************************Approach: North Bound South Bound East Bound West Bound Movement: L - T - R L - T - R L - T - R L - T - R ------------|---------------||---------------||---------------||---------------|Control: Permitted Permitted Protected Protected Rights: Include Include Include Include Min. Green: 10 10 0 0 10 10 10 0 10 0 0 0 Y+R: 4.0 4.0 4.0 4.0 4.0 4.0 4.0 4.0 4.0 4.0 4.0 4.0 Lanes: 1 0 1 0 0 0 0 1 0 1 1 0 0 0 1 0 0 0 0 0 ------------|---------------||---------------||---------------||---------------|Volume Module:Base Vol: 0 750 0 0 393 0 0 0 0 0 0 0 Growth Adj: 1.06 1.06 1.06 1.06 1.06 1.06 1.06 1.06 1.06 1.06 1.06 1.06 Initial Bse: 0 795 0 0 417 0 0 0 0 0 0 0 Added Vol: 7 145 0 0 52 14 41 0 20 0 0 0 PasserByVol: 0 0 0 0 0 0 0 0 0 0 0 0 Initial Fut: 7 940 0 0 469 14 41 0 20 0 0 0 User Adj: 1.00 1.00 1.00 1.00 1.00 1.00 1.00 1.00 1.00 1.00 1.00 1.00 PHF Adj: 0.92 0.92 0.92 0.92 0.92 0.92 0.92 0.92 0.92 0.92 0.92 0.92 PHF Volume: 8 1022 0 0 509 15 45 0 22 0 0 0 Reduct Vol: 0 0 0 0 0 0 0 0 0 0 0 0 Reduced Vol: 8 1022 0 0 509 15 45 0 22 0 0 0 PCE Adj: 1.00 1.00 1.00 1.00 1.00 1.00 1.00 1.00 1.00 1.00 1.00 1.00 MLF Adj: 1.00 1.00 1.00 1.00 1.00 1.00 1.00 1.00 1.00 1.00 1.00 1.00 FinalVolume: 8 1022 0 0 509 15 45 0 22 0 0 0 ------------|---------------||---------------||---------------||---------------|Saturation Flow Module:Sat/Lane: 1800 1800 1800 1800 1800 1800 1800 1800 1800 1800 1800 1800 Adjustment: 0.43 1.00 1.00 0.94 1.00 0.85 0.90 1.00 0.85 0.94 1.00 1.00 Lanes: 1.00 1.00 0.00 0.00 1.00 1.00 1.00 0.00 1.00 0.00 0.00 0.00 Final Sat.: 773 1800 0 0 1800 1530 1615 0 1530 0 0 0 ------------|---------------||---------------||---------------||---------------|Capacity Analysis Module:Vol/Sat: 0.01 0.57 0.00 0.00 0.28 0.01 0.03 0.00 0.01 0.00 0.00 0.00 Crit Moves: **** **** Green/Cycle: 0.87 0.87 0.00 0.00 0.87 0.87 0.09 0.00 0.09 0.00 0.00 0.00 Volume/Cap: 0.01 0.65 0.00 0.00 0.32 0.01 0.30 0.00 0.16 0.00 0.00 0.00 Delay/Veh: 0.9 3.0 0.0 0.0 1.4 0.9 47.9 0.0 46.6 0.0 0.0 0.0 User DelAdj: 1.00 1.00 1.00 1.00 1.00 1.00 1.00 1.00 1.00 1.00 1.00 1.00 AdjDel/Veh: 0.9 3.0 0.0 0.0 1.4 0.9 47.9 0.0 46.6 0.0 0.0 0.0 LOS by Move: A A A A A A D A D A A A HCM2kAvgQ: 0 11 0 0 3 0 2 0 1 0 0 0 ********************************************************************************Note: Queue reported is the number of cars per lane.
Traffix 8.0.0715 (c) 2008 Dowling Assoc. Licensed to RK ENGINEERING GROUP

Appendix H
Buildout Year (2035) Without Project Conditions
Intersection Analysis Worksheets

FORECAST YEAR (AM) Tue May 12, 2015 12:37:55 Page 2-1 -------------------------------------------------------------------------------- AGUA MANSA HIGH CUBE WAREHOUSE COUNTY OF SAN BERNARDINO FORECAST YEAR (2035) CONDITIONS -------------------------------------------------------------------------------- Level Of Service Computation Report 2000 HCM Operations Method (Future Volume Alternative) ********************************************************************************Intersection #1 CEDAR AVENUE (NS) AT EL RAVINO ROAD (EW) ********************************************************************************Cycle (sec): 110 Critical Vol./Cap.(X): 0.786Loss Time (sec): 8 Average Delay (sec/veh): 25.4Optimal Cycle: OPTIMIZED Level Of Service: C********************************************************************************Approach: North Bound South Bound East Bound West Bound Movement: L - T - R L - T - R L - T - R L - T - R ------------|---------------||---------------||---------------||---------------|Control: Protected Protected Permitted Permitted Rights: Include Include Include Include Min. Green: 10 0 0 10 23 23 10 14 14 10 24 24 Y+R: 4.0 4.0 4.0 4.0 4.0 4.0 4.0 4.0 4.0 4.0 4.0 4.0 Lanes: 1 0 1 1 0 1 0 1 1 0 0 0 1! 0 0 0 1 0 0 1 ------------|---------------||---------------||---------------||---------------|Volume Module:Base Vol: 15 688 48 64 1304 9 5 2 9 67 3 14 Growth Adj: 1.00 1.00 1.00 1.00 1.00 1.00 1.00 1.00 1.00 1.00 1.00 1.00 Initial Bse: 15 688 48 64 1304 9 5 2 9 67 3 14 Added Vol: 0 2 575 155 6 0 0 10 0 125 2 34 PasserByVol: 0 0 0 0 0 0 0 0 0 0 0 0 Initial Fut: 15 690 623 219 1310 9 5 12 9 192 5 48 User Adj: 1.00 1.00 1.00 1.00 1.00 1.00 1.00 1.00 1.00 1.00 1.00 1.00 PHF Adj: 0.95 0.95 0.95 0.95 0.95 0.95 0.95 0.95 0.95 0.95 0.95 0.95 PHF Volume: 16 726 656 231 1379 9 5 13 9 202 5 51 Reduct Vol: 0 0 0 0 0 0 0 0 0 0 0 0 Reduced Vol: 16 726 656 231 1379 9 5 13 9 202 5 51 PCE Adj: 1.00 1.00 1.00 1.00 1.00 1.00 1.00 1.00 1.00 1.00 1.00 1.00 MLF Adj: 1.00 1.00 1.00 1.00 1.00 1.00 1.00 1.00 1.00 1.00 1.00 1.00 FinalVolume: 16 726 656 231 1379 9 5 13 9 202 5 51 ------------|---------------||---------------||---------------||---------------|Saturation Flow Module:Sat/Lane: 1800 1800 1800 1800 1800 1800 1800 1800 1800 1800 1800 1800 Adjustment: 0.90 0.93 0.93 0.90 1.00 1.00 0.86 0.91 0.91 0.67 0.71 0.85 Lanes: 1.00 1.05 0.95 1.00 1.99 0.01 0.20 0.46 0.34 0.98 0.02 1.00 Final Sat.: 1615 1758 1587 1615 3572 25 311 746 560 1171 31 1530 ------------|---------------||---------------||---------------||---------------|Capacity Analysis Module:Vol/Sat: 0.01 0.41 0.41 0.14 0.39 0.39 0.02 0.02 0.02 0.17 0.17 0.03 Crit Moves: **** **** **** Green/Cycle: 0.13 0.53 0.53 0.18 0.57 0.57 0.22 0.22 0.22 0.22 0.22 0.22 Volume/Cap: 0.07 0.79 0.79 0.79 0.67 0.67 0.08 0.08 0.08 0.79 0.79 0.15 Delay/Veh: 41.7 23.5 23.5 56.0 17.2 17.2 34.2 34.2 34.2 54.8 54.8 34.8 User DelAdj: 1.00 1.00 1.00 1.00 1.00 1.00 1.00 1.00 1.00 1.00 1.00 1.00 AdjDel/Veh: 41.7 23.5 23.5 56.0 17.2 17.2 34.2 34.2 34.2 54.8 54.8 34.8 LOS by Move: D C C E B B C C C D D C HCM2kAvgQ: 1 20 20 10 17 17 1 1 1 9 9 1 ********************************************************************************Note: Queue reported is the number of cars per lane.
Traffix 8.0.0715 (c) 2008 Dowling Assoc. Licensed to RK ENGINEERING GROUP

FORECAST YEAR (PM) Tue May 12, 2015 12:40:15 Page 2-1 -------------------------------------------------------------------------------- AGUA MANSA HIGH CUBE WAREHOUSE COUNTY OF SAN BERNARDINO FORECAST YEAR (2035) CONDITIONS -------------------------------------------------------------------------------- Level Of Service Computation Report 2000 HCM Operations Method (Future Volume Alternative) ********************************************************************************Intersection #1 CEDAR AVENUE (NS) AT EL RAVINO ROAD (EW) ********************************************************************************Cycle (sec): 130 Critical Vol./Cap.(X): 1.362Loss Time (sec): 8 Average Delay (sec/veh): 159.6Optimal Cycle: OPTIMIZED Level Of Service: F********************************************************************************Approach: North Bound South Bound East Bound West Bound Movement: L - T - R L - T - R L - T - R L - T - R ------------|---------------||---------------||---------------||---------------|Control: Protected Protected Permitted Permitted Rights: Include Include Include Include Min. Green: 10 0 0 10 23 23 10 14 14 10 24 24 Y+R: 4.0 4.0 4.0 4.0 4.0 4.0 4.0 4.0 4.0 4.0 4.0 4.0 Lanes: 1 0 1 1 0 1 0 1 1 0 0 0 1! 0 0 0 1 0 0 1 ------------|---------------||---------------||---------------||---------------|Volume Module:Base Vol: 10 1517 134 47 1199 12 13 10 20 172 18 69 Growth Adj: 1.00 1.00 1.00 1.00 1.00 1.00 1.00 1.00 1.00 1.00 1.00 1.00 Initial Bse: 10 1517 134 47 1199 12 13 10 20 172 18 69 Added Vol: 0 6 186 50 3 0 0 3 0 544 9 147 PasserByVol: 0 0 0 0 0 0 0 0 0 0 0 0 Initial Fut: 10 1523 320 97 1202 12 13 13 20 716 27 216 User Adj: 1.00 1.00 1.00 1.00 1.00 1.00 1.00 1.00 1.00 1.00 1.00 1.00 PHF Adj: 0.95 0.95 0.95 0.95 0.95 0.95 0.95 0.95 0.95 0.95 0.95 0.95 PHF Volume: 11 1603 337 102 1265 13 14 14 21 754 28 227 Reduct Vol: 0 0 0 0 0 0 0 0 0 0 0 0 Reduced Vol: 11 1603 337 102 1265 13 14 14 21 754 28 227 PCE Adj: 1.00 1.00 1.00 1.00 1.00 1.00 1.00 1.00 1.00 1.00 1.00 1.00 MLF Adj: 1.00 1.00 1.00 1.00 1.00 1.00 1.00 1.00 1.00 1.00 1.00 1.00 FinalVolume: 11 1603 337 102 1265 13 14 14 21 754 28 227 ------------|---------------||---------------||---------------||---------------|Saturation Flow Module:Sat/Lane: 1800 1800 1800 1800 1800 1800 1800 1800 1800 1800 1800 1800 Adjustment: 0.90 0.97 0.97 0.90 1.00 1.00 0.56 0.59 0.59 0.66 0.69 0.85 Lanes: 1.00 1.65 0.35 1.00 1.98 0.02 0.29 0.28 0.43 0.97 0.03 1.00 Final Sat.: 1615 2898 609 1615 3561 36 297 297 456 1139 43 1530 ------------|---------------||---------------||---------------||---------------|Capacity Analysis Module:Vol/Sat: 0.01 0.55 0.55 0.06 0.36 0.36 0.05 0.05 0.05 0.66 0.66 0.15 Crit Moves: **** **** **** Green/Cycle: 0.08 0.39 0.39 0.08 0.39 0.39 0.47 0.47 0.47 0.47 0.47 0.47 Volume/Cap: 0.08 1.41 1.41 0.82 0.92 0.92 0.10 0.10 0.10 1.41 1.41 0.32 Delay/Veh: 55.2 228 228.4 92.8 48.3 48.3 19.3 19.3 19.3 229.6 230 21.8 User DelAdj: 1.00 1.00 1.00 1.00 1.00 1.00 1.00 1.00 1.00 1.00 1.00 1.00 AdjDel/Veh: 55.2 228 228.4 92.8 48.3 48.3 19.3 19.3 19.3 229.6 230 21.8 LOS by Move: E F F F D D B B B F F C HCM2kAvgQ: 0 73 73 6 28 28 1 1 1 63 63 6 ********************************************************************************Note: Queue reported is the number of cars per lane.
Traffix 8.0.0715 (c) 2008 Dowling Assoc. Licensed to RK ENGINEERING GROUP

MITIG8 - FORECAST YEAR (AM)Tue May 12, 2015 15:25:04 Page 1-1 -------------------------------------------------------------------------------- AGUA MANSA HIGH CUBE WAREHOUSE COUNTY OF SAN BERNARDINO FORECAST YEAR (2035) CONDITIONS -------------------------------------------------------------------------------- Level Of Service Computation Report 2000 HCM Operations Method (Future Volume Alternative) ********************************************************************************Intersection #1 CEDAR AVENUE (NS) AT EL RAVINO ROAD (EW) ********************************************************************************Cycle (sec): 120 Critical Vol./Cap.(X): 0.703Loss Time (sec): 8 Average Delay (sec/veh): 23.2Optimal Cycle: OPTIMIZED Level Of Service: C********************************************************************************Approach: North Bound South Bound East Bound West Bound Movement: L - T - R L - T - R L - T - R L - T - R ------------|---------------||---------------||---------------||---------------|Control: Protected Protected Permitted Permitted Rights: Include Include Include Include Min. Green: 10 0 0 10 23 23 10 14 14 10 24 24 Y+R: 4.0 4.0 4.0 4.0 4.0 4.0 4.0 4.0 4.0 4.0 4.0 4.0 Lanes: 1 0 2 0 1 1 0 1 1 0 0 0 1! 0 0 1 1 0 0 1 ------------|---------------||---------------||---------------||---------------|Volume Module:Base Vol: 15 688 48 64 1304 9 5 2 9 67 3 14 Growth Adj: 1.00 1.00 1.00 1.00 1.00 1.00 1.00 1.00 1.00 1.00 1.00 1.00 Initial Bse: 15 688 48 64 1304 9 5 2 9 67 3 14 Added Vol: 0 2 575 155 6 0 0 10 0 125 2 34 PasserByVol: 0 0 0 0 0 0 0 0 0 0 0 0 Initial Fut: 15 690 623 219 1310 9 5 12 9 192 5 48 User Adj: 1.00 1.00 1.00 1.00 1.00 1.00 1.00 1.00 1.00 1.00 1.00 1.00 PHF Adj: 0.95 0.95 0.95 0.95 0.95 0.95 0.95 0.95 0.95 0.95 0.95 0.95 PHF Volume: 16 726 656 231 1379 9 5 13 9 202 5 51 Reduct Vol: 0 0 0 0 0 0 0 0 0 0 0 0 Reduced Vol: 16 726 656 231 1379 9 5 13 9 202 5 51 PCE Adj: 1.00 1.00 1.00 1.00 1.00 1.00 1.00 1.00 1.00 1.00 1.00 1.00 MLF Adj: 1.00 1.00 1.00 1.00 1.00 1.00 1.00 1.00 1.00 1.00 1.00 1.00 FinalVolume: 16 726 656 231 1379 9 5 13 9 202 5 51 ------------|---------------||---------------||---------------||---------------|Saturation Flow Module:Sat/Lane: 1800 1800 1800 1800 1800 1800 1800 1800 1800 1800 1800 1800 Adjustment: 0.90 1.00 0.85 0.90 1.00 1.00 0.87 0.93 0.93 0.68 0.72 0.85 Lanes: 1.00 2.00 1.00 1.00 1.99 0.01 0.20 0.46 0.34 1.95 0.05 1.00 Final Sat.: 1615 3600 1530 1615 3572 25 317 760 570 2396 62 1530 ------------|---------------||---------------||---------------||---------------|Capacity Analysis Module:Vol/Sat: 0.01 0.20 0.43 0.14 0.39 0.39 0.02 0.02 0.02 0.08 0.08 0.03 Crit Moves: **** **** **** Green/Cycle: 0.13 0.55 0.55 0.18 0.60 0.60 0.20 0.20 0.20 0.20 0.20 0.20 Volume/Cap: 0.08 0.37 0.78 0.78 0.64 0.64 0.08 0.08 0.08 0.42 0.42 0.17 Delay/Veh: 46.0 15.3 25.9 59.1 16.0 16.0 39.2 39.2 39.2 42.5 42.5 40.0 User DelAdj: 1.00 1.00 1.00 1.00 1.00 1.00 1.00 1.00 1.00 1.00 1.00 1.00 AdjDel/Veh: 46.0 15.3 25.9 59.1 16.0 16.0 39.2 39.2 39.2 42.5 42.5 40.0 LOS by Move: D B C E B B D D D D D D HCM2kAvgQ: 1 7 20 10 17 17 1 1 1 4 4 2 ********************************************************************************Note: Queue reported is the number of cars per lane.
Traffix 8.0.0715 (c) 2008 Dowling Assoc. Licensed to RK ENGINEERING GROUP

MITIG8 - FORECAST YEAR (PM)Tue May 12, 2015 15:22:43 Page 1-1 -------------------------------------------------------------------------------- AGUA MANSA HIGH CUBE WAREHOUSE COUNTY OF SAN BERNARDINO FORECAST YEAR (2035) CONDITIONS -------------------------------------------------------------------------------- Level Of Service Computation Report 2000 HCM Operations Method (Future Volume Alternative) ********************************************************************************Intersection #1 CEDAR AVENUE (NS) AT EL RAVINO ROAD (EW) ********************************************************************************Cycle (sec): 100 Critical Vol./Cap.(X): 0.904Loss Time (sec): 8 Average Delay (sec/veh): 33.6Optimal Cycle: OPTIMIZED Level Of Service: C********************************************************************************Approach: North Bound South Bound East Bound West Bound Movement: L - T - R L - T - R L - T - R L - T - R ------------|---------------||---------------||---------------||---------------|Control: Protected Protected Permitted Permitted Rights: Include Include Include Include Min. Green: 10 0 0 10 23 23 10 14 14 10 24 24 Y+R: 4.0 4.0 4.0 4.0 4.0 4.0 4.0 4.0 4.0 4.0 4.0 4.0 Lanes: 1 0 2 0 1 1 0 1 1 0 0 0 1! 0 0 1 1 0 0 1 ------------|---------------||---------------||---------------||---------------|Volume Module:Base Vol: 10 1517 134 47 1199 12 13 10 20 172 18 69 Growth Adj: 1.00 1.00 1.00 1.00 1.00 1.00 1.00 1.00 1.00 1.00 1.00 1.00 Initial Bse: 10 1517 134 47 1199 12 13 10 20 172 18 69 Added Vol: 0 6 186 50 3 0 0 3 0 544 9 147 PasserByVol: 0 0 0 0 0 0 0 0 0 0 0 0 Initial Fut: 10 1523 320 97 1202 12 13 13 20 716 27 216 User Adj: 1.00 1.00 1.00 1.00 1.00 1.00 1.00 1.00 1.00 1.00 1.00 1.00 PHF Adj: 0.95 0.95 0.95 0.95 0.95 0.95 0.95 0.95 0.95 0.95 0.95 0.95 PHF Volume: 11 1603 337 102 1265 13 14 14 21 754 28 227 Reduct Vol: 0 0 0 0 0 0 0 0 0 0 0 0 Reduced Vol: 11 1603 337 102 1265 13 14 14 21 754 28 227 PCE Adj: 1.00 1.00 1.00 1.00 1.00 1.00 1.00 1.00 1.00 1.00 1.00 1.00 MLF Adj: 1.00 1.00 1.00 1.00 1.00 1.00 1.00 1.00 1.00 1.00 1.00 1.00 FinalVolume: 11 1603 337 102 1265 13 14 14 21 754 28 227 ------------|---------------||---------------||---------------||---------------|Saturation Flow Module:Sat/Lane: 1800 1800 1800 1800 1800 1800 1800 1800 1800 1800 1800 1800 Adjustment: 0.90 1.00 0.85 0.90 1.00 1.00 0.84 0.89 0.89 0.67 0.71 0.85 Lanes: 1.00 2.00 1.00 1.00 1.98 0.02 0.29 0.28 0.43 1.93 0.07 1.00 Final Sat.: 1615 3600 1530 1615 3561 36 446 446 687 2331 88 1530 ------------|---------------||---------------||---------------||---------------|Capacity Analysis Module:Vol/Sat: 0.01 0.45 0.22 0.06 0.36 0.36 0.03 0.03 0.03 0.32 0.32 0.15 Crit Moves: **** **** **** Green/Cycle: 0.13 0.48 0.48 0.10 0.45 0.45 0.34 0.34 0.34 0.34 0.34 0.34 Volume/Cap: 0.05 0.94 0.46 0.63 0.79 0.79 0.09 0.09 0.09 0.94 0.94 0.43 Delay/Veh: 38.5 35.2 18.1 51.1 26.3 26.3 22.2 22.2 22.2 49.5 49.5 25.8 User DelAdj: 1.00 1.00 1.00 1.00 1.00 1.00 1.00 1.00 1.00 1.00 1.00 1.00 AdjDel/Veh: 38.5 35.2 18.1 51.1 26.3 26.3 22.2 22.2 22.2 49.5 49.5 25.8 LOS by Move: D D B D C C C C C D D C HCM2kAvgQ: 0 28 7 4 18 18 1 1 1 17 17 6 ********************************************************************************Note: Queue reported is the number of cars per lane.
Traffix 8.0.0715 (c) 2008 Dowling Assoc. Licensed to RK ENGINEERING GROUP

FORECAST YEAR (AM) Tue May 12, 2015 12:37:55 Page 3-1 -------------------------------------------------------------------------------- AGUA MANSA HIGH CUBE WAREHOUSE COUNTY OF SAN BERNARDINO FORECAST YEAR (2035) CONDITIONS -------------------------------------------------------------------------------- Level Of Service Computation Report 2000 HCM Operations Method (Future Volume Alternative) ********************************************************************************Intersection #2 CACTUS AVENUE (NS) AT EL RAVINO ROAD (EW) ********************************************************************************Cycle (sec): 70 Critical Vol./Cap.(X): 0.582Loss Time (sec): 8 Average Delay (sec/veh): 20.2Optimal Cycle: OPTIMIZED Level Of Service: C********************************************************************************Approach: North Bound South Bound East Bound West Bound Movement: L - T - R L - T - R L - T - R L - T - R ------------|---------------||---------------||---------------||---------------|Control: Protected Protected Protected Permitted Rights: Include Include Include Include Min. Green: 0 0 0 10 0 0 10 0 0 0 0 0 Y+R: 4.0 4.0 4.0 4.0 4.0 4.0 4.0 4.0 4.0 4.0 4.0 4.0 Lanes: 0 0 0 0 0 1 0 0 0 1 0 1 0 0 0 0 0 0 1 0 ------------|---------------||---------------||---------------||---------------|Volume Module:Base Vol: 0 0 0 127 0 8 16 91 0 0 23 2 Growth Adj: 1.00 1.00 1.00 1.00 1.00 1.00 1.00 1.00 1.00 1.00 1.00 1.00 Initial Bse: 0 0 0 127 0 8 16 91 0 0 23 2 Added Vol: 0 0 0 12 0 216 143 47 0 0 217 54 PasserByVol: 0 0 0 0 0 0 0 0 0 0 0 0 Initial Fut: 0 0 0 139 0 224 159 138 0 0 240 56 User Adj: 1.00 1.00 1.00 1.00 1.00 1.00 1.00 1.00 1.00 1.00 1.00 1.00 PHF Adj: 0.95 0.95 0.95 0.95 0.95 0.95 0.95 0.95 0.95 0.95 0.95 0.95 PHF Volume: 0 0 0 146 0 236 167 145 0 0 253 59 Reduct Vol: 0 0 0 0 0 0 0 0 0 0 0 0 Reduced Vol: 0 0 0 146 0 236 167 145 0 0 253 59 PCE Adj: 1.00 1.00 1.00 1.00 1.00 1.00 1.00 1.00 1.00 1.00 1.00 1.00 MLF Adj: 1.00 1.00 1.00 1.00 1.00 1.00 1.00 1.00 1.00 1.00 1.00 1.00 FinalVolume: 0 0 0 146 0 236 167 145 0 0 253 59 ------------|---------------||---------------||---------------||---------------|Saturation Flow Module:Sat/Lane: 1800 1800 1800 1800 1800 1800 1800 1800 1800 1800 1800 1800 Adjustment: 0.94 1.00 1.00 0.90 1.00 0.85 0.92 0.97 1.00 0.94 0.97 0.97 Lanes: 0.00 0.00 0.00 1.00 0.00 1.00 0.55 0.45 0.00 0.00 0.81 0.19 Final Sat.: 0 0 0 1615 0 1530 910 790 0 0 1422 332 ------------|---------------||---------------||---------------||---------------|Capacity Analysis Module:Vol/Sat: 0.00 0.00 0.00 0.09 0.00 0.15 0.18 0.18 0.00 0.00 0.18 0.18 Crit Moves: **** **** **** Green/Cycle: 0.00 0.00 0.00 0.26 0.00 0.26 0.32 0.62 0.00 0.00 0.31 0.31 Volume/Cap: 0.00 0.00 0.00 0.34 0.00 0.58 0.58 0.30 0.00 0.00 0.58 0.58 Delay/Veh: 0.0 0.0 0.0 21.3 0.0 24.5 21.7 6.3 0.0 0.0 22.2 22.2 User DelAdj: 1.00 1.00 1.00 1.00 1.00 1.00 1.00 1.00 1.00 1.00 1.00 1.00 AdjDel/Veh: 0.0 0.0 0.0 21.3 0.0 24.5 21.7 6.3 0.0 0.0 22.2 22.2 LOS by Move: A A A C A C C A A A C C HCM2kAvgQ: 0 0 0 3 0 5 4 2 0 0 6 6 ********************************************************************************Note: Queue reported is the number of cars per lane.
Traffix 8.0.0715 (c) 2008 Dowling Assoc. Licensed to RK ENGINEERING GROUP

FORECAST YEAR (PM) Tue May 12, 2015 12:40:15 Page 3-1 -------------------------------------------------------------------------------- AGUA MANSA HIGH CUBE WAREHOUSE COUNTY OF SAN BERNARDINO FORECAST YEAR (2035) CONDITIONS -------------------------------------------------------------------------------- Level Of Service Computation Report 2000 HCM Operations Method (Future Volume Alternative) ********************************************************************************Intersection #2 CACTUS AVENUE (NS) AT EL RAVINO ROAD (EW) ********************************************************************************Cycle (sec): 70 Critical Vol./Cap.(X): 0.926Loss Time (sec): 8 Average Delay (sec/veh): 37.0Optimal Cycle: OPTIMIZED Level Of Service: D********************************************************************************Approach: North Bound South Bound East Bound West Bound Movement: L - T - R L - T - R L - T - R L - T - R ------------|---------------||---------------||---------------||---------------|Control: Protected Protected Protected Permitted Rights: Include Include Include Include Min. Green: 0 0 0 10 0 0 10 0 0 0 0 0 Y+R: 4.0 4.0 4.0 4.0 4.0 4.0 4.0 4.0 4.0 4.0 4.0 4.0 Lanes: 0 0 0 0 0 1 0 0 0 1 0 1 0 0 0 0 0 0 1 0 ------------|---------------||---------------||---------------||---------------|Volume Module:Base Vol: 0 0 0 50 0 54 38 104 0 0 181 194 Growth Adj: 1.00 1.00 1.00 1.00 1.00 1.00 1.00 1.00 1.00 1.00 1.00 1.00 Initial Bse: 0 0 0 50 0 54 38 104 0 0 181 194 Added Vol: 0 0 0 51 0 186 247 206 0 0 70 18 PasserByVol: 0 0 0 0 0 0 0 0 0 0 0 0 Initial Fut: 0 0 0 101 0 240 285 310 0 0 251 212 User Adj: 1.00 1.00 1.00 1.00 1.00 1.00 1.00 1.00 1.00 1.00 1.00 1.00 PHF Adj: 0.95 0.95 0.95 0.95 0.95 0.95 0.95 0.95 0.95 0.95 0.95 0.95 PHF Volume: 0 0 0 106 0 253 300 326 0 0 264 223 Reduct Vol: 0 0 0 0 0 0 0 0 0 0 0 0 Reduced Vol: 0 0 0 106 0 253 300 326 0 0 264 223 PCE Adj: 1.00 1.00 1.00 1.00 1.00 1.00 1.00 1.00 1.00 1.00 1.00 1.00 MLF Adj: 1.00 1.00 1.00 1.00 1.00 1.00 1.00 1.00 1.00 1.00 1.00 1.00 FinalVolume: 0 0 0 106 0 253 300 326 0 0 264 223 ------------|---------------||---------------||---------------||---------------|Saturation Flow Module:Sat/Lane: 1800 1800 1800 1800 1800 1800 1800 1800 1800 1800 1800 1800 Adjustment: 0.94 1.00 1.00 0.90 1.00 0.85 0.92 0.98 1.00 0.94 0.94 0.94 Lanes: 0.00 0.00 0.00 1.00 0.00 1.00 0.49 0.51 0.00 0.00 0.54 0.46 Final Sat.: 0 0 0 1615 0 1530 819 891 0 0 915 773 ------------|---------------||---------------||---------------||---------------|Capacity Analysis Module:Vol/Sat: 0.00 0.00 0.00 0.07 0.00 0.17 0.37 0.37 0.00 0.00 0.29 0.29 Crit Moves: **** **** **** Green/Cycle: 0.00 0.00 0.00 0.18 0.00 0.18 0.40 0.71 0.00 0.00 0.31 0.31 Volume/Cap: 0.00 0.00 0.00 0.37 0.00 0.93 0.93 0.52 0.00 0.00 0.93 0.93 Delay/Veh: 0.0 0.0 0.0 26.1 0.0 63.5 38.9 5.1 0.0 0.0 45.8 45.8 User DelAdj: 1.00 1.00 1.00 1.00 1.00 1.00 1.00 1.00 1.00 1.00 1.00 1.00 AdjDel/Veh: 0.0 0.0 0.0 26.1 0.0 63.5 38.9 5.1 0.0 0.0 45.8 45.8 LOS by Move: A A A C A E D A A A D D HCM2kAvgQ: 0 0 0 2 0 9 10 4 0 0 15 15 ********************************************************************************Note: Queue reported is the number of cars per lane.
Traffix 8.0.0715 (c) 2008 Dowling Assoc. Licensed to RK ENGINEERING GROUP

FORECAST YEAR (AM) Tue May 12, 2015 12:37:55 Page 4-1 -------------------------------------------------------------------------------- AGUA MANSA HIGH CUBE WAREHOUSE COUNTY OF SAN BERNARDINO FORECAST YEAR (2035) CONDITIONS -------------------------------------------------------------------------------- Level Of Service Computation Report 2000 HCM Unsignalized Method (Future Volume Alternative) ********************************************************************************Intersection #3 HALL AVENUE (NS) AT EL RAVINO ROAD (EW) ********************************************************************************Average Delay (sec/veh): 1.1 Worst Case Level Of Service: B[ 12.9]********************************************************************************Approach: North Bound South Bound East Bound West Bound Movement: L - T - R L - T - R L - T - R L - T - R ------------|---------------||---------------||---------------||---------------|Control: Stop Sign Stop Sign Uncontrolled UncontrolledRights: Include Include Include Include Lanes: 0 0 1! 0 0 0 0 1! 0 0 0 0 1! 0 0 0 0 1! 0 0 ------------|---------------||---------------||---------------||---------------|Volume Module:Base Vol: 4 2 20 18 5 6 6 59 159 2 22 5 Growth Adj: 1.00 1.00 1.00 1.00 1.00 1.00 1.00 1.00 1.00 1.00 1.00 1.00 Initial Bse: 4 2 20 18 5 6 6 59 159 2 22 5 Added Vol: 0 0 0 0 0 0 0 59 0 0 272 0 PasserByVol: 0 0 0 0 0 0 0 0 0 0 0 0 Initial Fut: 4 2 20 18 5 6 6 118 159 2 294 5 User Adj: 1.00 1.00 1.00 1.00 1.00 1.00 1.00 1.00 1.00 1.00 1.00 1.00 PHF Adj: 1.00 1.00 1.00 1.00 1.00 1.00 1.00 1.00 1.00 1.00 1.00 1.00 PHF Volume: 4 2 20 18 5 6 6 118 159 2 294 5 Reduct Vol: 0 0 0 0 0 0 0 0 0 0 0 0 FinalVolume: 4 2 20 18 5 6 6 118 159 2 294 5 ------------|---------------||---------------||---------------||---------------|Critical Gap Module:Critical Gp: 7.1 6.5 6.2 7.1 6.5 6.2 4.1 xxxx xxxxx 4.1 xxxx xxxxx FollowUpTim: 3.5 4.0 3.3 3.5 4.0 3.3 2.2 xxxx xxxxx 2.2 xxxx xxxxx ------------|---------------||---------------||---------------||---------------|Capacity Module:Cnflict Vol: 516 513 198 521 590 297 299 xxxx xxxxx 277 xxxx xxxxx Potent Cap.: 473 468 849 469 423 748 1274 xxxx xxxxx 1298 xxxx xxxxx Move Cap.: 463 465 849 454 420 748 1274 xxxx xxxxx 1298 xxxx xxxxx Volume/Cap: 0.01 0.00 0.02 0.04 0.01 0.01 0.00 xxxx xxxx 0.00 xxxx xxxx ------------|---------------||---------------||---------------||---------------|Level Of Service Module:2Way95thQ: xxxx xxxx xxxxx xxxx xxxx xxxxx 0.0 xxxx xxxxx 0.0 xxxx xxxxx Control Del:xxxxx xxxx xxxxx xxxxx xxxx xxxxx 7.8 xxxx xxxxx 7.8 xxxx xxxxx LOS by Move: * * * * * * A * * A * * Movement: LT - LTR - RT LT - LTR - RT LT - LTR - RT LT - LTR - RT Shared Cap.: xxxx 712 xxxxx xxxx 487 xxxxx xxxx xxxx xxxxx xxxx xxxx xxxxx SharedQueue:xxxxx 0.1 xxxxx xxxxx 0.2 xxxxx xxxxx xxxx xxxxx xxxxx xxxx xxxxx Shrd ConDel:xxxxx 10.2 xxxxx xxxxx 12.9 xxxxx xxxxx xxxx xxxxx xxxxx xxxx xxxxx Shared LOS: * B * * B * * * * * * * ApproachDel: 10.2 12.9 xxxxxx xxxxxxApproachLOS: B B * * ********************************************************************************Note: Queue reported is the number of cars per lane.********************************************************************************
Traffix 8.0.0715 (c) 2008 Dowling Assoc. Licensed to RK ENGINEERING GROUP

FORECAST YEAR (PM) Tue May 12, 2015 12:40:15 Page 4-1 -------------------------------------------------------------------------------- AGUA MANSA HIGH CUBE WAREHOUSE COUNTY OF SAN BERNARDINO FORECAST YEAR (2035) CONDITIONS -------------------------------------------------------------------------------- Level Of Service Computation Report 2000 HCM Unsignalized Method (Future Volume Alternative) ********************************************************************************Intersection #3 HALL AVENUE (NS) AT EL RAVINO ROAD (EW) ********************************************************************************Average Delay (sec/veh): 11.0 Worst Case Level Of Service: D[ 33.6]********************************************************************************Approach: North Bound South Bound East Bound West Bound Movement: L - T - R L - T - R L - T - R L - T - R ------------|---------------||---------------||---------------||---------------|Control: Stop Sign Stop Sign Uncontrolled UncontrolledRights: Include Include Include Include Lanes: 0 0 1! 0 0 0 0 1! 0 0 0 0 1! 0 0 0 0 0 1 0 ------------|---------------||---------------||---------------||---------------|Volume Module:Base Vol: 230 6 85 13 6 2 8 85 69 0 145 21 Growth Adj: 1.00 1.00 1.00 1.00 1.00 1.00 1.00 1.00 1.00 1.00 1.00 1.00 Initial Bse: 230 6 85 13 6 2 8 85 69 0 145 21 Added Vol: 0 0 0 0 0 0 0 257 0 0 88 0 PasserByVol: 0 0 0 0 0 0 0 0 0 0 0 0 Initial Fut: 230 6 85 13 6 2 8 342 69 0 233 21 User Adj: 1.00 1.00 1.00 1.00 1.00 1.00 1.00 1.00 1.00 1.00 1.00 1.00 PHF Adj: 1.00 1.00 1.00 1.00 1.00 1.00 1.00 1.00 1.00 1.00 1.00 1.00 PHF Volume: 230 6 85 13 6 2 8 342 69 0 233 21 Reduct Vol: 0 0 0 0 0 0 0 0 0 0 0 0 FinalVolume: 230 6 85 13 6 2 8 342 69 0 233 21 ------------|---------------||---------------||---------------||---------------|Critical Gap Module:Critical Gp: 7.1 6.5 6.2 7.1 6.5 6.2 4.1 xxxx xxxxx xxxxx xxxx xxxxx FollowUpTim: 3.5 4.0 3.3 3.5 4.0 3.3 2.2 xxxx xxxxx xxxxx xxxx xxxxx ------------|---------------||---------------||---------------||---------------|Capacity Module:Cnflict Vol: 640 647 377 682 671 244 254 xxxx xxxxx xxxx xxxx xxxxx Potent Cap.: 391 393 674 367 380 800 1323 xxxx xxxxx xxxx xxxx xxxxx Move Cap.: 384 390 674 315 378 800 1323 xxxx xxxxx xxxx xxxx xxxxx Volume/Cap: 0.60 0.02 0.13 0.04 0.02 0.00 0.01 xxxx xxxx xxxx xxxx xxxx ------------|---------------||---------------||---------------||---------------|Level Of Service Module:2Way95thQ: xxxx xxxx xxxxx xxxx xxxx xxxxx 0.0 xxxx xxxxx xxxx xxxx xxxxx Control Del:xxxxx xxxx xxxxx xxxxx xxxx xxxxx 7.7 xxxx xxxxx xxxxx xxxx xxxxx LOS by Move: * * * * * * A * * * * * Movement: LT - LTR - RT LT - LTR - RT LT - LTR - RT LT - LTR - RT Shared Cap.: xxxx 433 xxxxx xxxx 352 xxxxx xxxx xxxx xxxxx xxxx xxxx xxxxx SharedQueue:xxxxx 6.0 xxxxx xxxxx 0.2 xxxxx xxxxx xxxx xxxxx xxxxx xxxx xxxxx Shrd ConDel:xxxxx 33.6 xxxxx xxxxx 15.9 xxxxx xxxxx xxxx xxxxx xxxxx xxxx xxxxx Shared LOS: * D * * C * * * * * * * ApproachDel: 33.6 15.9 xxxxxx xxxxxxApproachLOS: D C * * ********************************************************************************Note: Queue reported is the number of cars per lane.********************************************************************************
Traffix 8.0.0715 (c) 2008 Dowling Assoc. Licensed to RK ENGINEERING GROUP

FORECAST YEAR (AM) Tue May 12, 2015 12:37:55 Page 5-1 -------------------------------------------------------------------------------- AGUA MANSA HIGH CUBE WAREHOUSE COUNTY OF SAN BERNARDINO FORECAST YEAR (2035) CONDITIONS -------------------------------------------------------------------------------- Level Of Service Computation Report 2000 HCM Unsignalized Method (Future Volume Alternative) ********************************************************************************Intersection #4 KININGHAM DRIVE (NS) AT EL RAVINO ROAD (EW) ********************************************************************************Average Delay (sec/veh): 0.2 Worst Case Level Of Service: B[ 11.7]********************************************************************************Approach: North Bound South Bound East Bound West Bound Movement: L - T - R L - T - R L - T - R L - T - R ------------|---------------||---------------||---------------||---------------|Control: Stop Sign Stop Sign Uncontrolled UncontrolledRights: Include Include Include Include Lanes: 0 0 0 0 0 0 0 1! 0 0 0 1 0 0 0 0 0 0 1 0 ------------|---------------||---------------||---------------||---------------|Volume Module:Base Vol: 0 0 0 3 0 2 5 128 0 0 110 2 Growth Adj: 1.00 1.00 1.00 1.00 1.00 1.00 1.00 1.00 1.00 1.00 1.00 1.00 Initial Bse: 0 0 0 3 0 2 5 128 0 0 110 2 Added Vol: 0 0 0 0 0 0 0 59 0 0 272 0 PasserByVol: 0 0 0 0 0 0 0 0 0 0 0 0 Initial Fut: 0 0 0 3 0 2 5 187 0 0 382 2 User Adj: 1.00 1.00 1.00 1.00 1.00 1.00 1.00 1.00 1.00 1.00 1.00 1.00 PHF Adj: 1.00 1.00 1.00 1.00 1.00 1.00 1.00 1.00 1.00 1.00 1.00 1.00 PHF Volume: 0 0 0 3 0 2 5 187 0 0 382 2 Reduct Vol: 0 0 0 0 0 0 0 0 0 0 0 0 FinalVolume: 0 0 0 3 0 2 5 187 0 0 382 2 ------------|---------------||---------------||---------------||---------------|Critical Gap Module:Critical Gp:xxxxx xxxx xxxxx 6.4 6.5 6.2 4.1 xxxx xxxxx xxxxx xxxx xxxxx FollowUpTim:xxxxx xxxx xxxxx 3.5 4.0 3.3 2.2 xxxx xxxxx xxxxx xxxx xxxxx ------------|---------------||---------------||---------------||---------------|Capacity Module:Cnflict Vol: xxxx xxxx xxxxx 580 580 383 384 xxxx xxxxx xxxx xxxx xxxxx Potent Cap.: xxxx xxxx xxxxx 480 428 669 1186 xxxx xxxxx xxxx xxxx xxxxx Move Cap.: xxxx xxxx xxxxx 478 427 669 1186 xxxx xxxxx xxxx xxxx xxxxx Volume/Cap: xxxx xxxx xxxx 0.01 0.00 0.00 0.00 xxxx xxxx xxxx xxxx xxxx ------------|---------------||---------------||---------------||---------------|Level Of Service Module:2Way95thQ: xxxx xxxx xxxxx xxxx xxxx xxxxx 0.0 xxxx xxxxx xxxx xxxx xxxxx Control Del:xxxxx xxxx xxxxx xxxxx xxxx xxxxx 8.0 xxxx xxxxx xxxxx xxxx xxxxx LOS by Move: * * * * * * A * * * * * Movement: LT - LTR - RT LT - LTR - RT LT - LTR - RT LT - LTR - RT Shared Cap.: xxxx xxxx xxxxx xxxx 540 xxxxx xxxx xxxx xxxxx xxxx xxxx xxxxx SharedQueue:xxxxx xxxx xxxxx xxxxx 0.0 xxxxx 0.0 xxxx xxxxx xxxxx xxxx xxxxx Shrd ConDel:xxxxx xxxx xxxxx xxxxx 11.7 xxxxx 8.0 xxxx xxxxx xxxxx xxxx xxxxx Shared LOS: * * * * B * A * * * * * ApproachDel: xxxxxx 11.7 xxxxxx xxxxxxApproachLOS: * B * * ********************************************************************************Note: Queue reported is the number of cars per lane.********************************************************************************
Traffix 8.0.0715 (c) 2008 Dowling Assoc. Licensed to RK ENGINEERING GROUP

FORECAST YEAR (PM) Tue May 12, 2015 12:40:15 Page 5-1 -------------------------------------------------------------------------------- AGUA MANSA HIGH CUBE WAREHOUSE COUNTY OF SAN BERNARDINO FORECAST YEAR (2035) CONDITIONS -------------------------------------------------------------------------------- Level Of Service Computation Report 2000 HCM Unsignalized Method (Future Volume Alternative) ********************************************************************************Intersection #4 KININGHAM DRIVE (NS) AT EL RAVINO ROAD (EW) ********************************************************************************Average Delay (sec/veh): 0.5 Worst Case Level Of Service: B[ 10.3]********************************************************************************Approach: North Bound South Bound East Bound West Bound Movement: L - T - R L - T - R L - T - R L - T - R ------------|---------------||---------------||---------------||---------------|Control: Stop Sign Stop Sign Uncontrolled UncontrolledRights: Include Include Include Include Lanes: 0 0 0 0 0 0 0 1! 0 0 0 1 0 0 0 0 0 0 1 0 ------------|---------------||---------------||---------------||---------------|Volume Module:Base Vol: 0 0 0 3 0 13 18 137 0 0 133 15 Growth Adj: 1.00 1.00 1.00 1.00 1.00 1.00 1.00 1.00 1.00 1.00 1.00 1.00 Initial Bse: 0 0 0 3 0 13 18 137 0 0 133 15 Added Vol: 0 0 0 0 0 0 0 257 0 0 88 0 PasserByVol: 0 0 0 0 0 0 0 0 0 0 0 0 Initial Fut: 0 0 0 3 0 13 18 394 0 0 221 15 User Adj: 1.00 1.00 1.00 1.00 1.00 1.00 1.00 1.00 1.00 1.00 1.00 1.00 PHF Adj: 1.00 1.00 1.00 1.00 1.00 1.00 1.00 1.00 1.00 1.00 1.00 1.00 PHF Volume: 0 0 0 3 0 13 18 394 0 0 221 15 Reduct Vol: 0 0 0 0 0 0 0 0 0 0 0 0 FinalVolume: 0 0 0 3 0 13 18 394 0 0 221 15 ------------|---------------||---------------||---------------||---------------|Critical Gap Module:Critical Gp:xxxxx xxxx xxxxx 6.4 6.5 6.2 4.1 xxxx xxxxx xxxxx xxxx xxxxx FollowUpTim:xxxxx xxxx xxxxx 3.5 4.0 3.3 2.2 xxxx xxxxx xxxxx xxxx xxxxx ------------|---------------||---------------||---------------||---------------|Capacity Module:Cnflict Vol: xxxx xxxx xxxxx 659 659 229 236 xxxx xxxxx xxxx xxxx xxxxx Potent Cap.: xxxx xxxx xxxxx 432 386 816 1343 xxxx xxxxx xxxx xxxx xxxxx Move Cap.: xxxx xxxx xxxxx 428 381 816 1343 xxxx xxxxx xxxx xxxx xxxxx Volume/Cap: xxxx xxxx xxxx 0.01 0.00 0.02 0.01 xxxx xxxx xxxx xxxx xxxx ------------|---------------||---------------||---------------||---------------|Level Of Service Module:2Way95thQ: xxxx xxxx xxxxx xxxx xxxx xxxxx 0.0 xxxx xxxxx xxxx xxxx xxxxx Control Del:xxxxx xxxx xxxxx xxxxx xxxx xxxxx 7.7 xxxx xxxxx xxxxx xxxx xxxxx LOS by Move: * * * * * * A * * * * * Movement: LT - LTR - RT LT - LTR - RT LT - LTR - RT LT - LTR - RT Shared Cap.: xxxx xxxx xxxxx xxxx 697 xxxxx xxxx xxxx xxxxx xxxx xxxx xxxxx SharedQueue:xxxxx xxxx xxxxx xxxxx 0.1 xxxxx 0.0 xxxx xxxxx xxxxx xxxx xxxxx Shrd ConDel:xxxxx xxxx xxxxx xxxxx 10.3 xxxxx 7.7 xxxx xxxxx xxxxx xxxx xxxxx Shared LOS: * * * * B * A * * * * * ApproachDel: xxxxxx 10.3 xxxxxx xxxxxxApproachLOS: * B * * ********************************************************************************Note: Queue reported is the number of cars per lane.********************************************************************************
Traffix 8.0.0715 (c) 2008 Dowling Assoc. Licensed to RK ENGINEERING GROUP

FORECAST YEAR (AM) Tue May 12, 2015 12:37:55 Page 6-1 -------------------------------------------------------------------------------- AGUA MANSA HIGH CUBE WAREHOUSE COUNTY OF SAN BERNARDINO FORECAST YEAR (2035) CONDITIONS -------------------------------------------------------------------------------- Level Of Service Computation Report 2000 HCM Unsignalized Method (Future Volume Alternative) ********************************************************************************Intersection #5 AGUA MANSA ROAD (NS) AT EL RAVINO ROAD (EW) ********************************************************************************Average Delay (sec/veh): 7.1 Worst Case Level Of Service: F[127.1]********************************************************************************Approach: North Bound South Bound East Bound West Bound Movement: L - T - R L - T - R L - T - R L - T - R ------------|---------------||---------------||---------------||---------------|Control: Uncontrolled Uncontrolled Stop Sign Stop Sign Rights: Include Include Ignore Include Lanes: 1 0 1 0 0 0 0 0 1 0 1 0 0 0 1 0 0 0 0 0 ------------|---------------||---------------||---------------||---------------|Volume Module:Base Vol: 2 401 0 0 849 21 50 0 10 0 0 0 Growth Adj: 1.00 1.00 1.00 1.00 1.00 1.00 1.00 1.00 1.00 1.00 1.00 1.00 Initial Bse: 2 401 0 0 849 21 50 0 10 0 0 0 Added Vol: 136 6 0 0 17 135 29 0 30 0 0 0 PasserByVol: 0 0 0 0 0 0 0 0 0 0 0 0 Initial Fut: 138 407 0 0 866 156 79 0 40 0 0 0 User Adj: 1.00 1.00 1.00 1.00 1.00 1.00 1.00 1.00 0.00 1.00 1.00 1.00 PHF Adj: 1.00 1.00 1.00 1.00 1.00 1.00 1.00 1.00 0.00 1.00 1.00 1.00 PHF Volume: 138 407 0 0 866 156 79 0 0 0 0 0 Reduct Vol: 0 0 0 0 0 0 0 0 0 0 0 0 FinalVolume: 138 407 0 0 866 156 79 0 0 0 0 0 ------------|---------------||---------------||---------------||---------------|Critical Gap Module:Critical Gp: 4.1 xxxx xxxxx xxxxx xxxx xxxxx 6.4 xxxx 6.2 xxxxx xxxx xxxxx FollowUpTim: 2.2 xxxx xxxxx xxxxx xxxx xxxxx 3.5 xxxx 3.3 xxxxx xxxx xxxxx ------------|---------------||---------------||---------------||---------------|Capacity Module:Cnflict Vol: 1022 xxxx xxxxx xxxx xxxx xxxxx 1627 xxxx 944 xxxx xxxx xxxxx Potent Cap.: 687 xxxx xxxxx xxxx xxxx xxxxx 114 xxxx 321 xxxx xxxx xxxxx Move Cap.: 687 xxxx xxxxx xxxx xxxx xxxxx 96 xxxx 321 xxxx xxxx xxxxx Volume/Cap: 0.20 xxxx xxxx xxxx xxxx xxxx 0.82 xxxx 0.00 xxxx xxxx xxxx ------------|---------------||---------------||---------------||---------------|Level Of Service Module:2Way95thQ: 0.7 xxxx xxxxx xxxx xxxx xxxxx 4.5 xxxx xxxxx xxxx xxxx xxxxx Control Del: 11.6 xxxx xxxxx xxxxx xxxx xxxxx 127.1 xxxx xxxxx xxxxx xxxx xxxxx LOS by Move: B * * * * * F * * * * * Movement: LT - LTR - RT LT - LTR - RT LT - LTR - RT LT - LTR - RT Shared Cap.: xxxx xxxx xxxxx xxxx xxxx xxxxx xxxx xxxx xxxxx xxxx xxxx xxxxx SharedQueue:xxxxx xxxx xxxxx xxxxx xxxx xxxxx xxxxx xxxx xxxxx xxxxx xxxx xxxxx Shrd ConDel:xxxxx xxxx xxxxx xxxxx xxxx xxxxx xxxxx xxxx xxxxx xxxxx xxxx xxxxx Shared LOS: * * * * * * * * * * * * ApproachDel: xxxxxx xxxxxx 127.1 xxxxxxApproachLOS: * * F * ********************************************************************************Note: Queue reported is the number of cars per lane.********************************************************************************
Traffix 8.0.0715 (c) 2008 Dowling Assoc. Licensed to RK ENGINEERING GROUP

FORECAST YEAR (PM) Tue May 12, 2015 12:40:15 Page 6-1 -------------------------------------------------------------------------------- AGUA MANSA HIGH CUBE WAREHOUSE COUNTY OF SAN BERNARDINO FORECAST YEAR (2035) CONDITIONS -------------------------------------------------------------------------------- Level Of Service Computation Report 2000 HCM Unsignalized Method (Future Volume Alternative) ********************************************************************************Intersection #5 AGUA MANSA ROAD (NS) AT EL RAVINO ROAD (EW) ********************************************************************************Average Delay (sec/veh): 197.7 Worst Case Level Of Service: F[1477.2]********************************************************************************Approach: North Bound South Bound East Bound West Bound Movement: L - T - R L - T - R L - T - R L - T - R ------------|---------------||---------------||---------------||---------------|Control: Uncontrolled Uncontrolled Stop Sign Stop Sign Rights: Include Include Ignore Include Lanes: 1 0 1 0 0 0 0 0 1 0 1 0 0 0 1 0 0 0 0 0 ------------|---------------||---------------||---------------||---------------|Volume Module:Base Vol: 53 1059 0 0 513 144 162 0 7 0 0 0 Growth Adj: 1.00 1.00 1.00 1.00 1.00 1.00 1.00 1.00 1.00 1.00 1.00 1.00 Initial Bse: 53 1059 0 0 513 144 162 0 7 0 0 0 Added Vol: 44 17 0 0 8 44 128 0 129 0 0 0 PasserByVol: 0 0 0 0 0 0 0 0 0 0 0 0 Initial Fut: 97 1076 0 0 521 188 290 0 136 0 0 0 User Adj: 1.00 1.00 1.00 1.00 1.00 1.00 1.00 1.00 0.00 1.00 1.00 1.00 PHF Adj: 1.00 1.00 1.00 1.00 1.00 1.00 1.00 1.00 0.00 1.00 1.00 1.00 PHF Volume: 97 1076 0 0 521 188 290 0 0 0 0 0 Reduct Vol: 0 0 0 0 0 0 0 0 0 0 0 0 FinalVolume: 97 1076 0 0 521 188 290 0 0 0 0 0 ------------|---------------||---------------||---------------||---------------|Critical Gap Module:Critical Gp: 4.1 xxxx xxxxx xxxxx xxxx xxxxx 6.4 xxxx 6.2 xxxxx xxxx xxxxx FollowUpTim: 2.2 xxxx xxxxx xxxxx xxxx xxxxx 3.5 xxxx 3.3 xxxxx xxxx xxxxx ------------|---------------||---------------||---------------||---------------|Capacity Module:Cnflict Vol: 709 xxxx xxxxx xxxx xxxx xxxxx 1885 xxxx 615 xxxx xxxx xxxxx Potent Cap.: 899 xxxx xxxxx xxxx xxxx xxxxx 79 xxxx 495 xxxx xxxx xxxxx Move Cap.: 899 xxxx xxxxx xxxx xxxx xxxxx 72 xxxx 495 xxxx xxxx xxxxx Volume/Cap: 0.11 xxxx xxxx xxxx xxxx xxxx 4.02 xxxx 0.00 xxxx xxxx xxxx ------------|---------------||---------------||---------------||---------------|Level Of Service Module:2Way95thQ: 0.4 xxxx xxxxx xxxx xxxx xxxxx 30.8 xxxx xxxxx xxxx xxxx xxxxx Control Del: 9.5 xxxx xxxxx xxxxx xxxx xxxxx 1477 xxxx xxxxx xxxxx xxxx xxxxx LOS by Move: A * * * * * F * * * * * Movement: LT - LTR - RT LT - LTR - RT LT - LTR - RT LT - LTR - RT Shared Cap.: xxxx xxxx xxxxx xxxx xxxx xxxxx xxxx xxxx xxxxx xxxx xxxx xxxxx SharedQueue:xxxxx xxxx xxxxx xxxxx xxxx xxxxx xxxxx xxxx xxxxx xxxxx xxxx xxxxx Shrd ConDel:xxxxx xxxx xxxxx xxxxx xxxx xxxxx xxxxx xxxx xxxxx xxxxx xxxx xxxxx Shared LOS: * * * * * * * * * * * * ApproachDel: xxxxxx xxxxxx 1477.2 xxxxxxApproachLOS: * * F * ********************************************************************************Note: Queue reported is the number of cars per lane.********************************************************************************
Traffix 8.0.0715 (c) 2008 Dowling Assoc. Licensed to RK ENGINEERING GROUP
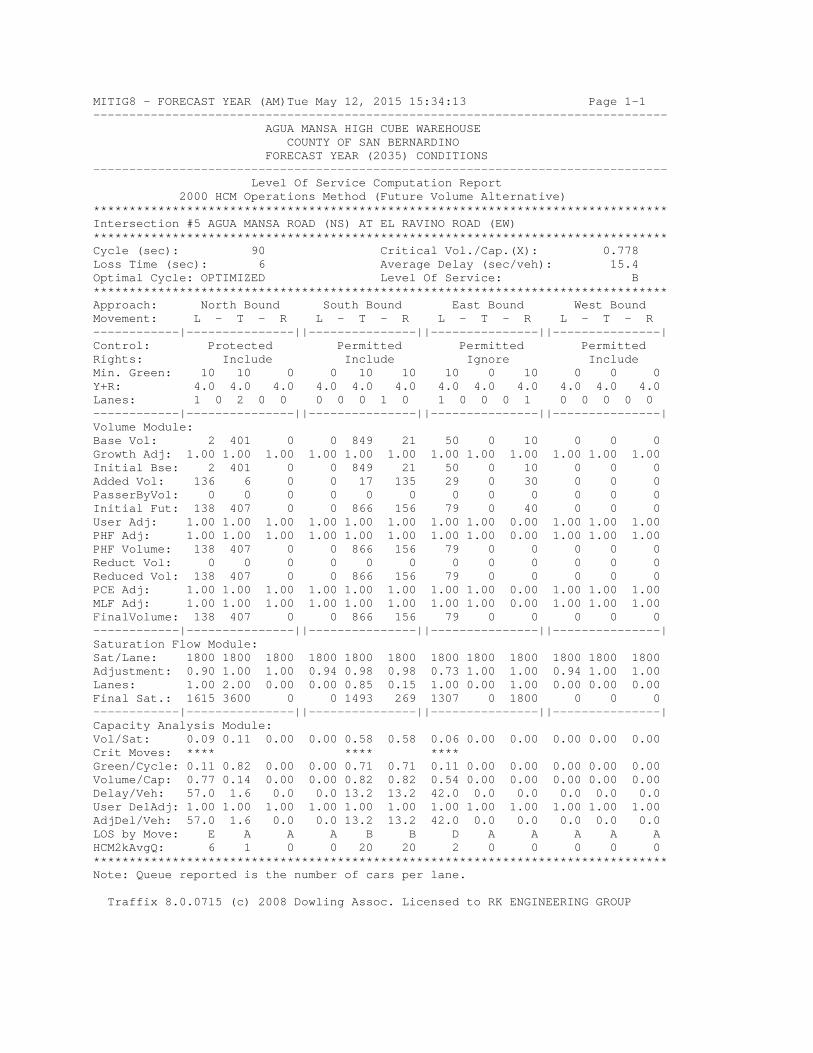
MITIG8 - FORECAST YEAR (AM)Tue May 12, 2015 15:34:13 Page 1-1 -------------------------------------------------------------------------------- AGUA MANSA HIGH CUBE WAREHOUSE COUNTY OF SAN BERNARDINO FORECAST YEAR (2035) CONDITIONS -------------------------------------------------------------------------------- Level Of Service Computation Report 2000 HCM Operations Method (Future Volume Alternative) ********************************************************************************Intersection #5 AGUA MANSA ROAD (NS) AT EL RAVINO ROAD (EW) ********************************************************************************Cycle (sec): 90 Critical Vol./Cap.(X): 0.778Loss Time (sec): 6 Average Delay (sec/veh): 15.4Optimal Cycle: OPTIMIZED Level Of Service: B********************************************************************************Approach: North Bound South Bound East Bound West Bound Movement: L - T - R L - T - R L - T - R L - T - R ------------|---------------||---------------||---------------||---------------|Control: Protected Permitted Permitted Permitted Rights: Include Include Ignore Include Min. Green: 10 10 0 0 10 10 10 0 10 0 0 0 Y+R: 4.0 4.0 4.0 4.0 4.0 4.0 4.0 4.0 4.0 4.0 4.0 4.0 Lanes: 1 0 2 0 0 0 0 0 1 0 1 0 0 0 1 0 0 0 0 0 ------------|---------------||---------------||---------------||---------------|Volume Module:Base Vol: 2 401 0 0 849 21 50 0 10 0 0 0 Growth Adj: 1.00 1.00 1.00 1.00 1.00 1.00 1.00 1.00 1.00 1.00 1.00 1.00 Initial Bse: 2 401 0 0 849 21 50 0 10 0 0 0 Added Vol: 136 6 0 0 17 135 29 0 30 0 0 0 PasserByVol: 0 0 0 0 0 0 0 0 0 0 0 0 Initial Fut: 138 407 0 0 866 156 79 0 40 0 0 0 User Adj: 1.00 1.00 1.00 1.00 1.00 1.00 1.00 1.00 0.00 1.00 1.00 1.00 PHF Adj: 1.00 1.00 1.00 1.00 1.00 1.00 1.00 1.00 0.00 1.00 1.00 1.00 PHF Volume: 138 407 0 0 866 156 79 0 0 0 0 0 Reduct Vol: 0 0 0 0 0 0 0 0 0 0 0 0 Reduced Vol: 138 407 0 0 866 156 79 0 0 0 0 0 PCE Adj: 1.00 1.00 1.00 1.00 1.00 1.00 1.00 1.00 0.00 1.00 1.00 1.00 MLF Adj: 1.00 1.00 1.00 1.00 1.00 1.00 1.00 1.00 0.00 1.00 1.00 1.00 FinalVolume: 138 407 0 0 866 156 79 0 0 0 0 0 ------------|---------------||---------------||---------------||---------------|Saturation Flow Module:Sat/Lane: 1800 1800 1800 1800 1800 1800 1800 1800 1800 1800 1800 1800 Adjustment: 0.90 1.00 1.00 0.94 0.98 0.98 0.73 1.00 1.00 0.94 1.00 1.00 Lanes: 1.00 2.00 0.00 0.00 0.85 0.15 1.00 0.00 1.00 0.00 0.00 0.00 Final Sat.: 1615 3600 0 0 1493 269 1307 0 1800 0 0 0 ------------|---------------||---------------||---------------||---------------|Capacity Analysis Module:Vol/Sat: 0.09 0.11 0.00 0.00 0.58 0.58 0.06 0.00 0.00 0.00 0.00 0.00 Crit Moves: **** **** **** Green/Cycle: 0.11 0.82 0.00 0.00 0.71 0.71 0.11 0.00 0.00 0.00 0.00 0.00 Volume/Cap: 0.77 0.14 0.00 0.00 0.82 0.82 0.54 0.00 0.00 0.00 0.00 0.00 Delay/Veh: 57.0 1.6 0.0 0.0 13.2 13.2 42.0 0.0 0.0 0.0 0.0 0.0 User DelAdj: 1.00 1.00 1.00 1.00 1.00 1.00 1.00 1.00 1.00 1.00 1.00 1.00 AdjDel/Veh: 57.0 1.6 0.0 0.0 13.2 13.2 42.0 0.0 0.0 0.0 0.0 0.0 LOS by Move: E A A A B B D A A A A A HCM2kAvgQ: 6 1 0 0 20 20 2 0 0 0 0 0 ********************************************************************************Note: Queue reported is the number of cars per lane.
Traffix 8.0.0715 (c) 2008 Dowling Assoc. Licensed to RK ENGINEERING GROUP

MITIG8 - FORECAST YEAR (PM)Tue May 12, 2015 15:33:42 Page 1-1 -------------------------------------------------------------------------------- AGUA MANSA HIGH CUBE WAREHOUSE COUNTY OF SAN BERNARDINO FORECAST YEAR (2035) CONDITIONS -------------------------------------------------------------------------------- Level Of Service Computation Report 2000 HCM Operations Method (Future Volume Alternative) ********************************************************************************Intersection #5 AGUA MANSA ROAD (NS) AT EL RAVINO ROAD (EW) ********************************************************************************Cycle (sec): 70 Critical Vol./Cap.(X): 0.755Loss Time (sec): 6 Average Delay (sec/veh): 16.4Optimal Cycle: OPTIMIZED Level Of Service: B********************************************************************************Approach: North Bound South Bound East Bound West Bound Movement: L - T - R L - T - R L - T - R L - T - R ------------|---------------||---------------||---------------||---------------|Control: Protected Permitted Permitted Permitted Rights: Include Include Ignore Include Min. Green: 10 10 0 0 10 10 10 0 10 0 0 0 Y+R: 4.0 4.0 4.0 4.0 4.0 4.0 4.0 4.0 4.0 4.0 4.0 4.0 Lanes: 1 0 2 0 0 0 0 0 1 0 1 0 0 0 1 0 0 0 0 0 ------------|---------------||---------------||---------------||---------------|Volume Module:Base Vol: 53 1059 0 0 513 144 162 0 7 0 0 0 Growth Adj: 1.00 1.00 1.00 1.00 1.00 1.00 1.00 1.00 1.00 1.00 1.00 1.00 Initial Bse: 53 1059 0 0 513 144 162 0 7 0 0 0 Added Vol: 44 17 0 0 8 44 128 0 129 0 0 0 PasserByVol: 0 0 0 0 0 0 0 0 0 0 0 0 Initial Fut: 97 1076 0 0 521 188 290 0 136 0 0 0 User Adj: 1.00 1.00 1.00 1.00 1.00 1.00 1.00 1.00 0.00 1.00 1.00 1.00 PHF Adj: 1.00 1.00 1.00 1.00 1.00 1.00 1.00 1.00 0.00 1.00 1.00 1.00 PHF Volume: 97 1076 0 0 521 188 290 0 0 0 0 0 Reduct Vol: 0 0 0 0 0 0 0 0 0 0 0 0 Reduced Vol: 97 1076 0 0 521 188 290 0 0 0 0 0 PCE Adj: 1.00 1.00 1.00 1.00 1.00 1.00 1.00 1.00 0.00 1.00 1.00 1.00 MLF Adj: 1.00 1.00 1.00 1.00 1.00 1.00 1.00 1.00 0.00 1.00 1.00 1.00 FinalVolume: 97 1076 0 0 521 188 290 0 0 0 0 0 ------------|---------------||---------------||---------------||---------------|Saturation Flow Module:Sat/Lane: 1800 1800 1800 1800 1800 1800 1800 1800 1800 1800 1800 1800 Adjustment: 0.90 1.00 1.00 0.94 0.96 0.96 0.73 1.00 1.00 0.94 1.00 1.00 Lanes: 1.00 2.00 0.00 0.00 0.73 0.27 1.00 0.00 1.00 0.00 0.00 0.00 Final Sat.: 1615 3600 0 0 1275 460 1307 0 1800 0 0 0 ------------|---------------||---------------||---------------||---------------|Capacity Analysis Module:Vol/Sat: 0.06 0.30 0.00 0.00 0.41 0.41 0.22 0.00 0.00 0.00 0.00 0.00 Crit Moves: **** **** **** Green/Cycle: 0.14 0.64 0.00 0.00 0.50 0.50 0.27 0.00 0.00 0.00 0.00 0.00 Volume/Cap: 0.42 0.46 0.00 0.00 0.82 0.82 0.82 0.00 0.00 0.00 0.00 0.00 Delay/Veh: 28.6 6.5 0.0 0.0 20.9 20.9 37.6 0.0 0.0 0.0 0.0 0.0 User DelAdj: 1.00 1.00 1.00 1.00 1.00 1.00 1.00 1.00 1.00 1.00 1.00 1.00 AdjDel/Veh: 28.6 6.5 0.0 0.0 20.9 20.9 37.6 0.0 0.0 0.0 0.0 0.0 LOS by Move: C A A A C C D A A A A A HCM2kAvgQ: 3 6 0 0 14 14 7 0 0 0 0 0 ********************************************************************************Note: Queue reported is the number of cars per lane.
Traffix 8.0.0715 (c) 2008 Dowling Assoc. Licensed to RK ENGINEERING GROUP

FORECAST YEAR (AM) Tue May 12, 2015 12:37:55 Page 7-1 -------------------------------------------------------------------------------- AGUA MANSA HIGH CUBE WAREHOUSE COUNTY OF SAN BERNARDINO FORECAST YEAR (2035) CONDITIONS -------------------------------------------------------------------------------- Level Of Service Computation Report 2000 HCM Operations Method (Future Volume Alternative) ********************************************************************************Intersection #6 RIVERSIDE AVENUE (NS) AT AGUA MANSA ROAD (EW) ********************************************************************************Cycle (sec): 130 Critical Vol./Cap.(X): 1.193Loss Time (sec): 8 Average Delay (sec/veh): 100.4Optimal Cycle: OPTIMIZED Level Of Service: F********************************************************************************Approach: North Bound South Bound East Bound West Bound Movement: L - T - R L - T - R L - T - R L - T - R ------------|---------------||---------------||---------------||---------------|Control: Protected Protected Protected Protected Rights: Include Include Include Include Min. Green: 10 29 29 10 32 32 10 27 27 10 23 23 Y+R: 4.0 4.0 4.0 4.0 4.0 4.0 4.0 4.0 4.0 4.0 4.0 4.0 Lanes: 1 0 1 1 0 1 0 2 0 1 1 0 1 0 1 1 0 1 0 1 ------------|---------------||---------------||---------------||---------------|Volume Module:Base Vol: 147 1197 161 38 2001 268 84 304 70 150 518 9 Growth Adj: 1.00 1.00 1.00 1.00 1.00 1.00 1.00 1.00 1.00 1.00 1.00 1.00 Initial Bse: 147 1197 161 38 2001 268 84 304 70 150 518 9 Added Vol: 77 21 0 0 6 37 10 8 17 0 39 0 PasserByVol: 0 0 0 0 0 0 0 0 0 0 0 0 Initial Fut: 224 1218 161 38 2007 305 94 312 87 150 557 9 User Adj: 1.00 1.00 1.00 1.00 1.00 1.00 1.00 1.00 1.00 1.00 1.00 1.00 PHF Adj: 0.95 0.95 0.95 0.95 0.95 0.95 0.95 0.95 0.95 0.95 0.95 0.95 PHF Volume: 236 1282 169 40 2113 321 99 328 92 158 586 9 Reduct Vol: 0 0 0 0 0 0 0 0 0 0 0 0 Reduced Vol: 236 1282 169 40 2113 321 99 328 92 158 586 9 PCE Adj: 1.00 1.00 1.00 1.00 1.00 1.00 1.00 1.00 1.00 1.00 1.00 1.00 MLF Adj: 1.00 1.00 1.00 1.00 1.00 1.00 1.00 1.00 1.00 1.00 1.00 1.00 FinalVolume: 236 1282 169 40 2113 321 99 328 92 158 586 9 ------------|---------------||---------------||---------------||---------------|Saturation Flow Module:Sat/Lane: 1800 1800 1800 1800 1800 1800 1800 1800 1800 1800 1800 1800 Adjustment: 0.90 0.98 0.98 0.90 1.00 0.85 0.90 1.00 0.85 0.90 1.00 0.85 Lanes: 1.00 1.77 0.23 1.00 2.00 1.00 1.00 1.00 1.00 1.00 1.00 1.00 Final Sat.: 1615 3122 413 1615 3600 1530 1615 1800 1530 1615 1800 1530 ------------|---------------||---------------||---------------||---------------|Capacity Analysis Module:Vol/Sat: 0.15 0.41 0.41 0.02 0.59 0.21 0.06 0.18 0.06 0.10 0.33 0.01 Crit Moves: **** **** **** **** Green/Cycle: 0.12 0.50 0.50 0.09 0.48 0.48 0.08 0.23 0.23 0.11 0.27 0.27 Volume/Cap: 1.23 0.82 0.82 0.26 1.23 0.44 0.80 0.78 0.26 0.89 1.23 0.02 Delay/Veh: 197.2 30.4 30.4 55.6 142 22.9 88.1 56.2 41.1 96.1 168 35.3 User DelAdj: 1.00 1.00 1.00 1.00 1.00 1.00 1.00 1.00 1.00 1.00 1.00 1.00 AdjDel/Veh: 197.2 30.4 30.4 55.6 142 22.9 88.1 56.2 41.1 96.1 168 35.3 LOS by Move: F C C E F C F E D F F D HCM2kAvgQ: 18 26 26 2 67 8 6 14 3 9 39 0 ********************************************************************************Note: Queue reported is the number of cars per lane.
Traffix 8.0.0715 (c) 2008 Dowling Assoc. Licensed to RK ENGINEERING GROUP

FORECAST YEAR (PM) Tue May 12, 2015 12:46:48 Page 7-1 -------------------------------------------------------------------------------- AGUA MANSA HIGH CUBE WAREHOUSE COUNTY OF SAN BERNARDINO FORECAST YEAR (2035) CONDITIONS -------------------------------------------------------------------------------- Level Of Service Computation Report 2000 HCM Operations Method (Future Volume Alternative) ********************************************************************************Intersection #6 RIVERSIDE AVENUE (NS) AT AGUA MANSA ROAD (EW) ********************************************************************************Cycle (sec): 130 Critical Vol./Cap.(X): 1.395Loss Time (sec): 8 Average Delay (sec/veh): 244.9Optimal Cycle: OPTIMIZED Level Of Service: F********************************************************************************Approach: North Bound South Bound East Bound West Bound Movement: L - T - R L - T - R L - T - R L - T - R ------------|---------------||---------------||---------------||---------------|Control: Protected Protected Protected Protected Rights: Include Include Include Include Min. Green: 10 29 29 10 32 32 10 27 27 10 23 23 Y+R: 4.0 4.0 4.0 4.0 4.0 4.0 4.0 4.0 4.0 4.0 4.0 4.0 Lanes: 1 0 1 1 0 1 0 2 0 1 1 0 1 0 1 1 0 1 0 1 ------------|---------------||---------------||---------------||---------------|Volume Module:Base Vol: 70 2287 182 8 2213 70 317 814 178 114 524 29 Growth Adj: 1.00 1.00 1.00 1.00 1.00 1.00 1.00 1.00 1.00 1.00 1.00 1.00 Initial Bse: 70 2287 182 8 2213 70 317 814 178 114 524 29 Added Vol: 25 7 0 0 21 15 35 37 73 0 13 0 PasserByVol: 0 0 0 0 0 0 0 0 0 0 0 0 Initial Fut: 95 2294 182 8 2234 85 352 851 251 114 537 29 User Adj: 1.00 1.00 1.00 1.00 1.00 1.00 1.00 1.00 1.00 1.00 1.00 1.00 PHF Adj: 0.95 0.95 0.95 0.95 0.95 0.95 0.95 0.95 0.95 0.95 0.95 0.95 PHF Volume: 100 2415 192 8 2352 89 371 896 264 120 565 31 Reduct Vol: 0 0 0 0 0 0 0 0 0 0 0 0 Reduced Vol: 100 2415 192 8 2352 89 371 896 264 120 565 31 PCE Adj: 1.00 1.00 1.00 1.00 1.00 1.00 1.00 1.00 1.00 1.00 1.00 1.00 MLF Adj: 1.00 1.00 1.00 1.00 1.00 1.00 1.00 1.00 1.00 1.00 1.00 1.00 FinalVolume: 100 2415 192 8 2352 89 371 896 264 120 565 31 ------------|---------------||---------------||---------------||---------------|Saturation Flow Module:Sat/Lane: 1800 1800 1800 1800 1800 1800 1800 1800 1800 1800 1800 1800 Adjustment: 0.90 0.99 0.99 0.90 1.00 0.85 0.90 1.00 0.85 0.90 1.00 0.85 Lanes: 1.00 1.85 0.15 1.00 2.00 1.00 1.00 1.00 1.00 1.00 1.00 1.00 Final Sat.: 1615 3299 262 1615 3600 1530 1615 1800 1530 1615 1800 1530 ------------|---------------||---------------||---------------||---------------|Capacity Analysis Module:Vol/Sat: 0.06 0.73 0.73 0.01 0.65 0.06 0.23 0.50 0.17 0.07 0.31 0.02 Crit Moves: **** **** **** **** Green/Cycle: 0.08 0.47 0.47 0.08 0.47 0.47 0.17 0.32 0.32 0.08 0.23 0.23 Volume/Cap: 0.80 1.57 1.57 0.07 1.40 0.13 1.38 1.57 0.54 0.97 1.38 0.09 Delay/Veh: 89.6 293 292.9 55.9 218 19.7 245.8 308 37.9 129.7 235 39.6 User DelAdj: 1.00 1.00 1.00 1.00 1.00 1.00 1.00 1.00 1.00 1.00 1.00 1.00 AdjDel/Veh: 89.6 293 292.9 55.9 218 19.7 245.8 308 37.9 129.7 235 39.6 LOS by Move: F F F E F B F F D F F D HCM2kAvgQ: 6 109 109 0 88 2 31 75 9 8 43 1 ********************************************************************************Note: Queue reported is the number of cars per lane.
Traffix 8.0.0715 (c) 2008 Dowling Assoc. Licensed to RK ENGINEERING GROUP

MITIG8 - FORECAST YEAR (AM)Wed May 13, 2015 09:13:14 Page 1-1 -------------------------------------------------------------------------------- AGUA MANSA HIGH CUBE WAREHOUSE COUNTY OF SAN BERNARDINO FORECAST YEAR (2035) CONDITIONS -------------------------------------------------------------------------------- Level Of Service Computation Report 2000 HCM Operations Method (Future Volume Alternative) ********************************************************************************Intersection #6 RIVERSIDE AVENUE (NS) AT AGUA MANSA ROAD (EW) ********************************************************************************Cycle (sec): 130 Critical Vol./Cap.(X): 0.847Loss Time (sec): 8 Average Delay (sec/veh): 44.1Optimal Cycle: OPTIMIZED Level Of Service: D********************************************************************************Approach: North Bound South Bound East Bound West Bound Movement: L - T - R L - T - R L - T - R L - T - R ------------|---------------||---------------||---------------||---------------|Control: Protected Protected Protected Protected Rights: Include Include Include Include Min. Green: 10 29 29 10 32 32 10 27 27 10 23 23 Y+R: 4.0 4.0 4.0 4.0 4.0 4.0 4.0 4.0 4.0 4.0 4.0 4.0 Lanes: 1 0 2 1 0 1 0 2 1 0 2 0 2 0 1 1 0 2 0 1 ------------|---------------||---------------||---------------||---------------|Volume Module:Base Vol: 147 1197 161 38 2001 268 84 304 70 150 518 9 Growth Adj: 1.00 1.00 1.00 1.00 1.00 1.00 1.00 1.00 1.00 1.00 1.00 1.00 Initial Bse: 147 1197 161 38 2001 268 84 304 70 150 518 9 Added Vol: 77 21 0 0 6 37 10 8 17 0 39 0 PasserByVol: 0 0 0 0 0 0 0 0 0 0 0 0 Initial Fut: 224 1218 161 38 2007 305 94 312 87 150 557 9 User Adj: 1.00 1.00 1.00 1.00 1.00 1.00 1.00 1.00 1.00 1.00 1.00 1.00 PHF Adj: 0.95 0.95 0.95 0.95 0.95 0.95 0.95 0.95 0.95 0.95 0.95 0.95 PHF Volume: 236 1282 169 40 2113 321 99 328 92 158 586 9 Reduct Vol: 0 0 0 0 0 0 0 0 0 0 0 0 Reduced Vol: 236 1282 169 40 2113 321 99 328 92 158 586 9 PCE Adj: 1.00 1.00 1.00 1.00 1.00 1.00 1.00 1.00 1.00 1.00 1.00 1.00 MLF Adj: 1.00 1.00 1.00 1.00 1.00 1.00 1.00 1.00 1.00 1.00 1.00 1.00 FinalVolume: 236 1282 169 40 2113 321 99 328 92 158 586 9 ------------|---------------||---------------||---------------||---------------|Saturation Flow Module:Sat/Lane: 1800 1800 1800 1800 1800 1800 1800 1800 1800 1800 1800 1800 Adjustment: 0.90 0.98 0.98 0.90 0.98 0.98 0.84 1.00 0.85 0.90 1.00 0.85 Lanes: 1.00 2.65 0.35 1.00 2.60 0.40 2.00 2.00 1.00 1.00 2.00 1.00 Final Sat.: 1615 4684 619 1615 4594 698 3040 3600 1530 1615 3600 1530 ------------|---------------||---------------||---------------||---------------|Capacity Analysis Module:Vol/Sat: 0.15 0.27 0.27 0.02 0.46 0.46 0.03 0.09 0.06 0.10 0.16 0.01 Crit Moves: **** **** **** **** Green/Cycle: 0.15 0.49 0.49 0.14 0.48 0.48 0.09 0.21 0.21 0.10 0.22 0.22 Volume/Cap: 0.96 0.56 0.56 0.18 0.96 0.96 0.35 0.44 0.29 0.96 0.76 0.03 Delay/Veh: 101.8 23.4 23.4 49.9 43.5 43.5 55.9 45.3 43.9 117.2 52.1 40.3 User DelAdj: 1.00 1.00 1.00 1.00 1.00 1.00 1.00 1.00 1.00 1.00 1.00 1.00 AdjDel/Veh: 101.8 23.4 23.4 49.9 43.5 43.5 55.9 45.3 43.9 117.2 52.1 40.3 LOS by Move: F C C D D D E D D F D D HCM2kAvgQ: 14 13 13 2 37 37 2 6 3 10 12 0 ********************************************************************************Note: Queue reported is the number of cars per lane.
Traffix 8.0.0715 (c) 2008 Dowling Assoc. Licensed to RK ENGINEERING GROUP

MITIG8 - FORECAST YEAR (PM)Wed May 13, 2015 09:12:33 Page 1-1 -------------------------------------------------------------------------------- AGUA MANSA HIGH CUBE WAREHOUSE COUNTY OF SAN BERNARDINO FORECAST YEAR (2035) CONDITIONS -------------------------------------------------------------------------------- Level Of Service Computation Report 2000 HCM Operations Method (Future Volume Alternative) ********************************************************************************Intersection #6 RIVERSIDE AVENUE (NS) AT AGUA MANSA ROAD (EW) ********************************************************************************Cycle (sec): 125 Critical Vol./Cap.(X): 0.872Loss Time (sec): 8 Average Delay (sec/veh): 43.8Optimal Cycle: OPTIMIZED Level Of Service: D********************************************************************************Approach: North Bound South Bound East Bound West Bound Movement: L - T - R L - T - R L - T - R L - T - R ------------|---------------||---------------||---------------||---------------|Control: Protected Protected Protected Protected Rights: Include Include Include Include Min. Green: 10 29 29 10 32 32 10 27 27 10 23 23 Y+R: 4.0 4.0 4.0 4.0 4.0 4.0 4.0 4.0 4.0 4.0 4.0 4.0 Lanes: 1 0 2 1 0 1 0 2 1 0 2 0 2 0 1 1 0 2 0 1 ------------|---------------||---------------||---------------||---------------|Volume Module:Base Vol: 70 2287 182 8 2213 70 317 814 178 114 524 29 Growth Adj: 1.00 1.00 1.00 1.00 1.00 1.00 1.00 1.00 1.00 1.00 1.00 1.00 Initial Bse: 70 2287 182 8 2213 70 317 814 178 114 524 29 Added Vol: 25 7 0 0 21 15 35 37 73 0 13 0 PasserByVol: 0 0 0 0 0 0 0 0 0 0 0 0 Initial Fut: 95 2294 182 8 2234 85 352 851 251 114 537 29 User Adj: 1.00 1.00 1.00 1.00 1.00 1.00 1.00 1.00 1.00 1.00 1.00 1.00 PHF Adj: 0.95 0.95 0.95 0.95 0.95 0.95 0.95 0.95 0.95 0.95 0.95 0.95 PHF Volume: 100 2415 192 8 2352 89 371 896 264 120 565 31 Reduct Vol: 0 0 0 0 0 0 0 0 0 0 0 0 Reduced Vol: 100 2415 192 8 2352 89 371 896 264 120 565 31 PCE Adj: 1.00 1.00 1.00 1.00 1.00 1.00 1.00 1.00 1.00 1.00 1.00 1.00 MLF Adj: 1.00 1.00 1.00 1.00 1.00 1.00 1.00 1.00 1.00 1.00 1.00 1.00 FinalVolume: 100 2415 192 8 2352 89 371 896 264 120 565 31 ------------|---------------||---------------||---------------||---------------|Saturation Flow Module:Sat/Lane: 1800 1800 1800 1800 1800 1800 1800 1800 1800 1800 1800 1800 Adjustment: 0.90 0.99 0.99 0.90 0.99 0.99 0.84 1.00 0.85 0.90 1.00 0.85 Lanes: 1.00 2.78 0.22 1.00 2.89 0.11 2.00 2.00 1.00 1.00 2.00 1.00 Final Sat.: 1615 4948 393 1615 5171 197 3040 3600 1530 1615 3600 1530 ------------|---------------||---------------||---------------||---------------|Capacity Analysis Module:Vol/Sat: 0.06 0.49 0.49 0.01 0.45 0.45 0.12 0.25 0.17 0.07 0.16 0.02 Crit Moves: **** **** **** **** Green/Cycle: 0.09 0.51 0.51 0.08 0.51 0.51 0.14 0.26 0.26 0.08 0.21 0.21 Volume/Cap: 0.70 0.95 0.95 0.07 0.90 0.90 0.89 0.95 0.66 0.93 0.76 0.10 Delay/Veh: 69.3 37.1 37.1 53.4 32.7 32.7 74.2 63.6 45.2 114.7 51.5 40.4 User DelAdj: 1.00 1.00 1.00 1.00 1.00 1.00 1.00 1.00 1.00 1.00 1.00 1.00 AdjDel/Veh: 69.3 37.1 37.1 53.4 32.7 32.7 74.2 63.6 45.2 114.7 51.5 40.4 LOS by Move: E D D D C C E E D F D D HCM2kAvgQ: 5 37 37 0 32 32 11 21 10 8 12 1 ********************************************************************************Note: Queue reported is the number of cars per lane.
Traffix 8.0.0715 (c) 2008 Dowling Assoc. Licensed to RK ENGINEERING GROUP

Appendix I
Buildout Year (2035) With Project Conditions
Intersection Analysis Worksheets

FORECAST YEAR + PROJ (AM) Tue May 12, 2015 12:40:51 Page 2-1 -------------------------------------------------------------------------------- AGUA MANSA HIGH CUBE WAREHOUSE COUNTY OF SAN BERNARDINO FORECAST YEAR (2035) WITH PROJECT CONDITIONS -------------------------------------------------------------------------------- Level Of Service Computation Report 2000 HCM Operations Method (Future Volume Alternative) ********************************************************************************Intersection #1 CEDAR AVENUE (NS) AT EL RAVINO ROAD (EW) ********************************************************************************Cycle (sec): 105 Critical Vol./Cap.(X): 0.801Loss Time (sec): 8 Average Delay (sec/veh): 25.9Optimal Cycle: OPTIMIZED Level Of Service: C********************************************************************************Approach: North Bound South Bound East Bound West Bound Movement: L - T - R L - T - R L - T - R L - T - R ------------|---------------||---------------||---------------||---------------|Control: Protected Protected Permitted Permitted Rights: Include Include Include Include Min. Green: 10 0 0 10 23 23 10 14 14 10 24 24 Y+R: 4.0 4.0 4.0 4.0 4.0 4.0 4.0 4.0 4.0 4.0 4.0 4.0 Lanes: 1 0 1 1 0 1 0 1 1 0 0 0 1! 0 0 0 1 0 0 1 ------------|---------------||---------------||---------------||---------------|Volume Module:Base Vol: 15 688 48 64 1304 9 5 2 9 67 3 14 Growth Adj: 1.00 1.00 1.00 1.00 1.00 1.00 1.00 1.00 1.00 1.00 1.00 1.00 Initial Bse: 15 688 48 64 1304 9 5 2 9 67 3 14 Added Vol: 0 2 582 165 6 0 0 10 0 127 2 37 PasserByVol: 0 0 0 0 0 0 0 0 0 0 0 0 Initial Fut: 15 690 630 229 1310 9 5 12 9 194 5 51 User Adj: 1.00 1.00 1.00 1.00 1.00 1.00 1.00 1.00 1.00 1.00 1.00 1.00 PHF Adj: 0.95 0.95 0.95 0.95 0.95 0.95 0.95 0.95 0.95 0.95 0.95 0.95 PHF Volume: 16 726 663 241 1379 9 5 13 9 204 5 54 Reduct Vol: 0 0 0 0 0 0 0 0 0 0 0 0 Reduced Vol: 16 726 663 241 1379 9 5 13 9 204 5 54 PCE Adj: 1.00 1.00 1.00 1.00 1.00 1.00 1.00 1.00 1.00 1.00 1.00 1.00 MLF Adj: 1.00 1.00 1.00 1.00 1.00 1.00 1.00 1.00 1.00 1.00 1.00 1.00 FinalVolume: 16 726 663 241 1379 9 5 13 9 204 5 54 ------------|---------------||---------------||---------------||---------------|Saturation Flow Module:Sat/Lane: 1800 1800 1800 1800 1800 1800 1800 1800 1800 1800 1800 1800 Adjustment: 0.90 0.93 0.93 0.90 1.00 1.00 0.86 0.91 0.91 0.66 0.70 0.85 Lanes: 1.00 1.05 0.95 1.00 1.99 0.01 0.20 0.46 0.34 0.98 0.02 1.00 Final Sat.: 1615 1746 1594 1615 3572 25 311 747 560 1168 30 1530 ------------|---------------||---------------||---------------||---------------|Capacity Analysis Module:Vol/Sat: 0.01 0.42 0.42 0.15 0.39 0.39 0.02 0.02 0.02 0.17 0.17 0.04 Crit Moves: **** **** **** Green/Cycle: 0.14 0.51 0.51 0.18 0.56 0.56 0.23 0.23 0.23 0.23 0.23 0.23 Volume/Cap: 0.07 0.81 0.81 0.81 0.69 0.69 0.07 0.07 0.07 0.76 0.76 0.15 Delay/Veh: 39.6 24.5 24.5 56.7 17.8 17.8 31.9 31.9 31.9 49.9 49.9 32.6 User DelAdj: 1.00 1.00 1.00 1.00 1.00 1.00 1.00 1.00 1.00 1.00 1.00 1.00 AdjDel/Veh: 39.6 24.5 24.5 56.7 17.8 17.8 31.9 31.9 31.9 49.9 49.9 32.6 LOS by Move: D C C E B B C C C D D C HCM2kAvgQ: 1 21 21 10 17 17 1 1 1 9 9 1 ********************************************************************************Note: Queue reported is the number of cars per lane.
Traffix 8.0.0715 (c) 2008 Dowling Assoc. Licensed to RK ENGINEERING GROUP

FORECAST YEAR + PROJ (PM) Tue May 12, 2015 12:41:21 Page 2-1 -------------------------------------------------------------------------------- AGUA MANSA HIGH CUBE WAREHOUSE COUNTY OF SAN BERNARDINO FORECAST YEAR (2035) WITH PROJECT CONDITIONS -------------------------------------------------------------------------------- Level Of Service Computation Report 2000 HCM Operations Method (Future Volume Alternative) ********************************************************************************Intersection #1 CEDAR AVENUE (NS) AT EL RAVINO ROAD (EW) ********************************************************************************Cycle (sec): 130 Critical Vol./Cap.(X): 1.373Loss Time (sec): 8 Average Delay (sec/veh): 162.3Optimal Cycle: OPTIMIZED Level Of Service: F********************************************************************************Approach: North Bound South Bound East Bound West Bound Movement: L - T - R L - T - R L - T - R L - T - R ------------|---------------||---------------||---------------||---------------|Control: Protected Protected Permitted Permitted Rights: Include Include Include Include Min. Green: 10 0 0 10 23 23 10 14 14 10 24 24 Y+R: 4.0 4.0 4.0 4.0 4.0 4.0 4.0 4.0 4.0 4.0 4.0 4.0 Lanes: 1 0 1 1 0 1 0 1 1 0 0 0 1! 0 0 0 1 0 0 1 ------------|---------------||---------------||---------------||---------------|Volume Module:Base Vol: 10 1517 134 47 1199 12 13 10 20 172 18 69 Growth Adj: 1.00 1.00 1.00 1.00 1.00 1.00 1.00 1.00 1.00 1.00 1.00 1.00 Initial Bse: 10 1517 134 47 1199 12 13 10 20 172 18 69 Added Vol: 0 6 189 54 3 0 0 3 0 552 9 157 PasserByVol: 0 0 0 0 0 0 0 0 0 0 0 0 Initial Fut: 10 1523 323 101 1202 12 13 13 20 724 27 226 User Adj: 1.00 1.00 1.00 1.00 1.00 1.00 1.00 1.00 1.00 1.00 1.00 1.00 PHF Adj: 0.95 0.95 0.95 0.95 0.95 0.95 0.95 0.95 0.95 0.95 0.95 0.95 PHF Volume: 11 1603 340 106 1265 13 14 14 21 762 28 238 Reduct Vol: 0 0 0 0 0 0 0 0 0 0 0 0 Reduced Vol: 11 1603 340 106 1265 13 14 14 21 762 28 238 PCE Adj: 1.00 1.00 1.00 1.00 1.00 1.00 1.00 1.00 1.00 1.00 1.00 1.00 MLF Adj: 1.00 1.00 1.00 1.00 1.00 1.00 1.00 1.00 1.00 1.00 1.00 1.00 FinalVolume: 11 1603 340 106 1265 13 14 14 21 762 28 238 ------------|---------------||---------------||---------------||---------------|Saturation Flow Module:Sat/Lane: 1800 1800 1800 1800 1800 1800 1800 1800 1800 1800 1800 1800 Adjustment: 0.90 0.97 0.97 0.90 1.00 1.00 0.55 0.59 0.59 0.66 0.69 0.85 Lanes: 1.00 1.65 0.35 1.00 1.98 0.02 0.29 0.28 0.43 0.97 0.03 1.00 Final Sat.: 1615 2893 614 1615 3561 36 293 293 451 1140 43 1530 ------------|---------------||---------------||---------------||---------------|Capacity Analysis Module:Vol/Sat: 0.01 0.55 0.55 0.07 0.36 0.36 0.05 0.05 0.05 0.67 0.67 0.16 Crit Moves: **** **** **** Green/Cycle: 0.08 0.39 0.39 0.08 0.38 0.38 0.47 0.47 0.47 0.47 0.47 0.47 Volume/Cap: 0.08 1.42 1.42 0.86 0.92 0.92 0.10 0.10 0.10 1.42 1.42 0.33 Delay/Veh: 55.2 233 232.7 100.0 49.0 49.0 19.2 19.2 19.2 233.5 233 21.8 User DelAdj: 1.00 1.00 1.00 1.00 1.00 1.00 1.00 1.00 1.00 1.00 1.00 1.00 AdjDel/Veh: 55.2 233 232.7 100.0 49.0 49.0 19.2 19.2 19.2 233.5 233 21.8 LOS by Move: E F F F D D B B B F F C HCM2kAvgQ: 0 74 74 7 28 28 1 1 1 64 64 6 ********************************************************************************Note: Queue reported is the number of cars per lane.
Traffix 8.0.0715 (c) 2008 Dowling Assoc. Licensed to RK ENGINEERING GROUP

MITIG8 - FORECAST YEAR + PRWed May 13, 2015 09:25:17 Page 1-1 -------------------------------------------------------------------------------- AGUA MANSA HIGH CUBE WAREHOUSE COUNTY OF SAN BERNARDINO FORECAST YEAR (2035) WITH PROJECT CONDITIONS -------------------------------------------------------------------------------- Level Of Service Computation Report 2000 HCM Operations Method (Future Volume Alternative) ********************************************************************************Intersection #1 CEDAR AVENUE (NS) AT EL RAVINO ROAD (EW) ********************************************************************************Cycle (sec): 115 Critical Vol./Cap.(X): 0.699Loss Time (sec): 8 Average Delay (sec/veh): 24.7Optimal Cycle: OPTIMIZED Level Of Service: C********************************************************************************Approach: North Bound South Bound East Bound West Bound Movement: L - T - R L - T - R L - T - R L - T - R ------------|---------------||---------------||---------------||---------------|Control: Protected Protected Permitted Permitted Rights: Include Include Include Include Min. Green: 10 0 0 10 23 23 10 14 14 10 24 24 Y+R: 4.0 4.0 4.0 4.0 4.0 4.0 4.0 4.0 4.0 4.0 4.0 4.0 Lanes: 1 0 1 1 0 1 0 1 1 0 0 0 1! 0 0 1 1 0 0 1 ------------|---------------||---------------||---------------||---------------|Volume Module:Base Vol: 15 688 48 64 1304 9 5 2 9 67 3 14 Growth Adj: 1.00 1.00 1.00 1.00 1.00 1.00 1.00 1.00 1.00 1.00 1.00 1.00 Initial Bse: 15 688 48 64 1304 9 5 2 9 67 3 14 Added Vol: 0 2 582 165 6 0 0 10 0 127 2 37 PasserByVol: 0 0 0 0 0 0 0 0 0 0 0 0 Initial Fut: 15 690 630 229 1310 9 5 12 9 194 5 51 User Adj: 1.00 1.00 1.00 1.00 1.00 1.00 1.00 1.00 1.00 1.00 1.00 1.00 PHF Adj: 0.95 0.95 0.95 0.95 0.95 0.95 0.95 0.95 0.95 0.95 0.95 0.95 PHF Volume: 16 726 663 241 1379 9 5 13 9 204 5 54 Reduct Vol: 0 0 0 0 0 0 0 0 0 0 0 0 Reduced Vol: 16 726 663 241 1379 9 5 13 9 204 5 54 PCE Adj: 1.00 1.00 1.00 1.00 1.00 1.00 1.00 1.00 1.00 1.00 1.00 1.00 MLF Adj: 1.00 1.00 1.00 1.00 1.00 1.00 1.00 1.00 1.00 1.00 1.00 1.00 FinalVolume: 16 726 663 241 1379 9 5 13 9 204 5 54 ------------|---------------||---------------||---------------||---------------|Saturation Flow Module:Sat/Lane: 1800 1800 1800 1800 1800 1800 1800 1800 1800 1800 1800 1800 Adjustment: 0.90 0.93 0.93 0.90 1.00 1.00 0.87 0.93 0.93 0.68 0.72 0.85 Lanes: 1.00 1.05 0.95 1.00 1.99 0.01 0.20 0.46 0.34 1.95 0.05 1.00 Final Sat.: 1615 1746 1594 1615 3572 25 317 760 570 2393 62 1530 ------------|---------------||---------------||---------------||---------------|Capacity Analysis Module:Vol/Sat: 0.01 0.42 0.42 0.15 0.39 0.39 0.02 0.02 0.02 0.09 0.09 0.04 Crit Moves: **** **** **** Green/Cycle: 0.13 0.53 0.53 0.19 0.59 0.59 0.21 0.21 0.21 0.21 0.21 0.21 Volume/Cap: 0.07 0.78 0.78 0.78 0.66 0.66 0.08 0.08 0.08 0.41 0.41 0.17 Delay/Veh: 43.8 24.0 24.0 56.6 16.6 16.6 36.7 36.7 36.7 39.9 39.9 37.6 User DelAdj: 1.00 1.00 1.00 1.00 1.00 1.00 1.00 1.00 1.00 1.00 1.00 1.00 AdjDel/Veh: 43.8 24.0 24.0 56.6 16.6 16.6 36.7 36.7 36.7 39.9 39.9 37.6 LOS by Move: D C C E B B D D D D D D HCM2kAvgQ: 1 21 21 11 17 17 1 1 1 4 4 2 ********************************************************************************Note: Queue reported is the number of cars per lane.
Traffix 8.0.0715 (c) 2008 Dowling Assoc. Licensed to RK ENGINEERING GROUP
Bryan Estrada
Typewritten Text
AM PEAK HOUR

MITIG8 - FORECAST YEAR + PRWed May 13, 2015 09:24:49 Page 1-1 -------------------------------------------------------------------------------- AGUA MANSA HIGH CUBE WAREHOUSE COUNTY OF SAN BERNARDINO FORECAST YEAR (2035) WITH PROJECT CONDITIONS -------------------------------------------------------------------------------- Level Of Service Computation Report 2000 HCM Operations Method (Future Volume Alternative) ********************************************************************************Intersection #1 CEDAR AVENUE (NS) AT EL RAVINO ROAD (EW) ********************************************************************************Cycle (sec): 125 Critical Vol./Cap.(X): 1.013Loss Time (sec): 8 Average Delay (sec/veh): 52.1Optimal Cycle: OPTIMIZED Level Of Service: D********************************************************************************Approach: North Bound South Bound East Bound West Bound Movement: L - T - R L - T - R L - T - R L - T - R ------------|---------------||---------------||---------------||---------------|Control: Protected Protected Permitted Permitted Rights: Include Include Include Include Min. Green: 10 0 0 10 23 23 10 14 14 10 24 24 Y+R: 4.0 4.0 4.0 4.0 4.0 4.0 4.0 4.0 4.0 4.0 4.0 4.0 Lanes: 1 0 1 1 0 1 0 1 1 0 0 0 1! 0 0 1 1 0 0 1 ------------|---------------||---------------||---------------||---------------|Volume Module:Base Vol: 10 1517 134 47 1199 12 13 10 20 172 18 69 Growth Adj: 1.00 1.00 1.00 1.00 1.00 1.00 1.00 1.00 1.00 1.00 1.00 1.00 Initial Bse: 10 1517 134 47 1199 12 13 10 20 172 18 69 Added Vol: 0 6 189 54 3 0 0 3 0 552 9 157 PasserByVol: 0 0 0 0 0 0 0 0 0 0 0 0 Initial Fut: 10 1523 323 101 1202 12 13 13 20 724 27 226 User Adj: 1.00 1.00 1.00 1.00 1.00 1.00 1.00 1.00 1.00 1.00 1.00 1.00 PHF Adj: 0.95 0.95 0.95 0.95 0.95 0.95 0.95 0.95 0.95 0.95 0.95 0.95 PHF Volume: 11 1603 340 106 1265 13 14 14 21 762 28 238 Reduct Vol: 0 0 0 0 0 0 0 0 0 0 0 0 Reduced Vol: 11 1603 340 106 1265 13 14 14 21 762 28 238 PCE Adj: 1.00 1.00 1.00 1.00 1.00 1.00 1.00 1.00 1.00 1.00 1.00 1.00 MLF Adj: 1.00 1.00 1.00 1.00 1.00 1.00 1.00 1.00 1.00 1.00 1.00 1.00 FinalVolume: 11 1603 340 106 1265 13 14 14 21 762 28 238 ------------|---------------||---------------||---------------||---------------|Saturation Flow Module:Sat/Lane: 1800 1800 1800 1800 1800 1800 1800 1800 1800 1800 1800 1800 Adjustment: 0.90 0.97 0.97 0.90 1.00 1.00 0.84 0.89 0.89 0.67 0.71 0.85 Lanes: 1.00 1.65 0.35 1.00 1.98 0.02 0.29 0.28 0.43 1.93 0.07 1.00 Final Sat.: 1615 2893 614 1615 3561 36 445 445 685 2325 87 1530 ------------|---------------||---------------||---------------||---------------|Capacity Analysis Module:Vol/Sat: 0.01 0.55 0.55 0.07 0.36 0.36 0.03 0.03 0.03 0.33 0.33 0.16 Crit Moves: **** **** **** Green/Cycle: 0.11 0.54 0.54 0.08 0.50 0.50 0.32 0.32 0.32 0.32 0.32 0.32 Volume/Cap: 0.06 1.03 1.03 0.82 0.70 0.70 0.10 0.10 0.10 1.03 1.03 0.49 Delay/Veh: 49.6 57.8 57.8 89.5 25.1 25.1 30.1 30.1 30.1 83.1 83.1 35.2 User DelAdj: 1.00 1.00 1.00 1.00 1.00 1.00 1.00 1.00 1.00 1.00 1.00 1.00 AdjDel/Veh: 49.6 57.8 57.8 89.5 25.1 25.1 30.1 30.1 30.1 83.1 83.1 35.2 LOS by Move: D E E F C C C C C F F D HCM2kAvgQ: 0 47 47 6 19 19 1 1 1 23 23 8 ********************************************************************************Note: Queue reported is the number of cars per lane.
Traffix 8.0.0715 (c) 2008 Dowling Assoc. Licensed to RK ENGINEERING GROUP
Bryan Estrada
Typewritten Text
PM PEAK HOUR

FORECAST YEAR + PROJ (AM) Tue May 12, 2015 12:40:51 Page 3-1 -------------------------------------------------------------------------------- AGUA MANSA HIGH CUBE WAREHOUSE COUNTY OF SAN BERNARDINO FORECAST YEAR (2035) WITH PROJECT CONDITIONS -------------------------------------------------------------------------------- Level Of Service Computation Report 2000 HCM Operations Method (Future Volume Alternative) ********************************************************************************Intersection #2 CACTUS AVENUE (NS) AT EL RAVINO ROAD (EW) ********************************************************************************Cycle (sec): 70 Critical Vol./Cap.(X): 0.598Loss Time (sec): 8 Average Delay (sec/veh): 20.4Optimal Cycle: OPTIMIZED Level Of Service: C********************************************************************************Approach: North Bound South Bound East Bound West Bound Movement: L - T - R L - T - R L - T - R L - T - R ------------|---------------||---------------||---------------||---------------|Control: Protected Protected Protected Permitted Rights: Include Include Include Include Min. Green: 0 0 0 10 0 0 10 0 0 0 0 0 Y+R: 4.0 4.0 4.0 4.0 4.0 4.0 4.0 4.0 4.0 4.0 4.0 4.0 Lanes: 0 0 0 0 0 1 0 0 0 1 0 1 0 0 0 0 0 0 1 0 ------------|---------------||---------------||---------------||---------------|Volume Module:Base Vol: 0 0 0 127 0 8 16 91 0 0 23 2 Growth Adj: 1.00 1.00 1.00 1.00 1.00 1.00 1.00 1.00 1.00 1.00 1.00 1.00 Initial Bse: 0 0 0 127 0 8 16 91 0 0 23 2 Added Vol: 0 0 0 14 0 216 143 64 0 0 223 55 PasserByVol: 0 0 0 0 0 0 0 0 0 0 0 0 Initial Fut: 0 0 0 141 0 224 159 155 0 0 246 57 User Adj: 1.00 1.00 1.00 1.00 1.00 1.00 1.00 1.00 1.00 1.00 1.00 1.00 PHF Adj: 0.95 0.95 0.95 0.95 0.95 0.95 0.95 0.95 0.95 0.95 0.95 0.95 PHF Volume: 0 0 0 148 0 236 167 163 0 0 259 60 Reduct Vol: 0 0 0 0 0 0 0 0 0 0 0 0 Reduced Vol: 0 0 0 148 0 236 167 163 0 0 259 60 PCE Adj: 1.00 1.00 1.00 1.00 1.00 1.00 1.00 1.00 1.00 1.00 1.00 1.00 MLF Adj: 1.00 1.00 1.00 1.00 1.00 1.00 1.00 1.00 1.00 1.00 1.00 1.00 FinalVolume: 0 0 0 148 0 236 167 163 0 0 259 60 ------------|---------------||---------------||---------------||---------------|Saturation Flow Module:Sat/Lane: 1800 1800 1800 1800 1800 1800 1800 1800 1800 1800 1800 1800 Adjustment: 0.94 1.00 1.00 0.90 1.00 0.85 0.92 0.98 1.00 0.94 0.98 0.98 Lanes: 0.00 0.00 0.00 1.00 0.00 1.00 0.52 0.48 0.00 0.00 0.81 0.19 Final Sat.: 0 0 0 1615 0 1530 863 841 0 0 1425 330 ------------|---------------||---------------||---------------||---------------|Capacity Analysis Module:Vol/Sat: 0.00 0.00 0.00 0.09 0.00 0.15 0.19 0.19 0.00 0.00 0.18 0.18 Crit Moves: **** **** **** Green/Cycle: 0.00 0.00 0.00 0.26 0.00 0.26 0.32 0.63 0.00 0.00 0.30 0.30 Volume/Cap: 0.00 0.00 0.00 0.36 0.00 0.60 0.60 0.31 0.00 0.00 0.60 0.60 Delay/Veh: 0.0 0.0 0.0 21.8 0.0 25.3 21.6 6.2 0.0 0.0 22.6 22.6 User DelAdj: 1.00 1.00 1.00 1.00 1.00 1.00 1.00 1.00 1.00 1.00 1.00 1.00 AdjDel/Veh: 0.0 0.0 0.0 21.8 0.0 25.3 21.6 6.2 0.0 0.0 22.6 22.6 LOS by Move: A A A C A C C A A A C C HCM2kAvgQ: 0 0 0 3 0 5 4 2 0 0 7 7 ********************************************************************************Note: Queue reported is the number of cars per lane.
Traffix 8.0.0715 (c) 2008 Dowling Assoc. Licensed to RK ENGINEERING GROUP

FORECAST YEAR + PROJ (PM) Tue May 12, 2015 12:41:21 Page 3-1 -------------------------------------------------------------------------------- AGUA MANSA HIGH CUBE WAREHOUSE COUNTY OF SAN BERNARDINO FORECAST YEAR (2035) WITH PROJECT CONDITIONS -------------------------------------------------------------------------------- Level Of Service Computation Report 2000 HCM Operations Method (Future Volume Alternative) ********************************************************************************Intersection #2 CACTUS AVENUE (NS) AT EL RAVINO ROAD (EW) ********************************************************************************Cycle (sec): 75 Critical Vol./Cap.(X): 0.935Loss Time (sec): 8 Average Delay (sec/veh): 39.4Optimal Cycle: OPTIMIZED Level Of Service: D********************************************************************************Approach: North Bound South Bound East Bound West Bound Movement: L - T - R L - T - R L - T - R L - T - R ------------|---------------||---------------||---------------||---------------|Control: Protected Protected Protected Permitted Rights: Include Include Include Include Min. Green: 0 0 0 10 0 0 10 0 0 0 0 0 Y+R: 4.0 4.0 4.0 4.0 4.0 4.0 4.0 4.0 4.0 4.0 4.0 4.0 Lanes: 0 0 0 0 0 1 0 0 0 1 0 1 0 0 0 0 0 0 1 0 ------------|---------------||---------------||---------------||---------------|Volume Module:Base Vol: 0 0 0 50 0 54 38 104 0 0 181 194 Growth Adj: 1.00 1.00 1.00 1.00 1.00 1.00 1.00 1.00 1.00 1.00 1.00 1.00 Initial Bse: 0 0 0 50 0 54 38 104 0 0 181 194 Added Vol: 0 0 0 52 0 186 247 212 0 0 88 20 PasserByVol: 0 0 0 0 0 0 0 0 0 0 0 0 Initial Fut: 0 0 0 102 0 240 285 316 0 0 269 214 User Adj: 1.00 1.00 1.00 1.00 1.00 1.00 1.00 1.00 1.00 1.00 1.00 1.00 PHF Adj: 0.95 0.95 0.95 0.95 0.95 0.95 0.95 0.95 0.95 0.95 0.95 0.95 PHF Volume: 0 0 0 107 0 253 300 333 0 0 283 225 Reduct Vol: 0 0 0 0 0 0 0 0 0 0 0 0 Reduced Vol: 0 0 0 107 0 253 300 333 0 0 283 225 PCE Adj: 1.00 1.00 1.00 1.00 1.00 1.00 1.00 1.00 1.00 1.00 1.00 1.00 MLF Adj: 1.00 1.00 1.00 1.00 1.00 1.00 1.00 1.00 1.00 1.00 1.00 1.00 FinalVolume: 0 0 0 107 0 253 300 333 0 0 283 225 ------------|---------------||---------------||---------------||---------------|Saturation Flow Module:Sat/Lane: 1800 1800 1800 1800 1800 1800 1800 1800 1800 1800 1800 1800 Adjustment: 0.94 1.00 1.00 0.90 1.00 0.85 0.92 0.98 1.00 0.94 0.94 0.94 Lanes: 0.00 0.00 0.00 1.00 0.00 1.00 0.49 0.51 0.00 0.00 0.56 0.44 Final Sat.: 0 0 0 1615 0 1530 811 900 0 0 942 750 ------------|---------------||---------------||---------------||---------------|Capacity Analysis Module:Vol/Sat: 0.00 0.00 0.00 0.07 0.00 0.17 0.37 0.37 0.00 0.00 0.30 0.30 Crit Moves: **** **** **** Green/Cycle: 0.00 0.00 0.00 0.18 0.00 0.18 0.40 0.72 0.00 0.00 0.32 0.32 Volume/Cap: 0.00 0.00 0.00 0.38 0.00 0.93 0.94 0.52 0.00 0.00 0.94 0.94 Delay/Veh: 0.0 0.0 0.0 28.1 0.0 68.0 42.0 5.2 0.0 0.0 48.3 48.3 User DelAdj: 1.00 1.00 1.00 1.00 1.00 1.00 1.00 1.00 1.00 1.00 1.00 1.00 AdjDel/Veh: 0.0 0.0 0.0 28.1 0.0 68.0 42.0 5.2 0.0 0.0 48.3 48.3 LOS by Move: A A A C A E D A A A D D HCM2kAvgQ: 0 0 0 3 0 10 11 4 0 0 16 16 ********************************************************************************Note: Queue reported is the number of cars per lane.
Traffix 8.0.0715 (c) 2008 Dowling Assoc. Licensed to RK ENGINEERING GROUP

FORECAST YEAR + PROJ (AM) Tue May 12, 2015 12:40:51 Page 4-1 -------------------------------------------------------------------------------- AGUA MANSA HIGH CUBE WAREHOUSE COUNTY OF SAN BERNARDINO FORECAST YEAR (2035) WITH PROJECT CONDITIONS -------------------------------------------------------------------------------- Level Of Service Computation Report 2000 HCM Unsignalized Method (Future Volume Alternative) ********************************************************************************Intersection #3 HALL AVENUE (NS) AT EL RAVINO ROAD (EW) ********************************************************************************Average Delay (sec/veh): 1.1 Worst Case Level Of Service: B[ 13.1]********************************************************************************Approach: North Bound South Bound East Bound West Bound Movement: L - T - R L - T - R L - T - R L - T - R ------------|---------------||---------------||---------------||---------------|Control: Stop Sign Stop Sign Uncontrolled UncontrolledRights: Include Include Include Include Lanes: 0 0 1! 0 0 0 0 1! 0 0 0 0 1! 0 0 0 0 1! 0 0 ------------|---------------||---------------||---------------||---------------|Volume Module:Base Vol: 4 2 20 18 5 6 6 59 159 2 22 5 Growth Adj: 1.00 1.00 1.00 1.00 1.00 1.00 1.00 1.00 1.00 1.00 1.00 1.00 Initial Bse: 4 2 20 18 5 6 6 59 159 2 22 5 Added Vol: 0 0 0 0 0 0 0 78 0 0 278 0 PasserByVol: 0 0 0 0 0 0 0 0 0 0 0 0 Initial Fut: 4 2 20 18 5 6 6 137 159 2 300 5 User Adj: 1.00 1.00 1.00 1.00 1.00 1.00 1.00 1.00 1.00 1.00 1.00 1.00 PHF Adj: 1.00 1.00 1.00 1.00 1.00 1.00 1.00 1.00 1.00 1.00 1.00 1.00 PHF Volume: 4 2 20 18 5 6 6 137 159 2 300 5 Reduct Vol: 0 0 0 0 0 0 0 0 0 0 0 0 FinalVolume: 4 2 20 18 5 6 6 137 159 2 300 5 ------------|---------------||---------------||---------------||---------------|Critical Gap Module:Critical Gp: 7.1 6.5 6.2 7.1 6.5 6.2 4.1 xxxx xxxxx 4.1 xxxx xxxxx FollowUpTim: 3.5 4.0 3.3 3.5 4.0 3.3 2.2 xxxx xxxxx 2.2 xxxx xxxxx ------------|---------------||---------------||---------------||---------------|Capacity Module:Cnflict Vol: 541 538 217 546 615 303 305 xxxx xxxxx 296 xxxx xxxxx Potent Cap.: 455 453 828 452 409 742 1267 xxxx xxxxx 1277 xxxx xxxxx Move Cap.: 445 450 828 437 407 742 1267 xxxx xxxxx 1277 xxxx xxxxx Volume/Cap: 0.01 0.00 0.02 0.04 0.01 0.01 0.00 xxxx xxxx 0.00 xxxx xxxx ------------|---------------||---------------||---------------||---------------|Level Of Service Module:2Way95thQ: xxxx xxxx xxxxx xxxx xxxx xxxxx 0.0 xxxx xxxxx 0.0 xxxx xxxxx Control Del:xxxxx xxxx xxxxx xxxxx xxxx xxxxx 7.9 xxxx xxxxx 7.8 xxxx xxxxx LOS by Move: * * * * * * A * * A * * Movement: LT - LTR - RT LT - LTR - RT LT - LTR - RT LT - LTR - RT Shared Cap.: xxxx 692 xxxxx xxxx 471 xxxxx xxxx xxxx xxxxx xxxx xxxx xxxxx SharedQueue:xxxxx 0.1 xxxxx xxxxx 0.2 xxxxx xxxxx xxxx xxxxx xxxxx xxxx xxxxx Shrd ConDel:xxxxx 10.4 xxxxx xxxxx 13.1 xxxxx xxxxx xxxx xxxxx xxxxx xxxx xxxxx Shared LOS: * B * * B * * * * * * * ApproachDel: 10.4 13.1 xxxxxx xxxxxxApproachLOS: B B * * ********************************************************************************Note: Queue reported is the number of cars per lane.********************************************************************************
Traffix 8.0.0715 (c) 2008 Dowling Assoc. Licensed to RK ENGINEERING GROUP

FORECAST YEAR + PROJ (PM) Tue May 12, 2015 12:41:21 Page 4-1 -------------------------------------------------------------------------------- AGUA MANSA HIGH CUBE WAREHOUSE COUNTY OF SAN BERNARDINO FORECAST YEAR (2035) WITH PROJECT CONDITIONS -------------------------------------------------------------------------------- Level Of Service Computation Report 2000 HCM Unsignalized Method (Future Volume Alternative) ********************************************************************************Intersection #3 HALL AVENUE (NS) AT EL RAVINO ROAD (EW) ********************************************************************************Average Delay (sec/veh): 11.8 Worst Case Level Of Service: E[ 37.1]********************************************************************************Approach: North Bound South Bound East Bound West Bound Movement: L - T - R L - T - R L - T - R L - T - R ------------|---------------||---------------||---------------||---------------|Control: Stop Sign Stop Sign Uncontrolled UncontrolledRights: Include Include Include Include Lanes: 0 0 1! 0 0 0 0 1! 0 0 0 0 1! 0 0 0 0 0 1 0 ------------|---------------||---------------||---------------||---------------|Volume Module:Base Vol: 230 6 85 13 6 2 8 85 69 0 145 21 Growth Adj: 1.00 1.00 1.00 1.00 1.00 1.00 1.00 1.00 1.00 1.00 1.00 1.00 Initial Bse: 230 6 85 13 6 2 8 85 69 0 145 21 Added Vol: 0 0 0 0 0 0 0 264 0 0 109 0 PasserByVol: 0 0 0 0 0 0 0 0 0 0 0 0 Initial Fut: 230 6 85 13 6 2 8 349 69 0 254 21 User Adj: 1.00 1.00 1.00 1.00 1.00 1.00 1.00 1.00 1.00 1.00 1.00 1.00 PHF Adj: 1.00 1.00 1.00 1.00 1.00 1.00 1.00 1.00 1.00 1.00 1.00 1.00 PHF Volume: 230 6 85 13 6 2 8 349 69 0 254 21 Reduct Vol: 0 0 0 0 0 0 0 0 0 0 0 0 FinalVolume: 230 6 85 13 6 2 8 349 69 0 254 21 ------------|---------------||---------------||---------------||---------------|Critical Gap Module:Critical Gp: 7.1 6.5 6.2 7.1 6.5 6.2 4.1 xxxx xxxxx xxxxx xxxx xxxxx FollowUpTim: 3.5 4.0 3.3 3.5 4.0 3.3 2.2 xxxx xxxxx xxxxx xxxx xxxxx ------------|---------------||---------------||---------------||---------------|Capacity Module:Cnflict Vol: 668 675 384 710 699 265 275 xxxx xxxxx xxxx xxxx xxxxx Potent Cap.: 375 378 668 351 367 779 1300 xxxx xxxxx xxxx xxxx xxxxx Move Cap.: 367 376 668 302 364 779 1300 xxxx xxxxx xxxx xxxx xxxxx Volume/Cap: 0.63 0.02 0.13 0.04 0.02 0.00 0.01 xxxx xxxx xxxx xxxx xxxx ------------|---------------||---------------||---------------||---------------|Level Of Service Module:2Way95thQ: xxxx xxxx xxxxx xxxx xxxx xxxxx 0.0 xxxx xxxxx xxxx xxxx xxxxx Control Del:xxxxx xxxx xxxxx xxxxx xxxx xxxxx 7.8 xxxx xxxxx xxxxx xxxx xxxxx LOS by Move: * * * * * * A * * * * * Movement: LT - LTR - RT LT - LTR - RT LT - LTR - RT LT - LTR - RT Shared Cap.: xxxx 417 xxxxx xxxx 338 xxxxx xxxx xxxx xxxxx xxxx xxxx xxxxx SharedQueue:xxxxx 6.5 xxxxx xxxxx 0.2 xxxxx xxxxx xxxx xxxxx xxxxx xxxx xxxxx Shrd ConDel:xxxxx 37.1 xxxxx xxxxx 16.4 xxxxx xxxxx xxxx xxxxx xxxxx xxxx xxxxx Shared LOS: * E * * C * * * * * * * ApproachDel: 37.1 16.4 xxxxxx xxxxxxApproachLOS: E C * * ********************************************************************************Note: Queue reported is the number of cars per lane.********************************************************************************
Traffix 8.0.0715 (c) 2008 Dowling Assoc. Licensed to RK ENGINEERING GROUP

MITIG8 - FORECAST YEAR + PRWed May 13, 2015 09:23:25 Page 1-1 -------------------------------------------------------------------------------- AGUA MANSA HIGH CUBE WAREHOUSE COUNTY OF SAN BERNARDINO FORECAST YEAR (2035) WITH PROJECT CONDITIONS -------------------------------------------------------------------------------- Level Of Service Computation Report 2000 HCM Unsignalized Method (Future Volume Alternative) ********************************************************************************Intersection #3 HALL AVENUE (NS) AT EL RAVINO ROAD (EW) ********************************************************************************Average Delay (sec/veh): 1.1 Worst Case Level Of Service: B[ 13.1]********************************************************************************Approach: North Bound South Bound East Bound West Bound Movement: L - T - R L - T - R L - T - R L - T - R ------------|---------------||---------------||---------------||---------------|Control: Stop Sign Stop Sign Uncontrolled UncontrolledRights: Include Include Include Include Lanes: 1 0 0 1 0 0 0 1! 0 0 0 0 1! 0 0 0 0 1! 0 0 ------------|---------------||---------------||---------------||---------------|Volume Module:Base Vol: 4 2 20 18 5 6 6 59 159 2 22 5 Growth Adj: 1.00 1.00 1.00 1.00 1.00 1.00 1.00 1.00 1.00 1.00 1.00 1.00 Initial Bse: 4 2 20 18 5 6 6 59 159 2 22 5 Added Vol: 0 0 0 0 0 0 0 78 0 0 278 0 PasserByVol: 0 0 0 0 0 0 0 0 0 0 0 0 Initial Fut: 4 2 20 18 5 6 6 137 159 2 300 5 User Adj: 1.00 1.00 1.00 1.00 1.00 1.00 1.00 1.00 1.00 1.00 1.00 1.00 PHF Adj: 1.00 1.00 1.00 1.00 1.00 1.00 1.00 1.00 1.00 1.00 1.00 1.00 PHF Volume: 4 2 20 18 5 6 6 137 159 2 300 5 Reduct Vol: 0 0 0 0 0 0 0 0 0 0 0 0 FinalVolume: 4 2 20 18 5 6 6 137 159 2 300 5 ------------|---------------||---------------||---------------||---------------|Critical Gap Module:Critical Gp: 7.1 6.5 6.2 7.1 6.5 6.2 4.1 xxxx xxxxx 4.1 xxxx xxxxx FollowUpTim: 3.5 4.0 3.3 3.5 4.0 3.3 2.2 xxxx xxxxx 2.2 xxxx xxxxx ------------|---------------||---------------||---------------||---------------|Capacity Module:Cnflict Vol: 541 538 217 546 615 303 305 xxxx xxxxx 296 xxxx xxxxx Potent Cap.: 455 453 828 452 409 742 1267 xxxx xxxxx 1277 xxxx xxxxx Move Cap.: 445 450 828 437 407 742 1267 xxxx xxxxx 1277 xxxx xxxxx Volume/Cap: 0.01 0.00 0.02 0.04 0.01 0.01 0.00 xxxx xxxx 0.00 xxxx xxxx ------------|---------------||---------------||---------------||---------------|Level Of Service Module:2Way95thQ: 0.0 xxxx xxxxx xxxx xxxx xxxxx 0.0 xxxx xxxxx 0.0 xxxx xxxxx Control Del: 13.2 xxxx xxxxx xxxxx xxxx xxxxx 7.9 xxxx xxxxx 7.8 xxxx xxxxx LOS by Move: B * * * * * A * * A * * Movement: LT - LTR - RT LT - LTR - RT LT - LTR - RT LT - LTR - RT Shared Cap.: xxxx xxxx 770 xxxx 471 xxxxx xxxx xxxx xxxxx xxxx xxxx xxxxx SharedQueue:xxxxx xxxx 0.1 xxxxx 0.2 xxxxx xxxxx xxxx xxxxx xxxxx xxxx xxxxx Shrd ConDel:xxxxx xxxx 9.8 xxxxx 13.1 xxxxx xxxxx xxxx xxxxx xxxxx xxxx xxxxx Shared LOS: * * A * B * * * * * * * ApproachDel: 10.3 13.1 xxxxxx xxxxxxApproachLOS: B B * * ********************************************************************************Note: Queue reported is the number of cars per lane.********************************************************************************
Traffix 8.0.0715 (c) 2008 Dowling Assoc. Licensed to RK ENGINEERING GROUP
Bryan Estrada
Typewritten Text
AM PEAK HOUR

MITIG8 - FORECAST YEAR + PRWed May 13, 2015 09:22:37 Page 1-1 -------------------------------------------------------------------------------- AGUA MANSA HIGH CUBE WAREHOUSE COUNTY OF SAN BERNARDINO FORECAST YEAR (2035) WITH PROJECT CONDITIONS -------------------------------------------------------------------------------- Level Of Service Computation Report 2000 HCM Unsignalized Method (Future Volume Alternative) ********************************************************************************Intersection #3 HALL AVENUE (NS) AT EL RAVINO ROAD (EW) ********************************************************************************Average Delay (sec/veh): 8.0 Worst Case Level Of Service: C[ 24.7]********************************************************************************Approach: North Bound South Bound East Bound West Bound Movement: L - T - R L - T - R L - T - R L - T - R ------------|---------------||---------------||---------------||---------------|Control: Stop Sign Stop Sign Uncontrolled UncontrolledRights: Include Include Include Include Lanes: 1 0 0 1 0 0 0 1! 0 0 0 0 1! 0 0 0 0 0 1 0 ------------|---------------||---------------||---------------||---------------|Volume Module:Base Vol: 230 6 85 13 6 2 8 85 69 0 145 21 Growth Adj: 1.00 1.00 1.00 1.00 1.00 1.00 1.00 1.00 1.00 1.00 1.00 1.00 Initial Bse: 230 6 85 13 6 2 8 85 69 0 145 21 Added Vol: 0 0 0 0 0 0 0 264 0 0 109 0 PasserByVol: 0 0 0 0 0 0 0 0 0 0 0 0 Initial Fut: 230 6 85 13 6 2 8 349 69 0 254 21 User Adj: 1.00 1.00 1.00 1.00 1.00 1.00 1.00 1.00 1.00 1.00 1.00 1.00 PHF Adj: 1.00 1.00 1.00 1.00 1.00 1.00 1.00 1.00 1.00 1.00 1.00 1.00 PHF Volume: 230 6 85 13 6 2 8 349 69 0 254 21 Reduct Vol: 0 0 0 0 0 0 0 0 0 0 0 0 FinalVolume: 230 6 85 13 6 2 8 349 69 0 254 21 ------------|---------------||---------------||---------------||---------------|Critical Gap Module:Critical Gp: 7.1 6.5 6.2 7.1 6.5 6.2 4.1 xxxx xxxxx xxxxx xxxx xxxxx FollowUpTim: 3.5 4.0 3.3 3.5 4.0 3.3 2.2 xxxx xxxxx xxxxx xxxx xxxxx ------------|---------------||---------------||---------------||---------------|Capacity Module:Cnflict Vol: 668 675 384 710 699 265 275 xxxx xxxxx xxxx xxxx xxxxx Potent Cap.: 375 378 668 351 367 779 1300 xxxx xxxxx xxxx xxxx xxxxx Move Cap.: 367 376 668 302 364 779 1300 xxxx xxxxx xxxx xxxx xxxxx Volume/Cap: 0.63 0.02 0.13 0.04 0.02 0.00 0.01 xxxx xxxx xxxx xxxx xxxx ------------|---------------||---------------||---------------||---------------|Level Of Service Module:2Way95thQ: 4.1 xxxx xxxxx xxxx xxxx xxxxx 0.0 xxxx xxxxx xxxx xxxx xxxxx Control Del: 29.9 xxxx xxxxx xxxxx xxxx xxxxx 7.8 xxxx xxxxx xxxxx xxxx xxxxx LOS by Move: D * * * * * A * * * * * Movement: LT - LTR - RT LT - LTR - RT LT - LTR - RT LT - LTR - RT Shared Cap.: xxxx xxxx 636 xxxx 338 xxxxx xxxx xxxx xxxxx xxxx xxxx xxxxx SharedQueue:xxxxx xxxx 0.5 xxxxx 0.2 xxxxx xxxxx xxxx xxxxx xxxxx xxxx xxxxx Shrd ConDel:xxxxx xxxx 11.6 xxxxx 16.4 xxxxx xxxxx xxxx xxxxx xxxxx xxxx xxxxx Shared LOS: * * B * C * * * * * * * ApproachDel: 24.7 16.4 xxxxxx xxxxxxApproachLOS: C C * * ********************************************************************************Note: Queue reported is the number of cars per lane.********************************************************************************
Traffix 8.0.0715 (c) 2008 Dowling Assoc. Licensed to RK ENGINEERING GROUP
Bryan Estrada
Typewritten Text
PM PEAK HOUR
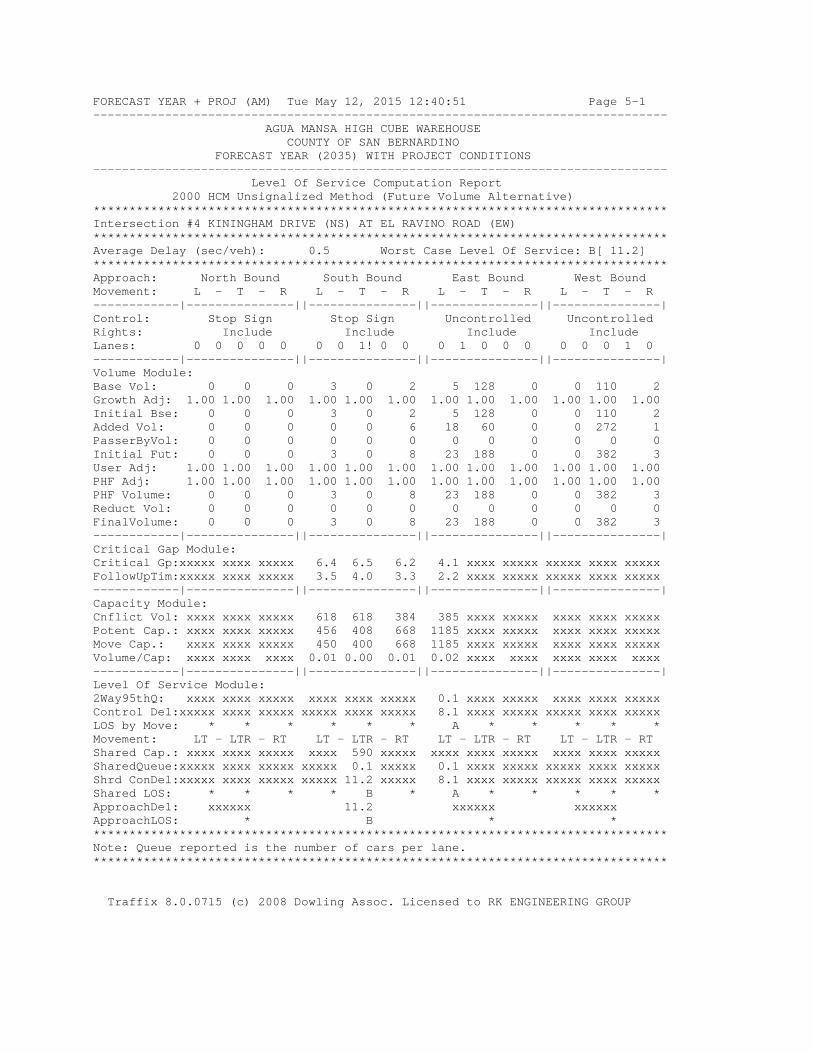
FORECAST YEAR + PROJ (AM) Tue May 12, 2015 12:40:51 Page 5-1 -------------------------------------------------------------------------------- AGUA MANSA HIGH CUBE WAREHOUSE COUNTY OF SAN BERNARDINO FORECAST YEAR (2035) WITH PROJECT CONDITIONS -------------------------------------------------------------------------------- Level Of Service Computation Report 2000 HCM Unsignalized Method (Future Volume Alternative) ********************************************************************************Intersection #4 KININGHAM DRIVE (NS) AT EL RAVINO ROAD (EW) ********************************************************************************Average Delay (sec/veh): 0.5 Worst Case Level Of Service: B[ 11.2]********************************************************************************Approach: North Bound South Bound East Bound West Bound Movement: L - T - R L - T - R L - T - R L - T - R ------------|---------------||---------------||---------------||---------------|Control: Stop Sign Stop Sign Uncontrolled UncontrolledRights: Include Include Include Include Lanes: 0 0 0 0 0 0 0 1! 0 0 0 1 0 0 0 0 0 0 1 0 ------------|---------------||---------------||---------------||---------------|Volume Module:Base Vol: 0 0 0 3 0 2 5 128 0 0 110 2 Growth Adj: 1.00 1.00 1.00 1.00 1.00 1.00 1.00 1.00 1.00 1.00 1.00 1.00 Initial Bse: 0 0 0 3 0 2 5 128 0 0 110 2 Added Vol: 0 0 0 0 0 6 18 60 0 0 272 1 PasserByVol: 0 0 0 0 0 0 0 0 0 0 0 0 Initial Fut: 0 0 0 3 0 8 23 188 0 0 382 3 User Adj: 1.00 1.00 1.00 1.00 1.00 1.00 1.00 1.00 1.00 1.00 1.00 1.00 PHF Adj: 1.00 1.00 1.00 1.00 1.00 1.00 1.00 1.00 1.00 1.00 1.00 1.00 PHF Volume: 0 0 0 3 0 8 23 188 0 0 382 3 Reduct Vol: 0 0 0 0 0 0 0 0 0 0 0 0 FinalVolume: 0 0 0 3 0 8 23 188 0 0 382 3 ------------|---------------||---------------||---------------||---------------|Critical Gap Module:Critical Gp:xxxxx xxxx xxxxx 6.4 6.5 6.2 4.1 xxxx xxxxx xxxxx xxxx xxxxx FollowUpTim:xxxxx xxxx xxxxx 3.5 4.0 3.3 2.2 xxxx xxxxx xxxxx xxxx xxxxx ------------|---------------||---------------||---------------||---------------|Capacity Module:Cnflict Vol: xxxx xxxx xxxxx 618 618 384 385 xxxx xxxxx xxxx xxxx xxxxx Potent Cap.: xxxx xxxx xxxxx 456 408 668 1185 xxxx xxxxx xxxx xxxx xxxxx Move Cap.: xxxx xxxx xxxxx 450 400 668 1185 xxxx xxxxx xxxx xxxx xxxxx Volume/Cap: xxxx xxxx xxxx 0.01 0.00 0.01 0.02 xxxx xxxx xxxx xxxx xxxx ------------|---------------||---------------||---------------||---------------|Level Of Service Module:2Way95thQ: xxxx xxxx xxxxx xxxx xxxx xxxxx 0.1 xxxx xxxxx xxxx xxxx xxxxx Control Del:xxxxx xxxx xxxxx xxxxx xxxx xxxxx 8.1 xxxx xxxxx xxxxx xxxx xxxxx LOS by Move: * * * * * * A * * * * * Movement: LT - LTR - RT LT - LTR - RT LT - LTR - RT LT - LTR - RT Shared Cap.: xxxx xxxx xxxxx xxxx 590 xxxxx xxxx xxxx xxxxx xxxx xxxx xxxxx SharedQueue:xxxxx xxxx xxxxx xxxxx 0.1 xxxxx 0.1 xxxx xxxxx xxxxx xxxx xxxxx Shrd ConDel:xxxxx xxxx xxxxx xxxxx 11.2 xxxxx 8.1 xxxx xxxxx xxxxx xxxx xxxxx Shared LOS: * * * * B * A * * * * * ApproachDel: xxxxxx 11.2 xxxxxx xxxxxxApproachLOS: * B * * ********************************************************************************Note: Queue reported is the number of cars per lane.********************************************************************************
Traffix 8.0.0715 (c) 2008 Dowling Assoc. Licensed to RK ENGINEERING GROUP

FORECAST YEAR + PROJ (PM) Tue May 12, 2015 12:41:21 Page 5-1 -------------------------------------------------------------------------------- AGUA MANSA HIGH CUBE WAREHOUSE COUNTY OF SAN BERNARDINO FORECAST YEAR (2035) WITH PROJECT CONDITIONS -------------------------------------------------------------------------------- Level Of Service Computation Report 2000 HCM Unsignalized Method (Future Volume Alternative) ********************************************************************************Intersection #4 KININGHAM DRIVE (NS) AT EL RAVINO ROAD (EW) ********************************************************************************Average Delay (sec/veh): 0.8 Worst Case Level Of Service: B[ 10.3]********************************************************************************Approach: North Bound South Bound East Bound West Bound Movement: L - T - R L - T - R L - T - R L - T - R ------------|---------------||---------------||---------------||---------------|Control: Stop Sign Stop Sign Uncontrolled UncontrolledRights: Include Include Include Include Lanes: 0 0 0 0 0 0 0 1! 0 0 0 1 0 0 0 0 0 0 1 0 ------------|---------------||---------------||---------------||---------------|Volume Module:Base Vol: 0 0 0 3 0 13 18 137 0 0 133 15 Growth Adj: 1.00 1.00 1.00 1.00 1.00 1.00 1.00 1.00 1.00 1.00 1.00 1.00 Initial Bse: 0 0 0 3 0 13 18 137 0 0 133 15 Added Vol: 0 0 0 2 0 19 6 258 0 0 90 1 PasserByVol: 0 0 0 0 0 0 0 0 0 0 0 0 Initial Fut: 0 0 0 5 0 32 24 395 0 0 223 16 User Adj: 1.00 1.00 1.00 1.00 1.00 1.00 1.00 1.00 1.00 1.00 1.00 1.00 PHF Adj: 1.00 1.00 1.00 1.00 1.00 1.00 1.00 1.00 1.00 1.00 1.00 1.00 PHF Volume: 0 0 0 5 0 32 24 395 0 0 223 16 Reduct Vol: 0 0 0 0 0 0 0 0 0 0 0 0 FinalVolume: 0 0 0 5 0 32 24 395 0 0 223 16 ------------|---------------||---------------||---------------||---------------|Critical Gap Module:Critical Gp:xxxxx xxxx xxxxx 6.4 6.5 6.2 4.1 xxxx xxxxx xxxxx xxxx xxxxx FollowUpTim:xxxxx xxxx xxxxx 3.5 4.0 3.3 2.2 xxxx xxxxx xxxxx xxxx xxxxx ------------|---------------||---------------||---------------||---------------|Capacity Module:Cnflict Vol: xxxx xxxx xxxxx 674 674 231 239 xxxx xxxxx xxxx xxxx xxxxx Potent Cap.: xxxx xxxx xxxxx 423 379 813 1340 xxxx xxxxx xxxx xxxx xxxxx Move Cap.: xxxx xxxx xxxxx 417 372 813 1340 xxxx xxxxx xxxx xxxx xxxxx Volume/Cap: xxxx xxxx xxxx 0.01 0.00 0.04 0.02 xxxx xxxx xxxx xxxx xxxx ------------|---------------||---------------||---------------||---------------|Level Of Service Module:2Way95thQ: xxxx xxxx xxxxx xxxx xxxx xxxxx 0.1 xxxx xxxxx xxxx xxxx xxxxx Control Del:xxxxx xxxx xxxxx xxxxx xxxx xxxxx 7.7 xxxx xxxxx xxxxx xxxx xxxxx LOS by Move: * * * * * * A * * * * * Movement: LT - LTR - RT LT - LTR - RT LT - LTR - RT LT - LTR - RT Shared Cap.: xxxx xxxx xxxxx xxxx 721 xxxxx xxxx xxxx xxxxx xxxx xxxx xxxxx SharedQueue:xxxxx xxxx xxxxx xxxxx 0.2 xxxxx 0.1 xxxx xxxxx xxxxx xxxx xxxxx Shrd ConDel:xxxxx xxxx xxxxx xxxxx 10.3 xxxxx 7.7 xxxx xxxxx xxxxx xxxx xxxxx Shared LOS: * * * * B * A * * * * * ApproachDel: xxxxxx 10.3 xxxxxx xxxxxxApproachLOS: * B * * ********************************************************************************Note: Queue reported is the number of cars per lane.********************************************************************************
Traffix 8.0.0715 (c) 2008 Dowling Assoc. Licensed to RK ENGINEERING GROUP

FORECAST YEAR + PROJ (AM) Tue May 12, 2015 12:40:51 Page 6-1 -------------------------------------------------------------------------------- AGUA MANSA HIGH CUBE WAREHOUSE COUNTY OF SAN BERNARDINO FORECAST YEAR (2035) WITH PROJECT CONDITIONS -------------------------------------------------------------------------------- Level Of Service Computation Report 2000 HCM Unsignalized Method (Future Volume Alternative) ********************************************************************************Intersection #5 AGUA MANSA ROAD (NS) AT EL RAVINO ROAD (EW) ********************************************************************************Average Delay (sec/veh): 7.7 Worst Case Level Of Service: F[141.3]********************************************************************************Approach: North Bound South Bound East Bound West Bound Movement: L - T - R L - T - R L - T - R L - T - R ------------|---------------||---------------||---------------||---------------|Control: Uncontrolled Uncontrolled Stop Sign Stop Sign Rights: Include Include Ignore Include Lanes: 1 0 1 0 0 0 0 0 1 0 1 0 0 0 1 0 0 0 0 0 ------------|---------------||---------------||---------------||---------------|Volume Module:Base Vol: 2 401 0 0 849 21 50 0 10 0 0 0 Growth Adj: 1.00 1.00 1.00 1.00 1.00 1.00 1.00 1.00 1.00 1.00 1.00 1.00 Initial Bse: 2 401 0 0 849 21 50 0 10 0 0 0 Added Vol: 139 24 0 0 24 135 29 0 30 0 0 0 PasserByVol: 0 0 0 0 0 0 0 0 0 0 0 0 Initial Fut: 141 425 0 0 873 156 79 0 40 0 0 0 User Adj: 1.00 1.00 1.00 1.00 1.00 1.00 1.00 1.00 0.00 1.00 1.00 1.00 PHF Adj: 1.00 1.00 1.00 1.00 1.00 1.00 1.00 1.00 0.00 1.00 1.00 1.00 PHF Volume: 141 425 0 0 873 156 79 0 0 0 0 0 Reduct Vol: 0 0 0 0 0 0 0 0 0 0 0 0 FinalVolume: 141 425 0 0 873 156 79 0 0 0 0 0 ------------|---------------||---------------||---------------||---------------|Critical Gap Module:Critical Gp: 4.1 xxxx xxxxx xxxxx xxxx xxxxx 6.4 xxxx 6.2 xxxxx xxxx xxxxx FollowUpTim: 2.2 xxxx xxxxx xxxxx xxxx xxxxx 3.5 xxxx 3.3 xxxxx xxxx xxxxx ------------|---------------||---------------||---------------||---------------|Capacity Module:Cnflict Vol: 1029 xxxx xxxxx xxxx xxxx xxxxx 1658 xxxx 951 xxxx xxxx xxxxx Potent Cap.: 683 xxxx xxxxx xxxx xxxx xxxxx 109 xxxx 318 xxxx xxxx xxxxx Move Cap.: 683 xxxx xxxxx xxxx xxxx xxxxx 91 xxxx 318 xxxx xxxx xxxxx Volume/Cap: 0.21 xxxx xxxx xxxx xxxx xxxx 0.86 xxxx 0.00 xxxx xxxx xxxx ------------|---------------||---------------||---------------||---------------|Level Of Service Module:2Way95thQ: 0.8 xxxx xxxxx xxxx xxxx xxxxx 4.7 xxxx xxxxx xxxx xxxx xxxxx Control Del: 11.6 xxxx xxxxx xxxxx xxxx xxxxx 141.3 xxxx xxxxx xxxxx xxxx xxxxx LOS by Move: B * * * * * F * * * * * Movement: LT - LTR - RT LT - LTR - RT LT - LTR - RT LT - LTR - RT Shared Cap.: xxxx xxxx xxxxx xxxx xxxx xxxxx xxxx xxxx xxxxx xxxx xxxx xxxxx SharedQueue:xxxxx xxxx xxxxx xxxxx xxxx xxxxx xxxxx xxxx xxxxx xxxxx xxxx xxxxx Shrd ConDel:xxxxx xxxx xxxxx xxxxx xxxx xxxxx xxxxx xxxx xxxxx xxxxx xxxx xxxxx Shared LOS: * * * * * * * * * * * * ApproachDel: xxxxxx xxxxxx 141.3 xxxxxxApproachLOS: * * F * ********************************************************************************Note: Queue reported is the number of cars per lane.********************************************************************************
Traffix 8.0.0715 (c) 2008 Dowling Assoc. Licensed to RK ENGINEERING GROUP

FORECAST YEAR + PROJ (PM) Tue May 12, 2015 12:41:21 Page 6-1 -------------------------------------------------------------------------------- AGUA MANSA HIGH CUBE WAREHOUSE COUNTY OF SAN BERNARDINO FORECAST YEAR (2035) WITH PROJECT CONDITIONS -------------------------------------------------------------------------------- Level Of Service Computation Report 2000 HCM Unsignalized Method (Future Volume Alternative) ********************************************************************************Intersection #5 AGUA MANSA ROAD (NS) AT EL RAVINO ROAD (EW) ********************************************************************************Average Delay (sec/veh): 206.2 Worst Case Level Of Service: F[1560.1]********************************************************************************Approach: North Bound South Bound East Bound West Bound Movement: L - T - R L - T - R L - T - R L - T - R ------------|---------------||---------------||---------------||---------------|Control: Uncontrolled Uncontrolled Stop Sign Stop Sign Rights: Include Include Ignore Include Lanes: 1 0 1 0 0 0 0 0 1 0 1 0 0 0 1 0 0 0 0 0 ------------|---------------||---------------||---------------||---------------|Volume Module:Base Vol: 53 1059 0 0 513 144 162 0 7 0 0 0 Growth Adj: 1.00 1.00 1.00 1.00 1.00 1.00 1.00 1.00 1.00 1.00 1.00 1.00 Initial Bse: 53 1059 0 0 513 144 162 0 7 0 0 0 Added Vol: 45 23 0 0 28 44 128 0 132 0 0 0 PasserByVol: 0 0 0 0 0 0 0 0 0 0 0 0 Initial Fut: 98 1082 0 0 541 188 290 0 139 0 0 0 User Adj: 1.00 1.00 1.00 1.00 1.00 1.00 1.00 1.00 0.00 1.00 1.00 1.00 PHF Adj: 1.00 1.00 1.00 1.00 1.00 1.00 1.00 1.00 0.00 1.00 1.00 1.00 PHF Volume: 98 1082 0 0 541 188 290 0 0 0 0 0 Reduct Vol: 0 0 0 0 0 0 0 0 0 0 0 0 FinalVolume: 98 1082 0 0 541 188 290 0 0 0 0 0 ------------|---------------||---------------||---------------||---------------|Critical Gap Module:Critical Gp: 4.1 xxxx xxxxx xxxxx xxxx xxxxx 6.4 xxxx 6.2 xxxxx xxxx xxxxx FollowUpTim: 2.2 xxxx xxxxx xxxxx xxxx xxxxx 3.5 xxxx 3.3 xxxxx xxxx xxxxx ------------|---------------||---------------||---------------||---------------|Capacity Module:Cnflict Vol: 729 xxxx xxxxx xxxx xxxx xxxxx 1913 xxxx 635 xxxx xxxx xxxxx Potent Cap.: 884 xxxx xxxxx xxxx xxxx xxxxx 76 xxxx 482 xxxx xxxx xxxxx Move Cap.: 884 xxxx xxxxx xxxx xxxx xxxxx 69 xxxx 482 xxxx xxxx xxxxx Volume/Cap: 0.11 xxxx xxxx xxxx xxxx xxxx 4.19 xxxx 0.00 xxxx xxxx xxxx ------------|---------------||---------------||---------------||---------------|Level Of Service Module:2Way95thQ: 0.4 xxxx xxxxx xxxx xxxx xxxxx 31.1 xxxx xxxxx xxxx xxxx xxxxx Control Del: 9.6 xxxx xxxxx xxxxx xxxx xxxxx 1560 xxxx xxxxx xxxxx xxxx xxxxx LOS by Move: A * * * * * F * * * * * Movement: LT - LTR - RT LT - LTR - RT LT - LTR - RT LT - LTR - RT Shared Cap.: xxxx xxxx xxxxx xxxx xxxx xxxxx xxxx xxxx xxxxx xxxx xxxx xxxxx SharedQueue:xxxxx xxxx xxxxx xxxxx xxxx xxxxx xxxxx xxxx xxxxx xxxxx xxxx xxxxx Shrd ConDel:xxxxx xxxx xxxxx xxxxx xxxx xxxxx xxxxx xxxx xxxxx xxxxx xxxx xxxxx Shared LOS: * * * * * * * * * * * * ApproachDel: xxxxxx xxxxxx 1560.1 xxxxxxApproachLOS: * * F * ********************************************************************************Note: Queue reported is the number of cars per lane.********************************************************************************
Traffix 8.0.0715 (c) 2008 Dowling Assoc. Licensed to RK ENGINEERING GROUP

MITIG8 - FORECAST YEAR + PRWed May 13, 2015 09:26:26 Page 1-1 -------------------------------------------------------------------------------- AGUA MANSA HIGH CUBE WAREHOUSE COUNTY OF SAN BERNARDINO FORECAST YEAR (2035) WITH PROJECT CONDITIONS -------------------------------------------------------------------------------- Level Of Service Computation Report 2000 HCM Operations Method (Future Volume Alternative) ********************************************************************************Intersection #5 AGUA MANSA ROAD (NS) AT EL RAVINO ROAD (EW) ********************************************************************************Cycle (sec): 90 Critical Vol./Cap.(X): 0.784Loss Time (sec): 6 Average Delay (sec/veh): 15.7Optimal Cycle: OPTIMIZED Level Of Service: B********************************************************************************Approach: North Bound South Bound East Bound West Bound Movement: L - T - R L - T - R L - T - R L - T - R ------------|---------------||---------------||---------------||---------------|Control: Protected Permitted Permitted Permitted Rights: Include Include Ignore Include Min. Green: 10 10 0 0 10 10 10 0 10 0 0 0 Y+R: 4.0 4.0 4.0 4.0 4.0 4.0 4.0 4.0 4.0 4.0 4.0 4.0 Lanes: 1 0 2 0 0 0 0 0 1 0 1 0 0 0 1 0 0 0 0 0 ------------|---------------||---------------||---------------||---------------|Volume Module:Base Vol: 2 401 0 0 849 21 50 0 10 0 0 0 Growth Adj: 1.00 1.00 1.00 1.00 1.00 1.00 1.00 1.00 1.00 1.00 1.00 1.00 Initial Bse: 2 401 0 0 849 21 50 0 10 0 0 0 Added Vol: 139 24 0 0 24 135 29 0 30 0 0 0 PasserByVol: 0 0 0 0 0 0 0 0 0 0 0 0 Initial Fut: 141 425 0 0 873 156 79 0 40 0 0 0 User Adj: 1.00 1.00 1.00 1.00 1.00 1.00 1.00 1.00 0.00 1.00 1.00 1.00 PHF Adj: 1.00 1.00 1.00 1.00 1.00 1.00 1.00 1.00 0.00 1.00 1.00 1.00 PHF Volume: 141 425 0 0 873 156 79 0 0 0 0 0 Reduct Vol: 0 0 0 0 0 0 0 0 0 0 0 0 Reduced Vol: 141 425 0 0 873 156 79 0 0 0 0 0 PCE Adj: 1.00 1.00 1.00 1.00 1.00 1.00 1.00 1.00 0.00 1.00 1.00 1.00 MLF Adj: 1.00 1.00 1.00 1.00 1.00 1.00 1.00 1.00 0.00 1.00 1.00 1.00 FinalVolume: 141 425 0 0 873 156 79 0 0 0 0 0 ------------|---------------||---------------||---------------||---------------|Saturation Flow Module:Sat/Lane: 1800 1800 1800 1800 1800 1800 1800 1800 1800 1800 1800 1800 Adjustment: 0.90 1.00 1.00 0.94 0.98 0.98 0.73 1.00 1.00 0.94 1.00 1.00 Lanes: 1.00 2.00 0.00 0.00 0.85 0.15 1.00 0.00 1.00 0.00 0.00 0.00 Final Sat.: 1615 3600 0 0 1495 267 1307 0 1800 0 0 0 ------------|---------------||---------------||---------------||---------------|Capacity Analysis Module:Vol/Sat: 0.09 0.12 0.00 0.00 0.58 0.58 0.06 0.00 0.00 0.00 0.00 0.00 Crit Moves: **** **** **** Green/Cycle: 0.11 0.82 0.00 0.00 0.71 0.71 0.11 0.00 0.00 0.00 0.00 0.00 Volume/Cap: 0.79 0.14 0.00 0.00 0.82 0.82 0.54 0.00 0.00 0.00 0.00 0.00 Delay/Veh: 59.1 1.6 0.0 0.0 13.5 13.5 42.0 0.0 0.0 0.0 0.0 0.0 User DelAdj: 1.00 1.00 1.00 1.00 1.00 1.00 1.00 1.00 1.00 1.00 1.00 1.00 AdjDel/Veh: 59.1 1.6 0.0 0.0 13.5 13.5 42.0 0.0 0.0 0.0 0.0 0.0 LOS by Move: E A A A B B D A A A A A HCM2kAvgQ: 6 1 0 0 20 20 2 0 0 0 0 0 ********************************************************************************Note: Queue reported is the number of cars per lane.
Traffix 8.0.0715 (c) 2008 Dowling Assoc. Licensed to RK ENGINEERING GROUP
Bryan Estrada
Typewritten Text
AM PEAK HOUR

MITIG8 - FORECAST YEAR + PRWed May 13, 2015 09:25:53 Page 1-1 -------------------------------------------------------------------------------- AGUA MANSA HIGH CUBE WAREHOUSE COUNTY OF SAN BERNARDINO FORECAST YEAR (2035) WITH PROJECT CONDITIONS -------------------------------------------------------------------------------- Level Of Service Computation Report 2000 HCM Operations Method (Future Volume Alternative) ********************************************************************************Intersection #5 AGUA MANSA ROAD (NS) AT EL RAVINO ROAD (EW) ********************************************************************************Cycle (sec): 70 Critical Vol./Cap.(X): 0.768Loss Time (sec): 6 Average Delay (sec/veh): 16.8Optimal Cycle: OPTIMIZED Level Of Service: B********************************************************************************Approach: North Bound South Bound East Bound West Bound Movement: L - T - R L - T - R L - T - R L - T - R ------------|---------------||---------------||---------------||---------------|Control: Protected Permitted Permitted Permitted Rights: Include Include Ignore Include Min. Green: 10 10 0 0 10 10 10 0 10 0 0 0 Y+R: 4.0 4.0 4.0 4.0 4.0 4.0 4.0 4.0 4.0 4.0 4.0 4.0 Lanes: 1 0 2 0 0 0 0 0 1 0 1 0 0 0 1 0 0 0 0 0 ------------|---------------||---------------||---------------||---------------|Volume Module:Base Vol: 53 1059 0 0 513 144 162 0 7 0 0 0 Growth Adj: 1.00 1.00 1.00 1.00 1.00 1.00 1.00 1.00 1.00 1.00 1.00 1.00 Initial Bse: 53 1059 0 0 513 144 162 0 7 0 0 0 Added Vol: 45 23 0 0 28 44 128 0 132 0 0 0 PasserByVol: 0 0 0 0 0 0 0 0 0 0 0 0 Initial Fut: 98 1082 0 0 541 188 290 0 139 0 0 0 User Adj: 1.00 1.00 1.00 1.00 1.00 1.00 1.00 1.00 0.00 1.00 1.00 1.00 PHF Adj: 1.00 1.00 1.00 1.00 1.00 1.00 1.00 1.00 0.00 1.00 1.00 1.00 PHF Volume: 98 1082 0 0 541 188 290 0 0 0 0 0 Reduct Vol: 0 0 0 0 0 0 0 0 0 0 0 0 Reduced Vol: 98 1082 0 0 541 188 290 0 0 0 0 0 PCE Adj: 1.00 1.00 1.00 1.00 1.00 1.00 1.00 1.00 0.00 1.00 1.00 1.00 MLF Adj: 1.00 1.00 1.00 1.00 1.00 1.00 1.00 1.00 0.00 1.00 1.00 1.00 FinalVolume: 98 1082 0 0 541 188 290 0 0 0 0 0 ------------|---------------||---------------||---------------||---------------|Saturation Flow Module:Sat/Lane: 1800 1800 1800 1800 1800 1800 1800 1800 1800 1800 1800 1800 Adjustment: 0.90 1.00 1.00 0.94 0.97 0.97 0.73 1.00 1.00 0.94 1.00 1.00 Lanes: 1.00 2.00 0.00 0.00 0.74 0.26 1.00 0.00 1.00 0.00 0.00 0.00 Final Sat.: 1615 3600 0 0 1289 448 1307 0 1800 0 0 0 ------------|---------------||---------------||---------------||---------------|Capacity Analysis Module:Vol/Sat: 0.06 0.30 0.00 0.00 0.42 0.42 0.22 0.00 0.00 0.00 0.00 0.00 Crit Moves: **** **** **** Green/Cycle: 0.14 0.65 0.00 0.00 0.50 0.50 0.27 0.00 0.00 0.00 0.00 0.00 Volume/Cap: 0.42 0.46 0.00 0.00 0.83 0.83 0.83 0.00 0.00 0.00 0.00 0.00 Delay/Veh: 28.6 6.4 0.0 0.0 21.6 21.6 39.6 0.0 0.0 0.0 0.0 0.0 User DelAdj: 1.00 1.00 1.00 1.00 1.00 1.00 1.00 1.00 1.00 1.00 1.00 1.00 AdjDel/Veh: 28.6 6.4 0.0 0.0 21.6 21.6 39.6 0.0 0.0 0.0 0.0 0.0 LOS by Move: C A A A C C D A A A A A HCM2kAvgQ: 3 6 0 0 14 14 7 0 0 0 0 0 ********************************************************************************Note: Queue reported is the number of cars per lane.
Traffix 8.0.0715 (c) 2008 Dowling Assoc. Licensed to RK ENGINEERING GROUP
Bryan Estrada
Typewritten Text
PM PEAK HOUR

FORECAST YEAR + PROJ (AM) Tue May 12, 2015 12:40:51 Page 7-1 -------------------------------------------------------------------------------- AGUA MANSA HIGH CUBE WAREHOUSE COUNTY OF SAN BERNARDINO FORECAST YEAR (2035) WITH PROJECT CONDITIONS -------------------------------------------------------------------------------- Level Of Service Computation Report 2000 HCM Operations Method (Future Volume Alternative) ********************************************************************************Intersection #6 RIVERSIDE AVENUE (NS) AT AGUA MANSA ROAD (EW) ********************************************************************************Cycle (sec): 130 Critical Vol./Cap.(X): 1.207Loss Time (sec): 8 Average Delay (sec/veh): 102.6Optimal Cycle: OPTIMIZED Level Of Service: F********************************************************************************Approach: North Bound South Bound East Bound West Bound Movement: L - T - R L - T - R L - T - R L - T - R ------------|---------------||---------------||---------------||---------------|Control: Protected Protected Protected Protected Rights: Include Include Include Include Min. Green: 10 29 29 10 32 32 10 27 27 10 23 23 Y+R: 4.0 4.0 4.0 4.0 4.0 4.0 4.0 4.0 4.0 4.0 4.0 4.0 Lanes: 1 0 1 1 0 1 0 2 0 1 1 0 1 0 1 1 0 1 0 1 ------------|---------------||---------------||---------------||---------------|Volume Module:Base Vol: 147 1197 161 38 2001 268 84 304 70 150 518 9 Growth Adj: 1.00 1.00 1.00 1.00 1.00 1.00 1.00 1.00 1.00 1.00 1.00 1.00 Initial Bse: 147 1197 161 38 2001 268 84 304 70 150 518 9 Added Vol: 85 21 0 0 6 62 18 10 19 0 43 0 PasserByVol: 0 0 0 0 0 0 0 0 0 0 0 0 Initial Fut: 232 1218 161 38 2007 330 102 314 89 150 561 9 User Adj: 1.00 1.00 1.00 1.00 1.00 1.00 1.00 1.00 1.00 1.00 1.00 1.00 PHF Adj: 0.95 0.95 0.95 0.95 0.95 0.95 0.95 0.95 0.95 0.95 0.95 0.95 PHF Volume: 244 1282 169 40 2113 347 107 331 94 158 591 9 Reduct Vol: 0 0 0 0 0 0 0 0 0 0 0 0 Reduced Vol: 244 1282 169 40 2113 347 107 331 94 158 591 9 PCE Adj: 1.00 1.00 1.00 1.00 1.00 1.00 1.00 1.00 1.00 1.00 1.00 1.00 MLF Adj: 1.00 1.00 1.00 1.00 1.00 1.00 1.00 1.00 1.00 1.00 1.00 1.00 FinalVolume: 244 1282 169 40 2113 347 107 331 94 158 591 9 ------------|---------------||---------------||---------------||---------------|Saturation Flow Module:Sat/Lane: 1800 1800 1800 1800 1800 1800 1800 1800 1800 1800 1800 1800 Adjustment: 0.90 0.98 0.98 0.90 1.00 0.85 0.90 1.00 0.85 0.90 1.00 0.85 Lanes: 1.00 1.77 0.23 1.00 2.00 1.00 1.00 1.00 1.00 1.00 1.00 1.00 Final Sat.: 1615 3122 413 1615 3600 1530 1615 1800 1530 1615 1800 1530 ------------|---------------||---------------||---------------||---------------|Capacity Analysis Module:Vol/Sat: 0.15 0.41 0.41 0.02 0.59 0.23 0.07 0.18 0.06 0.10 0.33 0.01 Crit Moves: **** **** **** **** Green/Cycle: 0.12 0.50 0.50 0.09 0.47 0.47 0.08 0.23 0.23 0.11 0.27 0.27 Volume/Cap: 1.24 0.82 0.82 0.26 1.24 0.48 0.86 0.79 0.26 0.89 1.24 0.02 Delay/Veh: 199.6 30.4 30.4 55.6 146 23.7 101.9 56.6 41.2 96.1 172 35.3 User DelAdj: 1.00 1.00 1.00 1.00 1.00 1.00 1.00 1.00 1.00 1.00 1.00 1.00 AdjDel/Veh: 199.6 30.4 30.4 55.6 146 23.7 101.9 56.6 41.2 96.1 172 35.3 LOS by Move: F C C E F C F E D F F D HCM2kAvgQ: 19 26 26 2 68 9 7 14 3 9 40 0 ********************************************************************************Note: Queue reported is the number of cars per lane.
Traffix 8.0.0715 (c) 2008 Dowling Assoc. Licensed to RK ENGINEERING GROUP

FORECAST YEAR + PROJ (PM) Tue May 12, 2015 12:41:21 Page 7-1 -------------------------------------------------------------------------------- AGUA MANSA HIGH CUBE WAREHOUSE COUNTY OF SAN BERNARDINO FORECAST YEAR (2035) WITH PROJECT CONDITIONS -------------------------------------------------------------------------------- Level Of Service Computation Report 2000 HCM Operations Method (Future Volume Alternative) ********************************************************************************Intersection #6 RIVERSIDE AVENUE (NS) AT AGUA MANSA ROAD (EW) ********************************************************************************Cycle (sec): 130 Critical Vol./Cap.(X): 1.398Loss Time (sec): 8 Average Delay (sec/veh): 248.1Optimal Cycle: OPTIMIZED Level Of Service: F********************************************************************************Approach: North Bound South Bound East Bound West Bound Movement: L - T - R L - T - R L - T - R L - T - R ------------|---------------||---------------||---------------||---------------|Control: Protected Protected Protected Protected Rights: Include Include Include Include Min. Green: 10 29 29 10 32 32 10 27 27 10 23 23 Y+R: 4.0 4.0 4.0 4.0 4.0 4.0 4.0 4.0 4.0 4.0 4.0 4.0 Lanes: 1 0 1 1 0 1 0 2 0 1 1 0 1 0 1 1 0 1 0 1 ------------|---------------||---------------||---------------||---------------|Volume Module:Base Vol: 70 2287 182 8 2213 70 317 814 178 114 524 29 Growth Adj: 1.00 1.00 1.00 1.00 1.00 1.00 1.00 1.00 1.00 1.00 1.00 1.00 Initial Bse: 70 2287 182 8 2213 70 317 814 178 114 524 29 Added Vol: 28 7 0 0 21 24 63 42 82 0 14 0 PasserByVol: 0 0 0 0 0 0 0 0 0 0 0 0 Initial Fut: 98 2294 182 8 2234 94 380 856 260 114 538 29 User Adj: 1.00 1.00 1.00 1.00 1.00 1.00 1.00 1.00 1.00 1.00 1.00 1.00 PHF Adj: 0.95 0.95 0.95 0.95 0.95 0.95 0.95 0.95 0.95 0.95 0.95 0.95 PHF Volume: 103 2415 192 8 2352 99 400 901 274 120 566 31 Reduct Vol: 0 0 0 0 0 0 0 0 0 0 0 0 Reduced Vol: 103 2415 192 8 2352 99 400 901 274 120 566 31 PCE Adj: 1.00 1.00 1.00 1.00 1.00 1.00 1.00 1.00 1.00 1.00 1.00 1.00 MLF Adj: 1.00 1.00 1.00 1.00 1.00 1.00 1.00 1.00 1.00 1.00 1.00 1.00 FinalVolume: 103 2415 192 8 2352 99 400 901 274 120 566 31 ------------|---------------||---------------||---------------||---------------|Saturation Flow Module:Sat/Lane: 1800 1800 1800 1800 1800 1800 1800 1800 1800 1800 1800 1800 Adjustment: 0.90 0.99 0.99 0.90 1.00 0.85 0.90 1.00 0.85 0.90 1.00 0.85 Lanes: 1.00 1.85 0.15 1.00 2.00 1.00 1.00 1.00 1.00 1.00 1.00 1.00 Final Sat.: 1615 3299 262 1615 3600 1530 1615 1800 1530 1615 1800 1530 ------------|---------------||---------------||---------------||---------------|Capacity Analysis Module:Vol/Sat: 0.06 0.73 0.73 0.01 0.65 0.06 0.25 0.50 0.18 0.07 0.31 0.02 Crit Moves: **** **** **** **** Green/Cycle: 0.08 0.47 0.47 0.08 0.47 0.47 0.17 0.32 0.32 0.08 0.22 0.22 Volume/Cap: 0.83 1.57 1.57 0.07 1.40 0.14 1.42 1.57 0.56 0.97 1.42 0.09 Delay/Veh: 94.5 295 294.6 55.9 219 19.9 262.9 310 38.2 129.7 254 40.3 User DelAdj: 1.00 1.00 1.00 1.00 1.00 1.00 1.00 1.00 1.00 1.00 1.00 1.00 AdjDel/Veh: 94.5 295 294.6 55.9 219 19.9 262.9 310 38.2 129.7 254 40.3 LOS by Move: F F F E F B F F D F F D HCM2kAvgQ: 6 109 109 0 88 2 34 76 9 8 44 1 ********************************************************************************Note: Queue reported is the number of cars per lane.
Traffix 8.0.0715 (c) 2008 Dowling Assoc. Licensed to RK ENGINEERING GROUP

MITIG8 - FORECAST YEAR + PRWed May 13, 2015 09:14:23 Page 1-1 -------------------------------------------------------------------------------- AGUA MANSA HIGH CUBE WAREHOUSE COUNTY OF SAN BERNARDINO FORECAST YEAR (2035) WITH PROJECT CONDITIONS -------------------------------------------------------------------------------- Level Of Service Computation Report 2000 HCM Operations Method (Future Volume Alternative) ********************************************************************************Intersection #6 RIVERSIDE AVENUE (NS) AT AGUA MANSA ROAD (EW) ********************************************************************************Cycle (sec): 130 Critical Vol./Cap.(X): 0.859Loss Time (sec): 8 Average Delay (sec/veh): 45.9Optimal Cycle: OPTIMIZED Level Of Service: D********************************************************************************Approach: North Bound South Bound East Bound West Bound Movement: L - T - R L - T - R L - T - R L - T - R ------------|---------------||---------------||---------------||---------------|Control: Protected Protected Protected Protected Rights: Include Include Include Include Min. Green: 10 29 29 10 32 32 10 27 27 10 23 23 Y+R: 4.0 4.0 4.0 4.0 4.0 4.0 4.0 4.0 4.0 4.0 4.0 4.0 Lanes: 1 0 2 1 0 1 0 2 1 0 2 0 2 0 1 1 0 2 0 1 ------------|---------------||---------------||---------------||---------------|Volume Module:Base Vol: 147 1197 161 38 2001 268 84 304 70 150 518 9 Growth Adj: 1.00 1.00 1.00 1.00 1.00 1.00 1.00 1.00 1.00 1.00 1.00 1.00 Initial Bse: 147 1197 161 38 2001 268 84 304 70 150 518 9 Added Vol: 85 21 0 0 6 62 18 10 19 0 43 0 PasserByVol: 0 0 0 0 0 0 0 0 0 0 0 0 Initial Fut: 232 1218 161 38 2007 330 102 314 89 150 561 9 User Adj: 1.00 1.00 1.00 1.00 1.00 1.00 1.00 1.00 1.00 1.00 1.00 1.00 PHF Adj: 0.95 0.95 0.95 0.95 0.95 0.95 0.95 0.95 0.95 0.95 0.95 0.95 PHF Volume: 244 1282 169 40 2113 347 107 331 94 158 591 9 Reduct Vol: 0 0 0 0 0 0 0 0 0 0 0 0 Reduced Vol: 244 1282 169 40 2113 347 107 331 94 158 591 9 PCE Adj: 1.00 1.00 1.00 1.00 1.00 1.00 1.00 1.00 1.00 1.00 1.00 1.00 MLF Adj: 1.00 1.00 1.00 1.00 1.00 1.00 1.00 1.00 1.00 1.00 1.00 1.00 FinalVolume: 244 1282 169 40 2113 347 107 331 94 158 591 9 ------------|---------------||---------------||---------------||---------------|Saturation Flow Module:Sat/Lane: 1800 1800 1800 1800 1800 1800 1800 1800 1800 1800 1800 1800 Adjustment: 0.90 0.98 0.98 0.90 0.98 0.98 0.84 1.00 0.85 0.90 1.00 0.85 Lanes: 1.00 2.65 0.35 1.00 2.58 0.42 2.00 2.00 1.00 1.00 2.00 1.00 Final Sat.: 1615 4684 619 1615 4540 747 3040 3600 1530 1615 3600 1530 ------------|---------------||---------------||---------------||---------------|Capacity Analysis Module:Vol/Sat: 0.15 0.27 0.27 0.02 0.47 0.47 0.04 0.09 0.06 0.10 0.16 0.01 Crit Moves: **** **** **** **** Green/Cycle: 0.15 0.49 0.49 0.14 0.48 0.48 0.09 0.21 0.21 0.10 0.21 0.21 Volume/Cap: 0.98 0.56 0.56 0.18 0.98 0.98 0.38 0.44 0.29 0.98 0.76 0.03 Delay/Veh: 105.2 23.3 23.3 49.9 46.4 46.4 56.2 45.3 44.0 122.2 52.6 40.4 User DelAdj: 1.00 1.00 1.00 1.00 1.00 1.00 1.00 1.00 1.00 1.00 1.00 1.00 AdjDel/Veh: 105.2 23.3 23.3 49.9 46.4 46.4 56.2 45.3 44.0 122.2 52.6 40.4 LOS by Move: F C C D D D E D D F D D HCM2kAvgQ: 15 13 13 2 38 38 3 6 3 10 13 0 ********************************************************************************Note: Queue reported is the number of cars per lane.
Traffix 8.0.0715 (c) 2008 Dowling Assoc. Licensed to RK ENGINEERING GROUP

MITIG8 - FORECAST YEAR + PRWed May 13, 2015 09:13:45 Page 1-1 -------------------------------------------------------------------------------- AGUA MANSA HIGH CUBE WAREHOUSE COUNTY OF SAN BERNARDINO FORECAST YEAR (2035) WITH PROJECT CONDITIONS -------------------------------------------------------------------------------- Level Of Service Computation Report 2000 HCM Operations Method (Future Volume Alternative) ********************************************************************************Intersection #6 RIVERSIDE AVENUE (NS) AT AGUA MANSA ROAD (EW) ********************************************************************************Cycle (sec): 125 Critical Vol./Cap.(X): 0.874Loss Time (sec): 8 Average Delay (sec/veh): 44.6Optimal Cycle: OPTIMIZED Level Of Service: D********************************************************************************Approach: North Bound South Bound East Bound West Bound Movement: L - T - R L - T - R L - T - R L - T - R ------------|---------------||---------------||---------------||---------------|Control: Protected Protected Protected Protected Rights: Include Include Include Include Min. Green: 10 29 29 10 32 32 10 27 27 10 23 23 Y+R: 4.0 4.0 4.0 4.0 4.0 4.0 4.0 4.0 4.0 4.0 4.0 4.0 Lanes: 1 0 2 1 0 1 0 2 1 0 2 0 2 0 1 1 0 2 0 1 ------------|---------------||---------------||---------------||---------------|Volume Module:Base Vol: 70 2287 182 8 2213 70 317 814 178 114 524 29 Growth Adj: 1.00 1.00 1.00 1.00 1.00 1.00 1.00 1.00 1.00 1.00 1.00 1.00 Initial Bse: 70 2287 182 8 2213 70 317 814 178 114 524 29 Added Vol: 28 7 0 0 21 24 63 42 82 0 14 0 PasserByVol: 0 0 0 0 0 0 0 0 0 0 0 0 Initial Fut: 98 2294 182 8 2234 94 380 856 260 114 538 29 User Adj: 1.00 1.00 1.00 1.00 1.00 1.00 1.00 1.00 1.00 1.00 1.00 1.00 PHF Adj: 0.95 0.95 0.95 0.95 0.95 0.95 0.95 0.95 0.95 0.95 0.95 0.95 PHF Volume: 103 2415 192 8 2352 99 400 901 274 120 566 31 Reduct Vol: 0 0 0 0 0 0 0 0 0 0 0 0 Reduced Vol: 103 2415 192 8 2352 99 400 901 274 120 566 31 PCE Adj: 1.00 1.00 1.00 1.00 1.00 1.00 1.00 1.00 1.00 1.00 1.00 1.00 MLF Adj: 1.00 1.00 1.00 1.00 1.00 1.00 1.00 1.00 1.00 1.00 1.00 1.00 FinalVolume: 103 2415 192 8 2352 99 400 901 274 120 566 31 ------------|---------------||---------------||---------------||---------------|Saturation Flow Module:Sat/Lane: 1800 1800 1800 1800 1800 1800 1800 1800 1800 1800 1800 1800 Adjustment: 0.90 0.99 0.99 0.90 0.99 0.99 0.84 1.00 0.85 0.90 1.00 0.85 Lanes: 1.00 2.78 0.22 1.00 2.88 0.12 2.00 2.00 1.00 1.00 2.00 1.00 Final Sat.: 1615 4948 393 1615 5151 217 3040 3600 1530 1615 3600 1530 ------------|---------------||---------------||---------------||---------------|Capacity Analysis Module:Vol/Sat: 0.06 0.49 0.49 0.01 0.46 0.46 0.13 0.25 0.18 0.07 0.16 0.02 Crit Moves: **** **** **** **** Green/Cycle: 0.09 0.51 0.51 0.08 0.50 0.50 0.14 0.26 0.26 0.08 0.20 0.20 Volume/Cap: 0.72 0.95 0.95 0.07 0.90 0.90 0.92 0.95 0.68 0.93 0.79 0.10 Delay/Veh: 72.0 37.5 37.5 53.4 33.1 33.1 77.5 63.8 46.0 114.7 53.2 41.0 User DelAdj: 1.00 1.00 1.00 1.00 1.00 1.00 1.00 1.00 1.00 1.00 1.00 1.00 AdjDel/Veh: 72.0 37.5 37.5 53.4 33.1 33.1 77.5 63.8 46.0 114.7 53.2 41.0 LOS by Move: E D D D C C E E D F D D HCM2kAvgQ: 6 37 37 0 32 32 12 22 10 8 12 1 ********************************************************************************Note: Queue reported is the number of cars per lane.
Traffix 8.0.0715 (c) 2008 Dowling Assoc. Licensed to RK ENGINEERING GROUP

MITIG8 - FORECAST YEAR + PRWed May 13, 2015 09:14:23 Page 1-1 -------------------------------------------------------------------------------- AGUA MANSA HIGH CUBE WAREHOUSE COUNTY OF SAN BERNARDINO FORECAST YEAR (2035) WITH PROJECT CONDITIONS -------------------------------------------------------------------------------- Level Of Service Computation Report 2000 HCM Operations Method (Future Volume Alternative) ********************************************************************************Intersection #6 RIVERSIDE AVENUE (NS) AT AGUA MANSA ROAD (EW) ********************************************************************************Cycle (sec): 130 Critical Vol./Cap.(X): 0.859Loss Time (sec): 8 Average Delay (sec/veh): 45.9Optimal Cycle: OPTIMIZED Level Of Service: D********************************************************************************Approach: North Bound South Bound East Bound West Bound Movement: L - T - R L - T - R L - T - R L - T - R ------------|---------------||---------------||---------------||---------------|Control: Protected Protected Protected Protected Rights: Include Include Include Include Min. Green: 10 29 29 10 32 32 10 27 27 10 23 23 Y+R: 4.0 4.0 4.0 4.0 4.0 4.0 4.0 4.0 4.0 4.0 4.0 4.0 Lanes: 1 0 2 1 0 1 0 2 1 0 2 0 2 0 1 1 0 2 0 1 ------------|---------------||---------------||---------------||---------------|Volume Module:Base Vol: 147 1197 161 38 2001 268 84 304 70 150 518 9 Growth Adj: 1.00 1.00 1.00 1.00 1.00 1.00 1.00 1.00 1.00 1.00 1.00 1.00 Initial Bse: 147 1197 161 38 2001 268 84 304 70 150 518 9 Added Vol: 85 21 0 0 6 62 18 10 19 0 43 0 PasserByVol: 0 0 0 0 0 0 0 0 0 0 0 0 Initial Fut: 232 1218 161 38 2007 330 102 314 89 150 561 9 User Adj: 1.00 1.00 1.00 1.00 1.00 1.00 1.00 1.00 1.00 1.00 1.00 1.00 PHF Adj: 0.95 0.95 0.95 0.95 0.95 0.95 0.95 0.95 0.95 0.95 0.95 0.95 PHF Volume: 244 1282 169 40 2113 347 107 331 94 158 591 9 Reduct Vol: 0 0 0 0 0 0 0 0 0 0 0 0 Reduced Vol: 244 1282 169 40 2113 347 107 331 94 158 591 9 PCE Adj: 1.00 1.00 1.00 1.00 1.00 1.00 1.00 1.00 1.00 1.00 1.00 1.00 MLF Adj: 1.00 1.00 1.00 1.00 1.00 1.00 1.00 1.00 1.00 1.00 1.00 1.00 FinalVolume: 244 1282 169 40 2113 347 107 331 94 158 591 9 ------------|---------------||---------------||---------------||---------------|Saturation Flow Module:Sat/Lane: 1800 1800 1800 1800 1800 1800 1800 1800 1800 1800 1800 1800 Adjustment: 0.90 0.98 0.98 0.90 0.98 0.98 0.84 1.00 0.85 0.90 1.00 0.85 Lanes: 1.00 2.65 0.35 1.00 2.58 0.42 2.00 2.00 1.00 1.00 2.00 1.00 Final Sat.: 1615 4684 619 1615 4540 747 3040 3600 1530 1615 3600 1530 ------------|---------------||---------------||---------------||---------------|Capacity Analysis Module:Vol/Sat: 0.15 0.27 0.27 0.02 0.47 0.47 0.04 0.09 0.06 0.10 0.16 0.01 Crit Moves: **** **** **** **** Green/Cycle: 0.15 0.49 0.49 0.14 0.48 0.48 0.09 0.21 0.21 0.10 0.21 0.21 Volume/Cap: 0.98 0.56 0.56 0.18 0.98 0.98 0.38 0.44 0.29 0.98 0.76 0.03 Delay/Veh: 105.2 23.3 23.3 49.9 46.4 46.4 56.2 45.3 44.0 122.2 52.6 40.4 User DelAdj: 1.00 1.00 1.00 1.00 1.00 1.00 1.00 1.00 1.00 1.00 1.00 1.00 AdjDel/Veh: 105.2 23.3 23.3 49.9 46.4 46.4 56.2 45.3 44.0 122.2 52.6 40.4 LOS by Move: F C C D D D E D D F D D HCM2kAvgQ: 15 13 13 2 38 38 3 6 3 10 13 0 ********************************************************************************Note: Queue reported is the number of cars per lane.
Traffix 8.0.0715 (c) 2008 Dowling Assoc. Licensed to RK ENGINEERING GROUP
Bryan Estrada
Typewritten Text
AM PEAK HOUR

MITIG8 - FORECAST YEAR + PRWed May 13, 2015 09:13:45 Page 1-1 -------------------------------------------------------------------------------- AGUA MANSA HIGH CUBE WAREHOUSE COUNTY OF SAN BERNARDINO FORECAST YEAR (2035) WITH PROJECT CONDITIONS -------------------------------------------------------------------------------- Level Of Service Computation Report 2000 HCM Operations Method (Future Volume Alternative) ********************************************************************************Intersection #6 RIVERSIDE AVENUE (NS) AT AGUA MANSA ROAD (EW) ********************************************************************************Cycle (sec): 125 Critical Vol./Cap.(X): 0.874Loss Time (sec): 8 Average Delay (sec/veh): 44.6Optimal Cycle: OPTIMIZED Level Of Service: D********************************************************************************Approach: North Bound South Bound East Bound West Bound Movement: L - T - R L - T - R L - T - R L - T - R ------------|---------------||---------------||---------------||---------------|Control: Protected Protected Protected Protected Rights: Include Include Include Include Min. Green: 10 29 29 10 32 32 10 27 27 10 23 23 Y+R: 4.0 4.0 4.0 4.0 4.0 4.0 4.0 4.0 4.0 4.0 4.0 4.0 Lanes: 1 0 2 1 0 1 0 2 1 0 2 0 2 0 1 1 0 2 0 1 ------------|---------------||---------------||---------------||---------------|Volume Module:Base Vol: 70 2287 182 8 2213 70 317 814 178 114 524 29 Growth Adj: 1.00 1.00 1.00 1.00 1.00 1.00 1.00 1.00 1.00 1.00 1.00 1.00 Initial Bse: 70 2287 182 8 2213 70 317 814 178 114 524 29 Added Vol: 28 7 0 0 21 24 63 42 82 0 14 0 PasserByVol: 0 0 0 0 0 0 0 0 0 0 0 0 Initial Fut: 98 2294 182 8 2234 94 380 856 260 114 538 29 User Adj: 1.00 1.00 1.00 1.00 1.00 1.00 1.00 1.00 1.00 1.00 1.00 1.00 PHF Adj: 0.95 0.95 0.95 0.95 0.95 0.95 0.95 0.95 0.95 0.95 0.95 0.95 PHF Volume: 103 2415 192 8 2352 99 400 901 274 120 566 31 Reduct Vol: 0 0 0 0 0 0 0 0 0 0 0 0 Reduced Vol: 103 2415 192 8 2352 99 400 901 274 120 566 31 PCE Adj: 1.00 1.00 1.00 1.00 1.00 1.00 1.00 1.00 1.00 1.00 1.00 1.00 MLF Adj: 1.00 1.00 1.00 1.00 1.00 1.00 1.00 1.00 1.00 1.00 1.00 1.00 FinalVolume: 103 2415 192 8 2352 99 400 901 274 120 566 31 ------------|---------------||---------------||---------------||---------------|Saturation Flow Module:Sat/Lane: 1800 1800 1800 1800 1800 1800 1800 1800 1800 1800 1800 1800 Adjustment: 0.90 0.99 0.99 0.90 0.99 0.99 0.84 1.00 0.85 0.90 1.00 0.85 Lanes: 1.00 2.78 0.22 1.00 2.88 0.12 2.00 2.00 1.00 1.00 2.00 1.00 Final Sat.: 1615 4948 393 1615 5151 217 3040 3600 1530 1615 3600 1530 ------------|---------------||---------------||---------------||---------------|Capacity Analysis Module:Vol/Sat: 0.06 0.49 0.49 0.01 0.46 0.46 0.13 0.25 0.18 0.07 0.16 0.02 Crit Moves: **** **** **** **** Green/Cycle: 0.09 0.51 0.51 0.08 0.50 0.50 0.14 0.26 0.26 0.08 0.20 0.20 Volume/Cap: 0.72 0.95 0.95 0.07 0.90 0.90 0.92 0.95 0.68 0.93 0.79 0.10 Delay/Veh: 72.0 37.5 37.5 53.4 33.1 33.1 77.5 63.8 46.0 114.7 53.2 41.0 User DelAdj: 1.00 1.00 1.00 1.00 1.00 1.00 1.00 1.00 1.00 1.00 1.00 1.00 AdjDel/Veh: 72.0 37.5 37.5 53.4 33.1 33.1 77.5 63.8 46.0 114.7 53.2 41.0 LOS by Move: E D D D C C E E D F D D HCM2kAvgQ: 6 37 37 0 32 32 12 22 10 8 12 1 ********************************************************************************Note: Queue reported is the number of cars per lane.
Traffix 8.0.0715 (c) 2008 Dowling Assoc. Licensed to RK ENGINEERING GROUP
Bryan Estrada
Typewritten Text
PM PEAK HOUR

FORECAST YEAR + PROJ (AM) Tue May 12, 2015 12:40:51 Page 8-1 -------------------------------------------------------------------------------- AGUA MANSA HIGH CUBE WAREHOUSE COUNTY OF SAN BERNARDINO FORECAST YEAR (2035) WITH PROJECT CONDITIONS -------------------------------------------------------------------------------- Level Of Service Computation Report 2000 HCM Unsignalized Method (Future Volume Alternative) ********************************************************************************Intersection #7 PROJECT ACCESS 1 (NS) AT EL RAVINO ROAD (EW) ********************************************************************************Average Delay (sec/veh): 0.0 Worst Case Level Of Service: A[ 8.1]********************************************************************************Approach: North Bound South Bound East Bound West Bound Movement: L - T - R L - T - R L - T - R L - T - R ------------|---------------||---------------||---------------||---------------|Control: Stop Sign Stop Sign Uncontrolled UncontrolledRights: Include Include Include Include Lanes: 0 0 0 0 0 0 0 1! 0 0 0 1 0 0 0 0 0 0 1 0 ------------|---------------||---------------||---------------||---------------|Volume Module:Base Vol: 0 0 0 0 0 0 0 128 0 0 133 0 Growth Adj: 1.00 1.00 1.00 1.00 1.00 1.00 1.00 1.00 1.00 1.00 1.00 1.00 Initial Bse: 0 0 0 0 0 0 0 128 0 0 133 0 Added Vol: 0 0 0 0 0 0 1 59 0 0 273 1 PasserByVol: 0 0 0 0 0 0 0 0 0 0 0 0 Initial Fut: 0 0 0 0 0 0 1 187 0 0 406 1 User Adj: 1.00 1.00 1.00 1.00 1.00 1.00 1.00 1.00 1.00 1.00 1.00 1.00 PHF Adj: 1.00 1.00 1.00 1.00 1.00 1.00 1.00 1.00 1.00 1.00 1.00 1.00 PHF Volume: 0 0 0 0 0 0 1 187 0 0 406 1 Reduct Vol: 0 0 0 0 0 0 0 0 0 0 0 0 FinalVolume: 0 0 0 0 0 0 1 187 0 0 406 1 ------------|---------------||---------------||---------------||---------------|Critical Gap Module:Critical Gp:xxxxx xxxx xxxxx 6.4 6.5 6.2 4.1 xxxx xxxxx xxxxx xxxx xxxxx FollowUpTim:xxxxx xxxx xxxxx 3.5 4.0 3.3 2.2 xxxx xxxxx xxxxx xxxx xxxxx ------------|---------------||---------------||---------------||---------------|Capacity Module:Cnflict Vol: xxxx xxxx xxxxx 596 596 407 407 xxxx xxxxx xxxx xxxx xxxxx Potent Cap.: xxxx xxxx xxxxx 470 420 649 1163 xxxx xxxxx xxxx xxxx xxxxx Move Cap.: xxxx xxxx xxxxx 470 419 649 1163 xxxx xxxxx xxxx xxxx xxxxx Volume/Cap: xxxx xxxx xxxx 0.00 0.00 0.00 0.00 xxxx xxxx xxxx xxxx xxxx ------------|---------------||---------------||---------------||---------------|Level Of Service Module:2Way95thQ: xxxx xxxx xxxxx xxxx xxxx xxxxx 0.0 xxxx xxxxx xxxx xxxx xxxxx Control Del:xxxxx xxxx xxxxx xxxxx xxxx xxxxx 8.1 xxxx xxxxx xxxxx xxxx xxxxx LOS by Move: * * * * * * A * * * * * Movement: LT - LTR - RT LT - LTR - RT LT - LTR - RT LT - LTR - RT Shared Cap.: xxxx xxxx xxxxx xxxx 0 xxxxx xxxx xxxx xxxxx xxxx xxxx xxxxx SharedQueue:xxxxx xxxx xxxxx xxxxx xxxx xxxxx 0.0 xxxx xxxxx xxxxx xxxx xxxxx Shrd ConDel:xxxxx xxxx xxxxx xxxxx xxxx xxxxx 8.1 xxxx xxxxx xxxxx xxxx xxxxx Shared LOS: * * * * * * A * * * * * ApproachDel: xxxxxx xxxxxx xxxxxx xxxxxxApproachLOS: * * * * ********************************************************************************Note: Queue reported is the number of cars per lane.********************************************************************************
Traffix 8.0.0715 (c) 2008 Dowling Assoc. Licensed to RK ENGINEERING GROUP

FORECAST YEAR + PROJ (PM) Tue May 12, 2015 12:41:21 Page 8-1 -------------------------------------------------------------------------------- AGUA MANSA HIGH CUBE WAREHOUSE COUNTY OF SAN BERNARDINO FORECAST YEAR (2035) WITH PROJECT CONDITIONS -------------------------------------------------------------------------------- Level Of Service Computation Report 2000 HCM Unsignalized Method (Future Volume Alternative) ********************************************************************************Intersection #7 PROJECT ACCESS 1 (NS) AT EL RAVINO ROAD (EW) ********************************************************************************Average Delay (sec/veh): 0.1 Worst Case Level Of Service: B[ 10.6]********************************************************************************Approach: North Bound South Bound East Bound West Bound Movement: L - T - R L - T - R L - T - R L - T - R ------------|---------------||---------------||---------------||---------------|Control: Stop Sign Stop Sign Uncontrolled UncontrolledRights: Include Include Include Include Lanes: 0 0 0 0 0 0 0 1! 0 0 0 1 0 0 0 0 0 1 0 0 ------------|---------------||---------------||---------------||---------------|Volume Module:Base Vol: 0 0 0 0 0 0 0 137 0 0 133 0 Growth Adj: 1.00 1.00 1.00 1.00 1.00 1.00 1.00 1.00 1.00 1.00 1.00 1.00 Initial Bse: 0 0 0 0 0 0 0 137 0 0 133 0 Added Vol: 0 0 0 1 0 2 1 259 0 0 89 0 PasserByVol: 0 0 0 0 0 0 0 0 0 0 0 0 Initial Fut: 0 0 0 1 0 2 1 396 0 0 222 0 User Adj: 1.00 1.00 1.00 1.00 1.00 1.00 1.00 1.00 1.00 1.00 1.00 1.00 PHF Adj: 1.00 1.00 1.00 1.00 1.00 1.00 1.00 1.00 1.00 1.00 1.00 1.00 PHF Volume: 0 0 0 1 0 2 1 396 0 0 222 0 Reduct Vol: 0 0 0 0 0 0 0 0 0 0 0 0 FinalVolume: 0 0 0 1 0 2 1 396 0 0 222 0 ------------|---------------||---------------||---------------||---------------|Critical Gap Module:Critical Gp:xxxxx xxxx xxxxx 6.4 6.5 6.2 4.1 xxxx xxxxx xxxxx xxxx xxxxx FollowUpTim:xxxxx xxxx xxxxx 3.5 4.0 3.3 2.2 xxxx xxxxx xxxxx xxxx xxxxx ------------|---------------||---------------||---------------||---------------|Capacity Module:Cnflict Vol: xxxx xxxx xxxxx 620 620 222 222 xxxx xxxxx xxxx xxxx xxxxx Potent Cap.: xxxx xxxx xxxxx 455 407 823 1359 xxxx xxxxx xxxx xxxx xxxxx Move Cap.: xxxx xxxx xxxxx 455 406 823 1359 xxxx xxxxx xxxx xxxx xxxxx Volume/Cap: xxxx xxxx xxxx 0.00 0.00 0.00 0.00 xxxx xxxx xxxx xxxx xxxx ------------|---------------||---------------||---------------||---------------|Level Of Service Module:2Way95thQ: xxxx xxxx xxxxx xxxx xxxx xxxxx 0.0 xxxx xxxxx xxxx xxxx xxxxx Control Del:xxxxx xxxx xxxxx xxxxx xxxx xxxxx 7.7 xxxx xxxxx xxxxx xxxx xxxxx LOS by Move: * * * * * * A * * * * * Movement: LT - LTR - RT LT - LTR - RT LT - LTR - RT LT - LTR - RT Shared Cap.: xxxx xxxx xxxxx xxxx 648 xxxxx xxxx xxxx xxxxx xxxx xxxx xxxxx SharedQueue:xxxxx xxxx xxxxx xxxxx 0.0 xxxxx 0.0 xxxx xxxxx xxxxx xxxx xxxxx Shrd ConDel:xxxxx xxxx xxxxx xxxxx 10.6 xxxxx 7.7 xxxx xxxxx xxxxx xxxx xxxxx Shared LOS: * * * * B * A * * * * * ApproachDel: xxxxxx 10.6 xxxxxx xxxxxxApproachLOS: * B * * ********************************************************************************Note: Queue reported is the number of cars per lane.********************************************************************************
Traffix 8.0.0715 (c) 2008 Dowling Assoc. Licensed to RK ENGINEERING GROUP

FORECAST YEAR + PROJ (AM) Tue May 12, 2015 12:40:51 Page 9-1 -------------------------------------------------------------------------------- AGUA MANSA HIGH CUBE WAREHOUSE COUNTY OF SAN BERNARDINO FORECAST YEAR (2035) WITH PROJECT CONDITIONS -------------------------------------------------------------------------------- Level Of Service Computation Report 2000 HCM Operations Method (Future Volume Alternative) ********************************************************************************Intersection #8 AGUA MANSA ROAD (NS) AT PROJECT ACCESS 2 (EW) ********************************************************************************Cycle (sec): 130 Critical Vol./Cap.(X): 0.626Loss Time (sec): 4 Average Delay (sec/veh): 3.0Optimal Cycle: OPTIMIZED Level Of Service: A********************************************************************************Approach: North Bound South Bound East Bound West Bound Movement: L - T - R L - T - R L - T - R L - T - R ------------|---------------||---------------||---------------||---------------|Control: Permitted Permitted Protected Protected Rights: Include Include Include Include Min. Green: 10 10 0 0 10 10 10 0 10 0 0 0 Y+R: 4.0 4.0 4.0 4.0 4.0 4.0 4.0 4.0 4.0 4.0 4.0 4.0 Lanes: 1 0 1 0 0 0 0 1 0 1 1 0 0 0 1 0 0 0 0 0 ------------|---------------||---------------||---------------||---------------|Volume Module:Base Vol: 0 451 0 0 870 0 0 0 0 0 0 0 Growth Adj: 1.00 1.00 1.00 1.00 1.00 1.00 1.00 1.00 1.00 1.00 1.00 1.00 Initial Bse: 0 451 0 0 870 0 0 0 0 0 0 0 Added Vol: 18 35 0 0 153 38 13 0 6 0 0 0 PasserByVol: 0 0 0 0 0 0 0 0 0 0 0 0 Initial Fut: 18 486 0 0 1023 38 13 0 6 0 0 0 User Adj: 1.00 1.00 1.00 1.00 1.00 1.00 1.00 1.00 1.00 1.00 1.00 1.00 PHF Adj: 0.95 0.95 0.95 0.95 0.95 0.95 0.95 0.95 0.95 0.95 0.95 0.95 PHF Volume: 19 512 0 0 1077 40 14 0 6 0 0 0 Reduct Vol: 0 0 0 0 0 0 0 0 0 0 0 0 Reduced Vol: 19 512 0 0 1077 40 14 0 6 0 0 0 PCE Adj: 1.00 1.00 1.00 1.00 1.00 1.00 1.00 1.00 1.00 1.00 1.00 1.00 MLF Adj: 1.00 1.00 1.00 1.00 1.00 1.00 1.00 1.00 1.00 1.00 1.00 1.00 FinalVolume: 19 512 0 0 1077 40 14 0 6 0 0 0 ------------|---------------||---------------||---------------||---------------|Saturation Flow Module:Sat/Lane: 1800 1800 1800 1800 1800 1800 1800 1800 1800 1800 1800 1800 Adjustment: 0.22 1.00 1.00 0.94 1.00 0.85 0.90 1.00 0.85 0.94 1.00 1.00 Lanes: 1.00 1.00 0.00 0.00 1.00 1.00 1.00 0.00 1.00 0.00 0.00 0.00 Final Sat.: 399 1800 0 0 1800 1530 1615 0 1530 0 0 0 ------------|---------------||---------------||---------------||---------------|Capacity Analysis Module:Vol/Sat: 0.05 0.28 0.00 0.00 0.60 0.03 0.01 0.00 0.00 0.00 0.00 0.00 Crit Moves: **** **** Green/Cycle: 0.89 0.89 0.00 0.00 0.89 0.89 0.08 0.00 0.08 0.00 0.00 0.00 Volume/Cap: 0.05 0.32 0.00 0.00 0.67 0.03 0.11 0.00 0.05 0.00 0.00 0.00 Delay/Veh: 0.9 1.2 0.0 0.0 3.0 0.8 56.3 0.0 55.8 0.0 0.0 0.0 User DelAdj: 1.00 1.00 1.00 1.00 1.00 1.00 1.00 1.00 1.00 1.00 1.00 1.00 AdjDel/Veh: 0.9 1.2 0.0 0.0 3.0 0.8 56.3 0.0 55.8 0.0 0.0 0.0 LOS by Move: A A A A A A E A E A A A HCM2kAvgQ: 0 3 0 0 12 0 1 0 0 0 0 0 ********************************************************************************Note: Queue reported is the number of cars per lane.
Traffix 8.0.0715 (c) 2008 Dowling Assoc. Licensed to RK ENGINEERING GROUP

FORECAST YEAR + PROJ (PM) Tue May 12, 2015 12:41:21 Page 9-1 -------------------------------------------------------------------------------- AGUA MANSA HIGH CUBE WAREHOUSE COUNTY OF SAN BERNARDINO FORECAST YEAR (2035) WITH PROJECT CONDITIONS -------------------------------------------------------------------------------- Level Of Service Computation Report 2000 HCM Operations Method (Future Volume Alternative) ********************************************************************************Intersection #8 AGUA MANSA ROAD (NS) AT PROJECT ACCESS 2 (EW) ********************************************************************************Cycle (sec): 130 Critical Vol./Cap.(X): 0.852Loss Time (sec): 4 Average Delay (sec/veh): 8.9Optimal Cycle: OPTIMIZED Level Of Service: A********************************************************************************Approach: North Bound South Bound East Bound West Bound Movement: L - T - R L - T - R L - T - R L - T - R ------------|---------------||---------------||---------------||---------------|Control: Permitted Permitted Protected Protected Rights: Include Include Include Include Min. Green: 10 10 0 0 10 10 10 0 10 0 0 0 Y+R: 4.0 4.0 4.0 4.0 4.0 4.0 4.0 4.0 4.0 4.0 4.0 4.0 Lanes: 1 0 1 0 0 0 0 1 0 1 1 0 0 0 1 0 0 0 0 0 ------------|---------------||---------------||---------------||---------------|Volume Module:Base Vol: 0 1221 0 0 657 0 0 0 0 0 0 0 Growth Adj: 1.00 1.00 1.00 1.00 1.00 1.00 1.00 1.00 1.00 1.00 1.00 1.00 Initial Bse: 0 1221 0 0 657 0 0 0 0 0 0 0 Added Vol: 7 145 0 0 52 14 41 0 20 0 0 0 PasserByVol: 0 0 0 0 0 0 0 0 0 0 0 0 Initial Fut: 7 1366 0 0 709 14 41 0 20 0 0 0 User Adj: 1.00 1.00 1.00 1.00 1.00 1.00 1.00 1.00 1.00 1.00 1.00 1.00 PHF Adj: 0.95 0.95 0.95 0.95 0.95 0.95 0.95 0.95 0.95 0.95 0.95 0.95 PHF Volume: 7 1438 0 0 746 15 43 0 21 0 0 0 Reduct Vol: 0 0 0 0 0 0 0 0 0 0 0 0 Reduced Vol: 7 1438 0 0 746 15 43 0 21 0 0 0 PCE Adj: 1.00 1.00 1.00 1.00 1.00 1.00 1.00 1.00 1.00 1.00 1.00 1.00 MLF Adj: 1.00 1.00 1.00 1.00 1.00 1.00 1.00 1.00 1.00 1.00 1.00 1.00 FinalVolume: 7 1438 0 0 746 15 43 0 21 0 0 0 ------------|---------------||---------------||---------------||---------------|Saturation Flow Module:Sat/Lane: 1800 1800 1800 1800 1800 1800 1800 1800 1800 1800 1800 1800 Adjustment: 0.33 1.00 1.00 0.94 1.00 0.85 0.90 1.00 0.85 0.94 1.00 1.00 Lanes: 1.00 1.00 0.00 0.00 1.00 1.00 1.00 0.00 1.00 0.00 0.00 0.00 Final Sat.: 595 1800 0 0 1800 1530 1615 0 1530 0 0 0 ------------|---------------||---------------||---------------||---------------|Capacity Analysis Module:Vol/Sat: 0.01 0.80 0.00 0.00 0.41 0.01 0.03 0.00 0.01 0.00 0.00 0.00 Crit Moves: **** **** Green/Cycle: 0.89 0.89 0.00 0.00 0.89 0.89 0.08 0.00 0.08 0.00 0.00 0.00 Volume/Cap: 0.01 0.90 0.00 0.00 0.46 0.01 0.35 0.00 0.18 0.00 0.00 0.00 Delay/Veh: 0.8 10.7 0.0 0.0 1.5 0.8 58.6 0.0 56.9 0.0 0.0 0.0 User DelAdj: 1.00 1.00 1.00 1.00 1.00 1.00 1.00 1.00 1.00 1.00 1.00 1.00 AdjDel/Veh: 0.8 10.7 0.0 0.0 1.5 0.8 58.6 0.0 56.9 0.0 0.0 0.0 LOS by Move: A B A A A A E A E A A A HCM2kAvgQ: 0 34 0 0 6 0 2 0 1 0 0 0 ********************************************************************************Note: Queue reported is the number of cars per lane.
Traffix 8.0.0715 (c) 2008 Dowling Assoc. Licensed to RK ENGINEERING GROUP

Appendix J
Traffic Signal Warrant Worksheets

2012 Edition
WARRANT 3, PEAK HOUR (70% FACTOR)(Rural Areas)
(COMMUNITY LESS THAN 10,000 POPULATION OR ABOVE 70 km/h OR ABOVE 40 mph ON MAJOR STREET)
Traffic Conditions =
Major Street Name = Total of Both Approaches (VPH) = 1203Number of Approach Lanes Major Street = 1
Minor Street Name = High Volume Approach (VPH) = 374Number of Approach Lanes Minor Street = 1
WARRANTED FOR A SIGNAL
* Note: 100 vph applies as the lower threshold volume for a minor-street approach with two or more lanes and 75 vph applies as the lower threshold volume for a minor-street approach with one lane.
Agua Mansa Road
El Rivino
Min
or S
treet
- Hi
gher
-Vol
ume
Appr
oach
- VP
H
Opening Year (2017) W/ Related W/ Project - PM Peak
1203
374
0
100
200
300
400
500
300 400 500 600 700 800 900 1000 1100 1200 1300
Major Street - Total of Both Approaches - Vehicles Per Hour (VPH)
1 Lane (Major) & 1 Lane (Minor)
2+ Lanes (Major) & 1 Lane (Minor) OR 1 Lane (Major) & 2+ Lanes (Minor)
2+ Lanes (Major) & 2+ Lanes (Minor)
Major Street Approaches
Minor Street Approaches
*10*75
November 2003
Agua Mansa Road at El Rivino (2017 PM).xls Sect. 4C.06

2012 Edition
WARRANT 3, PEAK HOUR (70% FACTOR)(Rural Areas)
(COMMUNITY LESS THAN 10,000 POPULATION OR ABOVE 70 km/h OR ABOVE 40 mph ON MAJOR STREET)
Traffic Conditions =
Major Street Name = Total of Both Approaches (VPH) = 1909Number of Approach Lanes Major Street = 1
Minor Street Name = High Volume Approach (VPH) = 429Number of Approach Lanes Minor Street = 1
WARRANTED FOR A SIGNAL
* Note: 100 vph applies as the lower threshold volume for a minor-street approach with two or more lanes and 75 vph applies as the lower threshold volume for a minor-street approach with one lane.
Agua Mansa Road
El Rivino Road
Min
or S
treet
- Hi
gher
-Vol
ume
Appr
oach
- VP
H
Buildout Year (2035) With Project - PM Peak Hour
1300
429
0
100
200
300
400
500
300 400 500 600 700 800 900 1000 1100 1200 1300
Major Street - Total of Both Approaches - Vehicles Per Hour (VPH)
1 Lane (Major) & 1 Lane (Minor)
2+ Lanes (Major) & 1 Lane (Minor) OR 1 Lane (Major) & 2+ Lanes (Minor)
2+ Lanes (Major) & 2+ Lanes (Minor)
Major Street Approaches
Minor Street Approaches
*10*75
November 2003
Agua Mansa Road at El Rivino (2035 PM).xls Sect. 4C.06

2012 Edition
WARRANT 3, PEAK HOUR (70% FACTOR)(Rural Areas)
(COMMUNITY LESS THAN 10,000 POPULATION OR ABOVE 70 km/h OR ABOVE 40 mph ON MAJOR STREET)
Traffic Conditions =
Major Street Name = Total of Both Approaches (VPH) = 1430Number of Approach Lanes Major Street = 1
Minor Street Name = High Volume Approach (VPH) = 61Number of Approach Lanes Minor Street = 1
SIGNAL WARRANT NOT SATISFIED
* Note: 100 vph applies as the lower threshold volume for a minor-street approach with two or more lanes and 75 vph applies as the lower threshold volume for a minor-street approach with one lane.
Agua Mansa Road
PA 2
Min
or S
treet
- Hi
gher
-Vol
ume
Appr
oach
- VP
H
Opening Year (2017) With Project - PM Peak Hour
1300
61
0
100
200
300
400
500
300 400 500 600 700 800 900 1000 1100 1200 1300
Major Street - Total of Both Approaches - Vehicles Per Hour (VPH)
1 Lane (Major) & 1 Lane (Minor)
2+ Lanes (Major) & 1 Lane (Minor) OR 1 Lane (Major) & 2+ Lanes (Minor)
2+ Lanes (Major) & 2+ Lanes (Minor)
Major Street Approaches
Minor Street Approaches
*10*75
November 2003
Agua Mansa Road at PA2 (2017 PM).xls Sect. 4C.06

2012 Edition
WARRANT 3, PEAK HOUR (70% FACTOR)(Rural Areas)
(COMMUNITY LESS THAN 10,000 POPULATION OR ABOVE 70 km/h OR ABOVE 40 mph ON MAJOR STREET)
Traffic Conditions =
Major Street Name = Total of Both Approaches (VPH) = 2096Number of Approach Lanes Major Street = 1
Minor Street Name = High Volume Approach (VPH) = 61Number of Approach Lanes Minor Street = 1
SIGNAL WARRANT NOT SATISFIED
* Note: 100 vph applies as the lower threshold volume for a minor-street approach with two or more lanes and 75 vph applies as the lower threshold volume for a minor-street approach with one lane.
Agua Mansa Road
PA 2
Min
or S
treet
- Hi
gher
-Vol
ume
Appr
oach
- VP
H
Buildout Year (2035) With Project - PM Peak Hour
1300
61
0
100
200
300
400
500
300 400 500 600 700 800 900 1000 1100 1200 1300
Major Street - Total of Both Approaches - Vehicles Per Hour (VPH)
1 Lane (Major) & 1 Lane (Minor)
2+ Lanes (Major) & 1 Lane (Minor) OR 1 Lane (Major) & 2+ Lanes (Minor)
2+ Lanes (Major) & 2+ Lanes (Minor)
Major Street Approaches
Minor Street Approaches
*10*75
November 2003
Agua Mansa Road at PA2 (2035 PM).xls Sect. 4C.06

Appendix K
Sight Distance Requirements

HIGHWAY DESIGN MANUAL 200-1 May 7, 2012
CHAPTER 200 GEOMETRIC DESIGN AND STRUCTURE STANDARDS
Topic 201 - Sight Distance
Index 201.1 - General Sight distance is the continuous length of highway ahead, visible to the highway user. Four types of sight distance are considered herein: passing, stopping, decision, and corner. Passing sight distance is used where use of an opposing lane can provide passing opportunities (see Index 201.2). Stopping sight distance is the minimum sight distance for a given design speed to be provided on multilane highways and on 2-lane roads when passing sight distance is not economically obtainable. Stopping sight distance also is to be provided for all users, including motorists and bicyclists, at all elements of interchanges and intersections at grade, including private road connections (see Topic 504, Index 405.1, & Figure 405.7). Decision sight distance is used at major decision points (see Indexes 201.7 and 504.2). Corner sight distance is used at intersections (see Index 405.1, Figure 405.7, and Figure 504.3J).
Table 201.1 shows the minimum standards for stopping sight distance related to design speed for motorists. Stopping sight distances given in the table are suitable for Class II and Class III bikeways. Also shown in Table 201.1 are the values for use in providing passing sight distance.
See Chapter 1000 for Class I bikeway sight distance guidance.
Chapter 3 of "A Policy on Geometric Design of Highways and Streets," AASHTO, contains a thorough discussion of the derivation of stopping sight distance.
201.2 Passing Sight Distance Passing sight distance is the minimum sight distance required for the driver of one vehicle to pass another vehicle safely and comfortably. Passing must be accomplished assuming an oncoming vehicle comes into view and maintains
the design speed, without reduction, after the overtaking maneuver is started.
Table 201.1 Sight Distance Standards
Design Speed(1)
(mph) Stopping(2)
(ft) Passing
(ft)
20 125 800
25 150 950
30 200 1,100
35 250 1,300
40 300 1,500
45 360 1,650
50 430 1,800
55 500 1,950
60 580 2,100
65 660 2,300
70 750 2,500
75 840 2,600
80 930 2,700
(1) See Topic 101 for selection of design speed. (2) For sustained downgrades, refer to advisory standard in
Index 201.3
The sight distance available for passing at any place is the longest distance at which a driver whose eyes are 3 ½ feet above the pavement surface can see the top of an object 4 ¼ feet high on the road. See Table 201.1 for the calculated values that are associated with various design speeds.
In general, 2-lane highways should be designed to provide for passing where possible, especially those routes with high volumes of trucks or recreational vehicles. Passing should be done on tangent horizontal alignments with constant grades or a slight sag vertical curve. Not only are drivers reluctant to pass on a long crest vertical curve, but it is impracticable to design crest vertical curves to provide for passing sight distance because of high cost where crest cuts are involved. Passing sight distance for crest vertical curves is 7 to 17 times longer than the stopping sight distance.

200-2 HIGHWAY DESIGN MANUAL May 7, 2012
Ordinarily, passing sight distance is provided at locations where combinations of alignment and profile do not require the use of crest vertical curves.
Passing sight distance is considered only on 2-lane roads. At critical locations, a stretch of 3- or 4-lane passing section with stopping sight distance is sometimes more economical than two lanes with passing sight distance.
Passing on sag vertical curves can be accomplished both day and night because headlights can be seen through the entire curve.
See Part 3 of the California Manual on Uniform Traffic Control Devices (California MUTCD) for criteria relating to the placement of barrier striping for no-passing zones. Note, that the passing sight distances shown in the California MUTCD are based on traffic operational criteria. Traffic operational criteria are different from the design characteristics used to develop the values provided in Table 201.1 and Chapter 3 of AASHTO, A Policy on Geometric Design of Highways and Streets. The aforementioned table and AASHTO reference are also used to design the vertical profile and horizontal alignment of the highway. Consult the Headquarters (HQ) Traffic Liaison when using the California MUTCD criteria for traffic operating-control needs.
Other means for providing passing opportunities, such as climbing lanes or turnouts, are discussed in Index 204.5. Chapter 3 of AASHTO, A Policy on Geometric Design of Highways and Streets, contains a thorough discussion of the derivation of passing sight distance.
201.3 Stopping Sight Distance The minimum stopping sight distance is the distance required by the user, traveling at a given speed, to bring the vehicle or bicycle to a stop after an object ½-foot high on the road becomes visible. Stopping sight distance for motorists is measured from the driver's eyes, which are assumed to be 3 ½ feet above the pavement surface, to an object ½-foot high on the road. See Index 1003.1(10) for Class I bikeway stopping sight distance guidance.
The stopping sight distances in Table 201.1 should be increased by 20 percent on sustained
downgrades steeper than 3 percent and longer than one mile.
201.4 Stopping Sight Distance at Grade Crests Figure 201.4 shows graphically the relationships between length of highway crest vertical curve, design speed, and algebraic difference in grades. Any one factor can be determined when the other two are known.
201.5 Stopping Sight Distance at Grade Sags From the curves in Figure 201.5, the minimum length of vertical curve which provides headlight sight distance in grade sags for a given design speed can be obtained.
If headlight sight distance is not obtainable at grade sags, lighting may be considered. The Design Coordinator and the HQ Traffic Liaison shall be contacted to review proposed grade sag lighting to determine if such use is appropriate.
201.6 Stopping Sight Distance on Horizontal Curves Where an object off the pavement such as a bridge pier, building, cut slope, or natural growth restricts sight distance, the minimum radius of curvature is determined by the stopping sight distance.
Available stopping sight distance on horizontal curves is obtained from Figure 201.6. It is assumed that the driver's eye is 3 ½ feet above the center of the inside lane (inside with respect to curve) and the object is ½-foot high. The line of sight is assumed to intercept the view obstruction at the midpoint of the sight line and 2 feet above the center of the inside lane when the road profile is flat (i.e. no vertical curve). Crest vertical curves can cause additional reductions in sight distance. The clear distance (m) is measured from the center of the inside lane to the obstruction.
The design objective is to determine the required clear distance from centerline of inside lane to a retaining wall, bridge pier, abutment, cut slope, or other obstruction for a given design speed. Using radius of curvature and minimum sight distance for that design speed, Figure 201.6 gives the clear

HIGHWAY DESIGN MANUAL 200-3 May 7, 2012
distance (m) from centerline of inside lane to the obstruction.
See Index 1003.1(12) for bikeway stopping sight distance on horizontal curve guidance.
When the radius of curvature and the clear distance to a fixed obstruction are known, Figure 201.6 also gives the sight distance for these conditions.
See Index 101.1 for technical reductions in design speed caused by partial or momentary horizontal sight distance restrictions. See Index 203.2 for additional comments on glare screens.
Cuts may be widened where vegetation restricting horizontal sight distance is expected to grow on finished slopes. Widening is an economic trade-off that must be evaluated along with other options. See Index 902.2 for sight distance requirements on landscape projects.
201.7 Decision Sight Distance At certain locations, sight distance greater than stopping sight distance is desirable to allow drivers time for decisions without making last minute erratic maneuvers (see Chapter III of AASHTO, A Policy on Geometric Design of Highways and Streets, for a thorough discussion of the derivation of decision sight distance.)
On freeways and expressways the decision sight distance values in Table 201.7 should be used at lane drops and at off-ramp noses to interchanges, branch connections, roadside rests, vista points, and inspection stations. When determining decision sight distance on horizontal and vertical curves, Figures 201.4, 201.5, and 201.6 can be used. Figure 201.7 is an expanded version of Figure 201.4 and gives the relationship among length of crest vertical curve, design speed, and algebraic difference in grades for much longer vertical curves than Figure 201.4.
Decision sight distance is measured using the 3 ½-foot eye height and ½-foot object height. See Index 504.2 for sight distance at secondary exits on a collector-distributor road.
Table 201.7
Decision Sight Distance Design Speed
(mph) Decision Sight
Distance (ft)
30 450
35 525
40 600
45 675
50 750
55 865
60 990
65 1,050
70 1,105
75 1,180
80 1,260
Topic 202 - Superelevation
202.1 Basic Criteria According to the laws of mechanics, when a vehicle travels on a curve it is forced outward by centrifugal force.
On a superelevated highway, this force is resisted by the vehicle weight component parallel to the superelevated surface and side friction between the tires and pavement. It is impractical to balance centrifugal force by superelevation alone, because for any given curve radius a certain superelevation rate is exactly correct for only one driving speed. At all other speeds there will be a side thrust either outward or inward, relative to the curve center, which must be offset by side friction.
If the vehicle is not skidding, these forces are in equilibrium as represented by the following equation, which is used to design a curve for a comfortable operation at a particular speed:
15RV
R0.067Vfe Factor lCentrifuga
22==+=

200-4 HIGHWAY DESIGN MANUAL May, 7 2012
Where:
e = Superelevation slope in feet per foot
emax = Maximum superelevation rate for a given condition
f = Side friction factor R = Curve radius in feet V = Velocity in miles per hour
Standard superelevation rates are designed to hold the portion of the centrifugal force that must be taken up by tire friction within allowable limits. Friction factors as related to speed are shown on Figure 202.2. The factors apply equally to portland cement concrete and bituminous pavements.
202.2 Standards for Superelevation (1) Highways. Maximum superelevation rates for
various highway conditions are shown in Table 202.2.
Based on an emax selected by the designer for one of the conditions, superelevation rates from Table 202.2 shall be used within the given range of curve radii. If less than standard superelevation rates are approved (see Index 82.1), Figure 202.2 shall be used to determine superelevation based on the curve radius and maximum comfortable speed.
Maximum comfortable speed is determined by the formula given on Figure 202.2. It represents the speed on a curve where discomfort caused by centrifugal force is evident to a driver. Side friction factors tabulated on Figure 202.2 are recommended by AASHTO for design purposes. AASHTO, A Policy on Geometric Design of Highways and Streets, states, "In general, studies show that the maximum side friction factors developed between new tires and wet concrete pavements range from about 0.5 at 20 miles per hour to approximately 0.35 at 60 miles per hour." The design side friction factors are, therefore, about one-third the values that occur when side skidding is imminent.
To use Figure 202.2, the designer must decide on the relative importance among three variables. Normally, when a nonstandard
superelevation rate is approved, Figure 202.2 will be entered with the rate and a desired curve radius. It must then be determined whether the resulting maximum comfortable speed is adequate for the conditions or whether further adjustments to radius and superelevation may be needed.
Except for short radius curves, the standard superelevation rate results in very little side thrust at speeds less than 45 miles per hour. This provides maximum comfort for most drivers.
Superelevation for horizontal curves with radii of 10,000 feet and greater may be deleted in those situations where the combination of a flat grade and a superelevation transition would create undesirable drainage conditions on the pavement.
Superelevated cross slopes on curves extend the full width of the traveled way and shoulders, except that the shoulder slope on the low side should be not less than the minimum shoulder slope used on the tangents (see Index 304.3 for cross slopes under cut widening conditions).
On rural 2-lane roads, superelevation should be on the same plane for the full width of traveled way and shoulders, except on transitions (see Index 304.3 for cut widening conditions).
(2) Bikeways. Table 202.2 also applies to Class II and III bikeways. See Index 1003.1 for Class I guidance.
202.3 Restrictive Conditions Lower superelevation rates than those given in either Table 202.2 or Figure 202.2 may be necessary in areas where restricted speed zones or ramp/street intersections are controlling factors. Other typical locations are short radius curves on ramps near the local road juncture, either at an intersection or where a loop connects with an overcrossing structure. Often, established street grades, curbs, or drainage may prove difficult to alter and/or superelevation transition lengths would be undesirably short.

400-22 HIGHWAY DESIGN MANUAL May 7, 2012
may be excessive. High costs may be attributable to right of way acquisition, building removal, extensive excavation, or immitigable environmental impacts. In such cases a lesser value of corner sight distance, as described under the following headings, may be used.
(b) Public Road Intersections (Refer to Topic 205)--At unsignalized public road intersections (see Index 405.7) corner sight distance values given in Table 405.1A should be provided.
At signalized intersections the values for corner sight distances given in Table 405.1A should also be applied whenever possible. Even though traffic flows are designed to move at separate times, unanticipated conflicts can occur due to violation of signal, right turns on red, malfunction of the signal, or use of flashing red/yellow mode.
Table 405.1A Corner Sight Distance (7-1/2 Second Criteria)
Design Speed (mph)
Corner Sight Distance (ft)
25 275 30 330 35 385 40 440 45 495 50 550 55 605 60 660 65 715 70 770
Where restrictive conditions exist, similar to those listed in Index 405.1(2)(a), the minimum value for corner sight distance at both signalized and unsignalized intersections shall be equal to the stopping sight distance as given in Table 201.1, measured as previously described.
(c) Private Road Intersections (Refer to Index 205.2) and Rural Driveways (Refer to Index 205.4)--The minimum corner sight distance shall be equal to the stopping sight distance as given in Table 201.1, measured as previously described.
(d) Urban Driveways (Refer to Index 205.3)--Corner sight distance requirements as described above are not applied to urban driveways.
(3) Decision Sight Distance. At intersections where the State route turns or crosses another State route, the decision sight distance values given in Table 201.7 should be used. In computing and measuring decision sight distance, the 3.5-foot eye height and the 0.5-foot object height should be used, the object being located on the side of the intersection nearest the approaching driver.
The application of the various sight distance requirements for the different types of intersections is summarized in Table 405.1B.
(4) Acceleration Lanes for Turning Moves onto State Highways. At rural intersections, with “STOP” control on the local cross road, acceleration lanes for left and right turns onto the State facility should be considered. At a minimum, the following features should be evaluated for both the major highway and the cross road:
• divided versus undivided
• number of lanes
• design speed
• gradient
• lane, shoulder and median width
• traffic volume and composition of highway users, including trucks and transit vehicles
• turning volumes
• horizontal curve radii
• sight distance
• proximity of adjacent intersections
• types of adjacent intersections

HIGHWAY DESIGN MANUAL 400-23 May 7, 2012 For additional information and guidance, refer
to AASHTO, A Policy on Geometric Design of Highways and Streets, the Headquarters Traffic Liaison and the Design Coordinator.
Table 405.1B Application of Sight Distance
Requirements Intersection Sight Distance
Types Stopping Corner Decision
Private Roads X X(1)
Public Streets and Roads X X
Signalized Intersections
X (2)
State Route Inter-sections & Route Direction Changes, with or without Signals
X X X
NOTES:
(1) Using stopping sight distance between an eye height of 3.5 ft and an object height of 4.25 ft. See Index 405.1(2)(a) for setback requirements.
(2) Apply corner sight distance requirements at signalized intersections whenever possible due to unanticipated violations of the signals or malfunctions of the signals. See Index 405.1(2)(b).
405.2 Left-turn Channelization (1) General. The purpose of a left-turn lane is to
expedite the movement of through traffic by, controlling the movement of turning traffic, increasing the capacity of the intersection, and improving safety characteristics.
The District Traffic Branch normally establishes the need for left-turn lanes.
(2) Design Elements.
(a) Lane Width – The lane width for both single and double left-turn lanes on State highways shall be 12 feet.
For conventional State highways with posted speeds less than or equal to 40 miles per hour and AADTT (truck
volume) less than 250 per lane that are in urban, city or town centers (rural main streets), the minimum lane width shall be 11 feet.
When considering lane width reductions adjacent to curbed medians, refer to Index 303.5 for guidance on effective roadway width, which may vary depending on drivers’ lateral positioning and shy distance from raised curbs.
(b) Approach Taper -- On conventional highways without a median, an approach taper provides space for a left-turn lane by moving traffic laterally to the right. The approach taper is unnecessary where a median is available for the full width of the left-turn lane. Length of the approach taper is given by the formula on Figures 405.2A, B and C.
Figure 405.2A shows a standard left-turn channelization design in which all widening is to the right of approaching traffic and the deceleration lane (see below) begins at the end of the approach taper. This design should be used in all situations where space is available, usually in rural and semi-rural areas or in urban areas with high traffic speeds and/or volumes.
Figures 405.2B and 405.2C show alternate designs foreshortened with the deceleration lane beginning at the 2/3 point of the approach taper so that part of the deceleration takes place in the through traffic lane. Figure 405.2C is shortened further by widening half (or other appropriate fraction) on each side. These designs may be used in urban areas where constraints exist, speeds are moderate and traffic volumes are relatively low.
(c) Bay Taper -- A reversing curve along the left edge of the traveled way directs traffic into the left-turn lane. The length of this bay taper should be short to clearly delin-eate the left-turn move and to discourage through traffic from drifting into the left-turn lane. Table 405.2A gives offset data for design of bay tapers. In urban areas,

400-24 HIGHWAY DESIGN MANUAL May 7, 2012
lengths of 60 feet and 90 feet are normally used. Where space is restricted and speeds are low, a 60-foot bay taper is appropriate. On rural high-speed highways, a 120-foot length is considered appropriate.
(d) Deceleration Lane Length -- Design speed of the roadway approaching the intersection should be the basis for determining deceleration lane length. It is desirable that deceleration take place entirely off the through traffic lanes. Deceleration lane lengths are given in Table 405.2B; the bay taper length is included. Where partial deceleration is permitted on the through lanes, as in Figures 405.2B and 405.2C, design speeds in Table 405.2B may be reduced 10 miles per hour to 20 miles per hour for a lower entry speed. In urban areas where cross streets are closely spaced and deceleration lengths cannot be achieved, the District Traffic branch should be consulted for guidance.
(e) Storage Length -- At unsignalized inter-sections, storage length may be based on the number of turning vehicles likely to arrive in an average 2-minute period during the peak hour. At a minimum, space for 2 vehicles should be provided at 25 feet per vehicle. If the peak hour truck traffic is 10 percent or more, space for at least one passenger car and one truck should be provided. Bus usage may require a longer storage length and should be evaluated if their use is anticipated.
At signalized intersections, the storage length may be based on one and one-half to two times the average number of vehicles that would store per signal cycle depending on cycle length, signal phasing, and arrival and departure rates. At a minimum, storage length should be calculated in the same manner as unsignalized intersection. The District Traffic Branch should be consulted for this information.
Table 405.2A Bay Taper for Median Speed-change Lanes
NOTES: (1) The table gives offsets from a base line parallel to
the edge of traveled way at intervals measured from point "A". Add "E" for measurements from edge of traveled way.
(2) Where edge of traveled way is a curve, neither base line nor taper between B & C will be a tangent. Use proportional offsets from B to C.
(3) The offset "E" is usually 2 ft along edge of traveled way for curbed medians; Use "E" = 0 ft. for striped medians.
Table 405.2B Deceleration Lane Length
Design Speed (mph)
Length to Stop (ft)
30 235 40 315 50 435 60 530

HIGHWAY DESIGN MANUAL 400-25 May 7, 2012
When determining storage length, the end of the left-turn lane is typically placed at least 3 feet, but not more than 30 feet, from the nearest edge of shoulder of the intersecting roadway. Although often set by the placement of a crosswalk line or limit line, the end of the storage lane should always be located so that the appropriate turning template can be accommodated.
(3) Double Left-turn Lanes. At signalized intersections on multilane conventional highways and on multilane ramp terminals, double left-turn lanes should be considered if the left-turn demand is 300 vehicles per hour or more. The lane widths and other design elements of left-turn lanes given under Index 405.2(2) applies to double as well as single left-turn lanes.
The design of double left-turn lanes can be accomplished by adding one or two lanes in the median. See "Guidelines for Reconstruction of Intersections", published by Headquarters, Division of Traffic Operations, for the various treatments of double left-turn lanes.
(4) Two-way Left-turn Lane (TWLTL). The TWLTL consists of a striped lane in the median of an arterial and is devised to address the special capacity and safety problems associated with high-density strip develop-ment. It can be used on 2-lane highways as well as multilane highways. Normally, the District Traffic Operations Branch should determine the need for a TWLTL.
The minimum width for a TWLTL shall be 12 feet (see Index 301.1). The preferred width is 14 feet. Wider TWLTL's are occasionally provided to conform with local agency standards. However, TWLTL's wider than 14 feet are not recommended, and in no case should the width of a TWLTL exceed 16 feet. Additional width may encourage drivers in opposite directions to use the TWLTL simultaneously.
405.3 Right-turn Channelization (1) General. For right-turning traffic, delays are
less critical and conflicts less severe than for
left-turning traffic. Nevertheless, right-turn lanes can be justified on the basis of capacity, analysis, and crash experience.
In rural areas a history of high speed rear-end collisions may warrant the addition of a right-turn lane.
In urban areas other factors may contribute to the need such as:
• High volumes of right-turning traffic causing backup and delay on the through lanes.
• Conflicts between crossing pedestrians and right turning vehicles and bicycles.
• Frequent rear-end and sideswipe collisions involving right-turning vehicles.
High-speed channelized right turns are generally inappropriate because they create conflicts with pedestrians and bicyclists and allow vehicles to turn at high speeds. For pedestrians a properly designed channelized right turn island can:
• Allow pedestrians to cross fewer lanes at a time and judge conflicts separately.
• Improve accessibility to pedestrian push-buttons.
• Reduce total crossing distance.
(2) Design Elements.
(a) Lane and Shoulder Width--Index 301.1 shall be used for right-turn lane width requirements. Shoulder width shall be a minimum of 4 feet. Although not desirable, lane and shoulder widths less than those given above can be considered for right-turn lanes under the following conditions and with the approval of a design exception pursuant to Index 82.2:
• On urban, city or town centers (rural main streets) where width is restricted, consideration may be given to reducing the lane width to 11 feet with approval of a design exception.

400-26 HIGHWAY DESIGN MANUAL May 7, 2012
Figure 405.2A Standard Left-turn Channelization

HIGHWAY DESIGN MANUAL 400-27 May 7, 2012
Figure 405.2B Minimum Median Left-turn Channelization
(Widening on one Side of Highway)

400-28 HIGHWAY DESIGN MANUAL May 7, 2012
Figure 405.2C Minimum Median Left-turn Channelization
(Widening on Both Sides in Urban Areas with Short Blocks)

HIGHWAY DESIGN MANUAL 400-29 May 7, 2012
• In urban, city or town centers (rural main streets) with posted speeds less than 40 miles per hour in severely constrained situations, if truck or bus use is low, consideration may be given to reducing the right-turn lane width to 10 feet with approval of a design exception.
• Shoulder widths may also be considered for reduction under constricted situations. Whenever possible, at least a 2-foot offset should be provided where the right-turn lane is adjacent to a curb. Entire omission of the shoulder should only be considered in the most severely constricted situations and where an 11-foot lane can be constructed. Gutter pans can be included within a shoulder, but cannot be included as part of the lane width.
Additional right of way for a future right-turn lane should be considered when an intersection is being designed.
(b) Tapers--Approach tapers are usually un-necessary since main line traffic need not be shifted laterally to provide space for the right-turn lane. If, in some rare instances, a lateral shift were needed, the approach taper would use the same formula as for a left-turn lane.
Bay tapers are treated as a mirror image of the left-turn bay taper.
(c) Deceleration Lane Length--The conditions and principles of left-turn lane deceleration apply to right-turn deceleration. Where full deceleration is desired off the high-speed through lanes, the lengths in Table 405.2B should be used. Where partial de-celeration is permitted on the through lanes because of limited right of way or other constraints, average running speeds in Table 405.2B may be reduced 10 miles per hour to 20 miles per hour for a lower entry speed. For example, if the main line speed is 50 miles per hour and a 10 miles per hour deceleration is permitted on the
through lanes, the deceleration length may be that required for 40 miles per hour.
(d) Storage Length--Right-turn storage length is determined in the same manner as left-turn storage length. See Index 405.2(2)(e).
(3) Right-turn Lanes at Off-ramp Intersections. Diamond off-ramps with a free right-turn at the local street and separate right-turn off-ramps around the outside of a loop will likely cause conflict as traffic volumes increase. Serious conflicts occur when the right-turning vehicle must weave across multiple lanes on the local street in order to turn left at a major cross street close to the ramp terminal. Furthermore, free right-turns create sight distance issues for pedestrians and bicyclists crossing the off-ramp, or pedestrians crossing the local road. Also, rear-end collisions can occur as right-turning drivers slow down or stop waiting for a gap in local street traffic. Free right-turns usually end up with ”YIELD”, ”STOP”, or signal controls thus defeating their purpose of increasing intersection capacity.
Free right-turns should generally be avoided unless there is room for a generous acceleration lane or a lane addition on the local street. Where pedestrians are allowed to cross a free right-turn, the curve radius should be such that the operating speed of vehicular traffic is no more than 20 miles per hour at the pedestrian crossing. NCHRP Report 672, “Roundabouts: An Informational Guide” has guidance on the determination of the design speed (fastest path) for turning vehicles. See Index 504.3(3) for additional information.
405.4 Traffic Islands A traffic island is an area between traffic lanes for channelization of bicycle and vehicle movements or for pedestrian refuge. An island may be defined by paint, raised pavement markers, curbs, pavement edge, or other devices. The California MUTCD should be referenced when considering the placement of traffic islands at signalized and unsignalized locations.
Traffic islands usually serve more than one function. These functions may be:

400-30 HIGHWAY DESIGN MANUAL May 7, 2012
(a) Channelization to confine specific traffic movements into definite channels;
(b) Divisional to separate traffic moving in the same or opposite direction; and
(c) Refuge, to aid users crossing the roadway.
Generally, islands should present the least potential conflict to approaching or crossing bicycles and vehicles, and yet perform their intended function.
(1) Design of Traffic Islands. Island sizes and shapes vary from one intersection to another. They should be large enough to command attention. Channelizing islands should not be less than 50 square feet in area, preferably 75 square feet. Curbed, elongated divisional median islands should not be less than 4 feet wide and 20 feet long. All traffic islands placed in the path of a pedestrian crossing must comply with DIB 82. See the Standard Plans for typical island passageway details.
The approach end of each island should be offset 3 feet to the left and 5 feet to the right of approaching traffic, using standard 1:15 parabolic flares, and clearly delineated so that it does not surprise the motorist or bicyclist. These offsets are in addition to the shoulder widths shown in Table 302.1. Table 405.4 gives standard parabolic flares to be used in island design. On curved alignment, parabolic flares may be omitted for small triangular traffic islands whose sides are less than 25 feet long.
The approach nose of a divisional island should be highly visible day and night with appropriate use of signs (reflectorized or illuminated) and object markers. The approach nose should be offset 3 feet from the through traffic to minimize accidental impacts.
(2) Delineation of Traffic Islands. Generally, islands should present the least potential conflict to approaching traffic and yet perform their intended function. See Index 303.2 for appropriate curb type. Islands may be designated as follows:
(a) Raised paved areas outlined by curbs.
(b) Flush paved areas outlined by pavement markings.
(c) Unpaved areas (small unpaved areas should be avoided).
On facilities with posted speeds over 40 miles per hour, the use of any type of curb is discouraged. Where curbs are to be used, they should be located at or outside of the shoulder edge, as discussed in Index 303.5.
In rural areas, painted channelization sup-plemented with raised pavement markers may be more appropriate than a raised curbed channelization. This design is as forgiving as possible and decreases the consequence of a driver's or bicyclist’s failure to detect or recognize the curbed island. Consideration for snow removal operations should be determined where appropriate.
In urban areas, posted speeds less than or equal to 40 miles per hour allow more frequent use of curbed islands. Local agency requirements and matching existing conditions are factors to consider.
(3) Pedestrian Refuge
Pedestrian refuge islands allow pedestrians to cross fewer lanes at a time while judging conflicts separately. They also provide a refuge so slower pedestrians can wait for a gap in traffic. Traffic islands used as pedestrian refuge should be large enough to provide a minimum of 6 feet in the direction of pedestrian travel. All traffic islands placed in the path of a pedestrian crossing must be accessible, refer to DIB 82 and the Standard Plans for further guidance. An example of a traffic island that serves as a pedestrian refuge is shown on Figure 405.4.
405.5 Median Openings (1) General. Median openings, sometimes called
crossovers, provide for crossings of the median at designated locations. Except for emergency passageways in a median barrier, median openings are not allowed on urban freeways.
Median openings on expressways or divided conventional highways should not be curbed except when the median between openings is curbed, or it is necessary for delineation of traffic signal standards and other necessary

Appendix L
Preliminary Construction Cost Estimates For Congestion Management Plan

1
PRELIMINARY CONSTRUCTION COST ESTIMATES FOR
CONGESTION MANAGEMENT PLAN
Add One Lane Each Direction on Freeway Asphalt Concrete Pavement Portland Cement Concrete Pavement Includes: Excavation Paving Section Barrier Shoulder Upgrade Drainage System Traffic Control Mobilization @10% Design @11% Construction Mgt. @12.5%
$2,300,000 Per Mile $2,800,000 Per Mile Excludes: Environmental Costs Right of Way Widening of Bridge Structures Added Retaining Walls Added Sound Walls
Widen Existing UC Structures Total Cost = Includes: Structure Mobilization @10% Design @11% Construction Mgt. @12.5%
$160 Per Square Foot Excludes: Environmental Costs Right of Way Traffic Control Ramp Modifications Signal/Lighting Up Grades Drainage Upgrades Added Retaining Walls Added Sound Walls
Diamond Interchanges $10,000,000 $15,000,000 $20,000,000 $25,000,000
EACH EACH EACH EACH
NEW IC NEW IC EXISTING EXISTING
Minimal Row/Environmental Includes Row/Environmental Minimal Row/Environmental Includes Row/ Environmental
Includes: Structure Retaining Walls Soil Nail Walls Drainage System Ramps Mobilization @ 10% Design @ 11% Construction Mgt. @ 12.5%
Excludes: As listed

2
Retaining Walls
Height Feet
4 6 8
10 12 14 16
Structure Cost
$/LF
$190 $260 $380 $430 $480 $590 $660
Excludes: Environmental Costs
Right of Way
Mobilization Design Constr. Mgt.
$/LF
$70 $90 $140 $150 $170 $210 $240
Total $/LF
$260 $350 $520 $580 $650 $800 $900
12’ High Sound Walls (Masonry Block on Footing)
Structure Cost $/Mile
$800,000
Mobilization Design Constr. Mgt.
$/Mile
$300,000
Total $/Mile
$1,100,000
Widen Conventional Highway 1. Add one outside lane (Work includes earthwork, modify existing drainage
system and construct AC shoulder section. Asphalt Concrete Pavement 2. Add one outside lane each direction (Work includes earthwork, modify existing drainage
system and construct AC shoulder section) Asphalt Concrete Pavement With Median Concrete Barrier With Median Double Thrie Beam Barrier
$1,000,000/Mile $2,000,000/Mile $2,200,000/Mile $2,300,000/Mile
Local Interchange Improvements 1. New Interchange Urban Interchange Partial – Cloverleaf Interchange (Work includes new OC structure, earthwork, signal) Diamond Interchange (Work includes new OC structure, earthwork, signal)
$10,000,000 to $17,000,000 $6,000,000 $5,000,000

3
Local Interchange Improvements CONT… 2. Reconstruct Existing Interchange Realign and widen existing ramps (to 2 lanes) Construct Loop on – ramps (Does not include realigning existing ramp) Upgrade existing Diamond IC to Partial – Cloverleaf
3. Improve Existing Interchange Widen ramps (From one to two lanes) Widen existing OC structure Signalize ramp intersection Upgrade existing signal at ramp terminal Upgrade existing signal at ramp terminal (Add lights only) 4. Ramp Metering System
$750,000/Each Ramp $700,000/Each Ramp $6,000,000 $350,000/Each Ramp $110/Sq. Ft. $90,000/Location $75,000/Intersection $25,000/Each $60,000/Each location
Intersection Improvements 1. Signalization of local intersection (with some roadwork) 2. Upgrade existing intersection signalization 3. Upgrade existing Traffic Controller/Assembles 4. Install new signal 5. Add signal heads 6. Construct left – turn lane (240’ long) 7. Street widening (12’ wide) (Pavement only) 8. Curb and gutter (Type A2-8)
$250,000 $75,000 $40,000/Each $90,000/location $25,000/Intersection $50,000/Each Location $180,000/Mile $15/LF

4
Other Improvements 1. Construct new OC structure (Does not include roadway work) 2. Construct Retaining Walls (Type 1) 3. Construct Soundwall 4. Traffic Management Plan
$100/Sq. Ft. $285/LF (H=8’) $360/LF (H=10’) $460/LF (H=12’) $560/LF (H=14’) $1,000,000/Mile (H=12’) 10% of total construction costs
NOTE: This cost estimate does not include the following items: 1. R/W engineering, appraisal, acquisition and utilities relocation costs. 2. Minor items and supplemental work (10%). 3. Mobilization (10%). 4. Contingencies (25%). 5. Landscaping costs. General Note: When adding a through lane, the minimum distance is 600’ approach and 600’ departure to the next intersection.

Appendix M
Memorandum of Understanding (MOU)

SCOPE FOR TRAFFIC STUDY
Project Name: Agua Mansa High Cube Warehouse
Form Rev. 9/28/2012 Page 1 of 6
This Scope for Traffic Study acknowledges San Bernardino County Department of Public Works, Traffic Division requirements of traffic impact analysis for the project and is subject to change:
Project Address: North of El Ravino Road, East of Hall Avenue, West of Agua Mansa Road, Bloomington, San Bernardino County
Project Description: 516,488 sq/ft High Cube Warehouse
City: County of San Bernardino/ City of Redlands
Project Buildout Year: 2017 Ambient Growth Rate per Year: 2% / SBTAM
Closest Intersection (Xtn) to the Project
Xtn N/S Street Name: Agua Mansa Road
Xtn E/W Street Name: El Ravino Road
Thomas Guide Pg+Grid: 645+G3/G4 County Supervisorial District: 5
Engineer Developer
Company: RK Engineering Group, Inc. Lansing Companies
Name: Robert Kahn Mark Pekarek
Address: 4000 Westerly Place 12671 High Bluff Drive, #150
City, State, Zip Code: Newport Beach, CA, 92660 San Diego, CA 92310
Phone #: 949-474-0809 858-523-0719
Fax #: 949-474-0902 858-523-0826
Email: [email protected] [email protected]
By: 7/28/14 Reviewed By:
Print Name: Bryan Estrada 7/28/14 Print Name: Consultant/Developer’s Representative Date Traffic Division Representative Date

SCOPE FOR TRAFFIC STUDY
Project Name: Agua Mansa High Cube Warehouse
Form Rev. 9/28/2012 Page 2 of 6
1. Traffic Distribution: Please insert or attach Figure(s) illustrating project trip distribution in percentages and volumes at the study intersections analyzed.
2. Trip Credit: Exact amount of credit subject to approval by Traffic Division.
Transportation Demand Management (TDM) No
Existing Active Land Use No
Previous Land Use No
Internal Trip Reduction No
Pass-by Trip Reduction No
3. Related Projects: Consultant should check with Planning in the San Bernardino County Department of Land Use Services and planning departments of adjoining Cities. Documentation of the consultation from these agencies shall be included in the traffic study. Related projects list shall be submitted to Traffic Division for our review and approval before being incorporated in the study.
4. Freeway Analysis: The potential traffic impact on the following Freeway(s) must be considered.
N/A; project not expected to contribute more than 50 trips to a Caltrans facility during any peak hour.
The applicant shall consult with the State of California Department of Transportation (Caltrans) to determine the California Environmental Quality Act levels of significance with regard to traffic impacts on Caltrans’ freeway facilities. This consultation shall also include a determination of Caltrans requirements for the study of traffic impacts to its facilities and the mitigation of any such impacts. This analysis must follow the most current Caltrans’ Guide for the Preparation of Traffic Impact Studies (December 2002) and can be obtained from http://www.dot.ca.gov/hq/traffops/developserv/operationalsystems/reports/tiguide.pdf. If Caltrans finds that the project has a significant impact on the freeway, Caltrans shall be requested to include the basis for this finding in their response. If fees are proposed to mitigate the freeway impact, Caltrans shall be requested to identify the specific project to which the fees will apply. These written comments from Caltrans shall be included with the traffic study and submitted to Public Works for review and approval. If a documented good faith effort is made to consult with Caltrans and written comments cannot be obtained from within a reasonable amount of time, an analysis of the freeway impact shall be made using HCM procedures. Appendix A of the SANBAG CMP outlines allowable modifications to these procedures. The SANBAG CMP can be viewed online at: http://www.sanbag.ca.gov/planning/subr_congestion.html

SCOPE FOR TRAFFIC STUDY
Project Name: Agua Mansa High Cube Warehouse
Form Rev. 9/28/2012 Page 3 of 6
5. Trip Generation Trip Generation Rate(s) Source: ITE Trip Generation
I – Institute of Transportation Engineers; S – San Diego Traffic Generators; C – County; O – Other:
Edition: 9th
Land Use
Code Land Use
Rate Based
on Qty *AVTE vs ADT
Weekday a.m. peak
Weekday p.m. peak
Weekend peak hour
In Out In Out In Out
152 High Cube Warehouse1 I/O 1,137 1,137 52 24 25 56 n/a n/a
- Average Vehicle Trip Ends
1 See attached trip generation tables for more information on rates and PCE factors.

SCOPE FOR TRAFFIC STUDY
Project Name: Agua Mansa High Cube Warehouse
Form Rev. 9/28/2012 Page 4 of 6
6. Study Intersections: At minimum, the study shall include the following intersections. The list is subject to change after related projects, trip generation and distribution are determined. Consultant should check with adjoining Cities regarding their requirements in addition to the following County/City intersections. Documentation of the consultation from these agencies shall be included in the traffic study.
Xtn #
% County
Thomas Guide
Page+Grid
N/S E/W Street Name
City Signalized CMP
1 0 645+E4 Rubidoux Blvd./Cedar Ave (NS) at El Rivino Rd./Tarragon Dr. (EW) Jurupa Valley Yes No
2 25 645+F4 Cactus Ave (NS) at El Rivino Rd. (EW) SB County/ Riverside
County/Rialto No No
3 50 645+G4 Hall Ave (NS) at El Rivino Rd. (EW) SB County/ Jurupa
Valley No No
4 50 645+G4 Kingham Dr. (NS) at El Rivino Rd. (EW) SB County/Jurupa
Valley No No
5 100 645+H4 Agua Mansa Rd. (NS) at El Rivino Rd. (EW) SB County No No
6 0 645+H3 Riverside Ave. (NS) at Agua Mansa Rd. (EW) Rialto/Colton Yes Yes
All Proposed Project Access Driveways to be Analyzed
7 100 645+G4 Project Access 1 (NS) at El Rivino Road County of SB No No
8 50 645+G4 Agua Mansa Road (NS) at Project Access 2 County of SB Future No Cites to be consulted: Fontana, Rialto, Colton, Jurupa Valley, Riverside, Riverside Co.

SCOPE FOR TRAFFIC STUDY
Project Name: Pioneer and San Bernardino Ave. High Cube Warehouse
Page 8 of 8
7. Other:
Traffic counts may be conducted immediately per the following:
• Must be taken on Tuesdays, Wednesdays or Thursdays.
• Must exclude holidays, and the first weekdays before and after the holiday.
• Must be taken on days when local schools or colleges are in session. • Must be taken on days of good weather, and avoid atypical conditions (e.g., road
construction, detours, or major traffic incidents). • Traffic counts used for other traffic studies in the area shall NOT be reused
again, unless 25% of the counts conducted for that particular traffic study are validated with new counts. The difference in volumes between the old and new counts at each corresponding movement should not be more than 10%.
• New traffic counts shall be checked to ensure the difference in volumes at corresponding approaches, if applicable, between two adjacent intersections is no more than 10% unless the difference can be justified.
• For all proposed mitigation measures, a conceptual plan for the improvements shall be submitted to our Traffic Studies section for review and approval prior to the approval of the Traffic Impact Analysis. All proposed improvements shall be within the right-of-way.
• For all cumulative mitigation measures, a cost estimate for the improvement shall be submitted.
This analysis must follow the most current Traffic Impact Study Guidelines for the County as stated in the County’s Road Planning and Design Standards.
8. Fees The County charges on an actual cost basis for review of traffic studies. An initial deposit of $3400 is required at the time that a land use application is filed with the Department of Land Use Services If the review costs exceed the initial deposit, the applicant will be expected to provide additional funds and the review will be suspended until the additional funds are deposited.

SCOPE FOR TRAFFIC STUDY
Project Name: Pioneer and San Bernardino Ave. High Cube
Warehouse
Form Rev. 9/28/2012 Page 6 of 6
9. Contact Information:
Please submit a signed copy of this MOU for approval by the Traffic Division. The MOU may be submitted in person, by fax, by email or by US Mail to:
County of San Bernardino Dept. of Public Works, Traffic Division
825 E. 3rd Street, Rm 115 San Bernardino, CA 92415-0835
Phone: 909-387-8186 Fax: 909-387-7809 Email: [email protected] (Ed Petre)

Land Use Units1 In Out Total In Out Total Daily
High-Cube Warehouse TSF
0.076 0.034 0.110 0.037 0.083 0.120 1.68069% 31% 100% 31% 69% 100% --
79.57% 79.57% 79.57% 79.57% 79.57% 79.57% 79.57%
1.0 1.0 1.0 1.0 1.0 1.0 1.0
0.060 0.027 0.088 0.030 0.066 0.095 1.337
3.46% 3.46% 3.46% 3.46% 3.46% 3.46% 3.46%
1.5 1.5 1.5 1.5 1.5 1.5 1.5
0.004 0.002 0.006 0.002 0.004 0.006 0.087
4.64% 4.64% 4.64% 4.64% 4.64% 4.64% 4.64%
2.0 2.0 2.0 2.0 2.0 2.0 2.0
0.007 0.003 0.010 0.003 0.008 0.011 0.156
12.33% 12.33% 12.33% 12.33% 12.33% 12.33% 12.33%
3.0 3.0 3.0 3.0 3.0 3.0 3.00.028 0.013 0.041 0.014 0.031 0.044 0.621
0.060 0.027 0.088 0.030 0.066 0.095 1.337
0.004 0.002 0.006 0.002 0.004 0.006 0.087
0.007 0.003 0.010 0.003 0.008 0.011 0.1560.028 0.013 0.041 0.014 0.031 0.044 0.621
Building Size: 516.488 TSF
1 TSF = Thousand Square Feet
2 High-Cube Warehouse Trip Generation Source: ITE Trip Generation, 9th Ed./National Association of Industrial and Office Properties (NAIOP) Adjusted Rates
3 Inbound/Outbound Splits per ITE Trip Generation, 8th Ed., 2008
4 Recommended Vehicle Mix Percentages per City of Fontana Truck Trip Generation Study for Heavy Warehouse uses, August 2003 (Page 40)
5 Recommended PCE Factor per San Bernardino County CMP, 2005 Update
Trip Generation Rates2
PCE Inbound/Outbound Splits3
Passenger Car Equivalent Rates Calculations
Recommended Mix (%)4
PCE Rates
3-Axle Trucks
Passenger Cars
Recommended Mix (%)4
PCE Factor5
PCE Rates
2-Axle Trucks
Recommended Mix (%)4
4-Axle+ Trucks
PCE Rates
Passenger Cars
2-Axle Trucks
Final Rates (In Passenger Car Equivalents)
3-Axle Trucks
PCE Factor5
Recommended Mix (%)4
PCE Factor5
4-Axle Trucks
PCE Rates
TABLE 2
Trip Generation Rates
AM PM
Peak Hour
PCE Factor5
j:/rktables/09951406_DRAFT TABLES.xlsJN:1496-2013-02

In Out Total In Out Total
High Cube Warehouse 516.488 TSF 39 18 57 19 43 62 868
In Out Total In Out Total Daily
31 14 45 15 34 49 690
2 1 3 1 2 3 45
4 2 6 2 4 6 81
15 7 22 7 16 23 321
52 24 76 25 56 81 1,137
1 TSF = Thousand Square Feet
Units1
2-Axle Trucks (1.5 x)
3-Axle Trucks (2.0 x)
4-Axle+ Trucks (3.0 x)
Final Trip Generation(In Passenger Car Equivalents)
Weekday Peak HourAM PM
Passenger Cars
Vehicle Mix
Table 3Trip Generation (Passenger Car Equivalents)
ITE TRIP GENERATION
ITE TRIP GENERATION IN PASSENGER CAR EQUIVALENTS
DailyAM PM
Weekday Peak Hour
Land Use Quantity
j:/rktables/09951406_DRAFT TABLES.xlsJN:1496-2013-02