r(JCW IONAL HURRICANE RESEARCH PROJECTJCW IONAL HURRICANE RESEARCH PROJECT flTS^ t ^ t &
36
r(JCW IONAL HURRICANE RESEARCH PROJECT flTS^ t ^ t & <P \ <CP REPORT NO. 60 Cloud Seeding Experiment in Hurricane Esther, 1961 ATHOS * LAB0RA1 UuLLtUlUM <? a- 0
Transcript of r(JCW IONAL HURRICANE RESEARCH PROJECTJCW IONAL HURRICANE RESEARCH PROJECT flTS^ t ^ t &
r(JCW
IONAL HURRICANE RESEARCH PROJECTflTS^
t
^ t
&
<P
\
<CP
REPORT NO. 60
Cloud Seeding Experiment in
Hurricane Esther, 1961
ATHOS *LAB0RA1 UuLLtUlUM
<?a-
0


U. S. DEPARTMENT OF COMMERCELuther H. Hodges, Secretary
WEATHER BUREAUF. W. Reichelderfer, Chief
NATIONAL HURRICANE RESEARCH PROJECT
REPORT NO. 60
A Cloud Seeding Experiment in
Hurricane Esther, 1961
by
R. H. Simpson, M. R. Ahrens, and R. D. Decker
U. S. Weather Bureau, Washington, D. C.
. fit
Research reported here has been sponsored by the Department of Commerce, Weather Bureau with operational supportby the U. S. Navy. Additional support has been provided by the National Science Foundation under Grant NSF-G-17993
Washington, D. C.
November 1962
Rev. April 1963
UlAiJDl DbDll?S

RATIONAL HURRICANE RESEARCH PROJECT REPORTS
Reports by Weather Bureau units, contractors, and cooperators working on the hurricane problem are preprinted inthis series to facilitate immediate distribution of the information among theworkers andother interested units. As%Mn limited reproduction anddistribution in this form do not constitute formal scientific publication, reference to apaper in the series should identify it as a preprinted report.
Objectives and basic design of the HHRP. March 1956*numerical weather prediction of hurricane motion. July 1956.
Supplement: Error analysis of prognostic 500-ab. maps made for numerical weather prediction of hurricanemotion. March 1957*
Rainfall associated with hurricanes. July 1956.Some problems involved inthe study of storm surges. December 1956.Survey of meteorological factors pertinent to reduction of loss of life andproperty in hurricane situations.
March 1957.A mean atmosphere for the Vest Indies area. May 1957.An In**'* of tide gages andtide gage records forthe Atlantic and Gulf coasts of the united States. May 1957.Part I. Hurricanes and the sea surface temperature field. Part H. The exchange of energy between the sea
and the atmosphere in relation to hurricane behavior. June 1957*Seasonal variations In the frequency of Bbrth Atlantic tropical cyclones related to the general circulation.
July 1957.Estimating central pressure oftropical cyclones from aircraft data. August 1957-Instrumentation of Rational Hurricane Research Project aircraft. August 1957.Studies of hurricane spiral bands as observed on radar. September 1957.Mean soundings forthe hurricane eye. September 1957.On the "pyrfiw™ intensity of hurricanes. December 1957*The three-dimensional wind structure around a tropical cyclone. January 1958.Modification ofhurricanes through cloud seeding. May 1958.Analysis of tropical storm Frieda 1957. A preliminary report. June 1958.She use of mean layer winds as a hurricane steering mechanism. June 1958.Further examination of the balance of angular' momentum in the mature hurricane. July 1958.On the energetics of the mature hurricane and other rotating wind systems. July 1958.Formation of tropical storms related to anomalies of the long-period mean circulation. September 1958.On production of kinetic energy from condensation heating. October 1958.Hurricane Audrey storm tide. October 1958. bDetails of circulation inthe high energy core ofhurricane Carrie. November 1958.Distribution of surface friction in hurricanes. Rbvember 1958.A note onthe origin of hurricane radar spiral bands and the echoes which form them. February 1959«Proceedings of the Board of Review and Conference on Research Progress. March 1959*A morttl hurricane plan for a coastal cosmmity. March 1959*Exchange of heat, moisture, and momentum between hurricane Ella (1958) and its environment. April 1959*Mean soundings for the Gulf of Mexico area. April 1959.On the dynamics and energy transformations in steady-state hurricanes. August 1959*An interim hurricane storm surge forecasting guide. August 1959•Meteorological considerations pertinent to standard project hurricane, Atlantic and Gulf coasts of the Ifaited
States. Bovember 1959.Filling and intensity changes inhurricanes over land. Bovember 1959*Wind and pressure fields In the stratosphere over the Vest Indies region in August 1958. December 1959*CUmatological aspects of intensity of typhoons. February i960.unrest In the upper stratosphere over the Caribbean Sea during January i960. April' i960.On quantitative precipitation forecasting. August i960.Surface winds near the center of hurricanes (and other cyclones). September i960.On Initiation of tropical depressions and convection in a conditionally unstable atmosphere. October i960.On the heat balance of the troposphere and water body of the Caribbean Sea. December i960.Climatology of 2U-hour Borth Atlantic tropical cyclone movements. January 1961.Prediction of movements and surface pressures of typhoon centers in the Far East by statistical methods. May 1961.Marked changes in the characteristics of the eye of Intense typhoons between the deepening and filling states.
May 196I.The occurrence of anomalous winds and their significance. June I96I.Some aspects of hurricane Daisy, 1958. July 1961.rynwwwttig the mechanics and thermdynamica of the inflow layer of the mature hurricane. September 1961.Onthe structure of hurricane Daisy (I958). October 1961.Some properties of hurricane wind fields as deduced from trajectories. Bovember I96I.Proceedings of the Second Technical Conference on Hurricanes, June 27-30, 1961, Miami Beach, Flo. March 1962.Concerning the general vertically averaged hydrodynamic equations with respect to basic storm
surge equations. April I962.Inventory, use, and availability of HHRP meteorological data gathered by aircraft. April 1962.On the momentum and energy balance of hurricane Helena (1958). April 1962.On the balance of forces andradial accelerations in hurricanes. June 1962.Vertical wind profiles In hurricanes. June 1962.A theoretical analysis of the field of motion in the hurricane boundary layer. June 1962.On the dynamics of disturbed circulation in the lower mesosphere. August 1962.Mean sounding data over the western tropical Pacific Ocean during the typhoon season, andDistribution of turbulence and icing inthe tropical cyclone. October I962.
Ho. 59. Reconstruction of the surface pressure and wind fields of hurricane Helene. October 1962.
Kb. 1.
Bo. 2.
Ho. 3.No. k.Bo. 5.
Bo. 6.Ho. 7.So. 8.
Bo. 9.
Bo. 10.
No. 11.
Bo. 12.
No. 13.Bo. Ik.Bo. 15.Bo. 16.Bo. 17.Bo. 18.Bo. 19.No. 20.
Bo. 21.
Ho. 22.
No. 23.No. 2k.Ho. 25.Ho. 26.No. 27-Bo. 28.No. 29.Bo. 30.No. 31.Ho. 32.Ho. 33.
No. 3t.No. 35.No. 36.Ho. 37.No. 38.No. 39-No. ko.Ho. kl.No. k2.No. *3.No. kk.
No. *5.Ho. 1*6.
Ho.Ho. &Bo. «*.Ho. 50.Bo. 51.
Ho. 52.Ho. 53.Ho. :*.Ho. 55.Ho. 56.No . 57.Bo • 58.
-, r—:u^^^^t'^M,:^'^^.V^V^^^^^---^^-^-•-' V^: J'l'^^l..
FOREWORD
This paper describes a cloud seeding experiment that was madein 196l during the research operations of the National HurricaneResearch Project (NHRP) with special support supplied by the U. S.Navy. Readers who are looking for definite answers to questionsabout the effects of cloud seeding on the destructive forces of ahurricane will not find them in this paper. Many more experimentsand much deeper research are necessary to get answers to thesequestions.
This paper is nevertheless important for several reasons. Although the experiment it describes is preliminary, it does representthe most comprehensive and concerted scientific experiment in thisfield up to the present time. It is the prototype for more intensiveand more extensive research now provided in the plans of the NHRPwhich include the collaboration and material assistance of other
interested agencies, particularly the Navy and the National ScienceFoundation.
This research is designed to test hypotheses involving therelease of small energy sources which might trigger changes in thestructure and mechanism of a hurricane in way$ that would modify andreduce its destructive characteristics.
Many inquiries have been received from persons interested in thepossibilities of hurricane modification. This paper serves to informthem of the experimentation so far completed. We hope it willstrengthen interest for and support of the program and give rise tofurther ideas and suggestions for the future progi
Chief, U. S. Weather Bureau
COLORED© 3TAT€ Uwwpdc^

CONTENTS
ABSTRACT Pa9e
1. INTRODUCTION
2. EXPERIMENT DESIGN 2
Background ?
Objectives and procedures 3
Flight tracks ,,
5. HURRICANE ESTHER
4. THE SEEDING OPERATION ]5
5. RESULTS OF THE SEPTEMBER 16 EXPERIMENT 19
Radar observations iq
Circulation and kinetic energy 20
6. RESULTS OF THE SEPTEMBER 17 EXPERIMENT 28
7. SUMMARY AND CONCLUSIONS 90^y
ACKNOWLEDGMENTS^9
REFERENCES30

A CLOUD SEEDING EXPERIMENT IN HURRICANE ESTHER, I96.I
R. H. Simpson, M. R. Ahrens, and R. D. DeckerU. S. Weather Bureau, Washington, D. C.
ABSTRACT
In September I96I cloud seeding experiments were conducted inhurricane Esther on two con.ecutive days. The purpose was to determine whether artificial releases of latent heat of fusion and
sublimation could be used to induce circulation instabilities
leading to a reduction of maximum wind speeds. Pyrotechnic generators, dropped from aircraft in the tops of clouds, releasedvertical plumes of silver iodide which were subsequently spreaddownstream by the hurricane circulation. Results were monitoredby research aircraft which maintained continuous radar coverage ofa test area and measured changes in kinetic energy before and afterseed ing.
A marked reduction in reflectivity of 10-cm. radar energy wasobserved in the test area after the silver iodide was released.
Also the kinetic energy diminished. However, the small magnitudeof the change and limitations of the analysis restricted the conclusions which can be drawn on the basis of these initial experiments
1. INTRODUCTION
Most scientific experiments in weather modification have soughtmeans of increasing rainfall or suppressing hail. While a number ofinvestigators have concerned themselves with means of reducing thehazard from severe storms (e.g., Langmuir ^4,57, Lopez and Howell /6/),few field experiments have been undertaken, probably for two reasons.First, the amount of energy released by hurricanes or tornado-bearingsquall lines is so immense that the work which man, through his owndevices, can apply to the atmosphere is insignificant by comparison,unless it can be used to trigger circulation instabilities which causedivergence of momentum or reduce the concentration of kinetic energy.Too little has been known about severe storms to identify their"Achilles heels". Secondly, the same lack of knowledge has tended toexpose the experimenter to unacceptable legal liabilities for stormdamage which might follow any effort to modify storm intensity.
The first documented effort at weather modification in a hurricane
occurred on October 13, 19^7> when Project Cirrus conducted.a seeding
. • cm^il hurricane off the Florida coast (Rex fij\ Mookexperiment in a small hurricane ott in dropped/67\ in this instance approximately oo id. ot ary i^ rr/8/). In this "«»"* ^ results of which could not be^ffS^^f^mtTri.r. available to monitor changes incirculation or cloud structure.
a i reran at west ran 7 tranes on two occasions.
STrr-VfS^ wThr;ren^rpmenrtr;Craenveented usefu, resuits fro.being obtained.
Afw five vears of experimental research, the findings of NHRPpoint^ne way I |-e c^ete^™^X&agreed on J°'"t sP-sorshi po aser es^th^ ^ P^ ^^the same time, the Nava ura"°' - raoidlv dispens ng largedeveloped new pyrotechnic generators for rapid y P squantities of silver od.de in ver,cP^^ 9upply th newflares launched from •'£««. Tn* " * hurricane seeding experimentsgenerators to the Weather B"reau ™r-?";„ TnIs made it possible toand to furnish aircraft to drop the f ares. Th s made Pdesign a more comprehensive and ^c''v*^™her on September 16S:ddi?9 ^atiTh1sWre;ortnwinedi;cussrrd:sign of the experimentand PresentVresuUs of these initial seeding efforts.
2. EXPERIMENT DESIGN
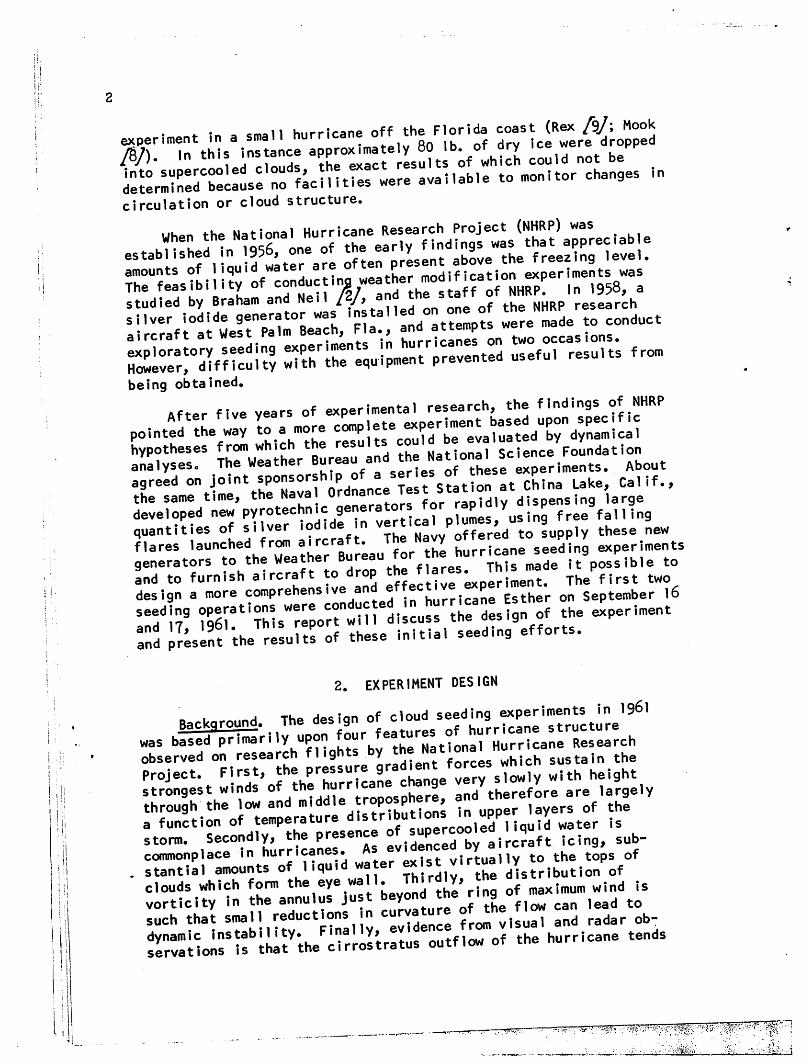
a tu* rioQian of cloud seeding experiments in 196l
»FS^BEsas tf^W'a function of temperature uidl. eil__rrftftie(i 1iau d water isstorm. Secondly, the presence * J^™*^, c?aft icing, sub-commonplace in hurr.canes. wf*v^"Virtually to the tops of. stantial amounts of 1iqu.d water ex ft v.rtu y ofclouds which form ^e eye wall. Thirdly, the ^ .$vorticity in the annulus just beyonthe^ °f can )ead t0such that smal reduct.cn. ncurvatu re "M*^, and radar obsrr^ilorrs^nat^the^rrrortratus outflow of the hurricane tends
to be fed primarily from a small convective chimney situated near theeye, usually in the right semicircle. In a few instances it has beenapparent that most of the mass transported by the lower inflow circulation has escaped upward to the outflow layer through a chimney nolarger than 10 by 20 miles (see fig. 1).
The efficiency of the hurricane heat engine is largely dependentupon the difference in temperature between the storm core and thestorm environment at the outflow level. And the storm intensity isrelated to the mass transport from the storm core to the environmentat this level. To the extent that the outflow is uniquely fed througha convective chimney near the eye, both the warmth of the upper stormcore and the mass transport of the storm must be related to the dynamical and thermodynamical properties of circulations in the chimney.This suggests the hypothesis that weather modification measures in thehurricane might possibly be confined to an area no larger than 200square miles, less than 1 percent of the surface area ordinarilyaffected by damaging winds0
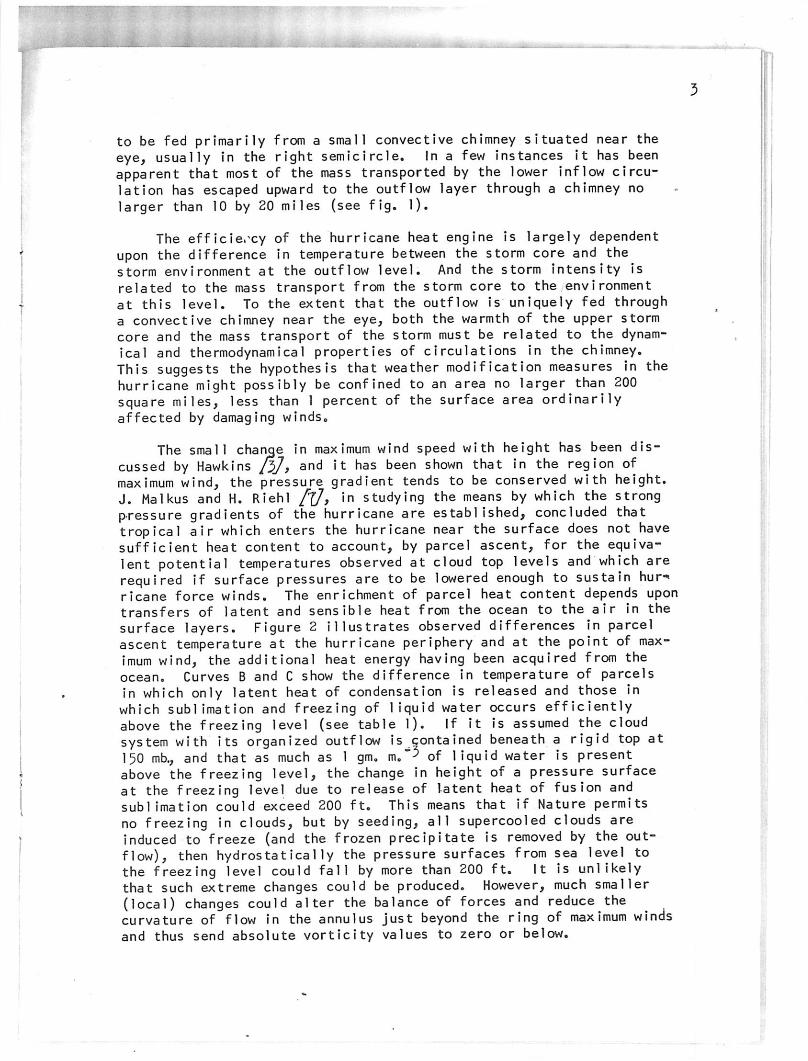
The small change in maximum wind speed with height has been discussed by Hawkins /%J, and it has been shown that in the region ofmaximum wind, the pressure gradient tends to be conserved with height.J. Malkus and H. Riehl fj], in studying the means by which the strongpressure gradients of the hurricane are established, concluded thattropical air which enters the hurricane near the surface does not havesufficient heat content to account, by parcel ascent, for the equivalent potential temperatures observed at cloud top levels and which arerequired if surface pressures are to be lowered enough to sustain hurricane force winds. The enrichment of parcel heat content depends upontransfers of latent and sensible heat from the ocean to the air in thesurface layers. Figure 2 illustrates observed differences in parcelascent temperature at the hurricane periphery and at the point of maximum wind, the additional heat energy having been acquired from theocean. Curves B and C show the difference in temperature of parcelsin which only latent heat of condensation is released and those inwhich sublimation and freezing of liquid water occurs efficientlyabove the freezing level (see table 1). If it is assumed the cloudsystem with its organized outflow is contained beneath a rigid top at150 mb., and that as much as 1gm. m. "* 0f liquid water is presentabove the freezing level, the change in height of a pressure surfaceat the freezing level due to release of latent heat of fusion andsublimation could exceed 200 ft. This means that if Nature permitsno freezing in clouds, but by seeding, all supercooled clouds areinduced to freeze (and the frozen precipitate is removed by the outflow), then hydrostatically the pressure surfaces from sea level tothe freezing level could fall by more than 200 ft. It is unlikelythat such extreme changes could be produced. However, much smaller(local) changes could alter the balance of forces and reduce thecurvature of flow in the annulus just beyond the ring of maximum windsand thus send absolute vorticity values to zero or below.

- •
RADAR
SPIRAL
RAINBANDS
rfffiflfl«W '5Sa5
HURRICANE MODEL
^^^^
LEFT SIDE RIGHT SIDE
[HI Primary Energy Cell ("Hot Towers") E23 Convective Clouds ESIAltostratus E23Cirrus
Figure 1. - The hurricane model. The primary energy cell (convectivechimney) is located in the area enclosed by the broken line.

PARCEL ASCENT OF SUBCLOUD AIR IN THE HURRICANE
-90 -30 °C -20
Figure 2. - Curve A illustrates the increase in equivalent potentialtemperature of air in the subcloud layer due to flux of latentand sensible heat from the ocean. Curves B and C also indicatethe difference in temperature of saturated rising parcels whichrelease latent heat of fusion and of those which do not.
Consider the wind profile in Esther, September 16 (fig. 3).The absolute vorticity may be written
£ f is.' " Sn (1)
where f is the Coriolis parameter, c the wind speed, n the distancenormal to the streamline, positive to the left, and R the radius ofstreamline curvature. If it is assumed for simplicity that nearthe ring of maximum winds R = r, the radial distance from the center,and that n lies along a radial then (1) may be rewritten
^ -f +̂ +Sa 5r R (2)
• mil I Hi

T-hl
eI
-Th
eco
ntrib
utio
nof
late
nthe
ats
ofsu
blim
atio
nan
dfu
sion
durin
gad
iaba
ticex
pans
ion
of^a
tlrat
edai
r.Th
eco
mputa
tions
show
theinc
reme
ntsin
parce
lme
antem
pera
ture
when
laten
the
atof
cond
ensa
tion
isau
gmen
tedby
heat
sof
subl
imat
ion
and
fusio
nIt
assu
mes
(1)co
ntin
uous
asce
ntof
undi
luted
sub-
cloud
air
from
thefre
ezin
glev
el(50
0mb
.)to
clou
^top
s
Bd
x:^
?$
Mir
^s.:
rS3S
,-i^
??i"
---r
-'Stin
,.flow
circulation.
Lay
er
(mb.
)
50
0-4
00
40
0-3
00
30
0-2
00
2Q
0-1
50
Tm(c
)(°
C.)
-5
-16
-35
-56
(Tm(
c)-Ta
)(°
C.)
4.0
10
.5
ll.o
11
.5
Ls/L
c
1.1
2
1.1
2
1.1
0
1.1
0
AT
su
bl.
(°C
.)
+0
.45
+1
.2
+1
.2
+1
.3
Liq
H90
-2
(gm
.cm
.)
0.1
6
0.2
0
0.2
6
0.1
5
ca
1.g
m.
-1
75 72
6o
60
A(6
z)
ATf
(°c.)
A(6
z)
(ft.
)(s
ub
l.+
F.)
o.T
+2
5
0.8
+56
0.9
+8
3
1.1
+5
5
Tot
alre
duct
ion
inhe
ight
ofpr
essu
resu
rfac
ebe
low
500
mb.
;21
9ft
._
__
__
T=
mea
nte
mpe
ratu
refo
rdr
yas
cent
ofpa
rcel
.t\
x=
mean
tempe
ratu
refo
rm
oist
asce
ntwi
thco
nden
satio
non
ly.
L/L
=ra
tioof
late
nthe
ats
ofsu
blim
atio
nan
dco
nden
satio
n.s
c
L_.
=la
tent
hea
to
ffu
sio
n.
f A(6
z)=
chan
gein
lay
erth
ick
nes
s.A
fin
crea
sein
laye
rme
ante
mpe
ratu
redu
eto
heat
ofsu
blim
atio
n.su
bl.
ATf=
increa
sein
layer
mean
tempe
rature
dueto
heat
offus
ion.
-(,-
ON

(KTS)
Figure 3. - Radial wind profiles in several hurricanes

8
In sector A, then, the absolute vorticity is approximately 0.8 x 10sec."1, which is two orders of magnitude larger than is characteristicfor extratropical cyclones. In sector B, however, the antIeyeIonicshear reduces the absolute vorticity to about 8.2 x 10 sec. . Itis in this sector that the hurricane may be susceptible to destabilizing influences. Only a small decrease in curvature of the streamline
hC C \may lead to negative absolute vorticities, that is (f -g- +£)<0.If, for given values of wind speed and wind shear, Rc is defined asthe critical radius of curvature at which | =j^ -fand ia= 0, thenthe ratIo h in Esther was 1.8; in Carla only 1.2. Hurricanes donot always have striated wind profiles such as those of figure 3.However, it is reasonable to suspect that such striat.ons may characterize certain stages in the development of most hurricanes. Inany event there are numerous evidences that circulat.on imbalancesand various kinds of instability tend to develop naturally in hurricanes.Small vortices, apparently of a parasitic nature, have been reported onmany occas ions' (Simpson and Starrett fltf), «d the ever changing cloudstructures of the eye reflect the frequent inject.on of cloud debrisfrom the lower troposphere, apparently borne by surges or unbalancedcirculations in the lower layers.
Objectives and procedures. The objectives of the 1961 experimentswere to use cloud seeding metnods in the chimney ^^"^^^esgenerating negative absolute vorticities and circulation nstablit es.?he hypothesized results were: (1) achange in radar reflectivity inthe seeded area, and (2) a reduction in maximum wind speeds for a shortperiod following the seeding. From the forego.ng d.scuss.on, the des.gnof the experiment drew upon the following line of reasoning, some ofwhich is necessarily heuristic. If one can identify a chimney area ina hurricane, it comprises the primary connection between the lowerinflow and the outflow layer. Temperature grad.ents in the outflowayer are closely related to surface pressure gradients The chimneyis also a region where deep layers of supercooled clouds are more therule than the exception. Mean vertical motions should range from5to 10 mps here. In much of this region £ is a^generally largenegative quantity of about the same magnitude as |, apositive quantity. By cloud seeding methods, the supercooled water in the chimneycan be induced to freeze, release heat of fusion, and permit sublimation to occur efficiently. If the ice crystals are swept up and awayin the outflow, and if the storm maintains a rigid top at, say, 150 mb.,the height of pressure surfaces below the freezing level should fall.
+

From this point one may reason further, heuristica1ly, that if the
seeding is concentrated in the region of negative— values (area
B, fig. 3), the net result should be to reduce the slope of pressure
surfaces near the point of maximum winds (as in fig. 4). This reduction
in pressure forces should provide a component of acceleration toward
higher pressure, reducing the cyclonic curvature of the streamline as
in figure 5, and thus lowering the value of — so that
-2000 -
10 20 30 40
RADIAL DISTANCE —
50 (MM.)
Figure 4. - Anticipated change in slope of pressure surfaces due to seeding.

The air moving horizontally through the instability area probablyrepresents the atmosphere's closest approximation to the ideal vortexupon which perturbation theory is based. Therefore, in the manner ofclassical dynamic instability, parcels should move outward acrosscontour fields, remaining immune to forces which would restore thebalance until the parcels moved beyond the region of instability. Itthe initial circulation imbalance is sufficiently large, the a,r w,11move outward toward higher pressure and upon reaching a region ofdynamic stability would begin an inertial oscillation about the eyeThe net effect of such a transport outward from the radius of max,mumwind is difficult to formulate or treat numerically. However, it snot unreasonable to hypothesize an increase in radius of maximum winds,and in conservation of absolute angular momentum, a reduction of max,mum wind speeds. This hypothesis can then be tested exper.mentally.
Navy pyrotechnic silveriodide generators of the kindshown in figure 6 were used inexperiments. It was planned todrop the generator canisters fromthe bomb bay of an A3D flyingabove 40,000 ft. The generators,falling freely through the chimney area, would then provide asuccession of vertical plumes ofsilver iodide extending througha cloud depth of more than 20,000ft. These were to be dropped at5-second intervals along a radialpath at the upstream edge of thechimney area. The vertical plumesof silver iodide would then beswept through the chimney area bythe storm circulation. Becauseof large mass transports upwardin the chimney area, it was expected that the seeding materialswould tend to be swept up and
away in the outflow layer before they could infect supercooled cloudsdownstream from the chimney.
The pyrotechnic generators (St. Amand and Henderson fuj) contained silver iodate with anitrasol binder. The compound burns atatemperature of 1700°C. and yields silver iodide crystals rangingfrom 05to I.Oil in size. Each canister contained approximately 9 b.°iWr o tLith acalculated yield of about 2 X10 5crystals.
?he 8canisters were to be distributed over a path 12 km. in length,centered 3 km. radially outward from the max.mum wind.
STEADY STATESTREAMLINE
STREAMLINE WITH WEAKENINOPRESSURE ORADIENT
Figure 5. - Decrease of streamlinecurvature with weakening pressuregradient. The shaded area is aregion of diminishing pressuregradient forces.
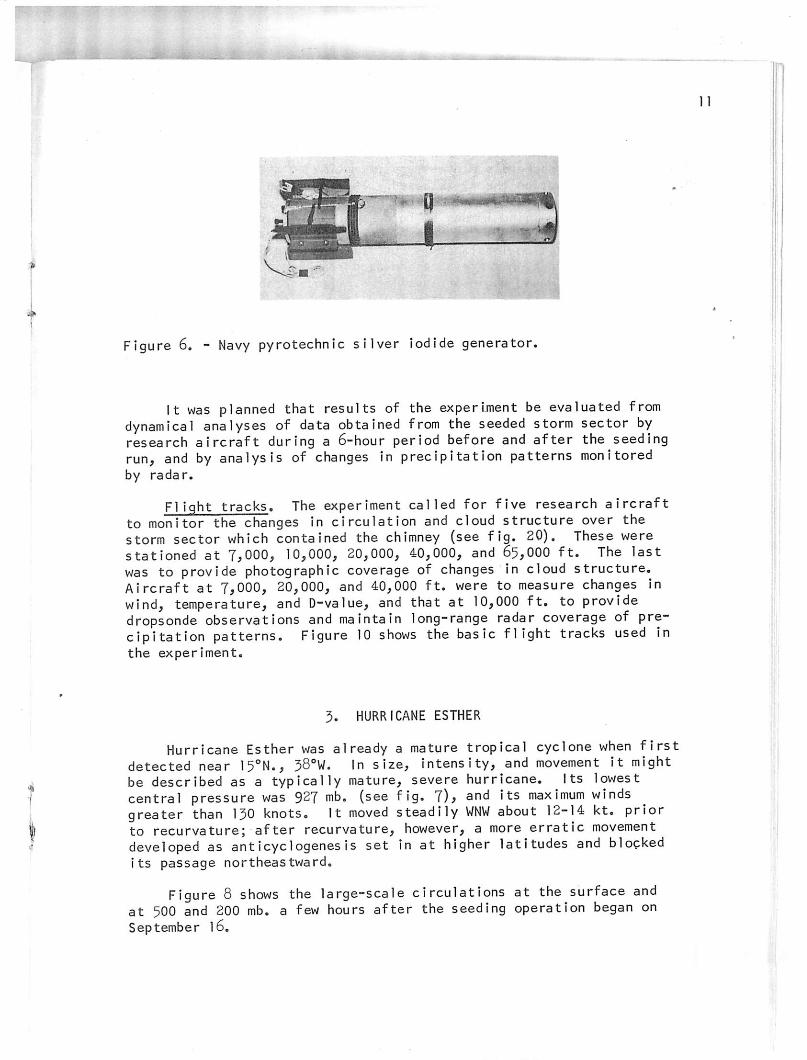
Figure 6. - Navy pyrotechnic silver iodide generator.
It was planned that results of the experiment be evaluated fromdynamical analyses of data obtained from the seeded storm sector byresearch aircraft during a 6-hour period before and after the seedingrun, and by analysis of changes in precipitation patterns monitoredby radar.
Flight tracks. The experiment called for five research aircraftto monitor the changes in circulation and cloud structure over thestorm sector which contained the chimney (see fig. 20). These werestationed at 7,000, 10,000, 20,000, 40,000, and 65,000 ft. The lastwas to provide photographic coverage of changes in cloud structure.Aircraft at 7,000, 20,000, and 40,000 ft. were to measure changes inwind, temperature, and D-value, and that at 10,000 ft. to providedropsonde observations and maintain long-range radar coverage of precipitation patterns. Figure 10 shows the basic flight tracks used inthe experiment.
3. HURRICANE ESTHER
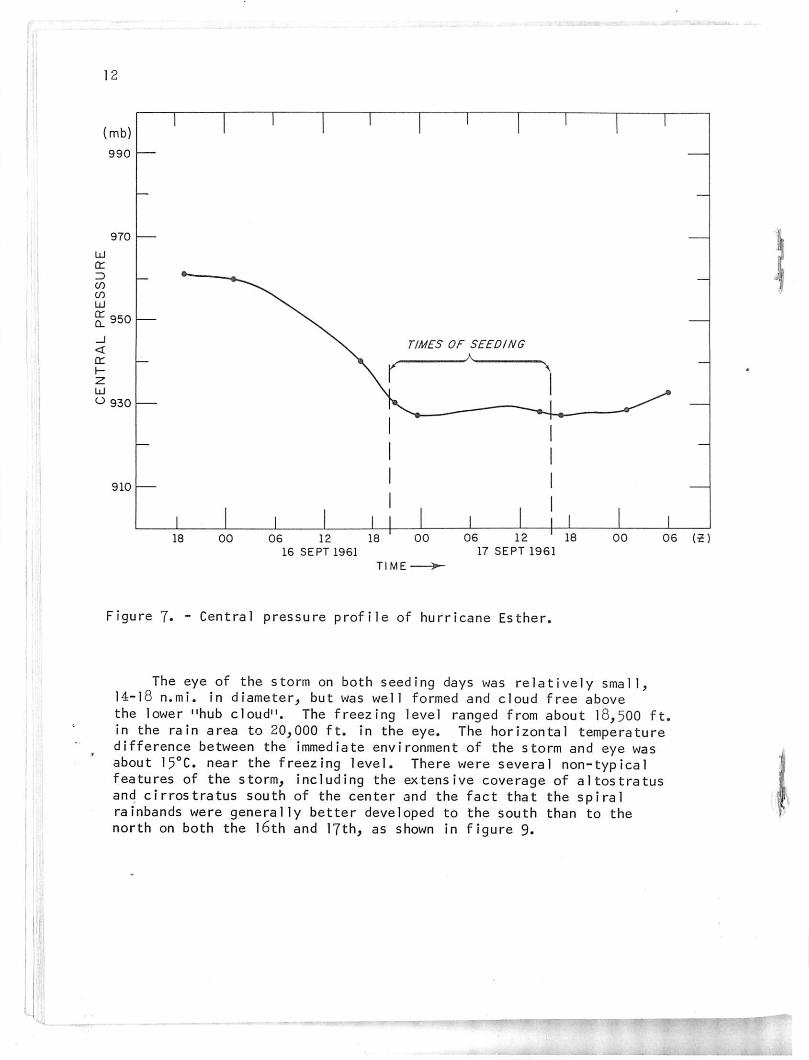
Hurricane Esther was already a mature tropical cyclone when firstdetected near 15°N., 38°W. In size, intensity, and movement it mightbe described as a typically mature, severe hurricane. Its lowestcentral pressure was 927 mb. (see fig. 7), and its maximum windsgreater than 130 knots. It moved steadily WNW about 12-14 kt. priorto recurvature; after recurvature, however, a more erratic movementdeveloped as anticyclogenesis set in at higher latitudes and blockedits passage northeastward.
Figure 8 shows the large-scale circulations at the surface andat 500 and 200 mb. a few hours after the seeding operation began onSeptember 16.
11
12
18 00 06 12 18 ' 00
16 SEPT 1961
TIME ;
06 12 18
17 SEPT 1961
Figure 7. - Central pressure profile of hurricane Esther.
.
00 06 (2)
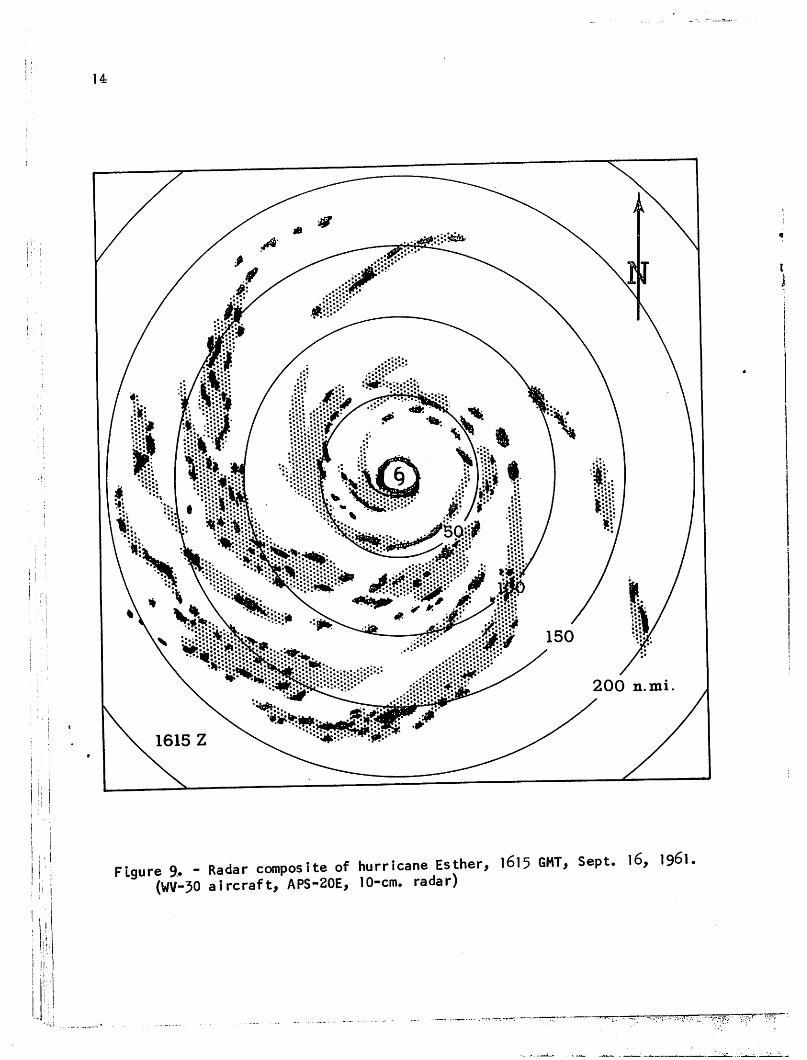
The eye of the storm on both seeding days was relatively small,14-18 n.mi. in diameter, but was well formed and cloud free abovethe lower "hub cloud". The freezing level ranged from about 18,500 ft.in the rain area to 20,000 ft. in the eye. The horizontal temperaturedifference between the immediate environment of the storm and eye wasabout 15°C. near the freezing level. There were several non-typicalfeatures of the storm, including the extensive coverage of altostratusand cirrostratus south of the center and the fact that the spiralrainbands were generally better developed to the south than to thenorth on both the 16th and 17th, as shown in figure 9.

200 MB
17 SEP 1961
1200 Z
\ 1 f \
\90
/\v\ 7 (T*
w * >*.
92 r^pXo
^_
88 \ V/VVj^V^^^^^r^
)<| 1 \.. 82 ' '
\ i iL186 J
88
f Ov / ) \
>w\\ Y % 1 ' r£^\\V\ / n / 95
• \ \J•\ V; \ 1500 MB
17 SEP 1961
I200Z^si' 94 / ---. • 94 / 1 \ 1 V^b)
1000 MB
17 SEP 1961
I200Z
Figure 8. - Surface and upper air conditions, 1200 GMT, Sept. 17, 196l
13
14
Figure 9. - Radar composite of hurricane Esther, l6l5 GMT, Sept. 16, 1961.(WV-30 aircraft, APS-20E, 10-cm. radar)
•••f*J?tfi,
4. THE SEEDING OPERATION
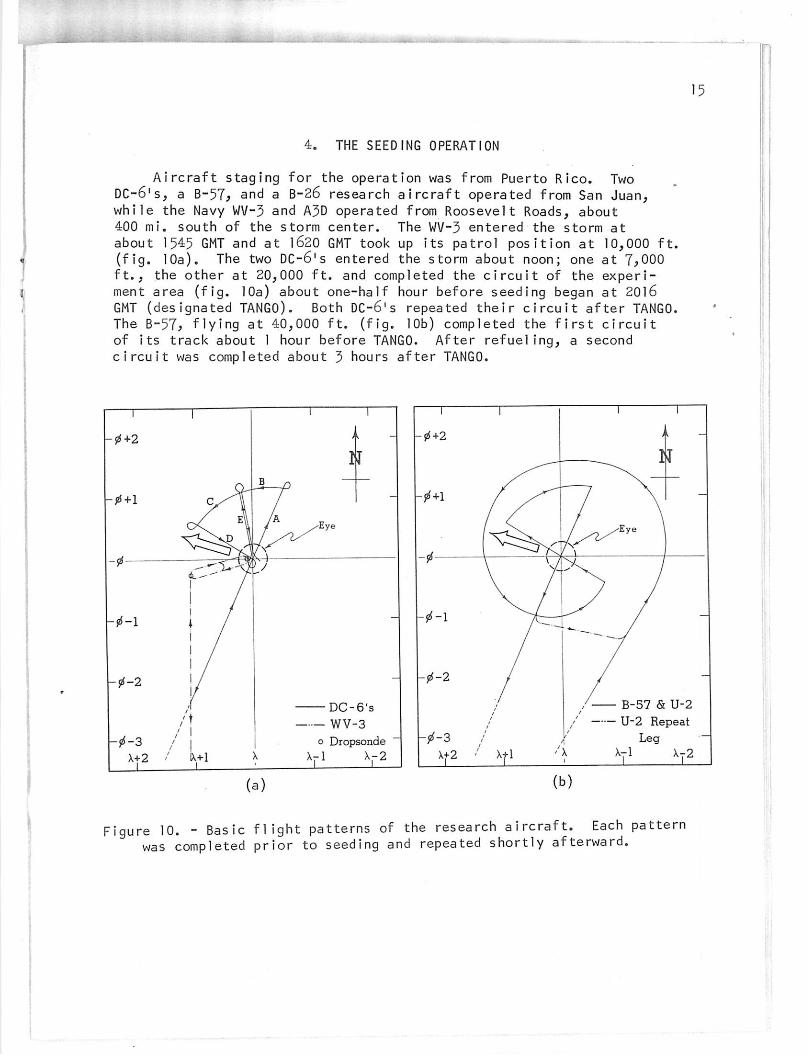
Aircraft staging for the operation was from Puerto Rico. TwoDC-6's, a B-57, and a B-26 research aircraft operated from San Juan,while the Navy WV-3 and A3D operated from Roosevelt Roads, about400 mi. south of the storm center. The WV-3 entered the storm atabout 1545 GMT and at 1620 GMT took up its patrol position at 10,000 ft,(fig. 10a). The two DC-6's entered the storm about noon; one at 7,000ft., the other at 20,000 ft. and completed the circuit of the experiment area (fig. 10a) about one-half hour before seeding began at 2016GMT (designated TANGO). Both DC-6's repeated their circuit after TANGO,The B-57, flying at 40,000 ft. (fig. 10b) completed the first circuitof its track about 1 hour before TANGO. After refueling, a secondcircuit was completed about 3 hours after TANGO.
-tf+2
-0+1
-0-1
jrf-2
X+2
15
Fiqure 10. - Basic flight patterns of the research aircraft. Each patterns completed prior to seeding and repeated shortly afterward.
wa
16
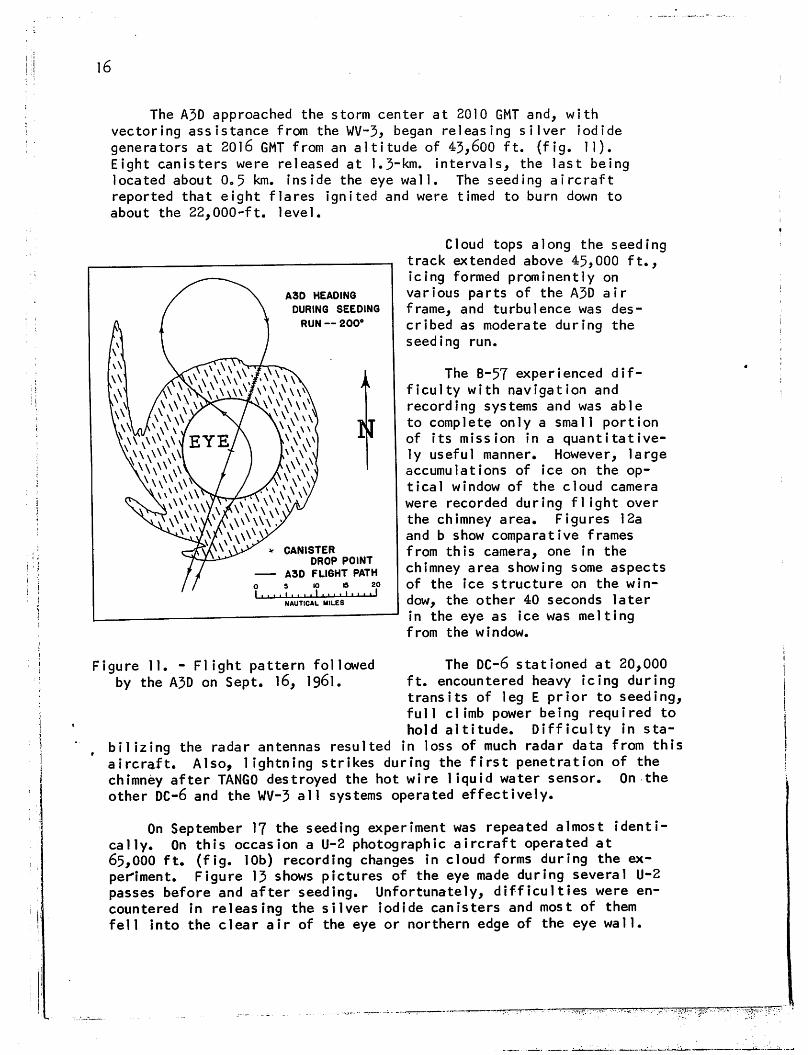
The A3D approached the storm center at 2010 GMT and, withvectoring assistance from the WV-3, began releasing silver iodidegenerators at 20l6 GMT from an altitude of 43,600 ft. (fig. 11).Eight canisters were released at 1.3-km. intervals, the last beinglocated about 0.5 km. inside the eye wall. The seeding aircraftreported that eight flares ignited and were timed to burn down toabout the 22,000-ft. level.
Cloud tops along the seedingtrack extended above 45,000 ft.,icing formed prominently onvarious parts of the A3D airframe, and turbulence was described as moderate during theseeding run.
A3D HEADING
DURING SEEDING
RUN — 200°
N
CANISTERDROP POINT
A3D FLIGHT PATH5 tO 6 20
• •..*•••• I • • • • I • • • i INAUTICAL MILES
Figure 11. - Flight pattern followedby the A3D on Sept. 16, I96I.
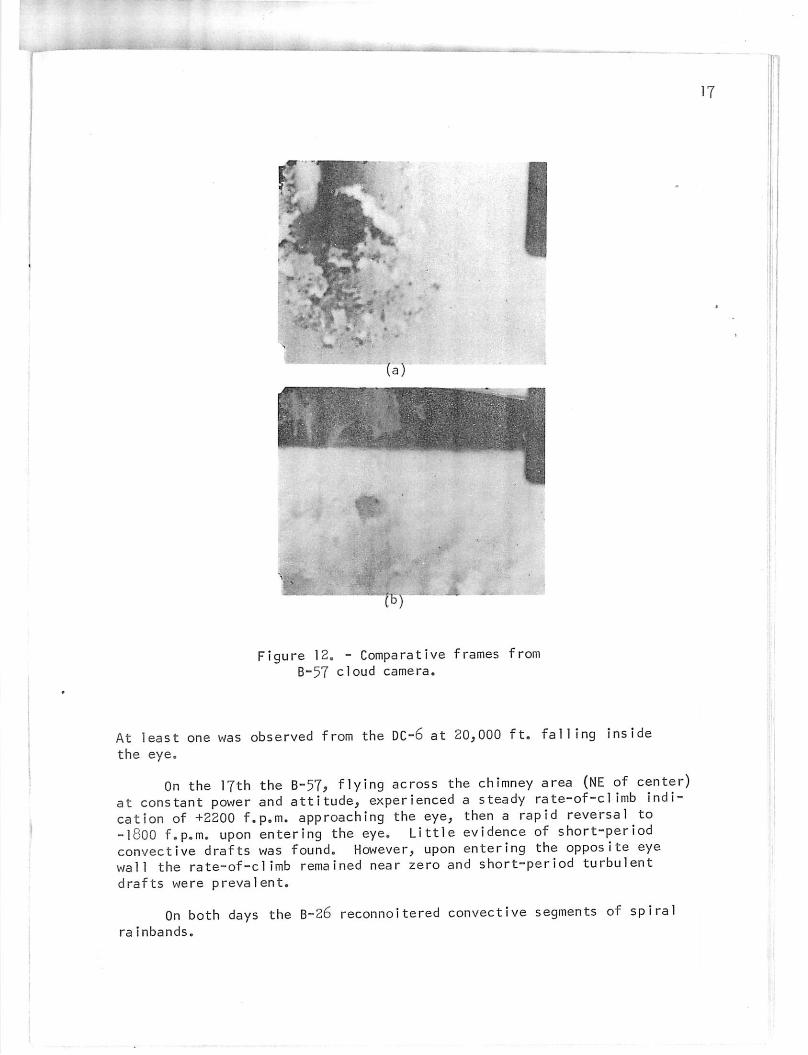
The B-57 experienced difficulty with navigation andrecording systems and was ableto complete only a small portionof its mission in a quantitatively useful manner. However, largeaccumulations of ice on the optical window of the cloud camera
were recorded during flight overthe chimney area. Figures 12aand b show comparative framesfrom this camera, one in thechimney area showing some aspectsof the ?ce structure on the win
dow, the other 40 seconds laterin the eye as ice was meltingfrom the window.
The DC-6 stationed at 20,000ft. encountered heavy icing duringtransits of leg E prior to seeding,full climb power being required tohold altitude. Difficulty in sta
bilizing the radar antennas resulted in loss of much radar data from thisaircraft. Also, lightning strikes during the first penetration of thechimney after TANGO destroyed the hot wire liquid water sensor. On theother DC-6 and the WV-3 all systems operated effectively.
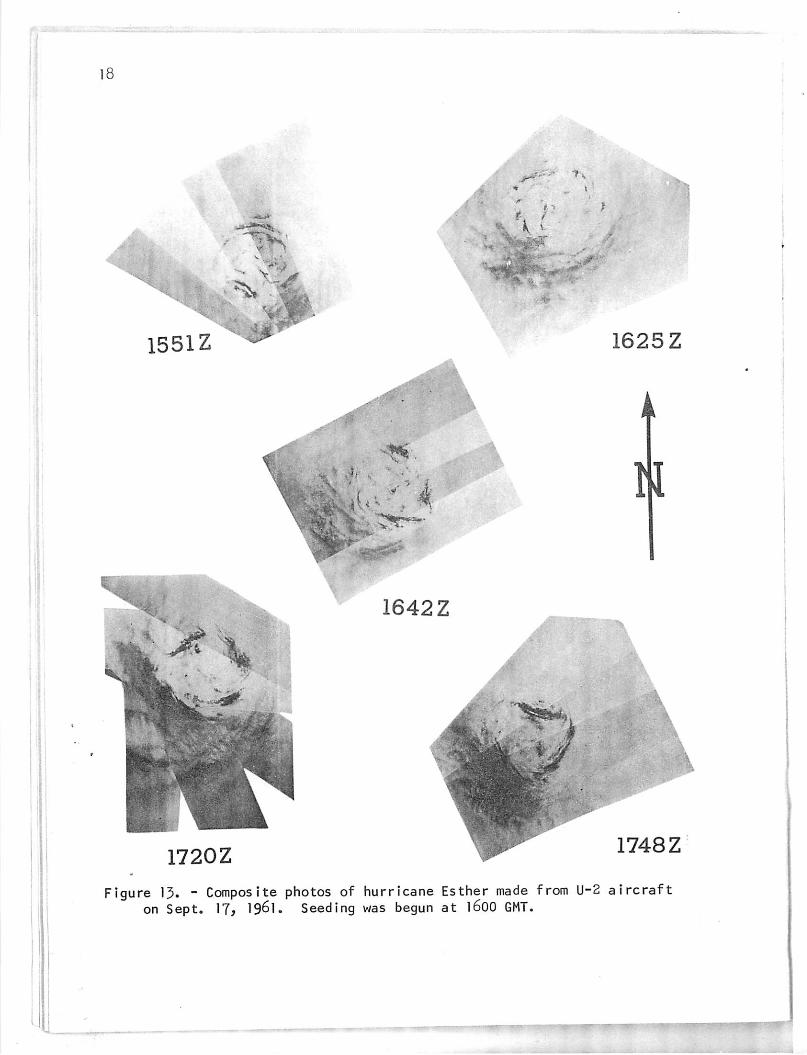
On September 17 the seeding experiment was repeated almost identically. On this occasion a U-2 photographic aircraft operated at65,000 ft. (fig. 10b) recording changes in cloud forms during the experiment. Figure 13 shows pictures of the eye made during several U-2passes before and after seeding. Unfortunately, difficulties were encountered in releasing the silver iodide canisters and most of themfell into the clear air of the eye or northern edge of the eye wall.
_.l
• _••
fb)
Figure 12„ - Comparative frames fromB-57 cloud camera.
At least one was observed from the DC-6 at 20,000 ft. falling insidethe eye.
On the 17th the B-57, flying across the chimney area (NE of center)at constant power and attitude, experienced a steady rate-of-cl imb indication of +2200 f.p.m. approaching the eye, then a rapid reversal to-1800 f.p.m. upon entering the eye. Little evidence of short-periodconvective drafts was found. However, upon entering the opposite eyewall the rate-of-climb remained near zero and short-period turbulentdrafts were prevalent.
On both days the B~26 reconnoitered convective segments of spiralra inbands.
17
n,
*\(-
^d.=%,X
1551Z 1625Z
N
1642 Z
1720Z1748 Z
Figure 13. - Composite photos of hurricane Esther made from U-2 aircrafton Sept. 17, 196l. Seeding was begun at 1600 GMT.

r
5. RESULTS OF THE SEPTEMBER 16 EXPERIMENT
As stated earlier, the experiment was designed to evaluateresults by dynamical analyses of data from the storm core andanalysis of changes in precipitation echoes observed by radar. Winddirection and speed was measured by an APN-82 doppler radar, D-valuesby an APR profile recorder. The DC-6's radars included an APS-20E(10 cm.), an RDR-1 (3 cm.), and a WP-101 (5.6 cm.). The WV-3 radarsincluded an APS-20E (10 cm.) and an APS-45 (3-cm. height finder).
Radar observations. The large scale distribution of precipitation in Esther on September l6 is shown in figure 9, a compositefrom the 10-cm. APS-20E. During the monitoring period no importantchanges occurred in the spiral rainband structure, or the distribution and intensity of precipitation except near the eye wall.
The RDR-1 radars on the DC-61s were mounted aft of the horizontal stabilizer with antenna rotation in the vertical plane.Figure 14 is a composite showing a vertical cross section of precipitation structure near the eye.
19
50,000 —
40,000—
30,000—
20,000—
10,000—
(ft)
—50,000
—40,000
—30,000
—20,000
—10,000
(ft;
Figure 14.Sept.
20 (n.mi.)South
- Cross section radar composite of hurricane Esther, 1945 GMT,16, 196l. (DC-6 aircraft, RDR-1, 3-cm. radar)
20
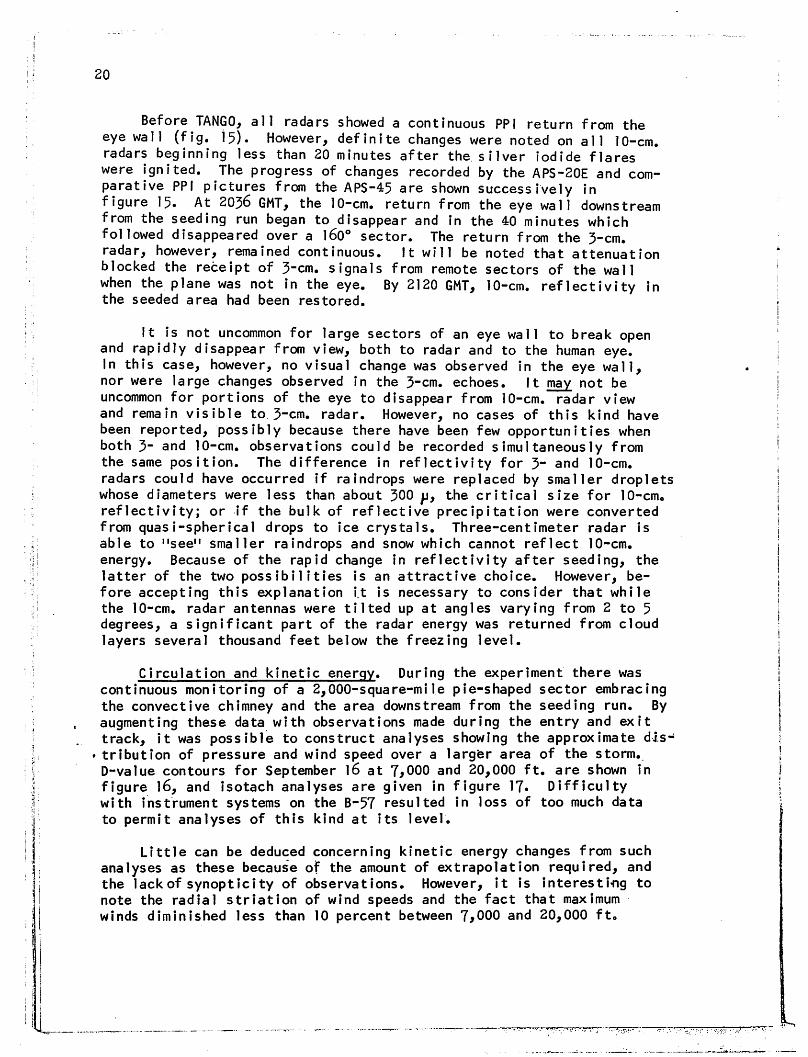
Before TANGO, all radars showed a continuous PPI return from theeye wall (fig. 15). However, definite changes were noted on all 10-cm.radars beginning less than 20 minutes after the silver iodide flareswere ignited. The progress of changes recorded by the APS-20E and comparative PPI pictures from the APS-45 are shown successively infigure 15. At 2036 GMT, the 10-cm. return from the eye wall downstreamfrom the seeding run began to disappear and in the 40 minutes whichfollowed disappeared over a l6o° sector. The return from the 3-cm.radar, however, remained continuous. It will be noted that attenuationblocked the receipt of 3~cm. signals from remote sectors of the wallwhen the plane was not in the eye. By 2120 GMT, 10-cm. reflectivity inthe seeded area had been restored.
It is not uncommon for large sectors of an eye wall to break openand rapidly disappear from view, both to radar and to the human eye.In this case, however, no visual change was observed in the eye wall,nor were large changes observed in the 3_cm. echoes. It may not beuncommon for portions of the eye to disappear from 10-cm. radar viewand remain visible to 3-cm. radar. However, no cases of this kind havebeen reported, possibly because there have been few opportunities whenboth 3~ and 10-cm. observations could be recorded simultaneously fromthe same position. The difference in reflectivity for 3~ and 10-cm.radars could have occurred if raindrops were replaced by smaller dropletswhose diameters were less than about 300 jj, the critical size for 10-cm,,reflectivity; or if the bulk of reflective precipitation were convertedfrom quasi-spherical drops to ice crystals. Three-centimeter radar isable to "see" smaller raindrops and snow which cannot reflect 10-cm.energy. Because of the rapid change in reflectivity after seeding, thelatter of the two possibilities is an attractive choice. However, before accepting this explanation it is necessary to consider that whilethe 10-cm. radar antennas were tilted up at angles varying from 2 to 5degrees, a significant part of the radar energy was returned from cloudlayers several thousand feet below the freezing level.
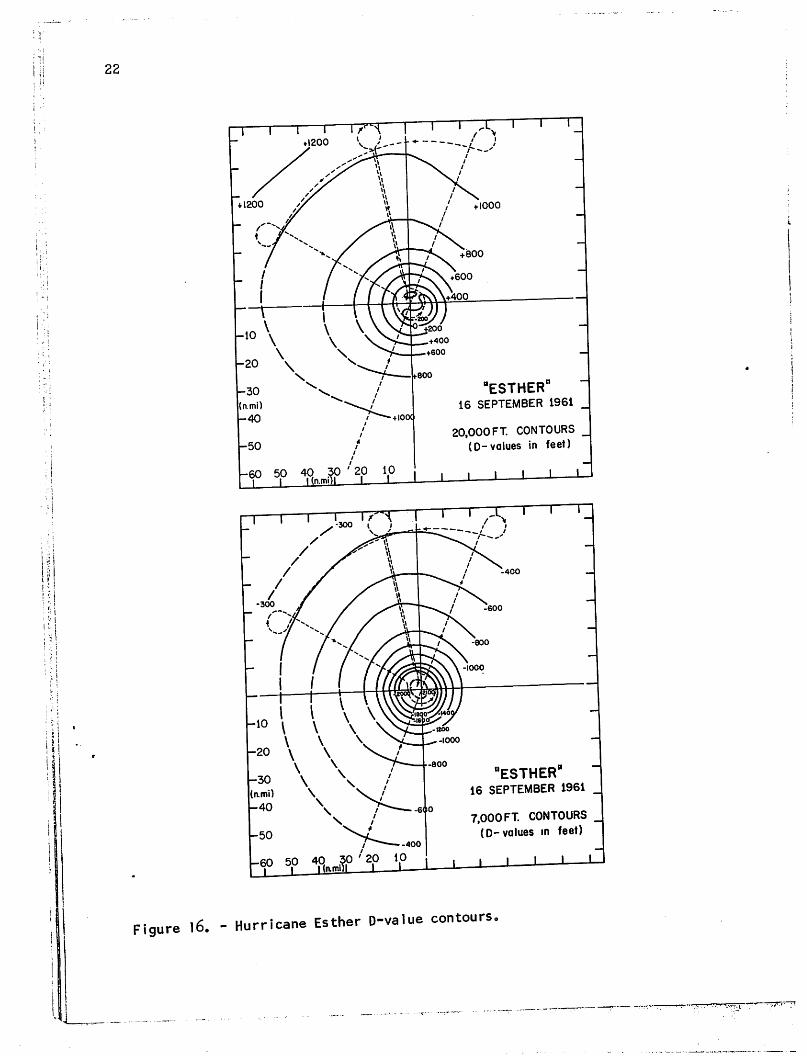
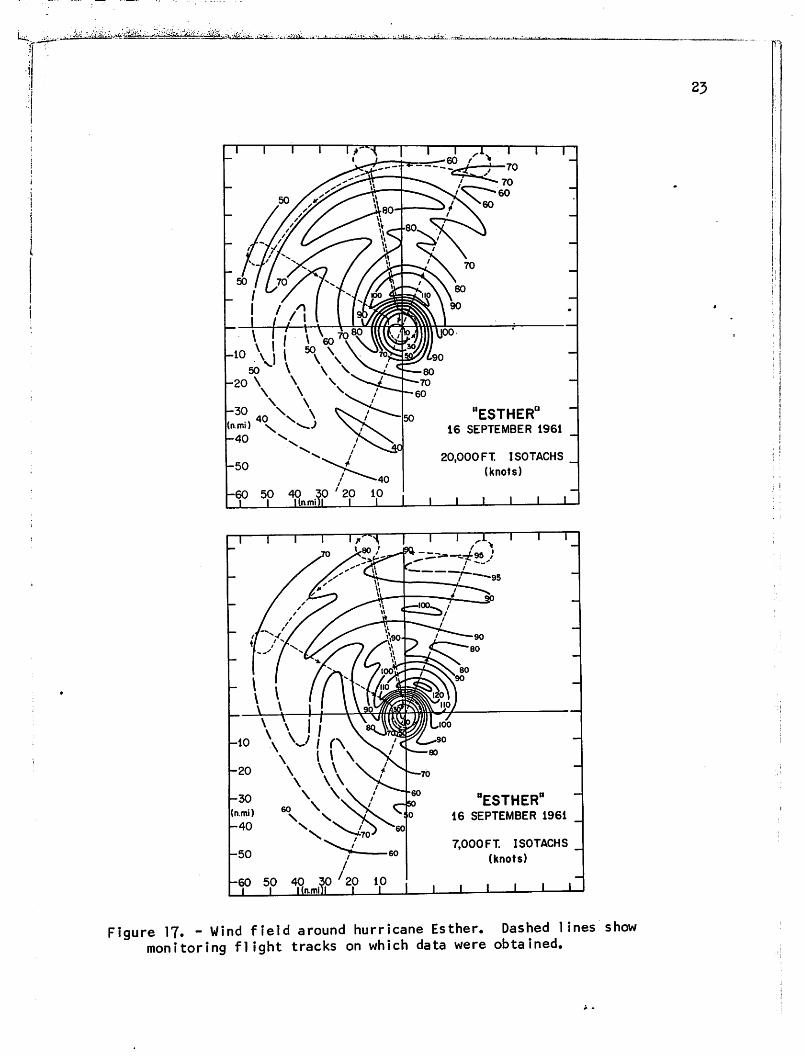
Circulation and kinetic energy. During the experiment there wascontinuous monitoring of a 2,000-square-mile pie-shaped sector embracingthe convective chimney and the area downstream from the seeding run. Byaugmenting these data with observations made during the entry and exittrack, it was possible to construct analyses showing the approximate distribution of pressure and wind speed over a larger area of the storm.D-value contours for September l6 at 7*000 and 20,000 ft. are shown infigure 16, and isotach analyses are given in figure 17. Difficultywith instrument systems on the B-57 resulted in loss of too much datato permit analyses of this kind at its level.
Little can be deduced concerning kinetic energy changes from suchanalyses as these because of the amount of extrapolation required, andthe lack of synoptic ity of observations. However, it is interesti-ng tonote the radial striation of wind speeds and the fact that maximumwinds diminished less than 10 percent between 7*000 and 20,000 ft.
t,

APS-20(10 cm)
APS-45(3 cm)
APS-20(10 cm)
APS-45(3 cm)
21
Figure 15. - Series of concurrent radar pictures from 10-cm. and 3-cm.radars before and after seeding on Sept. l6, 196l.
22
!••:
"ESTHER16 SEPTEMBER 1961 _
20,000FT. CONTOURS _(D-values in feet)
n —
-s° 5,° 4mp:2i0 y i • • i i i '"
-60 50 40 30 ' 20 10y | I(amrtl I L.
Figure 16. - Hurricane Esther D-value contours.
kc. "¥;^i ^^M&s^sMM^s^ atiai-'iUWMfr.--..
-60 50 40 30 ' 20 101 I finml)! I '
h-50
y
i-60 50 40 30 ' 20 10
I (itmi)l
:, -.itiiij -^.-:. ••••«•>••.
1 T
r . T i l
-
"ESTHER"16 SEPTEMBER 1961 _
7,000FT. ISOTACHS _(knots)
i i I I r
Figure 17. - Wind field around hurricane Esther. Dashed lines showmonitoring flight tracks on which data were obtained.
23

24
(ft.)
+1000 —
+ 800 —
+ 600
D-value
+ 400
+200 —
0 —
-200 —
although the total kinetic energy ofthe storm apparently diminished withheight by more than 30 percent. Theonly notable difference in geometryor character of circulation beforeand after seeding was that isotachmaxima, in the manner reported byBlumen and LaSeur f\J', tended tomove cyclonically with the wind, except those near the eye wall whichtended to maintain their azimuth relative to the storm track.
Sufficient information was a-vailable from the monitored sectorto examine changes in the pressuresurfaces and to obtain quantitativeestimates of variations in kineticenergy. The mean D-value profiles(fig. 18) show the decrease in heightand slope of the pressure surfacesfor both the 7,000 and 20,000 ft.--
levels. In figure 19, 3 va,ues havebeen averaged for legs A, D, and E ofthe experimental sector for periodsbefore and after TANGO, and for both7,000 and 20,000-ft. levels. Fromthese mean profiles it would appearthere was little change in totalkinetic energy in this area. However, near the eye, the kineticenergy dropped by 14 percent at20,000 ft. and 5 percent at 7,000 ft.,while compensating increases occurredat greater radial distances. Themean maximum wind was located at aslightly greater distance from theeye after seeding. The maximum windspeeds recorded in the experimentalsector were 9 percent lower at 7,000ft. and 14 percent lower at 20,000 ft.after seeding. The small increase inradius of maximum wind in the testarea suggests that any change inmaximum wind speeds may have been duesolely to changes in pressure gradientor other transient instabilities incirculation. However, in the absence
1 1 1 1 1 1 1 1 > 1 i 1 i 1
— y^^— . S1^ 20,000 FT. —
/7 —
/// / -
/ /— / /
//// _
//— // —
_
1finfnrn TAMHA
After TANGO
iiii
Ji~yi—S —
".i.i.i. i10 20 30 40 50 60 70 frtmi.)
r •*
(ft)
-400
-600 —
-800
-1000
D-volue
-1200
-1400
-1600
-1800 —
-2000
I I I I ' I ' I ' I ' 1 ' J
Before TANGO —
70 (n.mt)
Figure 18. - Mean D-value profilesfor hurricane Esther, Sept. 16,1961, showing change in heightand slope of pressure surfaces
- after seeding.

u*s.itfcfeil^i^y {'^ftjn„^
• ' I I I I I ' I ' I '
0 10
7.000 FT
Before TANGO
After TANGO
I I I ' ' ' ' ' '20 30 40 50 60
r **
70 (ami)
Figure 19. - Mean kinetic energy profiles in hurricane Esther,Sept. 16, 1961.
25
26
of adequate information from other sections of the storm, conclusionscannot be rel iably reached. Most of the observed trends must beregarded as approximations which are rather severely limited due toprobable errors in measurement and of analysis. However, the trendsin the test area conform with results predicted by the hypotheses,and with the acquisition of three or more test cases, a more objectiveinterpretation can be made, and perhaps some useful conclusion can bedrawn from such observed trends.
Changes which occurred in the experimental sector after seedingwere reflected in the kinetic energy of circulation expressed by
A*K = A T i£
g
(3)
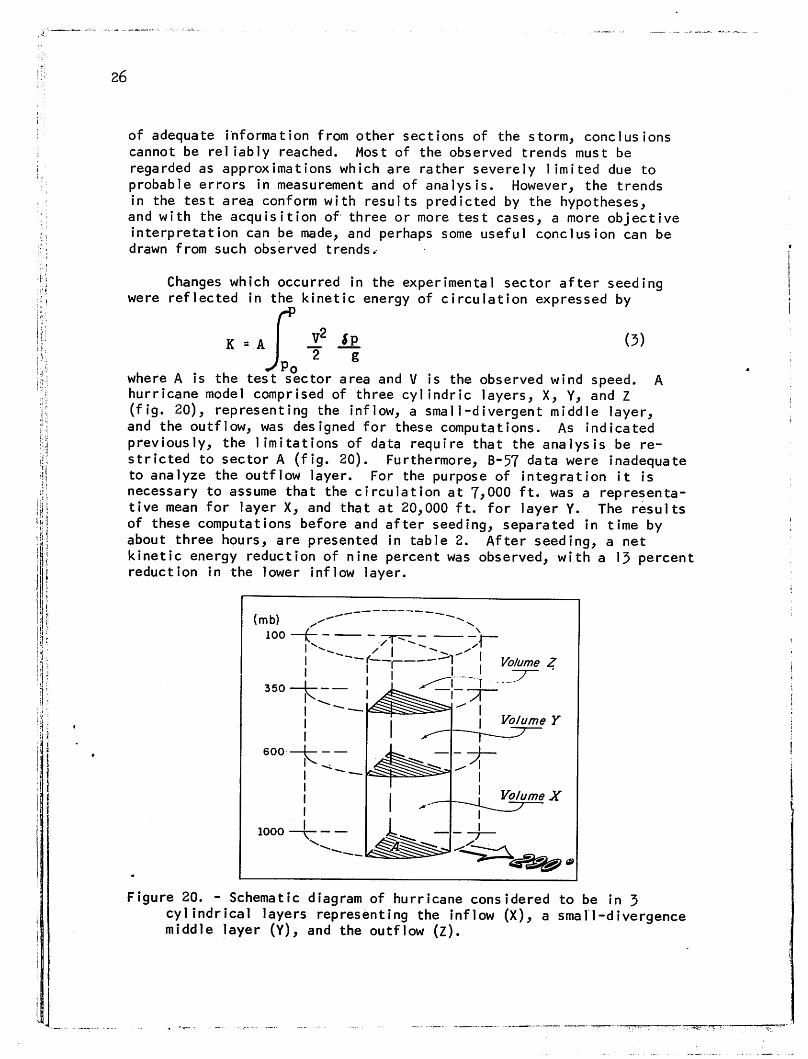
Jwhere A is the test sector area and V is the observed wind speed. Ahurricane model comprised of three cylindric layers, X, Y, and Z(fig. 20), representing the inflow, a smal1-divergent middle layer,and the outflow, was designed for these computations. As indicatedpreviously, the limitations of data require that the analysis be restricted to sector A (fig. 20). Furthermore, B-57 data were inadequateto analyze the outflow layer. For the purpose of integration it isnecessary to assume that the circulation at 7,000 ft. was a representative mean for layer X, and that at 20,000 ft. for layer Y. The resultsof these computations before and after seeding, separated in time byabout three hours, are presented in table 2. After seeding, a netkinetic energy reduction of nine percent was observed, with a 13 percentreduction in the lower inflow layer.
(mb)
loo —t
350 t—
600 t
1000
Figure 20. - Schematic diagram of hurricane considered to be in 3cylindrical layers representing the inflow (X), a smal1-divergencemiddle layer (Y), and the outflow (z).

Table 2. - Kinetic energy of circulation in the experimental sector13before and after seeding (10 kj.), Sept. 16, 196l.
Layer Before After $ Change
Y 1.38 1.38 0
X 2.74 2.38 -13
X+Y 4.12 3.76 -9
27
Changes in the production of kinetic energy due to pressure forceson the tangential and radial components of motion were computed forthe 3-hour period which straddled the time of seeding. For volumes Xand Y the changes were in the direction predicted by the hypothesis.However, the magnitude was comparable to changes which have appearedto occur over short intervals in some sectors of unseeded storms.
None of the analyses or computations which have been attemptedhave provided unassailable evidence for experimental conclusions.However, aggregation of evidence tends to support certain tentativeconclusions. These are:
(1) a large amount of supercooled liquid water was converted to ice,(2) the release of latent heat from (1) may have led to circulation
imbalances or instabilities,(3) the total kinetic energy over the test area was reduced and the
maximum wind speeds diminished.
There is no experience from which one can estimate the probabilitythat all these changes could have come from natural causes. In previoushurricane research flights, the flight plans have been designed tocollect data along a clover-leaf track at several different levelsrather than to measure changes with time. Therefore, the best (andperhaps only) means of assessing the validity of the hypotheses andreaching final conclusions concerning experimental results is throughthe repeatability of these results in succeeding experiments.

28
6. RESULTS OF THE SEPTEMBER 17 EXPERIMENT
As indicated earlier, the silver iodide canisters were not droppedaccording to plan on September 17. Apparently all the silver iodidewas released in sector A (fig. 3) or in the clear air of the eye. Ifreleased in Sector A, the effect, if any, should have been to steepenthe slope of pressure surfaces in the eye wall. If released in the eye,entrainment of silver iodide into the eye wall would have tended toproceed slowly, as borne out by the trajectory of constant pressureballoons released in the eye during earlier experiments, balloons whichremained in the eye for more than 24 hours. In either event the seedingshould not have led to circulation instabilities of the kind which thisexperiment sought to investigate. The results, analyzed in the samemanner as those of the l6th, follow.
Neither 3-cm. nor 10-cm. radar showed any significant change inprecipitation patterns or form. Figure 21 compares the 10-cm. radarreturn just before TANGO with that one hour after TANGO.
555 GMT
A
ir
Figure 21. - Radar return just before seeding of hurricane Esther onSept. 17, 196l, and 1 hour after seeding. (APS-20,10-cm. radar)
" The composite photographs of the eye on September 17 as viewed froma U-2 aircraft from about 65,000 ft. (fig. 13) indicate the conservativecharacter of the eye and eye wall during the period before and after theseed ing.
7. SUMMARY AND CONCLUSIONS
The initial experiments have provided interesting but by nomeans conclusive results. The change in reflectivity of 10-cm.radar energy is difficult to explain unless it was due to the rapidtransformation of supercooled liquid water to ice. However, aportion of the radar energy was reflected from the clouds below thefreezing level where such a transformation could not have occurred.
On the 16th there was evidence that kinetic energy may havebeen diffused outward after the seeding, and maximum winds reducedby about 10 percent for a 2-hour period. These changes could haveoccurred from natural fluctuations in structure and intensity ofthe hurricane. However, after several additional experiments itshould be possible to determine whether the results from the experiment of September 16 are repeatable and the tentative conclusionsjustified. If so, it should be feasible to extend the scope of theexperiment to determine whether destructive winds in the hurricanecan be reduced progressively by successive injections of silveriodide.
ACKNOWLEDGMENTS
The seeding experiment in hurricane Esther was a joint effortof the National Hurricane Research Project and the U. S. Navy, andwas funded in part by the National Science Foundation. Photographicsupport for the U-2 aircraft was furnished by the Air Force CambridgeResearch Center. Professor C. L. Jordan participated in the fieldexperiment, directed the radar data collection program on the WV-3aircraft, and analyzed dropsonde data obtained during the experiment.The authors are also indebted to the staff of the NHRP for assistancein processing of data and for some of the analyses, and to the Navyand the Air Force for photographic materials and information on flightdata during the operation.
29

30
REFERENCES
1. W. Blumen and N. E. LaSeur, "Some Details of the Wind Field inIndividual Hurricanes", Scientific Report No. 7, Contract Nos.AF19(604)-753 (GRD) and Cwb-9121 (USWB), Florida State University,July 1958.
2. R. R. Braham, Jr. and E. A. Neil, "Modification of HurricanesThrough Cloud Seeding", National Hurricane Research Project ReportNo. 16, May 1958, 12 pp.
3. H. F. Hawkins, "Vertical Wind Profiles in Hurricanes'.', NationalHurricane Research Project Report No. 55, June I962, 16 pp.
4. I.Langmuir, "The Growth of Particles in Smokes and Clouds and theProduction of Snow from Supercooled Clouds", Proceedings of theAmerican Philosophical Society, vol. 92, No. 3, 1948, pp. I67-I85.
5. I. Langmuir, "Control of Precipitation from Cumulus Clouds by VariousSeeding Techniques", Science, vol. 112, No. 2898, July 14, 1950,pp. 35-41.
6. M. Lopez and Wallace Howell, "The Campaign Against Windstorms in theBanana Plantations Near Santa Marta, Colombia, 1956-57", Bui let in ofthe American Meteorological Society, vol. 42, No. 4, April 1961,pp. 265-276.
7. J. S. Malkus and H. Riehl, "On the Dynamics and Energy Transformationsin Steady-State Hurricanes", Tellus, vol. 12, No. 1, Feb. i960, pp. 1-20.
8. C. P. Mook, E. W. Hoover, and R. A. Hoover, "Analysis of the Movementof the Hurricane Off the East Coast of the United States, October 12-14, 1947", Monthly Weather Review, vol. 85, No. 7, July 1957,pp. 243-248.
9. Daniel F. Rex, quoted on pp. 144-145 of Final Report, Project Cirrus,Part I. Laboratory, Field, and Flight Experiments, prepared byVincent J. Shaefer, General Electric Research Laboratory, Schenectady,N. Y., March 1953, 170 pp.
10. R. H. Simpson and L. G. Starrett, "Further Studies of HurricaneStructure by Aircraft Reconnaissance", Bulletin of the AmericanMeteorological Society, vol. 36, No. 9, Nov. 1955, pp. 459-468.
11. Pierre St. Amand and G. W. Henderson, Project Cyclops, an Experimentin Hurricane Modification, U. S. Naval Ordnance Test Station, Chinalake, Calif., 1962.
USCOMM-WB-DC