Riverstone Credit Opportunities Income Initiation of coverage
15
NOT INTENDED FOR PERSONS IN THE EEA 11 March 2021 Riverstone Credit Opportunities Income (RCOI) is a closed-end fund that invests in mid-market energy company credit mostly via direct loans. Broadly across the sector, the lending includes infrastructure and infrastructure services across conventional and recently renewable energy sources. Energy lending is a specialist niche and RCOI benefits from being part of Riverstone, a leading energy-focused US investment company that has raised $41bn in capital since 2000. The average RCOI loan YTM is 12.5% and despite the pandemic and low oil prices, there have been no portfolio losses. The NAV has been resilient (12% total return since IPO in May 2019), but energy sector and oil price concerns, coupled with low share liquidity, have led to a 20% NAV discount and a dividend of 8.3%. US leveraged loans recovery – distressed percentage of total loans Source: S&P Global Market Intelligence Why invest in energy direct loans now? The energy credit market has rebounded driven by the COVID-19 vaccine. RCOI’s share price has also risen, but it trades at a large NAV discount with a high covered dividend yield. It still has significant cash (currently c 20% of NAV) to deploy, which should boost dividends, and has been buying back shares at a steep discount. Oil price exposure is mitigated by diversification, low LTVs on real assets and the relatively short-term nature of the loans, which are often partially or fully repaid early. The analyst’s view Middle market energy companies are typically too small to issue liquid bonds, banks have been retreating, while most non-bank direct lenders do not have the required resources and sector knowledge for the extremely technical credit analysis. However, the sector has significant capital needs and recovery rates are often higher due to being asset based. This allows for attractive risk-adjusted returns. The Riverstone connection allows RCOI access to expertise, business relationships and a deal pipeline. No base management fee helps aligns interests with shareholders. Significant US energy infrastructure spending is expected in coming years, especially in renewables helped by government stimulus plans. Valuation: Dividend 8.3%, NAV discount 20% The shares are trading at a 20% discount to NAV with a trailing dividend yield of 8.3%. RCOI has a policy of distributing all income after expenses and taxes. 0 20 40 60 80 100 Cosmetics Oil & gas Non-fer metals Air transp. Broad. & tv Leisure Bev & tob Health care Auto Home furn. Utilities % of all loans 2020 peak 30 Sept 2020 Riverstone Credit Opportunities Income Initiation of coverage Niche energy infrastructure lending Price $0.84 Market cap $77.1m NAV* $95.5m €1.10/£ NAV per share* US$1.043 *As at 31 December 2020 Discount to NAV 20% Annualised current yield 8.3% Ordinary shares in issue 91.5m Free float 81.1% Code RCOI Primary exchange LSE Special. Fund Segment AIC sector Sector Specialist: Debt Gearing Net cash % NAV Feb.2020 c 20% Fund objective Riverstone Credit Opportunities Income’s (RCOI’s) objective is to generate stable current income and growth of net asset value by investing in a diversified portfolio of senior secured loans to mid- market energy infrastructure and infrastructure service focused companies across conventional and low carbon/renewable energy sources. There is a focus on US companies, but RCOI invests across end markets to provide synergies and hedges to enhance portfolio stability. Bull points Lending niche with barriers to entry allows for favourable pricing. RCOI has had no credit losses so far. Significant re-rating potential given wide discount. Bear points The energy market is highly cyclical and economic uncertainty remains elevated. There is still a high level of distressed loans in the energy sector in general. RCOI loans to projects that are pre-revenue can conceivably have higher risk. Relatively short fund trading history, although the manager has other similar (but private) energy funds since 2015 inception. Analyst Pedro Fonseca +44 (0)20 3077 5700 [email protected] Edison profile page Investment companies Riverstone Credit Opportunities Income is a research client of Edison Investment Research Limited
Transcript of Riverstone Credit Opportunities Income Initiation of coverage

NOT INTENDED FOR PERSONS IN THE EEA
11 March 2021 Riverstone Credit Opportunities Income (RCOI) is a closed-end fund that invests in mid-market energy company credit mostly via direct loans. Broadly across the sector, the lending includes infrastructure and infrastructure services across conventional and recently renewable energy sources. Energy lending is a specialist niche and RCOI benefits from being part of Riverstone, a leading energy-focused US investment company that has raised $41bn in capital since 2000. The average RCOI loan YTM is 12.5% and despite the pandemic and low oil prices, there have been no portfolio losses. The NAV has been resilient (12% total return since IPO in May 2019), but energy sector and oil price concerns, coupled with low share liquidity, have led to a 20% NAV discount and a dividend of 8.3%.
US leveraged loans recovery – distressed percentage of total loans
Source: S&P Global Market Intelligence
Why invest in energy direct loans now? The energy credit market has rebounded driven by the COVID-19 vaccine. RCOI’s share price has also risen, but it trades at a large NAV discount with a high covered dividend yield. It still has significant cash (currently c 20% of NAV) to deploy, which should boost dividends, and has been buying back shares at a steep discount. Oil price exposure is mitigated by diversification, low LTVs on real assets and the relatively short-term nature of the loans, which are often partially or fully repaid early.
The analyst’s view Middle market energy companies are typically too small to issue liquid bonds, banks have been retreating, while most non-bank direct lenders do not have the required resources and sector knowledge for the extremely technical credit analysis. However, the sector has significant capital needs and recovery rates are often higher due to being asset based. This allows for attractive risk-adjusted returns. The Riverstone connection allows RCOI access to expertise, business relationships and a deal pipeline. No base management fee helps aligns interests with shareholders. Significant US energy infrastructure spending is expected in coming years, especially in renewables helped by government stimulus plans.
Valuation: Dividend 8.3%, NAV discount 20% The shares are trading at a 20% discount to NAV with a trailing dividend yield of 8.3%. RCOI has a policy of distributing all income after expenses and taxes.
020406080
100
Cosmetics Oil& gas
Non-fermetals
Airtransp.
Broad.& tv
Leisure Bev& tob
Health care
Auto Homefurn.
Utilities
% of
all lo
ans
2020 peak 30 Sept 2020
Riverstone Credit Opportunities Income Initiation of coverage
Niche energy infrastructure lending
Price $0.84 Market cap $77.1m NAV* $95.5m
€1.10/£ NAV per share* US$1.043
*As at 31 December 2020
Discount to NAV 20%
Annualised current yield 8.3%
Ordinary shares in issue 91.5m
Free float 81.1%
Code RCOI
Primary exchange LSE Special. Fund Segment
AIC sector Sector Specialist: Debt
Gearing
Net cash % NAV Feb.2020 c 20%
Fund objective
Riverstone Credit Opportunities Income’s (RCOI’s) objective is to generate stable current income and growth of net asset value by investing in a diversified portfolio of senior secured loans to mid-market energy infrastructure and infrastructure service focused companies across conventional and low carbon/renewable energy sources. There is a focus on US companies, but RCOI invests across end markets to provide synergies and hedges to enhance portfolio stability.
Bull points Lending niche with barriers to entry allows for
favourable pricing. RCOI has had no credit losses so far. Significant re-rating potential given wide
discount. Bear points The energy market is highly cyclical and
economic uncertainty remains elevated. There is still a high level of distressed loans in the energy sector in general.
RCOI loans to projects that are pre-revenue can conceivably have higher risk.
Relatively short fund trading history, although the manager has other similar (but private) energy funds since 2015 inception.
Analyst Pedro Fonseca +44 (0)20 3077 5700
Edison profile page
Investment companies
Riverstone Credit Opportunities Income is a research client of Edison Investment Research Limited
Riverstone Credit Opportunities Income | 11 March 2021 2
A niche energy lending opportunity
The energy sector is a capital-intensive business and the sector is a significant borrower of capital. Capital expenditure in the US energy sector is estimated at around US$500–600bn (according to McKinsey). The sector’s capital demand and consumption has remained high despite the volatility in commodity prices. For example, although commodity prices fell 59% between 2014 and 2015, the energy sector remained one of the biggest sectors in terms of capital expenditure in 2015 and 2016.
Energy lending particularly requires sector expertise because lenders need to understand the various specifics of the industry including commodity risk and investment project lifecycles. The lending is asset-based as opposed to being based on short- and medium-term cash flows. At the same time, the borrowing characteristics and established lender protections have enabled this to remain a significant sector for credit markets and banks.
Traditionally energy companies have had lower default rates with higher recovery values than the market in general. According to the Fitch U.S. High Yield Default Index, the annual default rate of the energy sector averaged 2.6% between 2001 and 2017 compared to 4.9% in non-energy, despite commodity price volatility. At the same time, historical recovery rates in energy lending have been higher than average according to Moody’s. Energy recovery rates benefit from the fact lending is asset-backed.
However, the mid-market energy companies have found that their size hampers their access to credit markets. As credit markets have grown, they have been increasingly less interested in smaller and less liquid names. In addition to this, since the financial crisis in 2007–08, banks have been cutting back their lending to several segments to de-risk their portfolios and this has included middle-market energy.
Non-bank direct lending is increasingly stepping in and filling the gaps left by banks and credit markets. However, non-direct lenders usually do not have the resources and experience to deal with the non-conforming characteristics of energy lending that require extremely technical credit analysis (due to the high cyclicality) and sector knowledge. As a result, the energy segment is extraordinarily underrepresented in direct non-bank lending. In 2018, while the energy sector represented 26% of bank lending for mid-market US companies, it did not even account for 1% of the non-bank market according to Refinitiv Loan Connector.
The mid-market energy companies nevertheless have significant capital needs. This has created a business opportunity for non-bank lenders such as RCOI with access to specialist teams and the deep sector knowledge to take advantage of the favourable credit supply and demand dynamics.
Market outlook: Energy market stress has improved Although energy company credit has done relatively well, the sector been under significant stress in 2020 during the COVID-19 crisis with commodity prices falling significantly. Those exposed to oil prices have been particularly affected. There were nine energy company bankruptcies in the first nine months of 2020 in the S&P Leveraged Loan Index. This was the most in any sector. Although bonds are not a core part of RCOI’s investing strategy, we note that the situation in the bond market mirrored that in leveraged loans. The US high-yield energy sector default rate was 23% in 2020 according to ICE BofA and JP Morgan. This was much higher than the ex-energy average of 6%.
The collapse in oil and gas demand as a result of the lockdowns (fewer cars, fewer flights) and the high elasticity in the oil price resulted in sharp decline in oil prices. Although the financial crises in 2007–08 did hurt oil prices, there was no sudden sharp decline in oil and gas demand. There were
Riverstone Credit Opportunities Income | 11 March 2021 3
also problems with the lack of sufficient storage for the surplus oil production, which further exacerbated price volatility during H120.
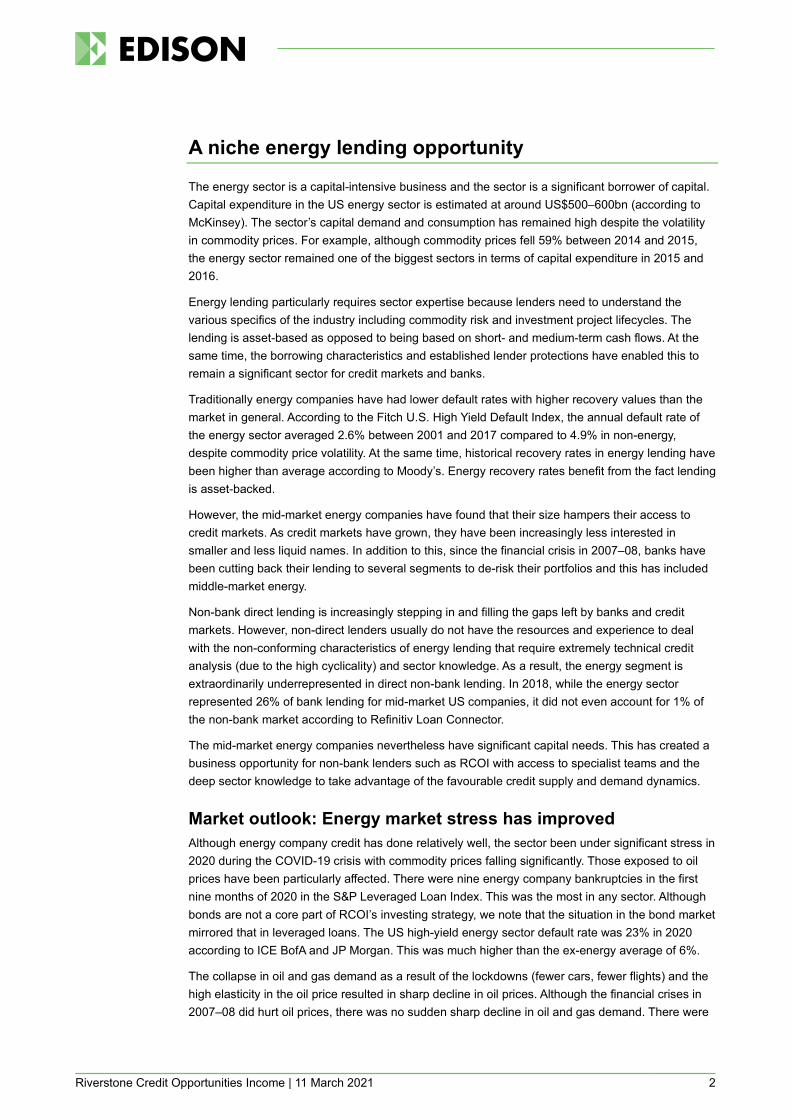
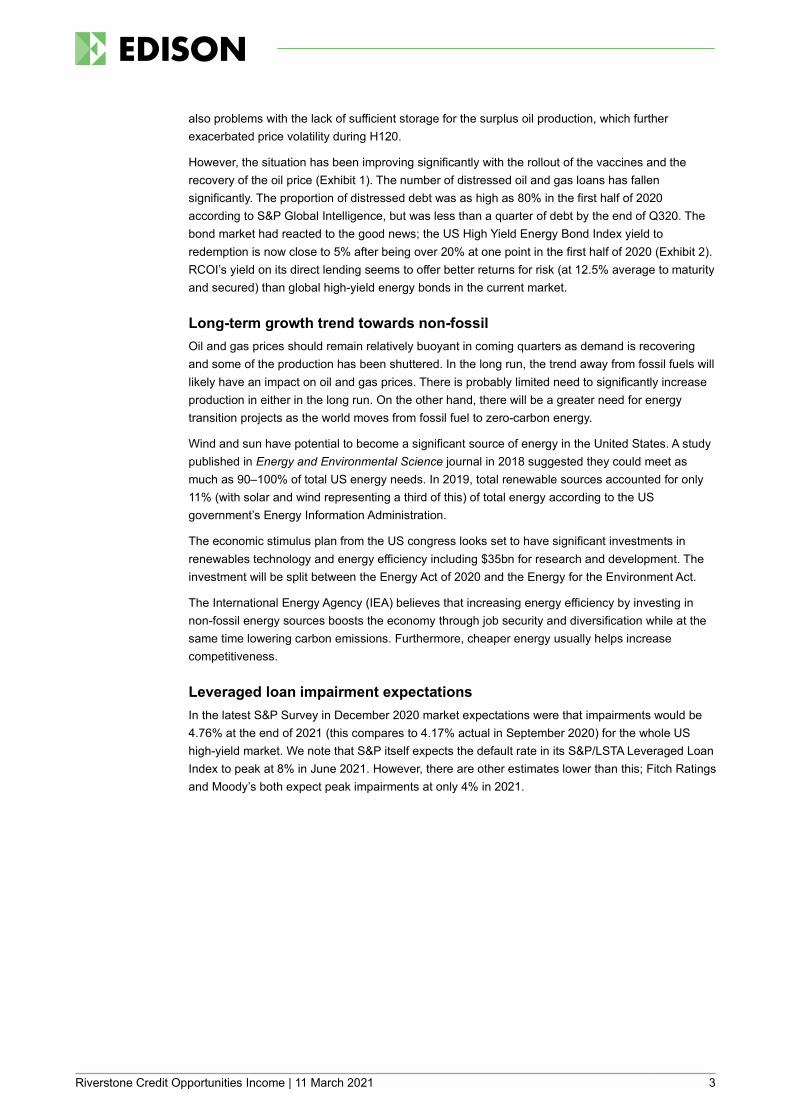
However, the situation has been improving significantly with the rollout of the vaccines and the recovery of the oil price (Exhibit 1). The number of distressed oil and gas loans has fallen significantly. The proportion of distressed debt was as high as 80% in the first half of 2020 according to S&P Global Intelligence, but was less than a quarter of debt by the end of Q320. The bond market had reacted to the good news; the US High Yield Energy Bond Index yield to redemption is now close to 5% after being over 20% at one point in the first half of 2020 (Exhibit 2). RCOI’s yield on its direct lending seems to offer better returns for risk (at 12.5% average to maturity and secured) than global high-yield energy bonds in the current market.
Long-term growth trend towards non-fossil Oil and gas prices should remain relatively buoyant in coming quarters as demand is recovering and some of the production has been shuttered. In the long run, the trend away from fossil fuels will likely have an impact on oil and gas prices. There is probably limited need to significantly increase production in either in the long run. On the other hand, there will be a greater need for energy transition projects as the world moves from fossil fuel to zero-carbon energy.
Wind and sun have potential to become a significant source of energy in the United States. A study published in Energy and Environmental Science journal in 2018 suggested they could meet as much as 90–100% of total US energy needs. In 2019, total renewable sources accounted for only 11% (with solar and wind representing a third of this) of total energy according to the US government’s Energy Information Administration.
The economic stimulus plan from the US congress looks set to have significant investments in renewables technology and energy efficiency including $35bn for research and development. The investment will be split between the Energy Act of 2020 and the Energy for the Environment Act.
The International Energy Agency (IEA) believes that increasing energy efficiency by investing in non-fossil energy sources boosts the economy through job security and diversification while at the same time lowering carbon emissions. Furthermore, cheaper energy usually helps increase competitiveness.
Leveraged loan impairment expectations In the latest S&P Survey in December 2020 market expectations were that impairments would be 4.76% at the end of 2021 (this compares to 4.17% actual in September 2020) for the whole US high-yield market. We note that S&P itself expects the default rate in its S&P/LSTA Leveraged Loan Index to peak at 8% in June 2021. However, there are other estimates lower than this; Fitch Ratings and Moody’s both expect peak impairments at only 4% in 2021.
Riverstone Credit Opportunities Income | 11 March 2021 4
Exhibit 1: Crude oil (West Texas Intermediate), price per barrel
Exhibit 2: S&P US High Yield Energy Bond Index yield to redemption
Source: Refinitiv Source: Refinitiv
26%
The fund manager: Riverstone Investment Group
Manager’s view In its comments on the portfolio on 22 January, Riverstone Investment Group (RIG) stated that despite the significant increase in commodity prices in Q420, ‘the longer term global supply and demand dynamics continue to remain uncertain as vaccination pace continues to face challenges and travel remains relatively restricted.’ RIG believe that these dynamics have led to a ‘robust transaction pipeline’. RIG expects to further diversify the portfolio going forward with ‘investments that are well-positioned to capitalise on a post-coronavirus market environment.’
RIG currently does not see any deterioration in any of its investments that would lead it to expect any loan loss realisation. While RIG accepts it is a volatile time for the sector, it believes that if it measures the risk correctly and prices it accordingly there are still good opportunities to invest. RCOI is obtaining good prices in its investments and equity-like returns are being achieved with lending that is done only on a secure first-lien basis.
RIG believes that it is more likely to increase its exposure towards infrastructure and infrastructure services, because these end markets are better suited to its short duration, loan to value lending model. However, it will continue to analyse and invest across the wide spectrum of the energy market. RIG also expects to increase its non-carbon investments and the recent community solar deal (Aspen) is a step in that direction. RCOI is almost 80% invested and expects to be fully invested by mid to late 2021.
Asset allocation
Current portfolio positioning Exhibit 5 shows RCOI’s loan portfolio as of Q420 as well as its exits. All of the loans are US dollar denominated, are to US companies and are floating rate. They are all first lien on the operating company; the exception is the Remington project, which is first lien on the holding company.
0102030405060708090
Jan15
Jun15
Nov15
Apr16
Sep16
Feb17
Jul17
Dec17
May18
Oct18
Mar19
Aug19
Jan20
Jun20
Nov20
US$
0
5
10
15
20
25
Jan15
Jun15
Nov15
Apr16
Sep16
Feb17
Jul17
Dec17
May18
Oct18
Mar19
Aug19
Jan20
Jun20
Nov20
%

Riverstone Credit Opportunities Income | 11 March 2021 5
Exhibit 3: Portfolio breakdown by segment (Q420)* Exhibit 4: Cash as % of NAV
Source: Riverstone. Note: *Committed capital, excluding cash. Source: Riverstone
At entry to investment the average drawn coupon is 9.7% and average tenor is 2.7 years; the longest is four years. The spread on the undrawn portion is 4% at entry. All of these figures have been fairly constant since inception.
As RIG builds up the portfolio, it is reducing the cash drag in the fund. In Q420, RCOI had $24.6m in cash, of which $19.3m was in its special purpose vehicle (SPV). This is equivalent to 25.8% of net asset value (NAV). Adjusting for residual liabilities in the SPV of $1.8m there is a net cash position of $22.8m (23.9% of NAV). This compares to about 60% at the end of FY19 and over 30% in Q120. After recent investments in Q120 the company has $15.8m in cash for investments. There is an actionable pipeline across energy infrastructure, infrastructure services and energy transition to deploy the remaining c 20% capital available.
Midstream (typically this is transport, storage and wholesale marketing) accounts for 42% of the committed loans. Infrastructure services account for 23% and could increase in weight as RIG sees relatively attractive risk-adjusted opportunities in this segment. Energy transition represents 8% of committed loans. The first loan (Aspen Power Partners) in this segment for RCOI was concluded in Q420 and is a community solar energy project. The loan duration is one year and the yield to maturity is 13%. This is another sector where RIG expects to conceivably increase in weight, especially with greater focus on environmental, social and corporate governance (ESG). Exploration and production (upstream) represents 28% of the loan commitments and its weight is set to decline in the future.
Exhibit 5 shows some details of RCOI loans as well as the loan exits, all of them profitable. The average yield to maturity is 12.5%, assuming the loan is fully drawn and with upfront fees. Loans are typically structured to be more expensive over time to encourage borrowers to repay RCOI early. Loan interest rates usually step up 1–2% percentage points each year until maturity.
The loans at the end of FY20 had a total fair value (FV) of $71.1m; this is similar to the gross unrealised value shown in Exhibit 5. Loans are usually valued on a discounted cash flow basis unless very recently invested in (eg Aspen Power Partners in December 2020). The weighted average discount rate is 13%, with a range of 7% to 20%.
Exploration & Production (E&P)(28.2%)
Midstream (41.5%)
Infrastructure Services (22.7%)
Energy Transition (7.6%)0
1020304050607080
Q319 Q419 Q120 Q220 Q320 Q420
%

Riverstone Credit Opportunities Income | 11 March 2021 6
Exhibit 5: RCOI portfolio (Q420) US$m Subsector Commit.
date Maturity
or exit date
Committed capital
Gross invested
capital
Gross realised
capital
Gross unrealised
value*
Realised & unrealised
value
Gross MOIC**
YTM*** (%) Company/project
name Existing portfolio
Project Yellowstone**** Midstream Jun-19 Nov-21 5.8 5.8 0.9 6.4 7.3 1.25 13.6 Ascent Energy Exploration & production Jun-19 Jun-22 13.3 13.3 7.1 8.4 15.5 1.17 13.7 Project Mariners Infrastructure services Jul-19 Jul-22 13.2 13.2 4.0 11.5 15.5 1.17 12.6 Pursuit Oil & Gas Exploration & production Jul-19 Jul-21 12.3 12.3 1.8 12.5 14.3 1.16 13.3 Caliber Midstream Midstream Aug-19 Jun-22 3.4 3.4 0.4 3.6 4.0 1.18 12.3 Epic Propane Pipeline Midstream Dec-19 Dec-22 14.8 14.8 1.2 15.2 16.5 1.11 11.6 Salt Creek Midstream Midstream Mar-20 Mar-23 13.7 13.7 9.0 6.5 15.5 1.13 11.7 Project Boulder II Infrastructure services Oct-20 Oct-24 7.4 7.4 3.4 4.4 7.7 1.05 10.4 Aspen Power Partners Energy transition Dec-20 Dec-21 6.9 3.4 0.1 3.4 3.5 1.03 13.3 Total
90.8 87.3 27.8 71.8 99.6 1.14 12.5
Portfolio exits
Project Shiner Exploration & production Jun-19 Dec-19 6.0 4.3 4.9 0 4.9 1.15 Mallard Exploration Exploration & production Nov-19 Apr-20 13.8 6.8 7.7 0 7.7 1.13 CIG Logistics Infrastructure services Jan-20 Jan-20 8.7 8.7 8.9 0 8.9 1.02 Market Based Multiple Jul-20 Nov-20 13.4 13.4 13.6 0 13.6 1.01 Total
41.9 33.2 35.1 0 35.1 1.06
Source: Riverstone. Note: *This is similar to fair value of the loans, given at $71.1m. **Margin over invested capital (MOIC) is the total gross realised and unrealised value as % of invested capital. ***Yield to maturity, assuming loan fully drawn and with all upfront fees. ****This investment in March 2021 was disclosed as realised, with an IRR of 13.5% and a MOIC of 1.23x.
Exhibit 6 gives brief descriptions of the various loans. Most of these loans are co-invested with other Riverstone-managed or associated funds, which reflects the aforementioned leverage off the Riverstone group’s expertise and support.
Exhibit 6: Borrower profile Ascent Energy – a sponsor-backed E&P company with operations focused in the Northern Delaware Basin (New Mexico). Use of proceeds is to fund capital expenditures in Lea County, New Mexico, subject to compliance with an Approved Plan of Development and to pay fees, costs and expenses related to the term loan. Part of a $55m loan.
Project Yellowstone – a privately owned, midstream company that provides fluids management, primarily produced water hauling, flow-back management and salt-water disposal infrastructure in Central Oklahoma. RCP closed the initial $105.0m financing in November 2018. Use of proceeds was to fund an acquisition. Part of a $55m loan. Investment realised in March.
Caliber Midstream – a sponsor-backed midstream company focused on the Bakken Formation (Montana, Dakotas and Canada) that provides crude oil and natural gas gathering and processing, produced water transportation and disposal, and freshwater sourcing and transportation. Use of proceeds, combined with a revolving credit facility draw, was to fund an acquisition. Part of a $65m loan.
Pursuit Oil and Gas – a sponsor-backed E&P company with operations focused in the dry gas window of the Eagle Ford Basin (Texas). Use of proceeds from the credit facility is to fund capital expenditures in Webb and La Salle Counties in Texas, other capital expenditures relating to existing and future upstream assets, and operating expenses. Part of a $50m loan.
Epic Propane Pipeline – a sponsor-backed midstream company that will provide propane purity offtake transportation to the Houston (Texas) export market. Use of proceeds from the credit facility is for the construction of a new propane pipeline from Robstown and Corpus Christi to Sweeney (Texas). Part of a $75m loan.
Salt Creek Midstream – a sponsor-backed midstream company that provides crude gathering, storage and blending services to a diversified footprint of producers in the core of the Delaware Basin (New Mexico). Part of a $75m loan.
Project Mariners –a privately held company that provides vessel and logistics services including cargo handling and towing, as well as tugboat, ship assist, and escort services predominantly focused on the energy sector. Part of a $140m loan.
Project Boulder II – a sponsor-backed company that is the leading specialty rental provider of containers and mobile asset management solutions across the energy, industrial, refining and petrochemical industries. Proceeds to completely refinance the existing capital structure. Part of a $225m loan.
Aspen Power Partners – a sponsor-backed company that acquires, constructs and manages community solar portfolios across the United States for eventual sale to third parties. This deal marks the first in a rapidly growing pipeline of de carbonisation investments. Part of a $20m loan.
US Shipping Corporation – a private midstream company that is a leading provider of long-haul marine transportation services for chemical, petroleum and clean petroleum product cargoes in the US operating along the US Gulf, East and West Coasts. Part of a $165m loan.
Roaring Fork Midstream – a sponsor-backed midstream that owns and operates pipeline and storage-related infrastructure moving natural gas and oil from the wellhead to market. Part of a $55m loan.
Source: Riverstone
Recent developments RCOI announced a new investment for Q120 that was closed on 10 February 2021. The project name is US Shipping Corporation and it is a private midstream company that is a leading provider of long-haul marine transportation services for chemical, petroleum and clean petroleum product cargoes across US ports. RCOI’s commitment is $6.5m out of a $165m loan. It is a four-year first-

Riverstone Credit Opportunities Income | 11 March 2021 7
lien loan with an expected total yield of 11.6% if fully drawn and is an example of a loan less exposed to commodity price movements than an average energy loan.
In February 2021, RCOI disclosed that 15% of the outstanding principal in the Mariners project, along with interest and fees at the 109 call premium, was repaid as a result of a sale leaseback in Q121 by the company. RCOI's remaining commitment is $10.1m. This is another example of profitably early loan repayments.
On 9 March 2021, RCOI disclosed that it had participated in a $55m loan to a sponsor-backed midstream company (Roaring Fork Midstream), which owns and operates pipeline and storage-related infrastructure moving natural gas and oil from the wellhead to market. RCOI’s commitment is $1.5m and was drawn at closing. The term is March 2024 with an all-in yield to maturity of 11.8% on a fully drawn basis.
ROIC also announced in March that it realised its Project Yellowstone investment with a total IRR of 13.5% and a MOIC of 1.23x.
Performance
RCOI’s inception date is relatively recent in May 2019. Its performance has been dominated by the COVID-19 pandemic crisis and its impact on the energy markets, particularly oil. During the peak of the market turbulence, RCOI’s share price had fallen almost 60% below issue price. As Exhibit 7 shows, the shares have rebounded but are still substantially below both issue price and NAV.
RCOI’s NAV per share has outperformed the S&P/LSTA US Leveraged Loan Index (LLI) index by 3.6% since inception and 1.7% in the last 12 months (Exhibit 8). RCOI’s NAV per share was marked down 4.3% in Q120 before increasing by 3.5% in Q220, whereas the LLI has been considerably volatile.
RCOI’s NAV has outperformed S&P High Yield Energy Loan Index since inception by 8.0%, but underperformed by 2.9% in the last year.
Over the same periods, RCOI’s NAV has outperformed the S&P Energy Bond Index, which tracks bonds from larger energy companies, by 0.6% and 5.1%, respectively, but this index not as close to RCOI’s portfolio as the S&P High Yield Energy Loan Index.
Exhibit 7: Investment company performance to end February 2021 Price, NAV and benchmark total return performance, one-year rebased Price, NAV and benchmark total return performance (%)
Source: Refinitiv, Edison Investment Research. Note: SI=since inception. Inception date is 24 May 2019.
30405060708090
100110120
Feb-
20
Mar-2
0
Apr-2
0
May-2
0
Jun-
20
Jul-2
0
Aug-
20
Sep-
20
Oct-2
0
Nov-2
0
Dec-2
0
Jan-
21
Feb-
21
RCOI Equity RCOI NAV S&P Lev Loan
-10
-5
0
5
10
15
20
25
1 m 3 m 6 m 1 y SI
Perfo
rman
ce
RCOI Equity RCOI NAV S&P Lev Loan

Riverstone Credit Opportunities Income | 11 March 2021 8
Exhibit 8: Share price and NAV total return performance, relative to indices (%) One month Three months Six months One year Since inception Price relative to S&P Lev Loan 2.7 24.3 25.4 98.2 (11.8) NAV relative to S&P Lev Loan 0.0 2.5 0.9 (10.9) 3.6 Price relative to S&P High Yield Energy Loan Index 2.5 22.7 14.2 40.8 (8.1) NAV relative to S&P High Yield Energy Loan Index (0.3) 1.2 (8.1) (36.7) 8.0 Price relative to S&P Energy Bond Index 3.8 29.3 27.1 84.1 (14.0) NAV relative to S&P Energy Bond Index 1.0 6.7 2.3 (17.2) 1.1
Source: Refinitiv, Edison Investment Research. Note: Data to end-December 2020. Inception date is 24 May 2019. Geometric calculation. All indices are US-based and in US dollars.
Exhibit 9: NAV total return performance relative to S&P Leveraged Loan Index since inception
Source: Refinitiv, Edison Investment Research. Note: Inception date is 24 May 2019.
Peer group comparison
Exhibit 10 shows a comparison of RCOI with a selected peer group of funds from the AIC Sector Specialist: Debt and AIC Sector Specialist: Financials sectors that have significant holdings in direct lending or similar investments. We note that there is not a pure energy direct lending peer; RCOI is fairly unique.
We compare the performance over one year. We have also added longer time periods for the peers, to give greater context to the short-term performance data.
Compared to its peers, RCOI’s NAV performance over the last 12 months ranks seventh out of 10 and fourth out of eight since inception in May 2019. However, the performance has been adversely affected in this period by the significant cash position, which it is steadily deploying.
RCOI stands out by having the largest discount to NAV and the highest dividend yield (a consequence of the large discount). RCOI is also on the lower end of the scale when it comes to costs, despite still being a small fund. Besides good cost control, it also reflects the lack of a base management fee and the benefit of being able to leverage off the Riverstone group and its infrastructure.
9095
100105110115120125130
Jun-
19
Jul-1
9
Aug-
19
Sep-
19
Oct-1
9
Nov-1
9
Dec-1
9
Jan-
20
Feb-
20
Mar-2
0
Apr-2
0
May-2
0
Jun-
20
Jul-2
0
Aug-
20
Sep-
20
Oct-2
0
Nov-2
0
Dec-2
0
Jan-
21
Feb-
21

Riverstone Credit Opportunities Income | 11 March 2021 9
Exhibit 10: Selected investment peer group as at 8 March 2021* in sterling terms % unless stated Market
cap £m NAV TR
1 year NAV TR
SI NAV TR
3 year NAV TR
5 year Premium/ (discount)
Ongoing charge
Perf. fee
Net gearing
Dividend yield
Riverstone Credit Opportunities Inc. 55.8 7.6 11.8 (19.5) 1.2 Yes 83 8.3 Alternative Credit Investments plc 639.2 1.8 6.0 8.4 18.0 (5.7) 1.5 Yes 148 5.5 BioPharma Credit Ord 970.8 4.7 0.6 23.4 (2.4) 1.1 Yes 61 7.0 GCP Asset Backed Income 396.1 8.4 12.4 24.7 39.7 (12.1) 1.2 No 97 6.6 Honeycomb Investment Trust 335.0 10.3 17.0 28.6 49.7 (6.7) 1.8 Yes 90 8.3 RM Secured Direct Lending 102.3 4.6 7.3 19.7 (7.8) 1.9 No 104 7.3 RM Secured Direct Lending ZDP 2021 11.8 3.5 1.5 0 (1.9) 1.9 No 94 0.0 Secured Income Fund Ord 35.2 (0.3) (1.1) 7.5 21.2 (14.6) 2.4 Yes 67 0.0 SME Credit Realisation Fund 99.8 (4.6) (3.5) (2.1) 11.7 (26.9) 1.0 No 120 8.1 VPC Specialty Lending Invest. Ord 239.6 20.3 44.2 52.7 60.6 (24.5) 2.0 Yes 91 9.0 Average 273.8 5.9 9.8 22.1 36.6 (12.1) 1.7 91 5.8 Rank in peer group 8 4 4 N/A N/A 8 3 3 2
Source: Morningstar, Edison Investment Research. Note: *Performance to end-January 2021. **Since RCOI inception (SI) date is 24 May 2019. ***Edison estimate. TR = total return in sterling terms. Net gearing is total assets less cash and equivalents as a percentage of net assets (100 = ungeared).
Dividends
RCOI pays dividends quarterly in April, July, October and January. It has an 8.0–10.0% target annualised yield based on its US$1.00 per share IPO price. RCOI aims to pay 100% of its quarterly income (after payment of expenses) as dividends. However, it can retain up to 15% of its income if the board believes it is in the best long-term interests of the company.
RCOI paid a dividend of 2.57c in Q419, followed by 1.8c in the next two quarters, 1.4c in Q320 and then 2c in Q420. The dividend paid with respect to 2020 was 7c per share. The trailing annual dividend yield is a substantial 8.3%.
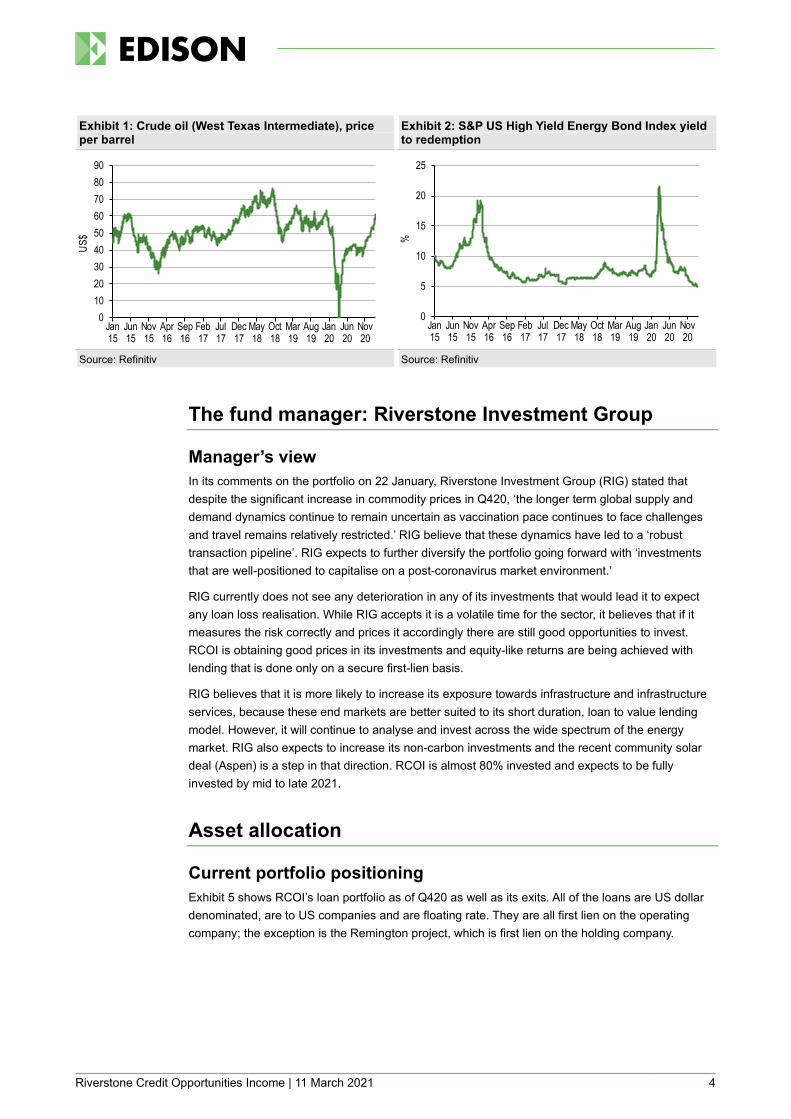
Discount: 20% below NAV RCOI’s shares are currently trading at 20% below their stated NAV per share. The discount peaked 60% below the NAV in the first half in 2020. Clearly market risk perceptions are very high. The market is pricing in significant loan portfolio losses, although to date all the loans have been performing. Although there may be default problems in the future, we note that the loans are all asset-backed and with LTVs in the mid-40s; therefore they are likely to have good recovery values or to be successfully restructured with no investment losses to RCOI.
RIG has taken advantage of the discount and has been buying back and cancelling RCOI shares. It has purchased 8.45m shares (8.45% of shares issued) and spent $5.8m at an average of $0.683 per share. Most of the share buybacks were done in May 2020 and in Q420. The company can buy up to 14.99% of its shares; this authorisation has to be renewed annually, usually at the AGM (the next AGM is on 19 May 2021).
Riverstone Credit Opportunities Income | 11 March 2021 10
Exhibit 11: Discount since inception (24 May 2019) Exhibit 12: Buybacks and issuance
Source: Refinitiv, Edison Investment Research Source: Morningstar, Edison Investment Research
Fund profile: Energy credit specialist
RCOI launched in May 2019 and is an England-domiciled, London-listed, closed-end investment company with a focus on credit opportunities in small and mid-sized energy companies. It invests in companies at all stages of energy exploration, production and distribution. To diversify risk and provide synergies, the company aims to invest geographically (both in terms of production and end markets) and in different commodities.
Investments maturities tend to be on the short to medium side (the usual tenor is one to four years) and RCOI often welcomes early redemption as a sign that the borrowers are growing. So, many if not most of the loans are expected to have full or partial realisations before maturity.
The portfolio so far consists of first-lien loans with floating rates and it is expected to remain heavily skewed towards this type of lending. The issuers will be typically domiciled in the US (or with the majority of the operations in the US), but the remit allows for lending to companies in other regions. The loans are also typically delayed draw loans, with the borrowers paying some interest on the undrawn portion.
While most of RCOI’s investing will be direct lending, RCOI will also look at capital relief and market-based opportunities. Capital relief transactions consist of RCOI buying non-conforming energy loans from banks that no longer can or wish to keep them on the balance sheet. Unlike direct lending, the due diligence will typically be based on public information and RCOI is unlikely to be able to influence underlying terms. These investments may also be part of a larger syndicate. Market-based investments will be conducted on the open market and can include bonds as well as syndicated loans. Both capital relief and market-based investments are expected to be secondary to direct lending and only done when the expected returns match or exceed the opportunities in direct lending.
The Riverstone advantage RCOI is able to leverage off the Riverstone Credit Platform and the wider Riverstone group (Riverstone Holdings) and this is a key, differentiating advantage. Riverstone was founded in 2000 and is a private investment firm focused on energy and power. It has raised $41bn in more than 200 investments across its three platforms: Global Energy & Power, Renewable Energy and Riverstone Credit Platform.
Riverstone is the key source for RCOI’s origination as well as providing support for due diligence, risk underwriting capabilities and credit analyses. It provides access to market specialists and operational expertise, which helps managing risk and provides downside protection.
-70-60-50-40-30-20-10
010
Jun-
19Ju
l-19
Aug-
19Se
p-19
Oct-1
9No
v-19
Dec-1
9Ja
n-20
Feb-
20Ma
r-20
Apr-2
0Ma
y-20
Jun-
20Ju
l-20
Aug-
20Se
p-20
Oct-2
0No
v-20
Dec-2
0Ja
n-21
Feb-
21 0
20
40
60
80
100
120
FY19 FY20
Costs
/pro
ceed
s (US
$m)
Repurchases Allotments
Riverstone Credit Opportunities Income | 11 March 2021 11
Christopher Abbate and Jamie Brodsky head the Riverstone Credit Platform (RCP) and the Riverstone Credit Team that manages the platform funds, including RCOI. Both joined Riverstone in 2014 after a decade of leading energy leveraged finance at Citibank and Nomura, respectively. The Riverstone Credit Team is made up of 12 people with industry knowledge, financial expertise (including origination, syndication and underwriting) and operating capabilities.
Since 2014, RCP has committed over $2.1bn in capital in RCP I and RCP II energy credit funds, both of them private (unlisted). As is the case with RCOI, these funds consist of floating rate, first-lien loans, secured and with similar average tenors and loan to value ratios (LTVs) (in the mid-40s). The average loan yields to redemption have been around 13% and the cash yield of the funds has been 11–12%. These seem to be quite attractive returns. As a comparison, the S&P High Yield Energy Loan Index averaged just under 6% in the last five years to the end of January 2021.
Investment process
RCOI seeks to only invest in credit instruments of energy companies, although RCOI may sometimes end up in equity, warrants or other financial instruments as a result of a loan workout. Primarily the investments will take the form of direct loans.
As mentioned earlier, the company invests across the broad range of the energy sector: downstream (including infrastructure services), midstream and upstream (exploration and production). It invests across several commodities (eg oil, natural gas) as well as renewables. As we detail later in the current portfolio description, the last loan investment was a community solar energy project and renewables is a targeted area for growth. Conversely, RIG does not anticipate significant RCOI capital investments in the upstream segment.
RCOI may invest alongside other Riverstone funds such as RCP I and RCP II or funds with a similar investment policy advised by Riverstone. It will not invest in other closed-ended funds.
The key investment restrictions are as follows:
no more than 15% of gross assets in any single borrower (including all related companies),
at least 85% of gross assets have to be secured,
borrowers have a maximum loan to asset ratio of 60% (including RCOI debt),
borrowers can not have any equity from a Riverstone group related company or advised by the same, and
the maximum loan term is seven years.

Riverstone Credit Opportunities Income | 11 March 2021 12
Exhibit 13: RCOI investment process
Source: Riverstone
Exhibit 13 shows the five stages of the investment process as described and defined by RCOI. RCOI’s deal origination comes from borrower relationships, Riverstone’s global network (including inbound requests) and relationships with key advisers and other financial companies. The latter include banks and broker-dealers wanting to downsize existing exposure to the mid-market energy companies.
The Credit Investment Committee is responsible for making all the final investment decisions, as well as screening ideas before they move to full diligence. The committee consists of three Riverstone employees in addition to Abbate and Brodsky: the two Riverstone founders, Pierre Lapeyre Jr. and David Leuschen, and Kenneth Ryan (a Riverstone partner).
Riverstone’s approach to ESG The Riverstone group has an ESG policy regarding how it handles issues such as ‘natural resource management, health and safety, community and stakeholder impact, climate change, greenhouse gas emissions and governance, among many others’. Riverstone has established a formal ESG Committee, which oversees processes to meet this policy. These processes include training, access to ESG resources as well as identifying possible risks and mitigating damage before an investment is made. There is also active portfolio monitoring regarding ESG issues. Both the due diligence and investment committee assess ESG risks, while third-party experts are used for assistance as needed. We note that in December 2020 RCOI made its first investments in renewable (solar) energy.
Gearing
RCOI had no borrowings as of the end of FY20. As set out in its memorandum of association, RCOI is permitted to borrow up to 30% of its gross assets, at the time of borrowing. This limit excludes non-recourse financing in any special investment vehicles such as the non-recourse loans in its two

Riverstone Credit Opportunities Income | 11 March 2021 13
Delaware-based limited partnerships (Riverstone International Credit and Riverstone International Credit-Direct).
Fees & charges
There is no base management fee paid by RCOI to RIG or to any Riverstone group entity. We believe this is an attraction that helps aligns the interests of shareholders with management. The remuneration for management will be solely through a profit share. RCOI does pay for reasonable reimbursable expenses as well as directors’ fees.
The incentive system is three tiered. It is paid quarterly, but reconciled on an annual basis. There is no catch up/adjustment on profit share beyond the fiscal year. Payment is 0% if the annual distributable income is less than 4%, 20% is paid out if the income is between 4% and 8% and 30% if the distributable income is greater than 8%.
Capital structure
RCOI currently has a single share class, with 91.54m ordinary shares in issue. There are no rules restricting the ability of the directors to issue additional shares on a non-pre-emptive basis at any time. The directors may issue additional shares, pursuant to a placing programme or otherwise, if they determine this to be in the best interests of shareholders and Riverstone as a whole. No shares have been allotted since RCOI’s IPO in May 2019, when it raised c US$100m in proceeds through issuing 100m ordinary shares at US$1.00 per share, and all of its 100m ordinary shares were admitted to trading on the Specialist Fund Segment (SFS) of the London Stock Exchange.
Exhibit 14: Major shareholders (29 January 2021) Exhibit 15: Average daily volume ($000s)
Source: Refinitiv Source: Refinitiv
The board
RCOI’s board is comprised of three non-executive directors, all of them independent of the investment manager.
Reuben Jeffery, III, Chairman: Mr Jeffery has a broad range of financial services experience, particularly investment banking, and in addition brings extensive insight into the US political and regulatory environment. He is currently vice chairman of Rockefeller Capital Management, and served in the US government as under secretary of state for economic, energy and agricultural affairs between 2007 and 2009. Mr Jeffery also served as chairman of the Commodity Futures Trading Commission and as a special assistant to the president on the staff of the National Security
Riverstone COI Coinv. (18.5%)ND Cap Inv (10.7%)Newton IM (10.7%)Alder IM (8.0%)Brooks Macdonald AM (8.0%)AXA IM (7.5%)Weiss AM (6.9%)Polar Capital (4.8%)Jupiter AM (4.3%)JP Morgan Securities (3.9%)Metage CM (3.7%)Others (13.1%)
0
500
1000
1500
2000
2500
3000
Feb20
Mar20
Apr20
May20
Jun20
Jul20
Aug20
Sep20
Oct20
Nov20
Dec20
Jan21
Feb21

Riverstone Credit Opportunities Income | 11 March 2021 14
Council. Before his government service, Mr Jeffery spent 18 years at Goldman, Sachs & Co where he was managing partner of Goldman Sachs in Paris and led the firm’s European Financial Institutions Group in London. Prior to joining Goldman Sachs, Mr Jeffery was a corporate attorney with Davis Polk & Wardwell.
Emma Davies: Ms Davies is head of direct investments at Marylebone Partners, an independent wealth management firm. Ms Davies was previously head of property and infrastructure at The Wellcome Trust, where she also helped to manage the public markets portfolio. She was formerly CIO of Big Society Capital and ran the European investments team for Perry Capital.
Edward Cumming-Bruce: Mr Edward Cumming-Bruce is the vice chairman of Gleacher Shacklock LLP, which he joined in August 2003, before which he worked for 12 years at Dresdner Kleinwort Wasserstein, where he held a number of senior positions including co-head of global telecoms investment banking, co-head of UK investment banking and global head of equity capital markets. Mr Cumming-Bruce has extensive experience advising a range of major European companies on capital markets and restructuring transactions as well as mergers and acquisitions. Prior to Dresdner Kleinwort Wasserstein, he worked at Schroders.
Exhibit 16: RCOI’s board of directors Board member Date of appointment Remuneration in FY20 Shareholdings end-FY20 Reuben Jeffery, III (Chairman) 2 April 2019 $56,821 50,000 Emma Davies (Audit & Risk Committee Chair) 2 April 2019 $50,507 45,000 Edward Cumming-Bruce (Nomination Comm. Chair) 2 April 2019 $44,194 50,000
Source: Riverstone

Riverstone Credit Opportunities Income | 11 March 2021 15
General disclaimer and copyright This report has been commissioned by Riverstone Credit Opportunities Income and prepared and issued by Edison, in consideration of a fee payable by Riverstone Credit Opportunities Income. Edison Investment Research standard fees are £49,500 pa for the production and broad dissemination of a detailed note (Outlook) following by regular (typically quarterly) update notes. Fees are paid upfront in cash without recourse. Edison may seek additional fees for the provision of roadshows and related IR services for the client but does not get remunerated for any investment banking services. We never take payment in stock, options or warrants for any of our services.
Accuracy of content: All information used in the publication of this report has been compiled from publicly available sources that are believed to be reliable, however we do not guarantee the accuracy or completeness of this report and have not sought for this information to be independently verified. Opinions contained in this report represent those of the research department of Edison at the time of publication. Forward-looking information or statements in this report contain information that is based on assumptions, forecasts of future results, estimates of amounts not yet determinable, and therefore involve known and unknown risks, uncertainties and other factors which may cause the actual results, performance or achievements of their subject matter to be materially different from current expectations.
Exclusion of Liability: To the fullest extent allowed by law, Edison shall not be liable for any direct, indirect or consequential losses, loss of profits, damages, costs or expenses incurred or suffered by you arising out or in connection with the access to, use of or reliance on any information contained on this note.
No personalised advice: The information that we provide should not be construed in any manner whatsoever as, personalised advice. Also, the information provided by us should not be construed by any subscriber or prospective subscriber as Edison’s solicitation to effect, or attempt to effect, any transaction in a security. The securities described in the report may not be eligible for sale in all jurisdictions or to certain categories of investors.
Investment in securities mentioned: Edison has a restrictive policy relating to personal dealing and conflicts of interest. Edison Group does not conduct any investment business and, accordingly, does not itself hold any positions in the securities mentioned in this report. However, the respective directors, officers, employees and contractors of Edison may have a position in any or related securities mentioned in this report, subject to Edison's policies on personal dealing and conflicts of interest.
Copyright: Copyright 2021 Edison Investment Research Limited (Edison).
Australia Edison Investment Research Pty Ltd (Edison AU) is the Australian subsidiary of Edison. Edison AU is a Corporate Authorised Representative (1252501) of Crown Wealth Group Pty Ltd who holds an Australian Financial Services Licence (Number: 494274). This research is issued in Australia by Edison AU and any access to it, is intended only for "wholesale clients" within the meaning of the Corporations Act 2001 of Australia. Any advice given by Edison AU is general advice only and does not take into account your personal circumstances, needs or objectives. You should, before acting on this advice, consider the appropriateness of the advice, having regard to your objectives, financial situation and needs. If our advice relates to the acquisition, or possible acquisition, of a particular financial product you should read any relevant Product Disclosure Statement or like instrument.
New Zealand The research in this document is intended for New Zealand resident professional financial advisers or brokers (for use in their roles as financial advisers or brokers) and habitual investors who are “wholesale clients” for the purpose of the Financial Advisers Act 2008 (FAA) (as described in sections 5(c) (1)(a), (b) and (c) of the FAA). This is not a solicitation or inducement to buy, sell, subscribe, or underwrite any securities mentioned or in the topic of this document. For the purpose of the FAA, the content of this report is of a general nature, is intended as a source of general information only and is not intended to constitute a recommendation or opinion in relation to acquiring or disposing (including refraining from acquiring or disposing) of securities. The distribution of this document is not a “personalised service” and, to the extent that it contains any financial advice, is intended only as a “class service” provided by Edison within the meaning of the FAA (i.e. without taking into account the particular financial situation or goals of any person). As such, it should not be relied upon in making an investment decision.
United Kingdom This document is prepared and provided by Edison for information purposes only and should not be construed as an offer or solicitation for investment in any securities mentioned or in the topic of this document. A marketing communication under FCA Rules, this document has not been prepared in accordance with the legal requirements designed to promote the independence of investment research and is not subject to any prohibition on dealing ahead of the dissemination of investment research.
This Communication is being distributed in the United Kingdom and is directed only at (i) persons having professional experience in matters relating to investments, i.e. investment professionals within the meaning of Article 19(5) of the Financial Services and Markets Act 2000 (Financial Promotion) Order 2005, as amended (the "FPO") (ii) high net-worth companies, unincorporated associations or other bodies within the meaning of Article 49 of the FPO and (iii) persons to whom it is otherwise lawful to distribute it. The investment or investment activity to which this document relates is available only to such persons. It is not intended that this document be distributed or passed on, directly or indirectly, to any other class of persons and in any event and under no circumstances should persons of any other description rely on or act upon the contents of this document.
This Communication is being supplied to you solely for your information and may not be reproduced by, further distributed to or published in whole or in part by, any other person.
United States Edison relies upon the "publishers' exclusion" from the definition of investment adviser under Section 202(a)(11) of the Investment Advisers Act of 1940 and corresponding state securities laws. This report is a bona fide publication of general and regular circulation offering impersonal investment-related advice, not tailored to a specific investment portfolio or the needs of current and/or prospective subscribers. As such, Edison does not offer or provide personal advice and the research provided is for informational purposes only. No mention of a particular security in this report constitutes a recommendation to buy, sell or hold that or any security, or that any particular security, portfolio of securities, transaction or investment strategy is suitable for any specific person. Frankfurt +49 (0)69 78 8076 960 Schumannstrasse 34b 60325 Frankfurt Germany
London +44 (0)20 3077 5700 280 High Holborn London, WC1V 7EE United Kingdom
New York +1 646 653 7026 1185 Avenue of the Americas 3rd Floor, New York, NY 10036 United States of America
Sydney +61 (0)2 8249 8342 Level 4, Office 1205 95 Pitt Street, Sydney NSW 2000, Australia