Rivers The Power of - The Nature Conservancy · 10 THE POWER OF RIVERS In an in-depth investigation...
52
Finding balance between energy and conservation in hydropower development Rivers The Power of
Transcript of Rivers The Power of - The Nature Conservancy · 10 THE POWER OF RIVERS In an in-depth investigation...
Finding balance between energy and conservation in hydropower development
RiversThe Power of

T H E P O W E R O F R I V E R S2
Acknowledgments
Photo: ©Jeff Opperman
T H E P O W E R O F R I V E R S 3
Lead authors:
Dr. Jeff Opperman, Dr. Günther Grill, Dr. Joerg Hartmann.
Case study authors and research:
Hector Angarita, Pedro Bara Neto, Juliana Delgado, David Harrison, Dr. Jonathan V. Higgins, Erik Martin, Amy Newsock, Dr. Paulo Petry, Ben Roth, Leonardo Sotomayor, Juan Francisco Torres Origel, Diana Vázquez.
Contributors:
Carolina Aguirre-Echeverri, David Banks, Ana Cristina Barros, Charles Bedford, Dr. Giulio Boccaletti, Katie Crossman, Randy Curtis, Jorge Gastelumendi, Dietmar Grimm, Qiaoyu Guo, Dr. Bernhard Lehner, Emily Powell, Dr. Carmen Revenga, Lynn Scarlett, Lisa Shipley, Meghan Snow, Dr. Rebecca Tharme, Jerry Touval and Dr. Christiane Zarfl.
Institutions contributing data and/or analyses:
Empresa de Planejamento Energético (EPE) Environmental Department, McGill University, Mexico´s Federal Electricity Commission (CFE), Mexican National Commission for Knowledge and Use of Biodiversity (CONABIO), The Leibniz-Institute of Freshwater Ecology and Inland Fisheries Berlin (IGB), the Center for Applied Geosciences of the Universität Tübingen, the Institute of Environmental Systems Research (USF) of the University of Osnabrück, International Hydropower Association, WWF, and the University of Wisconsin.
The following people served as interviewees or reviewed earlier drafts of this paper. Their contributions strengthened the paper, however, the positions expressed in this paper are those of The Nature Conservancy and do not necessarily reflect those who provided input.
Ken Adams, Dr. Luiz Gabriel Azevedo, Emmanuel Boulet, Emmanuel Branche, Jean Michel Devernay, Mark Eckstein, Roger Gill, Rikard Liden, Øyvind Espeseth Lier, Dr. Cathy Reidy Liermann, Kimberly Lyon, Gil Maranhão Neto, Dr. Peter McIntyre, Pelayo Menendez, Mario Barroso Ramos Neto, Dr. Judith Plummer Braeckman, John Reid, William Rex, Hugh Rudnick, Jamie Skinner, Richard Taylor, Paula Hanna Valdujo, Hermani Vieira.
Report Designer:
Paul Gormont, Apertures Inc.
This report would not have been possible without the generous support of: Caterpillar Foundation, Goldman Sachs Center for Environmental Markets and the Prince Albert II of Monaco Foundation.
Much of the thinking on basin-scale planning described in this paper was initiated during a collaboration with the Inter-American Development Bank (with funding from IDB), summarized in the report The Next Frontier of Hydropower Sustainability: Planning at the System Scale (Hartmann et al., 2013).
Please cite this document as: Opperman, J., G. Grill and J. Hartmann, The Power of Rivers: Finding balance between energy and conservation in hydropower development. 2015. The Nature Conservancy: Washington, D.C.
©2015 The Nature Conservancy.
Printed on recycled paper.
T H E P O W E R O F R I V E R S4
Acknowledgments ................................................................................................... 2
Foreword .................................................................................................................... 6
Key Findings ............................................................................................................... 9
THE POWER OF RIVERS
Finding balance between energy and conservation in hydropower development .........11
Prologue ...............................................................................................................................................12
The value of free-flowing rivers .......................................................................................................12
The expansion of hydropower .........................................................................................................13
What’s at stake if hydropower is not developed and managed sustainably? .....................14
A different path ...................................................................................................................................19
Funding better outcomes .................................................................................................................23
The way forward .................................................................................................................................25
RIVER BASIN CASE STUDIES ......................................................................................................27
Coatzacoalcos River Basin, Mexico ...............................................................................................28
Magdalena River Basin, Colombia .................................................................................................30
Tapajós River Basin, Brazil ................................................................................................................32
CHAPTER 3
TAB
LE OF C
ON
TENTS

T H E P O W E R O F R I V E R S 5
APPENDIX A
Methods for spatial analysis within case study basins and global modeling .........................................................................................................34
Downstream flow alteration .............................................................................................................35
Fragmentation of river channel networks .....................................................................................36
Basin-scale studies ............................................................................................................................37
Global calculations of future impacts from planned dams .......................................................38
Global-scale extrapolations ..............................................................................................................38
APPENDIX B
Methods for quantitative estimates of costs and benefits of Hydropower by Design ..........................................................................................................41
Additional costs of best practices ..................................................................................................42
Additional benefits of best practices .............................................................................................43
Relative cost analysis .........................................................................................................................44
APPENDIX C
References .........................................................................................................................................46
Photo: ©Bridget Besaw

T H E P O W E R O F R I V E R S6
Foreword
Photo: ©Bridget Besaw
T H E P O W E R O F R I V E R S 7
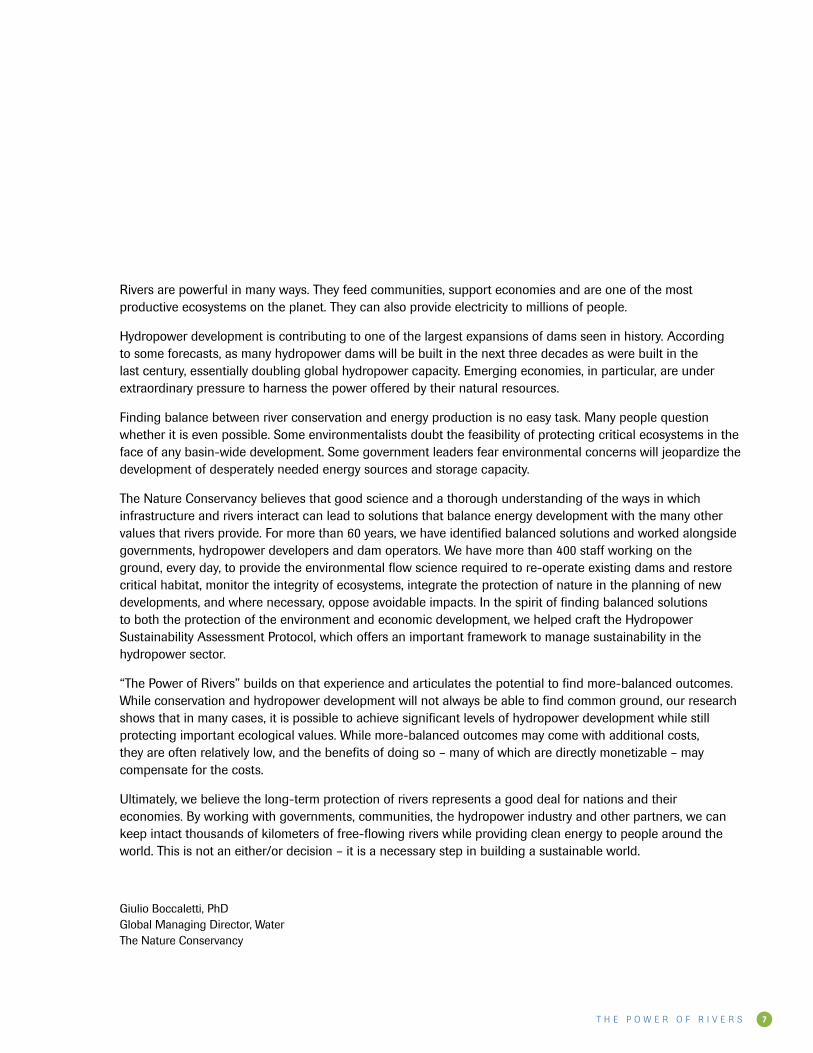
Rivers are powerful in many ways. They feed communities, support economies and are one of the most productive ecosystems on the planet. They can also provide electricity to millions of people.
Hydropower development is contributing to one of the largest expansions of dams seen in history. According to some forecasts, as many hydropower dams will be built in the next three decades as were built in the last century, essentially doubling global hydropower capacity. Emerging economies, in particular, are under extraordinary pressure to harness the power offered by their natural resources.
Finding balance between river conservation and energy production is no easy task. Many people question whether it is even possible. Some environmentalists doubt the feasibility of protecting critical ecosystems in the face of any basin-wide development. Some government leaders fear environmental concerns will jeopardize the development of desperately needed energy sources and storage capacity.
The Nature Conservancy believes that good science and a thorough understanding of the ways in which infrastructure and rivers interact can lead to solutions that balance energy development with the many other values that rivers provide. For more than 60 years, we have identified balanced solutions and worked alongside governments, hydropower developers and dam operators. We have more than 400 staff working on the ground, every day, to provide the environmental flow science required to re-operate existing dams and restore critical habitat, monitor the integrity of ecosystems, integrate the protection of nature in the planning of new developments, and where necessary, oppose avoidable impacts. In the spirit of finding balanced solutions to both the protection of the environment and economic development, we helped craft the Hydropower Sustainability Assessment Protocol, which offers an important framework to manage sustainability in the hydropower sector.
“The Power of Rivers” builds on that experience and articulates the potential to find more-balanced outcomes. While conservation and hydropower development will not always be able to find common ground, our research shows that in many cases, it is possible to achieve significant levels of hydropower development while still protecting important ecological values. While more-balanced outcomes may come with additional costs, they are often relatively low, and the benefits of doing so – many of which are directly monetizable – may compensate for the costs.
Ultimately, we believe the long-term protection of rivers represents a good deal for nations and their economies. By working with governments, communities, the hydropower industry and other partners, we can keep intact thousands of kilometers of free-flowing rivers while providing clean energy to people around the world. This is not an either/or decision – it is a necessary step in building a sustainable world.
Giulio Boccaletti, PhD Global Managing Director, Water The Nature Conservancy
T H E P O W E R O F R I V E R S8
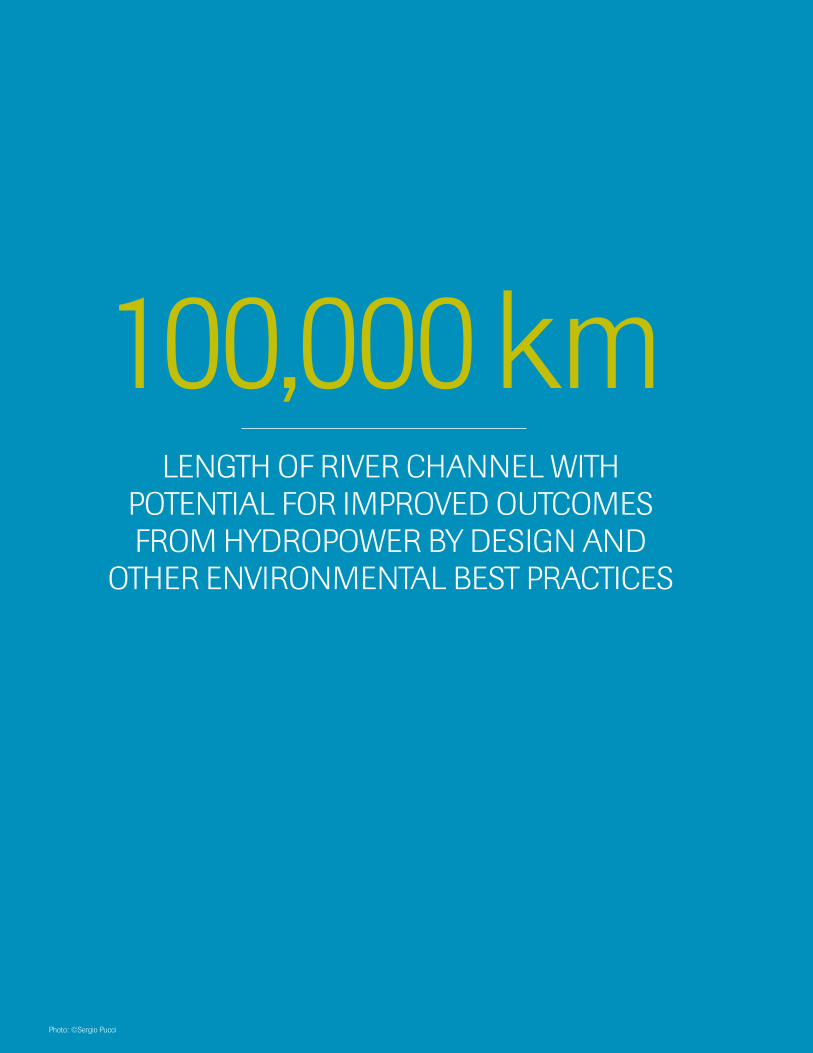
LENGTH OF RIVER CHANNEL WITH POTENTIAL FOR IMPROVED OUTCOMES FROM HYDROPOWER BY DESIGN AND
OTHER ENVIRONMENTAL BEST PRACTICES
100,000 km
Photo: ©Sergio Pucci
T H E P O W E R O F R I V E R S 9
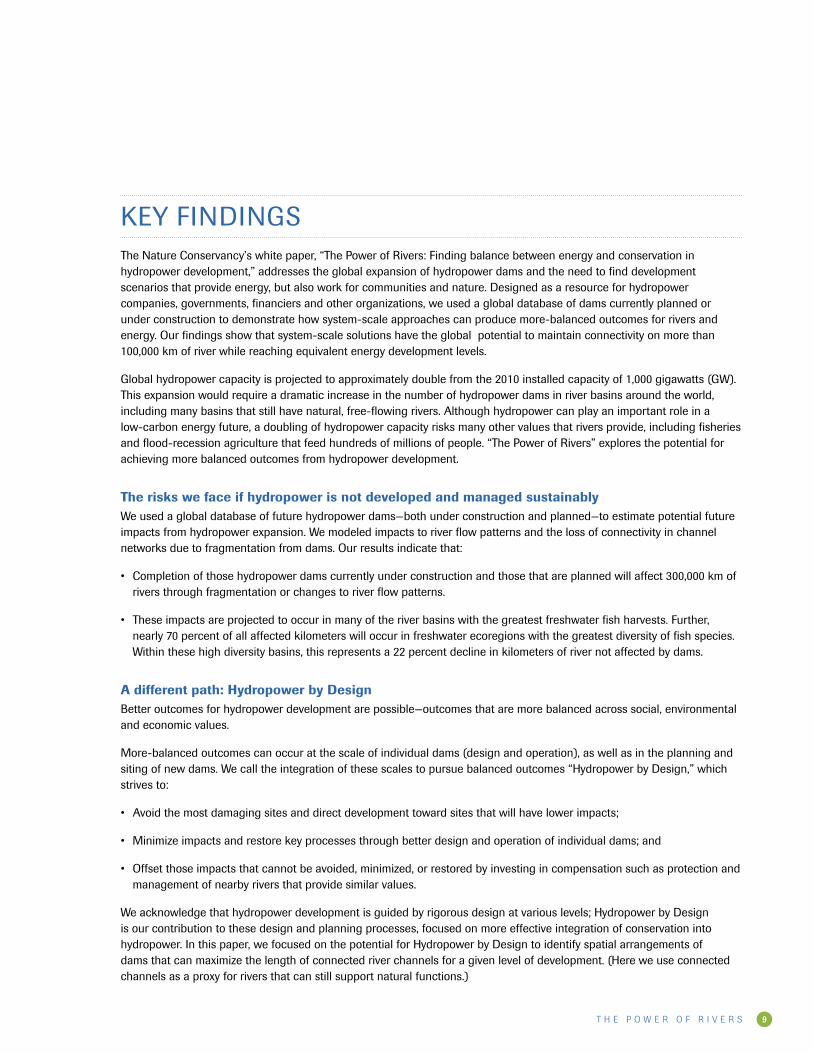
KEY FINDINGSThe Nature Conservancy’s white paper, “The Power of Rivers: Finding balance between energy and conservation in hydropower development,” addresses the global expansion of hydropower dams and the need to find development scenarios that provide energy, but also work for communities and nature. Designed as a resource for hydropower companies, governments, financiers and other organizations, we used a global database of dams currently planned or under construction to demonstrate how system-scale approaches can produce more-balanced outcomes for rivers and energy. Our findings show that system-scale solutions have the global potential to maintain connectivity on more than 100,000 km of river while reaching equivalent energy development levels.
Global hydropower capacity is projected to approximately double from the 2010 installed capacity of 1,000 gigawatts (GW). This expansion would require a dramatic increase in the number of hydropower dams in river basins around the world, including many basins that still have natural, free-flowing rivers. Although hydropower can play an important role in a low-carbon energy future, a doubling of hydropower capacity risks many other values that rivers provide, including fisheries and flood-recession agriculture that feed hundreds of millions of people. “The Power of Rivers” explores the potential for achieving more balanced outcomes from hydropower development.
The risks we face if hydropower is not developed and managed sustainablyWe used a global database of future hydropower dams—both under construction and planned—to estimate potential future impacts from hydropower expansion. We modeled impacts to river flow patterns and the loss of connectivity in channel networks due to fragmentation from dams. Our results indicate that:
• Completion of those hydropower dams currently under construction and those that are planned will affect 300,000 km of rivers through fragmentation or changes to river flow patterns.
• These impacts are projected to occur in many of the river basins with the greatest freshwater fish harvests. Further, nearly 70 percent of all affected kilometers will occur in freshwater ecoregions with the greatest diversity of fish species. Within these high diversity basins, this represents a 22 percent decline in kilometers of river not affected by dams.
A different path: Hydropower by DesignBetter outcomes for hydropower development are possible—outcomes that are more balanced across social, environmental and economic values.
More-balanced outcomes can occur at the scale of individual dams (design and operation), as well as in the planning and siting of new dams. We call the integration of these scales to pursue balanced outcomes “Hydropower by Design,” which strives to:
• Avoid the most damaging sites and direct development toward sites that will have lower impacts;
• Minimize impacts and restore key processes through better design and operation of individual dams; and
• Offset those impacts that cannot be avoided, minimized, or restored by investing in compensation such as protection and management of nearby rivers that provide similar values.
We acknowledge that hydropower development is guided by rigorous design at various levels; Hydropower by Design is our contribution to these design and planning processes, focused on more effective integration of conservation into hydropower. In this paper, we focused on the potential for Hydropower by Design to identify spatial arrangements of dams that can maximize the length of connected river channels for a given level of development. (Here we use connected channels as a proxy for rivers that can still support natural functions.)
T H E P O W E R O F R I V E R S10
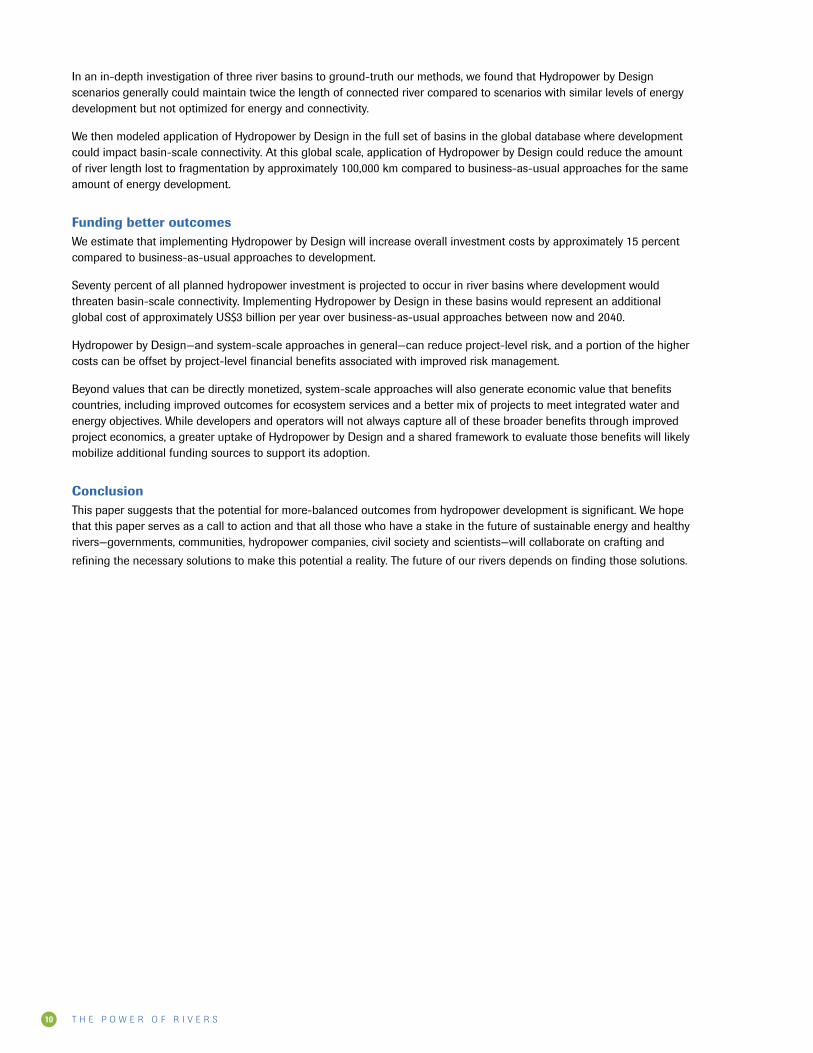
In an in-depth investigation of three river basins to ground-truth our methods, we found that Hydropower by Design scenarios generally could maintain twice the length of connected river compared to scenarios with similar levels of energy development but not optimized for energy and connectivity.
We then modeled application of Hydropower by Design in the full set of basins in the global database where development could impact basin-scale connectivity. At this global scale, application of Hydropower by Design could reduce the amount of river length lost to fragmentation by approximately 100,000 km compared to business-as-usual approaches for the same amount of energy development.
Funding better outcomesWe estimate that implementing Hydropower by Design will increase overall investment costs by approximately 15 percent compared to business-as-usual approaches to development.
Seventy percent of all planned hydropower investment is projected to occur in river basins where development would threaten basin-scale connectivity. Implementing Hydropower by Design in these basins would represent an additional global cost of approximately US$3 billion per year over business-as-usual approaches between now and 2040.
Hydropower by Design—and system-scale approaches in general—can reduce project-level risk, and a portion of the higher costs can be offset by project-level financial benefits associated with improved risk management.
Beyond values that can be directly monetized, system-scale approaches will also generate economic value that benefits countries, including improved outcomes for ecosystem services and a better mix of projects to meet integrated water and energy objectives. While developers and operators will not always capture all of these broader benefits through improved project economics, a greater uptake of Hydropower by Design and a shared framework to evaluate those benefits will likely mobilize additional funding sources to support its adoption.
ConclusionThis paper suggests that the potential for more-balanced outcomes from hydropower development is significant. We hope that this paper serves as a call to action and that all those who have a stake in the future of sustainable energy and healthy rivers—governments, communities, hydropower companies, civil society and scientists—will collaborate on crafting and
refining the necessary solutions to make this potential a reality. The future of our rivers depends on finding those solutions.
T H E P O W E R O F R I V E R S 11
FINDING BALANCE BETWEEN ENERGY AND CONSERVATION IN
HYDROPOWER DEVELOPMENT
The Power of Rivers
Photo: ©Patrick McCarthy
T H E P O W E R O F R I V E R S12
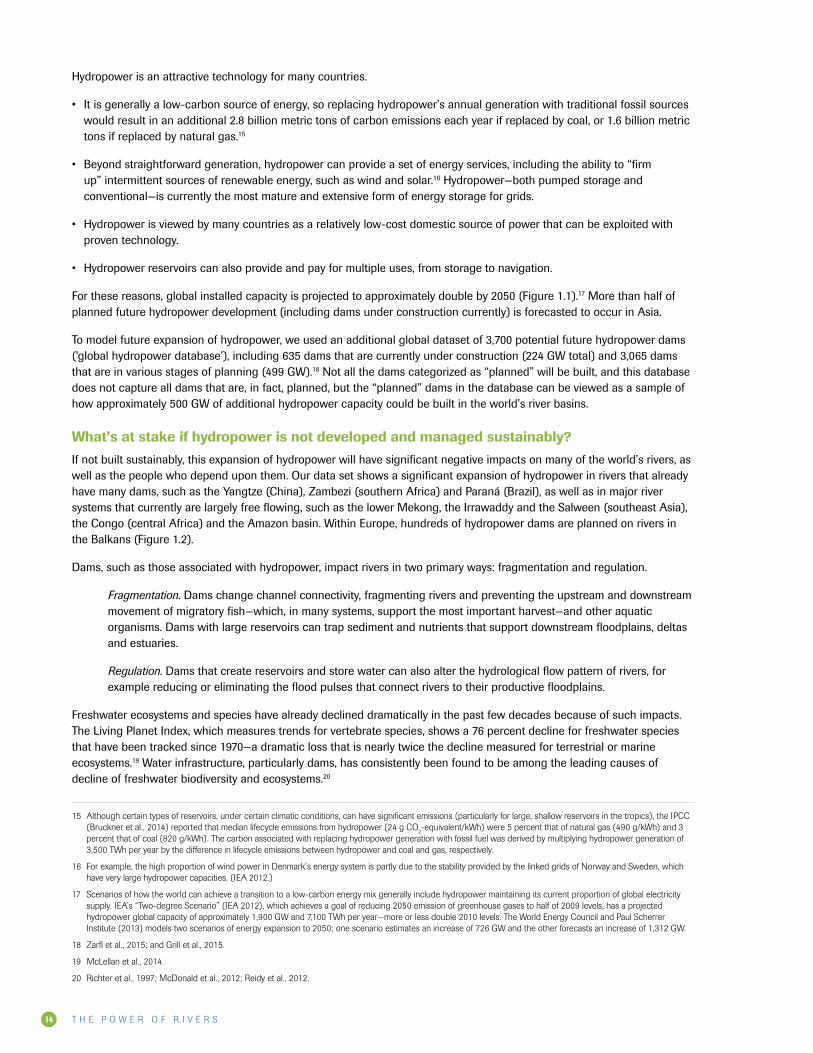
PrologueFree-flowing rivers around the world are under threat. The need for power to grow economies is driving one of the most rapid expansions of hydropower dams the world has ever seen. Due to the impact of hydropower dams on rivers, floodplains and deltas, some of the most diverse and productive ecosystems in the world are at risk of being lost between now and 2050. It does not need to be this way.
In this white paper, we propose solutions to achieve more-balanced outcomes. This report is not about whether hydropower dams should be built. Deciding whether and how much hydropower to build and what type is a critical question facing many countries today, one based on a broad range of considerations that vary by geography and time. We do not try to recommend a specific level of hydropower development—in a country or in the world—but, instead, focus on the potential for more sustainable outcomes across a range of development pathways.
This paper is intended to illustrate to those who make decisions about hydropower—governments, funders and developers—how the imperative to develop and to provide power to people can be reconciled with preserving the values of free-flowing rivers. It is not a perfect answer, but it is a possible answer, and, we hope, the beginning of a constructive dialogue that will lead us to achieving the goals of increasing access to sustainable energy and saving or restoring many of the great rivers of the planet.
The value of free-flowing riversFree-flowing rivers are a fundamental resource for the world. Rivers represent less than 1 percent of the Earth’s surface but are among the most productive and diverse ecosystems on the planet. Nearly half of all fish species on Earth can be found in rivers and hundreds of millions of people depend on food produced from rivers that are free flowing.1
Free-flowing rivers drive the productivity of floodplains and deltas, and these ecosystems are the most important sources of freshwater fish harvests around the world. Capture fisheries harvest an estimated 14-32 million tons of fish and other aquatic species annually from river-floodplain systems, providing enough protein to feed 225-550 million people on a fish-dominated diet.2 Along rivers that remain free flowing, people take advantage of annual floods for “flood-recession” agriculture—both crops and grazing land.3 Rivers also carry nutrients that are crucial for maintaining the wild capture harvests from estuaries and deltas, some of the most productive areas for marine fisheries, comprising 16 percent of the 90-million-ton marine harvest—some 14 million tons.4
To establish a current baseline of dams and rivers, we used a global database that includes 2.8 million km of river channels5 and more than 6,800 existing dams.6 Of these river kilometers, 2 million can be considered currently unaffected by dams, in that they are not fragmented by dams and do not have a flow regime regulated by upstream reservoirs.7 More than 200,000 of those unaffected river kilometers are near or above the Arctic Circle. Approximately 950,000 unaffected kilometers are in river systems that support high levels of freshwater species diversity.8
1 In this paper we use “free-flowing rivers” to describe rivers that retain much or all of key characteristics, such as connectivity and a natural flow regime, which support ecosystems and values for people. We note that scientists are currently striving to develop a consistent definition to identify what constitute a “free-flowing” river. Most river basins exist on a continuum from truly free flowing to heavily altered and managed. Here we use “free flowing” to describe rivers that encompass both truly unaltered rivers to those with some development, but that still retain much of their free-flowing character and can still produce much of the benefits—e.g., robust populations of migratory fish or productive flood-recession agriculture—typical of natural rivers.
2 For example, Dugan et al., (2010) reports a global annual inland fishery harvest of 14 million tons. However, inland fisheries are generally dramatically under-reported in official statistics. Lymer (2015) estimates that harvest from floodplains could be as high as 32 million tons per year. Cambodia is considered a nation that strongly depends on freshwater fish harvests, largely from the Mekong River and its floodplains, with annual per capita consumption of 63 kg (IFReDI, 2013). Using the lower estimate of 14 million tons would translate to feeding 225 million people at a consumption rate similar to Cambodia’s, while the higher estimate would translate to approximately twice that number of people.
3 Though global estimates have not been made for the number of people fed by flood-recession agriculture and grazing, the number is likely in the hundreds of millions (see Richter et al., 2010), with examples such as 1.5 million people who depend on the Hadejia-Nguru Wetlands of Nigeria, 364,000 people who rely on flood-recession agriculture on the Senegal River and 100,000 who rely on flood-recession agriculture on the Omo River (Ethiopia).
4 Gilson, 2011; Houde and Rutherford, 1993.
5 In this paper we define rivers as channels with a mean annual flow (MAF) > 10 cubic meters per second (cms), and so, by this definition, the length of river channels includes not only the main-stem river in each basin but any tributary that has a MAF > 10 cms.
6 Global Reservoir and Dams (GRanD) database; see Lehner et al., 2011.
7 Note that this database does not include every dam (either from missing data or because the database focused on dams with a reservoir > 0.1 km3) and thus some of what we refer to as “unaffected” may in fact be affected by small dams or dams missing from the database, or from other sources of impact (e.g., land use, pollution and levees). Note that the GRanD database includes all types of dams, not just hydropower dams. Although this paper’s future projections focus on hydropower dams, the current baseline reflects the landscape as affected by all dams. We decided this was a more realistic baseline (i.e., it would not be accurate to ignore the effect of non-hydropower dams on current connectivity and flow regulation conditions).
8 We used the Freshwater Ecoregions of the World (Abell et al., 2008) and divided the freshwater ecoregions based on fish species richness. Ecoregions in the top quartile of fish species richness contain 1,270,000 km of river, with 950,000 of that currently unaffected by dams.
T H E P O W E R O F R I V E R S 13
The expansion of hydropowerThe resources provided by damming and regulating river flows are also fundamental for global and local economies. River flows managed for irrigation support nearly 25 percent of the world’s crop production.9 Access to energy is a fundamental driver of economic growth, and during the next two decades, rivers around the world, including many currently free-flowing rivers, are predicted to undergo development of hydropower dams that could double current global capacity. Along with dams built for other purposes—irrigation, water supply and flood control—or for multiple purposes, this expansion of hydropower dams will be one of the biggest drivers of change to global rivers.10
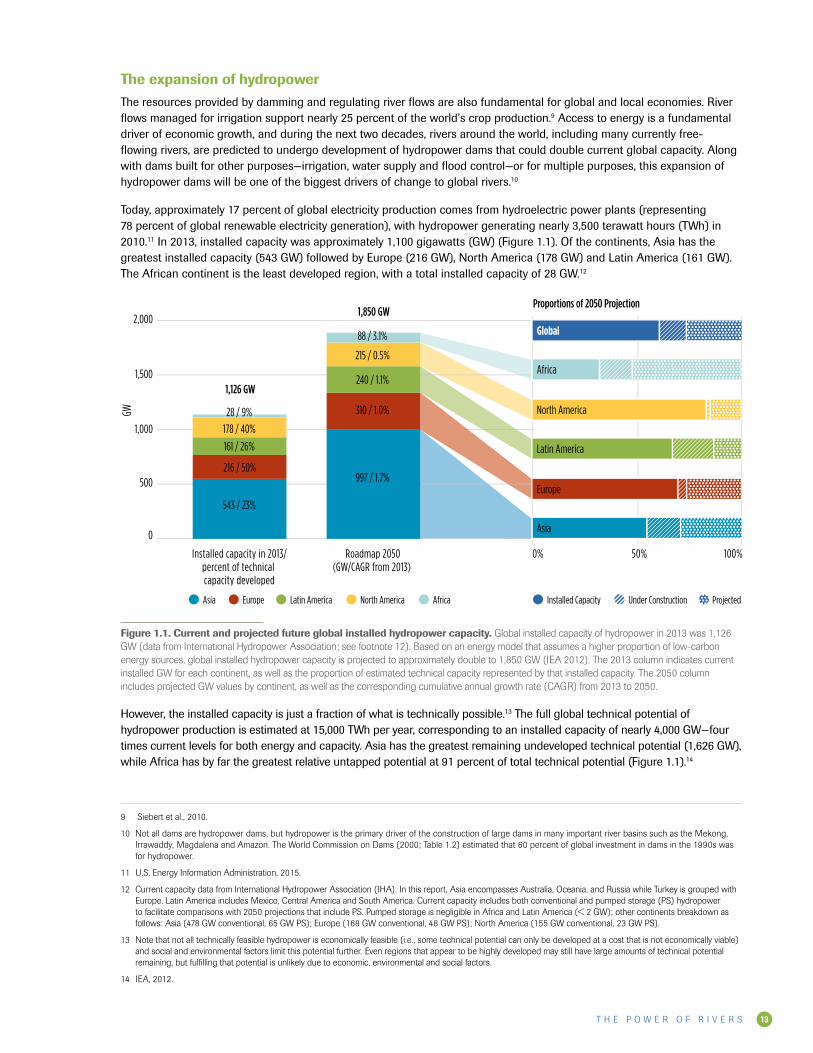
Today, approximately 17 percent of global electricity production comes from hydroelectric power plants (representing 78 percent of global renewable electricity generation), with hydropower generating nearly 3,500 terawatt hours (TWh) in 2010.11 In 2013, installed capacity was approximately 1,100 gigawatts (GW) (Figure 1.1). Of the continents, Asia has the greatest installed capacity (543 GW) followed by Europe (216 GW), North America (178 GW) and Latin America (161 GW). The African continent is the least developed region, with a total installed capacity of 28 GW.12
Asia
GW
Europe Latin America North America Africa
Proportions of 2050 Projection
0
500
1,000
1,500
2,000
Installed capacity in 2013/percent of technical capacity developed
Roadmap 2050(GW/CAGR from 2013)
0% 100%50%
Asia
Europe
Latin America
North America
Africa
Global
Installed Capacity ProjectedUnder Construction
543 / 23%
216 / 50%
161 / 26%
178 / 40%
1,126 GW
28 / 9%
997 / 1.7%
310 / 1.0%
240 / 1.1%
215 / 0.5%
1,850 GW
88 / 3.1%
Figure 1.1. Current and projected future global installed hydropower capacity. Global installed capacity of hydropower in 2013 was 1,126 GW (data from International Hydropower Association; see footnote 12). Based on an energy model that assumes a higher proportion of low-carbon energy sources, global installed hydropower capacity is projected to approximately double to 1,850 GW (IEA 2012). The 2013 column indicates current installed GW for each continent, as well as the proportion of estimated technical capacity represented by that installed capacity. The 2050 column includes projected GW values by continent, as well as the corresponding cumulative annual growth rate (CAGR) from 2013 to 2050.
However, the installed capacity is just a fraction of what is technically possible.13 The full global technical potential of hydropower production is estimated at 15,000 TWh per year, corresponding to an installed capacity of nearly 4,000 GW—four times current levels for both energy and capacity. Asia has the greatest remaining undeveloped technical potential (1,626 GW), while Africa has by far the greatest relative untapped potential at 91 percent of total technical potential (Figure 1.1).14
9 Siebert et al., 2010.
10 Not all dams are hydropower dams, but hydropower is the primary driver of the construction of large dams in many important river basins such as the Mekong, Irrawaddy, Magdalena and Amazon. The World Commission on Dams (2000; Table 1.2) estimated that 60 percent of global investment in dams in the 1990s was for hydropower.
11 U.S. Energy Information Administration, 2015.
12 Current capacity data from International Hydropower Association (IHA). In this report, Asia encompasses Australia, Oceania, and Russia while Turkey is grouped with Europe. Latin America includes Mexico, Central America and South America. Current capacity includes both conventional and pumped storage (PS) hydropower to facilitate comparisons with 2050 projections that include PS. Pumped storage is negligible in Africa and Latin America (< 2 GW); other continents breakdown as follows: Asia (478 GW conventional, 65 GW PS); Europe (168 GW conventional, 48 GW PS); North America (155 GW conventional, 23 GW PS).
13 Note that not all technically feasible hydropower is economically feasible (i.e., some technical potential can only be developed at a cost that is not economically viable) and social and environmental factors limit this potential further. Even regions that appear to be highly developed may still have large amounts of technical potential remaining, but fulfilling that potential is unlikely due to economic, environmental and social factors.
14 IEA, 2012.
T H E P O W E R O F R I V E R S14
Hydropower is an attractive technology for many countries.
• It is generally a low-carbon source of energy, so replacing hydropower’s annual generation with traditional fossil sources would result in an additional 2.8 billion metric tons of carbon emissions each year if replaced by coal, or 1.6 billion metric tons if replaced by natural gas.15
• Beyond straightforward generation, hydropower can provide a set of energy services, including the ability to “firm up” intermittent sources of renewable energy, such as wind and solar.16 Hydropower—both pumped storage and conventional—is currently the most mature and extensive form of energy storage for grids.
• Hydropower is viewed by many countries as a relatively low-cost domestic source of power that can be exploited with proven technology.
• Hydropower reservoirs can also provide and pay for multiple uses, from storage to navigation.
For these reasons, global installed capacity is projected to approximately double by 2050 (Figure 1.1).17 More than half of planned future hydropower development (including dams under construction currently) is forecasted to occur in Asia.
To model future expansion of hydropower, we used an additional global dataset of 3,700 potential future hydropower dams (‘global hydropower database’), including 635 dams that are currently under construction (224 GW total) and 3,065 dams that are in various stages of planning (499 GW).18 Not all the dams categorized as “planned” will be built, and this database does not capture all dams that are, in fact, planned, but the “planned” dams in the database can be viewed as a sample of how approximately 500 GW of additional hydropower capacity could be built in the world’s river basins.
What’s at stake if hydropower is not developed and managed sustainably?If not built sustainably, this expansion of hydropower will have significant negative impacts on many of the world’s rivers, as well as the people who depend upon them. Our data set shows a significant expansion of hydropower in rivers that already have many dams, such as the Yangtze (China), Zambezi (southern Africa) and Paraná (Brazil), as well as in major river systems that currently are largely free flowing, such as the lower Mekong, the Irrawaddy and the Salween (southeast Asia), the Congo (central Africa) and the Amazon basin. Within Europe, hundreds of hydropower dams are planned on rivers in the Balkans (Figure 1.2).
Dams, such as those associated with hydropower, impact rivers in two primary ways: fragmentation and regulation.
Fragmentation. Dams change channel connectivity, fragmenting rivers and preventing the upstream and downstream movement of migratory fish—which, in many systems, support the most important harvest—and other aquatic organisms. Dams with large reservoirs can trap sediment and nutrients that support downstream floodplains, deltas and estuaries.
Regulation. Dams that create reservoirs and store water can also alter the hydrological flow pattern of rivers, for example reducing or eliminating the flood pulses that connect rivers to their productive floodplains.
Freshwater ecosystems and species have already declined dramatically in the past few decades because of such impacts. The Living Planet Index, which measures trends for vertebrate species, shows a 76 percent decline for freshwater species that have been tracked since 1970—a dramatic loss that is nearly twice the decline measured for terrestrial or marine ecosystems.19 Water infrastructure, particularly dams, has consistently been found to be among the leading causes of decline of freshwater biodiversity and ecosystems.20
15 Although certain types of reservoirs, under certain climatic conditions, can have significant emissions (particularly for large, shallow reservoirs in the tropics), the IPCC (Bruckner et al., 2014) reported that median lifecycle emissions from hydropower (24 g CO2-equivalent/kWh) were 5 percent that of natural gas (490 g/kWh) and 3 percent that of coal (820 g/kWh). The carbon associated with replacing hydropower generation with fossil fuel was derived by multiplying hydropower generation of 3,500 TWh per year by the difference in lifecycle emissions between hydropower and coal and gas, respectively.
16 For example, the high proportion of wind power in Denmark’s energy system is partly due to the stability provided by the linked grids of Norway and Sweden, which have very large hydropower capacities. (IEA 2012.)
17 Scenarios of how the world can achieve a transition to a low-carbon energy mix generally include hydropower maintaining its current proportion of global electricity supply. IEA’s “Two-degree Scenario” (IEA 2012), which achieves a goal of reducing 2050 emission of greenhouse gases to half of 2009 levels, has a projected hydropower global capacity of approximately 1,900 GW and 7,100 TWh per year—more or less double 2010 levels. The World Energy Council and Paul Scherrer Institute (2013) models two scenarios of energy expansion to 2050; one scenario estimates an increase of 726 GW and the other forecasts an increase of 1,312 GW.
18 Zarfl et al., 2015; and Grill et al., 2015.
19 McLellan et al., 2014.
20 Richter et al., 1997; McDonald et al., 2012; Reidy et al., 2012.
T H E P O W E R O F R I V E R S 15
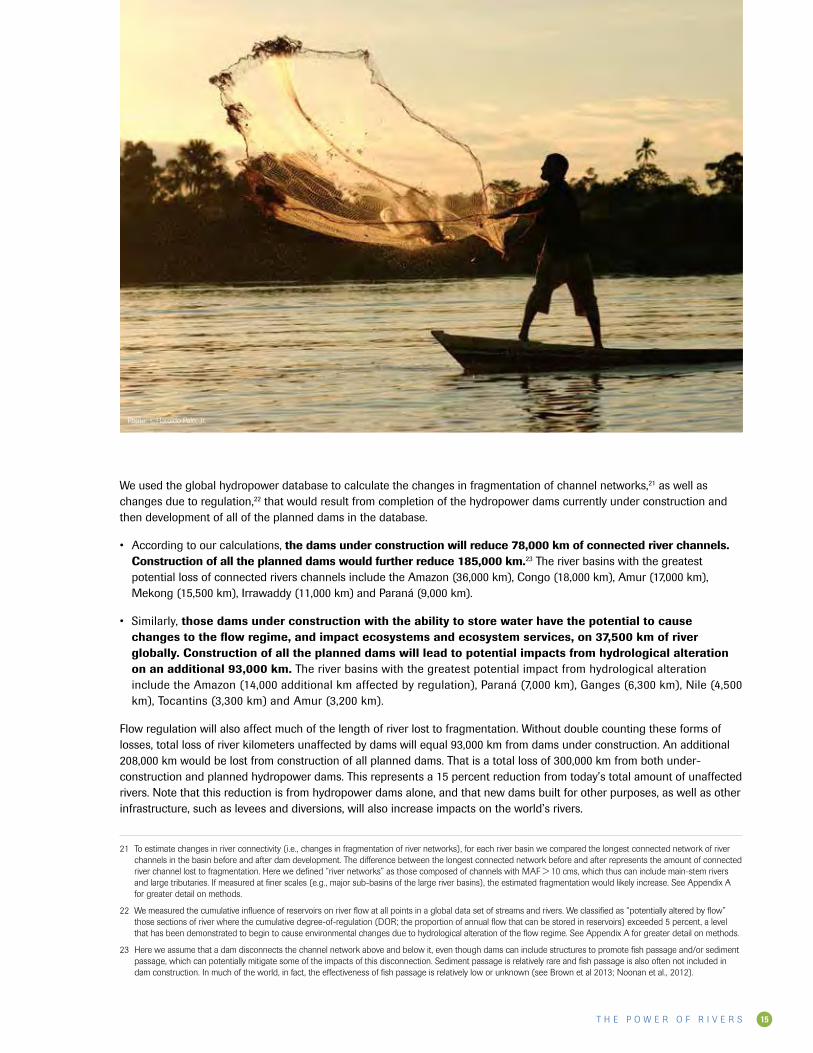
We used the global hydropower database to calculate the changes in fragmentation of channel networks,21 as well as changes due to regulation,22 that would result from completion of the hydropower dams currently under construction and then development of all of the planned dams in the database.
• According to our calculations, the dams under construction will reduce 78,000 km of connected river channels. Construction of all the planned dams would further reduce 185,000 km.23 The river basins with the greatest potential loss of connected rivers channels include the Amazon (36,000 km), Congo (18,000 km), Amur (17,000 km), Mekong (15,500 km), Irrawaddy (11,000 km) and Paraná (9,000 km).
• Similarly, those dams under construction with the ability to store water have the potential to cause changes to the flow regime, and impact ecosystems and ecosystem services, on 37,500 km of river globally. Construction of all the planned dams will lead to potential impacts from hydrological alteration on an additional 93,000 km. The river basins with the greatest potential impact from hydrological alteration include the Amazon (14,000 additional km affected by regulation), Paraná (7,000 km), Ganges (6,300 km), Nile (4,500 km), Tocantins (3,300 km) and Amur (3,200 km).
Flow regulation will also affect much of the length of river lost to fragmentation. Without double counting these forms of losses, total loss of river kilometers unaffected by dams will equal 93,000 km from dams under construction. An additional 208,000 km would be lost from construction of all planned dams. That is a total loss of 300,000 km from both under-construction and planned hydropower dams. This represents a 15 percent reduction from today’s total amount of unaffected rivers. Note that this reduction is from hydropower dams alone, and that new dams built for other purposes, as well as other infrastructure, such as levees and diversions, will also increase impacts on the world’s rivers.
21 To estimate changes in river connectivity (i.e., changes in fragmentation of river networks), for each river basin we compared the longest connected network of river channels in the basin before and after dam development. The difference between the longest connected network before and after represents the amount of connected river channel lost to fragmentation. Here we defined “river networks” as those composed of channels with MAF > 10 cms, which thus can include main-stem rivers and large tributaries. If measured at finer scales (e.g., major sub-basins of the large river basins), the estimated fragmentation would likely increase. See Appendix A for greater detail on methods.
22 We measured the cumulative influence of reservoirs on river flow at all points in a global data set of streams and rivers. We classified as “potentially altered by flow” those sections of river where the cumulative degree-of-regulation (DOR; the proportion of annual flow that can be stored in reservoirs) exceeded 5 percent, a level that has been demonstrated to begin to cause environmental changes due to hydrological alteration of the flow regime. See Appendix A for greater detail on methods.
23 Here we assume that a dam disconnects the channel network above and below it, even though dams can include structures to promote fish passage and/or sediment passage, which can potentially mitigate some of the impacts of this disconnection. Sediment passage is relatively rare and fish passage is also often not included in dam construction. In much of the world, in fact, the effectiveness of fish passage is relatively low or unknown (see Brown et al 2013; Noonan et al., 2012).
Photo: ©Haroldo Palo, Jr.
T H E P O W E R O F R I V E R S16
Congo
Amazon
Paraná
Total GW = 17.6
Total GW = 310
Total GW = 215
Total GW = 240
Total GW = 88
Total GW = 1,850
Total GW = 99.3
Total GW = 57.2
Total GW = 14.9
Total GW = 48.9
Total GW = 17.5
Mekong
Magdalena
Irrawaddy
Asia
Africa
Latin America
Europe
Nile
Zambezi GLOBAL
Total GW = 53.3
Total GW = 169
Total GW = 997
Total GW = 19.9
Yangtze
North America
FEOWs affected (159)
Increase fragmenta�onFish diversity weak moderate heavy severe
very high 7 10 8 10
high 5 3 16 11medium 21 29 12 18
low 3 2 2 2
Substan�al future dam effects in very high biodiversityecoregion (black outlinesin map)
Fish
diversi
ty
IncreaseRFI
weak
no change
moderate
heavy
severe
lowmediumhigh
very
high
no dams
Figure 1.2
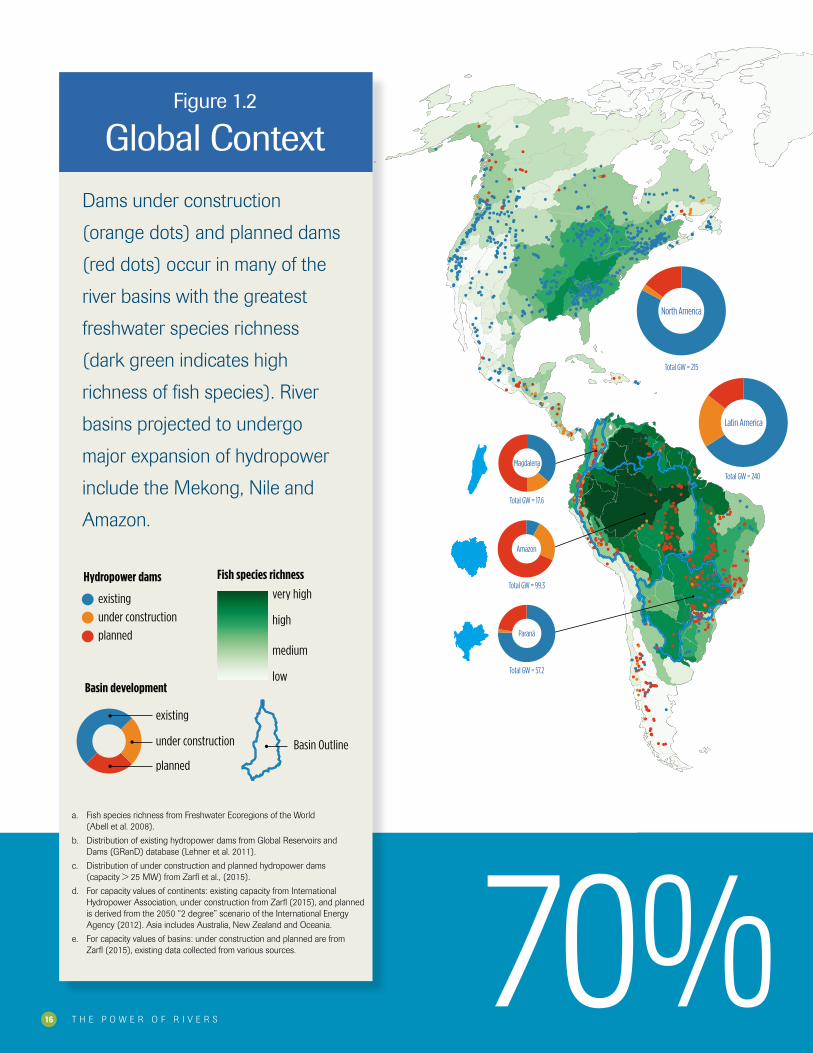
Global Context
Dams under construction
(orange dots) and planned dams
(red dots) occur in many of the
river basins with the greatest
freshwater species richness
(dark green indicates high
richness of fish species). River
basins projected to undergo
major expansion of hydropower
include the Mekong, Nile and
Amazon.
plannedunder constructionexisting
Hydropower dams
planned
Basin Outline
under construction
existing
Basin development
low
medium
high
very high
Fish species richness
plannedunder constructionexisting
Hydropower dams
planned
Basin Outline
under construction
existing
Basin development
low
medium
high
very high
Fish species richness
plannedunder constructionexisting
Hydropower dams
planned
Basin Outline
under construction
existing
Basin development
low
medium
high
very high
Fish species richness
70%a. Fish species richness from Freshwater Ecoregions of the World
(Abell et al. 2008).
b. Distribution of existing hydropower dams from Global Reservoirs and Dams (GRanD) database (Lehner et al. 2011).
c. Distribution of under construction and planned hydropower dams (capacity > 25 MW) from Zarfl et al., (2015).
d. For capacity values of continents: existing capacity from International Hydropower Association, under construction from Zarfl (2015), and planned is derived from the 2050 “2 degree” scenario of the International Energy Agency (2012). Asia includes Australia, New Zealand and Oceania.
e. For capacity values of basins: under construction and planned are from Zarfl (2015), existing data collected from various sources.
T H E P O W E R O F R I V E R S16
T H E P O W E R O F R I V E R S 17
Congo
Amazon
Paraná
Total GW = 17.6
Total GW = 310
Total GW = 215
Total GW = 240
Total GW = 88
Total GW = 1,850
Total GW = 99.3
Total GW = 57.2
Total GW = 14.9
Total GW = 48.9
Total GW = 17.5
Mekong
Magdalena
Irrawaddy
Asia
Africa
Latin America
Europe
Nile
Zambezi GLOBAL
Total GW = 53.3
Total GW = 169
Total GW = 997
Total GW = 19.9
Yangtze
North America
FEOWs affected (159)
Increase fragmenta�onFish diversity weak moderate heavy severe
very high 7 10 8 10
high 5 3 16 11medium 21 29 12 18
low 3 2 2 2
Substan�al future dam effects in very high biodiversityecoregion (black outlinesin map)
Fish
diversi
ty
IncreaseRFI
weak
no change
moderate
heavy
severe
lowmediumhigh
very
high
no dams
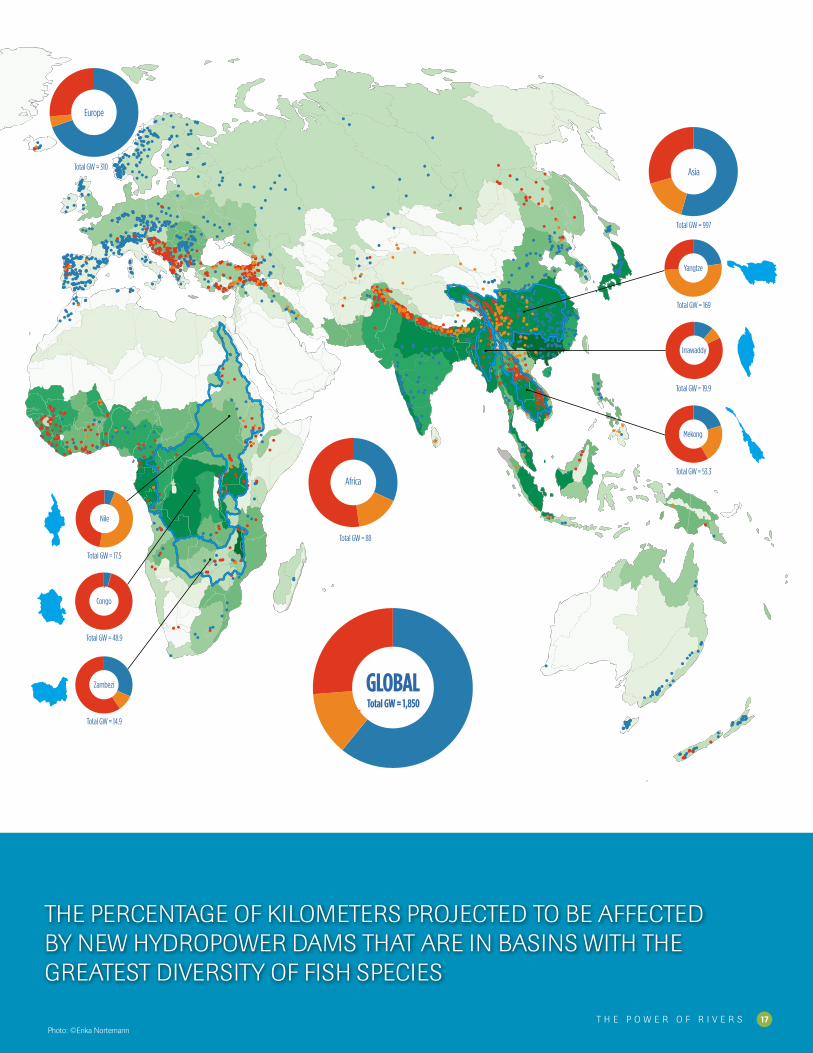
THE PERCENTAGE OF KILOMETERS PROJECTED TO BE AFFECTED BY NEW HYDROPOWER DAMS THAT ARE IN BASINS WITH THE GREATEST DIVERSITY OF FISH SPECIES
Photo: ©Erika NortemannT H E P O W E R O F R I V E R S 17
T H E P O W E R O F R I V E R S18
Figure 1.3a.
Construction Planned 2040
200
0
400
600
800
1,000
100
300
500
700
900
KM (1
,000)
2010
Lorem ipsum dolor Sitamus
-22%
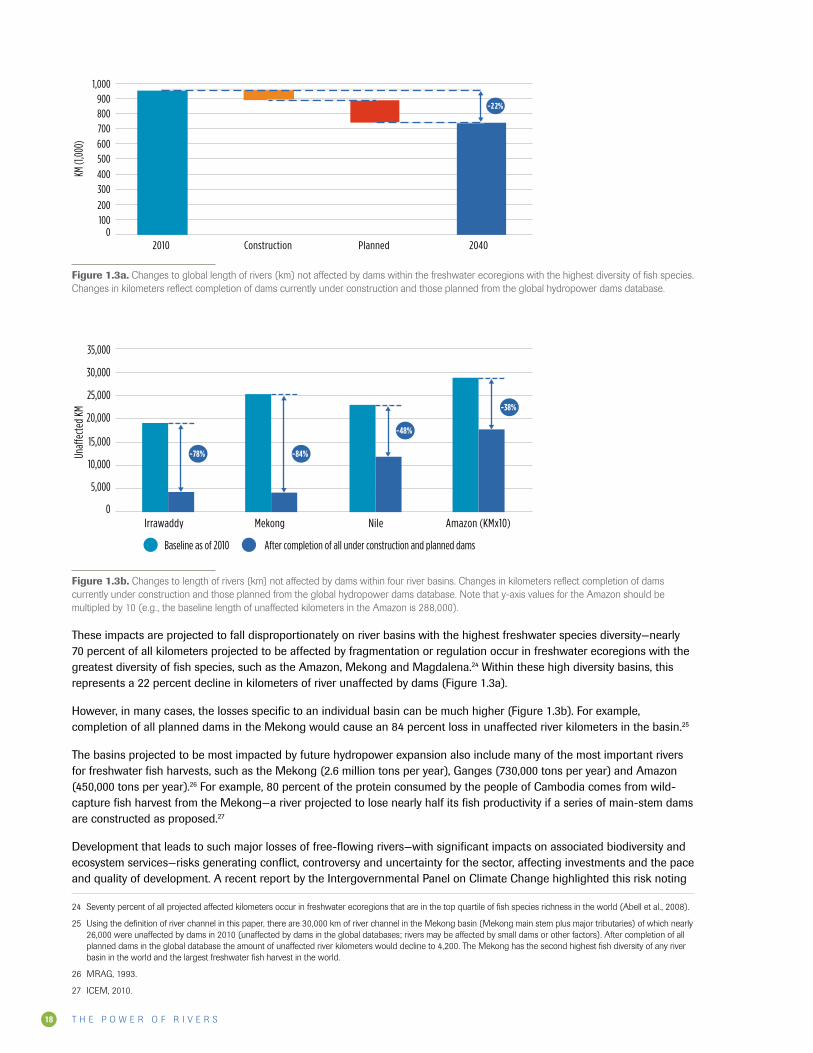
Figure 1.3a. Changes to global length of rivers (km) not affected by dams within the freshwater ecoregions with the highest diversity of fish species. Changes in kilometers reflect completion of dams currently under construction and those planned from the global hydropower dams database.
Figure 1.3b.
Mekong Nile Amazon (KMx10)
5,000
0
10,000
15,000
20,000
25,000
30,000
35,000
Una�
ecte
d KM
Irrawaddy
-38%
-78% -84%
-48%
Baseline as of 2010 After completion of all under construction and planned dams
Figure 1.3b. Changes to length of rivers (km) not affected by dams within four river basins. Changes in kilometers reflect completion of dams currently under construction and those planned from the global hydropower dams database. Note that y-axis values for the Amazon should be multipled by 10 (e.g., the baseline length of unaffected kilometers in the Amazon is 288,000).
These impacts are projected to fall disproportionately on river basins with the highest freshwater species diversity—nearly 70 percent of all kilometers projected to be affected by fragmentation or regulation occur in freshwater ecoregions with the greatest diversity of fish species, such as the Amazon, Mekong and Magdalena.24 Within these high diversity basins, this represents a 22 percent decline in kilometers of river unaffected by dams (Figure 1.3a).
However, in many cases, the losses specific to an individual basin can be much higher (Figure 1.3b). For example, completion of all planned dams in the Mekong would cause an 84 percent loss in unaffected river kilometers in the basin.25
The basins projected to be most impacted by future hydropower expansion also include many of the most important rivers for freshwater fish harvests, such as the Mekong (2.6 million tons per year), Ganges (730,000 tons per year) and Amazon (450,000 tons per year).26 For example, 80 percent of the protein consumed by the people of Cambodia comes from wild-capture fish harvest from the Mekong—a river projected to lose nearly half its fish productivity if a series of main-stem dams are constructed as proposed.27
Development that leads to such major losses of free-flowing rivers—with significant impacts on associated biodiversity and ecosystem services—risks generating conflict, controversy and uncertainty for the sector, affecting investments and the pace and quality of development. A recent report by the Intergovernmental Panel on Climate Change highlighted this risk noting
24 Seventy percent of all projected affected kilometers occur in freshwater ecoregions that are in the top quartile of fish species richness in the world (Abell et al., 2008).
25 Using the definition of river channel in this paper, there are 30,000 km of river channel in the Mekong basin (Mekong main stem plus major tributaries) of which nearly 26,000 were unaffected by dams in 2010 (unaffected by dams in the global databases; rivers may be affected by small dams or other factors). After completion of all planned dams in the global database the amount of unaffected river kilometers would decline to 4,200. The Mekong has the second highest fish diversity of any river basin in the world and the largest freshwater fish harvest in the world.
26 MRAG, 1993.
27 ICEM, 2010.
T H E P O W E R O F R I V E R S 19
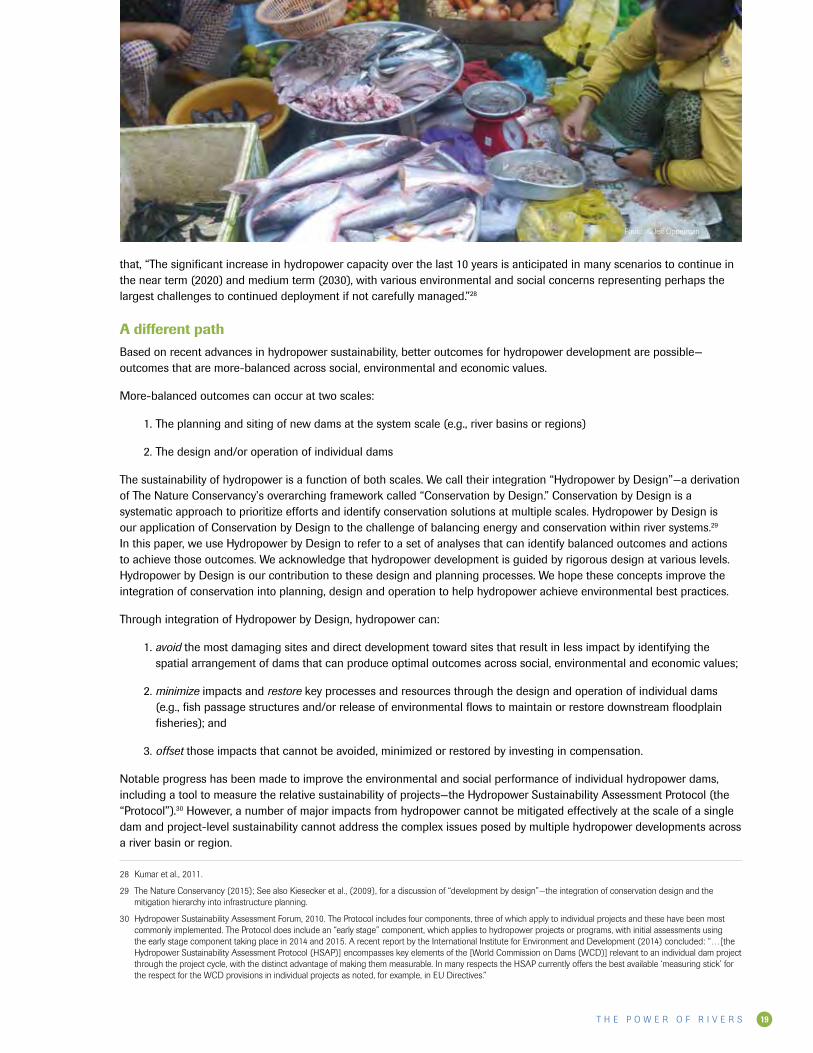
that, “The significant increase in hydropower capacity over the last 10 years is anticipated in many scenarios to continue in the near term (2020) and medium term (2030), with various environmental and social concerns representing perhaps the largest challenges to continued deployment if not carefully managed.”28
A different pathBased on recent advances in hydropower sustainability, better outcomes for hydropower development are possible—outcomes that are more-balanced across social, environmental and economic values.
More-balanced outcomes can occur at two scales:
1. The planning and siting of new dams at the system scale (e.g., river basins or regions)
2. The design and/or operation of individual dams
The sustainability of hydropower is a function of both scales. We call their integration “Hydropower by Design”—a derivation of The Nature Conservancy’s overarching framework called “Conservation by Design.” Conservation by Design is a systematic approach to prioritize efforts and identify conservation solutions at multiple scales. Hydropower by Design is our application of Conservation by Design to the challenge of balancing energy and conservation within river systems.29 In this paper, we use Hydropower by Design to refer to a set of analyses that can identify balanced outcomes and actions to achieve those outcomes. We acknowledge that hydropower development is guided by rigorous design at various levels. Hydropower by Design is our contribution to these design and planning processes. We hope these concepts improve the integration of conservation into planning, design and operation to help hydropower achieve environmental best practices.
Through integration of Hydropower by Design, hydropower can:
1. avoid the most damaging sites and direct development toward sites that result in less impact by identifying the spatial arrangement of dams that can produce optimal outcomes across social, environmental and economic values;
2. minimize impacts and restore key processes and resources through the design and operation of individual dams (e.g., fish passage structures and/or release of environmental flows to maintain or restore downstream floodplain fisheries); and
3. offset those impacts that cannot be avoided, minimized or restored by investing in compensation.
Notable progress has been made to improve the environmental and social performance of individual hydropower dams, including a tool to measure the relative sustainability of projects—the Hydropower Sustainability Assessment Protocol (the “Protocol”).30 However, a number of major impacts from hydropower cannot be mitigated effectively at the scale of a single dam and project-level sustainability cannot address the complex issues posed by multiple hydropower developments across a river basin or region.
28 Kumar et al., 2011.
29 The Nature Conservancy (2015); See also Kiesecker et al., (2009), for a discussion of “development by design”—the integration of conservation design and the mitigation hierarchy into infrastructure planning.
30 Hydropower Sustainability Assessment Forum, 2010. The Protocol includes four components, three of which apply to individual projects and these have been most commonly implemented. The Protocol does include an “early stage” component, which applies to hydropower projects or programs, with initial assessments using the early stage component taking place in 2014 and 2015. A recent report by the International Institute for Environment and Development (2014) concluded: “…[the Hydropower Sustainability Assessment Protocol (HSAP)] encompasses key elements of the [World Commission on Dams (WCD)] relevant to an individual dam project through the project cycle, with the distinct advantage of making them measurable. In many respects the HSAP currently offers the best available ‘measuring stick’ for the respect for the WCD provisions in individual projects as noted, for example, in EU Directives.”
Photo: ©Jeff Opperman
T H E P O W E R O F R I V E R S20
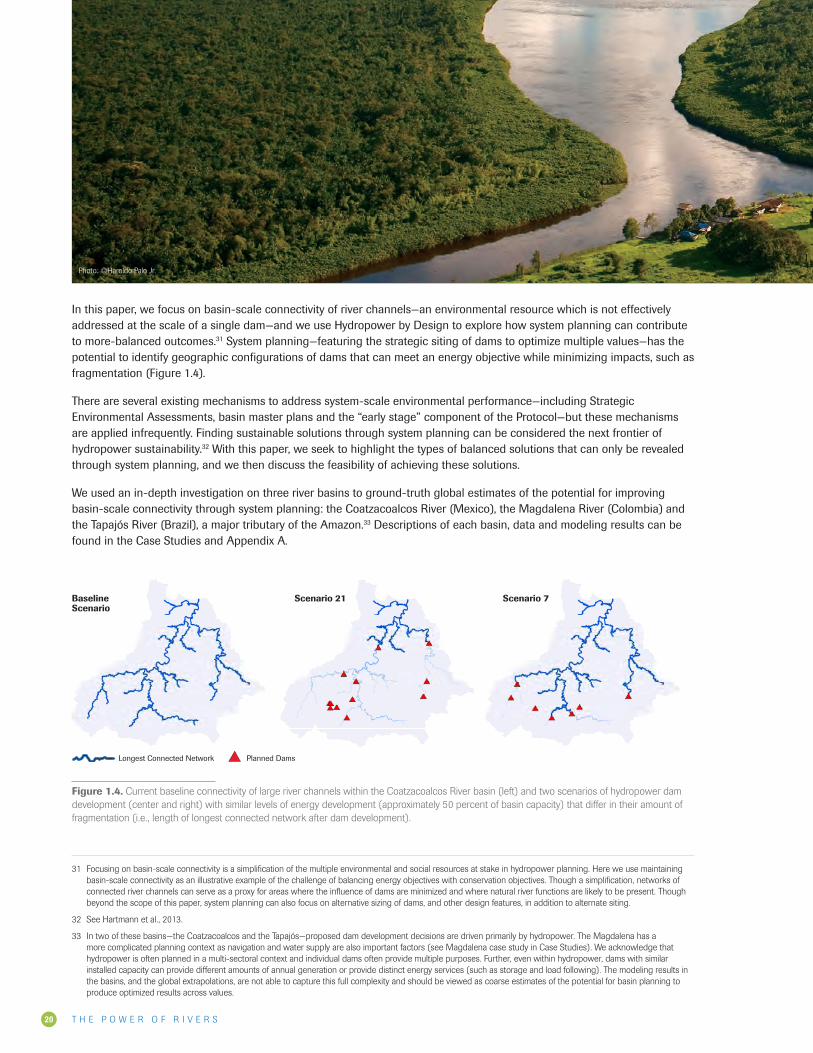
In this paper, we focus on basin-scale connectivity of river channels—an environmental resource which is not effectively addressed at the scale of a single dam—and we use Hydropower by Design to explore how system planning can contribute to more-balanced outcomes.31 System planning—featuring the strategic siting of dams to optimize multiple values—has the potential to identify geographic configurations of dams that can meet an energy objective while minimizing impacts, such as fragmentation (Figure 1.4).
There are several existing mechanisms to address system-scale environmental performance—including Strategic Environmental Assessments, basin master plans and the “early stage” component of the Protocol—but these mechanisms are applied infrequently. Finding sustainable solutions through system planning can be considered the next frontier of hydropower sustainability.32 With this paper, we seek to highlight the types of balanced solutions that can only be revealed through system planning, and we then discuss the feasibility of achieving these solutions.
We used an in-depth investigation on three river basins to ground-truth global estimates of the potential for improving basin-scale connectivity through system planning: the Coatzacoalcos River (Mexico), the Magdalena River (Colombia) and the Tapajós River (Brazil), a major tributary of the Amazon.33 Descriptions of each basin, data and modeling results can be found in the Case Studies and Appendix A.
Figure 1.4. Current baseline connectivity of large river channels within the Coatzacoalcos River basin (left) and two scenarios of hydropower dam development (center and right) with similar levels of energy development (approximately 50 percent of basin capacity) that differ in their amount of fragmentation (i.e., length of longest connected network after dam development).
31 Focusing on basin-scale connectivity is a simplification of the multiple environmental and social resources at stake in hydropower planning. Here we use maintaining basin-scale connectivity as an illustrative example of the challenge of balancing energy objectives with conservation objectives. Though a simplification, networks of connected river channels can serve as a proxy for areas where the influence of dams are minimized and where natural river functions are likely to be present. Though beyond the scope of this paper, system planning can also focus on alternative sizing of dams, and other design features, in addition to alternate siting.
32 See Hartmann et al., 2013.
33 In two of these basins—the Coatzacoalcos and the Tapajós—proposed dam development decisions are driven primarily by hydropower. The Magdalena has a more complicated planning context as navigation and water supply are also important factors (see Magdalena case study in Case Studies). We acknowledge that hydropower is often planned in a multi-sectoral context and individual dams often provide multiple purposes. Further, even within hydropower, dams with similar installed capacity can provide different amounts of annual generation or provide distinct energy services (such as storage and load following). The modeling results in the basins, and the global extrapolations, are not able to capture this full complexity and should be viewed as coarse estimates of the potential for basin planning to produce optimized results across values.
Scenario 8PlannedDams
LargestConnectedNetwork
Scenario 12PlannedDams
LargestConnectedNetwork
BaselineScenario
LargestConnectedNetwork
Longest Connected Network Planned Dams
Baseline Scenario
Scenario 21 Scenario 7
Photo: ©Haroldo Palo Jr.
T H E P O W E R O F R I V E R S 21
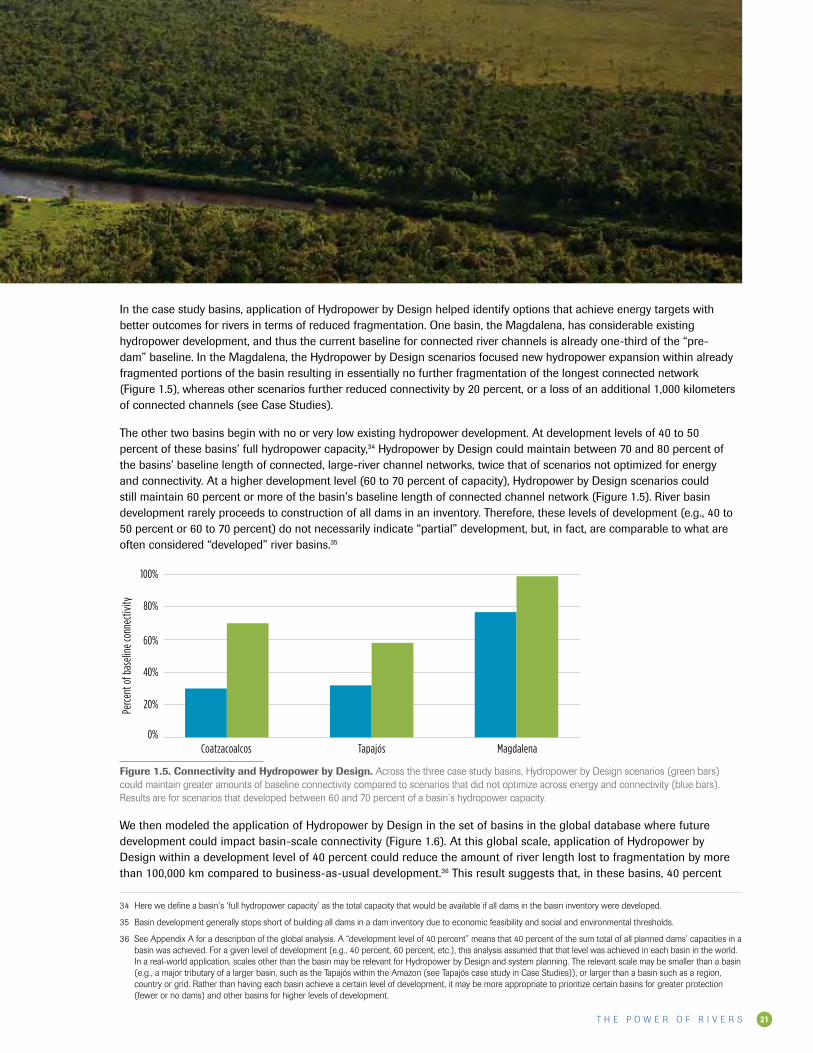
In the case study basins, application of Hydropower by Design helped identify options that achieve energy targets with better outcomes for rivers in terms of reduced fragmentation. One basin, the Magdalena, has considerable existing hydropower development, and thus the current baseline for connected river channels is already one-third of the “pre-dam” baseline. In the Magdalena, the Hydropower by Design scenarios focused new hydropower expansion within already fragmented portions of the basin resulting in essentially no further fragmentation of the longest connected network (Figure 1.5), whereas other scenarios further reduced connectivity by 20 percent, or a loss of an additional 1,000 kilometers of connected channels (see Case Studies).
The other two basins begin with no or very low existing hydropower development. At development levels of 40 to 50 percent of these basins’ full hydropower capacity,34 Hydropower by Design could maintain between 70 and 80 percent of the basins’ baseline length of connected, large-river channel networks, twice that of scenarios not optimized for energy and connectivity. At a higher development level (60 to 70 percent of capacity), Hydropower by Design scenarios could still maintain 60 percent or more of the basin’s baseline length of connected channel network (Figure 1.5). River basin development rarely proceeds to construction of all dams in an inventory. Therefore, these levels of development (e.g., 40 to 50 percent or 60 to 70 percent) do not necessarily indicate “partial” development, but, in fact, are comparable to what are often considered “developed” river basins.35 Figure 1.5.
Tapajós Magdalena
20%
0%
40%
60%
80%
100%
Perce
nt o
f bas
eline
conn
ectiv
ity
Coatzacoalcos
Hydropower by Design’ Not optimized for energy and connectivityFigure 1.5. Connectivity and Hydropower by Design. Across the three case study basins, Hydropower by Design scenarios (green bars) could maintain greater amounts of baseline connectivity compared to scenarios that did not optimize across energy and connectivity (blue bars). Results are for scenarios that developed between 60 and 70 percent of a basin’s hydropower capacity.
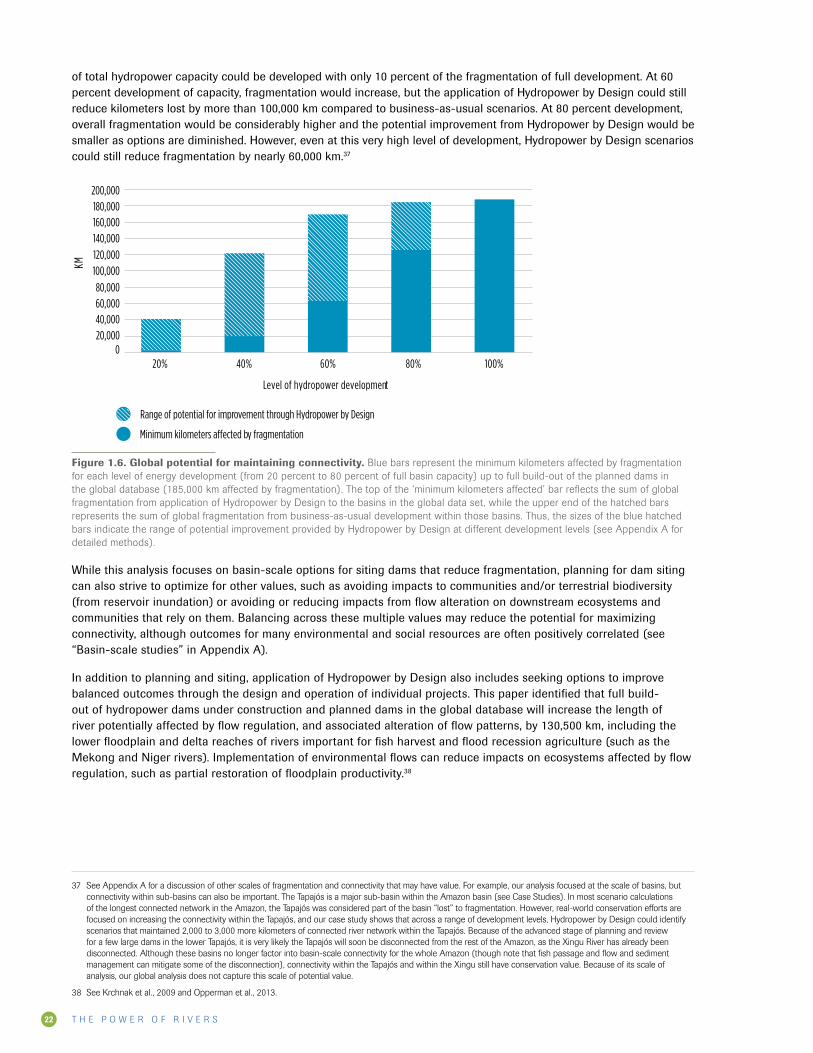
We then modeled the application of Hydropower by Design in the set of basins in the global database where future development could impact basin-scale connectivity (Figure 1.6). At this global scale, application of Hydropower by Design within a development level of 40 percent could reduce the amount of river length lost to fragmentation by more than 100,000 km compared to business-as-usual development.36 This result suggests that, in these basins, 40 percent
34 Here we define a basin’s ‘full hydropower capacity’ as the total capacity that would be available if all dams in the basin inventory were developed.
35 Basin development generally stops short of building all dams in a dam inventory due to economic feasibility and social and environmental thresholds.
36 See Appendix A for a description of the global analysis. A “development level of 40 percent” means that 40 percent of the sum total of all planned dams’ capacities in a basin was achieved. For a given level of development (e.g., 40 percent, 60 percent, etc.), this analysis assumed that that level was achieved in each basin in the world. In a real-world application, scales other than the basin may be relevant for Hydropower by Design and system planning. The relevant scale may be smaller than a basin (e.g., a major tributary of a larger basin, such as the Tapajós within the Amazon (see Tapajós case study in Case Studies)), or larger than a basin such as a region, country or grid. Rather than having each basin achieve a certain level of development, it may be more appropriate to prioritize certain basins for greater protection (fewer or no dams) and other basins for higher levels of development.
T H E P O W E R O F R I V E R S22
of total hydropower capacity could be developed with only 10 percent of the fragmentation of full development. At 60 percent development of capacity, fragmentation would increase, but the application of Hydropower by Design could still reduce kilometers lost by more than 100,000 km compared to business-as-usual scenarios. At 80 percent development, overall fragmentation would be considerably higher and the potential improvement from Hydropower by Design would be smaller as options are diminished. However, even at this very high level of development, Hydropower by Design scenarios could still reduce fragmentation by nearly 60,000 km.37 Figure 1.6.
40% 60% 80% 100%
40,000
0
80,000
120,000
160,000
200,000
20,000
60,000
100,000
140,000
180,000
KM
Level of hydropower development
20%
Minimum kilometers a�ected by fragmentation
Range of potential for improvement through Hydropower by Design
Figure 1.6. Global potential for maintaining connectivity. Blue bars represent the minimum kilometers affected by fragmentation for each level of energy development (from 20 percent to 80 percent of full basin capacity) up to full build-out of the planned dams in the global database (185,000 km affected by fragmentation). The top of the ‘minimum kilometers affected’ bar reflects the sum of global fragmentation from application of Hydropower by Design to the basins in the global data set, while the upper end of the hatched bars represents the sum of global fragmentation from business-as-usual development within those basins. Thus, the sizes of the blue hatched bars indicate the range of potential improvement provided by Hydropower by Design at different development levels (see Appendix A for detailed methods).
While this analysis focuses on basin-scale options for siting dams that reduce fragmentation, planning for dam siting can also strive to optimize for other values, such as avoiding impacts to communities and/or terrestrial biodiversity (from reservoir inundation) or avoiding or reducing impacts from flow alteration on downstream ecosystems and communities that rely on them. Balancing across these multiple values may reduce the potential for maximizing connectivity, although outcomes for many environmental and social resources are often positively correlated (see “Basin-scale studies” in Appendix A).
In addition to planning and siting, application of Hydropower by Design also includes seeking options to improve balanced outcomes through the design and operation of individual projects. This paper identified that full build-out of hydropower dams under construction and planned dams in the global database will increase the length of river potentially affected by flow regulation, and associated alteration of flow patterns, by 130,500 km, including the lower floodplain and delta reaches of rivers important for fish harvest and flood recession agriculture (such as the Mekong and Niger rivers). Implementation of environmental flows can reduce impacts on ecosystems affected by flow regulation, such as partial restoration of floodplain productivity.38
37 See Appendix A for a discussion of other scales of fragmentation and connectivity that may have value. For example, our analysis focused at the scale of basins, but connectivity within sub-basins can also be important. The Tapajós is a major sub-basin within the Amazon basin (see Case Studies). In most scenario calculations of the longest connected network in the Amazon, the Tapajós was considered part of the basin “lost” to fragmentation. However, real-world conservation efforts are focused on increasing the connectivity within the Tapajós, and our case study shows that across a range of development levels, Hydropower by Design could identify scenarios that maintained 2,000 to 3,000 more kilometers of connected river network within the Tapajós. Because of the advanced stage of planning and review for a few large dams in the lower Tapajós, it is very likely the Tapajós will soon be disconnected from the rest of the Amazon, as the Xingu River has already been disconnected. Although these basins no longer factor into basin-scale connectivity for the whole Amazon (though note that fish passage and flow and sediment management can mitigate some of the disconnection), connectivity within the Tapajós and within the Xingu still have conservation value. Because of its scale of analysis, our global analysis does not capture this scale of potential value.
38 See Krchnak et al., 2009 and Opperman et al., 2013.
T H E P O W E R O F R I V E R S 23
Funding better outcomes We estimate that implementing Hydropower by Design39 to achieve more-balanced outcomes will increase overall hydropower investment costs by approximately 15 percent on average, compared to business-as-usual approaches.40
Achieving the connectivity improvements described in this paper would require implementing Hydropower by Design in basins where planned dams threaten to reduce basin-scale connectivity.41 Approximately 70 percent of all planned hydropower capacity in the global database occurs in basins where development threatens basin-scale connectivity.42 Although this paper does not recommend a specific level of development, at the basin or global scale, for the purposes of this exercise in cost estimation we will assume that balancing connectivity with energy goals in those basins can occur at a 60 percent level of development. This translates to 205 GW of additional capacity in that sub-set of basins. Assuming this development takes place between now and 2040, applying Hydropower by Design in these basins would cost approximately an additional US$3 billion per year over business-as-usual practices,43 based on the estimated allocation of costs below. These cost estimates are derived from expert interviews, literature review and our own direct experience.
• Planning and assessment costs. Greater investment in upfront planning and project preparation, including basin plans, Strategic Environmental Assessments and/or use of the Hydropower Sustainability Assessment Protocol (early stage) represents a cost increase of 1 percent compared to business-as-usual efforts.
• Cost of alternative siting. Within a basin, Hydropower by Design will sometimes require selecting somewhat more expensive projects to avoid low-cost projects with higher environmental and social impacts. The difference in cost will depend on the specific cost curve of the basin.44 In our analyses, we found that alternative scenarios with similar capacity and improved environmental outcomes were often only slightly more expensive than a scenario based strictly on least cost, but others ranged up to 20 percent more expensive. Therefore, a reasonable average estimate for alternative siting is 10 percent of business-as-usual cost. Note that we are not suggesting that all decisions about dam siting should be subject to a financial test of feasibility alone. Many countries have policies that prohibit dams in particularly valuable or vulnerable locations, such as national parks, or prohibit development that will unacceptably impact communities, indigenous lands or cultural resources. We believe that such policies on “no go” areas are appropriate and should be applied prior to the alternative site selection process described in this paper.
• Cost of best practices mitigation, including offsets. In the regions where hydropower is expanding rapidly, the proportion of project costs dedicated to environmental mitigation is generally between 1 and 4 percent (excluding relocation costs and social program costs). We estimate that an additional 2 percent of costs would allow most projects to move toward international best practices for mitigation and achieve higher environmental performance.45 Half of this additional cost could be dedicated toward local improvements (such as fish passage), while the other half could be invested in regional conservation goals, such as formal protection and management of free-flowing rivers (e.g., through compensation or offsets).46 It is important to note that, if applied broadly, this incremental cost for offsets would generate significant funds. For example, applying a 1 percent cost to 300 GW would yield US$7.5 billion in strategic compensation funding during the next few decades.47 To put this into perspective, this is more than half the total of grants provided by the Global Environment Facility (GEF) since 1991.
39 Equivalent to achieving environmental best practices at both the system and project level.
40 See Appendix B for description of how these additional costs were estimated.
41 In contrast to basins that are already so fragmented that increased hydropower development will have little effect on basin-scale connectivity, or basins where planned dams are configured such that they have only minor impacts on connectivity.
42 See Appendix B.
43 With an average investment cost of US$2,500/kW the 205 GW of additional capacity would cost approximately US$500 billion, with 15 percent increased cost from Hydropower by Design equaling US$75 billion and an annual cost over 25 years of US$3 billion.
44 Note that as applied in an energy system, this substitution may not always involve another dam in the basin, but could entail substituting for hydropower in a different basin or another generation source, such as wind or gas.
45 Based on interviews with independent assessors who have evaluated hydropower projects using the Hydropower Sustainability Assessment Protocol to estimate the additional costs required to move project performance to the level of ‘best practice’ scores.
46 See Appendix B for further description of offsets for river conservation.
47 At US$2,500/MW for investment costs, 300 GW will require US$750 billion.
T H E P O W E R O F R I V E R S24
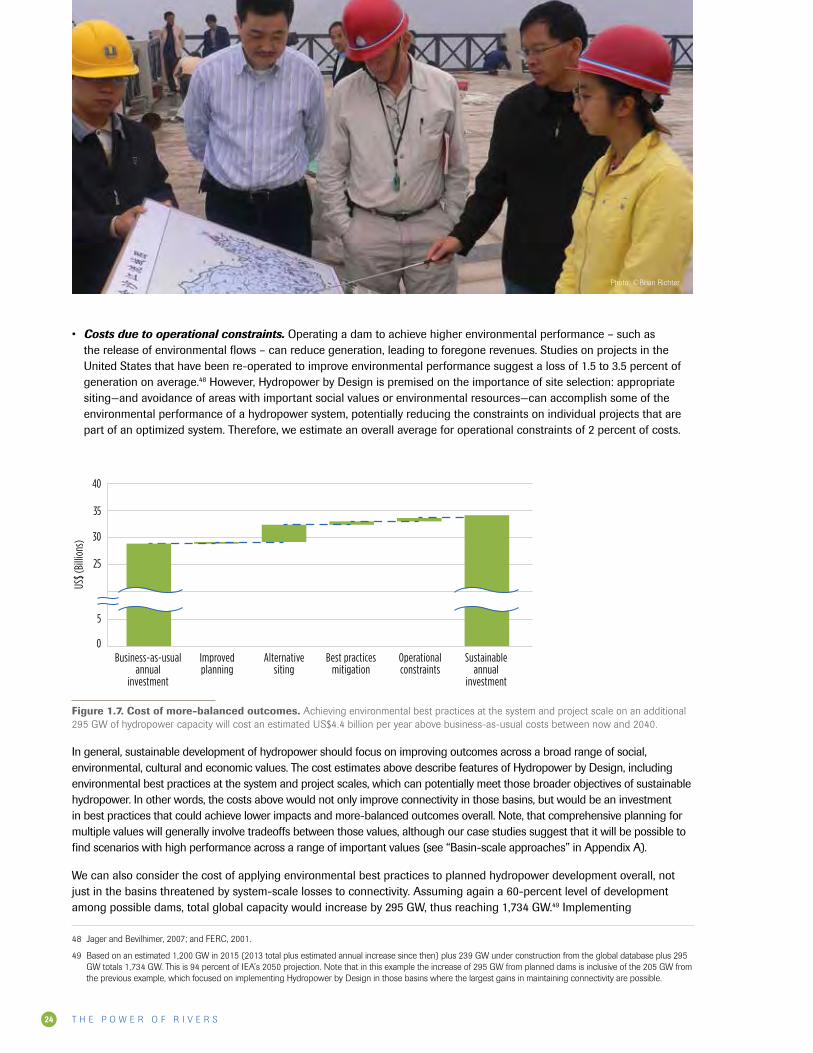
• Costs due to operational constraints. Operating a dam to achieve higher environmental performance – such as the release of environmental flows – can reduce generation, leading to foregone revenues. Studies on projects in the United States that have been re-operated to improve environmental performance suggest a loss of 1.5 to 3.5 percent of generation on average.48 However, Hydropower by Design is premised on the importance of site selection: appropriate siting—and avoidance of areas with important social values or environmental resources—can accomplish some of the environmental performance of a hydropower system, potentially reducing the constraints on individual projects that are part of an optimized system. Therefore, we estimate an overall average for operational constraints of 2 percent of costs.
Figure 1.7.
Improvedplanning
Alternativesiting
Best practicesmitigation
Operationalconstraints
Sustainableannual
investment
5
0
25
30
35
40
US$
(Bill
ions
)
Business-as-usualannual
investment
Figure 1.7. Cost of more-balanced outcomes. Achieving environmental best practices at the system and project scale on an additional 295 GW of hydropower capacity will cost an estimated US$4.4 billion per year above business-as-usual costs between now and 2040.
In general, sustainable development of hydropower should focus on improving outcomes across a broad range of social, environmental, cultural and economic values. The cost estimates above describe features of Hydropower by Design, including environmental best practices at the system and project scales, which can potentially meet those broader objectives of sustainable hydropower. In other words, the costs above would not only improve connectivity in those basins, but would be an investment in best practices that could achieve lower impacts and more-balanced outcomes overall. Note, that comprehensive planning for multiple values will generally involve tradeoffs between those values, although our case studies suggest that it will be possible to find scenarios with high performance across a range of important values (see “Basin-scale approaches” in Appendix A).
We can also consider the cost of applying environmental best practices to planned hydropower development overall, not just in the basins threatened by system-scale losses to connectivity. Assuming again a 60-percent level of development among possible dams, total global capacity would increase by 295 GW, thus reaching 1,734 GW.49 Implementing
48 Jager and Bevilhimer, 2007; and FERC, 2001.
49 Based on an estimated 1,200 GW in 2015 (2013 total plus estimated annual increase since then) plus 239 GW under construction from the global database plus 295 GW totals 1,734 GW. This is 94 percent of IEA’s 2050 projection. Note that in this example the increase of 295 GW from planned dams is inclusive of the 205 GW from the previous example, which focused on implementing Hydropower by Design in those basins where the largest gains in maintaining connectivity are possible.
Photo: ©Brian Richter
T H E P O W E R O F R I V E R S 25
environmental best practices on all hydropower development required to reach this figure would cost an additional US$4.4 billion per year between now and 2040 (Figure 1.7). It is worth noting that these additional costs are likely to be much lower than the subsidies many countries provide to thermal, nuclear and new renewable sources of power.50
The way forwardThis paper estimated the potential and cost of best practices in planning, siting, design and mitigation to achieve a range of outcomes, including a dramatic reduction in the loss of connected rivers to fragmentation. How can the necessary resources be mobilized to achieve this improvement and what else would need to happen?
First of all, we expect some of those costs to be offset by compensating cost reductions. The multi-scale best practices encompassed by Hydropower by Design can potentially lower risk, reduce delays, help secure more competitive financing and extend the life of the assets. In order to capture these avoided costs, governments, financiers and hydropower companies should collaborate on several initiatives:
• Systematically document hydropower projects’ risk profiles and codify risk reduction potential using Hydropower by Design and other best practices. A recent survey found that for a sample of large hydropower projects, construction times and costs were both generally greater than planned, both by a median of 27 percent larger. The sources of these overruns are not well documented, but the potential to reduce delays and cost overruns is significant. If improved environmental and social performance could reduce delays and associated cost overruns by just one quarter, this would account for a 7 percent cost savings on total investment compared to approaches with business-as-usual performance.51 Further, after commissioning, projects that were planned and developed based on sustainable best practices run lower risks of environmental problems affecting operation and generation. This helps secure the flow of revenue and benefits from the project and represents real value to operators, investors and energy consumers.
• Design financing vehicles that recognize and incentivize the adoption of Hydropower by Design and other best practices. Projects with better risk-management profiles should be more attractive as investments. This points to the need for two types of financial vehicles:
a. Projects that are selected through a comprehensive basin plan that achieves balanced outcomes—in other words, greater vetting at the project identification and preparation stages—should lead to better investments due to lowered risks of controversy, delay or cancellation. To achieve a portfolio of lower risk and more investable projects, countries and regulators should consider developing mechanisms to fund early planning, reimbursed through project revenue.
b. Governments and financiers should consider creating financing vehicles that reflect the improved risk profiles of projects developed through Hydropower by Design and other best practices by, for example, linking financing terms to the performance of individual projects against the rating on the Hydropower Sustainability Assessment Protocol. For example, if Hydropower by Design could reduce risk and justify a lowering of finance rates of 50 basis points (e.g., a reduction from 8.0 percent to 7.5 percent), this would translate to a 4 percent reduction in total costs.52
Beyond values that can be directly monetized, Hydropower by Design can also generate economic value that benefits countries, in many cases values sufficient to justify the relatively small incremental investment. These benefits include:
• Improved outcomes for ecosystem services. Better outcomes for environmental and social resources can provide ecosystem services that support fisheries, flood-recession agriculture, recreation and tourism. Biodiversity benefits can also be considered to have global value.
• System efficiency: better mix of projects through planning. The comprehensive planning necessary for Hydropower by Design can also ensure that projects work well together in an overall energy and water system. Without such planning, subsequent projects sometimes even diminish other projects’ benefits. Aside from the environmental and social benefits that could be gained by identifying more-balanced scenarios, comprehensive planning may result in better overall choices for a country in terms of cost of energy, synergies between projects, and overall performance of an energy and water system.
50 According to the International Energy Agency (2014), the world’s fossil-fuel consumption subsidies alone amounted to US$548 billion in 2013.
51 See Appendix B.
52 See Appendix B.

T H E P O W E R O F R I V E R S26
Developers cannot directly capture the broader national or societal benefits, but widespread uptake of Hydropower by Design and a shared framework to evaluate those benefits will likely mobilize additional funding sources to support its adoption – for example global funding to support protection and management of free-flowing rivers.
To capture these additional benefits and create practical frameworks for making decisions, it is essential that governments, industry and civil society develop a common framework for the evaluation of benefits from these types of investments. It is also essential that governments take the lead in either conducting early stage planning or creating a framework for developers to do so. Although this is primarily a responsibility of governments, in terms of planning and licensing, the most constructive outcomes will likely occur when developers and funders are well aligned with governments in promoting system-scale solutions and environmental best practices.
One final note: while our case studies focused on basins within a single country, several of the important basins discussed in this paper, such as the Mekong and Amazon, encompass multiple countries. Achieving system-scale balanced outcomes from Hydropower by Design will be particularly challenging in trans-boundary rivers. In these basins, governments, funders and developers will need to promote cooperation and innovative solutions in basin governance, and water- and power-sharing agreements.
This paper’s estimates of costs and benefits of Hydropower by Design are preliminary and based on limited data or expert judgment. Similarly, the estimates for potential reductions in fragmentation are based on one scale and approach to defining connectivity.53 Thus, all the estimates in this paper should be considered rough approximations of what is possible. However, even if these estimates are off by a substantial amount (e.g. 50 percent), they would still point to a clear conclusion: the potential for more-balanced outcomes from hydropower development is significant. Countries can get a better deal overall if they can find pathways of developing energy that maintain the diverse values provided by rivers. To achieve this potential, we must improve our understanding of the costs and benefits of different approaches to hydropower development.
We hope that this paper serves as first step in that direction, and as a call to action to all those that have a stake in the future of sustainable energy and healthy rivers—governments, communities, hydropower companies, civil society and scientists—to collaborate on crafting and refining the necessary solutions to make this potential a reality. The future of our rivers depends on finding those solutions.
53 See Appendix A and footnote 37 for a discussion of alternative ways of assessing connectivity.

T H E P O W E R O F R I V E R S 27
River Basin Case Studies
For each of the following three case studies, we examined multiple
different dam building scenarios (combinations of different dams)
and quantified for each scenario the total capacity represented by
the scenario and the impact on connectivity. These analyses were
developed to ground-truth the global potential and provide in-
depth analysis of the potential for increasing connectivity at varying
hydropower capacity levels within river basins. The scenarios were
chosen based on preliminary research and should be considered
illustrative examples. As such, we are not recommending or
endorsing any specific scenario because selection of the best
alternatives for developing energy will require analyzing a broader
range of issues, including impacts on communities and indigenous
lands. Decisions about how to balance energy development with
other values should be made with broad inclusion of stakeholders.
Methods for these case studies can be found in Appendix A.
Similar to the global analysis, for each basin we defined the
longest connected network of large-river channels to include the
main-stem river and major tributaries, and thus these networks are
considerably longer than the main-stem river alone.
Photo: ©Brian Richter

T H E P O W E R O F R I V E R S28
Coatzacoalcos River Basin - MexicoHydropower in MexicoDemand for electricity in Mexico is growing rapidly due to expanding industries and a population that is urbanizing. The Comisión Federal de Electricidad (CFE) is a government agency with responsibility for planning, generating and delivering electricity in Mexico. CFE manages a system with a total capacity of 52.5 GW, with approximately three-quarters of that coming from thermal sources. Hydropower provides 22 percent (11.2 GW), by far the largest among renewable generation sources. To improve the sustainability of its energy supply, Mexico recently announced a commitment to expand its use of low-carbon energy sources such as wind, solar and hydropower, with a national goal of 40 percent of electricity from renewable sources. A significant portion of this energy will come from hydropower.54
CFE operates all major hydropower dams in Mexico, and through its national planning process has identified approximately 100 river basins that are suitable for hydropower development, including the Coatzacoalcos.
The Coatzacoalcos River basin and its resourcesThe Coatzacoalcos River has a main-stem length of 325 km and flows to the Gulf of Mexico, draining a basin area of 17,400 km2 (Figure CS.1). The basin includes 45 municipalities in three states: Chiapas, Oaxaca and Veracruz, with a total population of just over one million. The basin is among the wettest basins in the country. There is currently no hydropower development in the Coatzacoalcos and the basin’s rivers are almost entirely free flowing.
In addition to energy, the Coatzacoalcos River has important values for local communities. On more than 700 locations along the Coatzacoalcos River and its tributaries, 115,000 people have livelihoods depending on natural resources. Many of these activities occur along the main-stem of the river, such as fishing and flood-recession agriculture, and depend on natural river processes. Thus, these activities are vulnerable to potential changes in flows or sediment supply from hydropower development.
54 Diario Oficial de la Federación, 2014.
Figure CS.1. Regional map of the Coatzacoalcos.
Photo: ©Dave Spier
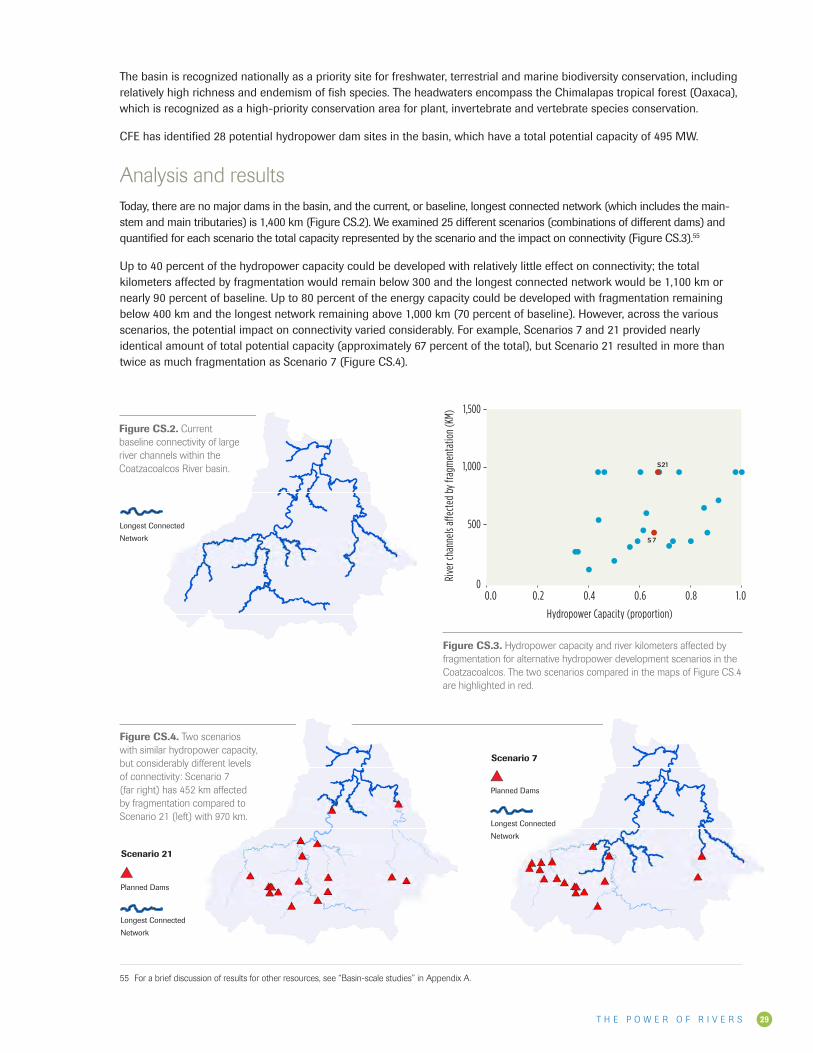
T H E P O W E R O F R I V E R S 29
The basin is recognized nationally as a priority site for freshwater, terrestrial and marine biodiversity conservation, including relatively high richness and endemism of fish species. The headwaters encompass the Chimalapas tropical forest (Oaxaca), which is recognized as a high-priority conservation area for plant, invertebrate and vertebrate species conservation.
CFE has identified 28 potential hydropower dam sites in the basin, which have a total potential capacity of 495 MW.
Analysis and resultsToday, there are no major dams in the basin, and the current, or baseline, longest connected network (which includes the main-stem and main tributaries) is 1,400 km (Figure CS.2). We examined 25 different scenarios (combinations of different dams) and quantified for each scenario the total capacity represented by the scenario and the impact on connectivity (Figure CS.3).55
Up to 40 percent of the hydropower capacity could be developed with relatively little effect on connectivity; the total kilometers affected by fragmentation would remain below 300 and the longest connected network would be 1,100 km or nearly 90 percent of baseline. Up to 80 percent of the energy capacity could be developed with fragmentation remaining below 400 km and the longest network remaining above 1,000 km (70 percent of baseline). However, across the various scenarios, the potential impact on connectivity varied considerably. For example, Scenarios 7 and 21 provided nearly identical amount of total potential capacity (approximately 67 percent of the total), but Scenario 21 resulted in more than twice as much fragmentation as Scenario 7 (Figure CS.4).
55 For a brief discussion of results for other resources, see “Basin-scale studies” in Appendix A.
Figure CS.3. Hydropower capacity and river kilometers affected by fragmentation for alternative hydropower development scenarios in the Coatzacoalcos. The two scenarios compared in the maps of Figure CS.4 are highlighted in red.
Coatzacoalcos River Basin
0
500
1,000
1,500
Rive
r cha
nnels
a�ec
ted
by fr
agm
enta
tion
(KM)
Hydropower Capacity (proportion)
0.0 0.2 0.4 0.6 0.8 1.0
S7
S21
BaselineScenario
LargestConnectedNetwork
Figure CS.2. Current baseline connectivity of large river channels within the Coatzacoalcos River basin.
Longest Connected
Network
Figure CS.4. Two scenarios with similar hydropower capacity, but considerably different levels of connectivity: Scenario 7 (far right) has 452 km affected by fragmentation compared to Scenario 21 (left) with 970 km.
Scenario 21
Longest Connected
Network
Planned Dams
Scenario21PlannedDams
LargestConnectedNetwork
Scenario 7PlannedDams
LargestConnectedNetwork
Scenario 7
Longest Connected
Network
Planned Dams

T H E P O W E R O F R I V E R S30
Magdalena River Basin – ColombiaHydropower in ColombiaColombia has a total installed electricity capacity of 14.5 GW, with more than 60 percent of that from hydropower, followed by natural gas (18 percent) and coal (8 percent). In 2011, total hydropower generation was 48.6 TWh. Since 2001, Colombia has enacted a series of energy laws, reforms and resolutions that strive to advance low-carbon and renewable energies. The Magdalena basin currently provides more than 60 percent of Colombia’s hydropower and the majority of the nation’s planned hydropower is within this basin.56
The Magdalena River basin and its resourcesThe Magdalena River is the most important waterway in Colombia and South America’s fifth-largest river (Figure CS.5). The main-stem river is 1,500 km long, starting among the glaciers and cloud forests of the Andes Mountains, winding through vast lowland floodplains, and flowing into the Caribbean Sea at the city of Barranquilla. The Magdalena basin encompasses a population of 30 million people and supports 75 percent of the nation’s agriculture production and nearly 90 percent of its GDP. Flood-dependent agriculture and fisheries are important for rural communities.
The Magdalena is globally significant for biodiversity. The basin contains more than 200 native fish species (roughly half are endemic), as well as high diversity of mammals, birds and amphibians. Major river-dependent habitat types include extensive riparian corridors, large wetlands and lagoon complexes. The wetlands and lagoons are critical stopovers for birds in the western hemisphere migration, and rural communities rely on these habitats for fish harvest and other resources. The wetland ecosystems depend on the seasonal overflow from the Magdalena and the nutrients and sediment carried by the floodwaters. Upstream dams have the potential to change the flow regime and alter the patterns of connectivity between the river and wetlands, jeopardizing their productivity.
The Magdalena basin currently contains 24 dams with an aggregate capacity of 6,360 MW, which currently produce approximately 33,400 GWh per year. Two major dams are under construction with a total capacity of 2,800 MW. An inventory of planned dams includes 30 large dam projects with a total capacity of 8,450 MW.
Hydropower is just one of the potential drivers of expansion of water infrastructure in the Magdalena. There is also significant interest in developing navigation resources. Some of the proposed dams are principally for navigation locks and dams, to which hydropower turbines would be added as an additional use. Other projects are being proposed for water supply with hydropower as an additional use. Flood management plans may result in the expansion of levees. All of these other development considerations would also affect the overall river values. The results we present here focus on hydropower to give some insight into the range of alternatives for adding increments of energy to the Magdalena, but we acknowledge that hydropower development will need to be planned in this broader context.
56 International Energy Agency, 2014.
Figure CS.5. Regional map of the Magdalena River basin.
Photo: ©Bridget Besaw
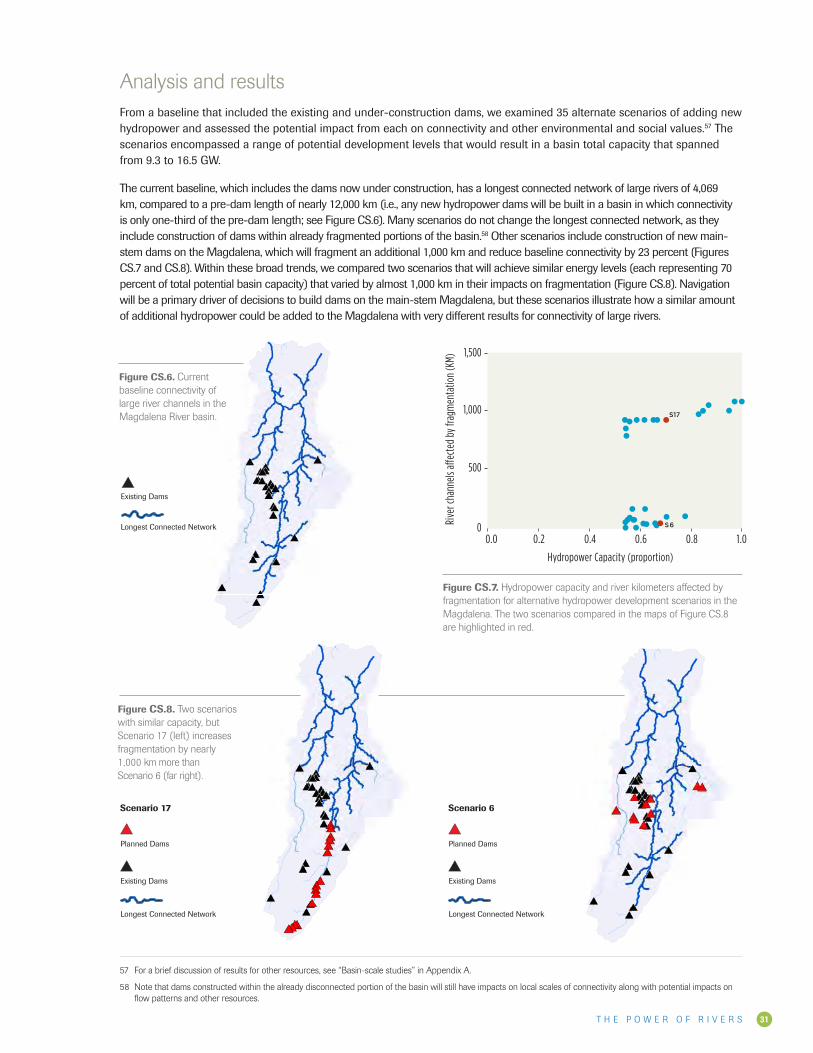
T H E P O W E R O F R I V E R S 31
Analysis and resultsFrom a baseline that included the existing and under-construction dams, we examined 35 alternate scenarios of adding new hydropower and assessed the potential impact from each on connectivity and other environmental and social values.57 The scenarios encompassed a range of potential development levels that would result in a basin total capacity that spanned from 9.3 to 16.5 GW.
The current baseline, which includes the dams now under construction, has a longest connected network of large rivers of 4,069 km, compared to a pre-dam length of nearly 12,000 km (i.e., any new hydropower dams will be built in a basin in which connectivity is only one-third of the pre-dam length; see Figure CS.6). Many scenarios do not change the longest connected network, as they include construction of dams within already fragmented portions of the basin.58 Other scenarios include construction of new main-stem dams on the Magdalena, which will fragment an additional 1,000 km and reduce baseline connectivity by 23 percent (Figures CS.7 and CS.8). Within these broad trends, we compared two scenarios that will achieve similar energy levels (each representing 70 percent of total potential basin capacity) that varied by almost 1,000 km in their impacts on fragmentation (Figure CS.8). Navigation will be a primary driver of decisions to build dams on the main-stem Magdalena, but these scenarios illustrate how a similar amount of additional hydropower could be added to the Magdalena with very different results for connectivity of large rivers.
57 For a brief discussion of results for other resources, see “Basin-scale studies” in Appendix A.
58 Note that dams constructed within the already disconnected portion of the basin will still have impacts on local scales of connectivity along with potential impacts on flow patterns and other resources.
BaselineScenario
ExistingDams
LargestConnectedNetwork
Longest Connected Network
Existing Dams
Scenario 17PlannedDams
ExistingDams
LargestConnectedNetwork
Scenario 17
Longest Connected Network
Existing Dams
Planned Dams
Scenario 6PlannedDams
ExistingDams
LargestConnectedNetwork
Scenario 6
Longest Connected Network
Existing Dams
Planned Dams
Figure CS.6. Current baseline connectivity of large river channels in the Magdalena River basin.
Figure CS.8. Two scenarios with similar capacity, but Scenario 17 (left) increases fragmentation by nearly 1,000 km more than Scenario 6 (far right).
Magdalena River Basin
0
500
1,000
1,500
Rive
r cha
nnels
a�ec
ted
by fr
agm
enta
tion
(KM)
Hydropower Capacity (proportion)
0.0 0.2 0.4 0.6 0.8 1.0S6
S17
Figure CS.7. Hydropower capacity and river kilometers affected by fragmentation for alternative hydropower development scenarios in the Magdalena. The two scenarios compared in the maps of Figure CS.8 are highlighted in red.
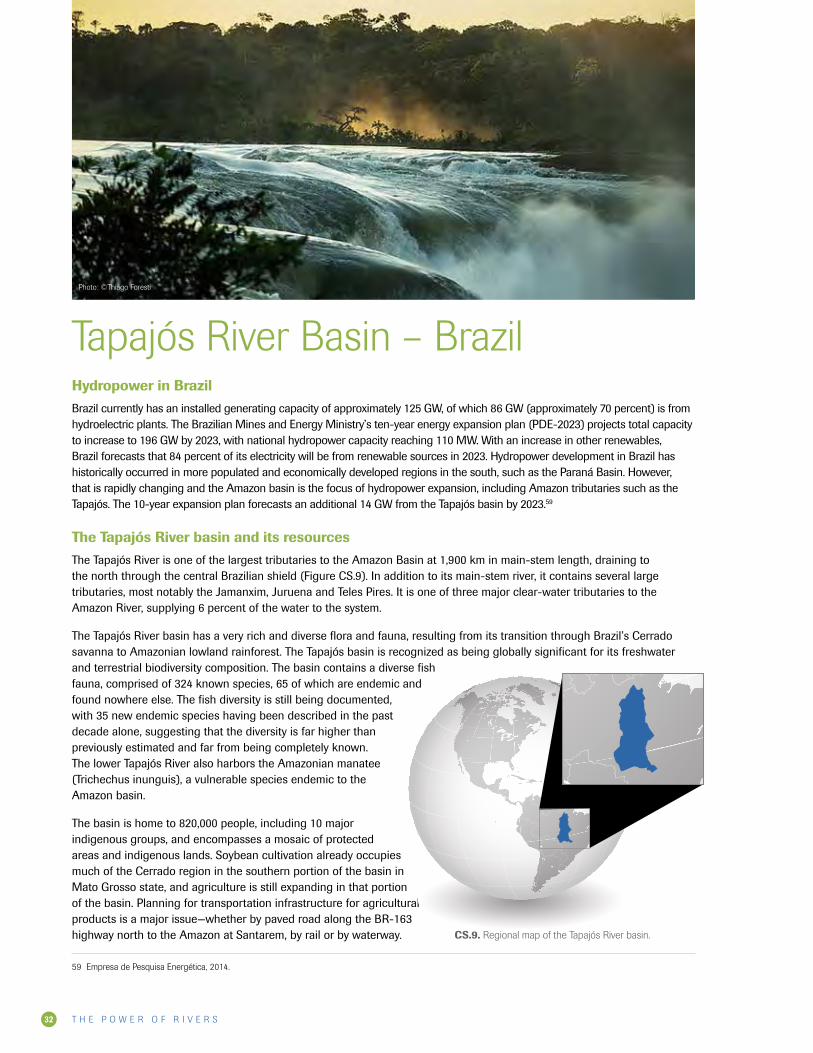
T H E P O W E R O F R I V E R S32
Tapajós River Basin – Brazil Hydropower in BrazilBrazil currently has an installed generating capacity of approximately 125 GW, of which 86 GW (approximately 70 percent) is from hydroelectric plants. The Brazilian Mines and Energy Ministry’s ten-year energy expansion plan (PDE-2023) projects total capacity to increase to 196 GW by 2023, with national hydropower capacity reaching 110 MW. With an increase in other renewables, Brazil forecasts that 84 percent of its electricity will be from renewable sources in 2023. Hydropower development in Brazil has historically occurred in more populated and economically developed regions in the south, such as the Paraná Basin. However, that is rapidly changing and the Amazon basin is the focus of hydropower expansion, including Amazon tributaries such as the Tapajós. The 10-year expansion plan forecasts an additional 14 GW from the Tapajós basin by 2023.59
The Tapajós River basin and its resourcesThe Tapajós River is one of the largest tributaries to the Amazon Basin at 1,900 km in main-stem length, draining to the north through the central Brazilian shield (Figure CS.9). In addition to its main-stem river, it contains several large tributaries, most notably the Jamanxim, Juruena and Teles Pires. It is one of three major clear-water tributaries to the Amazon River, supplying 6 percent of the water to the system.
The Tapajós River basin has a very rich and diverse flora and fauna, resulting from its transition through Brazil’s Cerrado savanna to Amazonian lowland rainforest. The Tapajós basin is recognized as being globally significant for its freshwater and terrestrial biodiversity composition. The basin contains a diverse fish fauna, comprised of 324 known species, 65 of which are endemic and found nowhere else. The fish diversity is still being documented, with 35 new endemic species having been described in the past decade alone, suggesting that the diversity is far higher than previously estimated and far from being completely known. The lower Tapajós River also harbors the Amazonian manatee (Trichechus inunguis), a vulnerable species endemic to the Amazon basin.
The basin is home to 820,000 people, including 10 major indigenous groups, and encompasses a mosaic of protected areas and indigenous lands. Soybean cultivation already occupies much of the Cerrado region in the southern portion of the basin in Mato Grosso state, and agriculture is still expanding in that portion of the basin. Planning for transportation infrastructure for agricultural products is a major issue—whether by paved road along the BR-163 highway north to the Amazon at Santarem, by rail or by waterway.
59 Empresa de Pesquisa Energética, 2014.
CS.9. Regional map of the Tapajós River basin.
Photo: ©Thiago Foresti
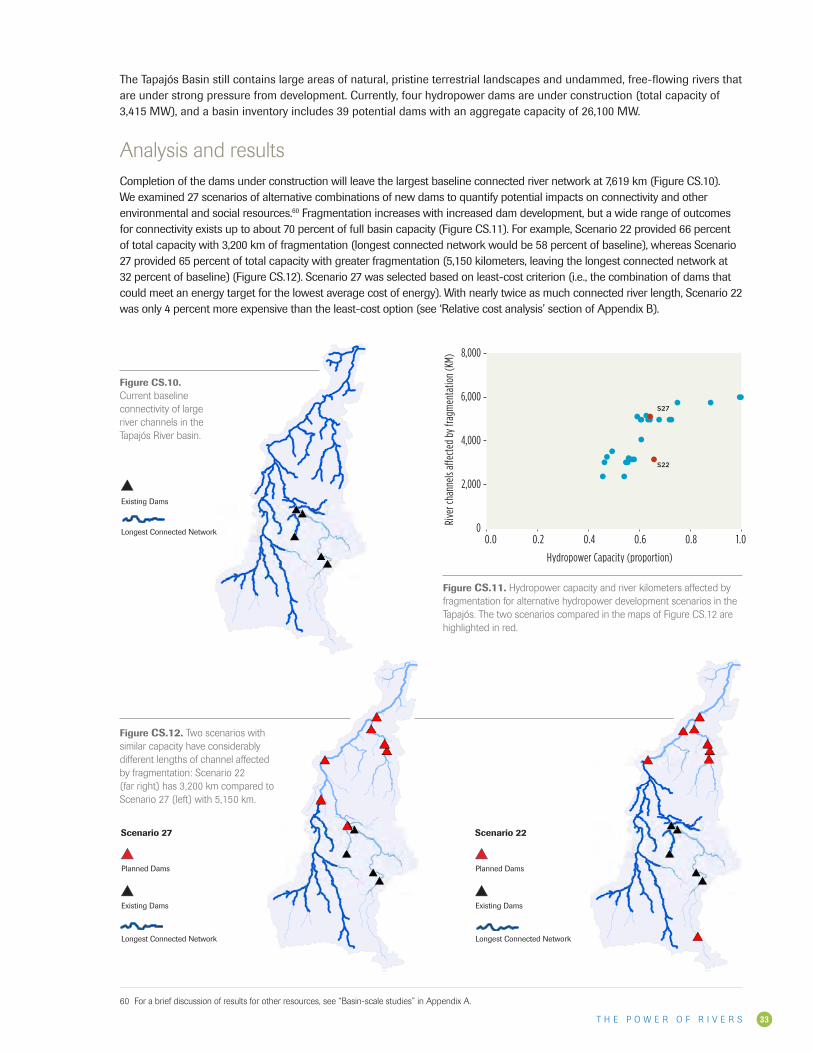
T H E P O W E R O F R I V E R S 33
The Tapajós Basin still contains large areas of natural, pristine terrestrial landscapes and undammed, free-flowing rivers that are under strong pressure from development. Currently, four hydropower dams are under construction (total capacity of 3,415 MW), and a basin inventory includes 39 potential dams with an aggregate capacity of 26,100 MW.
Analysis and resultsCompletion of the dams under construction will leave the largest baseline connected river network at 7,619 km (Figure CS.10). We examined 27 scenarios of alternative combinations of new dams to quantify potential impacts on connectivity and other environmental and social resources.60 Fragmentation increases with increased dam development, but a wide range of outcomes for connectivity exists up to about 70 percent of full basin capacity (Figure CS.11). For example, Scenario 22 provided 66 percent of total capacity with 3,200 km of fragmentation (longest connected network would be 58 percent of baseline), whereas Scenario 27 provided 65 percent of total capacity with greater fragmentation (5,150 kilometers, leaving the longest connected network at 32 percent of baseline) (Figure CS.12). Scenario 27 was selected based on least-cost criterion (i.e., the combination of dams that could meet an energy target for the lowest average cost of energy). With nearly twice as much connected river length, Scenario 22 was only 4 percent more expensive than the least-cost option (see ‘Relative cost analysis’ section of Appendix B).
60 For a brief discussion of results for other resources, see “Basin-scale studies” in Appendix A.
BaselineScenario
ExistingDams
LargestConnectedNetwork
Longest Connected Network
Existing Dams
Scenario 27PlannedDams
ExistingDams
LargestConnectedNetwork
Scenario 27
Longest Connected Network
Existing Dams
Planned Dams
Scenario 22PlannedDams
ExistingDams
LargestConnectedNetwork
Scenario 22
Longest Connected Network
Existing Dams
Planned Dams
Figure CS.10. Current baseline connectivity of large river channels in the Tapajós River basin.
Figure CS.12. Two scenarios with similar capacity have considerably different lengths of channel affected by fragmentation: Scenario 22 (far right) has 3,200 km compared to Scenario 27 (left) with 5,150 km.
Tapajós River Basin
0
2,000
6,000
4,000
8,000
Rive
r cha
nnels
a ec
ted
by fr
agm
enta
tion
(KM)
Hydropower Capacity (proportion)
0.0 0.2 0.4 0.6 0.8 1.0
S22
S27
Figure CS.11. Hydropower capacity and river kilometers affected by fragmentation for alternative hydropower development scenarios in the Tapajós. The two scenarios compared in the maps of Figure CS.12 are highlighted in red.
T H E P O W E R O F R I V E R S34
METHODS FOR SPATIAL ANALYSIS WITHIN CASE STUDY BASINS AND
GLOBAL MODELING
Appendix A
Photo: ©Ami Vitale
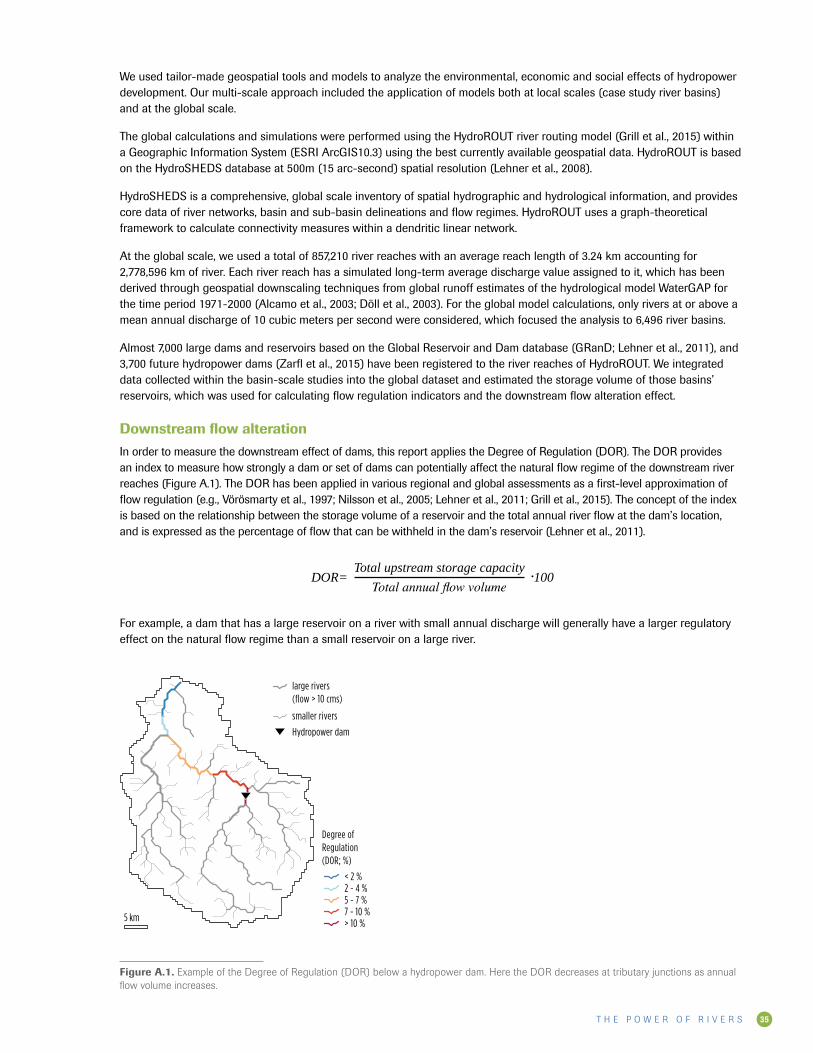
T H E P O W E R O F R I V E R S 35
We used tailor-made geospatial tools and models to analyze the environmental, economic and social effects of hydropower development. Our multi-scale approach included the application of models both at local scales (case study river basins) and at the global scale.
The global calculations and simulations were performed using the HydroROUT river routing model (Grill et al., 2015) within a Geographic Information System (ESRI ArcGIS10.3) using the best currently available geospatial data. HydroROUT is based on the HydroSHEDS database at 500m (15 arc-second) spatial resolution (Lehner et al., 2008).
HydroSHEDS is a comprehensive, global scale inventory of spatial hydrographic and hydrological information, and provides core data of river networks, basin and sub-basin delineations and flow regimes. HydroROUT uses a graph-theoretical framework to calculate connectivity measures within a dendritic linear network.
At the global scale, we used a total of 857,210 river reaches with an average reach length of 3.24 km accounting for 2,778,596 km of river. Each river reach has a simulated long-term average discharge value assigned to it, which has been derived through geospatial downscaling techniques from global runoff estimates of the hydrological model WaterGAP for the time period 1971-2000 (Alcamo et al., 2003; Döll et al., 2003). For the global model calculations, only rivers at or above a mean annual discharge of 10 cubic meters per second were considered, which focused the analysis to 6,496 river basins.
Almost 7,000 large dams and reservoirs based on the Global Reservoir and Dam database (GRanD; Lehner et al., 2011), and 3,700 future hydropower dams (Zarfl et al., 2015) have been registered to the river reaches of HydroROUT. We integrated data collected within the basin-scale studies into the global dataset and estimated the storage volume of those basins’ reservoirs, which was used for calculating flow regulation indicators and the downstream flow alteration effect.
Downstream flow alteration In order to measure the downstream effect of dams, this report applies the Degree of Regulation (DOR). The DOR provides an index to measure how strongly a dam or set of dams can potentially affect the natural flow regime of the downstream river reaches (Figure A.1). The DOR has been applied in various regional and global assessments as a first-level approximation of flow regulation (e.g., Vörösmarty et al., 1997; Nilsson et al., 2005; Lehner et al., 2011; Grill et al., 2015). The concept of the index is based on the relationship between the storage volume of a reservoir and the total annual river flow at the dam’s location, and is expressed as the percentage of flow that can be withheld in the dam’s reservoir (Lehner et al., 2011).
DOR= •100Total upstream storage capacity
Total annual flow volume
For example, a dam that has a large reservoir on a river with small annual discharge will generally have a larger regulatory effect on the natural flow regime than a small reservoir on a large river.
Degree of Regulation(DOR; %)
Hydropower dam
smaller rivers
large rivers (flow > 10 cms)
Hydropower dam
smaller rivers
large rivers (flow > 10 cms)
Disconnected portion of river network
> 10 %7 - 10 %5 - 7 %2 - 4 %< 2 %
5 km 5 km
Figure A.1. Example of the Degree of Regulation (DOR) below a hydropower dam. Here the DOR decreases at tributary junctions as annual flow volume increases.
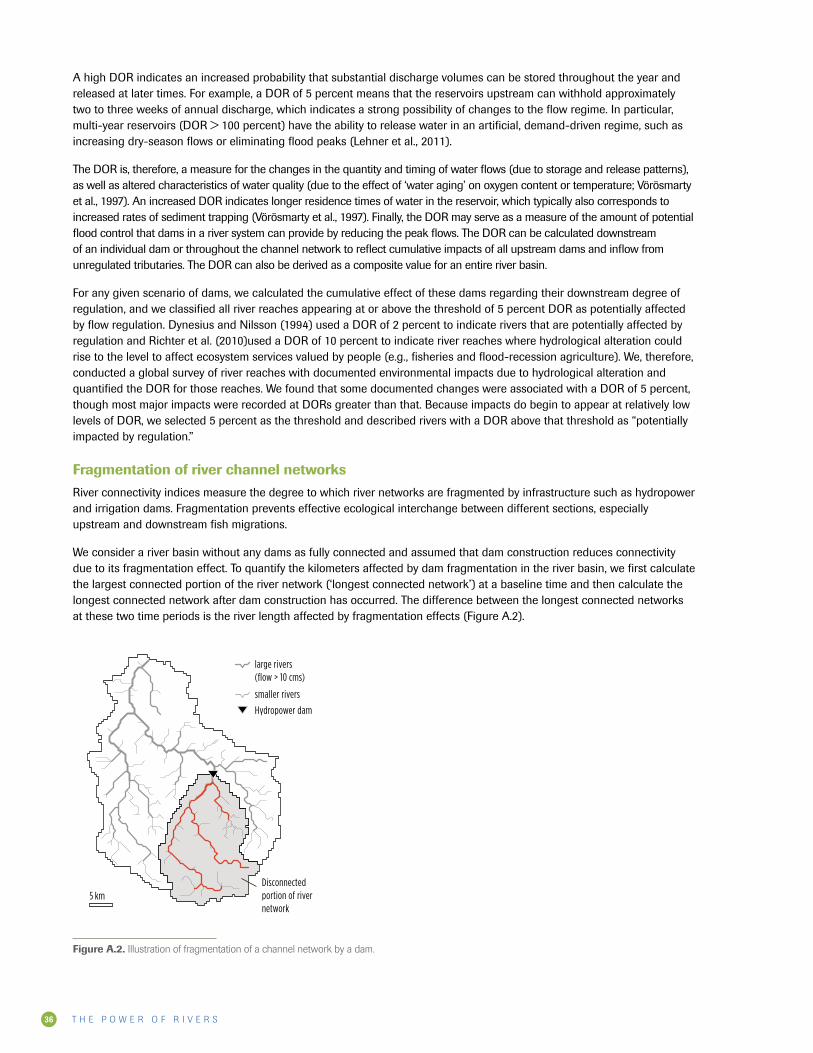
T H E P O W E R O F R I V E R S36
A high DOR indicates an increased probability that substantial discharge volumes can be stored throughout the year and released at later times. For example, a DOR of 5 percent means that the reservoirs upstream can withhold approximately two to three weeks of annual discharge, which indicates a strong possibility of changes to the flow regime. In particular, multi-year reservoirs (DOR > 100 percent) have the ability to release water in an artificial, demand-driven regime, such as increasing dry-season flows or eliminating flood peaks (Lehner et al., 2011).
The DOR is, therefore, a measure for the changes in the quantity and timing of water flows (due to storage and release patterns), as well as altered characteristics of water quality (due to the effect of ‘water aging’ on oxygen content or temperature; Vörösmarty et al., 1997). An increased DOR indicates longer residence times of water in the reservoir, which typically also corresponds to increased rates of sediment trapping (Vörösmarty et al., 1997). Finally, the DOR may serve as a measure of the amount of potential flood control that dams in a river system can provide by reducing the peak flows. The DOR can be calculated downstream of an individual dam or throughout the channel network to reflect cumulative impacts of all upstream dams and inflow from unregulated tributaries. The DOR can also be derived as a composite value for an entire river basin.
For any given scenario of dams, we calculated the cumulative effect of these dams regarding their downstream degree of regulation, and we classified all river reaches appearing at or above the threshold of 5 percent DOR as potentially affected by flow regulation. Dynesius and Nilsson (1994) used a DOR of 2 percent to indicate rivers that are potentially affected by regulation and Richter et al. (2010)used a DOR of 10 percent to indicate river reaches where hydrological alteration could rise to the level to affect ecosystem services valued by people (e.g., fisheries and flood-recession agriculture). We, therefore, conducted a global survey of river reaches with documented environmental impacts due to hydrological alteration and quantified the DOR for those reaches. We found that some documented changes were associated with a DOR of 5 percent, though most major impacts were recorded at DORs greater than that. Because impacts do begin to appear at relatively low levels of DOR, we selected 5 percent as the threshold and described rivers with a DOR above that threshold as “potentially impacted by regulation.”
Fragmentation of river channel networks River connectivity indices measure the degree to which river networks are fragmented by infrastructure such as hydropower and irrigation dams. Fragmentation prevents effective ecological interchange between different sections, especially upstream and downstream fish migrations.
We consider a river basin without any dams as fully connected and assumed that dam construction reduces connectivity due to its fragmentation effect. To quantify the kilometers affected by dam fragmentation in the river basin, we first calculate the largest connected portion of the river network (‘longest connected network’) at a baseline time and then calculate the longest connected network after dam construction has occurred. The difference between the longest connected networks at these two time periods is the river length affected by fragmentation effects (Figure A.2).
Degree of Regulation(DOR; %)
Hydropower dam
smaller rivers
large rivers (flow > 10 cms)
Hydropower dam
smaller rivers
large rivers (flow > 10 cms)
Disconnected portion of river network
> 10 %7 - 10 %5 - 7 %2 - 4 %< 2 %
5 km 5 km
Figure A.2. Illustration of fragmentation of a channel network by a dam.
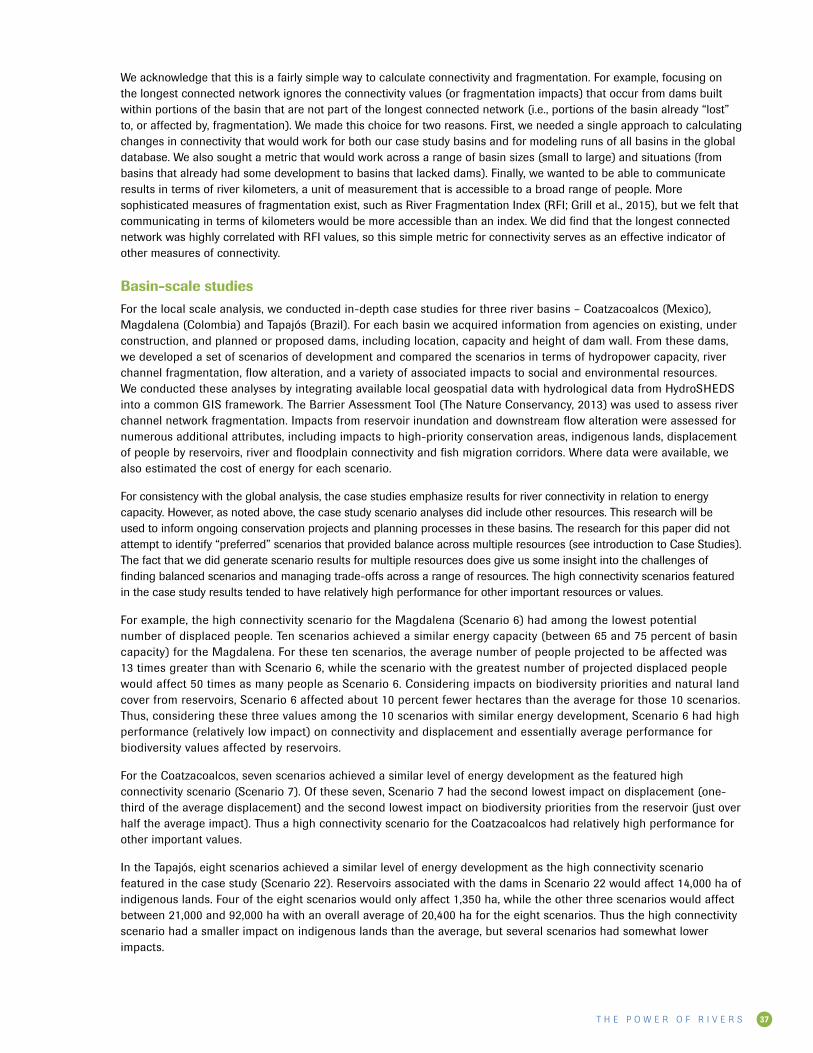
T H E P O W E R O F R I V E R S 37
We acknowledge that this is a fairly simple way to calculate connectivity and fragmentation. For example, focusing on the longest connected network ignores the connectivity values (or fragmentation impacts) that occur from dams built within portions of the basin that are not part of the longest connected network (i.e., portions of the basin already “lost” to, or affected by, fragmentation). We made this choice for two reasons. First, we needed a single approach to calculating changes in connectivity that would work for both our case study basins and for modeling runs of all basins in the global database. We also sought a metric that would work across a range of basin sizes (small to large) and situations (from basins that already had some development to basins that lacked dams). Finally, we wanted to be able to communicate results in terms of river kilometers, a unit of measurement that is accessible to a broad range of people. More sophisticated measures of fragmentation exist, such as River Fragmentation Index (RFI; Grill et al., 2015), but we felt that communicating in terms of kilometers would be more accessible than an index. We did find that the longest connected network was highly correlated with RFI values, so this simple metric for connectivity serves as an effective indicator of other measures of connectivity.
Basin-scale studiesFor the local scale analysis, we conducted in-depth case studies for three river basins – Coatzacoalcos (Mexico), Magdalena (Colombia) and Tapajós (Brazil). For each basin we acquired information from agencies on existing, under construction, and planned or proposed dams, including location, capacity and height of dam wall. From these dams, we developed a set of scenarios of development and compared the scenarios in terms of hydropower capacity, river channel fragmentation, flow alteration, and a variety of associated impacts to social and environmental resources. We conducted these analyses by integrating available local geospatial data with hydrological data from HydroSHEDS into a common GIS framework. The Barrier Assessment Tool (The Nature Conservancy, 2013) was used to assess river channel network fragmentation. Impacts from reservoir inundation and downstream flow alteration were assessed for numerous additional attributes, including impacts to high-priority conservation areas, indigenous lands, displacement of people by reservoirs, river and floodplain connectivity and fish migration corridors. Where data were available, we also estimated the cost of energy for each scenario.
For consistency with the global analysis, the case studies emphasize results for river connectivity in relation to energy capacity. However, as noted above, the case study scenario analyses did include other resources. This research will be used to inform ongoing conservation projects and planning processes in these basins. The research for this paper did not attempt to identify “preferred” scenarios that provided balance across multiple resources (see introduction to Case Studies). The fact that we did generate scenario results for multiple resources does give us some insight into the challenges of finding balanced scenarios and managing trade-offs across a range of resources. The high connectivity scenarios featured in the case study results tended to have relatively high performance for other important resources or values.
For example, the high connectivity scenario for the Magdalena (Scenario 6) had among the lowest potential number of displaced people. Ten scenarios achieved a similar energy capacity (between 65 and 75 percent of basin capacity) for the Magdalena. For these ten scenarios, the average number of people projected to be affected was 13 times greater than with Scenario 6, while the scenario with the greatest number of projected displaced people would affect 50 times as many people as Scenario 6. Considering impacts on biodiversity priorities and natural land cover from reservoirs, Scenario 6 affected about 10 percent fewer hectares than the average for those 10 scenarios. Thus, considering these three values among the 10 scenarios with similar energy development, Scenario 6 had high performance (relatively low impact) on connectivity and displacement and essentially average performance for biodiversity values affected by reservoirs.
For the Coatzacoalcos, seven scenarios achieved a similar level of energy development as the featured high connectivity scenario (Scenario 7). Of these seven, Scenario 7 had the second lowest impact on displacement (one-third of the average displacement) and the second lowest impact on biodiversity priorities from the reservoir (just over half the average impact). Thus a high connectivity scenario for the Coatzacoalcos had relatively high performance for other important values.
In the Tapajós, eight scenarios achieved a similar level of energy development as the high connectivity scenario featured in the case study (Scenario 22). Reservoirs associated with the dams in Scenario 22 would affect 14,000 ha of indigenous lands. Four of the eight scenarios would only affect 1,350 ha, while the other three scenarios would affect between 21,000 and 92,000 ha with an overall average of 20,400 ha for the eight scenarios. Thus the high connectivity scenario had a smaller impact on indigenous lands than the average, but several scenarios had somewhat lower impacts.
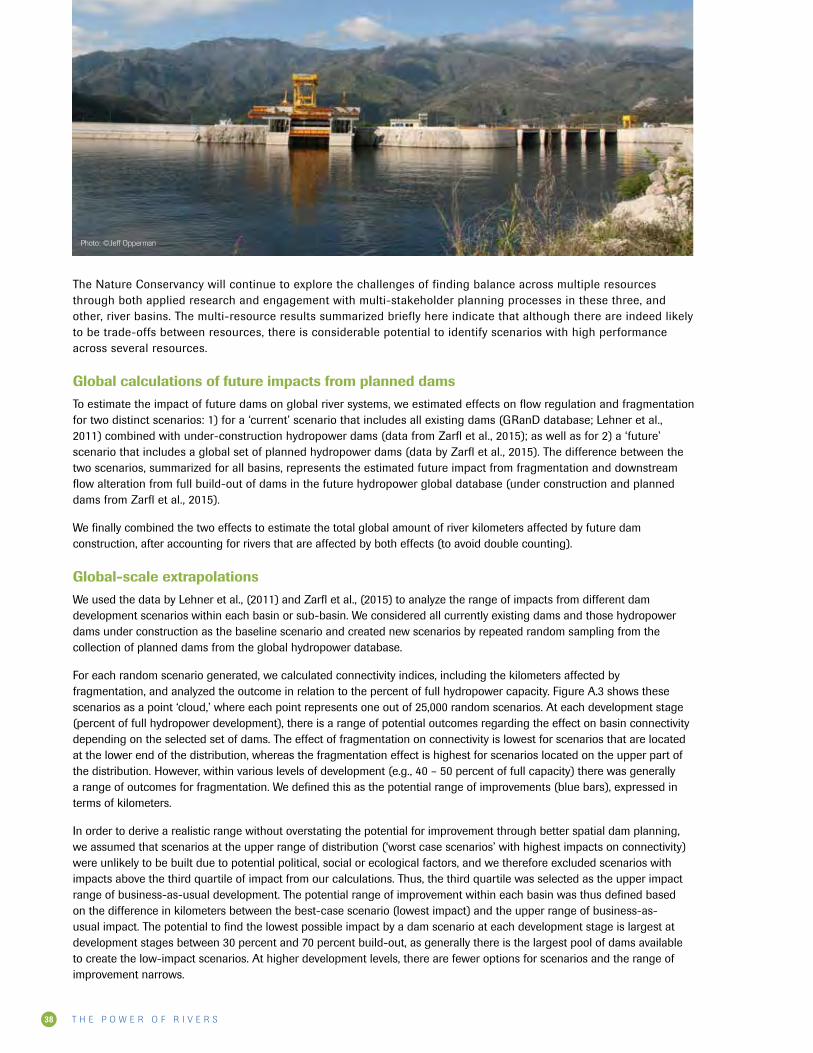
T H E P O W E R O F R I V E R S38
The Nature Conservancy will continue to explore the challenges of finding balance across multiple resources through both applied research and engagement with multi-stakeholder planning processes in these three, and other, river basins. The multi-resource results summarized briefly here indicate that although there are indeed likely to be trade-offs between resources, there is considerable potential to identify scenarios with high performance across several resources.
Global calculations of future impacts from planned damsTo estimate the impact of future dams on global river systems, we estimated effects on flow regulation and fragmentation for two distinct scenarios: 1) for a ‘current’ scenario that includes all existing dams (GRanD database; Lehner et al., 2011) combined with under-construction hydropower dams (data from Zarfl et al., 2015); as well as for 2) a ‘future’ scenario that includes a global set of planned hydropower dams (data by Zarfl et al., 2015). The difference between the two scenarios, summarized for all basins, represents the estimated future impact from fragmentation and downstream flow alteration from full build-out of dams in the future hydropower global database (under construction and planned dams from Zarfl et al., 2015).
We finally combined the two effects to estimate the total global amount of river kilometers affected by future dam construction, after accounting for rivers that are affected by both effects (to avoid double counting).
Global-scale extrapolationsWe used the data by Lehner et al., (2011) and Zarfl et al., (2015) to analyze the range of impacts from different dam development scenarios within each basin or sub-basin. We considered all currently existing dams and those hydropower dams under construction as the baseline scenario and created new scenarios by repeated random sampling from the collection of planned dams from the global hydropower database.
For each random scenario generated, we calculated connectivity indices, including the kilometers affected by fragmentation, and analyzed the outcome in relation to the percent of full hydropower capacity. Figure A.3 shows these scenarios as a point ‘cloud,’ where each point represents one out of 25,000 random scenarios. At each development stage (percent of full hydropower development), there is a range of potential outcomes regarding the effect on basin connectivity depending on the selected set of dams. The effect of fragmentation on connectivity is lowest for scenarios that are located at the lower end of the distribution, whereas the fragmentation effect is highest for scenarios located on the upper part of the distribution. However, within various levels of development (e.g., 40 – 50 percent of full capacity) there was generally a range of outcomes for fragmentation. We defined this as the potential range of improvements (blue bars), expressed in terms of kilometers.
In order to derive a realistic range without overstating the potential for improvement through better spatial dam planning, we assumed that scenarios at the upper range of distribution (‘worst case scenarios’ with highest impacts on connectivity) were unlikely to be built due to potential political, social or ecological factors, and we therefore excluded scenarios with impacts above the third quartile of impact from our calculations. Thus, the third quartile was selected as the upper impact range of business-as-usual development. The potential range of improvement within each basin was thus defined based on the difference in kilometers between the best-case scenario (lowest impact) and the upper range of business-as-usual impact. The potential to find the lowest possible impact by a dam scenario at each development stage is largest at development stages between 30 percent and 70 percent build-out, as generally there is the largest pool of dams available to create the low-impact scenarios. At higher development levels, there are fewer options for scenarios and the range of improvement narrows.
Photo: ©Jeff Opperman
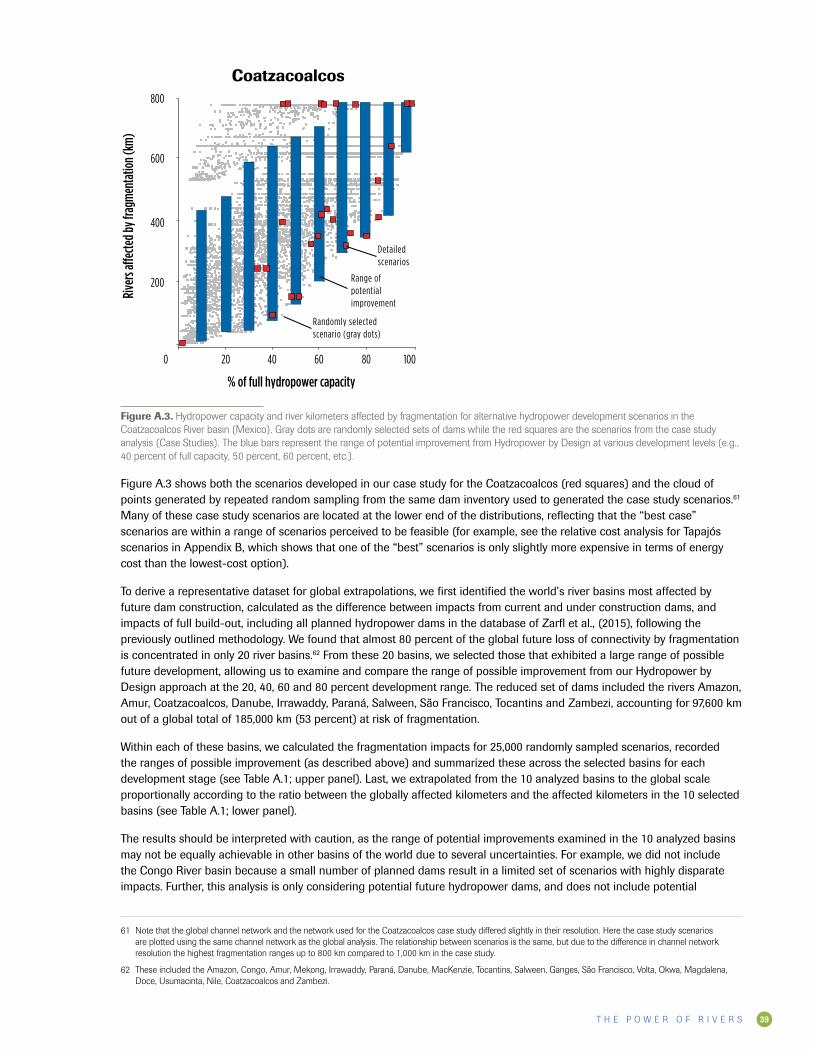
T H E P O W E R O F R I V E R S 39
Coatzacoalcos
% of full hydropower capacity
River
s a�e
cted b
y fra
gmen
tatio
n (km
)
100806040200
800
600
400
200
Randomly selectedscenario (gray dots)
Range ofpotentialimprovement
Detailed scenarios
Figure A.3. Hydropower capacity and river kilometers affected by fragmentation for alternative hydropower development scenarios in the Coatzacoalcos River basin (Mexico). Gray dots are randomly selected sets of dams while the red squares are the scenarios from the case study analysis (Case Studies). The blue bars represent the range of potential improvement from Hydropower by Design at various development levels (e.g., 40 percent of full capacity, 50 percent, 60 percent, etc.).
Figure A.3 shows both the scenarios developed in our case study for the Coatzacoalcos (red squares) and the cloud of points generated by repeated random sampling from the same dam inventory used to generated the case study scenarios.61 Many of these case study scenarios are located at the lower end of the distributions, reflecting that the “best case” scenarios are within a range of scenarios perceived to be feasible (for example, see the relative cost analysis for Tapajós scenarios in Appendix B, which shows that one of the “best” scenarios is only slightly more expensive in terms of energy cost than the lowest-cost option).
To derive a representative dataset for global extrapolations, we first identified the world’s river basins most affected by future dam construction, calculated as the difference between impacts from current and under construction dams, and impacts of full build-out, including all planned hydropower dams in the database of Zarfl et al., (2015), following the previously outlined methodology. We found that almost 80 percent of the global future loss of connectivity by fragmentation is concentrated in only 20 river basins.62 From these 20 basins, we selected those that exhibited a large range of possible future development, allowing us to examine and compare the range of possible improvement from our Hydropower by Design approach at the 20, 40, 60 and 80 percent development range. The reduced set of dams included the rivers Amazon, Amur, Coatzacoalcos, Danube, Irrawaddy, Paraná, Salween, São Francisco, Tocantins and Zambezi, accounting for 97,600 km out of a global total of 185,000 km (53 percent) at risk of fragmentation.
Within each of these basins, we calculated the fragmentation impacts for 25,000 randomly sampled scenarios, recorded the ranges of possible improvement (as described above) and summarized these across the selected basins for each development stage (see Table A.1; upper panel). Last, we extrapolated from the 10 analyzed basins to the global scale proportionally according to the ratio between the globally affected kilometers and the affected kilometers in the 10 selected basins (see Table A.1; lower panel).
The results should be interpreted with caution, as the range of potential improvements examined in the 10 analyzed basins may not be equally achievable in other basins of the world due to several uncertainties. For example, we did not include the Congo River basin because a small number of planned dams result in a limited set of scenarios with highly disparate impacts. Further, this analysis is only considering potential future hydropower dams, and does not include potential
61 Note that the global channel network and the network used for the Coatzacoalcos case study differed slightly in their resolution. Here the case study scenarios are plotted using the same channel network as the global analysis. The relationship between scenarios is the same, but due to the difference in channel network resolution the highest fragmentation ranges up to 800 km compared to 1,000 km in the case study.
62 These included the Amazon, Congo, Amur, Mekong, Irrawaddy, Paraná, Danube, MacKenzie, Tocantins, Salween, Ganges, São Francisco, Volta, Okwa, Magdalena, Doce, Usumacinta, Nile, Coatzacoalcos and Zambezi.

T H E P O W E R O F R I V E R S40
fragmentation from other dams or other impacts on rivers. As discussed in the report, planning that considers other environmental and social values may require trade-offs between resources and, thus, the best balance between energy and connectivity may not be possible in a basin where planning is trying to maintain other environmental or social values.
On the other hand, due to the relatively simple indicator we used for connectivity (the longest connected network), and that it was calculated only at the scale of basins (and not sub-basins; see above and footnote 37), there may in fact be greater potential for maintaining important connectivity, in terms of kilometers, than estimated here. For example, while the best scenarios for the Amazon could identify >15,000 km of potential for reduced fragmentation, the Tapajós was often not part of the longest connected network (i.e., the Tapajós was part of the basin “lost” to fragmentation). However, in our case study analysis—and in real-world conservation efforts—maintaining connectivity within the Tapajós is a priority and Hydropower by Design could identify 2,000 to 3,000 km of potential for improved connectivity. Because these kilometers occur within the disconnected part of the Amazon Basin, they are not included in the global estimate and, thus, they reflect additional kilometers of conservation value that could be maintained. Estimating these nested scales of important connectivity are beyond the scope of this paper, but based on the example of the Tapajós, they may be significant both in terms of their global total in kilometers and because of their conservation value.
Subset of analyzed river basins Sum of affected kilometers (km) Range of potential
improvement
Percent of full hydropower development
in low fragmentation scenarios
in high fragmentation scenarios
as difference of high-low fragmentation scenarios
15%-25% 153,000 174,000 21,000
35%-45% 162,000 216,000 54,000
55%-65% 185,000 240,000 55,000
75%-85% 218,000 248,000 30,000
Extrapolatedto global scale Sum of affected kilometers (km) Range of potential
improvement
Percent of full hydropower development
in low-fragmentation scenarios
in high-fragmentation scenarios
as difference of high-low fragmentation scenarios
15%-25% 295,000 334,000 39,000
35%-45% 312,000 415,000 103,000
55%-65% 356,000 462,000 106,000
75%-85% 419,000 477,000 58,000
Table A.1. Range of potential improvement for different levels of hydropower development for training basins (upper panel) and extrapolated to
global scale (lower panel).

T H E P O W E R O F R I V E R S 41
METHODS FOR QUANTITATIVE ESTIMATES OF COSTS AND BENEFITS
OF HYDROPOWER BY DESIGN
Appendix B
Photo: ©Erika Nortemann

T H E P O W E R O F R I V E R S42
The objective was to provide plausible estimates of additional costs and benefits of Hydropower by Design (i.e., environmental best practices) compared to business-as-usual hydropower. These are necessarily rough, high-level estimates, because: (a) there are very few published data, even at the project level; (b) hydropower is a very site-specific technology; and (c) current practices—and, therefore, the gap between best practices and business-as-usual—differ widely between countries, companies and financing institutions.
Additional costs of best practicesThe numbers below are provided in terms of percent of business-as-usual total investment costs. To convert these percentages into absolute values (US dollars) we assumed an average investment cost of US$2,500 per installed kW capacity. This is close to the middle of the range provided by IRENA (2012), consistent with historical data from Ansar et al., (2014), and consistent with recent projects known to the authors.
Planning and assessment costs. Greater investment in upfront planning and project preparation, including basin plans, Strategic Environmental Assessments, and/or use of the Hydropower Sustainability Assessment Protocol are estimated to represent a cost increase of 1 percent compared to business-as-usual. This estimate is based on expert opinion and known costs for basin plans and comparable studies, for studies as a percentage of project costs, and the actual costs of a Protocol assessment. As an example, a 100 MW project would cost approximately US$250 million overall, with typical costs for feasibility studies and environmental impact assessment (EIA) of US$5 million. An additional 1 percent of total investment would result in an additional US$2.5 million for more comprehensive planning, including a project-level contribution to basin planning, a cost which could be shared by multiple projects.
Cost of alternative siting. Hydropower by Design will sometimes require selecting somewhat more expensive projects to avoid lower-cost projects with higher environmental and social impacts. The difference in cost will depend on the specific cost curve of the basin or country, a curve that ranks potential projects by cost per kWh (the ‘levelized cost of energy,’ or LCOE). We derived cost curves for a number of basins or countries from master plans to review their typical slopes (i.e., rate of cost increase as capacity is expanded). In our basin analyses, we found that alternative scenarios with similar energy but improved environmental outcomes were often relatively similar in cost (essentially equal, due to a low slope of the cost curve in the relevant capacity range), but others ranged up to 20 percent more expensive compared to an alternative based solely on least-cost criterion (due to a steep cost curve). For details, see “Relative cost analysis” on page 44.
Therefore, a reasonable average estimate for alternative siting is 10 percent of the business-as-usual cost, with the understanding that this is highly case specific. Note that avoiding some projects, and permanently protecting those river stretches, is equivalent to offsetting (see below). Thus, the 10 percent cost increase can be understood as the opportunity cost of those offsets. This cost is a function of the attractiveness of the “offset river” for hydropower development, and this opportunity cost is typically not quantified within offset projects.
Cost of best practices mitigation, including offsets. In the regions where hydropower is expanding rapidly, the proportion of project costs typically dedicated to environmental mitigation is generally between 1 and 4 percent (excluding relocation costs and social program costs which can be considerably higher and are a function of the number of people affected). This is based on sector data on environmental mitigation costs from Brazil (World Bank, 2008) and the United States (Hall et al., 2003), as well as a review of many individual project budgets.
We estimate that, on average, an additional 2 percent of costs would allow most projects to move toward international best practices for mitigation. Half of this additional cost (1 percent) could be dedicated toward local improvements (such as the capital cost of a fish ladder), while the other half (another 1 percent) would be invested in regional conservation goals, such as protection of other free-flowing rivers in the region. This could cover, for example, the direct costs of management plans and measures to provide equivalent habitat in another river. These are additional to the indirect or opportunity costs of offsets, which consist of the foregone hydropower revenue from projects that were avoided, as described above. For example, in Costa Rica’s Reventazón project, the direct costs of the offset program were below US$3 million during project implementation.63
These data are based on expert opinion, including interviews with independent assessors who have evaluated hydropower projects using the Hydropower Sustainability Assessment Protocol, and have estimated the cost of closing gaps in sustainability performance between business-as-usual and environmental best practices.
63 For a more extensive review of offset investments for hydropower mitigation, see Hartmann et al., (2013; available online) with a case study on the Reventazón River (beginning on page 16).

T H E P O W E R O F R I V E R S 43
Costs of operational constraints. Operating a dam to achieve higher environmental performance −such as the release of environmental flows, maintaining certain reservoir levels, and maintaining a permanent flow through a fish bypass—can reduce generation leading to foregone revenues. We estimate an overall average cost of operational constraints of 2 percent of project costs (on a net present value basis), based on projects known to the authors where the costs of different environmental flow levels were compared and a limited range of published data. Studies on projects in the United States that have been re-operated to improve environmental performance suggest a loss of 3.5 percent of generation on average (Jager and Bevelhimer, 2007). A study by the U.S. Federal Energy Regulatory Commission (FERC, 2001) found that improving environmental performance at 240 dams in the United States since 1986 had, on average, reduced generation by 1.6 percent. Many countries already have some minimum environmental flow rules. For dams that have been appropriately selected to avoid critical areas, these minimum rules may be sufficient. Only a minority of projects in the Jager and Bevelhimer (2007) study had to be re-operated to renew their license. In other countries, a larger proportion of projects may lose significant amounts of generation in order to achieve best practices.
Additional benefits of best practicesEven fewer data or examples are available to estimate the potential benefits of implementing Hydropower by Design (i.e., achieving environmental best practices). Below we provide some hypotheses of potential benefits of implementing Hydropower by Design, and associated financial benefits that could accrue to project developers and thus help offset some of the additional costs of implementing environmental best practices.
Cost reduction potential. A recent survey found that for a sample of 245 large hydropower dams, the median cost overrun was 27 percent (average was 96 percent) and completion times were 27 percent longer than anticipated (average was 44 percent; Ansar et al., 2014). For this analysis, we will use median values as the averages are affected by outliers. Delays and costs are related, for example through increased interest during construction and delayed revenues. There are multiple reasons for such problems, and they are not well documented, but the potential to reduce delays and cost overruns is significant. If improved environmental and social performance—and thus lower risk of controversy, suspension or unexpected mitigation costs—could reduce delays and cost overruns by just one quarter, this would account for a 7 percent cost savings compared to approaches with status quo risk profiles. Reduction of overruns by one-quarter is broadly consistent with risks identified in surveys among hydropower companies (Plummer, 2013).
As an additional example of cost reduction, Hydropower by Design can help reduce mitigation costs by choosing sites that will cause lower mitigation costs in the long run, and by targeting mitigation expenditure more effectively. Such costs can become very substantial over the long run. For example, the fish and wildlife mitigation costs of the Bonneville Power Administration in the northwest United States were US$13.75 billion between 1978 and 2013, and currently constitute about one-third of the power rates (Northwest Power and Conservation Council, 2014).
Potential for improved financing terms. Projects with better risk-management profiles are more attractive as investments for equity investors, bondholders and banks, which should reduce financing costs. Indeed, financiers should consider actively incentivizing lower-risk projects through funding early stage planning and preferential financing terms. Because hydropower is so capital intensive and long-term, interest rates have a very significant influence on the costs of energy. For illustration, for a US$100 million project fully debt financed and paid off over 20 years (with total costs, including interest, reaching US$175 million), a reduction in interest rates from 8 percent to 7.5 percent would reduce debt service by US$7 million or 4 percent of total costs.
Photo: ©Jeff Opperman
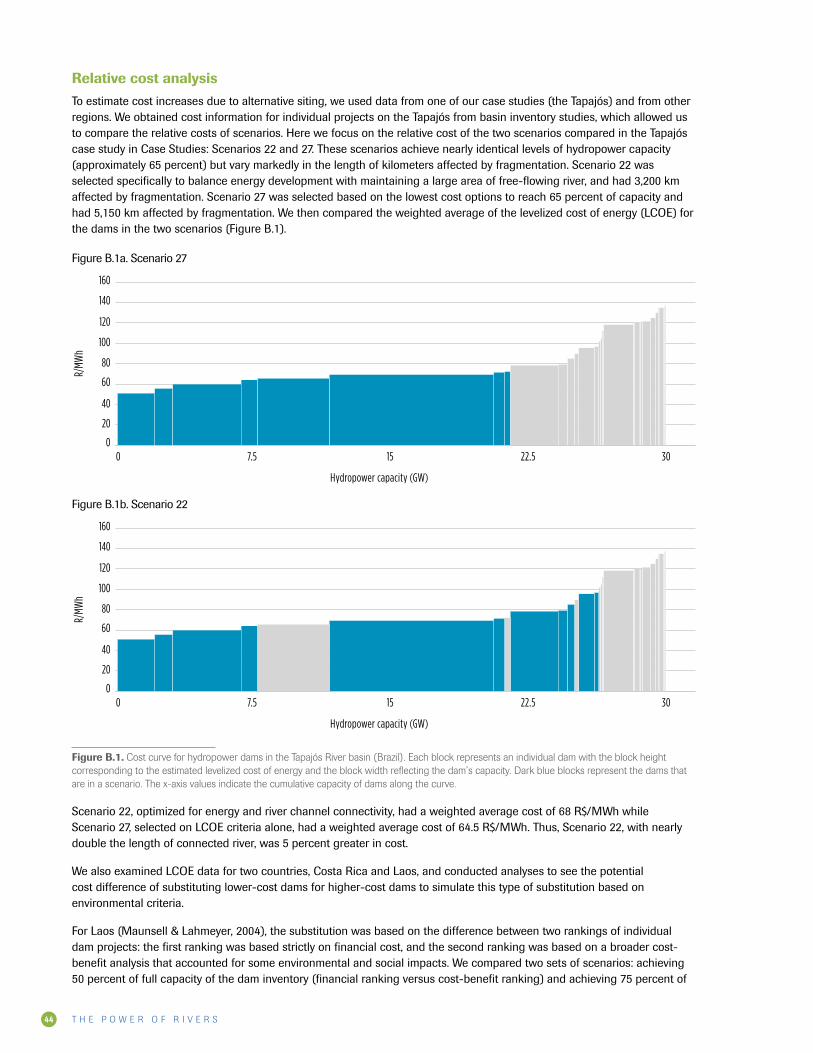
T H E P O W E R O F R I V E R S44
Relative cost analysisTo estimate cost increases due to alternative siting, we used data from one of our case studies (the Tapajós) and from other regions. We obtained cost information for individual projects on the Tapajós from basin inventory studies, which allowed us to compare the relative costs of scenarios. Here we focus on the relative cost of the two scenarios compared in the Tapajós case study in Case Studies: Scenarios 22 and 27. These scenarios achieve nearly identical levels of hydropower capacity (approximately 65 percent) but vary markedly in the length of kilometers affected by fragmentation. Scenario 22 was selected specifically to balance energy development with maintaining a large area of free-flowing river, and had 3,200 km affected by fragmentation. Scenario 27 was selected based on the lowest cost options to reach 65 percent of capacity and had 5,150 km affected by fragmentation. We then compared the weighted average of the levelized cost of energy (LCOE) for the dams in the two scenarios (Figure B.1).
Figure B.1a. Scenario 27
40
20
0
80
60
120
100
140
160
R/MW
h
7.5 15 22.5 30
Hydropower capacity (GW)
0
Figure B.1b. Scenario 22
40
20
0
80
60
120
100
140
160
R/MW
h
7.5 15 22.5 30
Hydropower capacity (GW)
0
Figure B.1. Cost curve for hydropower dams in the Tapajós River basin (Brazil). Each block represents an individual dam with the block height corresponding to the estimated levelized cost of energy and the block width reflecting the dam’s capacity. Dark blue blocks represent the dams that are in a scenario. The x-axis values indicate the cumulative capacity of dams along the curve.
Scenario 22, optimized for energy and river channel connectivity, had a weighted average cost of 68 R$/MWh while Scenario 27, selected on LCOE criteria alone, had a weighted average cost of 64.5 R$/MWh. Thus, Scenario 22, with nearly double the length of connected river, was 5 percent greater in cost.
We also examined LCOE data for two countries, Costa Rica and Laos, and conducted analyses to see the potential cost difference of substituting lower-cost dams for higher-cost dams to simulate this type of substitution based on environmental criteria.
For Laos (Maunsell & Lahmeyer, 2004), the substitution was based on the difference between two rankings of individual dam projects: the first ranking was based strictly on financial cost, and the second ranking was based on a broader cost-benefit analysis that accounted for some environmental and social impacts. We compared two sets of scenarios: achieving 50 percent of full capacity of the dam inventory (financial ranking versus cost-benefit ranking) and achieving 75 percent of

T H E P O W E R O F R I V E R S 45
full capacity (financial ranking versus cost-benefit ranking). The rankings did not vary greatly and in each of two scenarios (develop 50 percent of full capacity and develop 75 percent of full capacity) the only difference was the substitution of one higher-LCOE-but-lower-impact dam for a lower-LCOE-but-higher-impact dam. Although the environmentally weighted rankings were not considerably different, these two rankings allow testing for substitution of a single dam for an environmentally preferable dam. The differences in weighted average cost were slight: a difference of 2 percent for the 50 percent development scenario and a difference of 1 percent for the 75 percent scenario.
For Costa Rica (ICE, 2012), we aimed to explore the potential for replacing large, relatively low-cost dams with dams higher on the cost curve to explore the upper boundaries of cost for alternative siting. For example, we examined the impact on cost for replacing Diquís Dam, the largest and lowest-cost option in a national inventory of potential hydropower dams. We again compared two sets of scenarios: achieving 50 percent of full capacity (with and without Diquís) and achieving 75 percent of full capacity (with and without Diquís). Individually, Diquís Dam represents nearly 30 percent of the capacity in the entire dam inventory. Avoiding Diquís and achieving 50 percent capacity development would cost 20.5 percent more than achieving 50 percent capacity with Diquis. Avoiding Diquís and achieving 75 percent capacity would cost 29 percent more than achieving 75 percent capacity with Diquís.
We then examined the relative cost difference of including Diquís, but dropping the next three lowest-cost projects as a thought experiment for substituting multiple, relatively low-cost dams, for dams higher on the cost curve (as a hypothetical thought experiment based on the premise that those three dams should be avoided due to environmental impacts and replaced with other dams higher on the cost curve; Figure B.2). Due to the relatively flat cost curve for dams in Costa Rica, those three dams could be replaced at fairly low cost. A 50 percent development scenario without these dams would cost 4.5 percent more and a 70 percent development scenario without these dams would cost 2 percent more.
0.05
0
0.1
0.15
0.2
$/kW
h
Figure B.2a. Lowest cost scenario
Hydropower capacity (MW)
550 1,100 1,650 2,2000
0.05
0
0.1
0.15
0.2
$/kW
h
Figure B.2b. Scenario that substitutes three dams
Hydropower capacity (MW)
550 1,100 1,650 2,2000
Figure B.2. Cost curve for potential hydropower dams in Costa Rica. Each block represents an individual dam with the block height corresponding to the dam’s estimated levelized cost of energy and the block width reflecting the dam’s capacity. Dark blue blocks represent the dams that are included in a scenario. The x-axis values indicate the cumulative capacity of dams along the curve. The top scenario shows the lowest cost set of dams to achieve 70 percent capacity of the dam inventory while the lower scenario shows the set of dams that can achieve 70 percent, but replaces three of the four lowest cost dams with dams higher on the cost curve, as a thought experiment that simulates substituting those dams for environmental reasons.

T H E P O W E R O F R I V E R S46Photo: ©Bridget Besaw
REFERENCES
Appendix C
T H E P O W E R O F R I V E R S 47
Abell, R., Thieme, M., Revenga, C., Bryer, M., Kottelat, M., Bogutskaya, N., . . . Petry, P. (2008). Freshwater Ecoregions of the World: A New Map of Biogeographic Units for Freshwater Biodiversity Conservation. BioScience,58(5), 403-414.
Alcamo, J. P., Döll, P., Henrichs, T., Kaspar, F., Lehner, B., Rösch, T., & Siebert, S. (2003). Global estimates of water withdrawals and availability under current and future “business-as-usual” conditions. Hydrological Sciences Journal, 48, 339-348.
Ansar, A., Flyvbjerg, B., Budzier, A., & Lunn, D. (2014). Should we build more large dams? The actual costs of hydropower megaproject development. Energy Policy, 69, 43-56.
Brown, J. J., Limburg, K. E., Waldman, J. R., Stephenson, K., Glenn, E. P., Juanes, F., Jordaan, (2013). Fish and hydropower on the U.S. Atlantic coast: failed fisheries policies from half way technologies. Conservation Letters, 6(4), 280-286.
Bruckner, T., Fulton, L., Hertwich, E., McKinnon, A., Perczyk, D., Roy, J., . . . Schaeffer, R. (2014). Annex III: Technology-specific Cost and Performance Parameters. Retrieved from Climate Change 2014: Mitigation of Climate Change. Contribution of Working Group III to the Fifth Assessment Report of the Intergovernmental Panel on Climate Change website: http://report.mitigation2014.org/report/ipcc_wg3_ar5_annex-iii.pdf
Diario Oficial de la Federación. (2014). Programa Especial para el Aprovechamiento de Energías Renovables. Retrieved from http://www.dof.gob.mx/nota_detalle.php?codigo=5342501&fecha=28/04/2014
Döll, P., & Lehner, B. (2003). A global hydrological model for deriving water availability indicators: model tuning and validation. Journal of Hydrology, 270, 105-134.
Dugan, P., Delaporte, A., Andrew, N., O’Keefe, M., & Welcomme, R. (2010). Blue Harvest: Inland Fisheries as an Ecosystem Service (DEP/1316/NA). Retrieved from United Nations Environment Programme website: http://www.unep.org/pdf/Blue_Harvest.pdf
Dynesius, M., & Nilsson, C. (1994). Fragmentation and flow regulation of river systems in the northern third of the world. Science, 266(5186), 753-762.
Gillson, J. (2011). Freshwater flow and fisheries production in estuarine and coastal systems: where a drop of rain is not lost. Reviews in Fisheries Science,19(3), 168-186.
Grill, G., Lehner, B., Lumsdon, A. E., MacDonald, G. K., Zarlf, C., & Reidy Liermann, C. A. (2015). An index-based framework for assessing patterns and trends in river fragmentation and flow regulation by global dams at multiple scales. Environmental Research Letters, 10.
Grill, G., Ouellet Dallaire, C., Fluet Chouinard, E., Sindorf, N., & Lehner, B. (2014). Development of new indicators to evaluate river fragmentation and flow regulation at large scales: A case study for the Mekong River Basin. Ecological Indicators, 45, 148-159. doi:10.1016/j.ecolind.2014.03.026
Hall, D. G., Hunt, R. T., Reeves, K. S., & Carroll, G. R. (2003). Estimation of Economic Parameters of U.S. Hydropower Resources. Retrieved from Idaho National Engineering and Environmental Laboratory. Bechtel BWXT Idaho, LLC. Website: http://www1.eere.energy.gov/wind/pdfs/doewater-00662.pdf
Hartmann, J., Harrison, D., Gill, R., & Opperman, J. (2013). The Next Frontier of Hydropower Sustainability: Planning at the System Scale. Website: https://www.conservationgateway.org/ConservationPractices/Freshwater/WaterInfrastructure/Pages/hydroatscale.aspx
T H E P O W E R O F R I V E R S48
Houde, E. D., & Rutherford, E. S. (1993). Recent trends in estuarine fisheries: predictions of fish production and yield. Estuaries, 16(2), 161-176.
Hydropower Sustainability Assessment Forum. 2010. Hydropower Sustainability Assessment Protocol. Retrieved from http://www.hydrosustainability.org/Protocol/Documents.aspx
ICEM - International Centre for Environmental Management. (2010). Strategic Environmental Assessment of Hydropower on the Mekong Mainstem. Retrieved from http://www.mrcmekong.org/assets/Publications/Consultations/SEA-Hydropower/SEA-Main-Final-Report.pdf
Inland Fisheries Research and Development Instiutute (IFReDI). (n.d.). Food and nutrition security vulnerability to mainstream hydropower dam development in Cambodia. Retrieved from Inland Fisheries Research and Development Institute, Fisheries Administration website: https://www.oxfam.org.au/wp-content/uploads/2014/02/pdf_food-and-nutrition-for-print-2.pdf
Instituto Costarricense de Electricidad (ICE). (2012). Plan de expansion de la generaction electrica period 2012 – 2014. Retrieved from https://www.grupoice.com/wps/wcm/connect/3bd3a78047cdebee904df9f079241ace/PEG2014+rev+jun2014.pdf?MOD=AJPERES
International Energy Agency (IEA). Technology Roadmap: Hydropower. (2012). Retrieved from International Energy Agency-IEA website: http://www.iea.org/publications/freepublications/publication/technologyroadmaphydropower.pdf
International Energy Agency (IEA). (2014). World energy outlook 2014. Retrieved from http://www.worldenergyoutlook.org/publications/weo-2014/
International Renewable Energy Agency (IRENA). (2012). Renewable Energy Technologies: Cost Analysis Series, Volume I: Power Sector, Hydropower. Retrieved from http://www.irena.org/documentdownloads/publications/re_technologies_cost_analysis-hydropower.pdf
International Union for Conservation of Nature (IUCN). (2001). Economic value of reinundation of the Waza Logone flood-plain, Cameroon. Projet de Conservation et de Développement de la Région de Waza-Logone, Maroua. Leiden, the Netherlands: IUCN.
Jager, H. I., & Bevelhimer, M. S. (2007). How run-of-river operation affects hydropower generation and value. Environmental Management, 40(6), 1004-1015.
Kiesecker, J. M., Copeland, H., Pocewicz, A., & McKenny, B. (2009). Development by design: blending landscape-level planning with the mitigation hierarchy (8, no. 5: 261-266). Frontiers in Ecology and the Environment.
Krchnak, K., Richter, B., & Gregory, T. (2009). Integrating environmental flows into hydropower dam planning, design, and operations (51004). Retrieved from World Bank Group website: http://documents.worldbank.org/curated/en/2009/11/11510159/integrating-environmental-flows-hydropower-dam-planning-design-operations
Kumar, A., T. Schei, A. Ahenkorah, R. Caceres Rodriguez, J.-M. Devernay, M. Freitas, D. Hall, Å. Killingtveit, & Z. Liu (2011). Hydropower. In IPCC Special Report on Renewable Energy Sources and Climate Change Mitigation [O. Edenhofer, R. Pichs-Madruga, Y. Sokona, K. Seyboth, P. Matschoss, S. Kadner, T. Zwickel, P. Eickemeier, G. Hansen, S. Schlömer, C. von Stechow (eds)], Cambridge University Press, Cambridge, United Kingdom and New York, NY, USA.
Lehner, B., Liermann, C. R., Revenga, C., Vörösmarty, C., Fekete, B., Crouzet, P., . . . Döll, P. (2011). High-resolution mapping of the world’s reservoirs and dams for sustainable river-flow management. Frontiers in Ecology and the Environment, 9, 494-502.

T H E P O W E R O F R I V E R S 49
Lehner, B. (2008). New global hydrography derived from spaceborne elevation data.EOS, Transactions of the American Geophysical Union, 89, 93-104.
Lymer, D. (2015). A Global Estimate of Theoretical Potential Annual Inland Capture Fisheries Production. Symposium conducted at the meeting of the Food and Agriculture Organization of the United Nations Global Conference on Inland Fisheries — Freshwater, Fish, and the Future: A Cross-Sectoral Conference to Sustain Livelihoods, Food Security, and Aquatic Ecosystems, Rome, Italy.
Marine Resources Assessment Group (MRAG). 1993 Simple predictive models for tropical river fisheries, Final Technical Report. Marine Resources Assessment Group Ltd, London, UK.
Maunsell, & Lahmeyer International. (2004). Power system development plan for LAO PDR. Final report. Volume A: Main report. World Bank.
McDonald, R. I., Olden, J. D., Opperman, J. J., Miller, W. M., Fargione, J., Revenga, C., Higgins, J.V., Powell, J. (2012). Energy, Water and Fish: Biodiversity Impacts of Energy-Sector Water Demand in the United States Depend on Efficiency and Policy Measures. PloS one, 7(11). doi:10.1371/journal.pone.0050219
McLellan, R., Iyengar, L., Jeffries, B., Oerlemans, N., Grooten, M., Guerraoui, M., & Sunters, P. (2014). Living Planet Report 2014 Species and spaces, people and places. Retrieved from World Wildlife Fund website: http://wwf.panda.org/about_our_earth/all_publications/living_planet_report/living_planet_index2/
Nilsson, C., Reidy, C. A., Dynesius, M., & Revenga, C. (2005). Fragmentation and flow regulation of the world’s large river systems. Science, 308, 405-408.
Noonan, M. J., Grant J. WA, Jackson, C.D. (2012). A quantitative assessment of fish passage efficiency. Fish and Fisheries, 13(4), 450-464.
Northwest Power and Conservation Council. (2014). 2013 Columbia River Basin Fish and Wildlife Program Costs Report. 13th Annual Report to the Northwest Governors.
Opperman, J. J., G. E. Galloway, and S. Duvail. (2013). The multiple benefits of river-floodplain connectivity for people and biodiversity. Pages 144-160 in S. Levin, editor. Encyclopedia of Biodiversity, second edition, Volume 7. Academic Press, Waltham, MA.
Plummer, J. (2013). Assessing the Effects of Pre-construction Delay in Hydropower Projects. Cambridge, England: University of Cambridge.
Richter, B. D., Braun, D. P., Mendelson, M. A., & Master, L. L. (1997). Threats to Imperiled Freshwater Fauna. Conservation Biology, 11(5), 1081-1093. doi:10.1046/j.1523-1739.1997.96236.x
Richter, B. D., Postel, S., Revenga, C., Scudder, T., Lehner, B., Churchill, A., & Chow, M. (2010). Lost in development’s shadow: The downstream human consequences of dams. Water Alternatives, 3(2), 14-42.
Siebert, S., Burke, J., Faures, J. M., Frenken, K., Hoogeveen, J., Döll, P., & Portmann, F. T. (2010). Groundwater use for irrigation–a global inventory. Hydrology and Earth System Sciences, 14(10), 1863-1880. Retrieved from Hydrology and Earth System Sciences website: http://www.fao.org/docrep/013/al816e/al816e00.pdf
The Federal Energy Regulatory Commission (FERC). (2001). Report on hydroelectric licensing policies, procedures, and regulations comprehensive review and recommendations pursuant to Section 603 of the Energy Act of 2000. Retrieved from Federal Energy Regulatory Commission website: http://www.ferc.gov/legal/maj-ord-reg/land-docs/ortc_final.pdf
T H E P O W E R O F R I V E R S50
The Nature Conservancy Barrier Analysis Tool (Version 2.0) [Software]. 2013. Software Developer: Duncan Hornby, GeoData institute
The Nature Conservancy (TNC). (2015). Conservation by design: A strategic framework for mission success, 20th anniversary edition. Retrieved from http://www.nature.org/media/aboutus/conservation-by-design-20th-anniversary-edition.pdf
World Bank. (2008). Environmental Licensing for Hydroelectric Projects in Brazil: A Contribution to the Debate (40995). Retrieved from http://documents.worldbank.org/curated/en/2008/03/10155469/environmental-licensing-hydroelectric-projects-brazil-contribution-debate-vol-1-3-summary-report
The World Commission on Dams. (2000). Dams and Development: A New Framework for Decision-Making. Earthscan Publications Ltd. Retrieved from http://www.unep.org/dams/WCD/report/WCD_ DAMS%20report.pdf
World Energy Council, & Paul Scherrer Institute (PSI). (2013). World Energy Scenarios: Composing energy futures to 2050. Retrieved from http://www.worldenergy.org/wp-content/uploads/2013/09/World-Energy-Scenarios_Composing-energy-futures-to-2050_Full-report.pdf
U.S. Energy Information Administration (EIA), How much carbon dioxide is produced per kilowatthour when generating electricity with fossil fuels? (2015, March 30). Retrieved from http://www.eia.gov/tools/faqs/faq.cfm?id=74&t=11
Vörösmarty, C. J., Sharma, K. P., Fekete, B. M., Copeland, A. H., Holden, J., Marble, J., & Lough, J. A. (1997). The storage and aging of continental runoff in large reservoir systems of the world. AMBIO: Journal of the Human Environment, 26, 210-219.
Zarlf, C., Lumsdon, A. E., Berlekamp, J., Tydecks, L., & Tockner, K. (2015). A global boom in hydropower dam construction. Aquatic Sciences, 77, 161-170.
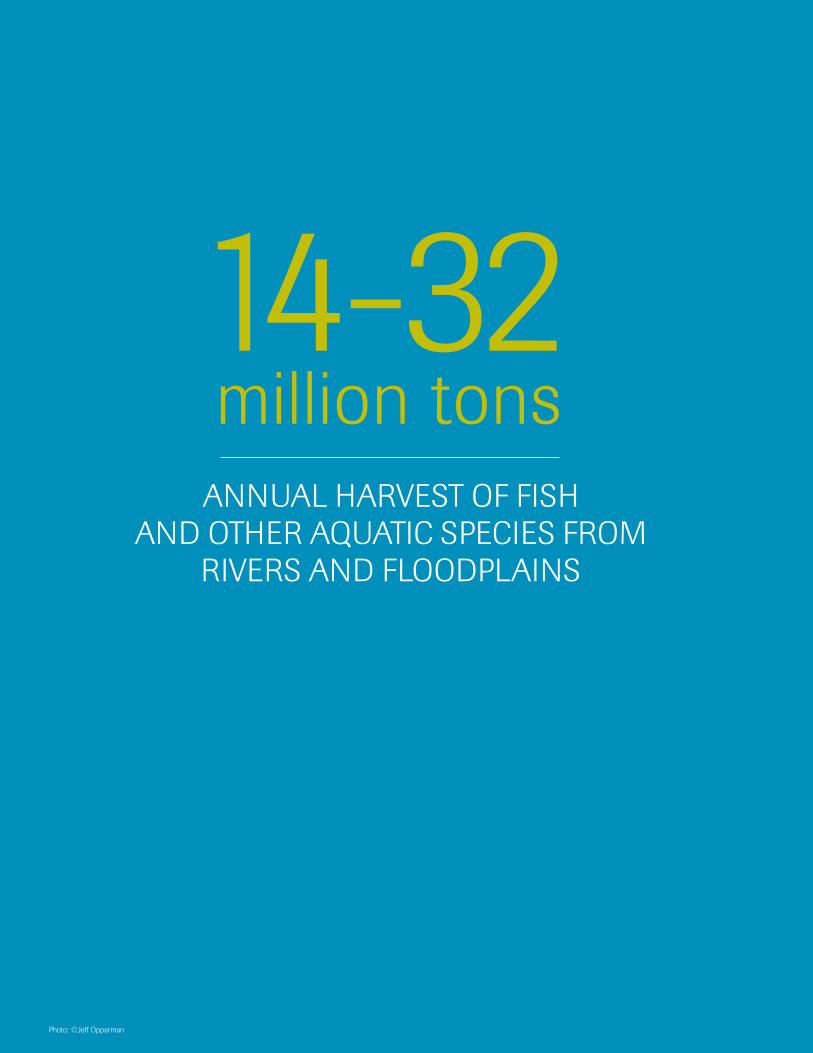
T H E P O W E R O F R I V E R S 51
ANNUAL HARVEST OF FISH AND OTHER AQUATIC SPECIES FROM
RIVERS AND FLOODPLAINS
14-32million tons
Photo: ©Jeff Opperman

Photos: Cover (top) ©Ami Vitale, (bottom) ©Bridget Besaw. Back cover: ©Ami Vitale
About The Nature ConservancyThe Nature Conservancy’s water program is backed by 400 staff working across more than 500 freshwater conservation projects around the world. We use science, innovation and collaboration to meet the global challenges facing rivers today. By providing strategic guidance on hydropower planning, downstream flows and other solutions to protect and restore rivers, we have collaborated on conservation or restoration solutions with the U.S. Army Corps of Engineers, Mexico’s Federal Commission for Electricity and China Three Gorges Corporation.
Paper Contact:Jeff Opperman, Lead Scientist, Great Rivers Partnership, The Nature Conservancy Email: [email protected] | Phone: (530) 400-4847
LENGTH OF RIVER CHANNEL WITH POTENTIAL FOR IMPROVED OUTCOMES FROM HYDROPOWER BY DESIGN AND
OTHER ENVIRONMENTAL BEST PRACTICES
100,000 km