RIVERS STATE UNIVERSITY OF SCIENCE AND TECHNOI,OGY …
148
-i- RIVERS STATE UNIVERSITY OF SCIENCE AND TECHNOI,OGY 1 NKPOLU, PORT HARCOURT, NIGERIA. A BIOCHEMICAL INVESTIGATION OF THE TAXONOMY OF THE CASSAVA GREEN MITE Mononychellus spp. (ACARI: TETRANYCHIDAE) IN KENYA. BY KENNETH KAMBONA OYUGI. BSc (Hons) (UNIVERSITY OF NAIROBI) THESIS SUBMITTED IN PARTIAL FULFILLMENT OF THE REQUIREMENT FOR THE AWARD OF A MASTER OF PHILOSOPHY (M.Phil) DEGREE IN APPLIED ENTOMOLOGY. APRIL, 1989 . • I
Transcript of RIVERS STATE UNIVERSITY OF SCIENCE AND TECHNOI,OGY …

-i-
RIVERS STATE UNIVERSITY OF SCIENCE AND TECHNOI,OGY 1
NKPOLU, PORT HARCOURT, NIGERIA.
A BIOCHEMICAL INVESTIGATION OF THE
TAXONOMY OF THE CASSAVA GREEN MITE Mononychellus
spp. (ACARI: TETRANYCHIDAE) IN KENYA.
BY
KENNETH KAMBONA OYUGI. BSc (Hons)
(UNIVERSITY OF NAIROBI)
THESIS SUBMITTED IN PARTIAL FULFILLMENT OF THE
REQUIREMENT FOR THE AWARD OF A MASTER OF
PHILOSOPHY (M.Phil) DEGREE IN APPLIED ENTOMOLOGY.
APRIL, 1989 .
• I

"Africa has unfortunately concentrated on utilitarian
sciences. These have been seen as passport to employment
and success. We have neglected the old fashion idea of
traininig the intellect, this is worrying"
Thomas.R.Odhiambo.

-ii-
DECLARATIONS
This thesis is my work and has not been presented for a degree in any other University.
~~eth Kambona
This thesis has been submitted for examination with our approvals as supervisors.
Dr. Lucie M. Rogo The International Centre of Insect Physiology and Ecology, P.O Box 30772 Nairobi, Kenya.
L .'t-f. Rogo.
Dr. Wilber Lwande. The International Center of Insect Physiology and Ecology, P.O.Box 30772 Nairobi, Kenya.
W. Lwande.
Prof. R. Kumar University of Science and Technology, Nkpolu P.M.B. 5080 Port Harcourt, Nigeria.
R. Kumar.

-iii-
ACKNOWLEDGEMENTS
I wish to express my gratitude to the
Director of the International Centre of Insect
Physiology and Ecology (ICIPE), Professor Thomas
R. Odhiambo for the permission to conduct this
work at ICIPE. My sincere thanks to Dr. M.E.
Smalley, the Academic cordinator of the African
Regional Postgraduate Programme in Insect Science
(ARPPIS), for the excellent way in which he
handled my day to day problems during the study
period.
I am most indebted to Dr (Mrs) L. M.
Rogo, currently at the university of Umea, Sweden,
for supervising this work and specifically for her
many acts of goodwill and concern since its
inception. I express my deep gratitude to Dr. W.
Lwande, who as my second supervisor followed my
progress throughout, giving valuable comments and
suggestions. Special thanks to Prof. R. Kumar, my
supervisor at The Rivers State University of
Science and Technology, Nigeria for assisting me
so much during the many times I had to call on his
vast experience.

-iv-
I wish to thank Dr A. Hassanali, unit head,
Chemistry and Bioassay Research Unit, ICIPE, for
extending me the· unit facilities and for the
useful advice throughout the entire period of my
studies. It is my pleasure to thank Dr. S.K.
Nokoe, unit head Biomathematics research unit
(ICIPE) and Mr 0. Okelo for the data analysis and
interpretation.
I thank Dr. Ellie Osir of the Biochemistry
Unit, ICIPE, Dr M. Hassane and Mr. F. Obunga
Otieno of the University of Nairobi who of ferred
suggestions and critically read the manuscript.
The technical assistance of Mr. J. Obara and Mr.L.
Labongo of the Biological Control Sub-programme
and the Biochemistry Research Unit respectively,
is very much appreciated. Much thanks to all
other technical staff of ICIPE who in their
various capacities have contributed to the
production of this work.
I would like to thank Mrs. A.A. Okumali and
Mrs M.S. Myendo who made sure things went on right
during my study period. Last, but not least, I
owe a lot to my parents, for their understanding
and constant encouragement during the course of my
study.

-v-
ABSTRACT
Biochemical methods have been applied to
elucidate the species systematics of cassava green
mite (CGM). Traditionally CGM have been
classified using the length of the dorso-central
setae (D1-o3 ), which groups CGM into two species,
the short setae form, Hononychellus tanajoa
(Bandar) and the long setae form Mononychellus
progresivus Doreste. However the validity of this
method of classification is being questioned
because the setae were found to vary from short to
long in a continuous gradient. This
characteristic, therefore becomes unreliable for
species separation.
Isoenzyme analysis and cuticular
hydrocarbon studies were carried out using
isoelectric focusing and gas chromatography
respectively. Thirteen enzyme/substrate systems
were used in distinguishing closely related
species. These were; Aconitate hydratase, alcohol
dehydrogenase, glucose-6-phosphate dehydrogenase,
i.socitrate dehyrogenase, malate dehydrogenase,
mannose phosphate isomerase malic enzyme,
phosphoglucomutase, superoxide dimutase,
nucleoside hydratase, hexokinase, glucose

-vi-
phosphate isomerase and pyruvate kinase. Out of
the thirteen, three enzymes proved most powerful
as taxonomic indicators, namely; malic enzyme,
glucose phosphate isomerase and rnalate
dehydrogenase. CGM populations showed identically
migrating bands for these enzymes. Multivariate
analysis was applied to demonstrate the
statistical significance of the electrophoretic
data. No major significant differences were
observed within the band parameters.
Hexane soluble cuticular hydrocarbons of
the short and long setae forms, were separated by
gas chromatography. The chromatographic profiles
were identical for the two setal forms.
It is clear from these results that
there are no biochemical variants in CGM
populations of Kenya. Consequently, there is no
evidence to warrant species differentiation. Only
a single species of CGM~ Mononychellus tanajoa can
be considered to occur in Kenya.

-vii-
DEDICATED
'l.'o
My grandfather, Ogot Oyugi,

-viii-
TABLE OF CONTENTS
TIT1.JE PAGE . .•.•.•..••...•.••....•.................
DECLARATION •••••••••••••••••••••••••••••••.•••••••
ACKNOWLEDGEMENTS ••••••••••••••••••••••••••••••••••
ABSTRACTS •••••••••••••••••••••••••••••••••••••••••
DEDICATION . ...................................... .
TABLE OF CON'l.'ENTS •••••••••••••••••••••••••••••••••
LIST OF FIGURES ••••••••••••••••••••••••••.•••••••
LI ST OF '!'ABLES ••••••••••••••••••••••••••••••••••••
r.1s·.r OF PLATES . ................................... .
1. GENERAL INTRODUCTION ••.•.•..••..••.....•.•.•
pages
i
ii
ii-iv
iv-vi
vi
vi-ix
ix-xi ·
xi-xvi
xvi
1-9
Objective.... . . . . . . . . . . . . . . . . . . . . . . . . . . . . . . . 9
2 . LITERATURE REVIEW ••••••••••••••••.••..••••.• 9-24
2.1 Aspects of Tetranychid taxonomy ............ . 10-12
2.2 Taxonomic context of the genus Mononychellus .. 12-14
2.3 Application of biochemical systematics ..... 14
2.3.1 Electrophoretic variation of enzymes as
applied in taxonomic classification ... I ·
14-19
2.3.2 Application of isoelectric focusing (IEF)
technique in taxonomic ·classification ....... . 19-20
2.3.3 Cuticular hydrocarbons as
taxonomic feature ......................... . 20-21
2.J.4 Gas chromatography (GC) of cuticular
hydrocarbons· ...................... . 21-24

-ix-
3. MATERIALS AND METHODS ....................... .
3.1 Collection of materials .................... .
3.2 Field sampling of Cassava green
mites . ..................................... .
3.3 Breeding Cassava green mites ................ .
3.4 Breeding red spider mites ................... .
3.5 Mounting . ............... . · ................... .
3.6 Measurements ................................ .
3.7 Sample preparation and
24-43
24
24-27
27-29
29-30
30-31
31-33
application.................................. 33
3.8 Running Isoelectric
focusing . .................................. . 33-35
3. 8 Staining method . ............................ . 35-40 3.10 Data recording and
analysis . ................................... . 40-41
3.11 Gas chromatography .......................... . 41
3.11.1 Sample preparation ........................ . 41-42
3.11.2 Gas chromatographic separation ...........•.. 46-47
4 RE SUI.. TS . . . . . . . • . . . . . . . . . . . . . . . . . . . . . . . . . . . . . . 4 3 - 8 2
4.1 Measurements of setal lengths................. 43
4.2 Isoenzyrne analysis............................ 43-44
4. 2. 1 Malic enzyme . . . . . . . . . . . . . . . . . . . . . . . . . . . . . . . . 44-59
4.2.2 Glucose phosphate............................. 62-10 ·
4.2.3 Malate dehydrogenase ......................... . 70-78
4.3 Cuticular hydrocarbon analysis ............... . 78-82

5.
6.
7.
8
9.
-x-
DISCUSSION ... . ....... .
SUMMARY • •••••••••.••••••••••.•••.•.•••••••
CONCI.US I ON • .••.....................•.....•..
LITERATURE CITED ......... .
APPENDICES •.................
82-94
94-98
98-99
99-119
119-130

Figure 1
Figure 2
Figure 3
Figure 4
Figure 5
Figure 6
Figure 7
-xi-
LIST OF FIGURES.
Title Pages
Initial discovery and spread
of Mononychellus spp. across the African
continent
Cassava growing areas and field
collection sites
A schematic representation of the dorsal
aspects of Mononychellus spp. showing
nomenclature of body setae
A schematic representation of zymograms
from IEF of malic enzyme (ME)
First and second principle component plot
comparisons of the six populations of
2
25
32
46
Mononychellus spp. using Malic enzyme 51
First and third principle component plot
comparisons of the six populations of
Mononychellus spp. using malic enzyme 52
First and fourth principle component plot
comparisons of six populations of

Figure 8
Figure 9
Figure 10
Figure 11
Figure 12
Figure 13
-xii-
Hononychellus spp. using malic enzyme 53
Second and third principle component plot
comparisons of six populations of
Mononychellus spp. using malic enzyme 54
Second and fourth principle component plot
comparisons of six populations of
Mononychellus spp. using malic enzyme 55
Third and fourth principle component plot
comparisons of six populations of
Hononychellus spp. using malic enzyme
A schematic representation of bands
from IEF of glucose phosphate isomerase
First and second principle component plot
comparison of six populations of
Mononychellus spp. using glucose phosphate
isomerase
Flrst and third principle component plot
comparisons of six populations of
Hononychellus spp. using glucose phosphate
isomerase
56
61
65
66

-xiii-
Figure 14 Second and Third principle component plot
comparisons of six populations of
Mononychellus spp. using glucose phosphate
isomerase 67
Figure 15 A schematic representation from IEF
of malate dehydrogenase (MDH) 72
Figure 16 First and second principle component plot
comparisons of six populations of
Mononychellus spp. using malate dehydrogenase 75
Figure 17 Gas chromatogram of cuticular hydrocarbons
isolated from Nairobi population of cassava
green mite Mononycliellus spp 79
Figure 18 Gas chromatogram of cuticular hydrocarbons
isolated from Mombasa population Of cassava
green mites Mononychellus spp 80
Figure 19 Gas chromatogram of cuticular hydrocarbons
isolated from red spider mite Tetranychus
urticae 81

Table 1
Table 2
Table 3
Table 4
Table 5
Table 6
Table 7
Table 8
-xiv-
LIST OF TABLES.
TITLE
Sample collection sites
representing various climatic zones
Program for running IEF
Staining conditions for isoenzymes
Developer buffers
Coefficient of correlation half
matrix for variables of malic enzyme
Normalized eigenvectors and variance
explained by the best 4 principle
components for the 10 variables of malic
enzyme
Analysis of variance for comparing
locations using band widths of malic
enzyme
Analysis of variance for comparing
locations using distances between bands
of malic enzyme
Page.
26
36
37-38
39
48
50
57
58

'rable 9
Table 10
Table 11
Table 12
Table 13
Table 14
'rable 15
-xv-
Coefficient of correlation half matrix for
variables of glucose phosphate isomerase
Normalized eigenvectors (weightings)
and variations by the best 3 principle
components for the 8 variables of glucose
phosphate isomerase
Analysis of variance for comparing locations
using distances between bands of glucose
phosphate isomerase
Analysis of variance for comparing locations
using band widths of glucose phosphate
isomerase
Coefficient of correlation half matrix for
variables of malate dehydrogenase
Normalized eigenvector and variance
explained by the best two principle
components for the six variables of malate
dehydrogenase
Analysis of variance for comparing locations
using distances between bands of malate
dehydrogenase
62
63
68
68
73
74
76

-xvi-
Table 16 Analysis of variance for comparing locations
using band widths of malate dehydrogenase 77

Plate 1
Plate 2
Plate 3
LIST OF PLATES.
Photograph of malic enzyme bands
Photograph of glucose phosphate isomerase bands
Photograph of malate dehydrogenase bands
Page
45
60
71

-1-
1 GENERAL INTRODUCTION.
Cassava green mites (CGM), Mononychellus
Wainstein belong to the subphylum Chelicerata.
They are members of the subclass Acari, and are
part of the agriculturally important family
Tetranychidae Donnadieu. Cassava green mites are
a serious pest of cassava, Manihot esculenta
Crantz. The first records of these mites in
Africa were near Kampala, Uganda in 1971, having
been accidentally introduced with cassava cuttings
from South America (Lyon, 1973). The mites spread
rapidly in their new environment, with outbreaks
reported in Kenya and Tanzania (Msabaha, 1984).
Since, then this pest has been reported in 30
countries across the cassava belt of Africa as
shown in fig 1 (Herren and Bennett, 1984).
Jennings (1970) reported that M.
esculenta was introduced into Africa in the later
part of the sixteenth century. With an increasing
world population and demand for drought resistant
crops, there has been a recent surge of interest
in the study of pests of cassava, particularly in
Africa, where this crop presently constitutes an
important source of carbohydrates for nearly 200
million people (Herren, 1987). It is also a basic
....

, -2-
Fig 1. Initial discovery (dot) and spread (heavy solid lines) of Hononychellus tanajoa across the African continent. The dashed lines show the cassava belt. (Yaninek and Herren, 1988)

-3-animal feed and a raw material for the manufacture
of starch and the production of alcohol
(Jennings, 1970; IITA, 1984). The increased
importance of cassava has focused attention on the
major constraints to its production.
A total of 10 million hectares of arable
land in Africa is devoted to cassava production of
which approximately 4.5 million hectares are
already affected by CGM and the cassava mealybug,
Phenococcus manihot Matile-Ferrero. Economic
losses due to CGM have been variously estimated as
follows; Doreste and Aponte (1978) estimated the
loss to be 8-17% in Venezuela. In Colombia, yield
reductions were 13% on susceptible varieties but
only 5% on resistant varieties (Bryne et
al.,1983), though Centro Internacional de
Agricultura Tropical (CIAT, 19~6) in the same
region reported yield losses of 20%-53%.
Shukla (1976) while comparing infested
and uninfested plants in Tanzania estimated yield
losses at 80%. Nyiira (1972) reported a 3-46%
loss for different varieties of cassava in Uganda.
In Burundi, Ndayiragiye (1984) indicated losses of
upto 32%. Sauti (1981) reported losses of upto
37% in Malawi. In all, an estimated US $ 2
billion is lost as a result of CGM infestation.
This threatens the continual production of

-4-
cassava, calling for a long term effective control
strategy for CGM (Yaninek et al., 1987).
Chemical control of CGM is beyond
the economic reach of the resource 'poor farmers of
Africa and is ecologically unsafe. Cultural
practices available to control CGM are limited and
subsistence farmers in Africa grow cassava without
much agronomic inputs. Resistant cultivars are
not widely available in Africa either (Megevand et
al., 1987). Biological control has been
recognized as the most promising solution to the
CGM problems in Africa (Lyon, 1973). For
successful classical biological control, accurate
identification of the target pest is vital
(Schelinger and Dout, 1964; Rosen and DeBach,
1973; Kumar, 1984; Danks, 1988).
Misidentification of the pests can of ten
hamper the implementation of biological control.
An example of this is the case of the Kenyan
coffee mealybug, Planococcus kenyae (Le Pelley).
The pest was first reported as the citrus mealybug
Pseudococcus citri (Risso), and later to be
Pseudococcus lilacinus Ukll. Time was wasted in
exploration and introduction of the wrong natural
enemies from four continents. Later, the pest was
identified as an hitherto unknown species from
Uganda, Anagyrus sp. nr. Kivuensis. Parasites

-5-
were subsequently introduced from that country
which brought the mealybug under control
(Greathead, 1970; Le Pelley, 1943). Similarly, a
revisionary study of scale insects allowed the
Califonian Red Scale Aunidiella aurantii (Maskell)
to be identified and effective parasites were then
found in China (Compere, 1961).
A similar situation is reported by Goto
(1982) in the genus Scirpophaga whose larvae cause
severe economic losses to rice and sugarcane.
These moths have few reliable characters that can
be used to separate them. They are mostly white
with few or no markings and when the markings
don't occur, identification becomes very
difficult. This situation has led to frequent
misidentification and a great deal of confusion.
Inappropriate control measures have resulted from
the incorrect identification. Later new
_characters, particularly the genitalia were found
to be of taxonomic value. These have enabled
correct identification to be made. It is now
possible to separate Scirpophaga nivella, a very
important pest of rice, from S. excerptalis that
damages sugarcane. Other authors who have
stressed on the importance of correct
identification of species involved in biological
control include, Kumar (1984) and Unruh and Goeden (1987)

-6-
Our knowledge of CGM taxonomy,
particularly in Africa is far from satisfactory
and has been a subject of controversy for sometime
(Guttierrez, 1987). CGM infesting cassava in
Africa have been identified using morphological
characters. Two closely related species
Mononychellus tanajoa (Bondar)and Mononychellus
progresivus Doreste are said to occur. The two
have been differentiated by the length of the
dorsal-central body setae in relation to the
longitudinal distances between the setae (Doreste,
1981). Rogo et al. (1987) have shown in their
recent study that these characters are variable
and cannot differentiate CGM into distinct taxa.
The current state of confusion is best seen by
examining the parallel courses of research in
South America and Africa.
In South America, Mononychellus was first
described by Bandar in 1938 as Tetranychus tanajoa
(Bandar) using female mites. Flechtmann and Baker
(1970) re-examined the female dorsum from the type
region and assigned it to the genus Mononychus
. Wainstein. Doreste (1981) re-described the
females using the relative lengths of the dorso
central setae in relation to the longitudinal
distance between the setal bases and for the first

-7-
time, described males of M. tanajoa using specimen
from Venezuela. Rogo et al. (1987) examined
several females and males of both M. tanajoa and
M. progresivus from their topotype and concluded
that Doreste's (1981) description of the two
species had several discrepancies. For example
the length of dorsal-central body setae (D2 -D3 ),
used in the description vary from short to long in
a continuous gradient. Examination of the males
also showed that terminalia were all similar and
resembled those described for M. progresivus males
(Doreste, 1981).
Reporting on the situation in Africa, Lyon
(1973) initially described CGM as M. tanajoa.
Later Flechtmann et al.(1982) reported the
presence of M. progresivus on cassava in Gabon and
Nigeria. Macfarlen (1984) suggested that although
both species were in Africa, M. progresivus was
more abundant. Rogo et al. (1988) re-examined CGM
from a number of African countries using Principle
Component Analysis (PCA) and concluded that there ·
was only one species, designated M. tanajoa.
Complimentary hybridization studies carried
out on ecologically different CGM populations to
provide quantitative asses~ment of the genetic
relationships among the .populations showed a high
degree of genetic compatibility. The results

-8-indic ate that only one species exists (Murega, pers.
comm.). The confusion that prevailed in the naming of
cassava green mites has led certain authors to speak of
a Mononychellus species complex infesting cassava in
Africa.

-9-
Objective:
The primary objective of this work was to investigate
characters other than morphological which can be used
to clarify the taxonomic status of cassava green mites.
For this purpose:
1. Measurements of the setal length were carried
out to ascertain whether morphological criteria for
characterization correlated with biochemical methods of
classification.
2. Isoenzymes were analysed studied using isoelectric
focusing. The banding patterns resulting from IEF
separation were used to characterize CGM
3. Extracts of cuticular hydrocarbons were analysed
using gas chromatography. In which the relationship
between of cuticular hydrocarbon composition and
taxonomic grouping of CGM were examined.
It is hoped that with the correct identity of CGM,
Biological control workers would be able to design
appropriate control strategies for the specific species of
CGM devastating cassava in Africa.

. -10-
2. LITERATURE REVIEW.
2.1 Aspects of Tetranychid taxonomy.
Members of the family Tetranychidae
Donnadieu, as said earlier are probably the most
serious plant feeding group of the Acari. They
cause enormous loss of yield to various crops each
year (Jeppson et al., 1975). Inspite of their
agricultural importance, the systematics of spider
mites has not drawn the concerted effort of many
acarologists (Baker, 1979).
The history of spider mite systematics
dates back to 1758 when emphasis was placed
primarily on the description of the species. This
era began with Linnaeus, when he described twenty
nine species. However the first semblance of a
higher classification of spider mites was
presented by Donnadieu in 1875 when he established
the family name Tetranychidae. Murray (1077) in
his "Economic Entomology Aptera" presented a
comprehensive treatment of the spider mites. In
the late 1800's meaningful descriptions and
carefully constructed illustrations of spider

-11-
mites were made by Antonio Berlese who recognized
the importance of the empodium of the tarsus as a
taxonomic character.
Ewing (1913) described several spider
mite species and for the first time used the
profile of the male genitalia for species
diagnosis. The setal · arrangement, types of setae
and striation patterns were still poorly
understood. Major studies involving higher
classification of Tetranychids have since been
reported by Pritchad and Baker (1955), Wainstein
(1960).
The division of the Tetranychidae is
currently based on a combination of characters
which have proved valuable in erecting various
taxa. Most of these characters are morphological
for example, the aedeagus, the peritremes,
ernpodium, leg setae, placement and relative sizes
of body setae, egg shape, and the appendages.
Recently the nature and distribution of the
cuticular lobes and colour of the haemolymph have
been adopted as taxonomic features ( Boudreaux,
1963). Bob-Manuel (1987) in her study of cassava
green mite taxonomy, used the ontogeny of body
setae in the classification.

-12-
2.2 Taxonomic context of the genus Mononyche.llus.
Cassava green mite was originally
classified in the genus Tetranychus (Dufour).
Bondar ( 1938) described CGM as Tetranyclms tanajoa
(Bondar) using females from Bahia, Brazil. His
description was inadequate since it was done using
only females, but he did state that T. tanajoa had
short strong dorsal central body setae.
Flechtmann and Baker (1970) later studied
specimens collected from Manihot sp. in the type
region and transferred tanajoa to a new genus
Mononychus. Wainstein (1971) however found that
the genus Mononychus was preoccupied and changed
the generic name to Mononychellus. Subsequent
authors recognized the species as Mononychellus
tanajoa (Flechtmann, 1977).
The name Mononychellus was given to all
cassava green mites collected from Africa for many
years since it's discovery in the continent.
However in 1979 Doreste reported another species
Mononychellus estradai (Pritchard and Baker) in
South America and then the same author in 1981
described 2 new species of Mononychellus collected
from the same cassava host, also in South America.
These were, Mononychellus progresivus and

-13-
Mononychellus manihoti (Doreste, 1981). He also
reported the occurrence of M. tanajoa.
Doreste, (1981) distinguished females of
M. progresivus from M. tanajoa on the basis of the
lengths of the dorso-central body setae and the
distances between them. M. tanajoa was described
as having short dorsal-central body setae (D1_D 3 )
and a strong straight aedeagus, ending in a bulge
with two projections sharply directed forward at
the basal part. Doreste further described the
presence of nine tactile setae, one slender
solenidion on tibia I and seven tactile setae on
tibia II. On tarsi I are five proximal tactile
setae and one solenidion, while on tarsi II are
three proximal tactile setae and one solenidion.
M. progresivus was described as having long dorso
central body setae (D 1_o 3 ), and the aedeagus which
lacked a strong ventral hook. Tarsus I had .four
proximal tactile setae and one solenidion . Tibia
I had eight tactile . setae and one solenidion.
However Rego et al.(1987) examined
materials from south America and concluded that
the length of the dorsal-central body setae (D 1 _
D3 ), the tibial count and the male terminalia
could not differentiate the two species since no
clear distinction of these characters was apparent
in cassava green mite specimens examined. The

- 14-
validity of the differentiation of CGM, based on
setal lengths is questionable particularly for
specimens collected from Africa. There is need
for a revisionary study of the genus Mononychellus
using characters other than morphology.
2.3 Application of Biochemical Systematics .
.. Goto (1982) reported that for many years
it had been known that there are demonstrable
differences in the biochemical composition of
different organisms. In cases where distinction
between closely related species becomes difficult
on morphological grounds, the value of biochemical
data in systematic studies is widely acknowledged.
Two common characters used in biochemical
systematic are:
(a) Enzymes
(b) Cuticular hydrocarbons.
2.3.1 Eletrophoretic variation of enzymes as
applied in taxonomic classification.
Electrophoretic techniques have become
principal tools for characterizing enzymes in
organisms. The method is based on the fact that
proteins have a charge and are therefore able to

-15-
move when placed in an electric field.
Electrophoretic techniques were first used to
distinguish between multiple fractions of serum
proteins. These techniques were sufficiently
reformed to permit examination of large numbers of
different proteins in organisms (Ayala and Powel,
1972).
In recent years, electrophoretic separations of
multiple molecular forms of enzymes (isoenzymes)
have been applied in clarifying the often
confusing taxonomic status of biotypes, races, or
sibling species of pests and vector species
complexes. Differentiation of species by
isoenzyme analysis has been reported by Petersen
(1982) who characterized five Lutzomyia Franca
spp. collected in· Panama using cellulose acetate
electrophoresis. Miles and Ward (1978) performed
preliminary isoenzyme studies employing starch gel
electrophoresis to characterize two colonies of
L.flaviscutella (Mangabeira) . They showed trat
malate dehydrogenase (MDH) and glucose phosphate
isomerase (GP!) are good diagnostic features.
Ward et al. (1982) investigated enzymatic
variation in Phlebotomus permicoccosus and other
sandf ly species collected in Southern France and
Tunisia, and concluded that phosphoglucomutase
(PGM), hexokinase (HK), alpha glucose-phosphate

-16-
dehydrogenase (G6PD) and glutamine oxaloacetate
(GOT) could be used to separate Phlebotomus
(Rondani) species.
Krutzer (1979) used cellulose acetate to
investigate isoenzymes in two Melanoconian
mosquitoes; Culex ocossa Dyar and Culex panacossa
Dyar and Panacos~a. He successfully classified
various forms of these species. Saul et al.(1977)
employed polyacrylamide gel electrophoresis to
separate Culex papiens Weidemann, Culex territans
Walker and Culex restuans Theobald. Saul and
Gimstad (1977) differentiated Culex isalinerius
(Coq.) and Culex papiens quinquefasciatus (Say)
using a similar method.
Characterization of Aedes scutellaris
Theobald complex by enzyme variants was reported
by Townson et al.(1977) in which Aedes
polynesiensis Marks and Aedes pseudoscutellaris
could be differentiated by esterases. Alpha
glycerophosphate dehydrogenase was also used to
distinguish Aedes malayensis Calles from Aedes
scutellaris Theobald. Alcohol dehydrogenase (ADH)
allows the separation of the closely related Aedes
polynesiensis and the 'Tufahi' forms.
In the identification of Anopheles
Meigen complex, Bianchi · and Chesa.(1970),
_distinguished An.atroparvus (Van Thiel) from An.

-17-
labranchidae Falleroni by gel electrophoresis.
They also used hydroxybutyrate dehydrogenase and
superoxide dimutase (SOD) to distinguish An.
beklemishevlvi (Stegnii and Kabanova) from An.
messeae. Steiner et al. (1982) detected enzyme
differences among, An. argyritarsis Theobald,
An.albitarsis Lynch, An. braziliensis and An.
darlingi (Root) using cellulose acetate
electrophoresis. Miles (1979) surveyed 22 enzyme
systems in An. gambiae Giles complex using starch
gel electrophoresis and distinguished between the
various strains.
May et al. (1977) found interspecific
differences in allelic frequencies in four enzymes
of the Simulium jenningsi group using starch gel
electrophoresis. Synder (1982) investigated
enzyme characters of Simulium venustum verecundum
complex by starch gel electrophoresis. Meredith
(1982) established that a variant of Xanthine
dehydrogenase (XDH) can distinguish the 'Sanje'
and 'Turiani' forms of Simulium Latrielle spp.
Meredith and Townson (1981) screened 44 enzyme
systems of which 2 enzyme systems,
phosphoglucomutase and Trehalase were found to
separate S. yahense Vajime and Dunbar from s.
squamosum (Enderlein). In addition these two
could be separated from S. sirbanum Vajime and
/

-18-
Dunbar, S. damnosum Theobald, S. sactipauli and S.
soubrense Vajime and Dunbar.
Pashley (1987) conducted electrophoretic
surveys of Spodoptera frugiperda Smith in which 35
enzymes were examined, five of these were able to
differentiate between the various strains of s.
frugiperda. Menken (1988) carried out
electrophoretic separation on geographical
populations, host races and sibling species of
Lepidoptera and Diptera and was able to
distinguish between species within these orders.
Daly and Fisk (1988) used cellulose
acetate electrophoresis to examine enzymatic
variation in two Australian species of Heliothes
Hubner; H. armige.ra (Hubner) and H. punctigera
Wallengren. ICD-1 ICD-2 and PGD clearly
distinguished these two forms. Singh and
Cunningham (1981) reported on intra and inter
generic variation in aphid enzymes.
In mites electrophoretic separation include
the work of Ward et al.(1982) who examined enzyme
polymorphism and differentiation in three species
of spider mites using starch gel electrophoresis.
Sula and Weyda (1983) investigated esterase
polymorphism of two spotted spider mites,
Tetranychus urticae Koch.
Cardwell-Grafton et al. (1988) distinguished

-19-
among females of three spider mite species
'l'etranyclms turkestani Ugarov and Nikolski, T.
urticae koch and T. pacificus McGregor using
cellulose acetate electrophoresis. Blank (1979)
used disc electrophoresis t~ separate Sancassania
berlesii Michael from Tetranychus urticae and
T.turkestani. Cicolani et al. (1981) used starch
gel electrophoresis to clarify the relationship of
mesostigmatid mites.
2.3.2 Application of Isoelectric focusing (IEF)
technique in taxonomic classification.
Isoelectric focusing is an electrophoretic
separation method in which a pH gradient is
established between two electrodes and is
stabilized by carrier ampholytes. Proteins focus
at their isoelectric points (pI). The pl defines
a physical parameter of the protein and therefore
has great taxonomic significance.
Bark et al. (1976) used IEF in analysing
polymorphic phosphoglucomutase (PGM) and reported
the method to be more sensitive in showing three
PGM phenotypes (PGM 1, PGM 2, PGM -2-1). Allsops
and Gibson (1983) compared the effectiveness of
starch gel electrophoresis and IEF in agarose for
the separation of lactate dehydrogenase (LDH) of

-20-
Theilaria parva. Similarly glucose phosphate
isomerase (GPI) of various cestode orders were
analyzed using IEF. This technique proved more
discriminatory than starch gel electrophoresis.
Allen et al.(1974) separated proteins
differing in their pl by only 0.0025 pH units
using IEF. This established IEF's effectiveness
over the other methods of protein separation used
in biochemical taxonomy. Heinz and Buschinger
(1988) studied variability of esterases in species
complexes of the Leptothoracini using IEF, and
concluded that IEF offered a higher degree of
reproducibility and resolution required for the
critical analysis of the esterases.
2.3.3 Cuticular hydrocarbons as taxonomic
features
The surf ace of arthropods is
covered with a complex mixture of aliphatic
compounds. These surface lipids play a key role
in the survival of the organisms by providing
protection from desiccation, as well as serving as
a barrier to abrasion, micro-organisms and
chemicals. They have been shown to be important
in chemical communication, as sex attractants and

-21-
2.3.4 Gas Chromatography (GC) of Cuticular
hydrocarbons
Carlson and Walsh (1981) differentiated two
West African female black flies, Simulium sirbanum
V.and D. and Simulium squamosum (Enderlain) which
are vectors of Onchocerca volvulus (Leuckart) by
GC analysis of their cuticular hydrocarbon .
Differentiation between Anopl1e.les gambiae Giles
complex by GC analysis is reported by Carlson
(1980).
Carlson (1986) also analyzed the
cuticular hydrocarbons in species of Glossina
Weidemann which showed marked differences in
chromatographic profiles of the males. Similarly
subspecies of Glossina palpalis R-D.,G. palpalis
palpalis R-D. and G. palpalis gambiensis were
distinguished by GC separations of their
hydrocarbon components.
Nelson et al. (1988) examined the methyl-
alkenes of four species of the Palpalis R-D group
Glossina fuscipes fuscipes, G. palpalis palpalis,
G. palpalis gambiense, G. tachninoides Westwood,
and one species of the Fusca Walk. group G.
brevipalpalis, to determine the presence of unique
or specific methyl-alkan~s which could be used as taxonomic indicators.

-22-
Cuticular hydrocarbons of nine Acridids;
Schistocerca vaga Scudder , Schistocerca
americana, Schistocerca gregaria (Forsk) (Jackson,
1982), Melanoplus sanguinipes (Fabricious),
Melanoplus parckardii, Melanoplus bivittatus
(Say), Melanoplus fermurrumbrum (DeGeer),
Melanoplus differentiales (Thomas) and Melanoplus
dawsoni have been studied for taxonomic purposes
(Howard, 1982)
Lockey (1980) examined the extent to which
cuticular hydrocarbons could be used in
classifying groups within the family Tenebrionidae
and found that hydrocarbons of Onymacris plana,
O.rugatipennis, Physadesmia globosa (Haag) and
Stenocara gracilipes (Haag) had several features
in common. At the same time certain hydrocarbon
components could be used to distinguish the two
species of onymacris Allard from P. globosa and s.
gracilipes, and to distinguish s. gracilipes from
P. globosa.
Haverty et al.(1988) evaluated the
quantitative and qualitative variation in
cuticular hydrocarbons of the Dampwood termites
Zootermopsis as a step towards the revision of the
genus. Similarly, Howard et al. (1988)
characterized Nasutitermes corniger (Motshulsky)

-23-
and N. ephratae (Holmgren) by capillary gas
chromatography. The same author (Horward, 1988)
also differentiated two sympatric North American
Rhinotermitids Light species; Reticulitermes
flavipes (Kollar) and Reticulitermes virginicus,
(Banks) using gas chromatography.
Jackson (1971) reported on the
qualitative and quantitative analysis of cuticular
hydrocarbons of two cockroach species, Periplaneta
japonica and Periplaneta americana (L.) as a
method of separating· the species. Similarly
Carlson and Brenner (1988) used the quantitative
differences in cuticular hydrocarbon profiles to
identify the various stages of three cockroach
species , Blattella asahinai -Mizukubo, Blatella
germanica (L.) and Blattella vaga Hebard.
To the best of my knowledge this is
the first time that GC has been used to study
cassava green mites. The degree of success
demonstrated by the above, and similar
investigations using biochemical techniques show
that electrophoresis and chromatography could
serve in resolving the taxonomic problem of CGM.

-24-
3 . MATERIALS AND METHODS
3.1 Collection of materials
Cassava green mites were collected
from six localities which were representative of
the major cassava growing areas of Kenya as shown
in fig 2. The collection was done during the dry
season (November-January), when mite populations
were high (Akinlosotu, 1981; Yaninek et al.,
1987). The sampling method was based on earlier
distribution and taxonomic studies of
Mononychellus spp. in Kenya by Rogo et al. (1987,
unpublished). Sampling design took into account
possible variations in the mites based on
different eco-climatic conditions within Kenya
(Table 1).
3.2 Field Sampling of Cassava Green Mite
Sampling techniques used in this study
are like those reported by Nachman (1984). Mite
collections were carried out in fields at every 15

-25-
------,------------ -- ··--·----------------------·-- ··- ·-·y----------
u G A N
D
A
35' E 4o• E
L. TURKANA
-, \ I ~I
I '...,
ETHIOPIA
,, I I ..--. ,.,,. \
I I -,
I I I ,--·
u
I I
I
' ' I _,/ ,- _.,,.
I
... \ \
\ \
I
' ' -" '
I I
_," I
' ' ' I ,, .,,.""
\_ ---..... ___ j \
t, I \ \
ISHl,.kA \ \ l,
I \ \
I I
TANZANIA
MavlBASA 0 200 Km.
Actninistrative Boundaries
Cassava Growing Areas
s• N
s 0
M A L
A o•
5• s
Fig 2. Cassava growing areas of Kenya and the collection site of cassava green mites

-26-
Tables 1: Sample collection sites representing various
cli!Tlatj __ c zones.
Collection Site Altitude Climatic Zone (meters)
Busia 1500 Equatorial
Rusinga (Lake Basin) 1000 Dry sub-humid
Em bu (Central Highlands) 1524 Sub-humid
Mombasa (Coastal Plains} 0 Dry sub-humid
Nairobi 2134 Semi-arid
Ishiara 914 Arid

-27-
kilometres interval along a road transect, within
a cassava growing area. Plant samples were chosen
at random. At every stopping point, a 40 cm long
wooden peg, with one sharpened end was thrown from
the edge of the cassava field. The nearest
cas~ava plant to the sharpened end was sampled.
From each sample plant, the first 7 fully
expanded young leaves from the shoot tip were
taken and placed singly in a cellophane bag (7 cm
x 12 cm). The bag was in turn placed in a plastic
sandwich box measuring 16 cm x 10 cm x 6 cm and
its lid replaced immediately to avoid desiccation.
Leaves handled this way remained in perfect
condition for 7 days at ambient temperature and
humidity conditions of about 22 °c -29 °c and 50%
- 70% RH respectively.
3.3 Breeding cassava green mites.
Pure-line progenies were required for
biochemical studies (Weyda, 1983). Breeding
experiments were therefore performed among
populations of cassava green mites. Female
specimens from the field were made to lay eggs on
fresh leaf discs measuring 15 mm in diameter. On
hatching the larvae developed through the
succeeding stages into adults. A quiescent female
-28-
deutonymph and an active adult male of the same
progeny were transferred to a separate leaf disc
and allowed to mate. Males were removed a day
after and adult females left undisturbed to
oviposit eggs for 10 days. The resulting progeny
were reared to adult stage.
The leaf disc method of rearing,
described by Helle and Overmeer (1985) was
employed. This method enables easy observation of
the mites under a stereo-microscope. Young, fully
expanded cassava leaves of a variety locally
call~d 'kibandameno' were made into leaf discs
using a cork borer. The leaf discs were washed,
dried and then put with their upper surface on a
wad of water saturated cotton wool placed in a
petri-dish. The petri-dishes were in turn placed
in trays measuring 380 mm x 230 mm x 30 mm. Water
was added to the trays.
The trays were put in a growth
chamber covered with fine netting material to keep
out flying insects . . A 60 W incandescent bulb was
used to illuminate the chamber and provide the
necessary warmth. Crawling insects were avoided
by placing the growth chamber in a galvanized
trough. Conditions within the chamber were
maintained at 26 °c - 28 °c and 65% - 75% relative
humidity. Four day old adult females of every

-29-
generation upto the fifth generation were picked
into a Beckmann™ polyethylene tube and stored in
a deep freezer at -20 °c until required for
electrophoresis. The fifth generation mites were
used in the electrophoresis to avoid the problem
of in-breeding which might result in laboratory
specimens differing from the wild type.
3.4 Breeding red spider mites (RSM)
The red spider mite, Tetranychus urticae
Koch, was used as a reference material. These
were reared on potted kidney bean plants,
Phaseolus vulgaris (L.) which were placed in a
green house as described by Helle and Overmeer,
(1985). Young bean plants were initially infested
with ten males and the same number of adult
females of RSM. These were subsequently left to
multiply on the foliage. When the plants became
densely popuiated, they were replaced with fresh
ones, thus assuring availability of a large colony
of the red mites. Adults were collected by
tapping the leaves over a white piece of paper and
then picking those that fell on the paper using a
fine camel hair brush.

-30-
3.5 Mounting
Mounts of cassava green mites were
made for microscopic examination. CGM were killed
in 70% ethyl alcohol and mounted in Hoyer's medium
according to the method of Pritchard and Baker
(1955). Hoyer's medium consists of; distilled
water (50 ml), gum Arabic (30 g), chloral
hydrate (200 g) and glycerol (16 ml). The
ingredients were mixed at room temperature in the
sequence listed above. Periodic stirring for
about 14 days was necessary.
A drop of Hoyer's solution was placed at the
centre of a clean 20 mm x 60 mm microscope slide,
mites were carefully placed onto the centre of the
drop. Females were oriented with the ventral side
down, and all appendages extended. Males were
mounted in profile in order to enable examination
of the aedeagus. A cover slip was then placed
over the specimen. To expand and clear the
specimen, the slide was warmed over a spirit lamp
and left to dry at 55 °c in a Fischer slide warmer
for 5 - 7 days. Dry slides were sealed with
neutral nail polish.

-31-
3.6 Measurements.
Measurements of the dorsal central body
setae, o1-n2 (Fig. 3) were made using a Lietz
phase contrast microscope. A stage micrometer
calibrated in millimicrons (µm) was mapped onto an
eye piece graticule. Dimensions on the stage
micrometer were then calibrated with the divisions
on the eye piece graticule under a x40 objective.
For example 0.05 mm of the stage
micrometer was equivalent to 18 divisions on the
eye piece graticule. To convert to millimicrons
the values of setal lengths is multiplied by value
equivalent to a single division in the eye piece;
E.g.
The setal lengths
Ro go et al. (1986)
Dl
~ 7 µm
~ 10 µm
0.05 x 1/ 18
= 2.78 µm
were categorized
as follows;
D2 D3
~ 9 µm ~11 µm
=3- 10 µm ~15 µm
according to
short setae
long setal
Values of intermediate setae forms fall in between
those of the long and short forms. Measurements
were done for five mites from each study region.
These measurements were ~mportant in ascertaining
whether the setal length variations correlated
with possible biochemical variation.

/ -32-
I'- - -------
GNATHOSOMA
>-------------
~ u PROOORSUM
P3
~-~ / J ~ D1
" H
6 ~ D2
' I \03 )PISTHOSOfv\AL ~ \
OORSUM
D4
Fig 3 Schematic representation of the dorsal aspect of Mononychellus spp. showing the nomenclature of body setae (Helle and Sabelis, 1985)
TIBIA
GENU
TROCHANTER
COXA

-33-
3.7 Sample preparation and application.
Mite samples were homogenized in freshly
prepared solutions by the method of Sula and Weyda
(1982, 1983). Thirty single line adult females of
the CGM and RSM were manually macerated in
polyethylene disposable microtubes using a close
fitting stainless steel pestle. 1 pl of 0.1%
phenylmethylsulphonylfluoride (PMSF), 5 µl of 0.1%
phosphate buffer solution (PBS) and 1 µl of 0.1%
triton X-100 detergent were used as homogenization
buffer. Triton X-100 extracts membrane-bound
enzymes, making them available for analysis. The
crude homogenate was allowed to settle for one
hour before centrifugation.
Samples were spinned in a Beckmann™
microfuge at 10,000 g for 10 minutes at 4 °c. The
homogenate supernatant was carefully transferred
to clean polyethylene rnicrotubes and used for
electrophoresis.
3.8 Running Isoelectrofocusing
Isoelectrofocusing was done
according to the technique of Cox and Willis
(1985) with several modifications for optimal

-34-
separation. The gels were then stained for
thirteen enzymes listed below ; Aconitate
hydratase (Aeon. E.C. 4.2.1.3), alcohol
dehydrogenase (ADH. E.C. 1.1.1.2), glucose-6-
phosphate dehydrogenase (G6PD E.C. 1.1.1.49),
isocitrate dehydrogenase (ICD. E.C. 1.1.1.42),
malate dehydrogenase (MDH. E.C. 1.1.1.37), mannose
phosphate isomerase (MPI. E.C. 5.3.1.8), malic
enzyme (ME. E.C. 1.1.1.40), phosphoglucomutase
(PGM. E.C. 2.7.5.1), superoxide dimutase (SOD.
E.C. 1.15.1.1), nucleoside hydratase (NH. E.C.
3.2.2.1), hexokinase (HK. E.C. 2.7.1.1),
phosphoglucose isomerase (GPI. E.C. 5.3.1.9),
pyruvate kinase (PK. E.C. 2.7.1.40).
A commercially available, already prepared,
high performance agarose PhastGel™ media was
used. The gel dimensions were; 43 mm X 50 mm,
length 37 mm, gel matrix 3%, Pharmalyte
concentration of 0.22 (urn), and a 3-9 pH gradient.
The homogenate was transferred, using a
micropipette, into wells formed out of a sample
well stamp using a parafilm. A PhastGel™
applicator was then loaded by dipping into the
wells containing the homogenate. The applicator
took up samples on its grooves by capillary
action. The PhastGel was placed in the separation
chamber and the system programmed to perform a

-35-
prefocusing . for 75 volt hours (vh). The
PhastSystem was also programmed to lower and raise
the sample applicator thereby applying the samples
for 15 vh onto the gel automatically. The
duration of separation (focusing) was 410 vh. All
populations and the reference material were
uniformly applied on the gel. The running
conditions are shown in Table 2.
3.9 Staining method
Isoelectrofocused gels were stained using
specific histochemical techniques for isoenzymes
and general proteins. The reaction mixtures were
modifications of those developed by Shaw and
Prasad (1970), Blanq et al. (1986). The
isoelectrof ocused gel was immersed in the staining
solution specific for each isoenzyrne (Tables 3 and
4). The gel was incubated for 10-15 minutes in
the dark at 37 °c until the bands were visible.
Thereafter, it was removed from the reaction
mixture, rinsed and fixed in 7% acetic acid at
room temperature for 15 minutes. A hair drier was
used in drying the gel.

Table 2: Program for running IEF (After Olsson et. al. 1988)
Step Stage Voltage V Current in Power in Tempe0ature vh mA 'lo;'atts in C
l Pre focusing 2000 2 3.5 15 75
I \C 2 Sample application ( a ) 200 2 3.5 15 15 C""\ I
3 Focussing ( b) 2000 5 3.5 15 410
(a) Sample applicator down at Step 2 after 0 vh (accumulated 75 vh)
(b) Sample applicator up at Step 3 after 0 vh (accumulated 90 vh)

TABLi 3: STAINING CONDITIOn~ fOx ~SU~NZYM.ES (}~tters refer to develnper buffArs on table ~)
ENZ\'ME DEVELOPER BUFFER H20 ADDITlONAL lONS COENYM..E~ SUESTRATES VISUALIZTION l"..E~HOD
L!NKlNG ENZY!"..ES
~r. 5mc;/m:.. lml l Acor.it.at.t: hydrat.ase A o.~ml 1l'lmgc72 NADP (mc:;(rr,11 lCD (E . C.l.l.l.0) n-prop~n~l Pl".S 2mc;/i:-.: O.~ml 6.0ml -· .lm_ 0.3nJ. 2 un:ts C. 1rr. ~
--------------------------------------------------------------------------------------------------------------------------------------------------------------2 Alconol dchydro9enase
A O • Bml NAD? n-orooanol ~':"'!' lml 6. 5ml 0. 5ml . c». iml PMS 1 • ml --
-------------------------------------------------------------------------------- ----------------------------------------------------------------------------3 Glucose-6-phosphate E 0. Bml N.l\DP D-glucose-6-phosphate MTT lml
--~=~:::~~=~~~~--------------------~:~~~-------------------------------~:~~~--------------------------------------~~~2~~~-----------------E~~-1~1-------------4 Glucost: phospha~e
1 ::;omt:ra::;t: " 6 . 5ml 0.5ml ; . O~ mncl NADP G6PD D-fruct.ose-6-phosphate ~TT lml PMS 0. 5111! C. ~ml C. 5ml • 5ml (!Orne /ml) 0. Bm2
-------------------------------------------------------------------------------~--------------------------------~---------------------------------------------
5 lsoc1tra~e dehydrogenase E 6.5ml
J .o~. i-.ncl 2 :'.ml
NADP 0.3ml DL-isocitric acid 0. 5rr.!
-----------------------------------------------------------------------------------------------------------------------------------
~TT lml Pl".S 1111:..
--------------------------~ r-!_6 ~alate dehydroge~ase (") "' c.5ml
3.Bml NAD O. ~111)
L-ma ic acici lm (ne~t. alisec wit.h NaOH) 0.2rn
¥.TT 11111 PMS 0. !>m:..
I
'· --------------------------------------------------------------------------------~-----------------------------------------------------------------------------
7 Halie en2~·me (!"..!:) E 6.5ml l rro! i . o~: Mgcl
2 O.lml NADP 0.2rnl
l.O~ L-malic acid (neautrali:ec ~ith Nat>H)
C.2~l
!'.TT lml P~S C. 5rn~
--------------------------------------------------------------------------------------------------------------------------------------------------------------& K4nnosc phosphate
.i.somerase E
6 . Sml i . o~. !'lgcl 2 NADP 0. ~1111
GPl 30 units (E.C.5.3.1.9.)
Mannose-6-phosphate(Na2
l 2 . 5m9
~TT l .Oml Pl-'.S 0. 5r.i~
----------------------------------------------------------------------------------------------------------------------------------- ---------------------------9 N~cleoside hydrolase (NH) D
b.~ml
2ml Xanthine oxidase ·· tE.C . 1.2.3.2.l
lnosine !Omg
!'.TT lml PMS 0. 5ml
--------------------------------------------------------------------------------------------------------------------------~------------------------10 PhosphOglucomutase(PGM) A
6.5ml lml l .0~ Mgcl
2 0.2ml !'ADP 0.2ml
G6PD (E.C.l.l . l.~9)
0.5ml Glucose-1-phosphate con~aininq l\ qlucose ll,t-biphosphate lml
~TT 11111 W.S O.Sml

T<Jble 3 cont.
ll Phosphogluconate dehydrogenase (6?GDl
E 6.Sml
l.ml l .O~ MgCl2
0.2-ml NADP
o.: t:il
6-phosphogluconate ( l Omo /ml o. :.;.l
!".TT lml ?MS 0. Sml
------------------------------------------------------------------------------------------------------------------------------------ -----------------------· 12 Proline peptidase
(PEP-D E
6.Sml l.ml 0.2ml
l.O~: KnCl 0.2ml
Peroxidase E.C.l.11.l.7.llmg L-amino acid oxidase IE.c.l.4.3.2.l 2mg
L-Leucyl-L-Proline lOrng
3-amino-9-ethvl carbazole, 2 Smg 0.7 ethanol Agar lOml
---------------------------------------------------------------------------------------------------~-------------------------------- -----------------------13 Pyruvate kinase (PK)
I co ("t')
I
A
6.Sml
1.0~\ MnCl 2 0.4ml l.O~~XCI
2.4ml
G6Pd (E.C.l.l.l.~9) 10 unite
Phosphate pyruvate 2mg
MTT lml PMS O.Sml
'

-39-
Tables 4: Developer buffers. (After Miles et al., 1980)_
A. 0.3M Tris/HCl pH 8.0
B. 0.019M NaH2Po4 /0.081M NaHP04 pH 7.4
c. O.OSM Tris/HCl pH 8.5
D. 0.03M Tris/HCl pH 7.0
E. 0.03M Tris/HCl pH 7.4
F. 0.004M NaH2Po4 /0.096M Na2HP04 pH 8.0

-40-
3.10 Data recording and Analysis
Bands were photogr~phed immediately to
obtain a permanent record for each sample studied.
Isoenzyme mobility was defined as the distance, in
millimeters at which the bands form, relative to
the starting slots. Mobility was compared amongst
the populations and then relative to the reference
material (RSM).

-41-
3.11 Gas chromatography (GC)
3.11.1 Sample Preparation
Cassava green mites used in the GC study were
obtained in the same way as described for IEF
analysis. Extracts of mites were prepared as
previously described by, Baker et al. (1979). Ten
females each of the long and short setae forms of
CGM were immobilized by freezing, then put into a
perspex glass tube 15 mm long and 1.5 mm internal
diameter with one end sealed. 10 ul of Purified
hexane was added to the mite samples. To another
glass tube of similar dimensions was added the
same amount of purified n-hexane as a control.
Both sample and control glass tubes were
placed inside a sample vial containing 20 ul of
hexane. The hexane in the sample vial helped to
minimize evaporation of hexane from the sample and
control tubes. The sample was left to soak for 24
hours at room temperature.

-42-
3.11.2 Gas chromatographic separation.
Analysis of cuticular hydrocarbons was
conducted according to the method of Peschke and
Metzter (1986). A Hewlett-Parkard 5890A series
gas chromatograph, fitted with a flame ionization
detector was used in the analysis. The gas
chromatograph was equipped with a 50 meter long
Hewlett-Packard fused silica capillary column,
cross linked with methyl silicon and having an
internal diameter (ID) of 0.31 mm.
Samples were analysed with the initial oven
temperature programming from 100 °c to 270 °c at
an increase rate of 4 °c per minute. The
injector temperature was 220 °c and the detector
temperature was 280 °c. Nitrogen was used as the
carrier gas. Samples of the short and long setae
forms were run separately. A Hewlett-Packard
3393A computing integrator was used to determine
the area and peak heights of the samples.

-43-
4. RESULTS
4.1 Setal length measurement
Measurements of the dorsal central body
setae (D1-o3 ) for the first five generations of
cassava green mite populations are given in
appendices 1-6. Results indicate that adult CGM
of different generations of a single line, in all
the populations, do not show significant variation
in the setal lengths. This means that mites from
any of the generations could be used in the
biochemical analysis. Rearing the mites upto the
fifth generation did not affect the eventual
length of setae. Mombasa and Rusinga population
had long setae while Nairobi, Embu, Ishiara and
Busia had short setae. In the locations where
long and short setae forms occured, intermediate
forms were also recorded.
4.2 Isoenzyme analysis
Three out of the thirteen enzyme/substrate
systems assayed gave consistent and high

-44-
resolution bands which could easily be interpreted
for taxonomic purposes. These included malic
enzyme, glucose phosphate isornerase and malate
dehydrogenase. The other isoenzymes assayed
either produced very faint bands, and were
unreproducible in which case they could not be
used for meaningful taxonomic interpretation or
did not show any measurable activity at all.
Since these bands were unreproducible they were
not represented diagramatically.
4.2.1 Malic enzyme
Malic enzyme (Plate 1 and figure 4)
were detected in all the populations of Cassava
Green Mite studied. Identical banding pattern
characterizes all populations Three prominent
bands occur in each population. Two bands, much
broader with a slow mobility and rather faint
compared to the electrophoretically faster bands
also occur in all the populations of CGM. These
bands are not seen in the in RSM.
Table 5 gives the results of coefficient
of correlation half matrix of variables, "LB" and
"WB" which represent distances between bands and
the band widths respectively, considered under
malic enzyme. The normalized eigenvectors of the

M-E: - - --&J--
PLATE 1: Photograph of malic enzyme bands.

-46-
+
ME
! •' :: · ; ,.d
BSA EMB
&mm Prominert
ISA MSA
. Not ~Prominent
. !· .
NRB RSA
Fg. 4 A schematic representation of zymograms from the IEF of malic enzyme (ME )
RSM= Red Spider Mite, BSA= Busia, EMB= Embu,
ISA= lshiara, MSA= Mombasa, RSA= Rusinga
NRB = Nairobi
. ' . ~


Table: 5 Coefficient cf Correlation half ~matrix for the variables of malic enzyme (ME)
LB12 LB23 LB34 LB45 LB56 WB2
LB12 . 1. 00 -0.47 -0.68 -0.54 -0.22 -0.49
LB23 1.00 0.61 0.49 0.07 0.49
LB34 1. 00 0.39 0.10 0.63
LB45 1.00 0 . 24 0.31
LB56 1.00 0.07
o!:, WB2 1. 00 -::!" I
WB3
ws.e
WBS
WB6
* No'.:e: "LB" denotes distance between bands ( e . g LB12 is the distance between the first and second bands).
·wB" denotes the band width (e.g.WBl is the width of the first band from the application point).
WB3 WB4 WB5
0.26 0.16 0.09
0.13 -0.14 0.08
0.12 0.06 0.21
0.20 -0.37 0.05
0.39 0.21 0.02
0 . 26 0.10 -1.20
1. 00 0.71 0.21
1.00 0.51
1. 00
WB6
0.32
0.079
-0.34
0.33
0.02
0.08
0 . 02
0.10
-0 . 65
1. 00

-49-
correlation matrix are presented in table 6.
These values represent the best four components of
the variables that effectively describe the
relationship of band widths as well as distances
between bands. Variables with high positive or
negative (> 0.7) weightings are said to reflect
significant variation within a population. None
of the principal components account for more than
half the variance. The first component accounts
for 32.58% of the total variance and is clearly
the most important. The other three components,
2,3 and 4 each account for much less.
Figure 5 shows a plot of the computed
values for the first two principle components,
which between them accounts for 55.49% of the
variation in the data. The plot shows a high
degree of correlation within each population and
subsequently between the populations. A similar
trend is seen in all the principal component plots
shown on Figs 6 - 10.
Further analysis using one-way analysis
of variance (ANOVA) and Duncan's multiple range
test (DMRT) are shown on Table 7 and 8. The
results show that means do not differ
significantly at a given level for both the band
width and the distances in between bands.
Analysis of band widths also shows high

-50-
Table 6 . Normalised eiqenvectors (weiqhtinqs) and variance explained by the best_4 ~principal components for the 10 variables of malic enzyme.
LB12
LB23
LB34
LB45
LB56
WB2
WB3
WB4
WB5
W86
Cummulative ' of Variance
1 ·
-0.828
0.733
0.863
0.708
0.240
0.695
0.056
-0.066
0.091
-0.453
32.58
PRINCIPAL
2
0.182
-0 .132
0.110
-0.309
0.320
0.066
0. 811
0.922
0.649
0.309
55.49
COMPONENTS
3 4
0.096 -0.095
0.287 -0.156
0 . 044 -0.252
-0.155 -0.390
0.346 -0.819
0.419 0.337
0.462 0 . 010
0.114 -0 .112 ;
-0.659 -0.010
0.720 -0.02:2 ·
71. 43 81. 89
* Note: "LB" denotes distance between bands (e.g LB12 is the distance between the lirst and second bands)
"WB" denotes the band width (e.g. WBl is the width o( the first band from the application point)

I I ,....; Lf')
I
4
2
-6 -4 -2 2 4 6 a 10 12 14 16 18 20 2 PC 2
-4 r..
-6 r..
-8 I- 0 OD '\l'\l
0
-10 ~ 0 'V
-12 ~ · :=. • -14 '\l
-16 L
-18 ... • 0 • PC 1 -20 L
Fig. 5. First and second principle component plot comparisons of the six population of MonoQY.chellus spp. using Malic Enzyme. (ME)
• Busia
• Embu
Y lshi_,.
OMom~
PC : Principle Component
o Nairobi
"Rusn~

I
I N UJ I
4 ..
2
-4 -2 2 4 6 8 10 12 14 16 18 20 -2 PC 3
-4
-6 [
-8 oo 0 'iJ
. -10 t 0
L -12
-14 lo o•
-16 [
-18 •o • PC 1
-20
Fig. 6 First and third principle component plot comparisons of the six populations of Mononychellus spp. using Malic Enzyme (ME)
• Busi.a
• Embu
• lshiara
o tviom~ O N•irobi
'iJ Rusinga
PC = Principle Component

I C"') I.I")
I
- - ---·-
-12 -10 -8 -6 -4 -2 PC4
0 0 0
\l\l 0
~l •
•
6
4
2
-2
-4
-6
-8
-10
-12
-14
-16
• 0-18
-20 PC 1
2 4
Fig. 7 First and fourth principle component plot comparisons of the six populations of Monony,chellus spp. using Malic Enzyme
• Busia
• Embu
(ME) T lshiar4
"V Rusin~
Pr.~ Pr-inr-in&.. rnmnnn•nt
o Nairobi
o Mombasa

PC 2 18 i-
16 [ •
14
12 ..
101- ~
Br o ~ • 0 •
6~
4 ...
J I 2 .. I.I")
I
' -~ -~ _; t ~ ~ ~ ~ 1~ i'2 14 16 18
-2 PC 3
-4 ...
Fig. 8 Second and third principle component plot comparisons of six populations of MononY.chellus spp. using Malic Enzyme (ME)
• Busia
• Embu
T lshiara
O Morrt>cs•
PC = Principle Component
o Nairobi
~ Rusinga

I If) If)
I
PC2
20 ...
18 ...
16 ...
• 14 ...
12 ...
8j;o 10 ...
0 8 ... 0 0 DO
• 6 ...
4 ...
I I I I I I I 2~
I I
-11 -12 -10 -8 -6 -4 -2 2 4
PC4. -2 ...
-4 ...
Fig. 9 Second and fourth principle component plot comparisons of six populations of Mononychellus spp. using Malic Enzyme (ME)
• Busia
• Embu
• lshiara
o Mombasa '"'r _ f"'\-. !--:-t- ,... ______ ~
o Nairobi
~ Rusinga

I \0
.
PC 3
20 ...
16""
• 14 ...
12"" y ti 10•
o s~
0 51-• 4 ""
? I 2f -1~ -1'2 -10 -8 -6 -4 -2 2 4
PC 4 -2 ·
-4 ...
Fig. 10 Third and fourth principle plot comparisons of six populations of Monony_chellus spp. using Malic
Enyme (ME)
• Busia y fshiara o Nairobi
• Embu o Mombasa 'V Rusinga
PC : Principle Component

-57-
' .
Table 7: Analysis of variance for comparing locations using band widths of malic enzyme (MEI
Source df WB2 WB3 WB4 WB5 WB6 MS MS MS MS MS
Location 5 18.79 12.45 2.74 0.37 13. 96
Error 12 40.70 16.45 5.81 1. 24 36.83
F Value 1.11 1. 82 1.13 0. 71 0.91
Significance 0.4059 0.1839 0.3943 0.6274 0.5063 level
Corrected 17 59.50 28.91 8.56 1. 61 50.79 Total
** represent significant values.
Locational Means
a b a a a Busia 5.667 2.700 1.000 0.667 3.067
a b,a a a a Em bu 7.500 3.500 1. 067 0.600 0.683
a a a a a Ishiara 7.233 5.067 2.067 1. 030 0.500
a a a a Mombasa 5.433 3.167 1.067 0.867 0.833
a a a a a Nairobi 8.100 2.500 1. 067 0.867 0.767
a b,a a a a Rusinga 7.733 3.500 0.933 0.850 0.833
*Mean comparison was by Duncan~multiple range test. Means with the same alphabet,within a particular treatment are not significantly different.

/
-58-
' '
Table 8: Analysis of variance for compari!lg locations using distances betwee!l bands of Ma lie enzyme IMEl.
Source df LB12 LB23 LB34 LB45 MS MS MS
Location 5 34.570 2.790 2.650 0.100
Error 12 8.000 1. 830 1.690 1. 000
F Value 10.37 3.65 3.76 2.47
Siqnificance 0 . 0005 •• 0.0306 * * 0 . 0280 ** 0.0920 level
Corrected 17 42.57 4 . 63 4.34 0.200 total
** represent significant values
Locational Means
a b c b Busi a 29.500 4.500 1. 670 0.833
a b,a b,c,c b,a Embu 28.333 5 . 167 1. 400 1.000
a b,a b,c b,a Ishiara 28.500 5.167 1.600 0 . 900
a a b b,a Mombasa 28.500 5.333 1. 600 1.000
a a a a Nairobi 25.330 5.667 2.330 1. 067
a a b,a b,a Rusinqa 26.670 5.667 2.000 0.967
*Mean comparison was by Duncan's, multiple range test (a=0 . 05) Means w~th the same alphabet, within a particular treatment are not si~nificantly different.
LB56
0.110
0 ; 370
0. 74
0.6060
0.480
a 0.767
1.000
a 0.833
a 0.867
a 0 . 933

-59-
correlation coefficient. These results indicate
that there is no locational differences between
populations.
4.2.2 Glucose phosphate isomerase
For glucose phosphate isomerase (Plate 2 and
Fig 11). Three clearly discernable bands and a
single faint band were produced in each of the CGM
populations. The red spider mite shows a
different banding pattern. Qualitative
differences were not evident from the expressions
of bands, this consistency was observed in all
replicates.
Results of the measurements of distances
between bands and of band widths are shown in
Appendix 8. Analyses were carried out using the
same statistical methods as for malic enzyme.
Table 9 gives the results of correlation
coefficient half matrix between the variables.
There exists a high degree of intercorrelation
between the variables, both in the length between .
bands and in band width.
Table 10 shows the normalized
eigenvectors· of the correlation matrix. These
represent the three best components of the
variables. Component 1 accounts for 31.93% of the

-60-
' - .
GPI
PLATE 2: Photograph of glucose phosphate isomerase bands.

-61-
GPI
ORIGIN RSM BSA EMB ISA MSA NRB RSA
BEi!1 EE!1 EBE 1E11 Eml Ei!!D
llEil EH!I 11111&1 EBB EBB lmBI aeB EB!!!I llB!B IE!il lm9D m:mB
~ Not prominent
Fig. 11 A schematic representation of zymograms f ram the I EF of glucose phosphate isomerase (GPI)
RSM: Red Spider mite, BSA= Busia, EMB = Embu, ISA= lshiara MSA = Mombasa, NRB - Nairobi, RSA = Rusinga

-62-
TABLE 9 Coefficient of correlation half matrix for variables
LB12
LB23
LBJ4
LB45
WB2
WB3
WB4
WBS
of Glucose phosphate isomerase
LB12 LB23 LB34 LB45 WB2 WBJ WB4 WBS
1. 00 -0.12 -0.46 -0.15 0.44 -0.03 0.08 -0.65
1. 00 0.07 -0.41 0.34 0.27 0.10 0.19
1. 00 -0.12 -0.26 0.33 -0.20 0 . 33
1. 00 0.09 0.14 0.15 0.11
1. 00 0.54 0.38 -0.48
1. 00 0.37 0.12
1. 00 0.15
1. 00
* Note: "LB" denotes distance between bands (e.g LB12 is the distance between the first and second bands)
"WB" denotes the band width (e.g. WBl is the width of the first band from the application point)

/
-63-
TAB~E to: Normalised eigenvectors (Weightings) and variance explained by the best 3 principal components for the 8 variables of glucose phosphate isomerase.
LB12
LB23
LB34
LB45
WB2
WB3
WB4
WB5
cununulative % of variance
1
0. 715
0.205
-0.658
0.161
0.846
0.515
0 . 393
-0.636
31. 930
Principal Components
2 3
-0.374 -0.430
0.227 0. 857
-0.048 0.248
0.465 -0 . 600
0.085 0.275
0.607 0.405
0 . 650 0.002
0.679 0.080
20 . 880 19.830
* Note: "LB" denotes distance between bands (e.g LB12 is the distance between the first and second bands)
"WB" denotes the band width (e.g. WBl is the width of the first band from the application point)

-64-
variation. This is much higher than the other two
components which contribute 20.88% and 19.83%
respectively. Figs 12 - 14 show plots of the
principal components whose values cluster, show{ng
evidence of a close correlation in the variables
between and within populations.
Table 11 and 12 show the ANOVA and DMRT
for GP! bands respectively. Significant
differences are shown by distances between bands,
except LB12. None of the values for band widths
show any significant differences in locational
mean. Comparison by DMRT indicate a high degree
of similarity within the CGM populations. Except
LB23, all other populations do not show
significant differences. Among the band width,
WB2 and WB3 have closely related means while WB4
and WBS show variations. Results with GPI again
indicate intercorrelation of CGM in the six
locations.

I l.J")
'° I
-
.. PC 1 20 ..
18 -
16 .. • 14
12 • • • • ~ll.ao 1u
= '0 • ~ 'g \7 -
"V 6•
4•
2
. . . . . .
-10 -8 -6 -4 -2 2 4 6 8 10 12 14 16 18 20 -2. PC 2
-4.
Fig. 12. First and second principle component plot comparisons of six populations of Mononychel lus spp. using Glucose Phosphase
lsomerase (GPI)
• Busia • lshiara o Nairobi
• Embu o Mom~sa "V Rusinga
PC = Principle Component

-66-
6 'V
4
2
-4 -2 2 4 6 8 10 12 14 16 18 PC 3
-2
-4
-6
Fig. 13 First and third principle component plot comparisons of six populations of tyboonychellus spp. using Glucose Phos-phate lsomerase (GPI)
• Busia
• Embu
~ lshiara
o Mombasa
PC = Principle Component
o Nairobi
'V Rusinga

-67-
PC2
16
14
12 . -,
10
8
6
4
6 4 4 6 8 10 12 14 16 18 20
-2 PC3
-4
-6
-8
Fig. · 14 Second and third principle component plot comparisons of si".x populations of Mononychel lus, using Glucose Phosphate
• Busia
•Embu
lsomerase ( GPI)
• lshiara
o Mombasa
PC= Principle Component
o Nairobi
'\l Rusinga

,. -68-
TABLE 11: Analysis of variance for comparinQ locations using distances between bands of glucose phosphate
isomerase (GPI)
Deqrees of LB12 '.,823 LB34 LB45 Source freedom Ms Ms Ms MS
Location 5 0.4530 0.0070** 0.0001** 0.0330**
Error 12 1.8800 3.82 0.92 0.4900
**represent significant values.
Locational means
a a b a Busi a 11.267 5.167 2.100 1.133
a ba b a Embu 11.267 4.833 2.033 1. 567
a d b a Ishiara 11.167 3.167 2.000 1. 733
a de b a Mombasa 11. 000 3.500 2.000 1. 733
a bdc b a Nairobi 10.000 4.000 2.167 1. 600
a abc a a Rusin9a 10.630 4.267 4.167 1. 533
*Mean comparison was by Duncan's multiple range test (a•0.05) • Means with the same alphabet within a particular treatment are not significantly
different.
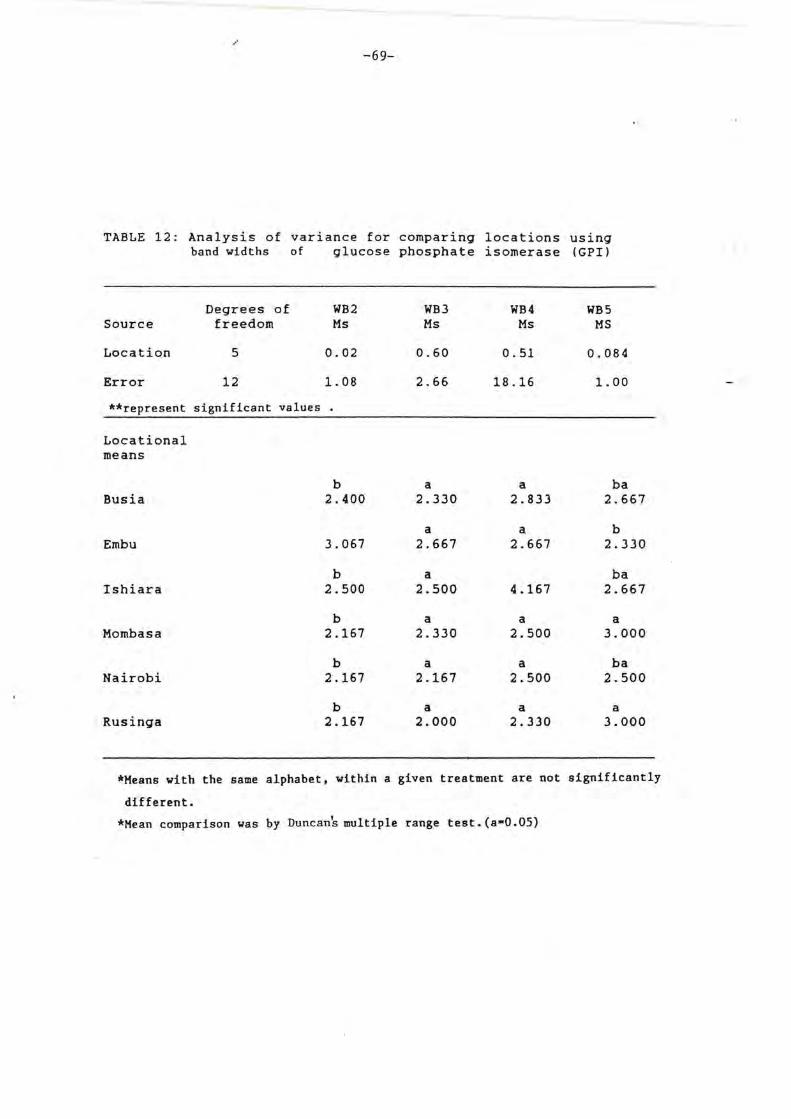
-69-
TABLE 12: Analysis of variance for comparing locations using band widths of glucose phosphate isomerase (GPI)
Degrees of WB2 WB3 WB4 WB5 Source freedom Ms Ms Ms MS
Location 5 0.02 0.60 0.51 0.084
Error 12 1. 08 2.66 18.16 1. 00
**represent significant values .
Locational means
b a a ba Busi a 2.400 2.330 2.833 2.667
a a b Em bu 3.067 2.667 2.667 2.330
b a ba Ishiara 2.500 2.500 4.167 2.667
b a a a Mombasa 2.167 2.330 2 . 500 3 . 000
b a a ba Nairobi 2.167 2.167 2.500 2.500
b a a a Rusinga 2.167 2.000 2.330 3.000
*Means with the same alphabet, within a given treatment are not significantly
different.
*Hean comparison was by Duncan~ multiple range test.(a•0.05)

-70-
4.2.3 Malate dehydrogenase
Malate dehydrogenase bands (Plate 3
and fig 15) were slow to form, but once they
appeared, remained consistent for several hours.
MOH banding pattern was more complex than ME and
GPI. A single, rapidly migrating anodic band
appeared in all the CGM populations. Data of the
measurements of distance between bands and those
of the band widths are shown in appendix 9. Table
13 shows the coefficient of correlation values
between the variables. MDH values are much ' lower
than ME and GPI.
Table 14 shows the two principal
components which between them account for 55.12%
of the variation. Plotted values of the
principal components are shown in Fig. 16
Uniformity between populations is portrayed by
clustering of the points. Table 15 and 16 show
results of the ANOVA and DMRT of locational means
for all populations to be very close

-71-
. MOH ----.:-
''
! '
PLATE 3: Photograph of malate dehydrogenase bands.

+
-- -Iii
-BSA
-72-
- - -
EMB ts.A NRB RSA
- Prominent
Fig i5 A schematic presentation of zymograms from I EF of malate dehytirogenase (MOH)
RSM: Red Spider Mite, BSA: Busia, EMB: Embu, ISA: lshiara MSA: Mombasa, NRB: Nairobi, RSA: Rusinga.
/

-73-
TABLE 13: Coefficient of correlat1on half matrix for variables of Malate dehydrogen•se (MDH)
LB12 LB23 LB14 WB2 WB3 WB4
LB12 1. 000 -0.140 0.177 -0.230 -0.400 0.010
LB23 1.000 -0.120 -0.030 0.220 -0.180
LB14 1. 000 0.210 0.560 0.069
WB2 1. 000 0.130 0.300
WBJ 1.000 0.270
WB4 1.000
* Note: "LB" denotes ·distance between bands (e.g LB12 is the distance between the first and second bands)
"WB" denotes the band width (e.g. WBl is the width of the first band from the application point)

/ -74-
TABLE 14: Normalised eigenvectors (Weightings) and bfy thle best 2 principal components variance explained o ma ate dehydrogenase. for the 6 variables
Principal Components
1 2
LB12 -0.595 0.370
LB23 0.093 -C.767
LB14 0.706 0.056
WB2 0.519 0.361
WB3 0.837 -0.231
WB4 0.409 0.629
Cummulative \ variance 33.310 55.120
* Note: "LB" denotes distance between bands (e.g LB12 is the distance between the first and second bands)
"WB" denotes the band width (e.g. 'WBl is the width of the first band from the application point)

..
-75-
PC 1 • 32 ~
30 ,p • 0 28 'fo8 26 .. " 0
24 0
• 22 ..
20 ..
18 •
16 ..
14
12 ..
10 -
8 ..
6
4 •
2~
. . . . . . . . •
-4 -2 2 4 6 8 10 12 14 16
-2 ~ PC2
-4.
Fig. 16 First and second principle component plot comparisons of six populations of Mononychellus
using Malate Dehydrogenase (MOH)
• Busia
• Embu
• lshiara
o Mombasa
D Nairobi
\I Rusinga
PC : Principle Component

/ -76-
TABLE 15 Analysis of variance for comparing locations using distances between bands of Malate dehydrogenase (MDHJ,
Degrees of WB2 WB3 WB4 Source freedom Ms Ms Ms
Lo Qation 5 0.705 NS 0.250 NS 0.030 * *
Error 12 5.660 5.120 3 . 000
**represent significant values
Locational means
a a a Busi a 3.500 3 . 330 4.500
a ba b Embu 4.167 3.067 3.330
a a b Ishiara 3.833 3.330 3.500
a ba b Mombasa 3.500 2.660 3.330
a ba b Nairobi 3.330 2.833 3.000
a b b Rusinqa 3.830 2.000 3.167
*Hean comparison was by .Durrcan's multiple range test (a•O. 05)
Means with same alphabet within a particular treatment are not significantly
different.

-77-
TABLE 16 Analysis of variance for comparing locations using band width of Malate dehydroqenase {MDH).
Degrees of LB12 1.323 LB14 Source freedom Ms Ms Ms
Location 5 0.250 NS 0.810 NS 0.480
Error 12 4.320 5.160 45.830
*represent significant values.
Locational means
a a b Busi a 4.330 5.500 32.167
a a Em bu 3.000 6.000 33.667
a a a Ishiara 2.900 6.000 34.667
a a a Mombasa 3.000 6.000 35.000
a a a Nairobi 3.167 5.500 32.833
a a a Rusinqa 4.600 5.500 34.330
I
*Hean comparison was by l'Juncan 's multiple range test (a•0.05)
HLans with the same alphabet within a particular treatment are not significantly different.

-78-
4.3 Cuticular hydrocarbon analysis
Cassava green mites produced
sufficient quantities of cuticular hydrocarbon
extracts which gave high resolution and consistent
chromatograms. Fig 17 and 18 show the
chromatograms from CGM collected from Mombasa and
Nairobi which represent the long and short setae
forms respectively. Fig 19 shows the profiles for
the red spider mite. Retention times, absolute
areas and relative areas for the prominent peaks
for all samples are presented in appendices 10 -
12.
The prominent peaks represent abundant
hydrocarbon components while the minor peaks
represent the less abundant components. Profiles
of both the Mombasa and Nairobi populations had
abundant hydrocarbons. A total of six prominent
peaks eluted at similar retention times in both
the populations. The pattern in RSM was different
from that in the two CGM populations, particularly
with increasing retention time. These profiles
express close relationship between the short and
long setae forms in the CGM populations that were
studied.

......_ LL -........ a:: 0 f-u i1
~I z 0
~ z 0
L{) ,...... co .-I[) (7)
(\jN .- .-
co (7) '""-: co ~
(7) .-co I[)
~ .-
~ ai
~ 0 0 ...: .-.-N l
TIME (MINUTES)
Fig . 17 Gas chromatogram of cuticular hydrocarbons isolated from Nairobi population of cassava green mite Mononychellus spp.

-80-
IONIZATION FACTOR (IF)
TJ (Q .. 1--' 00
(j) ru (/)
u n "J
0 ., uo c 3 ~ ru -· r+ 0 0 :J <O
0 al -3 n ru 0 (/) -(/) ru n < c ru r+
n · 11.100 co c -f
~ DJ ~ ro
., ,,, ~ ;g 12 .643 - 12.940 ~ - · ., r+ 0 z rn fti ~ ..
~g (/'I
~ -01 15.920 g
~ ~· "J 0 DJ = r+ <t> 0. B.201
(/) -u ., u 0
3 ~ 0 21.055 3 er ru (/) ru

-81-
IONIZATION FACTOR (IF)
Tl lO
f--' lD
(j)
~ () :T ,
, 0 <t> 3 a. ru
r+ (J1 0 DlO --., Q. DJ ~ 3 11.059
3o at - -t -() r ~~ l"1
c;....-----~ 12.576 12.262
r+ -· , () -ru c r
r~ z () :T c
-t :T '< l"1 Di Q. (/)
14.530
ii .._,
~
14.753
21.045
(/).
0 ru r+ <t> a. -, 0 3

-82-
5. DISCUSSION
5.1 Morphological examination.
Studies on Morphology were done to
correlate whatever biochemical findings with
morphological work, which has been the traditional
criteria for classifying CGM. Factors that make
morphological features unreliable for
characterizing CGM were revealed in the study.
This showed why the descriptions given by Doreste
(1981), based on setal lengths, created confusions
for workers who tried to describe the species much
later, such as Flechtmann and Baker (1982).
Among the factors responsible for this
confusion in the description of CGM is the
transient nature of the slide preparation of the
specimens. In the preparation of CGM for
observation, specimens are flattened out between
slides, and little idea is obtained of the actual
physical state of the mite, and the relative
positions of the setae. This is particularly
important in groups which are differentiated on
the basis of the setal length such as the CGM. It
would be most ideal to make such preparations in
cavity slides.

-83-
Furthermore microscopic slides tend to
degenerate and are likely to break after only a
short time making comparisons of present and past
descriptions difficult. For instance, Bandar's
original slide used in describing Tetranychus
tanajoa (Bondar) in 1938 was apparently lost and
not available to later authors for comparative
studies (Gutierrez, 1987). Another drawback in
morphological analysis observed in this study was
the shrinking of specimen as a result of
preservation in alcohol. This Gould be detected
by the reduced distances between the dorsal
integumentary setae. Sometimes the bodies of
older females were found to be swollen. In such
cases integumentary setae became further apart.
Rogo et al. (1987) and Bob-Manuel (1987) observed
similar occurrences in CGM. Biochemical analysis
could perhaps be the most meaningful method of
characterizing CGM.
Other than the experimentally induced
changes in CGM morphology, characters such as the
chaetotaxy used in this study and employed in
previous characterization, often differ from one
specimen to another. D~scription could for
instance be based on a species that is clearly
musculinized, which is ~ frequent phenomenon in
Tetranychids (Helle and Sabelis, 1985). At times

-84-
the number of ordinary setae is not the same in
the individual specimens. This lack of
consistency in morphological features does not
allow for effective application of setae in
species distinction.
Measurements and indices of
morphological features must always be taken with a
lot of caution during species definition.
Variations in morphology observed in setal lengths
are typical of Tetranychids (Boudreaux, 1963). ·
The same author reported variations in Tetranychus
telarius (L.) which was mistakenly considered as
the closely related Tetranychus cinnabarinus
(Biosduval). Only after experimental
demonstration of reproductive isolation followed
by the establishment of decisive morphological
characters such as the male genetalia, was the
correct identity of this mite known.
Suggestions by previous workers
(Rogo et al., 1987; Bob-Manuel, 1987) that a
cross-section of taxonomic characters be used to
identify CGM has been well considered in this
study. As noted by Boudreaux (1963) the study of
tetranychid systematics should be extensive enough
to replace the examination of
morphological characters alone.

-85-
5.2 Isoenzyme analysis.
In the isoenzymes where resolution was
quite distinct, interpopulation similarities in
bands were observed, these are clear indications
o~ the closeness in species relationship of CGM.
Harris and Hopkins (1976) stated that the more
enzymes that are electrophoretically identical
between samples, such as is observed in this study
the greater the likelihood that samples are from
related organisms, especially if the enzyme bands
are repeatable and consistent. Biometric analysis
further revealed the statistical significance of
the close relationship between CGM populations.
Scatter diagrams for the three most active enzymes
showed a· high degree of cluster which is normally
expected of inter-correlated characters in a
Principle Component Analysis (PCA) (Rolf, 1967).
Plots of GPI and MOH were particurlarly
effective indicators of the close relationship
among CGM populations. This corresponds with the
high rate of activities normally exhibited by the
two isoenzymes. Mehrotra (1961) and later Kotter
(1978) demonstrated the presence of large
quantities of MOH in T. urticae necessary for the

-8.6f·-
glycolytic pathway, the pentose and tricarboxylic
cycles in metabolism. Ward et al. (1982) in
separating three species of tetranychid mites,
Tetranychus urticae, T. turkestani and T pacificus
reported MDH as a particularly powerful diagnostic
character. Rogo et al (1988) in separating
Plilebotomus pedifer and Phlebotomus elgonensis
reported ME, MDH and GP! as having distinct and
reproducible bands which are useful in taxonomic
differentiation. Biometric analysis carried out
in this study further revealed the statistical
significance of the close relationship between CGM
populations. Scatter diagrams for the three most
active enzymes showed a high degree of cluster
which is normally expected of inter-correlated
characters in a Principle Component Analysis (PCA)
(Rohlf, 1967).
In those enzymes in which clear
discernable bands were not seen, the causes of
reduced activity or inactivity could have been due
to over dilution of extracts or in some cases a
complete lack of a particular enzyme in the mite.
Other possible reasons for the lack of activities
could be similar to the work reported by Blank
(1979), who studied enzyme activity in T. urticae
and showed that a considerable amount of enzymes
with cholesterase activity failed to penetrate the

-87-
electrophoretic gel. This would indicate that in
spider mites, such enzymes are strongly bound to
membranes or other proteinaceous material and
could not be easily extracted, and therefore, no
banding patterns were observed.
There are certain pitfalls in the use of
enzyme electrophoresis for taxonomic
characterization which could have resulted in
minor variations of the banding patterns. For
instance, only a single mite specimen should have
been homogenized for electrophoresis, but for
practical purposes, such as the small size of the
mite and therefore, a low protein content, this
was not possible. Furthermore biochemical studies
cannot be carried out in the field where there is
no electricity. For this reason samples have to
be specially stored, making the whole exercise
very expensive.
Although changes resulting from storage
were not observed unlike in setal length
measurements, enzyme patterns may degenerate or
alter upon storage especially if specimens are not
stored in liquid Nitrogen. In which case valid
comparisons may not be possible, since very weak
bands appear. Faint bands also occur when
organisms have enzymes which are broad-spectrum in
their activity. This t~nds to interfere with the

-88-
staining of a particular enzyme which is being
investigated (Dolan et al. 1988).
This study used female specimens for the
analysis. In the preliminary studies, the banding
pattern of both males and females were shown to be
the same, only that males produced faint bands. No
biasness was therefore introduced by using females
alone. Likewise Ward et al. (1982) and Rego et
al. (1988) in differentiating Phlebotomine species
reported that the main components of enzymes
normally detected for male and females in IEF runs
are the same.
The whole concept of using females was
to prove Doreste's (1981) criteria of using the
long and short setae forms of females to warrant
species differentiation in CGM, as incorrect.
These biochemical investigation have proved beyond
reasonable doubt that Doreste (1981) was not
correct in naming two species of CGM, M.
progresivus and M. tanajoa basing his description
on setal lengths of females. His classification
sparked off controversy about the precise identity
of CGM in Africa. Workers trying to use the same
criteria of setal lengths employed by Doreste
(1981) have therefore come up with conflicting
reports. Flechtmann (1982) reported that there
was M. progresivus and M. tanajoa in Gabon.

-89-
Macfarlane (1984) also reported the two species,
M. tanajoa and M. progresivus, but added that
M.tanajoa were fewer in number. Gutierrez (1987),
contrary to these reports, stated that there is
only one species in Africa and called it M.
progresivus. Rogo et al. (1987) reported that
only one species is present in Africa, but called
the species M. tanajoa. Similarly Bob-Manuel
(1987) using the ontogeny of the dorsal central
body setae found only one species and called it M.
tanajoa. Murega (pers comm.) working in the same
region using hybridization methods to describe the
species, reported one species, but maintained that
the species in Africa is M. Progresivus. Yaninek
and Herren (1988) stated that until otherwise
proved, only one specie~ exists in Africa and that
this should be ref fered to by the original name
given to CGM in Africa, M. tanajoa
From these biochemical studies we can
correctly say there is only one species, and that
Doreste's report of M. progresivus, as yet another
species in Africa differentiated from M. tanajoa
on the basis of females setal lengths, is
incorrect. The males he described to be M.

-90-
progresivus were infact those of M. tanajoa and
what he described as M. tanajoa males were
Mononychellus estradai. In otherwords M.
progresivus does not exist. It is evident that
even if the long and short setae forms are in the
process of becoming separate species, the
biochemical analysis shows that they have not yet
acquired the attributes of distinct species status
and should be treated as one .
The occurence .of long and short setae
forms of CGM could be a result of enviromental
factors. Bob-Manuel (1987) reported that setal
measurements of Mombasa mites which had
predominantly long setae forms, varied from other
populations of CGM in Kenya due to differences in
climatic conditions. Such differences influence
mites phenotypically. The changes resulting from
these environmental conditions can mislead workers
in morphological taxonomy to believe that more
than one species is involved, particurlaly a
worker looking at the extreme ends of the setal
l~ngths (short and Long). Isoelectric focusing
results in this study have provided. a source of
addition.al taxonomic characters for classifying
CGM

-91-
5.3 Cuticular hydrocarbon analysis.
Cuticular hydrocarbon analysis of cassava
green mites were complimentary to the isoenzyme
investigation. Chromatographic patterns of
Nairobi and Mombasa mites that represent the short
and long setae forms respectively were shown to be
identical. This confirms isoenzyme investigation
which indicated similarity in the CGM populations.
It is interesting to note that although
IEF and GC are two different methods of studying
biochemical characters, they showed results
indicating close species relationship among CGM
populations. The occurrence: of minor peaks on the
gas chromatograms can partially be explained by
the contrasting eco-climatic conditions in the
mite collection sites. Varying weather conditions
could induce changes in the cuticles of the mites.
For example Lees (1952), and Van de vrie et al.
(1972) noted that humidity and temperature exert
strong influence on spider mites. The loss or
gain of water from the atmosphere is important for
organisms the size of CGM because of their large
surface area/volume ratio. High relative humidity
may prevent loss of moisture. Mites in areas of
high humidity tend to have thin cuticle. Likewise

-92-
in low humidity areas the cuticles are thicker
(Baudreaux, 1958). For instance, Arnold and
Reigner (1975) reported that hydrocarbons are of
major importance in a wide range of ecological
roles and their quantity or at times quality are
correlated with the need to conserve water. He
gave the example of Ptenonacys carlif onica
(Newport). Members of this species which inhabit
hot areas had more surf ace lipids than those which
are found in cool habitats. Qualitative and
quantitative changes in cuticular hydrocarbons
related to environmental conditions have also been
reported in the flesh flies, Sarcophaga bullata
(Haag) (Armorld and Reignier, 1975) Sarcophaga
ritcheri (Lok et al. 1975), and in the beetles,
Tenebrio molitor (L.) and Tenebrio obscurus (F.)
(Lockey, 1984).
Despite their potentials as tools for
studying taxonomic characters, it should be noted
that use of GC as a taxonomic tool requires
improved quality in handling and extraction of the
specimens. In this particular study, the small
size of CGM was a limiting factor in the sense
that individual specimen have low absolute
quantities of Cuticular ' hydr9carbons which could
not easily be investigated with the kind of
equipment available. Studies on the quantities of

-93-
cuticular hydrocarbons have been carried out by
Morthes and Sietz (1982) who found the average
cuticular thickness in Tetranychus urticae to be
only 1.5 µm. Other authors who investigated
cuticular hydrocarbon thickness include (Gibbs and
Morrison, 1959; Hernesberg et al., 1965; Albert
and Storch, 1976). All are in general agreement
concerning the thin layer of cuticular
hydrocarbons.
The thin layer of cuticular hydrocarbons
meant that as many as ten adult pure-line bred
females of CGM had to be used in the analysis of
each population of CGM. Furthermore cuticular
hydrocarbon analysis requires expensive chemical
equipment (Howard et al., 1988). This makes it
difficult to conduct GC studies in the field.
Fortunately, hydrocarbons are relatively stable
molecules. They store well and can be readily
extracted under field conditions and preserved for
analysis at a later date (Howard, 1982). Inspite
of being a good taxonomic tool, such drawbacks as
mentioned above cannot allow the use of GC alone
in characterizing CGM. However, these preliminary
studies of cuticular hydrocarbons lend confidence
in establishing the precise identity of CGM.

-94-
6. SUMMARY
1. The study assessed the taxonomic status of cassava green
mite (CGM) using the traditional morphological characters
and the biochemical characters.
2. Morphological analysis indicated that CGM populations
have a gradient of setal lengths ranging from short,
intermediate to long forms.
3. The lack of a clear cut difference between the short and
long setal lengths makes this character unreliable for
species distinction.
4. Morphological analysis carried out in this study
confirmed previous reports by authors who had worked on the
taxonomy of the cassava green mite, and who suggested that
other taxonomic characters be applied in resolving the
species identitity of CGM.
5. Thirteen isoenzymes were studied on mites collected from
six cassava growing areas of Kenya. Isoelectric focusing
(IEF) method was used in separating these isoenzymes.
6. Enzyme bands appeared in all the six populations of CGM
and in the Red spider mite (RSM) which were used as
controls.

-95-
7. Not all bands were clear enough for use in taxonomic
classification. Only the clear and consistent bands were
used for taxonomic purposes.
8. Malate dehydrogenase (MOH), malic enzymes (ME) and
glucose phosphate isomerase (GPI), were powerful indicators
of species relationship, judged from the clarity and
consistency of the bands.
9. Multivariate analysis of the band parameters revealed no
statistically significant variation in the results.
10. In particular, PCA plots of MOH and GPI showed high
degrees of clusters. However, ME showed minor variations.
11. Analysis of variance (ANOVA) and Duncan's multiple
range test (DMRT) showed significant differences in the
population means.
12. Further analysis compared the cuticular hydrocarbon
components of the long and short setae forms of CGM using
gas chromatography (GC).
13. Cuticular hydrocarbon components showed identtcal peaks
for both the short and long setae forms of CGM.

-96-
14. Minor peaks appeared in profiles of both the long and
short setae forms of CGM, but these were not consistent for
either populations and could not be considered to express
species differences.
15. The occurance of minor peaks on the chromatograms was
explained in terms of differences in environmental
conditions which alters the nature of the cuticle
16. The chromatographic peaks show that cuticular
hydrocarbons of cassava green mites are closely related.
17. Based on investigations in this study, cassava green
mites in Kenya do not have any major biochemical variants.
This implies that the mites cannot be distinguished into two
separate species.
18. The methods of characterization considered in this
study emphasize the existence of only a single species of
cassava green mite.
19. There is need for biochemical studies to be conducted
extensively on CGM from various parts of Africa where
cassava is grown. Further studies should involve specimens
collected from the type region.

-97-
20. Until distinct species are demonstrated, cassava green
mite in Africa should be called Monoychellus tanajoa
(Bondar), which is the name originally given to the species
in Africa.

-98-
CONCLUSION
In correlating the various findings obtained
in this study, they collectively emphasize the
existence of a single species of cassava green
mite. However, data recorded in this work cannot
be taken as entirely adequate. Further research
will be required in both isoenzymes and cuticular
hydrocarbons of CGM. These studies should involve
investigations of CGM from other regions of
Africa. Comparative biochemical investigations
should be conducted with CGM from the type region.
Additional GC investigation should involve
isolation and the identification of cuticular
components using a mass-spectrometer. Lastly,
with the biochemical proof of only one species of
CGM, workers of Biological control can now evolve
more appropriate strategies for its control.

-99-
LITERATURE CITED
Akinlosotu, T.A. and K. Leuschner (1981). Outbreak of two
new cassava pests Mononychellus tanajoa and Phenacoccus
manihoti in South western Nigeria. Trap. Pest Manag.
27: 247-250.
Alberti and Storch (1976). Ultrastuktiv untersuchungen am
mannlichem Genitaltrakt und an spermeem von Tetranychus
urticae (Tetranychidae: Acari). Zoomorphologie 83:
283-296.
Allen, R.C. Harley R.A. and Talamo, R.C. (1974). A new
method for the determination of alpha-1-antitrypsin
phenotypes using isoelectric focusing on polyacrylamide
gel slabs. Am. J. Clin. Pathol. 62:732-739.
Allsops, B.A. and W.C. Gibson (1983). Isoelectric focussing
in Agarose. A highly discriminatory method for the
detection of enzyme heterogeneity. Ann. Trop. Med. and
Parasitol. 77: 169-173. ·
Arnold,.M.T. and Reigner F.E (1975). A development study
the cuticular hydrocarbons of Sarcophaga bullata. !L_
insect physiology 21,1827-1833.

-100-
Ayala, J.F. R. Jeffrey, L. Martin, A. Celso Santiago Perez
Salas (1971). Enzyme variability in Drosophila in the
Drosophila willistoni group IV. Genie variation in
natural populations of D. willistoni. Genetics 70: 113-
139.
Ayalla, J.F. and J.R. Powell (1972). Allozymes as diagnostic
characters of sibling species of Drosophila. Proc. Nat.
Acad. Scl. (USA). 69(5): 1094-1096.
Baker, E.W. (1979). Spider . Mites revisited: a review.
Systematic entomology laboratory. Rec. Advan. in
Acarol. 21: 387-391.
Baker, J.E. and Fatland (1979). Developmental changes in
cuticular lipids of the Black carpet Beetle Attagenus
megatoma Insect biochem 9: 335 -339.
Baker, J.E., R.D. Sukkestaad and C. Fatland (1979).
Cuticular Lipids of larvae and adults of the cigarette
beetle, Lasioderma serricorne. Insect Biochem. 9:
603-611.
Bark, V.E. and M. Firth (1976). Typing of common phospho
glucomutase variants using Isoelectric focusing, a new
interpretation of the phosphoglucomutase System. ;L_
Forens. Soc. 16, 115.

-101-
Baudreaux, H.B. (1958). The effect of of relative humidity
on egg hatching and survival in various spider mites.
J. Insect Physiol. 2 (1) 65-72.
Bennett, F.O. and M. Yaseen (1980). Distribution Biology
and Population dynamics in the tropics. Proceedings of
a workshop held in Rwanda, Kigali 23-27 Nov. (1980).
Bianchi, U and G. Chesa (1970). Alloenzimi ad attivita
xantin diedrogenasic in Anopheles artroparvus . Bull.
Zool.37: 477.
Blank, R.M. (1979). Studies on the non-specific esterase
and acetylcholinesterase isoenzymes electrophoretically
separated from the mites Sancassania berlesei
(Tyroglyphidae) and Tetranychus urticae
(Tetranychidae). N.Z. Journ. of Agric. Res. 22: 497-
506
Bob-Manuel, R. (1987). Study of the Cassava green mite Spp.
(Acari: Tehranychidae) in Africa. M.Phil. Thesis.
International centre of insect physiology and ecolo-9Y.L_
Nairobi.
Bondar, G. (1938). Notas entromologicas da Bahia. Rev.
Ent. 9 (3-98):441-449 . .

-102-
Boudreax, H. B. (1963). Biological aspects of some
phytophagous mite. Ann. Rev. Entomol. 0: 137-154.
Brazil, (1978). Electrophoretic variation of the enzyme
phosphoglucomutase in different strains of Leishmania.
Ann. Trop: Med. and Parasitol. 72(2): 113-119
Bryne, D.H. Bellotti A.C. and Guerrero J.M.(1983). The
Cassava mite. Tropical Pest Mang.29,378-394.
Cardwell-Grafton, E. Eash J.A. and Granett J. (1988).
Isoenzyme differentiation of Tetranychus pacif icus from
T. urticae and T turestani (Acari:Tetranychidae) in
laboratory and field populations. J.Econ.
Ent.81(3)770-775
Carlson, D.A. (1982). Chemical taxonomy; Analysis of
cuticular hydrocarbons for identification of Simulium,
Anopheles and Glossina. Proceedings of a symposium of
the application of the Biochemical and molecular
biology techniques to problems of parasites and vector
identification. Geneva, Switzerland. B-10 Nov. 1982.
Carlson, D.A. (1986). Identification of mosquitoe of
Anopheles gambiae Species complex A and B by analysis
of cuticular components. Science 207: 1039.

-103-
Carlson, D.A. and Brenner R.J.(1988). Hydrocarbon-based
discrimination of three North American Blatella
cockroach specis (Orthorptera: Blatellidae). using gas
chromatography. Ann. Ent.Soc.Am. 81(5): 711-723.
Centro Interncional de Agricultura Tropica, CIAT (1986).
Cassava newsletter vol 10 No.1
Cicolani, B., A.B.P. Bullini and L. Bullini (1981).
Morphological aspects of some phytophagous mites. Ann.
Rev. Entomol. 8:137-154.
Compere, H. (1961). The red scale and its enemies.
Higardia 31,173-278.
Cox, ' D. and J. Willis (1987). Post translational
modification of cuticular proteins of Hyalophora
cecropia from different anatomical regions and
metamorphic stages. Insect biochem. 17: 469-484.
Daly, J. and Fisk J. (1988). Identification of Heliothes
eggs using electrophoresis. International symposium on
electrophoretic studies of agricultural pests,
Rothamstead England. 6-8 April 1988.
Danks, H.V. (1988). Systematics in support of entomology.
Ann. Rev. entomol 33: 271-296.

-104-
Dolan, S. and C.C. Flemming (1988). Isoenzyme in the
identification and systematics of Terrestrial slugs of
the Arion hortonsis Complex. Biochem Syst. and ~col.
16: 195-198.
Donnadieu, A.L. (1875). A higher classifiation of the
spider mites. Soc. Linn. (n.ser.22 (1875), 34-163.
Doreste, E. (1981). Acaros del genoro Mononychellus
wainstain (Acari; Tetranychidae ) asociados con la
Yuccas (Manihot spp.) en Venezuela. Bull. ent. Venez.
10: 119-130.
Doreste, E. (1981). Spider Mites as important pests of
cassava (Manihot esculenta) Acarology 2: 761-769.
Doreste, S.E. and Aponte L.O. (1978). Egecto de los ateques
del comlejo de acaros Tetranychidae, en los rendimentos
del cultivo de la yuca. Revt. Fae. Agron. Cent. Venez.
10, 105-119.
Ewing, H.E (1913). The taxonomic value of characters of the
male genitalia arpature in the genus Tetranychus
Dufour. Expt. Applic, 25: 207-303

-105-
Flechtmann, c. H. W. and Baker E.W (1982). The cassava mite
complex: III New distribution records, mainly in
Colombia and Africa. References to other plants - Anas
ESC. Sup. Agric. 'Luiz Queroz' 39,809-813.
Flechtmann, C.H.W. and E.W. Baker (1970). A preliminary
report on the Tetranychidae (Acarina) of Brazil. Ann.
' of the Entomol. Soc. Am .. 63: 156-163.
Flechtrnann, C.H.W.and Baker, E.W. (1975). Plant feeding
mites of Thailand, Plant protection service. Technical
Bulletin No.35
Goto, H.E. (1982). Animal taxonomy. Arnold, London.5.ILJ;m
Grafton-Cardwel, E. (1988). Isoenzyme differentiation of T.
urticae and T~ turkestani (Acari: Tetranychidae) in
laboratory and field populations. J. Econ. Entomol
81: 770-775.
Greathead, D.J. (1970). A review of biological control in
the Ethiopian region. Tech. Comm. CIBC 5, 162pp
Gutierrez, A.P.(1987). An overview of a systems model of
cassava and cassava pests in Africa. Insect Sci. Appl.
8: 919-924.

-106-
Gutierrez, J. (1987). The Cassava Green Mite in Africa; one
or two species; (Acari Tretranychidae). Ex-Qt. and
Appl. Acarol. 3: 163-168.
Harris, H. and Hopkins D.A.(1976). Handbook of enzyme
electrophoresis in human genetics. North Holland,
Amsterdam
Haverty, MI. Page L.Nelson and G.J Blomquist (1988).
Cuticular hyrocarbons of the dampswood termite
zootermopsis, inter and intra colony variations and
potential as taxonomic characters. J. Chem Ecol. 14:
(3) 1035-1058.
Helle, W. and Overmeer W.P.J.(1985). Rearing techniques.
World crop pests. Vol.lA Elsevier, Amsterdam pp 331-
335 !..
Helle, W. and Sabelis M.M. (Editors) (1985) spider mites.
Their biology , Natural enemies and control. World
crop pest Vol lB Elsevier, Amsterdam 458~
Hernesberg, I.J. J.R. Adams and G.E. Cantwell (1965) Fine
structure of the integument of the two-spotted spider
mite Tetranychus telarius (Acarina: Tetranychidae).
Ann. Entomol. Soc. Am. 58:532-535.

-107-
Herren, H.R. and Bennett (1984). Cassava pests, their
spread and control. Proceedings of CAB'S First
Scientific conference Arusha Tanzania 12-18 Feb,
1984.-455pp.
Hienze, J. and A. Buschinger (1988). Electrophoretic
variability of esterases in the ant tribe
Leptothoracini. Biochem. System. Ecol. 16: 217-221.
Hauke E.J. and Hardy (1978). Electrophoretic characteristics
of non-specific esterases of the mosquitoe Culex
tansalis; conventional and isoelectric focused
acrylamide gels. Comp. Biochem. Physiol. 61: 291-295.
Howard, R.W. Thorne L.T. Lewing S.C.and McDaniel. (1988).
Cuticular hydrocarbons as chemotaxonomic characters for
Nasutitermes corniger (Motschulski) and N.ephratae
(Holmgren) (Isoptera: Termitidae). Ann.Entomol. Soc.
Am. 81 (3) 395-399.
Howard, R.W., C.A. McDaniel, · D.R. Nelson and G. Blomquist
(1982). Cuticular hydrocarbons of Reticulitermes
virginicus (Banks) and their role as potential species
and cast-recognition cues. Journ. Chem. Ecol. 8(9):
1227-1239.

-108-
Howard, w. R. (1982). Chemical Ecology and Biochemistry of
insect hydrocarbons. Ann. Rev. ent. 27: 149-172.
IITA (1984). Africa-wide biological control of cassava
mealybug and green spider mites. Information series No
16.
IITA (1986). Cassava Green Mite and the Africa-wide
Biological control programme at IITA. 1986 IITA
report.
Jackson, L.L. (1971). Cuticular lipids of insects IV.
Hydrocarbons of the cockroaches Periplaneta japonica
and Periplaneta americana. Compared to the cockroach
hydrocarbons. Comp. Biocem. Physiol.41B: 331-336.
Jackson, L.L. (1971). Cuticular lipids of ~nsects. IV
Hydrocarbons of the cockroaches Periplaneta japonium
and Periplaneta americana compared to other cockroach
hydrocarbons. Comp. Biochem.Physiol. 41B: 331-336.
Jennings, D.C.(1970). Cassava in Africa. Field crop abstract
vol 23 No.3
Jeppson, L.R. ,H.H. Keifer and E.W. Baker .. (1975). Mites
injurious to economic plants. University of California
Berkerly and Los angeles C.A.613.

-109-
Kottler, C (1978). Ein bietrag zur stoffwechessel-
Physiologie von Tetranychus urticae Koch.
(Acari:Tertranychidae). Z.Aqnew Ent. 86:337-348.
Krutzer R.D. (1979). Etterasa isozyrna in the rnoquitoe Culex
(melanoconious) Erratious Mosquitoe News 39, 500-505.
' Kumar, R. (1984). Insect pest control, with special
reference to African agriculture. Edward Arnold,
London. pp 286.
Le Pelley, R.H. (1943). The biological control of a
mealybug on coffee and other crops in Kenya. Emp. J.
Expt. Agri. 11:78-88.
Lees, G. (1952). The role of cuticular growth in the
feeding process of ticks. Proc. Zool. Soc. Lond. 121:
759-772
Lockey, H.K. (1980). Insect cuticular hydrocarbons. Comp.
Biochem. 65B: 457-462.
Lockey, K.H. (1984). Hydrocarbons of Metriopus pepressus
(HAAG) and Renatiella scrobipennis (HAAG) (Coleoptera:
Tenebrionidae). Insect biochem. 14: 65-7

-110-
Lok, J.B. Cupp E.W. and Blomquist G.J (1975). Cuticular
lipids of imported f ireants Solenopsis invicta and
richteri. Insect Biochem. 5, 821-829.
Lyon, W.F. (1973). A plant-feeding Mite Mononychellus
tanajoa (Bandar) (Acarina: Tetranychidae). New to
the African continent, threatens cassava (Manihot
esculenta) Crantz in Uganda, East Afr. PANS 19:
36-37.
MacFarlen, D. (1984). Key to spider mites (Tetranychidae)
recorded on cassava in Africa. Proc. of .r1fl Regional f; I
Training Workshop in E. Africa. 30April- 4th May 1984.,
31-35.
May, B., Bauer, L.S. Vadas, L.R. and Granett, J. (1977).
Biochemical genetic variation in the family Simulidae:
electrophoretic identification of the human - biter in
the isormorphic Simulium jenningsi group. Ann.Ent.
Soc. Am. 70 (5) : 637-640.
Megevand, B., J.S. Yaninek and D.D. Friese (1987).
Classical biological control of the Cassava Mite.
Insect Sci. Appl. 8: 871-874.
Mehrotra, K.N. (1961). Carbohydrate metabolism in the two
spotted spider mite Tetranychus telarius L. Hexose

-111-
monophosphate cycle. Comp. Biochem. Physiol.3:184-
198.
Mehrotra, K.N. (1961). Carbohydrate metabolism in the two
spotted spider mites Tetranychus telarius L. Comp.
Biochem. Physiol. 3:184-198.
Menken S.B.J. (1988). Electrophretic studies on population,
host races and sibling species in some families of
Lepidoptera and Diptera. International symposium on
electrophoretic studies of agricultural pests,
Rothamstead, England. 6-8 April, 1988.
Meredith, S.E.O. (1982). Filariasis: Simulium needs and
progress in the application of biochemical
Techniques to the problem of vector
identification. Proceedings of a symposium on
application of biochemical and molecular biology
techniques to problems of parasite and vector
identification held in Geneva, Switzerland, Nov.
1982.
Meredith, S.E.O. and Townson H. (1981). Enzymes for the
species identification of simulium damnosum complex
from West Africa. Tropenmedizin und Parasitologie,
32:123-129.

-112-
Miles, s. J.(1979). A biochemical key to the adult members
of Anopheles gambiae group. J. Med. Entomol.15: 297-9.
Miles, S.J and Ward (1978). Enzyme variation in the
Anopheles gambiae Giles group of species. (Diptera:
Culicidae. Bulletin of entomological Research. 68,
85-95.
Mothes,.U. and Sietz. K.A.(1982) Five structural alterations
in bean plant leaves by feeding injury of Tetranychus
urticae Koch (Acari: Tetranychidae). Acarologia
23:(149-159).
Murray (1877). 'Economic entomology aptera'. Chapman and
Hall. London 1-433.
Nachman, G (1984). Estimates of mean population density and
spartial distribution of the Tetranychus urticae and
Phytoseilus permisilis based upon the proportion of
empty units. J. Appl. Ecol. 21: 903-914.
Ndayiragiye, P. (1984). Cassava green mite in Burundi.
Proceedings of a Regional Training Workshop in
E.Africa.
Nelson, D.R., D.A. Carlson and C.L. Fatland (1988).
Cuticular hydrocarbons of Tsetse flies. II Glossina

-113-
fuscipes, G. palpalis palpalis G. P. gambiensis, G.
tachnoides and G. brevipalpis . Journal of chemical
ecology 14: 6-13.
• Nelson, D.R., J.W. Dillwith and G.J. Blomquist (1981).
Cuticular hydrocarbons of house fly Musca domestica.
Insect Biochem. 11: 189-197.
Nokoe, S. and L.M. Rogo (1988). A discriminant function for
the short and long setae forms of mononychellus (Acari:
Tetranychidae). Insect sci.applic.vol.9: 1-4.
Nyiira (1972). Report of investigation of cassava mite
Mononychellus tanajoa Bondar. Kawanda researcq
station, Kampala Uganda 1972 113p.
Pashley D.P. (1987). Host associated differentiation in
armyworms (Lepidoptera: Noctuidae). International
syposium on electrophoretic studies of agricultural
pest, Rothamstead, England. 6-8 April, 1988
Peschke, K. (1987). Cuticular hydrocarbons regulate male
recognition, male aggression and female choice of the
Rove beettle, Aleochara curtula. Journ. Chem. Ecol.
13: 1993-2008.
Petersen, J.L. (1982). Application of biochemical and

-114-
molecular biology techniques to problems of parasite
and vector identification. Geneva 8-10 Nov. 1982.
Petersen, J.L. (1982). Technique for isoenzyme analysis of
live mosquitoes (Diptera culicidae). Entomol. 75: 719-
720.
Pickett, C.H., F.E. Gilstrap, and L.F. Bouse (1987).
Release of predatory mites (Acari: Phytoseideae) by
aircraft for biological control of spider mites
(acari:tetranychidae) infesting corn. J. Econ Ent. 80:
906 910.
Pritchard, A.E. and E. W. Baker (1955). A revision of the
spider mite family, Tetranychidae. Pacific coast
Entomol. Soc. San. Fransisco. (Memoir Ser. 2) 472 pp
Rago, L.M., C.H.W. Flechtmann and E. Doreste (1987). A
preliminary study of the taxonomic status of Cassava
Green Spider Mite Complex Mononychellus (Acari:
Tetranychidae). Insect Sci. Applic 8:11-13.
Rogo, L.M., C.P.M Kharnala and M.J. Mutinga. (1988).
Biochemical identification of Phlebotomus (Larrousius)
Pedifer and Phlebotomous (Larrousius) elgonensis.
Biochem. Syst. Ecol. Vol.16 nos 7/8 pp 655-659.

-115-
Rohlf, F.J. (1967). Correlated characters in numerical
taxonomy. Syst. Zool. 16:109-126.
Rosen, D. and DeBach (1973). Systematics, Morphology and
Biological control. Entomophaga 18: 215-222.
Saul, S.H., M.J.Sinsko, P.R.Gimstad and C.B. Graig (1977).
Identification of siblings Aedes triseriatus and A.
hendersoni by electrophoresis. J. Med. Entomol .• 13:
705-8.
Saul, S.H.and P.R.Gimstad (1977). Identification of Culex
species by electrophoresis. Amer. J.Trop. Med.
Hyg.26:1009- 1009-12
Sauti, R.F.N (1981). Problems of cassava production in
Malawi. Proceedings of the first triannual root crops .
symposium of the international society of tropical root
crops - Africa 8-12 Sept. 1980, Ibadan, Nigeria.
Schelinger, E.I. and Doutt, R.L. (1964). Systematics in
relation to biocontrol. Biocontrol of insect pests and
weeds.pp 247-280, Chapmann and Hall, London.
Shaw, C.R and Prassad R. (1970). Starch gel electrophoresis
of enzymes - A compilation of recipes. Biochem. Genet.
4: 297-320.

-116-
Shukla, P.T. (1976). Preliminary report on the Green Mite
(Mononychellus tanajoa). Resistance to Tanzanian local
cassava varieties. E. Afr. Agr. For. J. 42: 55-59.
Singh and cunninghum (1981). Morphological and genetic
differentiation in aphids (Aphididae). Can entomol.
113, 539-550.
Sula, J. and Weyda (1983). Esterase polymorphism in several
populations of the two spotted spider mite Tetranychus
urticae Koch. Experimentia 39: 78-79.
Synder T.P. (L382). Electrophoretic characterization of
blackflies in Simulium venustum and verecundum species
complexes. (Diptera: Sim~lidae). Canadian entomologist
114:503-507.
Townson, H., S.E.O. Meredith and K. Thomas (1977). Studies
of enzymes in Aedes scutellaris group. Trans Royal Soc.
Trap.Med. Hyg.71:110.
Tuttle, D.M., and E.W. Baker (1968). Spider mites
(Tetranychidae: Acarina of the state of Coara Brazil.
Int. Journ. Acarol. 3: 1-8.
Unruh, T.R. and R.D. · Goeden (1987). Electrophoresis helps

-117-
to identify which race of the introduced weevil.
Rhinocyllus conicus (Coleoptera: Curculionidae) was
transfered to two· Southern Californian thistles.
Environm. Entomol. 16: 979-983.
Van der vrie, M. J.A McMurty and C.B. Huffacker (1972).
Ecology of Tetranychid mites and their natural enemies
. A review. Hilgardia 41:343-437.
Wainstein, B.A. (1960). Tetranychoid mites of the
Khazakhastan. J.Sci. Res. Inst. Plant. Prot.5: 1-156
Wainstein, B.A. (1971). Mononychellus, A new name for
Mononychus (Acariformes: Tetranychidae). Zool. zh.
50:589.
Ward, P.S., A. Boussy and D.E. Swincer (1982).
Electrophoretic detection of enzyme polymorphism and
differentiation in 3 species of spider mites (Acari:
Tetranychidae). Ann. Entomol Soc. Arn. 75: 595-598.
Wodagenen, A. (1985). Cassava and cassava pests in Africa.
FAO plant protection Bull. 33.
Yaninek, J.S. and H.R. Herren (1988). Introduction and spread
of Cassava Green Mite, Mononychellus tanajoa (Bondar)
(Acari: Tetranychidae) an exotic pest in Africa and the

-118-
search for appropriate control methods. Bull. ent. Res.
70: 1-13.
Yaninek, J.S. H.R. Herren and A.P. Gutierrez (1987). The
biological basis of the seasonal outbreak of CGM on
Africa. Insect Sci. Applic. 8: 861-865.

-119-
APnHnICES 1 - 6.: Keasure1ents (µ1) on adult fe1ale Cassava Green Kite of each qeneratioo fro1 six locations in ~eoya.
Appendix 1: Busia
Setal Lenq:h in iual
Gecentioo Repl. Dl J2 03
J7. 80 4U8 61. 44
27. 80 4U8 44. 48
28.08 4U8 44.48
28. 08 44.48 61.72
21. 80 44.76 44 .48
21 . ao 44.48 44. 4 8
27. 52 44.48 44 . 48
27.80 44.16 &o.88
28.08 44. 48 44.48 .
27. 80 44.48 4 4. 48
27.80 44.78 44. 48
28.08 44.48 44.48
27. 80 44. 48 44 . 48
27. 80 44 . 76 61. 44
28.08 44.48 61. 44
/
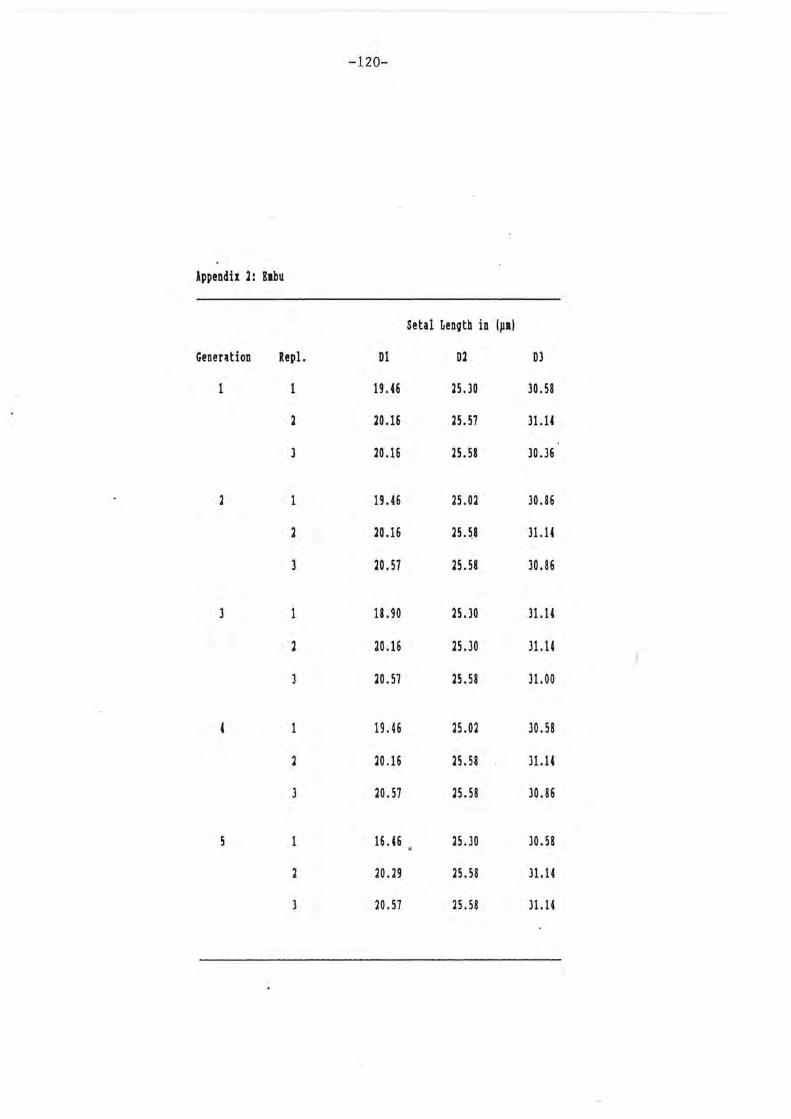
-120-
Appendix l: Babu
Setal Lenqtb in (µal
Geneution Repl. Dl D2 D3
1 19.46 25.30 30.58
2 20.16 25.57 31.1'
3 20.16 25.58 30.36
19 .46 25.02 30.86
2 20.16 25. ~8 31.14
20. 57 25.58 30.86
3 18. 90 25.30 31.14
20.16 25.30 31.1' •.
" l0.57 25.58 31.00
1 19.46 25.0l 30 .58
l0.16 25 . 58 31.14
20.57 25 . 58 30.86
5 1 16.46 25.30 30.58
2 20 .29 25.58 31.14
20.51 25.58 31.14

-121-
Appendix 3: Isbiara
Setal Lenqtb in (µ1)
Generation Repl. Dl DJ DJ
l7. 74 33. 92 41.98
25. 29 33.36 4U5
25.58 32.80 41. 98
2 25.58 33. 92 41. 70
25.J9 33. 92 (J.25
25.58 33.36 41.98
J5.02 33. 63 41. 98
25.29 33. 92 41.98
25.58 33. 36 41. 98
25.58 33. 92 41. 70
25.29 34. 05 42.25
25.58 33.36 41.98
25.02 33.92 41. 70
25.58 34.05 42.25
25.58 )3. 36 41. 98

-122-
Appendix 4: Ko1basa
Setal tenqth in (pal
Generation Repl. Dl D2 DJ
H. 46 36 .14 61.16
2 25.02 26.41 50.04
3 25.02 U.48 58.39
25.02 34.75 55.60
26. 41 30.58 50.04
3 B.63 H.48 53.93
25.02 30.58 61.H
2 25.02 33.36 50.04
3 25.02 45.04 52.41
25.02 30 .86 61.16
25.02 33.36 50.04
25.02 45.04 53.39
26.13 30.58 61. 72
25.02 33.92 50.32
25.20 45 .36 53.93

-123-
Appendix 5: Hairobi
Setal Lenqth in !µ11
G.eneration Repl. 01 02 03
20.85 25.30 38. 92
2 20.57 25 .02 22.24
20.85 25.02 )J .80
19.46 25.58 38.36
2 20.02 25.02 33.64
3 20.57 25.02 31.14
20.02 26.13 38.36
20.02 26.U n.26
20.51 26.13 31.14
20.29 26.13 38.64
l 20.02 25.58 n.n
20.57 26 .13 30.86
20.57 25.30 38. 92
2 20.02 25.58 33. 92
20.85 26.13 32.80

-124-
Appendix 6: Rusinqa
Setal Lenqth in ( ~1)
Generation Repl. Dl D2 DJ
1 U.98 52.82 61. 72
41. 70 53. 10 6U7
41. 70 52.82 62.40
2 41.iQ 52.32 61.7i
41. 70 53.10 62 .21
41.70 52.82 62.40
41. 98 5J.10 63.00
2 41 . 70 53.10 62.27
41. 70 Sl.82 6J.40
41.98 52.32 61.72
41.98 53.10 62. 27
H.70 5U2 62.40
H.70 53.10 61.72
41. 70 52.82 62 . 27
H. 70 52.82 62 ; l7
. · . .> ...

-125-
.\ppendix 7.
Location Repl. LB12 L5l3 LBH LB45 LB56 iBl iB3 i84 iBS ~B6
Susia 1 l9 .00 4.50 1.50 1. 00 1.00 7.00 3.30 uo 1. 00 0.50
J0.00 5.00 1.00 o.eo 0.90 6. so 3.50 1.00 a.so 1.00
29. 50 4.00 1.00 0.70 1.00 6.00 3.50 o.ao 1. 00 0.60
~1bu 28.50 5.00 1.60 1. 00 0.80 7.50 J.50 uo 0.60 0.45
28. 50 5.00 1.00 l.00 0.70 7.00 uo 0.30 0.50 il. 80
28.00 5.50 1.00 1.00 0.80 7.50 ).50 1.00 0.60 0.80
Ishiara 1 19.00 5.00 l.30 0.80 1.00 . 7. 50 uo· 1.50 1. 00 0.50
l 18. 00 5.50 1.50 0.90 1.00 7.20 uo UC 0.60 0.50
l8. 50 5.00 1.50 1.00 1.00 7.00 4.00 1.00 1. 00 0.50
Kol.bas a 27.00 5.00 l.00 1. 00 1.00 0.80 3.50 uo 1. 00 0.50
29. 50 6.00 1.80 1. 00 1.00 7. 50 ).00 1.00 1. 00 0.80
29.00 5.00 uo 1.00 LOO 0.80 ).00 1.00 l. OQ 1.80
!airobi J6.00 6.00 }.00 1.00 0.80 r.5o 3.50 1.00 0.80 0.60
25.50 5.50 LOO 1.00 o.ao 7.30 3.00 uo o.ao 0.90
15.00 5.50 2.00 1. lO 1.00 uo l.00 1.00 1. 00 0.80
Rusi11ga 28.00 6.00 2.00 1.00 1.00 7. 00 4.00 0.80 1J. 75 O.iO
26.00 5.50 uo 0.90 1.00 8.00 }.00 uo .). so 0.90
26 .00 5.50 1.00 1. 00 0.30 uo 3.50 1.00 0.80 iJ. 90

-126-
Appendix S.
Location Repl. LBU L823 LBH LB45 iB2 iBJ VB4 iB5
Busia 10.50 6.00 2.00 1.00 L20 ).00 3.00 J. 00
11.50 5.00 uo 1. 20 L50 uo J.50 1.50
10.50 4.50 2. 50 1.20 2. 50 3.00 2.50 6.30
Babu lUO 5.50 1.80 2. 00 ). 00 ).00 uo 2.50
lUO 4.50 1.30 !. 50 ). 20 uo 3.00 LJO
ll.00 uo l.50 1.20 LOO 3.00 uo 3.00
Ishiara 11.50 ).00 2.00 1. 80 2.50 1.50 2. 50 1.50
11.00 ).00 l.00 1. 60 LOO 2.00 uo 1.50
11.00 3.50 2.00 1.80 3.00 3.00 2.50 3. 00
!!oibasa lUO 4.00 2.00 1.80 LOO uo 3.00 J. 00
2 11.JO ).00 2.00 1.50 2.00 uo uo 3.00
11.00 3.50 2.00 1.80 2.:0 3.CO 2.50 3.00
hirobi 10.ao 4.00 2.50 1.60 2.00 2.00 1.50 2. 50
11.00 3.50 2.00 1.40 2.00 1.80 2.00 2.50
10.90 4.50 l.00 l.80 2.50 2.50 uo i.50
Rusinga 10.90 5.00 4.50 1.50 l.50 2.00 2.00 1. 5•)
10.00 3.80 4.00 1.60 1.00 uo 2. 00 3.50
l:.ao uo 4.00 1.50 2. 00 1.00 3.00 3. a D

-127-
Appendix 9.
Location Repl. LB1J m1 ~814 iB2 iB3 iB4
ausia 4.00 6.00 31.00 3.50 uo 4.50
6.00 6. 00 l0.50 LOO LSO 4.00
3. 00 4.50 35.00 4.00 3.00 s.ao
&J.bu 3.00 6.00 34. 00 3.00 uo l.00
2.50 5.50 32.50 5.00 uo uo
3.50 6.50 35.00 4.50 4.00 4.00
Ishiara 2. 20 6.50 34. 50 3.50 3.00 3.00
2 uo 6.00 33.00 3.50 LOO LOO
2.50 5. 50 37. 00 4.50 4.00 4.50
1{01basa LOO 6.00 35.00 3.00 2.50 J.00
3.50 5.50 34.00 3.50 uo 3.50
3.00 5.50 36.00 4.00 LOO 3.50
hirobi 3.00 6.00 J0.00 3.00 2.00 3.00
4.00 uo JJ.50 uo 1.50 3.00
uo 6.00 35.00 3.00 4.00 J.00
Rusinga 5.00 4.50 35 .00 J.00 l.00 LOO
6.00 6.00 35.50 uo uo 3.00
uo 6.00 32.00 uo uo J.50

-128-
Appendix 10 : Relative time (RT) and % area of peaks from Cassava Mites (CGM)
LOCATION REPL
NAIROBI
2
3
RELATIVE TIME (RT)
11. 0800
12. 6140
12.9010
15.8560
18.1950
21.0450
11.1000
12.6430
12.9400
15.9200
18.2010
21. 0550
11. 0680
12.5740
12.9020
15. 9220
18.2050
21. 0470
AREA
16664
5445
29303
47670
4280
3132
11494
48538
33790
U160
4943
3368
19498
5036
2215
6392
1303
2739
~ AREA
11. 3900
37 . 2000
20.0280
3.2580
2. 9254
2.1400
9.6820
40.8900
28.4600
3.4600
4.1600
2.8300
10.3500
50 . 3600
22.1540
0. 6392
1.3000
2. 7300

-129-
Appendix 11: Relative ti1e !RT) and area of peaks fro1 Cassava Kites (CGM}
LOC!'?IOI RKPL i&LATI7K ARKA TI!IE (RT}
MOMBASA 1 11.1020 10,656.00
U.6500 32.45
12.9000 79.29
15 .9400 18 . i5
18 . 9500 6,482.00
21.0500 40 . 32
11.0940 9,888 .00
11. 5920 79,m.oo
12.9170 45,582.00
15. 8940 8 1 881.00
18 .1980 11,557.00
n.o5oo 8,007.00
3 11.0890 16,593.00
ll.6180 64, 734.00
ll.6800 33,477 .00
12.mo 57 ,m.oo
18.nao 5,m.oo
U.0800 1,m.00
15.4570
47.0700
11.5000
l. 7200
9.4000
5.8500
5.0740
40.8000
23.3900
4. 5500
5.9300
4.1000
S.0200
31.1900
16.1800
27. 6800
l.4700
1.0800

-130-
Appendix l2: Relative ti1e (RT) and ' area of peaks fro1 Red Spider Kites
LOCATION REPL RETENTION AREA t AREA TillE (RT)
RSI! 9. 8030 2,909.00 0.8500
1l.0590 l6, 148.00 4.7500
12.5760 1,832.00 53 . 8700
l2.8620 94, 851. 00 27.8800
l4.7530 6,463.00 1. 8900
21.0450 6,479.00 l.9000
2 9.8160 l,318.00 1. 0700
ll. llOO 6,376.00 5.1700
12.6280 51,642.00 41. 9000
12 . 9300 32,046 . 00 26.0000
14. 7990 2,160.00 l.7500
l5.9l60 2, 135.00 1.7300
3 1l. 0990 113, 911. 00 4.0600
12.6380 39 ,993.00 11.7000
l2 . 9180 41, 381. 00 l2.l000
15.8750 21,5H.OO 6.3000
16.6330 . 9, 580 . 00 2. 8000
17 . 3880 15,694.00 4. 59


![[ITIL SYSTEM METHODOL OGY ]](https://static.fdocuments.us/doc/165x107/624cd347964d7328d919e9f8/itil-system-methodol-ogy-.jpg)