Riverbank Filtration Conference - National Water Research Institute
233
R iverbank F iltration Conference The National W ater Research I nstitute Presents 2 RBF September 16- 19 , 2003 Hilton Cincinnati Netherlands Plaza ✦ Cincinnati, Ohio USA T he S econd I nternational Riverbank Filtration : The Future Is NOW! PROGRAM & ABSTRACTS Edited by: GINA MELIN, National Water Research Institute
Transcript of Riverbank Filtration Conference - National Water Research Institute

Riverbank Filtration Conference
The National Water Research Institute Presents2RBF
September 16-19, 2003
Hilton Cincinnati Netherlands Plaza � Cincinnati, Ohio USA
The Second International
Riverbank Filtration:
The Future Is NOW!
PROGRAM & ABSTRACTS
Edited by:
GINA MELIN, National Water Research Institute

Riverbank Filtration Conference
The National Water Research Institute Presents2RBF
September 16-19, 2003Hilton Cincinnati Netherlands Plaza � Cincinnati, Ohio USA
The Second International
Riverbank Filtration:
The Future Is NOW!
PROGRAM & ABSTRACTS
Edited by:
GINA MELIN, National Water Research Institute

Published by the
NATIONAL WATER RESEARCH INSTITUTE
NWRI -2003-10
10500 Ellis Avenue � P.O. Box 20865
Fountain Valley, California 92728-0865
(714) 378-3278 � Fax: (714) 378-3375
www.NWRI-USA.org

i
Conference Planning Committee
Chair: CHITTARANJAN RAY, Ph.D, P.E., University of Hawaii at Mañoa
Conference Coordinator: GINA MELIN, National Water Research Institute
Conference Sponsors
EDWARD J. BOUWER, Ph.D.,The Johns Hopkins University
PAUL ECKERT, Ph.D.,Stadtwerke Düsseldorf
WILLIAM D. GOLLNITZ,Greater Cincinnati Water Works
THOMAS GRISCHEK, Ph.D.,University of Applied SciencesDresden
DAVID L. HAAS, P.E.,Jordan, Jones & Goulding
THOMAS HEBERER, Ph.D.,Technical University of Berlin
STEPHEN HUBBS, P.E.,Louisville Water Company
HENRY C. HUNT, CPG,Collector Wells International, Inc.
RUDOLF IRMSCHER, Ph.D.,Stadtwerke Düsseldorf AG
RONALD B. LINSKY,National Water Research Institute
JÜRGEN SCHUBERT,Stadtwerke Düsseldorf AG
RODNEY A. SHEETS,United States Geological Survey
THOMAS SPETH, Ph.D., P.E.,United StatesEnvironmental Protection Agency
� Environmental & Water Resources Institute of the American Society of Civil Engineers
� Greater Cincinnati Water Works
� International Association of Waterworks in the Rhine Catchment Area
� Jordan, Jones & Goulding
� Louisville Water Company
� Stadtwerke Düsseldorf AG
� United States Environmental Protection Agency
� United States Geological Survey
in collaboration with
� International Association of Hydrogeologists Commissionon Management of Aquifer Recharge

ii

iii
Foreword
In 1999, the National Water Research Institute (NWRI) invited American and European
experts to the first International Riverbank Filtration Conference, held in Louisville,
Kentucky, to discuss and promote riverbank filtration, a low-cost, relatively unknown water
treatment technology in the United States. The result of this conference was Riverbank
Filtration: Improving Source-Water Quality, a 365-page book written by over 30 experts and
jointly published by NWRI and Kluwer Academic Publishers in 2002.
The editors of Riverbank Filtration — namely, Chittaranjan Ray, Gina Melin, and Ronald
Linsky — saw a need to expand on the topics raised in the book, specifically because the
United States Environmental Protection Agency is developing the proposed Long Term 2
Enhanced Surface Water Treatment Rule, which applies to public water-supply systems that
use either surface water or groundwater under the direct influence of surface water as their
raw-water source. As a result, NWRI organized the Second International Riverbank
Filtration Conference, which featured over 40 presenters from around the world and was held
in Cincinnati, Ohio, in September 2003.
This conference came about through the dedication and assistance of numerous individuals
and organizations worldwide. NWRI gratefully acknowledges the efforts of all those involved
with planning, organizing, and sponsoring the conference, especially the 15-member
Conference Planning Committee. NWRI also extends special thanks to the conference
speakers, moderators, and panelists, whose expertise provided invaluable insight into the
status and needs of riverbank-filtration technology. Finally, NWRI would specifically like to
thank the Greater Cincinnati Water Works and Jordan, Jones & Goulding for providing
countless hours and manpower towards organizing this conference.
The extended abstracts provided at the conference were the contributions of conference
presenters. Abstracts were edited only when obvious errors were detected or when printing
requirements necessitated action. The opinions expressed within the abstracts are those of
individual authors and do not necessarily reflect those of the sponsors.
NWRI would like to extend sincere thanks to Gina Melin, Editor and Conference
Coordinator, and Tim Hogan, Graphics Designer, for their efforts in bringing the abstracts to
press and ensuring that the quality of each and every abstract reached its fullest potential.
Ronald B. Linsky
Executive Director
National Water Research Institute

iv

Conference Schedule & Abstracts Contents
Wednesday, September 17, 2003All sessions will take place in the Continental Room
7:00 am Registration Mezzanine Level
7:00 am Speaker Breakfast Rosewood Room
8:00 am Welcome Continental RoomRonald B. Linsky, National Water Research Institute, California
8:15 am Keynote AddressRiverbank Filtration: The American Experience . . . . . . . . . . . . . 1Edward J. Bouwer, Ph.D., The Johns Hopkins University, Maryland
8:45 am Session 1: CostsModerated by William D. Gollnitz, Greater Cincinnati Water Works, Ohio
The Costs and Benefits of Riverbank-Filtration Systems . . . . . . . . . . . . . . 3Stephen A. Hubbs, P.E., Louisville Water Company, Kentucky
9:15 am Session 2: OperationsModerated by Chittaranjan Ray, Ph.D., P.E.,
University of Hawaii at Mañoa, Hawaii
Bridging Research and Practical Design Applications . . . . . . . . . . . . . . . . . 7David L. Haas, P.E., Jordan, Jones & Goulding, Inc., Georgia
Construction and Maintenance of Wells for Riverbank Filtration . . . . . . . 17Henry C. Hunt, CPG, Collector Wells International, Inc., Ohio
Aquifer Storage and Recharge Pretreatment:Synergies of Bank Filtration, Ozonation, and Ultraviolet Disinfection . . . 23Robert S. Cushing, Ph.D., Carollo Engineers, Florida
Evolution from a Conventional Well Fieldto a Riverbank-Filtration System . . . . . . . . . . . . . . . . . . . . . . . . . . . . . . . . . 29John D. North, Cedar Rapids Water Department, Iowa
11:15 am Session 3A: Hydraulic AspectsModerated by Rudolf Irmscher, Ph.D., Stadtwerke Düsseldorf, Germany
Groundwater Flow and Water-Quality – A Flowpath Studyin the Seminole Well Field, Cedar Rapids, Iowa . . . . . . . . . . . . . . . . . . . . . 35Douglas J. Schnoebelen, Ph.D., United States Geological Survey, Iowa
The Use of Aquifer Testing and Groundwater Modelingto Evaluate Changes in Aquifer/River Hydraulics atthe Louisville Water Company . . . . . . . . . . . . . . . . . . . . . . . . . . . . . . . . . . . 39David C. Schafer, David Schafer & Associates, Minnesota
12:15 pm Lunch Rosewood Room
v

1:30 pm Session 3B: Hydraulic AspectsModerated by Rudolf Irmscher, Ph.D., Stadtwerke Düsseldorf, Germany
Plugging in Riverbank-Filtration Systems:Evaluating Yield-Limiting Factors . . . . . . . . . . . . . . . . . . . . . . . . . . . . . . . . 43Stephen A. Hubbs, P.E., Louisville Water Company, Kentucky
Application of Different Tracers to Evaluate the Flow Regimeat Riverbank-Filtration Sites in Berlin, Germany . . . . . . . . . . . . . . . . . . . . 49Dr. Gudrun Massman, Free University of Berlin, Germany
2:30 pm Session 4: SitingModerated by Henry C. Hunt, CPG,
Collector Wells International, Inc., Ohio
Siting and Testing Procedures for Riverbank-Filtration Systems . . . . . . . . 57Samuel M. Stowe, P.G., CPG, International Water Consultants, Inc., Ohio
Water Quality Management for Existing Riverbank Filtration Sitesalong the Elbe River in Germany . . . . . . . . . . . . . . . . . . . . . . . . . . . . . . . . . 63Prof. Dr.-Ing. Thomas Grischek, University of Applied Sciences Dresden, Germany
3:30 pm Session 5: DynamicsModerated by Prof. Dr.-Ing. Thomas Grischek,
University of Applied Sciences Dresden, Germany
Using Models to Predict Filtrate Quality at Riverbank-Filtration Sites –What Is the Adequate Level of Modeling?. . . . . . . . . . . . . . . . . . . . . . . . . . 69Chittaranjan Ray, Ph.D., P.E., University of Hawaii at Mañoa, Hawaii
The 100-Year Flood of the Elbe River in 2002and Its Effects on Riverbank-Filtration Sites . . . . . . . . . . . . . . . . . . . . . . . 81Dipl.-Ing. Matthias Krueger, Fernwasserversorgung Elbaue-Ostharz GmbH, Germany
Temporal Changes of Natural Attenuation ProcessesDuring Bank Filtration . . . . . . . . . . . . . . . . . . . . . . . . . . . . . . . . . . . . . . . . . 87Paul Eckert, Ph.D., Stadtwerke Düsseldorf AG, Germany
An Update of the City of Guelph’s Response to Regulation 459/00:Effective Natural In Situ Filtration of Several GroundwaterUnder the Direct Influence of Surface-Water Supplies . . . . . . . . . . . . . . . 91Dennis E. Mutti, P.E., Associated Engineering Limited, Canada
On Bank Filtration and Reactive Transport Modeling . . . . . . . . . . . . . . . . 93Dr.-Ing. Ekkehard Holzbecher, Humboldt University, Germany
6:00 pm Reception Pavilion Foyer
6:30 pm Dinner Pavilion BallroomDinner Speaker:Hydraulic Sensitivities and Reduction Potential Correlatedwith the Distance Between the Riverbank and Production Well . . . . . . . . 99Bernhard Wett, Ph.D., University of Innsbruck, Austria
vi

Thursday, September 18, 2003All sessions will take place in the Continental Room
7:00 am Speaker Breakfast Rosewood Room
8:00 am Keynote Address
Riverbank Filtration: The European Experience . . . . . . . . . . . . . . 105
Prof. Dr.-Ing. Martin Jekel, Technical University of Berlin, Germany
8:30 am Session 6: Microorganisms
Moderated by Edward J. Bouwer, Ph.D., The Johns Hopkins University, Maryland
Using Microscopic Particulate Analysis for Riverbank Filtration . . . . . . . 111
Jennifer L. Clancy, Ph.D., Clancy Environmental Consultants, Inc., Vermont
Transport and Removal of Cryptosporidium Oocysts
in Subsurface Porous Media. . . . . . . . . . . . . . . . . . . . . . . . . . . . . . . . . . . . . . 115
Menachem Elimelech, Ph.D., Yale University, Connecticut
Laboratory and Field Strategies for Assessing Pathogen Removal
by Riverbank Filtration . . . . . . . . . . . . . . . . . . . . . . . . . . . . . . . . . . . . . . . . 117
Monica B. Emelko, Ph.D., University of Waterloo, Canada
Fate of Disinfection Byproduct Precursors and Microorganisms
During Riverbank Filtration. . . . . . . . . . . . . . . . . . . . . . . . . . . . . . . . . . . . . 123
W. Joshua Weiss, The Johns Hopkins University, Maryland
Assessment of the Microbial Removal Capabilities
of Riverbank Filtration . . . . . . . . . . . . . . . . . . . . . . . . . . . . . . . . . . . . . . . . . 129
Vasiliki Partinoudi, University of New Hampshire, New Hampshire
11:00 am Session 7: Organics Removal
Moderated by Richard J. Miltner, P.E.,
United States Environmental Protection Agency, Ohio
Riverbank Filtration: A Very Efficient Treatment Process
for the Removal of Organic Contaminants?. . . . . . . . . . . . . . . . . . . . . . . . . 137
Dr.-Ing. Heinz-Jürgen Brauch, DVGW-Technologiezentrum Wasser, Germany
Organics Removal by Riverbank Filtration
at the Greater Cincinnati Water Works Site . . . . . . . . . . . . . . . . . . . . . . . . 143
Jeffrey Vogt, Greater Cincinnati Water Works, Ohio
12:00 pm Lunch Pavilion Ballroom
Lunch Speaker:
Potential Uses of Riverbank Filtration
for Regulatory Compliance. . . . . . . . . . . . . . . . . . . . . . . . . . . . . . . . . . . . . . 149
Stig Regli, United States Environmental Protection Agency, Washington, D.C.
vii

1:15 pm Session 8: Emerging Contaminants RemovalModerated by Monica B. Emelko, Ph.D., University of Waterloo, Canada
Transport and Attenuation of Pharmaceutical ResiduesDuring Bank Filtration . . . . . . . . . . . . . . . . . . . . . . . . . . . . . . . . . . . . . . . . . 151Andy Mechlinski, Technical University of Berlin, Germany
Attenuation of Pharmaceuticals During Riverbank Filtration . . . . . . . . . . 155Traugott Scheytt, Ph.D., Technical University of Berlin, Germany
The Fate of Bulk Organics and Emerging ContaminantsDuring Soil-Aquifer Treatment . . . . . . . . . . . . . . . . . . . . . . . . . . . . . . . . . . 159Dr. Jörg E. Drewes, Colorado School of Mines, Colorado
Ethylenediaminetetraacetic Acid Occurrence and RemovalThrough Bank Filtration in the Platte River, Nebraska . . . . . . . . . . . . . . . 163Jason R. Vogel, Ph.D., United States Geological Survey, Nebraska
3:15 pm Session 9: Public Policy and RegulatoryModerated by Richard J. Miltner, P.E.,
United States Environmental Protection Agency, Ohio
Riverbank Filtration as a Regional Supply Optionfor the United States . . . . . . . . . . . . . . . . . . . . . . . . . . . . . . . . . . . . . . . . . . . 167Leo Gentile, P.G., CPG, Jordan, Jones & Goulding, Inc., Georgia
Application of the Long Term 2 Enhanced Surface WaterTreatment Rule Microbial Toolbox at Existing Water Plants . . . . . . . . . . . 173Richard A. Brown, Environmental Engineering and Technology, Inc., Virginia
Draft Protocol for the Demonstration of Effective Riverbank Filtration . . . . 175William D. Gollnitz, Greater Cincinnati Water Works, Ohio
Source Water Protection and Riverbank Filtrationin the Dyje River Basin . . . . . . . . . . . . . . . . . . . . . . . . . . . . . . . . . . . . . . . . 181Prof.-Dr. Petr Hlavinek, Brno University of Technology, Czech Republic
5:15 pm Session 10: Research Needs Panel DiscussionModerated by Ronald B. Linsky, National Water Research Institute, CaliforniaPanelists:
Kellogg J. Schwab, Ph.D.,Johns Hopkins Bloomberg School of Public Health, Maryland
Peter Fox, Ph.D., Arizona State University, ArizonaMonica B. Emelko, Ph.D., University of Waterloo, CanadaProf. Dr.-Ing. Thomas Grischek,
University of Applied Sciences Dresden, GermanyProf. Vladimir Rojanschi, Ecological University Bucharest, Romania
6:30 pm Reception Rosewood Room
viii

Friday, September 19, 2003
7:00 am Speaker Breakfast Rosewood Room
8:00 am Session 11: Case Studies “Lessons Learned”Moderated by Stephen Hubbs, P.E., Louisville Water Company, Kentucky
Greater Cincinnati Water WorksFlowpath Study Field Design: Methodology and Evaluation . . . . . . . . . . . . 187Bruce Whitteberry, P.G., Greater Cincinnati Water Works, Ohio
The Hungarian Experience with Riverbank Filtration . . . . . . . . . . . . . . . . 193Ferenc Laszlo, Ph.D.,
Institute for Water Pollution Control, Water Resources Research Centre, Hungary
Nitrate Pollution of a Water Resource –15N and 180 Study of Infiltrated Surface Water . . . . . . . . . . . . . . . . . . . . . 197Frantisek Buzek, Ph.D., Czech Geological Survey, Czech Republic
Microbial Growth in Artificially Recharged Groundwater:Experiences from a 4-Year Project . . . . . . . . . . . . . . . . . . . . . . . . . . . . . . . . . 203Ilkka T. Miettinen, Ph.D., National Public Health Institute, Finland
Evaluation of the Existing Performance of Infiltration Galleriesin the Alluvial Deposits of the Parapeti River . . . . . . . . . . . . . . . . . . . . . . 207Dip.-Eng. Alvaro Camacho Garnica,
Bolivian Association of Sanitary Engineers, Bolivia
Sensitivity and Implication of Microscopic Particulate Analysis –A Collector Well Owner’s Perspective. . . . . . . . . . . . . . . . . . . . . . . . . . . . . 215Barry C. Beyeler, City of Boardman, Oregon
Combined Use of Surface Water and Groundwaterfor Drinking-Water Production in the Barcelona Metropolitan Area. . . . . 217Jordi Martín-Alonso, Barcelona’s Water Company, Spain
11:30 am Conference Wrap-UpEdward J. Bouwer, Ph.D., Johns Hopkins University, MarylandMartin Jekel, Ph.D., Technical University of Berlin, Germany
ix

x

xi
Acronyms
ADA ß-alaninediacetic acid
AOC Assimilable organic carbon
AOX Adsorbable organic halogen
ASR Aquifer Storage and Recovery
DBP Disinfection byproduct
DOC Dissolved organic carbon
DTPA Diethylenetrinitrilopenataacetic acid
EDTA Ethylenediaminetetraacetic acid
GAC Granular activated carbon
GC Gas chromatography
GWUDI Groundwater under the direct influence of surface water
HAA Haloacetic acid
HPI Hydrophilic carbon
HPO-A Hydrophobic acids
LT2ESWTR Long Term 2 Enhanced Surface Water Treatment Rule
MAP Microbially available phosphorous
MS Mass spectrometry
NASRI Natural and Artificial Systems for Recharge and Infiltration
NTA Nitrilotriacetic acid
NOM Natural organic matter
NPEC Nonylphenolpolyethoxycarboxylate
O&M Operation and maintenance
PDTA 1.3-propylenedinitrilotetraacetic acid
PhAC Pharmaceutically active compound
PHREEQC pH redox equilibrium equation
RBF Riverbank filtration
THM Trihalomethane
TOC Total organic carbon
USEPA United States Environmental Protection Agency
USGS United States Geological Survey
UV Ultraviolet
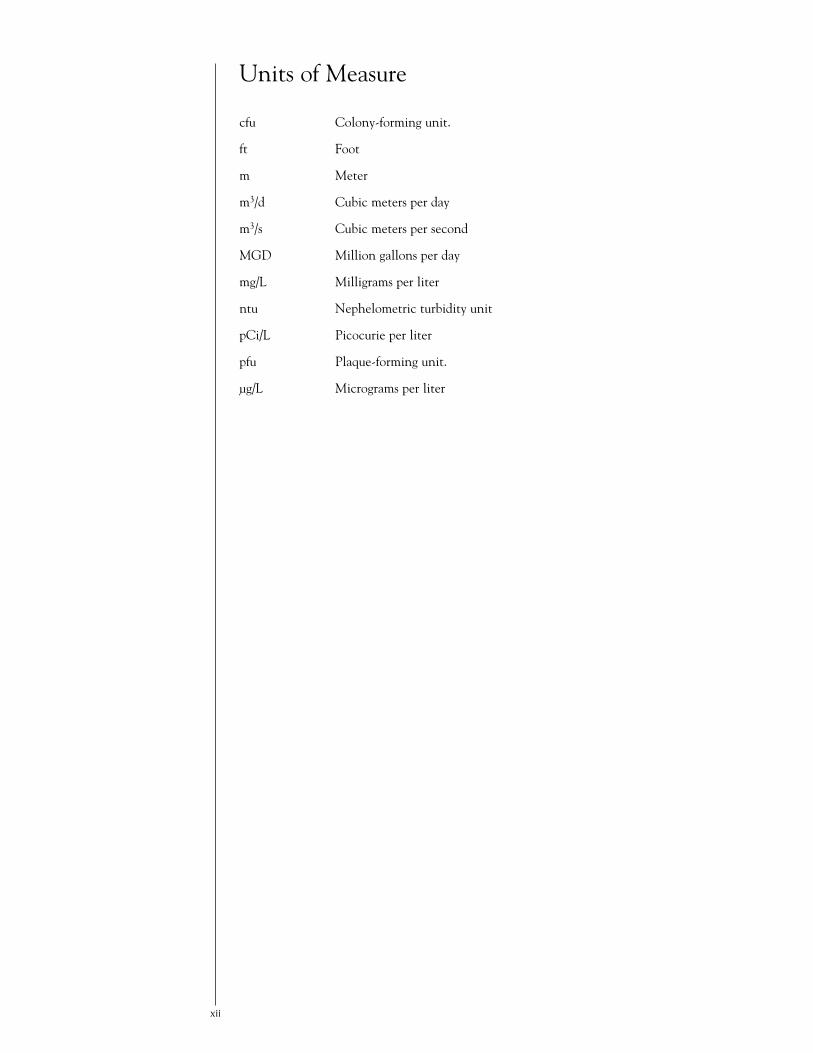
cfu Colony-forming unit.
ft Foot
m Meter
m3/d Cubic meters per day
m3/s Cubic meters per second
MGD Million gallons per day
mg/L Milligrams per liter
ntu Nephelometric turbidity unit
pCi/L Picocurie per liter
pfu Plaque-forming unit.
µg/L Micrograms per liter
xii
Units of Measure
ConferenceAbstracts

Keynote Presentation
Riverbank Filtration: The American Experience
Edward J. Bouwer, Ph.D.The Johns Hopkins UniversityBaltimore, Maryland
Riverbank filtration (RBF) is a process during which surface water is subjected to subsurface flowprior to extraction from vertical or horizontal wells. Most RBF systems are located alongriverbanks. Alternative systems can involve lakes and infiltration ponds. The objective of thiskeynote address is to provide an overview of the water-quality improvements possible with RBF,the motivation for RBF and its promise in the United States, and some of the remainingchallenges for the reliable implementation of this technology.
During infiltration and soil passage, surface water is subjected to a combination of physical,chemical, and biological processes, such as filtration, dilution, sorption, and biodegradation, thatcan significantly improve raw-water quality. Transport through alluvial aquifers is associated witha number of water-quality benefits, including the removal of microbes, pesticides, total organiccarbon (TOC), dissolved organic carbon (DOC), nitrate, and other contaminants. In comparisonto most groundwater sources, alluvial aquifers that are hydraulically connected to rivers aretypically easier to exploit (shallow) and more highly productive for drinking-water supplies. Asreflected by several recently published reviews (Journal of Hydrology, 2002; Ray et al., 2002a;Tufenkji et al., 2002; and Ray et al., 2002b), RBF is receiving increased attention, especially in theUnited States. One motivation for the increased applications of RBF is the need for drinking-waterutilities to meet increasingly stringent drinking-water regulations, especially with regard to:
• The provision of multiple barriers for protection against microbial pathogens.
• Tighter regulations for disinfection byproducts (DBPs), such as trihalomethanes (THMs)and haloacetic acids (HAAs).
A second motivation is the ability of RBF to provide continuous treatment and to buffer againstaccidental spills and terrorist events.
Since RBF is a natural treatment system and has a long history of use in Europe, it is sometimesviewed as a simple process. This simplicity is appealing; however, the geochemical, biological, andhydrologic factors that control the removal of dissolved and particulate contaminants during RBFare complex.We have learned from experience with groundwater remediation that the effectivenessof subsurface processes is inherently site-specific. Many of the papers presented at this conferencewill address the factors influencing water-quality improvements possible with RBF systems.
One question of interest to users can be stated as, “Is RBF with post-disinfection an acceptable, oreven preferable, alternative to conventional drinking-water treatment?” In my laboratory, thereduction of DBP precursors upon RBF was compared with that obtained using a bench-scale
1
Correspondence should be addressed to:
Edward J. Bouwer, Ph.D.Professor, Department of Geography and Environmental EngineeringThe Johns Hopkins University3400 N. Charles Street • Baltimore, Maryland 21218 USAPhone: (410) 516-7437 • Fax: (410) 516-8996 • Email: [email protected]

conventional treatment train on corresponding river waters. The river waters were subjected to atreatment train consisting of coagulation, flocculation, sedimentation, filtration, and ozonation.This research showed that RBF performs as well as or better than a bench-scale conventionaltreatment train (based on coagulation chemistry for optimum turbidity removal) with respect tothe removal of natural organic matter (NOM), particularly precursor material for THM4 andHAA6 concentrations. Consequently, a potential major benefit of RBF is as a pretreatment stepfor controlling DBPs. A shift from chlorinated to brominated DBPs occurred during RBF. Sincebrominated DBPs tend to have greater toxicity than chlorinated DBPs, the shift from chlorinatedto brominated DBP species caused reductions in the calculated risk for bank-filtered waters in thisstudy to be lower than corresponding reductions in THM concentrations. Nonetheless, the datademonstrate the ability of RBF to reduce theoretical risk due to THMs formed upon chlorinationin all cases and with substantially better performance than the bench-scale conventionaltreatment train.
A remaining challenge for the reliable implementation of RBF as a technology is the dynamicnature of these complex hydrologic systems. Transient flows in rivers influence flow and removalprocesses during ground passage, which can affect the quality of bank-filtered waters. A moredetailed understanding of the fundamental processes that govern contaminant transport in RBFsystems will lead to the reliable design, implementation, and operation of RBF systems.
REFERENCES
Journal of Hydrology (2002). Special Issue on Bank Filtration, 266(3-4): 139-284.
Ray, C., T. Grischek, J. Schubert, J.Z. Wang, and T.F. Speth (2002a). “A perspective of riverbank filtration.”Jour. AWWA, 94(4): 149-160.
Ray, C., G. Melin, and R.B. Linsky, editors (2002b). Riverbank Filtration: Improving Source Water Quality,Kluwer Academic Publishers, Dordrecht.
Tufenkji, N., J.N. Ryan, and M. Elimelech (2002). “The promise of bank filtration.” Environmental Scienceand Technology, 36(21): 423A-428A.
ED BOUWER has taught environmental engineering courses at The Johns HopkinsUniversity since 1985. His research interests include factors that influence the biotransfor-mation of organic contaminants, bioremediation for the control of organic contaminantsat waste sites, biofilm kinetics, the interaction between biotic and abiotic processes,groundwater contamination, biological processes design in wastewater, industrial anddrinking-water treatment, and the transport and fate of microorganisms in porous media.At present, he is an editor for or is on the editorial board of several journals, including the
Journal of Contaminant Hydrology, Biodegradation, and Environmental Engineering Sciences. Bouwer received aB.S. in Civil Engineering from Arizona State University, and both an M.S. and Ph.D. in EnvironmentalEngineering and Science from Stanford University.
2

Session 1: Costs
The Costs and Benefits of Riverbank-Filtration Systems
Stephen A. Hubbs, P.E.Louisville Water CompanyLouisville, Kentucky
Henry C. Hunt, CPGCollector Wells International, Inc.Columbus, Ohio
Jürgen SchubertStadtwerke DüsseldorfDüsseldorf, Germany
The Benefits of Riverbank Filtration
The history of RBF in modern times is connected to the experience of disease outbreaks in Europein the 1890s, with specific reference to the cholera epidemic in Hamburg, Germany, in 1892. Thepreference for groundwater, RBF, and artificial recharge to surface water stems from thisexperience, noting much more wholesome water from these sources than from surface water.
A much earlier reference to RBF (albeit far less scientific) is found in the Bible:
The fish that were in the Nile died, and the Nile became foul, so that the Egyptianscould not drink water from the Nile … So all the Egyptians dug around the Nile forwater to drink, for they could not drink of the water of the Nile. (Exodus 7, 21-24)
Thus, it appears that the benefits of RBF are anything but new!
The benefits of RBF have been cataloged in recent publications to include:
• Particle removal.
• Pathogen removal.
• Organic and inorganic chemical removal.
• Peak smoothing in spills.
• Reduction in DBP formation.
• Production of a more biologically stable water.
When faced with the decision to choose an advanced treatment technology for its two treatmentplants, the Louisville Water Company in Louisville, Kentucky, sought to compare these benefitsagainst the benefits of in-plant treatment techniques from both a treatment efficiency perspectiveand cost-based perspective; however, a comprehensive, quantitativemeasure was difficult to develop.
3
Correspondence should be addressed to:
Stephen A. Hubbs, P.E.Vice President, New TechnologyLouisville Water Company550 South Third Street • Louisville, Kentucky 40202 USAPhone: (502) 569-3675 • Fax: (502) 569-0813 • Email: [email protected]

The Louisville Water Company also wanted to involve the public in the overall decision process,so a simple communication tool was desired that was capable of ranking various treatmenttechnologies with regards to the risks they were designed to reduce. Treatment effectiveness wassimply identified by a series of “+” signs, with one “+” being effective and two “++” being highlyeffective. A negative assignment (“–”) indicated that the treatment process had an overallnegative impact on the risk of a selected component, and a “0” indicated no impact.
The risks evaluated in the analysis included: pathogens, such as Giardia and Cryptosporidium;DBPs; tastes and odor (2-methylisoborneol and Geosmin); synthetic organic chemicals likeatrazine and Aloclor; and river-borne spills of industrial chemicals. Operational benefits included:reduced regrowth in the distribution system, reduced main breaks from avoidance of extremelycold water, avoidance of zebra mussels, and reliability associated with simple operation. These risksand benefits were used to compare the RBF process to other treatment technologies, includingconventional treatment, ozone, ultraviolet light (UV), granular activated carbon (GAC), biologicalactive carbon, combinations of all of these, and membranes.
This matrix was recently modified to include risks associated with the presence of radon andarsenic in groundwater. Radon has been detected in RBF water in Louisville at levels near themaximum contaminant level of 300 picocuries per liter (pCi/L). The radon level leaving thetreatment plant is below the detection limit of 50 pCi/L, with the reduction the result ofout-gassing in open treatment basins and blending with surface water. Arsenic has not beendetected in RBF water at Louisville. Radon and arsenic risk factors do not exist in Ohio Riversource water. The treatments for radon (aeration) and arsenic (flocculation with ferric) effectivelyreduce these risk factors at an increase in treatment costs.
A matrix comparing these risks and operational benefits is presented in Table 1. This analysisindicates which treatment combinations provide specific water-quality benefits. From this analysis,it was obvious that RBF was capable of matching the benefits of in-plant treatment options.
4
River + Ozone River + GAC River + GACBenefits RBF + UV and UV + UV + Membranes
Particle Removal + + + +
Microbial Removal + + + +
DBP Reduction + + + +
Taste and Odor + + + +
Spill Dampening ++ 0 ++ +
Iron/Manganese – + + 0
SOC Removal + + + +
AOC/BDOC Control + 0 + +
Nitrification Control + + + +
Temperature ++ 0 0 0
Operability + 0 0 +
Residuals 0 0 0 +
Multiple Barriers ++ ++ ++ ++
Reduced Chemicals + 0 0 +
Radon – 0 0 0
Arsenic 0 0 0 0
TOTAL 13 9 12 13
Table 1. Comparison of Risks and Operational Benefits
AOC = Assimilable organic carbon. BDOC = Biodegradable organic carbon. SOC = Synthetic organic chemical.

Cost-Evaluation of Riverbank Filtration
The capital cost of a RBF system depends on many factors, including aquifer characteristics, typeof well-screen installation (vertical or horizontal), aesthetic considerations in facility design, anddistance to the population served. The operational costs vary as a function of water quality andrequired treatment, lift required in pumping, and pump and well-screen maintenance costs. Theability of a stream to support a given well-field capacity can be calculated as the yield per unitlength of riverbank. This capacity is influenced by the composition of the riverbed, riverbedscouring characteristics, stream-water quality, and width of the river.
Large river systems situated in glacial sands and gravels (such as the Ohio, Mississippi, and Rhinerivers) can sustain yields up to 8 million gallons per day (MGD) per 1,000 feet (ft) of riverbank.Typical installations in these aquifers include 1.5-MGD vertical wells spaced on 200-ft centers, or15-MGD horizontal collector wells spaced at 2,000-ft centers.
The 20-MGD horizontal collector well system constructed in Louisville in 1999 cost $5 million.The system included:
• Seven laterals that are 200 to 240 ft in length.
• A 21-ft diameter, 100-ft deep caisson.
• A pump house and controls with one constant speed and one variable speed pump(both 10 MGD).
• Two thousand feet of 42-inch discharge piping to the plant.
The pump house was designed to include architectural features complimentary to surroundingresidential neighborhoods. This system can peak at over 20MGD in warm weather and is operatedyear-round at 17 MGD.
When this system was being considered, alternative treatment techniques for surface-water treatmentwere also evaluated. Critical treatment functions included efficiency in removing Giardia andCryptosporidium, ability to remove 2-methylisoborneol and Geosmin, and DBP reduction. Suitablealternatives were determined from the matrix and evaluated for cost. This process was repeatedtwice, by two separate consultants: once in the initial planning stages of the 20-MGD project(1995), and again just before a contract was let to design a 45-MGD expansion of the system(2002).
The surface-water treatment process selected in the final cost analysis as providing comparablebenefits to the overall benefits of RBF included: conventional treatment, ozone and biologicaltreatment in GAC-capped filters, and UV/chlorine/chloramine disinfection. Treatment costs,however, were also estimated for separate elements of this treatment scheme (as was the cost ofmembranes) for the 180-MGD treatment plant at Crescent Hill.
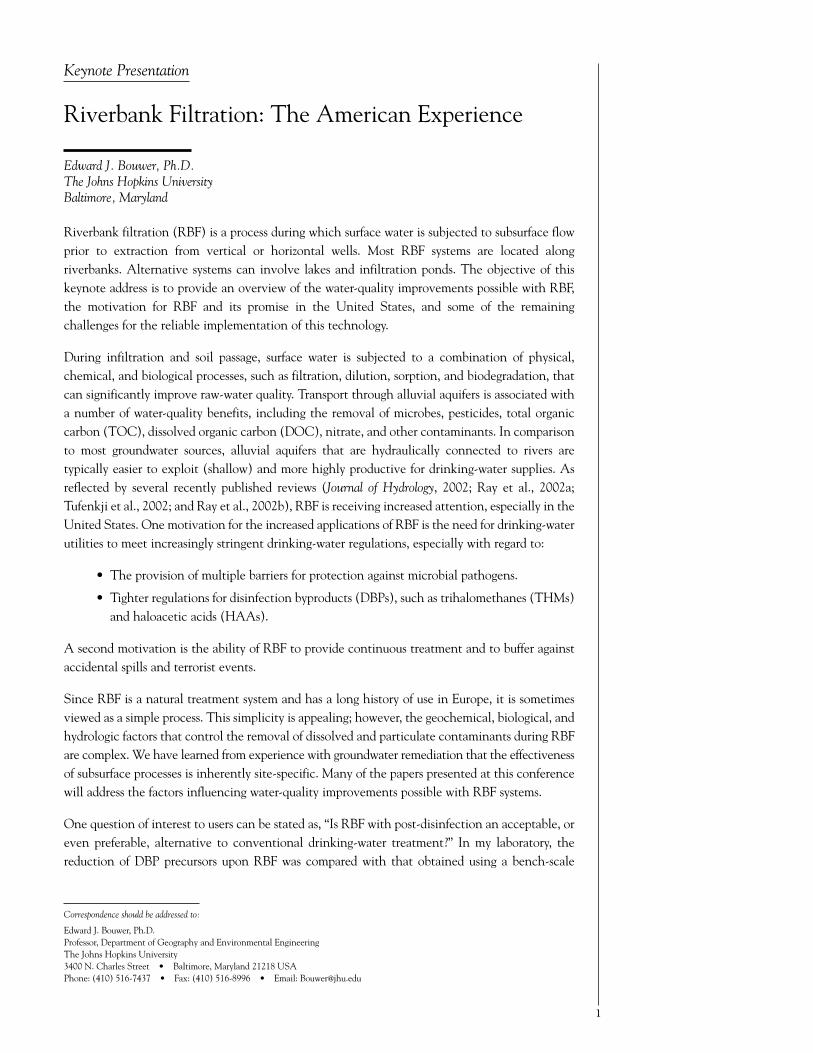
The results of this cost comparison are included in Table 2. The capital costs were amortized over20 years in this analysis, and the operation and maintenance (O&M) costs include the treatmentcosts to reduce hardness from 220 to 160 milligrams per liter (mg/L). Based on this analysis, thedecision was made to proceed with the development of RBF for the entire capacity of the 60-MGDB.E. Payne Water Treatment Plant, and to continue considering RBF for the larger 180-MGDcapacity Crescent Hill Treatment Plant.
5
Capital Costs of Alternative Well-Field Design: Hard-Rock Tunnel Collector
The difficulty of obtaining riverfront property in developed areas prompted the Louisville WaterCompany to consider alternative designs to the traditional well-field configuration. The designselected for constructing the 45-MGD addition to the existing 20-MGD RBF capacity includesthe construction of a large-diameter (10- to 12-ft) horizontal tunnel in bedrock, below the water-bearing sand and gravel aquifer. Vertical wells will be constructed at 200-ft centers, and willpenetrate the bedrock and discharge by gravity into the tunnel. A single pump station located atthe treatment plant will extract up to 45 MGD from the tunnel, connecting the 30 vertical wellsin the system. This construction technique minimizes the impact on landowners, with visibleconstruction activities limited to drilling and developing the individual wells. This design alsoallows total flow to be distributed to each well, evenly distributing riverbed plugging stresses across6,000 ft of riverbank.
The cost of this system was compared to the cost of developing a conventional well field withsubmersible pumps and a collecting header. The cost-estimate for the bedrock tunnel systemwas highlyimpacted by the assigned cost of the hard-rock tunnel. The final design included a cement-lined tunnelto protect against intermittent layers of shale encountered in the massive limestone formation.
The current estimate for this hard-rock tunnel-vertical well extraction system is $33 million for45-MGD capacity. The system involves approximately 6,000 ft of riverbank and hard-rock tunnel.The comparable conventional vertical well field has been estimated at $23 million. Current plansare to design and construct the hard-rock vertical well system, noting advantages in expandability,future connection to an additional 180-MGD system for the larger treatment plant, and generalconstructability in the developed riverfront area.
STEVE HUBBS is a Professional Engineer with 28 years of experience at the LouisvilleWater Company in Louisville, Kentucky. In the early 1980s, he began researching riverbankfiltration as an alternate source of water for the Louisville Water Company, specificallylooking at the reduction in disinfection byproduct precursors, river-borne organics, andmutagenicity in the riverbank-filtration process. His work continued in the 1990s with afocus on pathogen reduction, and his research is now being conducted on the hydraulicconnection between the riverbed and aquifer, with a focus on riverbed plugging dynamics
and their influence on sustainable yields from high-capacity riverbank-filtration systems. Hubbs received anM.S. in Environmental Engineering from the University of Louisville, and is currently enrolled in the Ph.D.program in Civil and Environmental Engineering at the University of Louisville, focusing on the hydraulicsof riverbank-filtration systems.
6
Treatment Capital Cost Annual O&M Cost Present Worth CostAlternative ($ million) ($ million) ($ million)
RBF Conventional 103 1.82 112
RBF + UV 116 2.34 130
River + Ozone UV 70 6.36 152
River + GAC + UV 114 5.46 160
River + Membranes204 4.96 251
+ GAC + UV
Table 2. Results of the Cost Comparison

Session 2: Operations
Bridging Research and Practical Design Applications
David L. Haas, P.E.Jordan, Jones & Goulding, Inc.Norcross, Georgia
Michael J. Robison, P.E.Jordan, Jones & Goulding, Inc.Norcross, Georgia
David R. Wilkes, P.E.Jordan, Jones & Goulding, Inc.Norcross, Georgia
Background
The LouisvilleWater Company operates two water filtration plants: the B.E. PayneWater TreatmentPlant (PaynePlant), whichhas a treatment capacity of 60MGD(227,000 cubicmeters per day [m3/d])and is located in eastern Jefferson County, Kentucky; and the Crescent Hill Water TreatmentPlant, which is located closer to downtown Louisville and has a treatment capacity of 180 MGD(682,000 m3/d). Both are conventional surface-water treatment plants drawing their supply fromthe Ohio River. The Payne Plant has two 60-inch (1.5-meter [m]) raw-water intake pipes locatedon plant property. The intake for the Crescent Hill Water Treatment Plant is located near theintersection of Zorn Avenue and River Road, approximately 7 miles (4.4 kilometers) downstreamfrom the Payne Plant intake.
In 1999, the Louisville Water Company started operating a horizontal collector well at itsPayne Plant. This horizontal collector well consists of a 16-ft (4.9-m) diameter caisson.The caisson was constructed down to the top of bedrock and is approximately 100-ft (30.5-m)deep. There are seven 12-inch (30.5-centimeter) collector laterals radiating out horizontally fromthe caisson. A pump station was constructed on top of the caisson above the flood plain to pumpwater to the Payne Plant for further treatment. The design capacity of this well is 15 MGD(57,000 m3/d).
Jordan, Jones & Goulding, Inc. was retained by the the Louisville Water Company to implementRBF for the remainder of the Payne Plant. This second phase of RBF will provide an additional45 MGD (171,000 m3/d) of capacity. Ultimately, the Louisville Water Company desires to extendRBF technology to the Crescent Hill Water Treatment Plant.
This paper provides a summary of issues that were faced in taking the concept of providingadditional RBF capacity for the Payne Plant through design. There were three primary areas that
7
Correspondence should be addressed to:
David L. Haas, P.E.Senior Project ManagerJordan, Jones & Goulding, Inc.6801 Governors Lake Parkway • Norcross, Georgia 30071 USAPhone: (678) 333-0242 • Fax: (678) 333-0828 • Email: [email protected]

design engineers needed to address:
• Type of RBF collection system.
• Hydrogeologic yield.
• Water quality and treatment.
Type of RBF Collection System
First, it was necessary to select the most appropriate type of RBF technology to satisfy the technicalneeds of the project economically, as well as other goals such as community acceptance of theproject. The construction of additional horizontal collector wells, similar to the existing well, wasconsidered unacceptable because 15 to 20 of these collector wells would be required to satisfy thetotal treatment capacity for both plants. The construction of this many wells, each with an above-ground pump station, would be costly, as well as aesthetically unpleasing.
Three options were considered that would use tunnels in conjunction with RBF to satisfy theneeds of the project:
• Option 1 consisted of driving a tunnel through the alluvial deposits that overlay bedrockand installing collector laterals from within the tunnel (soft-ground tunnel option). Thisdesign concept is depicted in Figure 1.
• Option 2 included installing a series of horizontal collector wells (Figure 2) that wouldbe capped at grade and connected together using a deep tunnel through the bedrock.
• Option 3 consisted of installing vertical collectors connected together using a tunnelthrough the bedrock (Figure 3).
With any of these options, the number of above-ground pump stations would be minimized,because water from horizontal or vertical collectors would be conveyed through the tunnel to asingle pump station located on plant property.
In addition to cost, factors that were considered in selecting the type of RBF collection systemincluded construction and maintenance.
Construction Considerations
The two main construction issues that were evaluated for Option 1 were the feasibility ofconstructing the tunnel in the alluvial deposits along the riverbank and the feasibility of installinglaterals safely from within the tunnel. With regard to Options 2 and 3, the main construction issueevaluated was rock quality.
To evaluate these factors, a detailed subsurface investigation was conducted that included thefollowing elements:
• Large-diameter bucket auger borings to bedrock.
• Grain-size analysis of composite samples obtained from the bucket auger borings.
• Core borings of bedrock materials.
• Examination of rock outcrops near the site.
Large-diameter bucket auger borings were used to collect representative samples of alluvium.Because alluvium contains significant amounts of coarse gravel, cobbles, and possibly boulders, the
8

large-diameter bucket auger was considered the most appropriate sample collection method.Grain-size distribution curves were developed based on sieve analyses of the bucket auger samples.
The results of the rock-core boring program indicated the presence of limestone and shale. Aparticularly good layer of limestone occurred from 130- to 157-ft (40- to 48-m) below groundsurface. Limestone beds in this unit tend to be on the order of 2- to 3-ft (0.6- to 0.9-m) thick,interbedded with 3- to 4-inch (7- to 10-centimeter) thick layers of shale. All of the limestone inthis layer has a rock quality designation in the range of 90 to 100 percent, which according toDeere and Deere (1989) is classified as “excellent.”
9
Soft Ground Soft Ground TTunnelunnel
Existing 48-Inch Raw Water Transmission Line
New 54-Inch Raw Water Transmission Line
Existing Collector Well
Pump Station
Lagoon
Lagoon
Soft-Ground Tunnel
Caisson Capped at Grade
Existing (Two) 60-Inch Diameter Water Intake Pipes
Lagoon
Lagoon
Existing B.E. Payne Water Treatment Plant
Ohio
Rive
r
Plan View 1A
Section View 1B
Bedrock
200-ft LateralsSand and Gravel
Clay
Ground SurfaceSouthern Caisson (capped at grade)
19-ft Diameter
Northern Caisson (Pump Station)
32-ft Diameter Shaft
14-ft Diameter Tunnel with 25 Laterals
15+0 10+0 5+00 0+00
Figure 1. Soft ground tunnel concept (Option 1).

Based on the results of the subsurface investigation, the construction of either type of tunnelsystem (soft ground or bedrock) was determined to be feasible.
Maintenance Considerations
One of the unique challenges of Option 1 would be the long-term maintenance of collectorlaterals. Over time, it is anticipated that the laterals would need to be cleaned to restore theiryield, as would be the case with any well screen. Several options were considered that would allowindividual laterals to be taken out of service for cleaning while the rest of the tunnel systemremained in operation. The selected option consisted of a “wet/dry” tunnel system, with waterbeing conveyed through carrier pipes in the “wet” side and O&M being performed from within
10
Ohio
Rive
r Existing 48-Inch Raw Water Transmission Line
Existing B.E. Payne Water Treatment Plant
New 54-Inch Raw Water Transmission Line
Pump Station
Collector Well
Existing Collector Well
Collector
Hard RocHard Rockk TTunnelunnelHard Rock
Lagoon
Lagoon
Lagoon
Lagoon
Existing (2) 60-Inch Diameter Water Intake Pipes
Plan View 2A
Bedrock
200-ft Diameter Laterals 11 per Collector Well
200-ft Diameter Laterals 11 per Collector Well Sand and
Gravel
Clay
Ground Surface
7-ft Diameter Tunnel
8+00 4+00 0+00
Collector Well 19-ft Diameter
Collector Well 19-ft Diameter
Drop Shaft 4-ft Diameter
Drop Shaft 4-ft Diameter
Pump Station 32-ft Diameter Shaft
24-ft Diameter Shaft
in Bedrock
Section View 2B
Figure 2. Hard-rock tunnel concept using horizontal collector wells (Option 2).

the “dry” side. This construction option would allow laterals to be maintained individually, whileall other laterals remain in service. Figure 4 illustrates the “wet/dry” tunnel concept.
Maintenance requirements for Option 2 would involve taking an entire caisson out of service forlateral rehabilitation. This concept would reduce the effective capacity of the overall system bythe capacity of an entire caisson, or approximately one-third of a three-caisson system.
Option 3 would consist of individual wells that could be individually taken out of service andrehabilitated. A packer could be used to isolate the vertical collector from the tunnel. Based onmaintenance considerations, Option 3 was preferred.
11
Figure 3. Hard-rock tunnel concept using vertical collectors (Option 3).
Ohio River
Existing B.E. Payne Water Treatment Plant
TBM Construction
TBM Exit Construction
RBF Pump Station Existing Collector Well /Pump Station
Existing Low Lift Pump Station
Approx. 2,000 ft Tunnel Extension (no wells)
Plan View 3A
Vertical Collectors Installedon 200-ft Centers
3B
Capped Well Capped Well
Wellscreen
Tunnel
Well CasingClay
Sand & Gravel Aquifer
Bedrock
To Pump Station
Section View
Water Table Level

Hydrogeologic Yield
Computer modeling was used to predict the safe yield of the aquifer and to optimize the placementof collectors for all of the options. For Option 1, collector laterals would be positioned 60 ft(18.3 m) on center on the riverside of the tunnel (Schafer, 2000). Using a 1,500-ft (457-m) longtunnel with laterals located on 60-ft (18.3-m) centers resulted in an estimated yield ranging from44 to 61 MGD (167,000 to 231,000 m3/d), depending on water temperature. For Option 2, theoptimum number of laterals per collector well was determined to be 10 to 11 (Schafer, 2000) andthe estimated yield ranged from 37 to 51 MGD (140,000 to 193,000 m3/d), depending on watertemperature, for a system consisting of three new collector wells. For Option 3, approximately30 vertical collectors would be installed approximately 200-ft (67-m) apart, resulting in anestimated yield ranging from 38 to 44 MGD (144,000 to 167,000 m3/d) (Shafer, 2002).
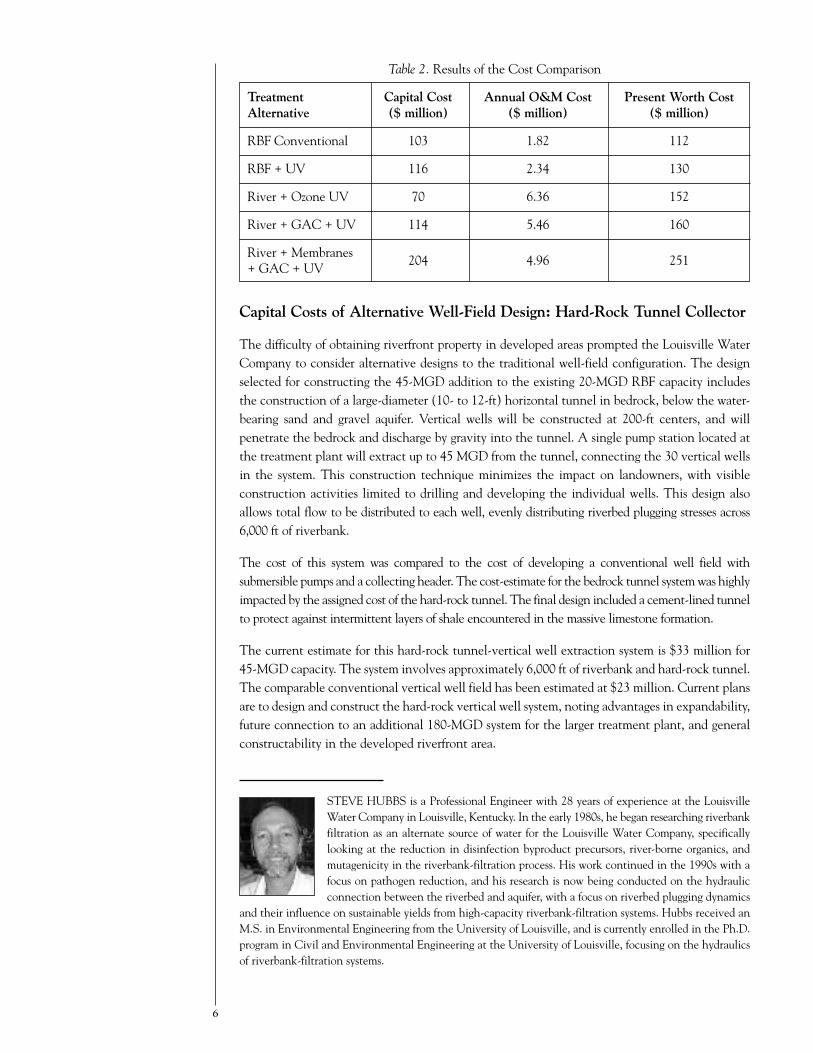
Data from the existing collector well and pumping tests were used as the basis for selectingleakance and transmissivity values that were used in calculating the predicted yields. Figure 5shows measured leakance data from the existing collector. As shown, leakance declined over theinitial 2-year period of operation from over 2.0 to 0.148 inverse days due to clogging in theriverbed. Within the past year, measured leakance values appear to have stabilized and increasedslightly. To be conservative in predicting yields for the new RBF addition, the lowest observedleakance value was used.
Water Quality and Treatment
Water quality obtained from the collector wells in many locations has been documented as havingmany advantages over that obtained directly from surface-water sources (Sontheimer, 1980;Hubbs, 1981; Wang et al., 1995; National Water Research Institute, 1999; Kuehn and Mueller,2000). In the Louisville Water Company’s case, the existing RBF collector well has shown many
12
Gate Valves withRemovable Elbow
12-Inch Lateral
Concrete Fill
Two 48-Inch Carrier Pipes
PrecastConcreteTunnel Segments
Tunnel Cross-Section
Figure 4.Wet/dry tunnel concept.
favorable improvements in water quality compared to the Ohio River source (Wang et al., 2002),including:
• Lower turbidity.
• Lower TOC.
• Increased minimum temperature.
• Reduced microbial contaminants.
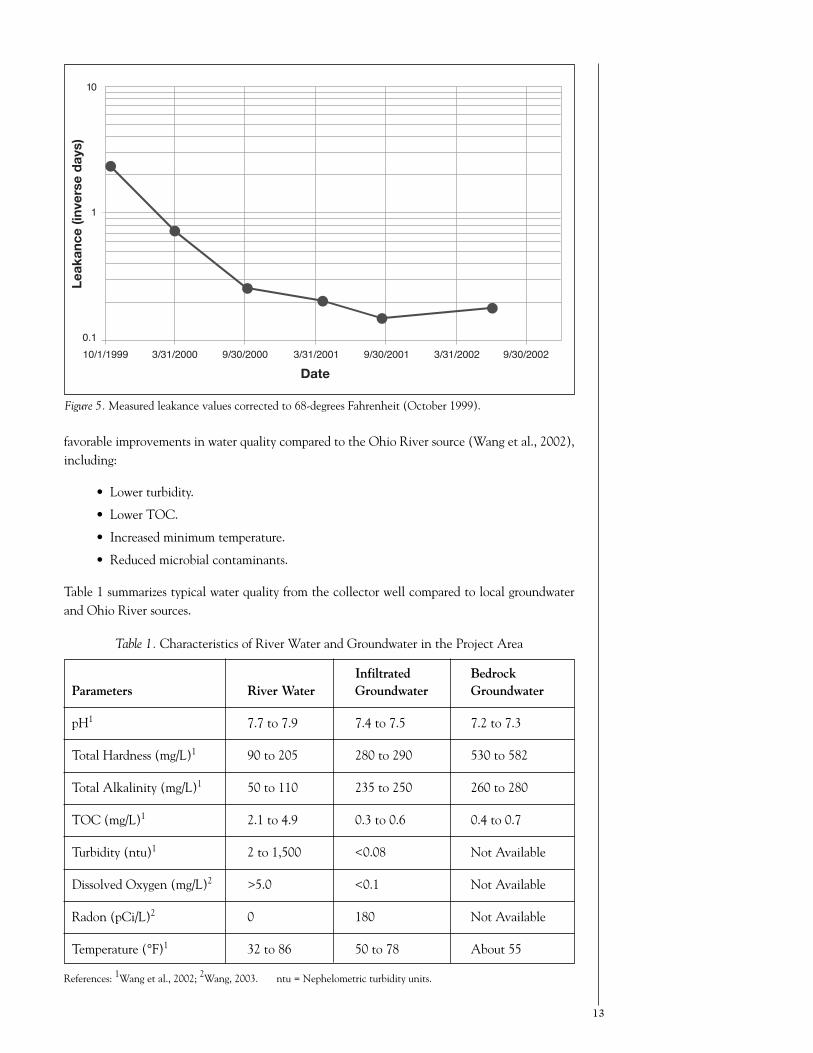
Table 1 summarizes typical water quality from the collector well compared to local groundwaterand Ohio River sources.
13
Infiltrated BedrockParameters River Water Groundwater Groundwater
pH1 7.7 to 7.9 7.4 to 7.5 7.2 to 7.3
Total Hardness (mg/L)1 90 to 205 280 to 290 530 to 582
Total Alkalinity (mg/L)1 50 to 110 235 to 250 260 to 280
TOC (mg/L)1 2.1 to 4.9 0.3 to 0.6 0.4 to 0.7
Turbidity (ntu)1 2 to 1,500 <0.08 Not Available
Dissolved Oxygen (mg/L)2 >5.0 <0.1 Not Available
Radon (pCi/L)2 0 180 Not Available
Temperature (°F)1 32 to 86 50 to 78 About 55
Table 1. Characteristics of River Water and Groundwater in the Project Area
References: 1Wang et al., 2002; 2Wang, 2003. ntu = Nephelometric turbidity units.
10/1/1999 3/31/2000 9/30/2000 3/31/2001 9/30/2001 3/31/2002 9/30/20020.1
1
10
Date
Leak
ance
(inve
rse
day
s)
Figure 5.Measured leakance values corrected to 68-degrees Fahrenheit (October 1999).

The turbidity of well water is typically less than 0.08 nephelometric turbidity units (ntu), whichcould allow the Louisville Water Company to bypass the coagulation treatment process and usedirect filtration for treating water. Reduced turbidity will result in lower coagulant dosages and lesssludge production. The reduction of organic material in the water will provide lower levels ofDBPs in the finished water.
With minimum water temperatures of the Ohio River source near freezing, water main breaks are anissue during the winter months. By having a more moderate water temperature and using more RBFwater, this will ultimately result in fewer main breaks. The LouisvilleWater Company also noted thelack of Geosmin and 2-methylisoborneol in well water during a taste and odor episode that occurredin 1999, resulting in the ability to eliminate the need to add powdered activated carbon.
Well water, however, has other water-quality issues that need to be addressed in the design of thesystem. Data from the Louisville Water Company shown in Table 1 indicates the followingtreatment issues:
• Increased hardness.
• Presence of radon.
• Low dissolved oxygen.
Additionally, water quality of the aquifer downstream from the Payne Plant has been documentedas having elevated levels of iron (Schafer, 2000). This will be a consideration as the LouisvilleWater Company proceeds with implementing RBF for the Crescent Hill Water Treatment Plant,but is not a factor for the current design project at the Payne Plant. Because the Payne Plant isalready a softening plant, the increased hardness of RBF water will be treated using existing basins.
Radon levels of 180 pCi/L have been noted in the existing collector well. While this is below theanticipated maximum contaminant level of the future Radon Rule (300 pCi/L), the LouisvilleWater Company desires to set a goal of 0 pCi/L, because the surface-water source currentlysupplying water to its customers does not contain radon. Treatment for radon will involve theinstallation of an in-line aerator.
Dissolved oxygen from well water is less than 0.1 mg/L. Currently, as water flows throughthe basins of the existing treatment plant, oxygen levels are naturally increased up to about5 mg/L. The same in-line aerator used for radon removal can be used to impart higher levels ofoxygen into the water, if needed.
Summary
The results of the subsurface evaluation show that both tunnel options are feasible for RBF. Witheither Option 1 or 3, the collector laterals would be evenly spaced along the entire length of thecollection system, providing for more even hydraulic head distribution across the riverbank and,thus, better overall yield from the installation. With Option 2, the hydraulic head would befocused at the collector wells, resulting in less than maximum yield from the aquifer system.Maintenance flexibility would be greater for either Option 1 or 3, which would allow eachlateral/vertical collector to be maintained independently of the operation of the remaininglaterals/vertical collectors. Cost was a determining factor in selecting Option 3. In optimizing thedesign of the selected RBF system, the design engineers considered both water-quantity and water-quality issues. Water-quantity predictions were made using conservative assumptions based ondata from the existing collector well. Water-quality issues were identified and appropriatetreatment technologies are being incorporated into the design.
14

REFERENCES
Deere, D.U., and D.W. Deere (1989). “Rock Quality Designation (RQD) After Twenty Years.” ContractReport No. 6L-89-1, U.S. Army Corps of Engineers.
Hubbs, S.A. (1981). “Organic reduction — Riverbank Infiltration at Louisville.” Proceedings, AmericanWater Works Association Annual Conference, St. Louis, Missouri.
Kuehn, W., and U. Mueller (2000). “Riverbank Filtration: An Overview.” Journal AWWA, 92(12): 60.
National Water Research Institute (1999). Abstracts, International Riverbank Filtration Conference, November4-5, 1999, Louisville, Kentucky.
Schafer, D. (2001). Evaluation of Collector Well Production Capacity B.E. Payne Water Treatment Plant, DavidSchafer & Associates, Inc., Project Report.
Schafer, D. (2000). Hydraulics Analysis of Groundwater Extraction at the B.E. Payne Water Treatment Plant,David Schafer & Associates, Inc., Project Report.
Sontheimer, H. (1980). “Experience with Riverbank Filtration Along the Rhine River.” Journal AWWA,72(7): 386.
Wang, J., J. Smith, and L. Dooley (1995). “Evaluation of Riverbank Infiltration as a Process for RemovingParticles and DBP Precursors.” Proceedings, American Water Works Association Water Quality TechnologyConference, New Orleans, Louisiana.
Wang, J.Z., S.A. Hubbs, and R. Song (2002). Evaluation of Riverbank Filtration as a Drinking Water TreatmentProcess, American Water Works Association Research Foundation Report Number 90922.
Wang, J.Z. (2003). Personal communication.
DAVID HAAS is a Senior Project Manager with Jordan, Jones & Goulding, Inc., anAtlanta-based consulting firm that offers engineering, management, and planningservices. Haas has over 18 years of experience in municipal water supply, treatment, anddistribution system projects. Currently, he is the Project Manager for the Louisville WaterCompany’s 45-million gallons per day riverbank-filtration project at the B.E. PayneWaterTreatment Plant in Louisville, Kentucky. He is also a contributing author of RiverbankFiltration: Improving Source-Water Quality, jointly published by Kluwer Academic
Publishers and the National Water Research Institute in 2002. Haas received both a B.S. and M.S. inEnvironmental Engineering from the University of Louisville. He is a Professional Engineer in the States ofGeorgia, Kentucky, and Tennessee.
15

16

Session 2: Operations
Construction and Maintenance of Wellsfor Riverbank Filtration
Henry C. Hunt, CPGCollector Wells International, Inc.Columbus, Ohio
By description, RBF implies that we are designing something that will allow water to be infiltratedfrom a surface-water source through riverbank (and river-bottom) deposits. This allows physical(e.g., suspended) particles to be filtered out of source water in an attempt to “pretreat” raw waterbefore it reaches a treatment plant or enters a distribution system with some sort of primarytreatment, such as chlorination.
While the term “RBF” is a relatively new term in the United States, well and gallery systems havebeen used in international settings to develop water supplies using induced infiltration dating backto the 1800s. Many well and infiltration systems have relied on RBF to provide recharge intoalluvial aquifers to replace groundwater pumped at sites all across the United States, but onlyrecently have these sites been coined as “RBF” sites. Water-supply facilities at such sites typicallyinclude vertical wells, infiltration galleries, and radial collector wells.
What makes RBF work is that the water level in the aquifer is drawn down by pumping from awell or gallery system located adjacent to a surface-water source, and water from the surface-waterbody is then induced to infiltrate into the aquifer as hydraulic gradients are developed frompumping. The schematic in Figure 1 shows this general relationship for horizontal collector wellsand conventional vertical wells.
17
Correspondence should be addressed to:
Henry C. Hunt, CPGSenior Project Manager/HydrogeologistCollector Wells International, Inc.6360 Huntley Road • Columbus, Ohio 43229 USAPhone: (614) 888-6263 • Fax: (614) 888-9208 • Email: [email protected]
Screened Pipe
River River
Plan
Elevation
Horizontal Vertical
Flow
Flow
Figure 1. Well systems develop capacity through induced infiltration (Ray et al., 2002a).

Riverbank Filtration Suitability
ARBF system is designed to infiltrate water from an adjacent surface-water source, using streambedand riverbank deposits to naturally filter out suspended materials from source water. The first (andobvious) requirement is that the facilities be placed in close proximity to a source of recharge, suchas a river. During the feasibility and siting stages of a project, a number of criteria must beconsidered, including:
• Availability of water from a surface-water source that can recharge the aquifer.
• An efficient hydraulic interconnection between the river and aquifer.
• Suitable water quality in the surface-water source.
• Sustainable flow in the river to match anticipated withdrawal rates.
A detailed hydrogeologic investigation is required to verify that aquifer conditions are favorablefor considering a RBF facility to meet project water demands. The investigation must evaluate thegeology of the aquifer and the interconnection between the river and groundwater in the aquiferto determine the feasibility of inducing infiltration from the river, evaluate possible well designs,and determine likely well yields. This type of investigation typically includes exploratory testdrilling, aquifer (pumping) testing, and data analysis to develop the needed information for eachprospective project site. Based on the results of this investigation, well designs are developed andalternatives are compared for feasibility, yield, and cost. These alternative designs are generallydiscussed below.
Vertical Wells
Vertical wells represent the most conventional method for developing a groundwater supply in thecountry. These wells consist of a vertical borehole that is usually completed with a screen and risercasing to allow water to enter from the formation and be pumped from the borehole via a pumpingsystem installed within the riser casing. A diagram of a typical vertical well constructed in anunconsolidated (e.g., sand and gravel) aquifer is shown in Figure 2. Vertical wells can be usedeffectively when small to moderate yields are needed, or when a system is growing slowly over alonger period of time, such that adding a well to the system every year or so meets growing waterdemands. To meet larger demands, a series of vertical wells must be installed, spreading alongriverfront areas or grouped into well-field clusters.
Vertical wells can be constructed using a variety of drilling methods, including mud rotary, reversecirculation, cable tool, bucket-auger, dual-rotary, and air rotary. The method selected for each sitewill take into account a combination of well criteria, including well depths, diameters, water-tableelevations, screen requirements, and potential problems caused by geologic conditionsencountered. These wells are constructed by drilling a vertical borehole, and then installing thedesired well riser casing and screen in the borehole. In some cases, an artificial gravel-pack filteris also added to help prevent the intrusion of sand and silt from the formation during pumping.
Collector Wells
A collector well, also called a horizontal collector or radial well, differs from a vertical well in thatthe well screen is installed horizontally into the aquifer formation from a central reinforcedconcrete caisson that serves as the wet well pumping station. These wells are constructed bysinking sections of reinforced concrete (called lifts) into the aquifer adjacent to the river until thelower portion of the caisson reaches the design elevation for installing the well screen. Individual
18

lengths of well screens are then projected out into the aquifer in a variety of patterns near the baseof the alluvial aquifer or at another pre-selected horizon within the aquifer. Where RBF is desired,the pattern of lateral well screens is predominantly beneath the river. This allows the “pumpingcenter” for the collector well to be shifted closer to the river, usually in an attempt to increase thepercentage of river water that is infiltrated into the aquifer. This design capability usually permitsthe highest percentage of river water to be achieved in a riverbank setting. The ability to installthe well screens horizontally in the aquifer beneath the river permits longer lengths of well screento be installed, per site, typically maximizing the yield possible from each well site. It is commonfor a collector well to produce a yield equivalent to multiple vertical wells from the same well site.A general schematic of a typical collector well is shown in Figure 3.
Well Selection
The hydrogeologic investigation determines the hydraulic characteristics of the aquifer formationnecessary to determine the potential yield possible from either a collector well or a series ofvertical wells. This data allows a comparison to be made of well designs to meet project waterdemands, usually considering a single collector well versus a series of vertical wells, withconnecting pipeline, electrical service, access roads, etc., to produce the equivalent yield (it iscommon for a collector well to produce a yield equal to 5 to 10 vertical wells). As the capital coststo install the “complete system” are compared, it is often very competitive to consider a collectorwell to meet moderate to very large capacities, and more competitive to consider a vertical wellwhen lower capacities are required (for example, when incremental increases in capacity areprojected over a number of years).
19
Electric Motor
Original Water Surface
Approximately 1-m High
Pump Bowl for a Turbine Pump
Well Screen
Well Casing
Pump House
Land Surface
Pump to Water Treatment Plant
Cone of Depression
Gravel Pack
Water
River
Water
Rotating Shaft
Figure 2. Typical components of a vertical well (Ray et al., 2002b).

Alternate Systems
In addition to vertical wells and radial collector wells, infiltration galleries can be used to developfiltered surface-water supplies through RBF. These can include trenching parallel or beneath theriver and installing screened gallery pipes that can deliver filtered surface water to sumps and wetwells. It is also possible to use horizontal directionally drilled wells to induce infiltration from anadjacent river. These systems are often installed under low head conditions, such that lower perfoot yields are obtained, requiring longer gallery lengths to meet higher capacity needs. It is oftendifficult to perform effective well-screen maintenance on these systems.
Well Maintenance
It is normal for well screens to become plugged with chemical (mineral) precipitates and biologicalgrowths (e.g., iron bacteria) over time in alluvial aquifers. The rate of plugging can be exacerbatedif the screen design creates excessive entrance velocities through the slot openings in the wellscreens, so it is important that proper screen design considers the water quality and hydrauliccharacteristics of the aquifer to maintain entrance and approach velocities within acceptableranges to minimize this rate of plugging and extend the intervals between well cleanings. Sincethe lineal footage of well screen in a collector well is longer than for a vertical well, entrancevelocities are minimized so that the intervals between required maintenance can be extended.This typically results in lower O&M costs over the life of the collector well.
Well maintenance can be accomplished using a variety of methods including mechanical,chemical, or a combination of methods. The most effective method to restore well-screenopenings and well efficiency will vary from well field to well field, and is selected based upondetails of the well construction (e.g., screen design), groundwater quality, past results, the natureof plugging (mineralogic versus biological), and other factors. The use of an ongoing monitoringand record-keeping program should allow you to track well performance, identify operating trends,and predict optimal times for performing maintenance.
20
Pump Shaft
Pump House
Land Surface
Central Collection Caisson
Pump
Laterals
Well Screens (in Laterals)
Figure 3. Typical components of a radial collector well (Ray et al., 2002b).

Summary
Well systems can be constructed in alluvial aquifer systems at many locations to induce infiltrationfrom adjacent surface-water sources to provide a pre-filtered raw-water supply. The design of thesesystems should be selected after evaluating site-specific aquifer conditions, water-qualityobjectives, and project water demands to ensure that the most effective system is selected. Thereare many well systems operating in the United States and overseas, demonstrating that RBF canbe used effectively to meet water-quality and capacity objectives.
REFERENCES
Ray, C., T. Grischek, J. Schubert, J. Wang, and T. Speth (2002a). “A perspective of riverbank filtration.”Journal AWWA, 94(4): 149-160.
Ray, C., G. Melin, and R. Linsky, editors (2002b). Riverbank Filtration: Improving Source-Water Quality,Kluwer Academic Publishers, Dordrecht.
HENRY HUNT is a Senior Project Manager and Hydrogeologist with Collector WellsInternational, Inc., which specializes in the design, construction, and rehabilitation ofwater-supply systems for public drinking water, industrial process, or power plant coolingwater. Hunt has over 25 years experience involving riverbank-filtration systems, rangingfrom the inspection and rehabilitation of existing well and infiltration systems to thedesign and construction of new water wells and riverbank-filtration facilities. He hasspecial expertise concerning the inspection, evaluation, siting, and testing of radial
collector wells along many alluvial valleys across the United States and overseas. In addition, he has authoreda number of papers regarding water-supply development, infiltration galleries, radial collector wells, andseawater collector wells, including several chapters in the 2002 publication Riverbank Filtration: ImprovingSource-Water Quality and the newly revised American Water Works Association Manual 21 on Groundwater.Hunt received a B.A. in Geology from Lafayette College in Pennsylvania, with a minor in Civil Engineering.
21

22

Session 2: Operations
Aquifer Storage and Recovery Pretreatment:Synergies of Bank Filtration, Ozonation,and Ultraviolet Disinfection
Robert Stanley Cushing, Ph.D., P.E.Carollo EngineersSarasota, Florida
R. David G. Pyne, P.E.ASR SystemsGainesville, Florida
David R. Wilkes, P.E.Jordan, Jones & GouldingNorcross, Georgia
Introduction
Aquifer Storage and Recovery (ASR) is a technique in which water is stored in subsurface aquifersduring high-supply, low-demand periods for use during low-supply, high-demand periods. Asindicated in Figure 1, water is pumped into a confined aquifer, displacing the native water, andforms a zone in the aquifer comprised primarily of injected water. Water is subsequently extractedfrom the aquifer when needed to supplement finished water-production capacity.
23
Correspondence should be addressed to:
Robert S. Cushing, Ph.D., P.E.PartnerCarollo Engineers, P.C.401 North Cattlemen Road • Suite 306 • Sarasota, Florida 34232 USAPhone: (941) 371-9832 • Fax: (941) 371-9873 • Email: [email protected]
Figure 1. Schematic representation of ASR.
Native Ground Water
Native Ground Water
Buffer Zone
Buffer Zone
Stored Water
Stored Water
Target Storage Volume Confining Layer
Confining Layer Confining Layer
ASR Well

Traditionally, ASR has been used to store potable water to meet seasonal limitations in source-watersupply or to optimize the use of water-treatment capacity. For example, the PeaceRiver RegionalWaterSupply Authority in Florida draws and treats water from the Peace River at a rate limited by minimumflows and levels. By storing treated water through ASR during high river flow periods, the Authorityhas been able to more than double the usable yield from this source, while avoiding adverse impacts tosensitive downstream ecosystems. Mt. Pleasant Water Works in South Carolina supplements theirwater supply using reverse-osmosis treatment of brackish groundwater. ASR allows the reverse-osmosisplant to operate at a relatively constant rate, minimizing the production cost from this facility.
Emerging ASR applications include storing water types other than finished potable water, includingpartially treated surface water and reclaimed wastewater, as well as different uses for ASR productionwater (such as water-treatment plant source-water, irrigation, and environmental applications).Biological and physiochemical processes during ASR storage can remove certain contaminants,including THMs and HAAs, leading to ASR applications that provide treatment, as well as storage.
Water-quality goals for water to be injected into an ASR well vary with application. Generally, theleast restrictive goal is to produce a water with chemical and particle characteristics that preventexcessive loss of permeability in the injection well aquifer. Some applications require injection waterto meet primary (or public health-related drinking water) standards to protect aquifer quality or tomeet ASR production requirements. Treatment to secondary or aesthetic water-quality standards mayalso be required. The most restrictive water-quality goals require treatment for trace, unregulatedcontaminants (e.g., low levels of endocrine disrupting compounds). Treatment system complexity,O&M requirements, and cost are all strongly related to source-water quality and finishedwater-qualitygoals, with ASR pretreatment costs ranging well over an order of magnitude, depending on theparticular application.
One general treatment approach for meeting ASR pretreatment goals consists of bank filtrationfollowed by ozonation and/or UV disinfection (Figure 2). This process combination offers theimproved reliability of a multiple-barrier approach while maintaining cost and operationalefficiencies due to the synergistic nature of the individual unit processes. The following discussionprovides a summary of treatability study results, engineering analysis, and cost-estimates for thisprocess configuration.
Discussion
Traditional treatment approaches, such as membrane filtration or conventional treatment,produce process residuals that generally have substantial cost and operational implications. Inaddition, these traditional approaches require substantial chemicals for process O&M, an aspect
24
Figure 2. Integrated bank filtration/ozonation/UV disinfection process train.
Lake Okeechobee
Bank Filtration
Ozone Contactor/ Reaction Basin
UV Disinfection

that is important when considering both reliability and security. A process train comprised of bankfiltration followed by ozonation and/or UV disinfection produces no residuals and has minimalchemical requirements. This process combination offers a number of benefits, including cost,flexibility, and multiple barriers to pathogens and other contaminants.
For this process combination, the barriers to pathogens operate by distinctly different mechanisms,enhancing the robustness of the multiple-barrier approach and providing the first example ofprocess synergy. Bank filtration provides physical removal and physical/chemical/biologicalinactivation of pathogens, ozonation provides chemical disinfection, and UV providesdisinfection through a fundamentally different mechanism.
While bank filtration removes color and taste- and odor-causing compounds, ozonation providesa means of further improving these water-quality characteristics. Ozonation also increasesUV transmittance, decreasing the capital and operational cost of the UV disinfection process.
Case Study Description and Objectives
As part of the Comprehensive Everglades Restoration Program, the U.S. Army Corps of Engineers— in conjunction with the South Florida Water Management District — have initiated pilotstudies to evaluate potential treatment options for an ASR project that includes hundreds of ASRwells. Treatment systems will be designed to treat surface water prior to injection into groundwaterstorage zones, with ultimate capacity approaching 1.5-billion gallons of water per day.
The purpose of the pilot-testing project was to demonstrate surface-water treatment technologiesto meet multiple water-quality goals prior to injection into ASR wells. Pilot-test data andengineering analysis were used to develop optimized design criteria, as well as capital and O&Mcosts for full-scale treatment systems. The specific primary objectives of the study were to:
• Determine raw-water quality during the pilot study.
• Collect and analyze unit process and treatment train performance data.
• Establish process feasibility and design criteria for full-scale water treatment systems.
• Determine preliminary capital and operating cost estimates for each of the unit processesconsidered.
Methodology
Two parallel treatment trains were operated during most of the study:
• Treatment Train 1 — Simulated bank filtration/ozonation.
• Treatment Train 2 — Simulated bank filtration/UV disinfection.
During later stages of the study, two additional trains were tested. Simulated bank filtration wasbypassed and a direct surface-water intake (with wire mesh filtration followed by ozonation andUV disinfection) was evaluated. Figure 3 illustrates the treatment trains, with dashed lines labeled“Alternative Treatment Train” showing the supplemental testing.
Water was taken from the St. Lucie Canal (eastern shore of Lake Okeechobee) through an intakeheader that consisted of slotted polyvinyl chloride pipe. The water was pumped from the intakepipe through a centrifugal pump and into the simulated bank-filtration system, consisting of awedge-wire filter (Parker TruClean filtration system) followed by a gravity sand filter(10-ft × 10-ft area, with 36-inches of 0.45 to 0.55-millimeter diameter sand). Note that original
25

plans for a pilot-scale bank-filtration intake were changed by the U.S. Army Corps of Engineersand South Florida Water Management District. Simulated bank-filtration results were analyzeddirectly and extrapolated to consider the impacts of full-scale bank-filtration intake.
Results
Raw-water quality during the study (August 2002 to October 2002) was generally consistent withhistorical trends. TOC levels were high, averaging 27 mg/L, with a maximum concentration of49 mg/L. Correspondingly, true color was also elevated, averaging 96 color units, with a maximumof 236 color units. Turbidity was variable, ranging from 5 to 57 ntu, with an average of 15 ntu.
The simulated bank-filtration unit process provided particle removal averaging 91 percent andturbidity removal averaging 78 percent. The removal of dissolved constituents (e.g., TOC andcolor) was minimal. As expected, due to the short residence time in the simulated bank-filtrationsystem (1 to 3 hours), particle removal through the simulated system was less than expectedthrough a full-scale bank-filtration system, and microbial activity and the associated removal oforganic material was not significant.
Ozone was capable of removing color to meet and exceed the secondary maximum contaminantlevel of 15 color units and to reduce UV absorbance. Due to the high ozone doses required tomaintain a residual and rapid decay rates, achieving disinfection credit through ozonation was notfeasible. In addition, with bromide concentrations approaching 300 micrograms per liter (µg/L),achieving significant disinfection and maintaining bromate concentrations below the maximumcontaminant level of 10 micrograms per milliliter would be infeasible; however, ozone doses usedto reduce color and improve UV transmittance (from a minimum of 13-percent UV transmittancein raw water to greater than 65-percent UV transmittance in ozonated water).
Due to the synergistic relationship between ozone and UV disinfection, full-scale design criteriafor the two processes were analyzed concurrently to minimize water production costs. As ozonedose goes up, the cost to purchase and operate the ozone system rises; however, due to the increasein UV transmittance with higher doses, UV-disinfection system costs decrease. An average ozonedose of approximately 6 mg/L and maximum dose of 11 mg/L produced a UV transmittance of65 to 72 percent and a minimum production cost (amortized capital, plus O&M). The UV system
26
Figure 3. Pilot process flow schematic.
Settling Tank
Residual
Solids Land Applied On-Site
UV
O3
Holding Tank
Residual
Water Source Submersible Pump
Wedge Wire Filter
Sand Filter
Effluent
to Canal
Alternate Treatment Train
Alternate Treatment Train
Decant

was designed to deliver a dose of 140 millijoules per square centimeter to meet all disinfectiongoals for Giardia, Cryptosporidium, and viruses at a design UV transmittance of 60 percent.
The cost of a 5-MGD bank filtration/ozonation/UV-disinfection treatment facility is approximately$4,759,000 for design and construction and $147,000 per year for O&M (or $0.20 per 1,000 gallonsof water produced). This translates into a normalized capital cost of $0.95 per gallons per day ofcapacity and a production cost of $0.70.
BOB CUSHING has 14 years of experience in applied environmental science andengineering. Throughout his career, he has coupled fundamental concepts with soundengineering practices to provide creative, innovative, and enduring solutions to challengesfaced by water and wastewater utilities. Cushing has been responsible for numeroussuccessful treatment facility planning and design projects, as well as studies and programsfor improving distribution system water quality. Cushing has practiced nationally,providing service to a broad cross-section of the industry, from some of the largest and most
visible utilities (e.g., New York City and Washington, D.C.) to very small applications with important andunique issues (e.g., Oray National Fish Hatchery, Utah). He has also been responsible for introducing andapplying advanced technologies, most notably ultraviolet disinfection for potable water treatment. Aninternationally recognized expert in ultraviolet disinfection, he is responsible for seminal applied research inthis area, and is project manager and a primary author for the United States Environmental ProtectionAgency’s Ultraviolet Disinfection Guidance Manual. Cushing received a B.S. in Petroleum Engineering and anM.S. and Ph.D. in Civil Engineering from the University of Texas at Austin.
27

28

Session 2: Operations
Evolution from a Conventional Well Fieldto a Riverbank-Filtration System
John D. NorthCedar Rapids Water DepartmentCedar Rapids, Iowa
Douglas J. Schnoebelen, Ph.D.United States Geological SurveyIowa City, Iowa
Shelli GrappCedar Rapids Water DepartmentCedar Rapids, Iowa
Roy E. HesemannCedar Rapids Water DepartmentCedar Rapids, Iowa
The City of Cedar Rapids is located in east-central Iowa and has a population of 121,000. TheCedar River alluvial aquifer is the sole source of drinking water for the City. Within the last fewyears, the Cedar River — which drains a major agricultural watershed — has experienced extendedperiods of elevated levels of nitrate and herbicides (notably, atrazine and its degradationbyproducts) that were above the maximum contaminant level for drinking water. Fortunately,during these extended periods of compromised water quality in the river, RBF enabled the CedarRapids Water Department to obtain and treat adequate quantities of water that met all drinking-water standards. The Cedar Rapids Water Department and the United States Geological Survey(USGS) have been collaborating in an ongoing study of the river and its hydraulic interconnectionwith the City’s wells. A primary focus of this study is to identify operational and developmentstrategies that will optimize RBF and the water-quality benefits it affords.
The Cedar River originates in southern Minnesota and generally flows in a southeasterly directionthrough east-central Iowa until it discharges to the Iowa River in Louisa County. The Cedar Riverdrains a major agricultural watershed, which also includes several urban areas. The entirewatershed encompasses 7,800 square miles, in which approximately 6,500 square miles areupstream from Cedar Rapids’ well fields. Land use in the watershed is predominantly agricultural(approximately 90 percent), with major crops being corn and soybeans (Kalkhoff et al., 2000;Schnoebelen and Schulmeyer, 1998; Schulmeyer, 1995). Major urban areas in the watershedinclude:
• Albert Lea and Austin in Minnesota.
• Mason City, Clear Lake, Charles City, Forest City, Waverly, Cedar Falls/Waterloo, andCedar Rapids/Marion in Iowa.
29
Correspondence should be addressed to:
John D. NorthWater Utility Director, Cedar Rapids Water Department1111 Shaver Road NECedar Rapids, Iowa 52402 USAPhone: (319) 286-5912 • Fax: (319) 286-5911 • Email: [email protected]

The Cedar River and its water quality have been the subject of extensive studies and monitoringby the Cedar Rapids Water Department, USGS, Iowa Geological Survey Bureau, and other localagencies. These studies have documented several major water-quality issues that affect the river’ssuitability for the three designation uses established by the Iowa Department of Natural Resources:
• Primary contact recreation (e.g., swimming).
• Wildlife, fish, and aquatic life.
• Potable water source.
Water-quality challenges come from both point and non-point sources and include excessive soilerosion/sedimentation, elevated levels of nitrate and phosphorous, and fecal coliform bacteriacounts above the acceptable levels for recreational swimming. The 57-mile segment of the CedarRiver upstream from the City’s well field to LaPorte City has been placed on the State’s list ofimpaired streams due to elevated levels of nitrate and fecal coliform bacteria.
The most daunting challenge for the Cedar Rapids Water Department is the increasing trend ofelevated levels of nitrate, especially in the spring and early summer. During these periods, monthlynitrate levels are routinely in the range of 10.0 to 14.7 mg/L as nitrogen (N). The drinking-waterstandard for nitrate is 10.0 mg/L (as N), and a single exceedance constitutes a violation.Fortunately, as illustrated in Figure 1, a 2- to 3-mg/L reduction in nitrate levels is generallyaccomplished as the water moves from the river to the wells. This natural reduction, combinedwith the monitoring and management of individual wells, has enabled the Cedar Rapids WaterDepartment to avoid any violations of the drinking-water standard for nitrate.
Prior to 1963, the City of Cedar Rapids obtained its water supplies directly from the Cedar River.River water underwent treatment processes similar to those used today — lime softening,disinfection by chloramination, filtration, and the addition of fluoride and phosphate for corrosioncontrol. This provided for safe drinking water, but failed to avoid the intermittent aestheticproblems (taste and odor) primarily associated with elevated algae levels in the river. Thisprompted the City to construct and convert its water supplies to a series of shallow wells along theCedar River.
30
16.0 14.0 12.0 10.0 8.0 6.0 4.0 2.0 0.0
Jan-
02
Feb-
02
Mar
-02
Apr-0
2 M
ay-0
2 Ju
n-02
Ju
l-02
Aug-
02
Sep-
02
Oct-0
2 No
v-02
De
c-02
Ja
n-03
Fe
b-03
M
ar-0
3 Ap
r-03
May
-03
Jun-
03
Jul-0
3
Monthly Nitrate Results (mg/L as N) Highest Reported Values
Cedar River NW Water Plant MCL Standard
Figure 1. Highest recorded nitrate levels: Cedar River as compared to the well water supplies to CedarRapids’ NW Water Plant (Source: Cedar Rapids Water Department).

Today, Cedar Rapids obtains all of its water supplies from a series of shallow wells constructed inthe sand and gravel alluvium along the Cedar River. The City now has four well fields consistingof 45 vertical wells and four horizontal collector wells. Total current production capacity of thewells is generally assumed to be approximately 65 MGD, but output will vary depending on riverlevel and recent operating conditions. Withdrawal rates now average about 36 MGD, with amaximum demand of 50 MGD. Approximately 80 percent of the water is used for grain processingand other wet industries.
Vertical wells are drilled to the top of the bedrock with depths ranging from 42 to 72 ft and arelocated about 30 to 900 ft from the river. The two original horizontal collector wells placed inservice in 1995 consist of a 13-ft diameter center column extending to a depth of approximately60 ft (about 2 ft above bedrock) and six lateral screens extending about 200 ft from the centralcolumn. The two collector wells placed in service this year are of similar construction, except forthe use of a 16-ft diameter center column. All of the well laterals were constructed so as not toextend under the river channel except under high water conditions.
The USGS and other agencies have conducted extensive studies of the Cedar River and thealluvium that serves as the drinking-water supply for Cedar Rapids. These studies have determinedthat the Cedar River is generally a “gaining stream” — that is, water will typically move throughalluvium to the river; however, pumping of the wells will reverse the normal flow pattern andinduce the infiltration of water from the Cedar River into the alluvium. The USGS found thatinduced filtration from the Cedar River supplies approximately 74 percent of the recharge to theCity’s wells. The balance of the recharge is from the underlying aquifer (21 percent) and theinfiltration of precipitation (5 percent). The USGS also determined that the travel times for themovement of water from the Cedar River to the nearest vertical well ranged from 7 to 17 days(Schulmeyer, 1995; Schulmeyer and Schnoebelen, 1998).
The movement of water through sand and gravel formations due to pumping is commonly calledinduced RBF. RBF has been widely used in Europe as a pretreatment process for almost 100 years,and there has been recent interest and research concerning its use in North America. The naturalfiltration and biological activity that occur during the movement of water through the alluviumaffords several water-quality benefits. These include a reduction in turbidity and microbiologicalimprovements with the removal/reduction of viruses, bacteria, and protozoan organisms(e.g., Giardia and Cryptosporidium), as well as a reduction in the levels of nitrates, herbicides, andother potential contaminants. USGS studies of Cedar Rapids’ wells have confirmed that, “Thefiltering efficiency of the aquifer is equivalent to a 3-log reduction rate or 99.99-percent reductionin particulates” (Schulmeyer, 1995).
When the Cedar Rapids Water Department and USGS initiated their cooperative study in 1992, itwas restricted to a 231-square mile area along the Cedar River that encompasses the City’s four wellfields. Initially, the primary focus was to develop an understanding of the hydraulic interconnectionof the river and wells and the factors that affect the quantity and quality of the water drawn from thewells. For example, studies regarding new well development would simply attempt to identify sitesthat would yield significant water with relatively low levels of iron and manganese. There was verylittle consideration given to “RBF” and enhancing the water-quality benefits it affords.
Beginning about 1995, the scope of the study was expanded to include additional physical andchemical parameters, as well as the addition of biological monitoring (e.g., Microscopic ParticulateAnalysis). This was prompted by two primary considerations. The ongoing cooperative studyconfirmed that well water was consistently of higher quality than the river; however, the study alsoconfirmed that the movement of recharge water through alluvium could also readily transport
31

contaminants from the river to the wells. Additionally, Iowa regulatory officials issued a preliminarydetermination that the newly constructed collector wells were groundwater under the directinfluence of surface water (GWUDI) sources.
To date, major study activities and work products of the USGS/Cedar Rapids Water Departmentcooperative study include:
• Identification and mapping of contaminant sources in the immediate vicinity of theCity’s wells.
• Development of a regional groundwater model covering 231 square miles, whichsimulates groundwater flow under steady-state conditions.
• Construction of a detailed groundwater flow model, which simulates groundwater flowand well recharge under transient conditions (a computer model is now complete andbeing tested).
• Completion of extensive water-quality monitoring (physical and chemical parameters) ofthe river and wells.
This research, along with the Cedar Rapids Water Department’s Source Water Assessment study,has documented the importance of the river and the potential contaminant threats it poses to ourwater supplies. They have also confirmed the protection and other benefits afforded by RBF.Consequently, the cooperative study was recently expanded to include the entire Cedar RiverWatershed. The Cedar Rapids Water Department, USGS, and Iowa Geological Survey Bureauhave partnered to conduct three separate comprehensive synoptic studies of water quality ofsamples at 64 locations throughout the watershed. A dye tracer/time-of-travel study has beencompleted on the lower main stem of the Cedar River, with plans for more dye tracing on othersections at low flow conditions, as well as possible Lagrangian sampling. In Lagrangian sampling,the same mass of water is sampled as it moves downstream. The objective of this study will be tovalidate time-of-travel models and to determine the fate of nitrogen compounds as they aretransported down the river (D.J. Schnoebelen, 2002).
In summary, the Cedar Rapids Water Department has attempted to develop a better understand-ing of the river and its wells, which would allow the implementation of management andprotection programs for its drinking-water supplies. Although we did not fully understand its roleuntil just recently, RBF is a valuable pretreatment process and is an integral component of ourmulti-barrier strategy for protecting water quality. It has enabled the Cedar Rapids WaterDepartment to avoid any violations of the drinking-water standard for nitrate that wouldnecessitate the construction and operation of costly nitrate removal facilities.
Without RBF, the Cedar Rapids Water Department would not have been able to supply qualitywater that meets all drinking-water standards while maintaining the competitive rates required byits major customers, the local industries. Although very beneficial, it must be acknowledged thatRBF does not completely remove contaminants, as evidenced by the presence of nitrates andherbicides in Cedar Rapids’ well supplies. RBF, along with watershed protection programs, mustbe a key element of Cedar Rapids’ multi-barrier approach to the protection of its water suppliesand public health.
32

REFERENCES AND ACKNOWLEDGEMENTS
The following references and publications were used in the research and preparation of this report(though not all are cited in the text):
National Water Research Institute
• Ray, C., G. Melin, and R.B. Linsky, editors (2002). Riverbank Filtration: Improving Source-WaterQuality, Kluwer Academic Publishers, Dordrecht.
United States Geological Survey
• Becher, K.D., S.J. Kalkhoff, D.J. Schnoebelen, K.K. Barnes, and V.E. Miller (2001). Water-QualityAssessment of the Eastern Iowa Basins – Nitrogen, Phosphorous, Suspended Sediment and OrganicCarbon in Surface Water, 1996-98, U.S. Geological Survey Water-Resources Investigations Report01-4175.
• Kalkhoff, S.J., K.K. Barnes, K.D. Becher, M.E. Savoca, D.J. Schnoebelen, E.M. Sadorf, S.D. Porter,and D.J. Sullivan (2000). Water Quality in the Eastern Iowa Basins, Iowa and Minnesota, 1996-98,U.S. Geological Survey Circular 1210.
• Schnoebelen, D.J. (2002). Written correspondence.
• Schnoebelen, D.J., D.E. Christiansen, and K.D. Becher (2002). “City of Cedar Rapids: SourceWater Assessment of Public Drinking-Water Supplied from Ground-Water.”
• Schulmeyer, P.M. (1995). Effect of the Cedar River on the Quality of the Ground-Water Supply for CityRapids, Iowa, U.S. Geological Survey Water-Resources Investigations Report 94-4211.
• Schulmeyer, P.M., and D.J. Schnoebelen (1998). Hydrogeology and Water Quality in the Cedar RapidsArea, Iowa, 1992-1996, U.S. Geological Survey Water-Resources Investigations Report 97-4261.
Iowa Department of Natural Resources
• “Progress Report One — Cedar River Assessment Survey,” June 2001.
• “Source Water Assessment and Protection Program and Implementation Strategy for the State ofIowa,” March 2000.
Iowa Department of Natural Resources – Geological Survey Bureau
• Seigely, L.S., andM.P. Skopec.Written reports of three comprehensive synoptic monitoring programsconducted at 62 sites on the Cedar River on August 26, 2000; June 2, 2001; and June 7, 2003.
Cedar Rapids Water Department
• Grapp, S.J., J.D. North, and R.E. Hesemann (2002). “City of Cedar Rapids SourceWater Assessment.”
JOHN NORTH has 30 years of experience in water-quality monitoring and in theoperation and maintenance of water systems. For the past 11 years, he has worked for theCity of Cedar Rapids in Iowa, which draws its water supplies from a series of shallowalluvial wells located along the Cedar River and drains a major agricultural watershed. Atpresent, he is the Water Utility Director for the City of Cedar Rapids Water Department.Under his direction, the Cedar Rapids Water Department has conducted severalcomprehensive water-quality research projects and other studies designed to ensure the
continued availability of an ample supply of safe drinking water for Cedar Rapids. Since 1993, the utility haspartnered with the United States Geological Survey in a comprehensive ongoing study of the City’s wellfields and their hydraulic interconnection with the Cedar River. A major focus of the study has been tooptimize the benefits of RBF. North received a B.S. in Chemistry from Loras College. He has dual-certification as a Grade IV water and wastewater plant operator.
33

34
Session 3: Hydraulic Aspects
Groundwater Flow and Water Quality – A FlowpathStudy in the Seminole Well Field, Cedar Rapids, Iowa
Douglas J. Schnoebelen, Ph.D.United States Geological SurveyIowa City, Iowa
Michael J. TurcoUnited States Geological SurveyLincoln, Nebraska
John D. NorthCedar Rapids Water DepartmentCedar Rapids, Iowa
In Iowa, alluvial aquifers near major rivers are a source of water for many communities. The Cityof Cedar Rapids withdraws water from wells completed in the Cedar River alluvium, a shallowalluvial aquifer adjacent to the Cedar River. TheCity of Cedar Rapids is located within LinnCountyin east-central Iowa, and water for the City is supplied by four well fields (East, Northwest,Seminole, andWest well fields) along the Cedar River. The City has a population of about 121,000,and several large industries are major water users. Currently, per capita water usage in the City isnearly three times the national average. The City is committed to providing both a high qualityand quantity of water to its customers. The USGS and Cedar Rapids Water Department havebeen working together in an ongoing research program to better understand water quality and flowin the Cedar River and alluvial well fields. Work has been done on both a basin and well-fieldapproach and has involved dye tracing/time-of-travel studies on the Cedar River, water-qualitysampling, geochemical modeling, and groundwater-flow modeling.
The effect of land use in the Cedar River Basin on both surface-water and groundwater quality isan important issue. The Cedar River Basin upstream from Cedar Rapids is approximately6,500 square miles. Upstream land use in the Cedar River Basin is over 90-percent agriculture.Corn and soybeans are the major crops. Livestock raised in the area include beef and dairy cattle,as well as hogs. Runoff from agriculture is of concern, particularly during the spring and earlysummer when many chemicals are applied to cropland. Triazine and acetanilide herbicides arecommonly applied in the Cedar River Basin, and these herbicides are water soluble and can betransported to streams and infiltrate to groundwater. In addition, several studies in eastern Iowahave identified nutrients as a major contaminant that has impaired water quality (Goolsby andBattaglin, 1993; Hallberg et al., 1996; Schnoebelen et al., 1999; Kalkhoff et al., 2000). In general,the majority of nitrogen inputs in the Cedar River Basin are from chemical fertilizers and animalmanure (Becher et al., 2000). High nitrate levels (greater than 10.0 mg/L) in the Cedar River areof particular concern to municipal water operators. The lower Cedar River is listed on the Iowatotal maximum daily load list for nitrate upstream of Cedar Rapids, Iowa. The Cedar River is the
35
Correspondence should be addressed to:
Douglas J. Schnoebelen, Ph.D.Research Hydrologist/Water-Quality SpecialistUnited States Geological SurveyFederal Building, Room 269 • 400 South Clinton • Iowa City, Iowa 52240 USAPhone: (319) 358-3617 • Fax: (319) 358-3606 • Email: [email protected]

source of most nitrate detected in the Cedar River alluvial aquifer because of induced infiltrationfrom the river due to pumping (Schulmeyer and Schnoebelen, 1998; Boyd, 2000).
An unconsolidated surficial layer of glacial till, loess, and Cedar River alluvium (alluvial aquifer)overlies carbonate bedrock of Devonian and Silurian age (bedrock aquifer) in the study area. Thealluvial aquifer typically consists of a sequence of coarse sand and gravel at the base, gradingupwards to finer sand, silt, and clay near the surface. The sand and gravel contain carbonate, shale,and ferro-magnesium rich rock fragments. The thickness of the alluvial aquifer ranges from about2 to 30 m. The alluvial aquifer is recharged by the infiltration of water from the Cedar River,precipitation, and seepage from the underlying bedrock and adjacent hydrogeologic units. In areasunder the influence of municipal pumping, groundwater flow is from the Cedar River toward thewell fields; in areas outside the influence of municipal pumping, groundwater flow is toward theCedar River. Results from a regional groundwater flow model indicated that approximately74 percent of the water pumped from the alluvial well fields is recharged from the Cedar River,approximately 21 percent is recharged from adjacent underlying hydrogeologic units, and approxi-mately 5 percent of the water is from infiltrating precipitation (Schulmeyer and Schnoebelen,1998). Currently, a more detailed groundwater model in the study area indicates that, in someplaces, up to 90 percent of the water pumped from the alluvial well fields is recharged from theCedar River.
The water quality in the alluvial aquifer within the well field has been characterized with samplescollected from both monitoring and municipal wells at various times since 1992 (Boyd, 2000;Schulmeyer and Schnoebelen, 1998; Schnoebelen and Schulmeyer, 1996). Calcium, magnesium,and bicarbonate are the dominant ions. In addition, nitrate, sulfate, silica, iron, and manganese arepresent in significant concentrations in certain wells or at certain times of the year. Previous work inthe Seminole well field indicated some detections of herbicides and their degradates (breakdownproducts) in shallow monitoring wells (3.8- to 6-m deep) completed in the alluvium as water movedfrom the river into the alluvial aquifer (Boyd, 2000). Atrazine was the most commonly detectedherbicide in this study. Acetochlor, cyanazine, and metolachlor were also detected, but at smallerconcentrations than atrazine. Acetanilide degradates were detected at greater frequencies and atgreater concentrations than their corresponding parent compounds. Fewer numbers of detections ofherbicide compounds were found in wells completed deeper in the alluvium.
The infiltration of water with large nitrate concentrations into the alluvial aquifer from the CedarRiver affects groundwater quality. Recent research was conducted along a flowpath to study RBFthrough a natural wetland area. Groundwater modeling helped locate the flowpath study. Thestudy examined the role of a natural wetland in reducing nitrate concentrations as water movesfrom the Cedar River. A real challenge for the Cedar Rapids Water Department is the increasingtrend of nitrate concentrations in the Cedar River. Nitrate concentrations in the Cedar Riverduring the spring are often more than 10 mg/L and can reach 20 mg/L. A 2- to 3-mg/L reductionin nitrate often occurs as water moves from the river to the well, but in some wells, this may notreduce nitrate concentrations below the 10.0-mg/L maximum contaminant level. Sampling inwells along a flowpath occurred quarterly over a period of about 4 years. A comparison of waterchemistry was made from water analyses from:
• The river.
• A monitoring well upgradient of the wetland area and river.
• Wells in the wetland area.
• Wells between the wetland area and river.
36

In addition, a comparison of water-chemistry data from a municipal well located near the wetlandarea and one located nearest the river were compared in terms of water chemistry from previoussampling work (Schulmeyer and Schnoebelen, 1998). Results show that nitrate concentrationswere 4 to 6 times lower in samples from monitoring wells completed in the wetland area than inthe Cedar River or groundwater in the upland area; however, iron and manganese concentrationsin samples from the monitoring wells in the wetland areas were an order of magnitude higherwhen compared to the river or upland well. Water samples from the wells and the Cedar Rivergenerally displayed similar trends (high in the spring and low in the fall), while iron and manganeseconcentrations were more variable.
As water moves from the river towards the monitoring wells, microorganisms obtain energy formetabolic processes by catalyzing the oxidation of organic matter with a progressive series ofreducing reactions (Stumm andMorgan, 1981). Nitrate can be reduced to elemental nitrogen (N2)by denitrification (Equation 1) or to ammonium (NH4+) by reduction (Equation 2). Sinceammonium was only detected in small quantities (less than 0.80 mg/L), denitrification most likelyis the predominant process.
4NO3– + 5CH2O + 4H+ = 2N2(g) + 5CO2 + 7H2O (Equation 1)
NO3– + 2CH2O + 2H+ = NH4
+ + H2O + 2CO2 (Equation 2)
Reduction then proceeds from nitrate (NO3–) to Mn+4, Fe+3, SO4
–2, CO2, and N2. The reducedforms of iron (Fe II) and manganese (Mn II) are more soluble in water and are more mobile thanoxidized forms (Hem, 1985) and, under anoxic conditions, are stable. As nitrate in groundwateris depleted, iron and manganese reduction begins. The reduction of Fe+3 to Fe+2 and Mn+4 toMn+2 from aquifer grain coatings can cause large concentrations of these ions in groundwater.Ferrihydrite and manganite (MnOOH) occurring as oxyhydroxide coatings on clay and siltparticles are the most likely oxidized forms of iron (Fe+3) and manganese (Mn+3 and Mn+4) in thealluvial aquifer. Oxidized forms of iron and manganese might occur in the aquifer as crystallineminerals, such as hematite (Fe2O3) and hausmannite (Mn3O4). Iron and manganese mayco-precipitate with carbonate minerals to cause well fouling.
Research in the Seminole well field indicates that the location of a well in or near natural wetlandareas may benefit from the natural reduction of nitrate concentrations, with the disadvantage ofincreased iron and manganese concentrations. Future expansions of the well fields may takeadvantage of natural wetland areas to help reduce nitrate concentrations. In Iowa, most wetlandshave been drained, but alluvial wetlands associated with bottomland forested and oxbow lakeareas may persist as they are subject to periodic flooding and are often not suitable for sustainedagriculture.
REFERENCES
Becher, K.D., D.J. Schnoebelen, and K.K.B. Akers (2000). “Nutrients discharged to the Mississippi Riverfrom Eastern Iowa Watersheds, 1996-97.” Journal AWWA, 36(1): 161-173.
Boyd, R.A. (2000). “Herbicides and herbicide degradates in shallow groundwater and the Cedar River neara municipal well field, Cedar Rapids, Iowa.” The Science of the Total Environment, 241-253.
Goolsby, D.A., andW.A. Battaglin (1993). “Occurrence, distribution, and transport of agricultural chemicalsin surface water of the Midwestern United States.” Selected papers on agricultural chemicals in water resources ofthe midecontinental United States, D.A. Goolsby, L.L. Boyer, and G.E. Mallard, compilers, U.S. GeologicalSurvey Open-File Report 93-418, p. 1-25.
37
Hallberg, G.R., D.G. Riley, J.R. Kantamneni, P.J. Weyer, and R.D. Kelley (1996). Assessment of Iowa safedrinking water act monitoring data, 1988-1995, Iowa City, University of Iowa Hygienic Laboratory ResearchReport 97-1, 132 p.
Hem, J.D. (1985). Study and interpretation of the chemical characteristics of natural water, third edition, U.S.Geological Survey Water-Supply Paper 2254, p. 264.
Kalkhoff, S.J., K.K. Barnes, K.D. Becher, M.E. Savoca, D.J. Schnoebelen, E.M. Sadorf, S.D. Porter, and D.J.Sullivan (2000). Water Quality in the Eastern Iowa Basins, Iowa and Minnesota, 1996-98, U.S. GeologicalSurvey Circular 1210, 37 p.
Schnoebelen, D.J., K.D. Becher, M.W. Bobier, and T.Wilton (1999). Selected nutrients and pesticides in streamsof the Eastern Iowa Basins, 1970-95, U.S. Geological Survey Water-Resources Investigations Report 99-4028,105 p.
Schnoebelen, D.J., and P.M. Schulmeyer (1996). Selected hydrogeologic data in the Cedar Rapids area, Bentonand Linn Counties, Iowa, October 1992 through March 1996, U.S. Geological Survey Open-File Report96-471, 172 p.
Schulmeyer, P.M., and D.J. Schnoebelen (1998). Hydrogeology and water-quality in the Cedar Rapids Area,Iowa, 1992-96, U.S. Geological Survey Water Resources Investigations Report 97-4261, 77 p.
Stumm W., and J.J. Morgan (1981). Aquatic Chemistry — An introduction emphasizing chemical equilbria innatural waters, second edition, Wiley-Interscience Publisers, New York, 780 p.
DOUG SCHNOEBELEN is a Research Hydrologist with the United States GeologicalSurvey and has worked on a variety of groundwater and surface-water projects over the last13 years. He has served as the groundwater specialist on the White River National WaterQuality Assessment project in Indiana and as the surface-water specialist for the EasternIowa Basins National Water Quality Assessment project in Iowa. In addition, he has beenthe Iowa District Water-Quality Specialist since 1994, and is an Adjunct Professor in theGeoscience Department at the University of Iowa. His research has focused on the use of
isotopes and bore hole geophysics in groundwater and, more recently, on the fate and transport of agriculturalchemicals in surface water and groundwater across eastern Iowa. In particular, he has focused on the fate andtransport of several pesticide degradate compounds. He has been involved with ongoing research in riverbankfiltration and geochemical modeling in the Cedar Rapids well field since 1999. Schnoebelen received a B.S.in Geology from the University of Iowa, an M.S. in Geology from the University of Tennessee, and a Ph.D.in Geology, with a minor in Environmental Science, from Indiana University.
38

Session 3: Hydraulic Aspects
The Use of Aquifer Testing and Groundwater Modelingto Evaluate Changes in Aquifer/River Hydraulics at theLouisville Water Company
David C. SchaferDavid Schafer & AssociatesStillwater, Minnesota
In 1999, the Louisville Water Company in Louisville, Kentucky, constructed a 20-MGD radialcollector well as part of a pilot study to evaluate using RBF to reduce treatment costs and to ensurehigh-quality water production. The water company currently withdraws up to a total of 240 MGDof surface water from theOhio River at the Zorn Pumping Station and B.E. PayneWater TreatmentPlant (both in Louisville, Kentucky), and is exploring ways to further improve water-supplyquality.
A primary objective of the pilot project was to identify processes that would meet or exceedexpected water-quality regulations. Considerations included:
• Removing synthetic organics.
• Reducing turbidity.
• Eliminating taste and odor during summer months.
• Attenuating water temperature extremes in the distribution system.
Although several options were evaluated (such as GAC and membrane filtration), RBF was theonly one that addressed all of the Louisville Water Company’s concerns.
In addition to evaluating water quality, a secondary objective was to assess aquifer/river hydraulicsand monitor the hydraulic performance over time to detect whether or not changes in capacityoccurred. Although it was not expected that the well structure would lose hydraulic efficiency,there was some concern that riverbed materials adjacent to the well could clog or compact inresponse to groundwater withdrawal.
The collector well was constructed about 120 ft from the shore of the Ohio River at the B.E. PayneWater Treatment Plant site. It incorporated a 16-ft inside diameter concrete caisson extending toa depth of about 105-ft below land surface. The caisson penetrated the glacial sand and gravelaquifer at the site, bottoming out on the underlying shale and limestone bedrock. Seven 12-inchdiameter stainless steel horizontal well-screen laterals were installed near the base of the sand andgravel aquifer — four laterals 240 ft in length and three 200 ft in length. The four longer lateralswere oriented toward the Ohio River, while the other three shorter laterals extended 1) upriver,2) downriver, and 3) away from the river.
39
Correspondence should be addressed to:
David C. SchaferPresidentDavid Schafer & Associates9955 North 101st Street • Stillwater, Minnesota 55082 USAPhone: (651) 762-8281 • Fax: (651) 762-8335 • Email: [email protected]

Two 10-MGD capacity pumps were installed to produce water from the collector well. A variable-frequency driver was used to power one of the two pump motors to allow the pumping plant toreadily adapt to changing flow and head requirements.
In addition to the collector well, about a dozen on-land piezometers were installed around thecollector well at distances up to 1,200-ft away. Also, a nested piezometer was installed about80-ft offshore, adjacent to the well site. The piezometers were used to monitor aquifer water levelsduring the testing and operation of the collector well to provide the data needed to quantifyaquifer characteristics.
Following well construction, a 70-day constant-rate pumping test was conducted at a pumping rateof 19.4 MGD. Water levels were monitored in both the collector well and observation wells. Themaximum drawdown observed in the collector well during the test was about 27 ft. The pumpingtest data were used to quantify hydraulic properties — transmissivity and river leakance — and toidentify baseline performance characteristics.
The data were analyzed by constructing a groundwater flow model of the site and adjusting modelinput parameters until the model faithfully replicated water levels observed during the pumpingtest. The USGS groundwater flow code, MODFLOW, was selected for the modeling study. Theaquifer and Ohio River were represented in a model grid covering an area 4,000 ft × 14,000 ft. Themodel domain was subdivided into 119 rows, 53 columns, and 8 model layers. The use of a largenumber of model layers permitted the realistic simulation of vertical resistance to groundwaterflow — both water exiting the river and entering collector well laterals. Results of the pumpingtest and modeling effort revealed an aquifer transmissivity of 204,000 gallons per day per foot anda river leakance of 2.35 inverse days at the prevailing groundwater and surface-water temperatures.
The collector well was used as the pumping well in five subsequent pumping tests conducted overa 3-year period from 1999 to 2002. Data from each pumping test were analyzed using groundwatermodeling to update the computed values of transmissivity and leakance. The prevailing groundwaterand surface-water temperatures were different for each test that was conducted. Because watertemperature affects flow characteristics, it was necessary to correct the results of each test fortemperature effects so that performance could be compared from one test to another.
In the model calculations, a simplifying assumption was made that leakance was constanteverywhere for any given model run. This simplification allowed a relative comparison of one testwith another. It is known that leakance declines in a non-uniform manner, with greater reductionnear the pumped well and less reduction away from the well; however, the exact nature ofleakance distribution is not known, and trying to estimate it with the available data would havebeen speculative. Therefore, the assumption of a single leakance value was made. The resultingleakance value can be thought of as an “effective leakance” for comparison purposes.
Throughout the period of testing, transmissivity remained constant while effective leakancedeclined steadily. Over time, the rate of leakance decline diminished and finally stabilized based onthe last pumping test conducted in July 2002, after nearly 3 years of well operation. Measuredleakance values, corrected for water temperature, are listed in Table 1.
River scour associated with a bank full-flood event in Spring 2002 may have contributed to theapparent stabilization (actually, a slight increase in leakance). The average measured leakance inJuly 2002, corrected to the same water temperature as the original pumping test, was about0.18 inverse days, more than an order of magnitude lower than the original leakance value.
40

The corresponding well capacity had declined by about a third in response to reduced riverleakance.
The reduction in river leakance is being evaluated on an ongoing basis, but is believed to becaused by clogging/compaction of riverbed sediments in response to collector well operation.Regular pumping tests and leakance evaluation will be continued in the future to further monitorthe effects of riverbed clogging and periodic river scour associated with flood events on the OhioRiver. The Louisville Water Company continues to do research in the area of riverbed cloggingand leakance reduction.
Hydrologist DAVID SCHAFER has over 30 years of experience in the groundwater industry.He has designed hundreds of high-capacity water supply wells, has analyzed hundreds ofpumping tests, and is consulted regularly on well development and rehabilitation procedures.In addition, he has done extensive groundwater modeling using numerical models, analyticelement models, and proprietary analytical models that he has developed. At present, he isPresident of his own company, David Schafer & Associates, which he founded in 1999.Schafer has published numerous articles on dewatering, well hydraulics, well development,
and well rehabilitation, and contributed a portion of the well hydraulics section of Groundwater and Wells,Second Edition. Schafer received both a B.S. in Mathematics and an M.S. in Computer Science from theUniversity of Minnesota.
41
Table 1. Measured Leakance Values
Date of Test Effective LeakanceData Acquisition (inverse days)
October 1999 2.35
March 2000 0.72
October 2000 0.25
April 2001 0.20
September 2001 0.15
July 2002 0.18

42

Session 3: Hydraulic Aspects
Plugging in Riverbank-Filtration Systems:Evaluating Yield-Limiting Factors
Stephen A. Hubbs, P.E.Louisville Water CompanyLouisville, Kentucky
The RBF process involves the passage of river water containing dissolved and suspended solidsthrough the sands and gravels of a connected aquifer. In this process, the removal of suspended solidsinvolves dynamics that are similar to slow sand filtration, with both biological filtration and physicalfiltration acting to remove particles. If the entrained particles are not removed, the hydraulicconductivity of the riverbed will decrease due to particles plugging the pores of the aquifer.
Work done at the LouisvilleWater Company in Louisville, Kentucky, and elsewhere have indicatedthat the bulk of particle removal takes place in the first few feet of the aquifer, which is consistentwith behavior in a slow sand filter. The dynamics of how a riverbed restores its filtration capacityare not fully understood. Anecdotal information from those operating large-capacity well fieldsindicates that these well fields require 3 to 5 years to “settle in” to their sustainable yield, whichis usually within 50 to 75 percent of the initial capacity of the well field. Recent research at theLouisville Water Company has focused on developing a better understanding of the dynamics ofriverbed plugging and predicting sustainable capacity from high-capacity RBF systems.
Predicting Sustainable Yield
The 20-MGD horizontal collector well at Louisville was constructed in 1999, and data on variousparameters have been collected since that time. These data have been analyzed by traditionalmodeling techniques (Schafer, 2003) and, more recently, by regression techniques, with thespecific interest of gaining more information about the process of riverbed plugging.
Data indicate a cyclic pattern in specific yield, assumed to be a function of water viscosity asimpacted by water temperature. Data also indicate a decreasing trend with time for specific yield.The possible causes of this decrease include:
• Plugging of the riverbed-aquifer interface.
• Decreased conductance of the bulk of the aquifer.
• Decreased conductance in the area of the well screen.
Various parameters from the entire 4-year database at the Louisville Water Company weresubjected to regression analysis, with specific yield as the dependent variable. Variables included:
• River stage.
• Water elevation in the collector caisson.
43
Correspondence should be addressed to:
Stephen A. Hubbs, P.E.Vice President, New TechnologyLouisville Water Company550 South Third Street • Louisville, Kentucky 40202 USAPhone: (502) 569-3675 • Fax: (502) 569-0813 • Email: [email protected]

• River and caisson water temperature.
• Time (linear), the square root of time, and natural log of time.
The influence of the driving head from the river was factored into the specific yield value bysubtracting river stage from water level in the caisson. This eliminated the need to carry a termfor river level in the analysis. Thus, the term for specific yield was defined from the data as:
(Well output in MGD)/(River stage – Caisson water level).
The square root of time was selected as a parameter based on the hypothesis that:
• Plugging of the aquifer was the result of the deposition of suspended sediment at theaquifer-riverbed interface.
• The rate of this plugging process would decrease as the recharge area extended fartherinto the river.
• A balance between plugging and riverbed scouring would eventually be established.
Subsequent analyses indicated that a better regression fit was realized when the natural log of timewas used as a parameter, as opposed to linear time or the square root of time.
When the entire data set was analyzed, it was apparent that typical trends were skewed duringtimes of flooding. The database was modified to exclude flooding periods and then re-analyzed.Results of this analysis are presented in Figure 1. The regression model provides a good fit withactual data, but varies the most at the initiation of pumping and during the period of Weeks 160to 180, following a significant flooding event.
It is suggested that the parameter of natural log of time in this analysis is a good surrogate for themeasure of plugging in the system. This analysis was extended to include an extrapolation of anadditional 5 years of data, with the insertion of “jumps” representing the impact of periodic
44
-0.300
-0.200
-0.100
0.000
0.100
0.200
0.300
0.400
0.500
0 20 40 60 80 100 120 140 160 180 200Period (week)
Spec
ificY
ield
(nor
mal
ized
tom
ean
of0.
491
MGD
/ft)
Actual Data Predicted Data
SpYield (MGD/ft) = (-0.013) + .0045 (Well Temp. F) + .0018 (River Temp F) - .095 (Ln (Time week))
R = 0.96F = 583
Specific Yield immediate followingflood event is greater than predicted
Period of flooding
Figure 1. Regression with Natural Log of Time (Cleaned Data)
Ln = Natural log.

riverbed scouring. This analysis shows the system stabilizing after 8 years of operation, with aspecific yield cycling between 0.25 and 0.4MGD/ft drawdown. This type of extrapolation is highlyspeculative, but fits anecdotal information on sustainable yields from high-capacity RBF systems.
Riverbed Shear Stress as an Indicator of Riverbed Scouring
Riverbed scouring plays an essential role in determining the sustainable yield in RBF systems. Theshear stresses exerted on the riverbed during periods of high flow provide for the transport ofriverbed materials and the re-suspension and transport of particles trapped during the RBF process.The extent of riverbed scouring can be estimated as a function of riverbed shear stress exertedduring high-flow events.
Streams typically exert higher riverbed shear stresses near headwaters, with decreasing stressesexerted near the terminus of a large water body (such as an ocean). This implies that riverbedscouring will decrease near the terminus of a stream, consistent with the formation of river deltas.Because of this tendency to deposit fine materials near the mouth of streams, these locations aretypically not well suited for high-capacity RBF systems.
Two techniques for estimating riverbed shear stresses were used in this analysis:
• Measured velocity profiles across the river cross-section.
• Stream-surface slope measurements.
The shear stresses exerted on a streambed can also be inferred by looking at the riverbed material intransport during high-flow events, as indicated by the particle-size distribution of riverbed sediments.
A compilation of particle-size data from the Ohio River in the Louisville area is presented inFigure 2. Data to the left represent suspended solids, while data to the center and to the rightindicate bed material. The river at the point where these data were collected is on a bend, with
45
SS -11/30/1979SS -6/10/1981SS-1/27/1982bed-1375' from KY bankbed-1650' from KY bankbed-1850' from KY bankbed-2000' from KY bankbed-2200' from KY bankbed-2500' from KY bankbed-2700' from KY bankbed-2900' from KY bankbed-3900' from KY bankbed-4120' from KY bankSS-6/2/82 mid-streamSS-6/2/82 Ind side
Particle Size
Perc
entP
assi
ng
Suspended Solids Indiana side Riverbed
Main channel and Kentucky side Riverbed
Flow = 301,000 to 434,000 cfsTSS = 482 to 698 mg/l
Flow= 239,000 cfsTSS=408-466 mg/l
0
20
40
60
80
100
120
0.001 0.01 0.1 1 10 100
Figure 2. Particle Size Distribution Analysis – Riverbed and Suspended Solids(USGS Data, 1979–1982, Ohio River at Louisville)
TSS = Total suspended solids. cfs = Cubic feet per second. SS = Suspend solids. KY = Kentucky. Ind = Indiana.

the Kentucky side of the river on the outside of the bend. The prevalence of courser material inthe riverbed on the outside of the bend reflects higher riverbed shear stress exerted at the outsideface of the bend.
These data indicate that the shear stresses exerted against the riverbed are capable of transportingriverbed media in the size range of 1 to 10 millimeters. According to available literature, thiswould require a streambed shear stress in the range of 5 Newtons per square meter.
Stream velocity profiles and stream surface slopes of the Ohio River at high flow conditions(383,000 cubic feet per second) were also secured from USGS. Velocity profile data were reporteddown to about 4 ft, the approximate limit of the acoustic doppler current profiler technology usedfor this data collection effort.
The velocity profiles used in this study for calculating boundary shear stress would be expected toreflect a maximum shear stress for any point in the river, as the velocity profile selected was theone with the highest velocity in the cross-section. The slope calculation technique, on the otherhand, would be expected to reflect an average boundary shear stress across both the cross-sectionand length of river selected for calculation. Comparable data sets for these two methods ofcalculation revealed that the velocity profile (using the manipulation yielding the greatest shearvelocity) provided a lower and less consistent estimate of boundary shear stress than did themethod based on measured stream slope. These data are summarized in Table 1 from a 2000 USGSdatabase:
The inconsistency and lower results from the stream profile calculations may be the results of thehigher degree of variability obtained from the acoustic doppler measurement technique forvelocity and, particularly, the inability for this technique to measure velocity at the lower portionsof the stream. It is also noted that video images of the riverbed indicated surface irregularities (or“pocks” on the river bottom). These depressions would be expected to change the velocity profileas compared to a theoretical surface where friction is exerted by media roughness only.
The slope-calculated shear stress values, on the other hand, were consistent and logical for all ofthe measured values. The higher stream flows were associated with higher shear stresses, and shearstresses tended to be greater where the river was deeper and narrower.
The data from the Ohio River were compared to data from the Rhine River. The maximumboundary shear stress observed on the Ohio River during the high-flow event was7.5 Newtons per square meter. This compares to the average shear stress of the Rhine River of10 Newtons per square meter, as reported by Schubert (2002).
46
Location Profile-Calculated Shear Stress Slope-Calculated Shear Stress(N/m2) (N/m2)
12 Mile Island 1.63 3.21
BEPWTP 1.68 5.33
Zorn Avenue 5.79 5.62
Table 1. Comparison of Shear Stress Calculation Methods at Three Locationsin the Ohio River Near Louisville
BEPWTP = B.E. Payne Water Treatment Plant. N/m2 = Newtons per square meter.

REFERENCES
Schafer, D.C. (2003). “The Use of Aquifer Testing and Groundwater Modeling to Evaluate Changes inAquifer/River Hydraulics at the Louisville Water Company.” Program and Abstracts, Second InternationalRiverbank Filtration Conference, G. Melin, ed., National Water Research Institute, Fountain Valley.
Schubert, J. (2002). “Hydraulic aspects of riverbank filtration: Field studies.” Journal of Hydrology, 266 (3-4):154-161.
STEVE HUBBS is a Professional Engineer with 28 years of experience at the LouisvilleWater Company in Louisville, Kentucky. In the early 1980s, he began researching riverbankfiltration as an alternate source of water for the Louisville Water Company, specificallylooking at the reduction in disinfection byproduct precursors, river-borne organics, andmutagenicity in the riverbank-filtration process. His work continued in the 1990s with afocus on pathogen reduction, and his research is now being conducted on the hydraulicconnection between the riverbed and the aquifer, with a focus on riverbed plugging
dynamics and their influence on sustainable yields from high-capacity riverbank-filtration systems. Hubbsreceived an M.S. in Environmental Engineering from the University of Louisville, and is currently enrolledin the Ph.D. program in Civil and Environmental Engineering at the University of Louisville, focusing onthe hydraulics of riverbank-filtration systems.
47

48

Session 3: Hydraulic Aspects
Application of Different Tracers to Evaluatethe Flow Regime at Riverbank-Filtration Sitesin Berlin, Germany
Dr. Gudrun MassmannFree University of BerlinBerlin, Germany
Dipl. Geol. Andrea KnappeAlfred-Wegener-Institute PotsdamPottsdam, Germany
Doreen RichterFree University of BerlinBerlin, Germany
Dr. Jürgen SültenfußUniversity of BremenBremen, Germany
Prof. Asaf PekdegerFree University of BerlinBerlin, Germany
Introduction
The inhabitants of metropolitan Berlin (Germany) rely on drinking water derived from groundwaterwithin the City’s boundary. Production well galleries are generally located adjacent to the surface-water system and artificial infiltration ponds, and around 70 percent of abstracted groundwater isestimated to originate from bank filtration and artificial groundwater recharge (Pekdeger andSommer-von Jarmerstedt, 1998). Berlin’s water production is a semi-closed water cycle with anindirect potable reuse system: local wastewater treatment plants discharge treated effluent into thesurface-water system (Figure 1). Induced by well abstraction, surface water infiltrates into theground and is used for drinking-water production. The raw water requires only minimal treatmentto ensure good drinking-water quality. After use, water is redirected into wastewater treatmentplants and released into the surface-water system again after treatment. Hence, the quality of theraw water is influenced by a number of factors, including:
• Temporal and spatial variations of surface-water quality, largely depending on location inrelation to wastewater treatment plants.
• Presence, permeability, and thickness of the colmation layer.
• Lithology, permeability, and geochemistry of the aquifer sediment.
• Nature of the wells (location, length, and depth of filter screens).
49
Correspondence should be addressed to:
Dr. Gudrun MassmannScientific ColleagueFree University of BerlinHydrogeology Group • Malteserstr. 74-100 • 12249 Berlin GermanyPhone: +49-30-83870472 • Fax: +49-30-83870742 • Email: [email protected]

• Hydraulic regime resulting from natural gradients and pumping performances.
• Water-quality changes that occur during bank filtration.
A major advantage of the application of bank filtration is the capability of the subsurface toremove contaminants during underground passage, either by physical filtration and/or (bio)chemicalprocesses, such as adsorption, reduction, or degradation. In addition, the application of bankfiltration spares natural groundwater resources, which inhibits the rise of deeper, more salinegroundwater into local freshwater aquifers; however, since a proportion of the surface water inBerlin originates from treated effluent released by wastewater treatment plants, it is necessary toconstantly monitor the fate of potential contaminants during bank filtration.
Processes accompanying bank filtration and artificial recharge are currently studied in Berlinwithin a multidisciplinary cooperative project at the Berlin Centre of Competence called Naturaland Artificial Systems for Recharge and Infiltration (NASRI) (KWB, 2002). The project focuseson the behavior and removal of, for example, pathogens, microcystins, and organic pollutants, aswell as pharmaceutically active compounds, during underground passage. To interpret thebehavior of these non-conservative water constituents, the local hydrogeological and hydraulicsituation has to be well understood. Three field sites are the focus of current investigations, all inthe western part of the City (see Figure 1). Two sites are located next to natural lakes (TegelerSee/Tegel Lake and Wannsee/Wannsee Lake) and one next to an artificial recharge pond (GWATegel). Only examples of the Wannsee Lake site will be discussed.
Several tracers have been successfully applied in Berlin for various purposes. Some of these areuseful to study water movement and derive mean residence times (e.g., delta deuterium [δD],delta oxygen 18 [δ18O], temperature [T], chloride [ C1–]), while others may be particularly usefulin identifying the proportion of treated wastewater in surface water (e.g., boron [B], Cl–, δD, δ18O)or the proportion of either bank filtrate (e.g., ethylenediaminetetraacetic acid [EDTA], galdolinium[Gd], strontium [Sr]) or deeper saline groundwater (e.g., B, Cl-, sodium [Na+]) in raw water.
50
Figure 1. Overview of the surface-water system, flow directions, waterworks, wastewater and surface-watertreatment plants, and study sites in the western part of Berlin.
flow direction waterworks sewage treatment plant surface water treatment plant transect / field site weir lock
Legend
TS Tegeler See
TS GWA Tegel
TS Wannsee
SpandauCharlottenburg
Unterschleuse
WW Stolpe KW Schönerlinde
Tegele
r See Tegeler Flieβ
WW Tegel
PEA-Tegel
WW SpandauWW Jungfernheide
KW Ruhleben
WW Tiefwerder
WW und PEA Beelitzhof
WW Kladow
Nordgraben
Pank
e
Spree
Landwehrkanal
Have
l
Telfow
kanal (KW Marienfelde)
KW Stahnsdorf
Kleinmachnow
input summer KW Ruhleben

Methodology
Transects generally reach from the lake or artificial recharge pond to a production well parallel tothe flow direction. These transects contain a number of observation wells, usually one below thelake, some between the lake and production well, and some beyond the well. A brief overview onthe analysis discussed here is given in Table 1.
The T-He age dating method uses the ratio of the concentration of radioactive tritium (3H or T)derived from atmospheric nuclear bomb testing and its decay product, Helium (3He), ingroundwater to determine a groundwater age (i.e., the time passed since water had its last contactwith the atmosphere).
In case the abstracted water is a mixture of surface water and background groundwater only, thepercentage of bank filtrate in the well (X) can be calculated as:
X = [Cw–CGW)/(CSW–CGW)]•100 [%]
With C as the concentration of a suitable tracer in groundwater (CGW), well water (Cw), or surfacewater (CSW).
The simple mixing formula can be used under the premise that the differences between groundwaterand surface water are large and relatively stable, and well water is a mixture of two water componentsonly.
Results
Surface-Water System
The strain on surface water becomes larger as it flows through the City and is substituted byconsiderable amounts of treated wastewater. The wastewater influence provokes highconcentrations of, for example, Cl–, B, anthropogenic Gd, high conductivities and temperatures(in winter), and more negative isotope signatures. The highest influence and largest fractions oftreated wastewater can be seen in the Teltow Canal and Nordgraben (a ditch). The Havel River
51
Table 1. Overview of Analytical Methods
Parameter Analytical Method Laboratory Details Provided In
4He, 20Ne, Mass Spectrometry Institute of Environmental Physics, Sültenfuß et al.and 22Ne Pfeiffer QMG 112 University of Bremen (in preparation)(Age Dating)
3He and 4He Mass Spectrometry Institute of Environmental Physics, Sültenfuß et al.(Age Dating) MAP215-50 University of Bremen (in preparation)
Cl– Photometry Free University of Berlin(Autoanalyser,Technicon)
B ICP-OCE Free University of Berlin
δ2H, δ18O Delta S MS Alfred-Wegener-Institute, Meyer et al. (2000)Potsdam
EDTA DIN 38413-PO3 Berlin Water Works
4He =Helium 4. 20Ne =Neon 20. 22Ne =Neon 22. 3He =Helium 3. 4He =Helium 4. ICP-OCE= Ionic Coupled Plasma.

contains the lowest concentration of wastewater indicators. For example, Figure 2 shows theB concentration and the proportions of treated wastewater in surface water in September 2002. Theinfluence of the Nordgraben extends to transect Tegel Lake, while the field site Wannsee Lake isunder the influence of the Teltow Canal. The percentage of treated wastewater is higher duringthe summer months, when the Ruhleben Treatment Plant discharges into the Teltow Canal.
By combining the results of the discharge measurements with the concentrations of wastewaterindicators, proportions of treated wastewater can be calculated with a mixing formula for eachsampling point. In Figure 3, results are shown for Tegel Lake in front of the transect. In October2001, a pumping device started operation, which pumps Havel River water into the PEA-Tegel, aphophate elimination plant (see Figure 1), when the natural discharge of the Nordgraben is verylow in summer. This led to a strong decrease of treated wastewater in Lake Tegel near the transect(from 33 to 46 percent [Fritz, 2002] to an average of 11.7 +/– 1.9 percent). For surface water neartransectWannsee Lake, values of 20.1 percent in the summer (when Ruhleben discharges into theTeltow Canal) and 8.5 percent in the winter were calculated.
Bank-Filtration System (Wannsee Lake)
At Wannsee Lake, two transects exist, running perpendicular to the shore of Wannsee Lakebetween drinking-water Production Wells 3 (TS Wannsee 2) and 4 (TS Wannsee 1). The wellsof the local gallery (Beelitzhof) have several filter screens in different porous aquifers separated byaquitards. A schematic overview is given in Figure 4. Also shown are the T and 4He concentra-tions originating from hydrogen bomb testing in the 1960s, as well as uranium and thorium decaywithin the aquifer. In the two deeper aquifers, groundwater is considerably older than 50 years,since T is already decayed and the 4He values are high. In contrast, the shallow wells reflect thepresent atmospheric concentrations of T, while 4He could not be detected. The resulting age is lessthan the detection limit of 3 months. The production well is a mixture of all aquifers.
52
Figure 2. (a) Percentage of treated wastewater in surface water (calculated with discharge only; evaporation,storage changes, and precipitation neglected). (b) Boron concentration indicating the influence ofthe Teltow Canal in the south and Nordgraben in the northeast for September 2002.

Mean residence times are estimated with the help of (for example) δD and δ18O breakthroughcurves. The surface water shows a clear seasonal signal, with more negative signatures in winter(Figures 5a and 6). The exemplary breakthrough curves of Observation Wells 3,337 and 3,335(see Figure 4) reflect the surface-water signal. Here, groundwater is made of bank filtrate only. Thecurves illustrate that residence times are rather low at this particular site. Travel times are around1 month on the distance from the lake to Observation Well 3,337, which is approximatelytwo-thirds of the way to the production well. Well 4 does not show a seasonal signal and has a morenegative signature.
53
Figure 3. Percentage of treated wastewater calculated with B and Cl for surface water in front of transectTegel Lake.
Figure 4. Tritium and terrigenic 4He in different observation wells and Production Well 4 of TS Wannsee 1.
3339
3338
3337
BEE201OP
BEE201UP
BEE200UP
BEE200OP
3332m belowground
W E
m abovesea-level
3336
33343335
Brunnen4

Estimates of the proportion of bank filtrate in the production wells can be made with substancesthat are only present in bank filtrate. For example, EDTA concentrations are below the detectionlimit in all deeper observation wells, as well as in those inland of the wells. Figure 5b shows theEDTA time-series in surface water and Production Well 4, as well as in adjacent Wells 3 and 5.While EDTA is rarely detected in low concentrations in Well 4, concentrations are relatively
54
Figure 5. (a) Time series of δ18O in lake water, shallow observation wells, and Production Well 4. (b) Timeseries of EDTA in the lake and Production Wells 3, 4, and 5.
–6
–7
–8
–9
7
6
5
4
3
<2
Mai
02
Jun02
Jul0
2
Aug
02
Sep02
Nov
02
Dez
02
Jan03
Feb03
Mar
03
Apr
03
Mai
03
δ18 O
[0⁄ 00
versus
Stan
dard
MeanOcean
Water]
EDTA
[ µg/L]
Sampling Campaign
Mai
02
Jun02
Jul0
2
Aug
02
Sep02
Okt
02
Nov
02
Dez
02
Jan03
Feb03
Sampling Campaign

similar in the lake andWells 3 and 5.Mixing calculations assuming a residence time of 1 to 2monthsresult in an average percentage of bank filtrate of 61 to 97 percent in Well 3, 10 to 47 percent inWell 4, and 88 to 96 percent in Well 5. The large variations are mainly due to the detection limitof 2-µg/L EDTA, which results in uncertainties in the actual concentrations of Well 4 andbackground groundwater. An evaluation of other tracers suggest that the proportion of bankfiltrate in Well 4 is more likely to be in the order of magnitude of 10 percent.
The differences between the water bodies become clear in the plot of δD versus δ18O (Figure 6),where Well 4 plots next to the deeper aquifer samples. In contrast, Well 3 and Well 5 plot withinthe surface-water samples (just like the shallow observation wells), but show less seasonal variation.
Conclusions
The combination of different tracers enables the interpretation of the flow regime at sites wherebank-filtration processes are currently studied in Berlin. With the help of T/He analysis, the agesof different water bodies can be estimated. The analysis of tracers showing distinct seasonalvariations is used to estimate travel times, while water constituents — which are either mainlypresent in bank filtrate or background water — are used for mixing calculations. The results of thetracer studies can be used to interpret the fate and behavior of potential contaminants (e.g., drugresidues, organic pollutants, etc.).
55
Figure 6. δD versus δ18O at the Wannsee Lake field sites. Analysis of deeper aquifer samples was done fromSeptember 2000 to November 2001, with remaining data from May 2002 to March 2003.
–46
–48
–50
–52
–54
–56
–58
–60
–62
–64
–66
–68
–70
–9 –8 –7 –6 –5
δD[0⁄ 00
versus
Stan
dard
MeanOcean
Water]
δD [ 0⁄00 versus Standard Mean Ocean Water]
Feb 03
Jan 03Mar 03
Dec 02
May 02
Nov 02
Jun 02
Jul 02Aug 02
Sep 02

Acknowledgements
We would like to thank the German Research Foundation, Veolia Water, and the Berlin WaterCompany for financing the NASRI Project.
REFERENCES
Fritz, B. (2002). Untersuchungen zur Uferfiltration unter verschiedenen wasserwirtschaftlichen, hydrogeologischenund hydraulischen Bedingungen, Ph.D. Thesis, University of Berlin, Berlin, 203 pp.
KWB (2002).NASRI Natural and Artificial Systems for Recharge and Infiltration, First Progress Report, reportingperiod May 2002 – December 2002.
Pekdeger, A., and C. Sommer-von Jarmerstedt (1998). Einfluß der Oberflächenwassergüte auf die Trinkwasser-versorgung Berlins, Forschungspolitische Dialoge in Berlin, Geowissenschaft und Geotechnik, Berlin, pp. 33-41.
Meyer, T., L. Schönicke, U. Wand, H.W. Hubberten, and H. Friedrichsen (2000). Isotope studies of hydrogenand oxygen in ground ice – Experiences with the equilibration technique, Isotopes Environ. Health Stud., p 133-149.
Sültenfuß, J., G. Massmann, and A. Pekdeger (in preparation). Datierung mit der He3-T-Methode am Beispielder Uferinfiltration im Oderbruch.
GUDRUN MASSMANN studied Geology at both the Universities of Bremen andEdinburgh, specializing in Hydrogeology. After receiving her Diploma, she worked as anoccupational trainee at the Center for Groundwater Studies at the CommonwealthScientific & Industrial Research Organization (CSIRO) Land and Water in Adelaide,Australia, gaining experience on Artificial Storage and Recovery. For the past 4 years, shehas worked as a scientific colleague for the Hydrogeology Group of the Free University ofBerlin. Her research interests include hydraulic modeling, hydrochemistry, tracer analysis,
and isotopes. Massmann finished her Ph.D. in summer 2002 at the Free University of Berlin on a projectdealing with evaluating and modeling hydraulic and hydrochemical processes accompanying bank filtrationin a polder region in Germany. She then continued to word on bank filtration, but changed the field site toBerlin, where bank filtration plays an important role in drinking-water production.
56

Session 4: Siting
Siting and Testing Proceduresfor Riverbank-Filtration Systems
Samuel M. Stowe, P.G., CPGInternational Water Consultants, Inc.Columbus, Ohio
Phased, multi-tasked investigations can be structured to collect pertinent data to evaluate yield,quality, and (ultimately) the design of RBF systems. The initial phase should:
• Define project objectives (yield, quality, water use).
• Identify project concerns (treatment and regulatory issues).
• Collect available data for preliminary hydrogeological screening/feasibility.
If the initial phase indicates a reasonable probability that potential favorable conditions exist(given project objectives), then subsequent phases can be designed to collect site-specific data forcomprehensive analysis. Subsequent phases should include:
• Test drilling.
• Hydraulic interval testing.
• Water-quality screening.
• Streambed characterization.
• Water-level monitoring.
• Detailed aquifer and water-quality testing.
The key parameters to any RBF evaluation are aquifer transmissivity and streambed permeability.A good understanding of these parameters, along with the hydrogeological setting, will result inthe proper evaluation of the expected yield and quality of a RBF system and will allow for thethorough evaluation of potential means of development. Understanding the ability of the aquiferto provide sufficient RBF to recharge water pumped from a RBF system is key to ensuring thatlong-term capacities can be sustained and that target water quality can be maintained through abalance of infiltrated surface water and groundwater.
Two case studies are presented to provide examples of recent RBF investigations. One is for alow-yield system (1.0 MGD), with very difficult access conditions in New Mexico, where rafts,helicopters, and portable drilling equipment were used. The other is a high-yield system(50 MGD) along a large river in the Great Plains, where more standard access and drilling methods(rotary, rotosonic) were used.
57
Correspondence should be addressed to:
Samuel M. Stowe, P.G., CPGPresidentInternational Water Consultants, Inc.6360 Huntley Road • Columbus, Ohio 43229 USAPhone: (614) 888-6263 • Fax: (614) 888-9208 • Email: [email protected]

Phase 1 Investigations
Once the project objectives have been adequately defined, existing data that pertain to thehydrogeology and hydrology of the region of interest should be collected, assimilated, and assessed.This research should focus on the feasibility of developing the required capacity fromunconsolidated deposits. Information collected for evaluation would include:
• Well logs.
• Bridge boring logs.
• Steam flow and quality data.
• Records of production wells for other water utilities in the region.
• Reports on file with state or local agencies.
• Other information that pertains to the hydrogeological setting of the area.
Additionally, sites that are identified as potentially favorable should be visited and inspected.Phase 1 findings should include the following:
• Listings of the available data reviewed and other resources used.
• Discussions of the data and results of any preliminary analyses that were possible, with theconfidence level of data obtained.
• Identification of areas that appear to have a favorable potential for testing.
• Preliminary rankings of prospective sites, with a discussion of relative advantages anddisadvantages for siting.
• Evaluations regarding water quality that may be expected from a RBF system located inthis area, considering depth, proximity to the river, other regional water-quality problemsexperienced, and local features that may impact quality, etc.
• Assessment of permits that may be required for installation and withdrawal using aRBF system.
• Descriptions and budgets for work procedures recommended to be completed insubsequent phases.
Phase 2 Investigations
Phase 2 tasks would include drilling, sampling, and testing exploratory borings/observation wellsat sites identified in Phase 1. Given logistics and site layouts, surface geophysical surveys (seismic,electrical resistivity, electromagnetic) could precede actual drilling. Geophysical surveys can behelpful in preliminary screening activities. These sites would be selected based upon access (landownership, permission, etc.) and the potential for favorable saturated aquifer thicknesses near theriver. The primary objective of this Phase is to locate the most favorable site(s) for detailed aquifertesting (Phase 3) and the collection of data for hydraulic and quality evaluations for site ranking.
The selection of appropriate drilling and sampling methods are imperative during this phase.Drilling methods should consider:
• Representative soil samples.
• Expected drilling conditions (materials, depths).
• Rate of advancement (timely drilling).
• Cost-effectiveness.
58

• Potential for hydraulic testing and water-quality sampling.
• Site access conditions.
• Monitoring well installation.
Potential drilling/sampling methods include:
• Hollow stem auger with split-spoon sampling.
• Cable tool with bailed samples.
• Direct rotary with wash and split-spoon sampling.
• Rotosonic with dual-tube continuous sampling.
• Reverse rotary with wash samples.
Generally, it has been found that rotosonic drilling provides the best overall results for represen-tative soil sampling, speed, water sampling, and hydraulic testing. Drawbacks have been costs andaccess. In the rotosonic drilling method, a drill casing is advanced into the ground usingrotary/vibrasonic techniques. This method does not require the use of drilling mud, so there is nomud to dispose of, and ground-surface disturbance is minimal. The rotosonic drilling methodproduces nearly continuous samples of the materials penetrated by the sample tube, and themethod produces representative samples from unconsolidated, granular deposits.
Sieve analyses should be performed on selected lithologic samples collected from test borings todetermine optimum well-screen design and to help evaluate hydraulic conductivity. Hydraulicinterval testing can also be conducted on test borings to determine the hydraulic conductivity ofselected intervals and to evaluate groundwater quality.
Following the collection of all field data, the data are compiled and analyzed to determine themost favorable locations for detailed aquifer testing (Phase 3). This determination is based uponsaturated thicknesses, hydraulic conductivities, and logistics. From Phase 2 results, it can bedetermined with a reasonable degree of certainty that one or more of the sites tested is capable ofyielding the desired quantity of water.
Phase 3 Investigations
At the completion of Phase 2, if results are favorable, a site (or sites) for detailed aquifer testing isselected. Phase 3 studies generally include the installation of additional observation wells forsampling subsurface materials, monitoring water levels, and conducting a detailed aquifer test,along with a test pumping well. Additionally, the evaluation of streambed conditions (width,depth, permeability) is generally conducted during this phase.
Observation wells are positioned in a pattern around the test pumping well at appropriate locationsand distances selected to facilitate data analysis, with emphasis on RBF. Following the installationof observation wells, a temporary test pumping well is installed. It is important that the testpumping well be constructed to produce enough water to adequately stress the aquifer. Well pointscan be installed in the river (conditions permitting) to further evaluate streambed permeability.
The monitoring of water levels in the wells and river should be conducted prior to any pumpingto evaluate antecedent trends and the correlation of stream level and groundwater levels, withlevels converted to elevation datum for analysis. Following the collection of background waterlevels, a long-term (2- to 10-days) constant rate test is conducted. A general guideline is to runthe test 24 hours after steady-state conditions are reached. At the conclusion of the test, the
59

pumping is discontinued and the recovery of water levels is monitored until at least 90-percentrecovery is obtained in the observation wells. During the test, samples of the water pumped (andriver) can be obtained for laboratory analyses. Additionally, the pump discharge should bemonitored every 6 to 12 hours and river quality every 24 hours for field screening of temperature,pH, iron, hardness, turbidity, and specific conductance.
All data from Phase 3 are analyzed to determine aquifer properties, streambed permeability, aquifercharacter, yield, anticipated quality, and conceptual RBF system design. Yield estimates shouldconsider the impacts of river stage/flow and water temperature variations. Based upon the results,the preferred location of a RBF system can be recommended based upon an evaluation of benefitsand drawbacks, including refinements in design. Phase 3 testing may also identify additionaltesting that may be necessary to finalize design.
Case Studies
Two case studies are briefly discussed to illustrate the phased approach to siting RBF systems andcritical evaluation items. Case Study Number 1 was completed in north-central New Mexico alongthe Rio Grande (Figure 1), where difficult access conditions presented challenges for completionusing conventional approaches. Project objectives were to locate a site that could yield at least1.0 MGD of infiltrated surface water from the Rio Grande for potable use (surface-water rights to1,200 acre-feet per year). Phase 1 studies (literature review, site reconnaissance) identified up tosix potentially favorable sites within the canyon. Given difficult site access, the initial Phase 2 studyinvolved surface geophysics (electrical resistivity) at the six locations, along with a control site.Access to the sites was obtained using an all terrain vehicle and rafts, with base camps set up forovernight stays. Based upon the survey, two sites were selected for test drilling.
Drilling was conducted using a portable modular core rig with wash samples and 2-inchoutside-diameter split-spoon samples. At Site A, nine borings were drilled, six 1.5-inch diameterobservation wells installed, and hydraulic testing (high-efficiency suction pumps) completed. Asresults were favorable, Phase 3 aquifer testing was completed with additional observation wells anda 66-hour constant rate test (0.144 MGD).
Following the completion of testing at Site A, the equipment and base camp were mobilized toSite B using rafts and a helicopter. Phase 2 testing included the drilling of four borings, interval
60
Figure 1. Rio Grande Valley, New Mexico.

testing, and a short constant rate test. As results here were not as favorable as at Site A, detailedaquifer testing was not completed.
Case Study Number 2 was completed along the Missouri River in North Dakota (Figure 2), wheremore conventional investigative methods could be used. Project objectives were to locate a sitethat could yield up to 50 MGD of potable water from a RBF system. The study was beingcompleted to evaluate the possibility of replacing an existing direct surface-water intake. Phase 1investigations (desktop study, site visit) determined that several sites existed within the area,which were promising. Phase 2 investigations were targeted at two sites, given the primarylogistical concern of distance from existing treatment. Phase 2 included the drilling of threeborings and conducting one hydraulic test using rotosonic methods.
Given favorable Phase 2 results, Phase 3 investigations were completed at one site with theinstallation of four additional observation wells and a test pumping well. Because of budgetconcerns, Phase 3 drilling was completed using mud rotary methods and a local drilling contractor.Testing was completed with the running of a 72-hour constant rate test (1.9 MGD). The analysisof data indicated a transmissive aquifer (40,000 square feet per day) in good communication withthe river. Preliminary results indicate that the site will yield 30 MGD from a single horizontalcollector well.
SAM STOWE is President of International Water Consultants, Inc., a subsidiary ofCollector Wells International, Inc. A hydrogeologist, Stowe has nearly 30 years of diverseexperience in the groundwater industry. He has been in charge of projects involvingaquifer-test analyses, riverbank filtration and recharge evaluation, groundwater quality,well design, groundwater management, numerical modeling, contamination investigation,and remedial action. He has also been involved in groundwater-supply projects for yieldsof nearly 100 million gallons per day and in contamination evaluations ranging from
industrial organic pollution from landfills to the environmental effects of strip and deep-coal mining. Inaddition, Stowe is highly experienced in evaluations of induced infiltration potential from streams andoceans. He has completed hundreds of hydrogeological evaluations for horizontal collector wells in regard toyield, quality, and design, having been responsible for siting and designing many horizontal collector wellswith individual yields ranging from 2 to 40 million gallons per day and is a recognized expert in theirapplication. Stowe received a B.A. in Geology from Miami University and an M.S. in Geology from OhioState University.
61
Figure 2. Missouri River Valley, North Dakota.

62

Session 4: Siting
Water-Quality Management for Existing Riverbank-Filtration Sites along the Elbe River in Germany
Prof. Dr.-Ing. Thomas GrischekUniversity of Applied Sciences DresdenDresden, Germany
Introduction
In former times, the management of RBF sites in Germany focused on water quantity — how muchwater could be abstracted and what groundwater levels would result. Control measures were basedon measurements of river and groundwater levels and pumping rates and on black-box models toestimate the portion of riverbank filtrate abstracted (e.g., Luckner and Nestler, 1982). Thedevelopment of computer programs for groundwater flow and transport simulations resulted inincreasing management applications for RBF sites (e.g., Koster et al., 1994; Heinzmann, 1998;Eckert et al., 2000).
The number of published papers dealing with the complex management of water quality at RBFsites is very low. Besides work done by Sontheimer (1991) and Schubert (1999) at sites along theRhine River, a control and management concept for the Hengsen site on the Ruhr River(Schöttler and Sommer, 1992) must be highlighted. At the end of the 1980s, water-qualitymanagement also became a subject for RBF sites on the Elbe River due to problems with river andraw-water quality. Initial work done by Müller, Schwan, and others between 1985 and 1989 wascontinued by Nestler et al. (1998).
Water-quality management must be based on detailed knowledge of groundwater flow conditionsand monitoring measures to obtain sufficient data on water quality; however, this is not the casefor every site. Of course, for small waterworks, such investigations and investments may be higherthan the cost savings resulting from water-quality management. But, the optimization of waterabstraction can have long-term effects on raw-water quality and treatment cost savings. Water-quality management systems are well established at sites where problems with contamination haveoccurred (e.g., high concentrations of nitrate, organic halogens). In such cases, experiences maynot be published to give the impression of a “no problem waterworks” or because a cleardescription is not easy due to the large amount of data needed to understand the complex systemand site-specific boundary conditions.
General Water-Quality Management Measures
The first step in water-quality management is to clarify which advantage of RBF is the mostimportant and to identify the main aims or problems. At one site, the nitrate concentration in theraw water should be decreased; at another site, the concentration of DOC, dissolved iron, or anorganic contaminant should decrease.
63
Correspondence should be addressed to:
Prof. Dr.-Ing. Thomas GrischekProfessorInstitute for Geotechnics & Water SciencesUniversity of Applied Sciences Dresden • Friedrich-List-Platz 1 • 01069 Dresden, GermanyPhone: +49 351 4623350 • Fax: +49 351 4623567 • Email: [email protected]

Water-quality management could include:
• Optimization of the operation of existing abstraction wells.
• Building additional abstraction wells.
• Technical measures in the riverbed.
• (Political) activities to improve river-water quality.
• Contracts with farmers to change land use in a catchment zone.
This paper focuses on the operation of existing wells affected by mixing processes in an aquifer,flow times and flow path lengths, and the catchment area for landside groundwater. Specialmeasures to face problems resulting from contaminant shock loads in a river, as well as droughtsor floods, are not covered because these are the subjects of other contributions in this volume.
Strategies based on the operational control of existing abstraction wells could include:
• Well operation to achieve a maximum volume of utilized aquifer (long flow paths andretention times).
• Preferential operation of selected wells with best raw-water quality.
• Operation of a limited number of wells with high abstraction rates to increase theproportion of bank filtrate in raw water.
• Continuous operation of selected wells to meet the mean water demand and additionaloperation of other wells in peak periods.
• Periodic operation of wells to increase the effects of dispersion and mixing in the aquifer.
An additional technical measure could be a change of the well filter length and depth in anaquifer.
Riverbank Filtration along the Elbe River
At present, there are eight water facilities along the Elbe River that use RBF to supply more than1.5-million people with drinking water and industry with process water. Three of these sites havebeen chosen to carry out further investigations on water-flow and water-quality changes duringRBF, especially due to the changing water quality of the Elbe River in the 1990s. Between 1992and 2002, different research programs focused mainly on the behavior of DOC, EDTA, sulfurorganic compounds, and carbonic acids. Besides this specialized research, daily problems amongwater companies were investigated.
All RBF sites along the Elbe River are operated under anoxic conditions. Reducing conditionsresult in the dissolution of iron and manganese along the flowpath between the river andabstraction wells. At some sites, denitrification occurring during RBF was found to compensate forhigh nitrate concentrations in groundwater from other sources.
Due to the closure of large industries and a new water pricing system after the reunification ofGermany, water demand decreased significantly between 1989 and 1998. Lower abstraction ratesfor bank filtrate and an improvement in river-water quality allow for efficient groundwatermanagement and the optimization of pumping schemes to obtain good raw-water quality.
64

Torgau Case Study
The highly productive RBF scheme near Torgau in Saxony, eastern Germany, is situated within theElbe River Basin. The basin is filled with Pleistocene deposits to a depth of 10 to 55 m that compriseinterfingered glaciofluviatile sediments ranging from fine sand and silt to medium sand and gravel(Grischek et al., 1998). The deposits are overlain by Holocene river gravels (5- to 8-m thick) andmeadow loam (2-m thick). The hydraulic conductivity values range from 0.6-2 × 10⁻³ m per second.The Elbe River is in direct hydraulic contact with the aquifer. Riverbed clogging is low. The RBFsystem consists of 42 vertical wells arranged in nine well groups (Figure 1) and has a capacity of150,000 m3/d. The distance between abstraction wells and the riverbank is about 300 m. The flowtime of bank filtrate is between 80 and 300 days. The wells have a 20-m long filter placed in thelower layer of the aquifer at 30- to 50-m below ground surface. The site is well equipped with twosampling profiles along flowpaths between the river and abstraction wells, with monitoring wellsin the landside catchment zone.
The main aims of water-quality management include the maximum attenuation of organiccompounds during aquifer passage and low concentrations of DOC, dissolved iron, and nitrate inraw water. Results from long-term monitoring programs and special field experiments provided anexcellent database to draw conclusions on the effect of water-quality management measures. Adetailed description of redox conditions and removal rates of organics is given in Grischek et al.(1998, 2000). Table 1 summarizes the effects of different management measures for the RBF siteat Torgau.
65
Figure 1. Mean DOC concentration in milligrams per liter in groundwater in the catchment zone of theTorgau Waterworks from 1995 to 1997.
3.73.23.0 3.3
1.91.7
1.62.04.3
2.65.2 5.0
4.81.5
7145 7345 7545 7745
1057
0857
0657
1257
2.6*3.24.4
1.01.03.1
2.3*2.03.2
4.1*1.73.1
1.21.92.6
2.71.33.0
1.40.83.3 1.0
0.92.8
1.01.1
4.1
1.10.9
1.83.32.7
1.73.32.9
2.80.80.81.5 2.8
4.6*
3.0
5.14.2
Elbe River
Mixed waterDOC > 3 mg/L
Mixed waterDOC 2.3...3.0 mg/L
DOC < 2.3 mg/LMixed water
LakesVII
VIII IX
V VI
IVIII
IIIObservation well with three sampling depths; mean DOC concentration in mg/L, 1995-97Affected by local infiltration of surface water
Abstraction wellLegend
old branch
2.63.24.4
4.4*
1 km

Readily degradable and highly adsorbable organic compounds are attenuated in the biologicallyactive riverbed. Long flow paths and long retention times of the bank filtrate in the aquifer allowfurther attenuation of poorly degradable and some polar organics.
A field test was done to study the effect of an increase in water abstraction resulting in a decreasein retention time of bank filtrate in the aquifer. Over a period of 1.5 years, water abstraction fromfive selected wells was increased by about 40 percent. Excluding some slight changes in waterquality near the bank line, no significant effect due to the decrease in retention time was observed.DOC removal and denitrification along the whole flowpath were not affected (Grischek, 2002).
A continuous operation of selected wells has the advantage of lower concentrations of dissolvediron in raw water. High concentrations of dissolved iron were not measured in the bank filtrate,but were measured in the landside groundwater. Switching off the abstraction wells results ingroundwater flow towards the river and the transport of dissolved iron into the aquifer zonebetween the wells and river. When the pumps are switched on again, higher iron concentrationsare observed in raw water. Furthermore, periodic well operation leads to higher well clogging.
A groundwater flow and transport model has been used to simulate the change of the well filterdepth and its effect on groundwater flow, especially groundwater flow from the opposite side of theriver beneath the riverbed to the wells. Due to the long distance between the wells and bank line,the effect was found to be negligible. A change in the filter depth should only be considered if theaquifer consists of layers with very different hydraulic conductivities and if the well is located at ashort distance from the riverbank (the distance is less than aquifer thickness).
Surprisingly, the most important factor was the selection of abstraction wells according to theircatchment zone for landside groundwater. Based on the dense net of observation wells, it was possibleto identify zones with different concentrations of DOC and dissolved iron in landside groundwater.Figure 1 shows the range of DOC concentrations in groundwater in the catchment zones behindthe wells.
66
Table 1. Effect of Control Measures on Raw-Water Quality at the RBF Site in Torgau(Grischek, 2002)
Control Measure Bank- Effect on Raw-Water QualityFiltrate
DOC Trace NO3– Fe2+ NH4
+ SO42–
PortionOrganics Mn2+
Continuous operation of wellswith increased abstraction rate
Continuous operation of wellswith decreased abstraction rate
Periodic operation of selected wells
Preferential operation of selectedwells with favorable catchment area
Operation of every second or thirdwell within a group of wells
Technical measure
Change of the well filter depth
— Effect is negligible or only temporary. Concentration increase. Concentration decrease.
�
��
� � � �
� � �
� �
� � �
�
�
�
�
�� �
— — —
— — — — —
—
—
—
—
—
—
� � ��� �
� �

The mean concentration in the “mixed water” (see Figure 1) was calculated from the concentra-tions determined at different depths in the aquifer. Depth-dependent groundwater sampling was akey factor in understanding groundwater flow and quality changes in the catchment zone. Theoperation of Well Groups II to IV results in lower DOC concentration in the raw water comparedto the operation of Well Groups VIII and IX. Fortunately, low DOC concentrations are associatedwith low dissolved iron concentrations. Thus, the advantage of appropriately selecting abstractionwells covers both parameters. Because the water-quality change for bank filtrate was very similarin all wells, an improvement of raw-water quality can be achieved mainly by the selection of wellsabstracting the proportion of landside groundwater with the best quality. At the TorgauWaterworks, the preferential operation of these wells has already resulted in cost savings,especially for the removal of dissolved iron during the water-treatment process that requires ironsludge disposal.
Summary
The main aim at all RBF sites along the Elbe River is the attenuation of organic compounds andlow concentrations of DOC, dissolved iron, and manganese in raw water. Long flow paths andretention times promote the attenuation of organics, but were found to have only a relatively smalleffect on iron and manganese concentrations. In general, the continuous pumping of selectedwells should be preferred over periodic operation. At all sites, mixing ratios of bank filtrate andgroundwater were found to be of main importance for the concentration of nitrate, sulfate,dissolved iron, and manganese in raw water. Due to different groundwater qualities within thewhole catchment zone, a selection of wells having a catchment zone with good groundwaterquality offered a significant improvement in raw-water quality. Thus, monitoring systems for RBFsites should not only focus on bank filtrate, but should include observation wells landside of theabstraction wells. Due to site-specific boundary conditions, a detailed investigation of groundwaterflow conditions and proportions of bank filtrate in raw water is very important for draftingeffective water-quality management measures.
REFERENCES
Eckert, P., C. Blömer, J. Gotthardt, S. Kamphausen, D. Liebich, and J. Schubert (2000). “Correlationbetween the well field catchment area and transient flow conditions.” Proceedings, International RiverbankFiltration Conference, W. Jülich and J. Schubert (eds.), IAWR Rheinthemen 4, 103-113.
Grischek, T., KM. Hiscock, T. Metschies, P.F. Dennis, and W. Nestler (1998). “Factors affecting denitri-fication during infiltration of river water into a sand and gravel aquifer in Saxony, Germany.” Wat. Res.,32(2): 450-460.
Grischek, T., E. Worch, and W. Nestler (2000). “Is bank filtration under anoxic conditions feasible?”Proceedings, International Riverbank Filtration Conference, W. Jülich and J. Schubert (eds.), IAWRRheinthemen 4, 57-65.
Grischek, T. (2002). Zur Bewirtschaftung von Uferfiltratfassungen an der Elbe (Management of riverbank filtrationsites along the River Elbe), Ph.D. thesis, Dresden University of Technology, Institute for GroundwaterManagement (in German).
Heinzmann, B. (1998). “Beispiele für integriertes Management von Wasserressourcen in der Region Berlin-Brandenburg. (Examples of integrative management of water resources in the Berlin-Brandenburg region).”Wasserwirtschaft in urbanen Räumen. Schriftenreihe Wasserforschung, 3: 171-197 (in German).
Koster, N., U. Willme, and K. Döhmen (1994). “Wasserwirtschaftliche Betriebsanalyse am Beispiel einerWassergewinnungsanlage im Ruhrtal (Analysis of water management at a waterworks in the River Ruhrvalley).” Wasser Abwasser Praxis, 5: 19-23 (in German).
67

Luckner, L., and W. Nestler (1982). “Zur Methodik des Aufbaus und der Nutzung von Kontroll- undSteuerungsprogrammen von Grundwasserfassungen (On the methodology of structuring and use of controlprograms for groundwater abstraction wells).” Wasserwirtschaft-Wassertechnik, 32(7): 219-223 (in German).
Nestler, W., W. Walther, F. Jacobs, R. Trettin, and K. Freyer (1998). Wassergewinnung in Talgrundwasserleiternder Elbe (Water production in alluvial aquifers along the River Elbe), UFZ-Research Report 7 (in German).
Schöttler, U., and H. Sommer (1992). “Optimierung einer Wassergewinnungsanlage mit Hilfe der Modell-rechnung und ihre Auswirkungen auf die Grundwassergüte (Optimisation of a water abstraction system withthe help of model calculations and the effects on groundwater quality).” Steuerung in der Wasserwirtschaft,DFG-Forschungsbericht, VCH-Verlagsges., Weinheim, 178-195 (in German)
Schubert, J. (1999). “Riverbank filtration — Field studies, modeling, monitoring.” Proceedings, InternationalRiverbank Filtration Conference, 4-6 Nov 1999, Louisville, Kentucky, 39-42.
Sontheimer, H. (1991). Trinkwasser aus dem Rhein? Bericht über ein Verbundforschungsvorhaben zur Sicherheitder Trinkwassergewinnung aus Rheinuferfiltrat (Drinking water from the River Rhine? Report on a collaborativeresearch project on safety of drinking water production from bank filtrate from the River Rhine), Academia Verlag,Sankt Augustin, Germany (in German).
THOMAS GRISCHEK has 15 years of research experience in the field of riverbankfiltration. He published eight papers on riverbank filtration in refereed journals as principalauthor and has contributed to more than 10 papers as co-author. His main researchinterests are the interaction of groundwater and surface water, especially riverbankfiltration and artificial groundwater recharge, groundwater management, and diffusinggroundwater pollution. Currently, he is Professor of Water Science at the University ofApplied Sciences Dresden. Prior to this position, Grischek spent 8 years as a Research
Associate for the Institute for Groundwater Management at the Dresden University of Technology, as wellas at the University of Applied Sciences Dresden. In addition, he also taught at the Institute for WaterChemistry at the Dresden University of Technology. In 2003, he worked as a Referee at the Saxon StateAgency for Environment and Geology. Grischek studied Water Management in the Department of WaterSciences at Dresden University of Technology, where he graduated as a diploma engineer. He also receiveda Ph.D. in Environmental Engineering from the Dresden University of Technology in 2002, where heresearched the “Management of Riverbank-Filtration Sites along the Elbe River.”
68

Session 5: Dynamics
Using Models to Predict Filtrate Qualityat Riverbank-Filtration Sites –What Is the Adequate Level of Modeling?
Chittaranjan Ray, Ph.D., P.E.University of Hawaii at MañoaHonolulu, Hawaii
Henning Prommer, Ph.D.Delft University of TechnologyDelft, The Netherlands, andCenter for Groundwater StudiesPerth, Australia
Prof. Dr.-Ing. Thomas GrischekUniversity of Applied SciencesDresden, Germany
RBF is an efficient and low-cost treatment technology for drinking-water production that hasbeen in use for more than a century in Europe and nearly half a century in the United States.There has been a recent surge in the design and construction of RBF facilities in the United Statesdue to the potential to receive 0.5- to1.0-log removal credit for protozoa Cryptosporidium filtrationunder the upcoming Enhanced Surface Water Treatment Rule (USEPA, 2002). While most smallwater utilities use RBF as the sole treatment system (with the exception of disinfection), mostmedium to large utilities use RBF as a pretreatment system, which helps process performance inthe final treatment system.
The design and operation of RBF systems are facilitated by the use of flow and transport modelsfor estimating yield and water quality of the filtrate; however, the level of the modeling effort canvary depending upon the utility, data availability, and problems to be solved. While water-qualitymodeling is the primary focus, flow simulation is the first step prior to undertaking transportsimulations. In this paper, we present various scenarios involved in flow and transport modelingat RBF sites and discuss what level of modeling is adequate for what problems.
Flow Simulations
Most utilities undertake some sort of flow simulation to estimate yield from RBF wells. Thesesimulations are broadly divided into (a) analytical and (b) numerical models. Analytical models(Ferris et al., 1962; Hantush, 1959) assume that the river fully penetrates the aquifer and there isno additional resistance to flow at the river-aquifer interface. Hantush (1959) also presented asimple procedure to handle partial penetration of the river by moving the recharge boundary somedistance away from the actual location with respect to the pumping well. Other analytical models,
69
Correspondence should be addressed to:
Chittaranjan Ray, Ph.D., PEAssociate ProfessorDepartment of Civil & Environmental EngineeringUniversity of Hawaii at Mañoa • 2540 Dole Street, 383 Holmes Hall • Honolulu, Hawaii 96822 USAPhone: (808) 956-9652 • Fax: (808) 956-5014 • Email: [email protected]
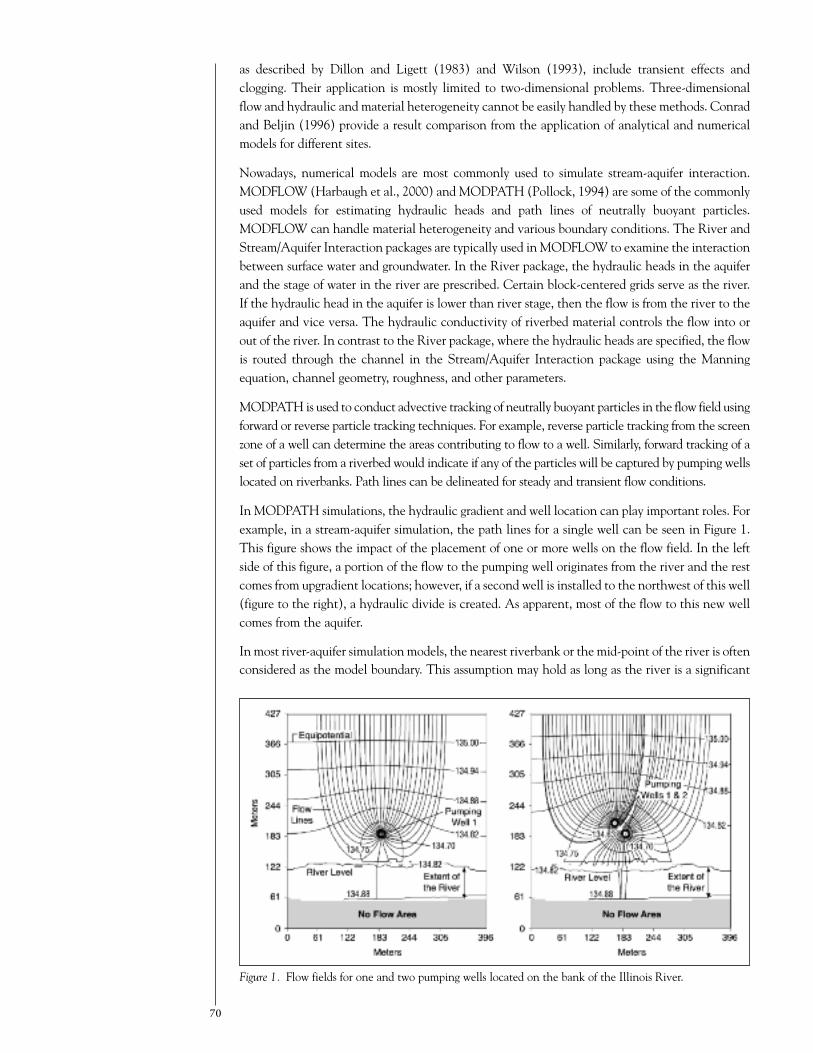
as described by Dillon and Ligett (1983) and Wilson (1993), include transient effects andclogging. Their application is mostly limited to two-dimensional problems. Three-dimensionalflow and hydraulic and material heterogeneity cannot be easily handled by these methods. Conradand Beljin (1996) provide a result comparison from the application of analytical and numericalmodels for different sites.
Nowadays, numerical models are most commonly used to simulate stream-aquifer interaction.MODFLOW (Harbaugh et al., 2000) and MODPATH (Pollock, 1994) are some of the commonlyused models for estimating hydraulic heads and path lines of neutrally buoyant particles.MODFLOW can handle material heterogeneity and various boundary conditions. The River andStream/Aquifer Interaction packages are typically used inMODFLOW to examine the interactionbetween surface water and groundwater. In the River package, the hydraulic heads in the aquiferand the stage of water in the river are prescribed. Certain block-centered grids serve as the river.If the hydraulic head in the aquifer is lower than river stage, then the flow is from the river to theaquifer and vice versa. The hydraulic conductivity of riverbed material controls the flow into orout of the river. In contrast to the River package, where the hydraulic heads are specified, the flowis routed through the channel in the Stream/Aquifer Interaction package using the Manningequation, channel geometry, roughness, and other parameters.
MODPATH is used to conduct advective tracking of neutrally buoyant particles in the flow field usingforward or reverse particle tracking techniques. For example, reverse particle tracking from the screenzone of a well can determine the areas contributing to flow to a well. Similarly, forward tracking of aset of particles from a riverbed would indicate if any of the particles will be captured by pumping wellslocated on riverbanks. Path lines can be delineated for steady and transient flow conditions.
In MODPATH simulations, the hydraulic gradient and well location can play important roles. Forexample, in a stream-aquifer simulation, the path lines for a single well can be seen in Figure 1.This figure shows the impact of the placement of one or more wells on the flow field. In the leftside of this figure, a portion of the flow to the pumping well originates from the river and the restcomes from upgradient locations; however, if a second well is installed to the northwest of this well(figure to the right), a hydraulic divide is created. As apparent, most of the flow to this new wellcomes from the aquifer.
In most river-aquifer simulation models, the nearest riverbank or the mid-point of the river is oftenconsidered as the model boundary. This assumption may hold as long as the river is a significant
70
Figure 1. Flow fields for one and two pumping wells located on the bank of the Illinois River.
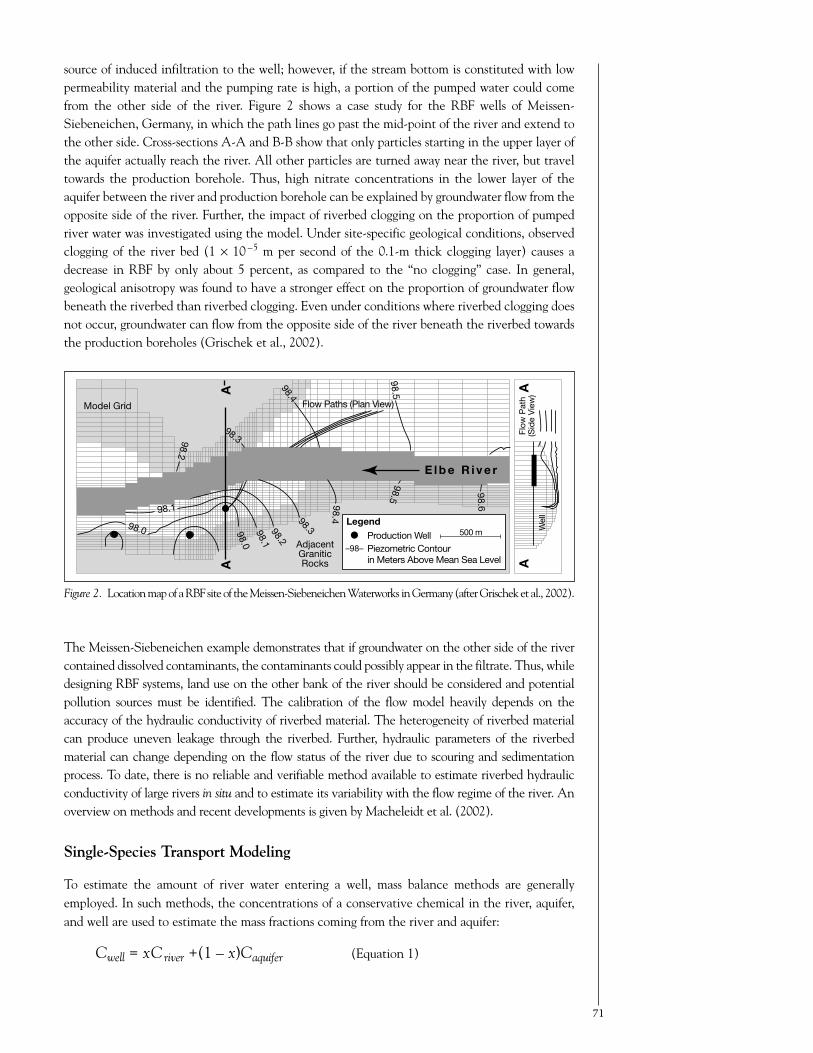
source of induced infiltration to the well; however, if the stream bottom is constituted with lowpermeability material and the pumping rate is high, a portion of the pumped water could comefrom the other side of the river. Figure 2 shows a case study for the RBF wells of Meissen-Siebeneichen, Germany, in which the path lines go past the mid-point of the river and extend tothe other side. Cross-sections A-A and B-B show that only particles starting in the upper layer ofthe aquifer actually reach the river. All other particles are turned away near the river, but traveltowards the production borehole. Thus, high nitrate concentrations in the lower layer of theaquifer between the river and production borehole can be explained by groundwater flow from theopposite side of the river. Further, the impact of riverbed clogging on the proportion of pumpedriver water was investigated using the model. Under site-specific geological conditions, observedclogging of the river bed (1 × 10 –5 m per second of the 0.1-m thick clogging layer) causes adecrease in RBF by only about 5 percent, as compared to the “no clogging” case. In general,geological anisotropy was found to have a stronger effect on the proportion of groundwater flowbeneath the riverbed than riverbed clogging. Even under conditions where riverbed clogging doesnot occur, groundwater can flow from the opposite side of the river beneath the riverbed towardsthe production boreholes (Grischek et al., 2002).
The Meissen-Siebeneichen example demonstrates that if groundwater on the other side of the rivercontained dissolved contaminants, the contaminants could possibly appear in the filtrate. Thus, whiledesigning RBF systems, land use on the other bank of the river should be considered and potentialpollution sources must be identified. The calibration of the flow model heavily depends on theaccuracy of the hydraulic conductivity of riverbed material. The heterogeneity of riverbed materialcan produce uneven leakage through the riverbed. Further, hydraulic parameters of the riverbedmaterial can change depending on the flow status of the river due to scouring and sedimentationprocess. To date, there is no reliable and verifiable method available to estimate riverbed hydraulicconductivity of large rivers in situ and to estimate its variability with the flow regime of the river. Anoverview on methods and recent developments is given by Macheleidt et al. (2002).
Single-Species Transport Modeling
To estimate the amount of river water entering a well, mass balance methods are generallyemployed. In such methods, the concentrations of a conservative chemical in the river, aquifer,and well are used to estimate the mass fractions coming from the river and aquifer:
Cwell = xCriver +(1 – x)Caquifer (Equation 1)
71
98.0
98.1
98.2
98.0
98.198.2
98.3
98.4
98.4
98.598.5 98.6
98.3
Model Grid Flow Paths (Plan View)
AdjacentGraniticRocksA
A
AA
Flow
Pat
h(S
ide
Vie
w)
Wel
l
E l b e R i v e r
LegendProduction WellPiezometric Contour in Meters Above Mean Sea Level
–98–
500 m
Figure 2. Locationmapof aRBFsiteof theMeissen-SiebeneichenWaterworks inGermany(afterGrischeket al., 2002).

In Equation 1, the fraction of river water (x) can be calculated if the three concentrations are known.Similarly, if x is known from prior investigations, the concentration of a conservative chemical inthe filtrate may be estimated; however, the equation is only valid for steady-state conditions. In otherwords, concentrations in the river and aquifer do not change with time. Also, it is assumed thatinfiltrating water from the river at a given moment in time is of the same quality as that reaching thewell and that the quality of the bank filtrate and groundwater does not change over the wholethickness of the aquifer. Such assumptions hamper the use of Equation 1 for spill events, even forconservative chemicals. Transient effects such as lag time (or travel time) issues are not considered.Further, Equation 1 cannot be used for non-conservative contaminants that are subject todegradation, sorption, or other reactions. For such contaminants, knowing the concentrations in theriver and aquifer, as well as the mass fraction of the water derived from the river, one would not beable to predict the concentration at the well. For transient problems, the application of numericalmodels is typically required. In those, the advection-dispersion equation is solved with or withoutchemical reactions, depending upon the type of contaminants. The advection-dispersion equationcan be solved analytically if the flow field is steady and reaction terms are linear. In cases where theuse of three-dimensional numerical models is beyond the ability of water utilities, simpleone-dimensional analytical models can be used to estimate chemical concentrations in pumpedwater, especially from shock events or chemical spills. Mälzer et al. (2003) used the analyticalsolution to the one-dimensional advection-dispersion equation to estimate the concentration of achemical reaching a well. In their approach, they approximated the flow field between the river andaquifer using five flow tubes. For each tube, they solved the advection-dispersion equation with(sorption and first order degradation) to calculate the concentration at Observation Well M1(Figure 3); however, the assumption of steady flow through these flow tubes may not be valid for allcases. Further, estimating the concentrations for a contaminant at the pumping well may not be easywithout knowing the amount of groundwater contribution to the well.
For transient three-dimensional simulations, MT3D/MT3DMS (Zheng and Wang, 1999) isprobably the most common transport simulator that is used in conjunction with MODFLOW.MT3D uses the same grid of MODFLOW and solves advection-dispersion equation, along withsorption and degradation reactions, to estimate the concentration of a contaminant at a givenlocation in the model domain. For estimating the concentration at the pumping well, a flow modelmust be built and calibrated to provide a good description of the velocity field. As mentionedearlier, the hydraulic conductivity of bed material at the river-aquifer interface can significantly
72
Aquifer
Rhine River
35
30
25
20
15
27 m
High
M1
Low
23 m
10
Vertical Section at Wittlaer
Met
ers
Ab
ove
Sea
Leve
l
Figure 3. Vertical section of the aquifer at Wittlaer between the Rhine Riverand Observation Well M1 and a simplified model assumption of fiveparallel tubes (after Mälzer et al., 2003).

affect the amount of contaminant entering from the river to the aquifer and, eventually, to thepumping well(s). For flow fields affected by pumping wells, the assumption of equilibrium sorption(in contrast to kinetically controlled sorption) near the screen zone may not be valid due to fasttravel rates of water particles. Ray et al. (2002) simulated the impact of riverbed/bank materialproperties on filtrate quality during a flood pass-through event at a RBF facility on the banks of theIllinois River. They used equilibrium sorption and first order degradation from literature-reporteddata. Also, in certain simulations, they considered the contaminant to be conservative. Thisassumption enveloped the two extremes. For atrazine, with a highly conductive bank, theconcentrations in groundwater and the pumped well are slightly attenuated when the effects ofsorption and degradation are considered (Figure 4A); however, without sorption and degradation,the concentrations can be close to that found in river water (Figure 4B).
73
SP-3 is below detection limit
SP-1
Caisson
River water
(A) with sorption and decay
Atra
zine
Conc
entra
tion,
µg/L
4
3
2
1
00 20 40 60 80 100
SP-3
Days Since Start of Simulation
Days Since Start of Simulation
SP-1
Caisson
River water
(B) without sorption and decay
Atra
zine
Conc
entra
tion,
µg/L
4
3
2
1
00 20 40 60 80 100
Figure 4. Atrazine transport from the river to the aquifer and the pumping wellwith and without sorption and decay reactions for a highly conductive bedand bank (after Ray et al., 2002).

When the hydraulic conductivity of the bed and bank are reduced to moderate values (see setsA-A and B-B in Ray et al., 2002), there is a significant attenuation of atrazine at the collector wellcaisson (Figure 5). It is clear that the transient effects call for the use of complex three-dimensionalmodels to account for the spatial and temporal variability of streamlines. Based on hydraulic headmeasurements and water-quality observations, the calibration of flow and transport models isessential for an accurate description and prediction of the fate of individual or multiple chemicals.The current version of the standard MT3DMS code (Zheng and Wang, 1999) accounts for thetransport of multiple species and a small range of basic reactions; however, for cases wherechemical species are assumed to interact in a more complex manner, MT3DMS-based packagessuch as RT3D (Clement, 1997) or PHT3D (Prommer et al., 2003a), which account for a greatervariety of biogeochemical processes, are available.
Multi-Species and Multi-Component Transport Modeling
In those scenarios where the reaction progress of a dissolved chemical strongly depends onthe concentration of one or more other dissolved species, reactive multi-species models cantypically provide a better process description. This is particularly important if models are used in apredictive mode. Furthermore, if water-quality changes are additionally affected by water-sedimentinteractions, such as mineral dissolution/precipitation and/or ion-exchange reactions, a reactivemulti-component transport model might need to be applied to explain specific field observations.Multi-component models typically use an extensive reaction database. Until recently, thosedatabases were (in most cases) confined to the definition of thermodynamic equilibrium reactions,which made those models only applicable to systems where (all) reactions proceed relatively fast inrelation to groundwater flow velocity (local equilibrium assumption); however, in most of therecently published models, a wide range of different kinetic reactions and processes can be defined.Models with those capabilities can be used to study complex process interactions that lead to non-
74
Caisson (set B-B)
Caisson (set A-A)
River water
No reaction – filtrateWith reaction – filtrateRiver water
Atra
zine
Conc
entra
tion,
µg/L
4
3
2
1
00 20 40 60 80 100
Days Since Start of Simulation
Figure 5. Atrazine transport from the river to the aquifer and the pumping well for a casewith low permeability riverbed/bank (after Ray et al., 2002).

intuitive system behavior. In the case of RBF, such examples might be:
• The reductive dissolution of iron oxides by DOC and the resulting release of sorbedheavy metals.
• The assessment of pesticide mobility during flood events.
Denitrification, degradation of pesticides, and dissolution of minerals are closely linked to DOC,a key component of river water whose concentration can vary depending on the season and flowevents. Because of the reaeration process, river water is oxygenated compared to groundwater.During the induced infiltration process, oxygen-rich river water enters the aquifer, as does DOC.On its travel path, DOC from river water is oxidized and either mineralizes completely or istransformed to intermediates through bacterial catalysis, together with the organic carbon that isperhaps naturally abundant in the aquifer as sediment-bound organic matter. Oxygen inthe invading water is used as an electron acceptor in the process. Normally, there is sufficientcarbon available for microbial use; however, oxygen can become in short supply along the flowpath. Once microbes consume the oxygen, an anoxic zone develops where the nitrate of theinfiltrating river water and groundwater is used as a substitute electron acceptor. This leads to thereduction of nitrate along the flow path. Once nitrate is also depleted, thermodynamically lessfavorable oxidized iron and manganese minerals and/or sulfate might act as alternative electronacceptors. Note that the simulation of the oxidation of one or multiple organic substrates using asequence of electron acceptors is routinely applied in the field of bioremediation modeling, mainlywhere the transport and natural attenuation of oxidizable organic contaminants is simulated(Barry et al., 2002).
The simultaneous simulation of RBF-typical denitrification and mineral dissolution reactions canbe handled by a number of existing codes (for examples, see Table 1). One such code is EASY-LEACHER (Stuyfzand and Lüers, 2000), which was used to simulate reactions along a transect ofthe Torgau RBF site on the Elbe River in Germany. EASY-LEACHER is a two-dimensionalreactive transport code in EXCEL spreadsheet, combining chemical principles with empiricalrules in an expert system. The code was found useful to attain a first estimate of water quality inthe production well for a RBF site where the operation of wells is started and for an easycalculation of different boundary conditions. In contrast to EASY LEACHER, which uses acollection of (one-dimensional) flow tubes to account for the transport of chemicals, theFEREACT model (see Tebes-Stevens et al., 1998; Tebes-Stevens and Valocchi, 2000) is a
75
Table 1. Examples of Reactive Multi-Component Transport Models
Model Reference
CRUNCH Steefel (2001)
EASY-LEACHER Stuyfzand and Lüers (2000)
FEREACT Tebes-Stevens et al. (1998)
PHT3D Prommer et al. (2003a)
PHAST Parkhurst et al. (1995)
MIN3P Mayer (1999)
TBC Schäfer et al. (1998)
HBGC123D Salvage and Yeh (1998)

two-dimensional, finite element-based transport model that can simulate biodegradation andgeochemical reactions along, for instance, a vertical transect of the river-aquifer interface. Althoughthe model cannot handle the true three-dimensional (and perhaps transient) flow dynamicsexperienced at a RBF site, it accounts for all typical geochemical and microbial reactive processes.An example for a fully three-dimensional model is the MODFLOW/MT3DMS-based codePHT3D (Prommer, 2002, Prommer et al., 2003a). It combines the previously mentionedMT3DMS (Zheng and Wang, 1999) with PHREEQC-2 (Parkhurst and Appelo, 1999), wherebythe former solves the advection-dispersion equation and the latter accounts for all geochemicalreactions. Prommer et al. (2003b) recently applied the model to simulate the transport andreactive processes that affect the fate of atrazine near a RBF scheme during a flood event.
For that modeling study, the hydrogeological setting and hydrological characteristics described byRay et al. (2002) were used to demonstrate the potential influence of a microbial lag effect andthe redox-dependency of atrazine degradation on abstraction water quality during the flood event.They considered kinetically controlled mineralization of DOC, dissolution of sediment-boundorganic matter, growth and decay of atrazine degraders, and microbially mediated atrazinedegradation. During the flood event, DOC from the river water modifies the redox patterns in theaquifer along the flow path to the well screens. The simulations demonstrated that with the flood,the concentration of atrazine reaches a peak in a similar pattern to that found in floodwater andthe concentration in groundwater remains high; however, once atrazine degraders are active, theconcentration drops significantly (Figure 6, Case 1). On the other hand, if the DOC of the riverwater is somewhat increased, this leads to the formation of an anoxic zone, which promotesdenitrification, but inhibits atrazine degradation (Figure 6, Case 2).
Concluding Remarks
It is apparent that the level of modeling can range from a very simple mass balance to verycomplex studies that involve transient flow and biogeochemical reactions. The objective of themodeling study, as well as the type, quantity, and quality of data, will dictate what level ofsophistication is needed. For example, if yield determination is the primary purpose, MODFLOWsimulations will mostly be adequate. Preliminary investigations to delineate the sources of water
76
0 50 100 0
0.2
0.4
0.6
0.8
1 x 10 7
Time (days)
C(m
ol/l)
Atrazine
conservative reactive case 1 reactive case 2
0 50 100 0
0.5
1
1.5
2 x 10 8
Time (days)
Atrazine degraders
reactive case 1 reactive case 2
0 50 100 132
134
136
138
140
142
Head
(m)
Water level
Time (days)
River Obs. Pt.
0 50 100 0
1
2
3
4
5 x 10 4
C(m
ol/l)
Oxygen
reactive case 1 reactive case 2
0 50 100 0
2
4
6
8 x 10 4 Nitrate
reactive case 1 reactive case 2
Figure 6. Schematic representation of the 3-D model, hydraulic heads, and selected simulated concentrationsof oxygen, nitrate, atrazine, and atrazine degraders.

entering the well can be carried out with MODPATH or comparable particle tracking tools;however, the accuracy of the simulation strongly depends on how well the true values of hydraulicconductivity of riverbed/bank materials are represented in the models. Especially for transientsimulations, accurate estimates of riverbed and bank hydraulic conductivity are critical. Fortransport simulations, simple mixing models (as used by many utilities) may not provide goodestimates of contaminant concentrations at RBF wells due to lag times involved, transient flow,and heterogeneity issues. Models using MT3D for simulating the transport of single or multiplecontaminants may be adequate for specific problems (for example, worst-case estimates); however,the assumption of equilibrium reactions near well screens may not be valid. On the other hand,for kinetic reactions, the availability of appropriate rate parameters might not always bewarranted. Finally, biogeochemical models such as PHT3D are most comprehensive and are idealto study both steady and transient effects; however, the input data sets for such models can beextensive, and field data sets that underpin the simulations may not always be readily available.For such complex models, input parameters are rarely found in literature and are very much site-specific. On the other hand, the determination of such parameters at the laboratory-scale requiresboth significant time and effort and, additionally, the usefulness of the results for field-scalesimulations might still not be warranted due to scale-issues. Furthermore, the application of suchmodels typically requires users with advanced modeling skills and experience in the areas ofgeochemistry and (groundwater) hydrology. After all, the complexity found in some of the modelsis only a reflection of the complexity and diversity found in nature and natural materials. To findand make use of adequate simplifications should be part of the development of the (site-specific)conceptual model. Each complex numerical model can also be used as a “simpler” model by fixingthose parameters that were excluded in the corresponding simple model. Also, it must be notedthat the parameters used in simpler models are by far not less site-specific than those of morecomplex models.
A typical example of the “how much complexity is adequate” question is DOC, since it consistsof thousands of single organic compounds with different biodegradation behavior. The question ishow many different fractions (concerning biodegradability and sorption behavior) should beidentified and used in the model to be adequate for the selected level of model discretization,reactions included, and kinetic parameters. Based on the application of different models forchosen field-sites and qualified sensitivity analyses (benchmarking), a guideline should bedeveloped to propose the right type of model for a specific task. The development of reducedmodels, such as the spreadsheet program EASY-LEACHER (Stuyfzand and Lüers, 2000), and theimprovement of multi-species reaction models should be carried out simultaneously.
Furthermore, for detailed modeling, the hydraulic component must be able to handle scour,deposition, high water levels, flooding, etc. For detailed transport and reaction modeling, variedproperties of the riverbed material and aquifer material (e.g., organic carbon content, enzymaticactivity) should be considered.
Finally, we must mention that besides the widely known models mentioned in Table 1, there aremany other models that have been applied successfully for the simulation of processes at RBF sitesfor the specific evaluation purposed.
77

REFERENCES
Barry, D.A., H. Prommer, C.T. Miller, P. Engesgaard, and C. Zheng (2002). “Modeling the fate of oxidisableorganic contaminants in groundwater.” Adv. Water Resour., 25: 945-983.
Clement, T.P. (1997). RT3D - A Modular Computer Code for Simulating Reactive Multi-species Transport in 3-Dimensional Groundwater Aquifers, Battelle Pacific Northwest National Laboratory Research Report, PNNL-SA-28967.
Conrad, L.P., and M.S. Beljin (1996). “Evaluation of an induced infiltration model as applied to glacialaquifer systems.” Wat. Resour. Bull., 32(6): 1,209-1,220.
Dillon, P.J., and J.A. Liggett (1983). “An ephemeral stream-aquifer interaction model.” Wat. Resour. Res.,19(3): 621-626.
Ferris, J.G., D.B. Knowles, R.H. Brown, and R.W. Stallmann (1962). Theory of Aquifer Tests,U.S. GeologicalSurvey Water Supply Paper 1536-E, Government Printing Office, Washington, D.C.
Grischek, T., D. Schoenheinz, andW.Nestler (2002). “Unexpected groundwater flow beneath theRiver Elbe at thebank filtration site Meissen, Germany.”Water resources and environment research, ICWRER 2002, Vol. 1: 116-120.
Hantush,M.S. (1959). “Analysis of data from pumping wells near a river.” Jour. Geophys. Res., 64(11): 1,921-1,931.
Harbaugh, A.W., E.R. Banta, M.C. Hill, andM.G.McDonald (2000).MODFLOW-2000, the U.S. GeologicalSurvey modular ground-water model — User guide to modularization concepts and the Ground-Water Flow Process,U.S. Geological Survey Open-File Report 00-92, 121 p.
Macheleidt, W., W. Nestler, and T. Grischek (2002). “Determination of hydraulic boundary conditions forthe interaction between surface water and groundwater.” Sustainable groundwater development, GeologicalSociety, London, Special Publ. 193: 235-243.
Mälzer, H., J. Schubert, R. Gimbel, and C. Ray (2003). “Effectiveness of riverbank filtration sites to mitigateshock loads.” Riverbank Filtration: Improving Source Water Quality, Kluwer Academic Publishers, Dordrecht,The Netherlands.
Mayer, K.U. (1999). A numerical model for multicomponent reactive transport in variably saturated porous media,Ph.D. thesis, University of Waterloo, Waterloo, Ontario, Canada.
Parkhurst, D.L., P. Engesgaard, and K.L. Kipp (1995). “Coupling the geochemical model PHREEQC with a3D multi-component solute transport model.” Fifth Annual V.M. Goldschmidt Conference, Penn StateUniversity, University Park Pennsylvania, USA, May 1995.
Parkhurst, D.L., and C.A.J. Appelo (1999). User’s guide to PHREEQC - A computer program for speciation,reaction-path, 1D-transport, and inverse geochemical calculations: Technical Report 99-4259, U.S. GeologicalSurvey Water-Resources Investigations Report.
Pollock, D.W. (1994). User’s Guide for MODPATH/MODPATH-PLOT, Version 3: A particle tracking post-processing package for MODFLOW, the U.S. Geological Survey finite-difference ground-water flow model,U.S. Geological Survey Open-File Report 94-464.
Prommer, H. (2002). PHT3D: A Reactive Multicomponent Transport Model for Saturated Media, User’s ManualVersion 1.0,ContaminatedLandAssessment andRemediationResearchCentre, TheUniversity of Edinburgh,UK,http://www.pht3d.org.
Prommer, H., D.A. Barry, and C. Zheng (2003a). “PHT3D - AMODFLOW/MT3DMS based reactive multi-component transport model.” Ground Water, 42(2): 247-257.
Prommer, H., J. Greskowiak, P.J. Stuyfzand, and C. Ray (2003b). “Geochemical transport modeling of waterquality changes during managed artificial recharge.” MODFLOW and More 2003: Understanding throughModeling, Proceedings of the International Ground Water Modeling Conference, Golden, Colorado USA,16-19 September 2003.
78
Ray, C., T.W. Soong, Y.Q. Lian, and G.S. Roadcap (2002). “Effect of flood-induced chemical load on filtratequality at bank filtration sites.” J. Hydrol., 266: 235-258.
Salvage, K.M., and G.T. Yeh (1998). “Development and application of a numerical model of kinetic andequilibrium microbiological and geochemical reactions (BIOKEMOD).” J. Hydrol., 209(1-4): 27-52.
Schäfer, D., W. Schäfer, and W. Kinzelbach (1998). “Simulation of processes related to biodegradation ofaquifers 1. structure of the 3D transport model.” J. Contam. Hydrol., 31(1-2): 167-186.
Steefel, C.I. (2001). GIMRT, Version 1.2: Software for Modeling Multicomponent, Multidimensional ReactiveTransport. Users Guide, Technical Report UCRL-MA-143182, Lawrence Livermore National Laboratory,Livermore, California, 2001.
Stuyfzand, P.J., and F. Lüers (2000). “Modelling the quality changes upon artificial recharge and bankinfiltration.” Principles and user`s guide of EASY-LEACHER 4.5, KIWA-report SWI 99.199.
Tebes-Stevens, C.L., and A.J. Valocchi (2000). “Calculation of reaction parameter sensitivity coefficients inmulticomponent subsurface transport models.” Adv. Water Resour., 23: 591-611.
Tebes-Stevens, C.L., A.J. Valocchi, J.M. VanBriesen, and B.E. Rittmann (1998). “Multicomponent transportwith coupled geochemical and microbiological reactions: Model description and example simulations.”J. Hydrol., 209: 8-26.
United States Environmental Protection Agency (2002). Long-Term 1 Enhanced Surface Water TreatmentRule, Final Rule. Federal Register, 67:9:1812 (January 14, 2002).
van Breukelen, B.M., C.A.J. Appelo, and T.N. Oltshoorn (1998). “Hydrogeochemical transport modeling of24 years of Rhine water infiltration in the dunes of the Amsterdam water supply.” J. Hydrol., 209: 281-296.
Wilson, J.L. (1993). “Induced infiltration in aquifers with ambient flow.”Wat. Resour. Res., 29(10): 3,503-3,512.
Zheng, C., and P.P. Wang (1999). MT3DMS: A modular three-dimensional multispecies model for simulation ofadvection, dispersion and chemical reactions of contaminants in groundwater systems, Documentation and User’sGuide, Contract Report SERDP-99-1, U.S. Army Engineer Research andDevelopment Center, Vicksburg,MS.
CHITTARANJAN RAY is an Associate Professor in the Department of Civil &Environmental Engineering and an Associate Researcher with the Water ResourcesResearch Center at the University of Hawaii at Mañoa. His current research interestsinclude riverbank filtration, pesticides in drinking-water wells, and the flow and transportof pathogens and chemicals in saturated/unsaturated media. Over the past 2 years, he hasedited two books on riverbank filtration and written a monograph on pesticides indomestic wells. Among his honors, he is a recipient of the Fulbright faculty scholarship for
conducting riverbank filtration-related research in Nepal, India, and Bangladesh. Prior to joining theUniversity, Ray worked as a staff engineer with the groundwater consulting firm of Geraghty & Miller, Inc.(now called Arcadis Geraghty & Miller) and in the Groundwater Section of Illinois State Water Survey,conducting various groundwater quantity and quality investigations, including bank filtration. Ray receiveda B.S. in Agricultural Engineering from Orissa University of Agriculture and Technology in India, an M.S.in Agricultural Engineering from the University of Manitoba in Canada, an M.S. in Civil Engineering fromTexas Tech University, and Ph.D. Civil and Environmental Engineering from the University of Illinois atUrbana-Champaign.
79

80

Session 5: Dynamics
The 100-Year Flood of the Elbe River in 2002and Its Effects on Riverbank-Filtration Sites
Dipl.-Ing. Matthias KruegerFernwasserversorgung Elbaue-Ostharz GmbHTorgau, Germany
Dipl.-Ing. Ingbert NitzscheFernwasserversorgung Elbaue-Ostharz GmbHTorgau, Germany
Introduction
To historians, Torgau, Germany, is mainly known as the former residence of the Saxon Electorsand the cultural capital of sixteenth-century Saxony (Figure 1). A short time later, Martin Luther’swork gave the town on the Elbe the nickname, “Nursemaid of the Reformation.” Finally, manypeople know Torgau as the historic site where the defeat of Nazi Germany was symbolized by themeeting of Soviet and American troops on the Elbe River on April 25, 1945.
Torgau is the headquarters of the Fernwasserversorgung Elbaue-Ostharz GmbH, one of the largestdrinking-water supply companies in Germany. The company was founded about 50 years ago andmanages one waterworks at a reservoir in the Harz Mountains, five bank-filtration waterworks in theElbe River Basin near Torgau, and a 700-kilometer long distribution network. In 2002, thedrinking-water production was 76-cubic meters. About 3.5-million people were supplied withdrinking water of high quality.
81
Correspondence should be addressed to:
Dipl.-Ing. Matthias KruegerHead of LaboratoryFernwasserversorgung Elbaue-Ostharz GmbHNaundorferstraße 46 • 04860 Torgau, GermanyPhone: +49 3421 757511 • Fax: +49 3421 757522 • Email: [email protected]
Figure 1. Air view of Torgau, Germany, 2 days before the flood peak.

Riverbank Filtration Near Torgau
In this system, raw-water abstraction via bank filtration in the Elbe River Basin is a key element.The production boreholes are located in an alluvial sand and gravel aquifer with a thickness of40 to 60 m, covered by a 2- to 5-m thick layer of meadow loam. The meadow loam provides animportant protection against pollution and infiltration during flooding. Due to erosive conditions,there is only low clogging of the riverbed. The good hydraulic connection between the Elbe Riverand the adjacent aquifer ensures stable water abstraction during low flow periods.
Figure 2 shows the biggest waterworks, Torgau-Ost, which has a maximum capacity of120,000 m3/d. Raw water is abstracted from 42 production boreholes on the western bank of theElbe River. At a distance of about 300 m between the production boreholes and the riverbank,the flow time of the bank filtrate is between 60 and 200-plus days.
The produced water has a good quality due to the natural purification ability of the aquifer. Twomonitoring cross-sections positioned along assumed flowpaths to the production boreholes havebeen installed to control borehole operation and to guarantee flexibility in response to environ-mental impacts, both seasonal and long-term. These monitoring cross-sections include up to fiveobservation stations between the production boreholes and the river. Each observation stationconsists of three to five monitoring points at varying depths.
Raw water is purified by aeration and deacidification, pre-purification by 20 tube sedimentationbasins, and fine purification by 16 open sand filters. Iron, manganese, and carbon dioxide are themain constituents of raw water that require treatment. These constituents are eliminated byadding hydrated lime and potassium permanganate. Prior to pumping into the public-water supplynetwork, the water is further treated with small amounts of chlorine and chlorine dioxide toprevent bacteriological deterioration during the long transportation process to the consumer.
The 100-Year Flood of the Elbe River in 2002
In Torgau, the mean discharge of the Elbe River is about 330 cubic meters per second (m3/s). InAugust 2002, a so-called “Flood of the Century” occurred. The event was caused by a “Vb” (extreme)weather situation. Precipitation reached 300 millimeters per day, with 25 to 30 millimeters per hourin the Ore Mountains. This intensity had never been measured before in this region. In Dresden,the Elbe River exceeded the 1845 flood level of 8.77 m, hitting a record of 9.40 m on August 17,2002. The towns of Meissen, Torgau, Wittenberg, and Dessau were also partially flooded.
82
Figure 2. Torgau-Ost Waterworks and the Elbe River.

In Torgau, the water level of the Elbe River increased within 10 days by about 8 m up to 9.47 mon August 19, a level that has never been observed before. The peak discharge of the Elbe Riverin Torgau was estimated to have been 4,295 m3/s. The City of Torgau had to be evacuatedcompletely. Technical staff, soldiers, and helpers built anti-flood barricades with thousands ofsandbags.
To ensure a safe drinking-water production, the water company formed an emergency task forceon August 13 to organize necessary measures.
The Effects of the Flood
Most bank-filtration waterworks near Torgau are located at elevated levels at a sufficient distanceto the river and are normally not affected by flooding. Nearly all production boreholes were flooded,but still functioned due to their special construction. A problem arose with the power-supply systemfor the boreholes. Transformer stations are located behind the dikes. But, due to the high waterlevel and risk of dikes breaking, the stations had to be extra protected; therefore, the stations werehoused-in using sheet piling and equipped with pumps for dewatering and additional emergencypower generators (Figure 3).
As a result of these measures, the power supply was maintained at most locations. Only two smallwaterworks in the north of Torgau had to be abandoned due to water influx at transformer stations.
Besides the aspect of water quantity, there is water quality. As a result of former bank-filtrationresearch programs at the Torgau site, there is an excellent knowledge of flow processes andwater-quality changes along the flowpath. Based on this knowledge, no significant change inraw-water quality was expected, mainly because the flow time of the bank filtrate ranges between60 and 300-plus days. For control purposes, the continuous monitoring of raw-water quality wasintensified during the flood, and a special groundwater-monitoring program for the cross-sectionswas set up after the flood.
All results of measurements at the outflow of the waterworks proved that drinking-water qualitywas not at risk at any time. The quality of the production water met the German standards for
83
Figure 3. Protected transformer station behind a dike.

drinking-water quality. Drinking-water disinfection was done by 0.2 mg/L chlorine dioxide (ClO2)and 0.6 mg/L chlorine (Cl2). There was no problem with bacterial contamination.
But what about raw-water quality? The flood caused a strong increase in turbidity, organic carbonconcentration, and number of microorganisms in river water. The increase in DOC from 5 mg/Lto more than 10 mg/L in river water did not affect the DOC concentration in the raw water(Figure 4). The increase in DOC in river water was mainly caused by an increase of thebiodegradable fraction of DOC, which is consumed along the flowpath of the bank filtrate. Thus,biodegradation and mixing in the aquifer prevented an increase in DOC concentration in the rawwater and an increase in DBPs.
Increases in concentrations of organic trace compounds such as polynuclear aromatic hydrocarbon,chlor-organics, and pesticides were not observed in Elbe River water during the flood. Despitemany reported inputs of contaminants, the huge discharge caused an effective dilution andminimized the risk. After the flood, concentrations were found to be around the mean annualvalues. Despite these facts, measurements of the sum of adsorbable organic halogenatedcompounds (AOX) were used to check for the potential contamination of river water and rawwater. The AOX concentration in the raw water remained at a low level of less than 30 µg/L,giving no indication of contamination (see Figure 4). Measured DOC and AOX concentrationsin bank-filtrate samples were found to be within long-term concentrations ranges.
Increased heavy metal concentrations in the river water also did not affect raw-water quality.
Conclusions
The 100-year flood of the River Elbe in August 2002 became the greatest challenge forFernwasserversorgung Elbaue-Ostharz GmbH in its history. Maintaining the power supply forpumps in the production boreholes was the most important factor, whereas the quality ofabstracted bank filtrate was never at risk due to the design of bank-filtration sites. Based on themeasures taken and management of efficient distribution network, the water company ensured a
84
Elbe River 4/29/02 Elbe River
8/20/02 Borehole 22 9/4/02 Raw water
10/7/02
DOC (mg/l)
AOX (µg/l) 0
5
10
15
20
25
30
35
40
Figure 4. DOC and AOX concentrations in Elbe River water and raw water

stable water supply for millions of people during the flood without restrictions to quantity andquality. The available technology for drinking-water treatment was successful in producinghigh-quality drinking water.
Since 1990, MATTHIAS KRUEGER — a process engineer and chemist — has worked forthe Fernwasserversorgung Elbaue-Ostharz GmbH, a water company that provides drinkingwater for over 3.5-million people in Germany. Early on, he was responsible for watertreatment technology, then became Head of Laboratory in 2001. Under his leadership, theLaboratory has recently been involved in large research projects on physical and chemicalprocesses during bank filtration. Prior to joining Fernwasserversorgung Elbaue-OstharzGmbH, Krueger was an Engineer at Galvanotechnic in Leipzig, Germany, for 7 years. His
areas of interest include flow path, residence times, and redox conditions in the behavior of pollutants duringriverbank filtration. Krueger received a diploma (Dipl.-Ing.) in Chemistry from the Technical UniversityIlmenau and completed post-graduated studies in analytics and spectroscopy at Leipzig University.
85

86

Session 5: Dynamics
Temporal Changes of Natural Attenuation ProcessesDuring Bank Filtration
Paul Eckert, Ph.D.Stadtwerke Düsseldorf AGDüsseldorf, Germany
Rudolf Irmscher, Ph.D.Stadtwerke Düsseldorf AGDüsseldorf, Germany
RBF is a well-proven natural purification step in water supply. Sustainable water managementshould be based specifically on natural purification methods, as declared by the InternationalAssociation of Waterworks in the Rhine Catchment Area, in their 2003 memorandum. Toachieve this aim, a profound knowledge of the purification capacity of bank filtration is essential.At the Düsseldorf Waterworks in Germany, the influence of long-term — as well as periodic —changes of both hydraulics and river-water quality on natural attenuation processes wereinvestigated.
The improvement of Rhine River water quality over the last 30 years enabled the DüsseldorfWaterworks to reduce their technical treatment expenses. Temperature variations throughout theyear and flood events significantly influenced the purification capacity of bank filtration. Thisreinforces the need for flexible technical treatment methods capable of adapting to changing raw-water quality.
Even though the complete replacement of subsequent technical treatment steps might be seen asan unreachable vision, the substantial knowledge we have acquired on the purification capacityof bank filtration enables the design of tailor-made treatment methods.
Site Description and Treatment Concept
The City of Düsseldorf is situated in northwestern Germany, in the lower Rhine Valley (Figure 1).The Düsseldorf Waterworks supply 600,000 inhabitants with treated bank filtrate. A multi-protective barrier concept ensures the constant production of high-quality drinking water (Figure 2).Natural attenuation processes during bank filtration form the first and most efficient protectivebarrier. The subsequent protective barrier is raw-water treatment, including ozonation, biologicalactive filtration, and active carbon adsorption.
The Rhine River has a length of 1,320 kilometers and a catchment area of 185,000 square kilometers;it is the third biggest river and the largest source of drinking water in Europe. The mean dischargeof the Rhine at Düsseldorf is 2,200 m3/s, while the Waterworks use less than 2 m3/s. During floodevents, discharge increases up to 9,900 m3/s.
87
Correspondence should be addressed to:
Paul Eckert, Ph.D.Head of the Water Management DepartmentStadtwerke Düsseldorf AGAbt. Wasserwirtschaft • Höherweg 100 • 40233 Düsseldorf, GermanyPhone: +0211/8218359 • Fax: +0211/821778359 • Email: [email protected]

The production wells, situated at a distance of 50 to 350 m of the riverbank, discharge water froma sandy and gravel aquifer. Depending on the hydraulic situation, the residence time of bankfiltrate in the aquifer varies between weeks to several months.
From a water-resources perspective, bank filtration is characterized by an improvement in waterquality (Kühn and Müller, 2000). The most important effects of bank filtration include:
• Removal of particles and turbidity.
88
Duisburg
KrefeldMettmann
Düsseldorf
Mettmann
Rhine
Rhine
Staad WaterworksProtection Zones
N
Lörick Waterworks
Flehe Waterworks
NBG GmbH
Auf dem Grind Well Field
Neuss
II
IIIa
0 1 2 3 4 5 km
IIIb
Local Frontier
Figure 1. Geographic location of the Düsseldorf Waterworks.
upper layer
lower layer
Biological active filtration Activated carbon adsorption
Ozonation
Inactivation of virusis and pathogena
CorgCO2
Figure 2. The multi-protection barrier concept for drinking-water production.

• Equalization of fluctuating concentrations in river water.
• Removal of biodegradable compounds.
• Removal of bacteria, viruses, and parasites.
The efficiency of these natural attenuation processes is influenced by river-water quality and thehydraulic situation. Continuous and periodic changes of water quality must be considered togetherwith fluctuating river-water levels.
Temporal Changes Affecting Bank Filtration
During the last 30 years, Rhine River water quality has improved significantly. Many actions toreduce nutrients and pollutants were necessary. These measures comply with the best availabletechnology in production, as well as wastewater treatment along the Rhine. The return of salmonin the year 2000 is a visible sign of the success of this program.
These quality improvements were accompanied by a decrease of ammonia and DOC in riverwater. Oxygen concentrations reached saturation. The higher oxidation capacity of bank filtrateis linked to more efficient natural attenuation processes within the aquifer. This enabled theWaterworks to reduce treatment expenses.
Natural attenuation processes are affected periodically by flood events. The water level increasesup to 5 m, which leads to a higher influx of river water into the aquifer. Thus, oxygen and organiccarbon flux also increase by a factor of 3 to 4. The aerobic microbes adapted to the lower flux arenot able to degrade the entire organic carbon during flood events. Another decrease of naturalattenuation processes becomes evident in the removal of bacteria. While mostly raw water alreadyfulfills the European Drinking Water Standard, higher colony counts are observed in theproduction wells following flood events (Irmscher and Teermann, 2002; Schubert, 2002). Thesefindings explain the need of subsequent purification processes: the so-called “second protectivebarrier” (see Figure 2).
Another effect on natural attenuation processes during bank filtration is caused by changing watertemperatures throughout the year. As the temperature of the river rises quickly in the spring andsummer, the temperature of the water in the aquifer also rises, but not as quickly due to a certaintime delay. Microbial activity related to temperature leads, therefore, to a higher degradation rateof organic carbon. The organic carbon is removed more efficiently; however, it must be consideredthat, under aerobic conditions, the bank filtrate becomes more aggressive versus calcite. A flexibletreatment step must be adaptable to these changing conditions.
Conclusions
To reduce technical treatment expenses, river water of high quality, together with a profoundknowledge of the natural attenuation processes within the aquifer, is essential. At the Rhine River,successful efforts have improved water quality significantly. More efficient natural attenuationprocesses accompanied this improvement during bank filtration, which enabled the Waterworksto reduce expenses in water treatment.
Temporal changes of river-water quality and hydraulics still influence natural attenuation processesduring bank filtration. They have to be well-understood to design adequate treatment steps andto define specific target values on river-water quality. The multi-protective barrier concept,including both natural and technical purification, is still necessary to ensure drinking water ofcontinuously high standards.
89

REFERENCES
Irmscher, R., and I. Teermann (2002). “Riverbank filtration for drinking water supply – A proven method,perfect to face today’s challenges.” Water Science and Technology, 2(5-6): 1-8.
Kühn, W., and U. Müller (2000). “Riverbank filtration.” Journal AWWA, 92(12): 60-69.
Schubert, J. (2002). “Water-Quality improvement with riverbank filtration at Düsseldorf Waterworks inGermany.” Riverbank Filtration: Improving Source-Water Quality, C. Ray, G. Melin, and R.B. Linsky (eds.),Kluwer Academic Publishers, Dordrecht.
PAUL ECKERT has more than 10 years of professional experience in water-managementprojects. He was involved in the project for bank filtration (risk assessment of shock loads)funded by the Federal Ministry for Research and Technology (BMFT). Currently, as Headof the Water Management Department, he is responsible for protection zone managementat Düsseldorf Waterworks, where special investigations are performed in the field of bankfiltration and groundwater remediation. A hydrogeochemist, he specializes inhydraulic/hydrochemical modeling, the design of field studies, and the assessment of
groundwater-quality problems. Extended experience includes the application of a geographic informationsystem database for groundwater. Eckert received both an M.S. (Diplom) and Ph.D. from the University ofBochum in Germany, where he researched the efficacy of enhanced natural attenuation processes in a BTEX-contaminated aquifer with nitrate.
90

Session 5: Dynamics
An Update of the City of Guelph’s Responseto Regulation 459/00: Effective Natural In SituFiltration of Several Groundwater Under the DirectInfluence of Surface-Water Supplies
Dennis E. Mutti, P.E.Associated Engineering LimitedToronto, Ontario, Canada
Peter BusattoCity of Guelph Waterworks DivisionGuelph, Ontario, Canada
Douglas H. StendahlCity of Guelph Waterworks DivisionGuelph, Ontario, Canada
Caroline Korn, P.E.Associated Engineering LimitedToronto, Ontario, Canada
Elia Edwards, P.E.Associated Engineering LimitedToronto, Ontario, Canada
Associated Environmental Limited developed a protocol for determining GWUDI status to assistthe City of Guelph in Ontario, Canada, in assessing treatment requirements for their municipalwater supply. This protocol is based on protocols established by the United States EnvironmentalProtection Agency (USEPA) and further defined in AmericanWater Works Association ResearchFoundation Project #605. The protocol entails three stages of assessment. Stage 1 is a review ofexisting information to characterize the well as a true groundwater or GWUDI. This data includeswell construction and maintenance records, sanitary condition of the well, hydrogeological dataincluding time-of-travel estimates (well-head delineation), geological characteristics, and water-quality data. Stage 2 is initiated if there is insufficient data to make a characterization of the natureof the well in Stage 1 and consists of a period of data collection that will allow the characterizationto be completed. Wells that are characterized as GWUDI are then subject to a Stage 3 assessment,which consists of a data collection period followed by an assessment of the level of natural or in situfiltration that is occurring. If sufficient evidence of in situ filtration is shown in the Stage 3assessment, then a case can be made for waiving the chemically assisted filtration component of theminimum treatment requirement for GWUDI in the Province of Ontario. The minimum treatmentrequirements in the Province of Ontario for GWUDI sources with effective in situ filtration is 3-loginactivation for Giardia cysts and 4-log inactivation for viruses from disinfection alone.
91
Correspondence should be addressed to:
Dennis Mutti, P.E.Senior Water Treatment and Supply EngineerAssociated Engineering Limited525-21 Four Seasons Place • Toronto, Ontario M9B 6J8 CanadaPhone: (416) 622-9502 • Fax: (416) 622-6249 • Email: [email protected]

The City of Guelph’s supply system consists of a network of 21 groundwater wells and a springcollector system, augmented by artificial recharge. The Stage 1 assessment was completed for allof the City’s wells as a part of the provincially mandated Engineers’ Report. Two bedrock wells(Burke Well and Downey Well) and an overburden well system (Carter Wells 1 and 2) wereidentified as requiring a Stage 2 assessment due to insufficient existing data. The collector system(Arkell Spring and Glen Collector) was identified as GWUDI by definition and required a Stage 3assessment. The City of Guelph decided to expedite the process and collect data required for aStage 3 assessment for the three wells, as well as for the surface-water recharge and collector systemin case the wells were determined to be GWUDI.
The results of the GWUDI assessment were presented at a stakeholders meeting with keyprovincial regulators. Consensus was reached as follows:
• BurkeWell and DowneyWell are representative of true groundwater supplies and, as such,must provide disinfection as mandated by the Drinking Water Protection Regulation(2.0-log virus inactivation).
• The treatment requirement to provide chemically assisted filtration for the Carter Wells,Arkell Recharge System, and Glen Collector System should be waived as effectivenatural in situ filtration is provided through the subsurface. As such, the treatmentrequirements for Giardia cysts (3-log inactivation) and viruses (4-log inactivation) maybe provided by disinfection only.
The City of Guelph is currently negotiating treatment requirements, as well as the final wordingin its Consolidated Certificate of Approval, with the Ontario Ministry of the Environment.
DENNIS MUTTI has 13 years of progressive experience as a Project Manager and ProcessEngineer, the last 5 of these years with Associated Engineering, which provides environmentalengineering consulting services to the Ontario, Canada, market. His focus has been onprocess evaluation and development, and the design, implementation, and optimization ofwater supply and treatment systems. Mutti has worked on all types of water-supply andtreatment projects, including water-supply master plans, water treatment plant designs andupgrades, groundwater supplies, automation and Supervisory Control and Data Acquisition
(SCADA) system implementation, and start-up and commissioning. He received both a B.S. in ChemicalEngineering and an M.S. in Civil Engineering from the University of Waterloo.
92

Session 5: Dynamics
On Bank Filtration and Reactive Transport Modeling
Dr.-Ing. Ekkehard HolzbecherHumboldt UniversityBerlin, Germany
Prof.-Dr. Gunnar NützmannHumboldt UniversityBerlin, Germany
Modeling can enhance the understanding of the influence of hydraulic, transport, and biogeo-chemical processes for the development of bank filtration as an applied technology. Because acoupled three-dimensional approach, including all biogeochemical transformations, speciation,and kinetics, is not feasible nowadays in applied projects, a simpler procedure is proposed. Inthe first step, flow is calculated using analytical solutions or numerical models in two- orthree-dimension. In the second step, reactive transport is simulated in one-dimension alongflowpaths. How these two steps are performed in a project depends on the chosen software for flowand reactive transport. A simple approach is demonstrated that uses analytical solutions for flow andthe pH redox equilibrium equation (PHREEQC) for reactive transport. This approach is appropriatefor understanding processes in porous media in the direct vicinity of a surface-water body.
Flow Modeling
The simulation of reactive transport at a field site is always based on a flow model. Flow modelscan account for:
• Inhomogeneities.
• Anisotropies.
• Site-specific design of the well system.
• Irregular (usually) setting of the boundaries.
Rather complex two-dimensional or three-dimensional flow patterns emerge.
Although the capability of software has increased in conjunction with the power of hardware,there are still limiting factors for solving general three-dimensional reactive transport models.Transport models require a small spatial resolution (e.g., a high number of nodes or blocks) inwhich dependent variables are computed. Biogeochemistry requires a small temporal resolution tocapture the changes of some variables in response to changes in the system.
Numerical errors and their propagation when solving huge linear and/or nonlinear systems arehard to predict. If some well-known constraints (grid Péclet-number criterion, Courant-numberand Neumann-number criteria) are not fulfilled, numerical errors increase dramatically. The
93
Correspondence should be addressed to:
Dr.-Ing. Ekkehard HolzbecherSenior ScientistHumboldt University BerlinInstitute of Freshwater Ecology and Inland Fisheries • Müggelseedamm 310 • 12587 Berlin, GermanyPhone: +0049-30-64181 667 • Fax: +0049-30-64181 663 • E-Mail: [email protected]

resulting numerical dispersion or oscillations disturb results in that the results cannot be used forcomparisons with observations.
To couple the result of a flow model with a general geochemical approach, as given by thePHREEQC code, the flow system must be reduced to one-dimension. Flowpaths can be taken from atwo- or three-dimensional model and be used for a one-dimensional reactive transport simulation.The procedure is applicable for bank-filtration systems, as concentration gradients in transversedirections can be assumed to be much smaller than in longitudinal directions.
In the first step towards such a simulation, flowpaths are taken from analytical solutions foridealized well gallery systems. MATLAB (2002) software is applied for the analytical solution.Systems with different numbers of wells, different distances from the surface-water body, anddifferent pumping rates can be investigated. It is also possible to introduce a groundwater baseflow. Moreover, different types of boundary conditions at the bank can be considered.
Figures 1 and 2 show the results of a simulation for two wells. The calculations with analyticalsolutions, as well as the graphical representation, were made using MATLAB.
Some basic results can be obtained for a single well near a gaining stream. There is a criticalpumping rate, Qcri t , below which only groundwater is pumped. By increasing the pumping rateabove Qcri t , the share of surface water (filtrate) increases. An equal share between groundwaterand surface water is given for:
(Equation 1)
94
Figure 1. Hydraulic potential φ (m3/s) for two wells with different pumping rates and distances from asurface-water body near a gaining stream.
Q = 6.1878•Qcrit

We intend to further explore the use of analytical solutions. A numerical algorithm, whichcalculates flowpaths and travel times from the surface-water body to the wells, is currently beingtested. If combined with geochemical computations, the approach can provide a highly importanttool for the design of well galleries.
Travel times along flowpaths are obtained by numerical integration.
Reactive Transport Modeling
With the outlined strategy, the well-established PHREEQC code (new version: PHREEQC2) canbe applied for reactive transport modeling to reduce the number of spatial dimensions. ThePHREEQE code (which is the origin of PHREEQC) was mainly a geochemical speciation codeand originally not intended to be combined with a transport model. Velocity is not an input to bespecified. Instead, lengths (∆x), time step (∆t), cells (number of blocks), and shifts (number of timesteps) must be given as parameters (Parkhurst, 1995). Nevertheless, the simulated velocity vresults from the input parameters:
(Equation 2)
The so-called “mixing cell approach” for advection, which uses the operator-splitting technique, iscombined with the finite difference method for diffusion and proves to be competitive with advancednumerical techniques. Errors from the discretization advection term are successfully suppressed.
PHREEQC can also be used for variable velocity along flowpaths. The time step in Equation 2 isfixed, but grid spacing varies locally, taking velocity changes into account. Small velocities resultin small ∆x and high velocities in large ∆x.
95
Figure 2. Streamlines for two wells with different pumping rates and distances from a surface-water body neara gaining stream.
ν = ∆x /∆t

As an alternative to PHREEQC for certain tasks, a new model based on MATLAB is currently indevelopment. The model is being tested in a number of benchmark studies. Figure 3 shows theresults of the MATLAB model for a test of redox sequences, as compared with PHREEQC output.
In the MATLAB model, valence electron balances are obtained using an adequate conceptual-ization of operational valence electron balancing. Redox equilibrium modeling, including kineticsfor organic carbon biodegradation and operational valence electron balancing to the equilibriummodule, yields automatically to a correct choice of electron acceptor.
For non-redox equilibrium systems, which incorporate proton and component mass balances andmass action equations, the operational valence electron balance and the electron (e–) as formalspecies entering mass action equations — derived from redox half reactions — are considered.Since free electrons are generally not observed in aqueous solutions (Thorstenson, 1984),operation valence electron balancing has to be carried out by adapting the share of differentvalence states of heterovalent components (in a sense, valence electron “bookkeeping”) (Appeloand Postma, 1996).
In inorganic redox systems, the sum of mobile operational valence electrons is an additionaltransport species. In the presence of biodegradation redox reactions (which supply additionalcarbonate species to the system), the actual operation electron balance has to be corrected by thecarbonate species arising from biodegradation, as pointed out by Brun and Engesgaard (2002).
A test case including hydrodynamic transport to the redox system was set up using MATLAB. Atthe inlet of the model column, a solution that is rich in mobile organic matter infiltrates into anaquifer void of organic matter, but contains oxygen, nitrate, and sulphate as electron acceptors.Unlike Redox Test Case 1, ammonium (N[–3]) is included in the equilibrium reaction framework.During infiltration, a steady-state redox zone is simulated similar to the redox zone observed at
96
Figure 3. Reactive transport (redox) test case: Redox zoning after a 1-year simulation timeframe.
CH20 MATLAB
N(0) PHREEQE
S-2 MATLAB
02 PHREEQC
CH20 PHREEQC
N(-3) MATLAB
S(-2) PHREEQC
pH MATLAB
N(5) MATLAB
N(-3) PHREEQC
HCO3 MATLAB
pH PHREEQC
N(3) PHREEQC
S(6) MATLAB
HCO3 PHREEQC
pe MATLAB
N(0) MATLAB
S(6) PHREEQC
O2 MATLAB
pe PHREEQC
16.00
14.00
12.00
10.00
8.00
6.00
4.00
2.00
0.00
–2.00
–4.00
–6.00
5.00E-03
4.50E-03
4.00E-03
3.50E-03
3.00E-03
2.50E-03
2.00E-03
1.50E-03
1.00E-03
5.00E-04
0.00E-000.00 10.00 20.00 30.00 40.00 50.00 60.00 70.00 80.00 90.00 100.00
x [m]
pH.p
E[ –]
Conc
entra
tion
[mol
/L]

well galleries near the Unterhavel (Berlin). The distance from the inlet at which the redoxcline(a large jump in the redox state) is expected depends on:
• Hydrodynamic parameters in relation to the first-order organic matter decay constant.
• Initial redox state (operational valence electron balance).
• Initial electron-acceptor concentrations.
• Availability of reactive organic matter.
These are the main sensitivity parameters that determine the extent of redox zoning.
Figure 3 shows the simulated steady-state species and pH/oxidation-reduction (redox) potential (pE)distribution along the model transect. The simulation reached steady-state concentrations after a150-day simulation time. The pE profile shows the typical variation caused by aerobic respiration(pE buffering at +15), denitrification (pE buffering at +12 to +14), and sulphate reduction(pE buffering at –3). The profiles of oxygen (O2) concentrations, nitrate (N[5]), and sulphate(S[6]) concentrations also are figured so that the changes of pE are explained straightforwardly.Because ammonium (N[–3]) is incorporated into the speciation, elemental nitrogen (N[0]) willnot be the end step of the nitrogen species, but will be reduced to ammonium in conjunction withthe sulphate-reduction step.
Outlook
The outlined coupling strategy for flow and reactive transport is intended to be applied on realsites. Flow simulation will be done using MODFLOW (Harbaugh et al., 2000) or FEFLOW (2002)for site-specific models and by analytical solutions for conceptual models concerning well-gallerydesign. For reactive transport, there is the choice between PHREEQC and MATLAB.
REFERENCES
Appelo, C.A., and D. Postma (1996). Geochemistry, groundwater and pollution, Balkema, Rotterdam.
Brun, A., and P. Engesgaard (2002). “Modeling of transport and biogeochemical processes in pollutionplumes: literature review and model development.” Journ. of Hydrology, 256: 211-227.
FEFLOW (2002). Finite element, subsurface flow & transport simulation system, WASY, Berlin, Germany.
Harbaugh, A.W., E.R. Banta, M.C. Hill, andM.G.McDonald (2000).MODFLOW-2000, the U.S. GeologicalSurvey modular ground-water model — User guide to modularization concepts and the Ground-Water Flow Process,U.S. Geological Survey Open-File Report 00-92, 121p.
MATLAB (2002). MATLAB the language of technical computing, The MathWorks, Inc., Natick, MA.
Parkhurst, D.L. (1995). PHREEQC: A computer program for speciation, reaction-path, advective transport, andinverse geochemical calculations,U.S. Geological Survey, Water Res. Invest. Report 95-4227, Lakewood, 143p.
Thorstenson, D.C. (1984). The concept of electron activity and its relation to redox potentials in aqueousgeochemical systems, Open-File Report 84-072, U.S. Geological Survey Denver, Colorado.
97

Mathematician EKKEHARD HOLZBECHER has worked the field of groundwaterscience and applications since 1984. Most of his projects are related to numericalmodeling. Past projects include investigating the safety of nuclear waste repositories inGermany, saltwater intrusion in the Nile-Delta in Egypt, geothermal flow in Japan, andabandoned industrial sites in Germany. Currently, he is investigating various problemsregarding eco-hydrology. Since 2002, Holzbecher has been a Senior Scientist withHumboldt University in Berlin, where he teaches groundwater and transport modeling
courses, and participates in the Natural and Artificial Systems for Recharge and Infiltration project. He wasalso involved in the international Groundwater Hydrology Modeling Strategies for Performance Assessment ofNuclear Waste Disposal (HYDROCOIN) project and is a member of the United Nations Educational,Scientific and Cultural Organization (UNESCO) working group for the Development and Calibration ofCoupled Hydrological/Atmospheric Models. Holzbecher received a Ph.D. from the Civil EngineeringDepartment at the Technical University Berlin and the German degree of Habilitation (qualification for atenure professorship) at the Faculty of Geosciences at the Free University Berlin, where he is now aPrivatdozent.
98

Dinner Presentation
Hydraulic Sensitivities and Reduction PotentialCorrelated with the Distance Betweenthe Riverbank and Production Well
Bernhard Wett, Ph.D.University of InnsbruckInnsbruck, Austria
Objectives
Beginning with a detailed case study of a RBF system at the alpine river, Enns, in Austria, someaspects of the question, “In what ways do specified hydraulic parameters affect water quality (e.g.,what is the appropriate well distance from the riverbank)?” are elaborated. In addition tomonitoring data, numerical sensitivity analyses will be applied to display interactions betweenwell distances, filtrate production, and reduction processes.
Methodology and Site Description
The investigated RBF well is situated about 50 m from the bank of the oligotrophic alpine river,Enns, at the beginning of the 5-kilometer long reservoir of the HPP Garsten power plant (Figure 1).At this particular location, the river stage (as determined by a dam) is 302.0 m above sea level andshowed only minor elevations when discharge varied from about 70 to 540 m3/s during a 1-yearmeasurement period. Since the riverbed is cut into the dense flysch zone, river water infiltratesalmost exclusively through the bank and not the bottom. Between the river and well, aquiferthickness is about 5 m, and the total thickness of the gravel layer is 15 m (Ingerle et al., 1999;Wett et al., 2002).
Organic loading is very low (the DOC concentration varies between 1 and 2 mg/L), and riverwater is saturated with oxygen (greater than 10 mg/L). Groundwater quality reflects the trends ofland use and the intensity of agriculture along the river. The further downstream of the river, thehigher the nitrate and pesticides concentrations are in groundwater. In the region of the filtrationsite, groundwater shows nitrate concentrations of about 50 mg/L. The enrichment of groundwaterby river filtrate (less than 5 mg/L nitrate) offers a solution to obtain nitrate concentrations inagreement with drinking-water standards.
A high-grade steel box with windows for visual observation and video recording of riverbed cloggingwas installed in the riverbank. One set of five probes was installed at the upstream side of the box innatural sediment (multi-level Probe F at depths between 0.1 and 0.9 m beneath the riverbed surface),and two sets of five probes (D and E) were installed downstream in specified filter sand (0 to 4 mm)to measure hydraulic heads and obtain water samples. Water levels in the probes correspond with thelevels of graduated glass pipes within the steel box. An analysis of hydraulic head data and relativevariations of head differences allows for filter velocity calculations. Higher hydraulic conductivity in
99
Correspondence should be addressed to:
Bernhard Wett, Ph.D.Scientific Researcher and LecturerInstitute of Environmental EngineeringUniversity of Innsbruck • Technikerstr. 13 • A-6020 Innsbruck, AustriaPhone: +43 512 507 6926 • Email: [email protected]

the filter sand causes a significantly higher filter velocity than in natural sediment (the mean filtervelocity is 1.99 × 10⁻⁵ m per second and 0.83 × 10⁻⁵ m per second, respectively).
Results
In general, microbial metabolism and degradation processes require both electron donators andacceptors. Depending on the site and its inherent boundary conditions, an oligotrophic riverwould have carbon as a limiting factor. The lack of electron donators can be compensated for bylong hydraulic retention in organic-rich sediment layers at high water temperatures. A longretention time (represented by low infiltration rates in Figure 2) in the most biologically activezone near the water-sediment interface drives the balance between the availability of electrondonators and acceptors towards higher oxygen consumption. The arrow indicating the influenceof hydraulic parameters refers to the distance d from the river to the production well, hydraulic
Figure 1. Schematic overview and cross-section of the RBF site on the Enns River, a tributary ofthe Danube River.
Figure 2. Limitations of microbial metabolism in the riverbank and their balancing factors.
100

conductivity k (especially of the riverbed), aquifer thickness H, and production rate QBF.Additionally, an increase in temperature causes a decrease in water viscosity and, therefore, createshigher hydraulic conductivity (this is a 50-percent increase in the presented case study).
It is a known fact that particulate organic matter deposited in the riverbed represents an importantcarbon pool (Bretschko and Moser, 1993). The metabolized mass of particulate organic carbon canbe estimated from the respiration of the sediment community to identify the dominant carbonsource. The difference between total hyporeic respiration and DOC respiration, as depicted inFigure 3, describes a substantial gap in the mass balance between carbon fluxes in and out of theriverbed. In the case of increased DOC loads of the filtrate, the microbial community can adaptas long as electron acceptors are available (e.g., basin maturation for soil-aquifer treatment ofpercolated secondary effluent occurs within a few months) (Quanrud et al., 2003). Reactivetransport models can describe the relatively quick development from electron donator limitationtowards electron acceptor limitation (Lensing et al., 1994).
Figure 4 demonstrates influences on microbial reduction processes both by temperature and flowvelocity: the oxygen and nitrate of the electron acceptors show the highest peaks during the winterseason (the oxygen concentration approaches saturation at water temperatures of 2-degrees Celsiusin February) and drop to low points during the summer season (8.5-mg/L oxygen [O2] in Station Eand 4.5-mg/L O2 in Station F in July, when water temperature reaches 15-degrees Celsius). Thisperiod of increased oxygen depletion corresponds with concentration peaks of iron and manganese.
The mean oxygen depletion during the summer season in the riverbed achieves 4.0-mg/L O2 atBore F and 2.8-mg/L O2 at Bore D. These respiration rates include a portion for DOC immobili-zation of 25 and 19 percent, respectively (see Figure 3). Hence, both DOC immobilization and
101
Figure 3. Seasonal variation of DOC immobilization (∆DOC), total hyporheic carbon respiration (HCR),and the difference between ∆DOC and HCR in the riparian zone (0.9 to 1.0 m from the sediment-water interface, with Stations C and F in natural sediment and Stations D and E in specified filtersand) (Brugger et al., 2001).
month (1997/1998)
DOC immobilization C respiration
DOC
immob
iliza
tion/microbial
Cresp
iratio
n(µ
mol
Cpe
rL)
(non
-DOC)-C
resp
iratio
n(µ
mol
Cpe
rL)
(non-DOC)-C respiration
Station C Station D
Station F Station E

total hyporheic carbon respiration are significantly higher in Infiltration Area F, where the filtervelocity is 58 percent lower than at Bore D. These results suggest that monitored degradationprocesses are limited by available retention time and that the hydrolyses of particulate organicmatter is the time-limiting process step.
The spatial distribution of oxygen, as presented in Figure 5, clearly shows the influence ofretention time on reduction processes. During the migration time in the first meter of the flowpathin natural sediment, the oxygen concentration drops to a minimum level and the subsequentrecovery is attributed to mixing with oxygen-enriched water.
In the following section, a calibrated model of the presented site serves as the initial situation (plotand cross-section in Figure 6) of a systematic parameter investigation. The linear sensitivityanalysis uses a function, δ v,p, to quantify the sensitivity of the model response to a unit change in
102
Figure 4. Courses of oxygen, nitrate, iron, and manganese concentrations at Station E in riverbed zones withlow hydraulic conductivity and at Station F with higher conductivity during the 1-year monitoringperiod (0.9 to 1.0 m from the sediment-water interface).
Figure 5. Oxygen concentration profiles along the flowpath from the river to the well,starting from four different infiltration areas (Stations D and E in naturalsediment, July 27, 1998).

parameter value:
δv,p = where p = parameter and v = output variable (model response).
The larger the value of the function, the more significant the specific parameter is for modelbehavior. The applicability of this form is limited to linear cause-and-effect relationships or smallparameter variations. The results in Table 1 outline the major influence of riverbed cloggingkA/ kBF on filtrate production QBF and well distance d on the total migration time HRT andmaximum infiltration rate vmax.
103
Figure 6. Initial conditions of numerical sensitivity analyses (MODFLOW software).
dv/ vdp/ p
dv,p kA / kBF kA QProd. d H
HRT [d] 0.24 0.33 –1.01 1.89 1.20
QBF [%] –0.25 –0.15 0.03 –0.18 0.17
vmax [m/h] –0.44 –0.44 0.89 –0.76 –0.89
Table 1. Comparison of Parameter Sensitivities to Hydraulic Properties of the Considered RBF Site
HRT = Hydraulic retention time. QBF = Filtrate portion. vmax = Maximum infiltration rate.

Conclusions
Biologically mediated degradation processes mainly occur at the first meter of the flowpath fromthe river to the well. Hydraulic retention in this layer and infiltration rates, respectively, arecrucial parameters of additional particulate carbon respiration. Infiltration velocity, in turn,depends on the site-specific hydraulic setting, especially on production rate, well distance, andaquifer thickness. The appropriate selection of these parameters, therefore, should aim towardsachieving preferable hyporheic conditions.
Acknowledgements
Basic results presented in this paper have been achieved by close interdisciplinary cooperation in thecourse of a research project coordinated (Ch. Hasenleithner) and funded by the Ennskraft Company.
REFERENCES
Brettschko, G., and H. Moser (1993). “Transport and retention of matter in riparian ecotones.” Hydrobiologia,251: 95-102.
Brugger, A., B. Wett, I. Kolar, B. Reitner, and G.J. Herndl (2001). “Immobilization and bacterial utilizationof dissolved organic carbon entering the riparian zone of the alpine Enns River, Austria.” Aquatic MicrobialEcology, 24(2): 129-142.
Ingerle, K., A.P. Blaschke, A. Brugger, C. Hasenleithner, G.J. Herndl, H. Jarosch, I. Kolar, H.J. Lensing, S.Pöschl, N. Quéric, B. Reitner, F. Schöller, R. Sommer, and B. Wett (1999). Forschungsprojekt Uferfiltrat(Research project bank filtration), Research Initiative Verbund, Vienna, 60, 43-78.
Lensing, H.J., M. Vogt, and B. Herrling (1994). “Modeling of biologically meditated redox processes in thesubsurface.” J. of Hydrology, 159: 125-143.
Quanrud, D.M., J. Hafer, M.M. Karpiscak, J. Zhang, K.E. Lansey, and R.G. Arnold (2003). “Fate of organicsduring soil-aquifer treatment: sustainability of removals in the field.” Wat. Res., 37: 3,401-3,411.
Wett, B., H. Jarosch, and K. Ingerle (2002). “Flood induced infiltration affecting a bank filtrate well at theRiver Enns, Austria.” J. of Hydrology, 266(3-4): 222-234.
BERNHARD WETT has been a Scientific Researcher at the Department of EnvironmentalEngineering at the University of Innsbruck in Austria for 9 years. His recent scientificwork has focused on the separate biological treatment of rejection water — a majorinteraction between the wastewater and the sludge lane of a treatment plant. With regardto riverbank filtration and its relation to flooding events, he has conducted aninterdisciplinary project together with various companies and universities over the pastseveral years. The central question of these investigations was the vulnerability of
riverbank-filtration waterworks, in regard to both hydraulic and water-quality aspects. Wett participates inworking groups of national water associations (Wastewater Technology Association, Austrian Water-andWaste Management Association) and in the EU-COST-624 Action. He lectures in various fields ofenvironmental engineering, including numerical methods of groundwater flow modeling. Wett received anM.S. in Civil Engineering and a Ph.D. in Engineering Science-Environmental Engineering from theUniversity of Innsbruck.
104
Keynote Presentation
Riverbank Filtration: The European Experience
Prof. Dr.-Ing. Martin JekelTechnical University of BerlinBerlin, Germany
Prof. Dr.-Ing. Thomas GrischekUniversity of Applied SciencesDresden, Germany
Introduction
The first historical citation of a small bank filtration system for a village dates back to 1798 in aGerman text entitled, About Water. It describes a construction procedure for artificial bankfiltration into a dug well, about 2 m from a turbid creek. The intermediate space is filled with sandto remove pollution during gravity flow into the well. The sand is replaced twice a year toguarantee sufficient yield. Thus, we interpret this treatment as a combination of RBF and slowsand filtration, two techniques still widely used and known as effective physical and biologicalfilters with many similarities.
In Europe, more than 130 years of experience exist in the O&M of large bank-filtration schemes.The oldest operating RBF waterworks were founded in the 1870s in Germany and The Netherlandsduring the introduction of centralized water supply in urban areas. The most important sites aresituated along the Danube, Rhine, and Elbe rivers, and the lakes in the City of Berlin area. A largevariety of schemes has been designed and operated according to site-specific conditions. Manyresearch projects have been conducted within the last 20 years to study attenuation processesduring bank filtration.
Relevance of Riverbank Filtration in Europe
Groundwater derived from infiltrating river water provides 45 percent of drinking-water supplies inHungary, 16 percent in Germany, 5 percent in The Netherlands, and 50 percent in the SlovakRepublic. In Germany, the City of Berlin depends on bank filtration for about 60 percent of itsdrinking water. The City of Düsseldorf, situated on the River Rhine in Germany, is entirely suppliedwith drinking water derived from bank filtration. Budapest, the capital of Hungary, also depends100 percent on bank filtration. Waterworks in many other cities (e.g., Cologne, Dresden, Zurich,Lindau, and Maribor) rely on bank filtrate as an important resource. In Finland, 217 waterworks usebank-filtration techniques as part of their water-treatment process (Kivimäki, 1995).
Besides known bank-filtration sites, there are many groundwater works where bank filtration isnot planned and is unintentional, especially within periods of high surface-water levels duringfloods.
105
Correspondence should be addressed to:
Prof. Dr.-Ing. Martin JekelProfessor, Department of Water Quality ControlTechnical University of BerlinSekr. KF 4 • Strasse des 17. Juni 135 • 10623 Berlin, GermanyPhone: +(30) 314 - 25058 • Fax: +(30) 314 - 23313 / 23850 • Email: [email protected]

Geohydraulic Characteristics
Grischek et al. (2002) provide an overview on the geohydraulic characteristics of differentbank-filtration sites in Europe. Typical aquifers used for bank filtration consist of alluvial sand andgravel deposits and have a hydraulic conductivity higher than 1 × 10⁻⁴ m per second. Thethickness of the exploited alluvial aquifers covers a wide range. Along the Danube River in theSlovak Republic and Elbe River in Germany, aquifer thickness exceeds 50 m. Along the Lot Riverin France and Neckar River in Germany, boreholes are operated in shallow aquifers of about 5-mthickness. The distance between production wells and the bank of the river or lake is, in general,more than 50 m. Excluding some sites in The Netherlands and along the Danube River in theSlovak Republic, travel times are mostly between 20 and 300 days.
In some countries, a travel time minimum of 50 days is proposed because an accepted rule ofthumb assumes that about 50 days are sufficient to obtain pathogen-free water. But, recent findingsunderline that other factors, such as surface area (flowpath length), riverbed properties, and redoxconditions, play an important role in removing pathogens.
At most sites, vertical wells are in operation. At sites with a high aquifer thickness (for example,Kalinkovo in the Slovak Republic), vertical wells have screen lengths of 40 m, allowing highabstraction rates. Older systems often include siphon pipes connected to vertical well gallerieswith low abstraction rates (for example, Karany in the Czech Republic and Dresden-Tolkewitz inGermany). Horizontal wells are used at sites with high abstraction rates, such as in Düsseldorf,Germany, and Budapest, Hungary.
Riverbeds at RBF sites are normally cut into an underlying sand and gravel aquifer, resulting indirect hydraulic contact of the river and aquifer. At many RBF sites, erosive conditions in the riverlimit the formation of a siltation layer. Detailed research to understand the specific mechanismscontrolling clogging has been undertaken on the Rhine River (Schubert, 2001), Enns River(Ingerle et al., 1999), and Elbe River (Heeger, 1987). At most rivers, infiltration occurs in theareas between the bank adjacent to the wells and the middle of the river, sometimes over thewhole width of the river. At the Rhine River, partial clogging of the riverbed limits infiltrationnear the bank adjacent to the wells. The riverbed infiltration zone is fairly clean, but other areasare coated with a layer of about 1-millimeter thickness. Sand ripples also develop. Under rapidlychanging river levels, the riverbed is cleaned (Schubert, 2000). The other case is observed atimpounded river lakes in Berlin, where infiltration occurs mainly via the bank because thickorganic mud layers at the bottom of lakes have low hydraulic conductivity.
Surface-Water Quality
In general, organic carbon concentrations (TOC) in river waters used for RBF are between 1 and 6 mg/L.The lakes of Berlin are higher in TOC, up to 10 mg/L, due to natural fulvic acids, effluent organicmatter, and algal growth. In Finland, where NOM concentrations contribute to TOC values of4 to 15 mg/L, problems are associated with natural humic substances and DBP formation.Temperature variations in most rivers range from zero to 25-degrees Celsius, and the pH is between6 and 8.
Since the late 1950s, the water quality of large rivers in Europe began to deteriorate. Highwastewater input threatened the use of bank filtrate. Furthermore, spectacular spills (for example,the Sandoz accident on November 1, 1986 [Sontheimer, 1991]), underlined the need forsanitation measures and pollution control. The activities of waterworks and water-industryassociations, authorities and industries, transborder programs, and the closure of industries all
106

resulted in a significant improvement of river-water quality (e.g., the Rhine River since 1980 to1985 and the Elbe River since 1990). Historic water-quality records show a strong decrease in theconcentrations of phosphate, polynuclear aromatic hydrocarbon compounds, pesticides such asatrazine and mecoprop, and biodegradable organic carbon.
Raw-Water Quality
A summary evaluation of elimination processes at bank-filtration sites in The Netherlands showedan effective, sustainable, and redox-independent elimination of polycyclic aromatic hydrocarbons,polychlorinated biphenyls, chloroorganic pesticides, bromoform, dichloroaniline, nitrobenzene,nitrotoluene, and chlornitrobenzene (Stuyfzand, 1998). Anoxic conditions cause an effectiveelimination of pesticides, such as atrazine, diurone, and simazine, which are less (or not) degradedunder aerobic conditions.
During bank filtration at the Rhine River, the concentrations of DOC, AOX, and sulphurcompounds in Rhine water are reduced by more than 50 percent during a mean retention time ofthe infiltrate in the aquifer of 6 to 8 weeks (Brauch and Kuehn, 1988). Concentrations ofmalodorous compounds such as geosmin and monoterpenes decrease through degradationprocesses during bank filtration by 80 to 99 percent (Juettner, 1995). During bank filtration atSchlachtensee, Wannsee, and Tegeler See lakes in Berlin, Germany, algae-born terpenes causingmalodor of lake waters were not found in bank filtrate (Chorus et al., 1992). Complex studies onbiogeochemical reactions are reported by Bourg and Bertin (1993), Sontheimer (1991), andNestler et al. (1998).
The long-term monitoring of water quality has demonstrated the effective removal of a range ofcontaminants, including ammonium and polar compounds. Results from monitoring programs atsites on the Rhine, Elbe, and Danube rivers and at Tegel Lake have been recently summarized byKuehn and Mueller (2000), Brauch et al. (2000), Grischek (2002), Mucha et al. (2002), and Fritz(2002), respectively.
Drinking-Water Treatment
In the 1960s and 1970s, one of the major problems was bad odor of drinking water derived frombank filtrate. The main ways to solve this problem were a reducing the organic load of the riverwater and using GAC filtration as a post-treatment step (Sontheimer, 1980).
At some sites, advanced technologies such as ozone treatment, biological filtration, or GACadsorption were established to treat the pumped infiltrate (e.g., along the Rhine River). At othersites, simple treatment technologies, such as pH-adjustment, aeration with sand filtration for ironand manganese removal, or disinfection by chlorine, are sufficient for meeting today’s drinking-water standards (e.g., along the Elbe River). The necessary treatment steps are still in discussion,especially due to recent findings of persistent organic trace compounds in bank filtrate.
In Germany, different tests have been developed to classify compounds into compound classes thatare not removed during aquifer passage and not removed by common drinking-water treatment(Sontheimer, 1991; Mueller et al., 1993). This concept has been used to identify compounds thatare problematic in terms of drinking-water quality and to initiate source control measures forreducing the input of these mobile substances into receiving rivers.
107

Problems
At several sites (e.g., Budapest, Hungary and Dresden, Germany, or at the lower Rhine River), thequality of backside groundwater beneath the river floodplain, especially regarding the nitrateconcentration, is becoming a greater problem than bank-filtrate quality.
Problems with persistent organic compounds (e.g., pharmaceuticals) are reported for bankfiltration in Berlin, Germany, where the percentage of surface waters comprised of municipalsewage effluents is relatively high (Ziegler et al., 2000, 2002). Recent work has shown thatpharmaceuticals, with sources including feed additives, animal drugs, and human medical care,can be persistent in the aquatic environment. Trace-level analysis shows the presence of drugresidues such as clofibric acid (a metabolite of a blood lipid regulator in medical care) in municipalsewage effluents and in receiving surface waters. As polar compounds, clofibric acid and severalother pharmaceuticals, such as diclofenac, propyphenazone, carbamazepine, and primidone, arehighly mobile (Heberer, 2002). Findings of pharmaceutical residues in drinking water are notdesirable from a hygienic point of view; nevertheless, from today’s knowledge, these lowconcentrations do not have any toxicological impacts on human health. A limited removal of thepolar drug residues is possible using activated carbon filtration. In summary, polar-peristentsynthetic organic contaminants such as pharmaceuticals and industrial compounds require greaterattention to assess the possibility, if any, of attenuation during bank filtration.
This topic is one of the major issues in a large-scale research program of the new Berlin Centre ofCompetence on Water, called NASRI, which commenced in May 2002. Research activities includeseveral field-site investigations with bank filtration and recharge, as well as semi-technical andlaboratory studies on hydrogeology, modeling, algal toxins, viruses and bacteria, natural andanthropogenic organic compounds, and the clogging processes. Results will be presented in thissurvey, as well as in other presentations out of the NASRI-group at this conference.
Conclusions
For the future, bank filtration is viewed as a promising approach to increase limited groundwaterresources and to provide a sustainable pretreatment step with multiple-barrier functions regardingchemical and microbial parameters.
A new period in the exchange of worldwide experience started in November 1999 with theInernational Riverbank Filtration Conference in Louisville, Kentucky (United States), followed by aworkshop on the Attenuation of Groundwater Pollution by Bank Filtration in June 2000 in Dresden,Germany, an International Riverbank Filtration Conference in November 2000 in Düsseldorf, Germany,and a NATO Advanced Research Workshop on Riverbank Filtration on Understanding ContaminantBiogeochemistry and Pathogen Removal, which was held in September 2001 in Tihany, Hungary.
REFERENCES
Bourg, A.C.M., and C. Bertin (1993). “Biogeochemical processes during the infiltration of river water intoan alluvial aquifer.” Environ. Sci. Technol., 27(4): 661-666.
Brauch, H.-J., and W. Kuehn (1988). “Organische Spurenstoffe im Rhein und bei der Trinkwasserauf-bereitung.” gwf Wasser Abwasser, 129(3): 37-44 (in German).
Brauch, H.-J., U. Mueller, and W. Kuehn (2000). “Experiences with riverbank filtration in Germany.”Proceedings, International Riverbank Filtration Conference, IAWR, 4: 33-39.
Chorus, I., G. Klein, J. Fastner, and W. Rotard (1992). “Off-flavors in surface waters - How efficient is bankfiltration for their abatement in drinking water?” Wat. Sci. Technol., 25(2): 251-258.
108

Fritz, B. (2002). Uferfiltration unter verschiedenen wasserwirtschaftlichen, hydrogeologischen und hydraulischenBedingungen. (Investigations of river bank filtration influenced by different hydrogeological, hydraulic and watermanagement systems), PhD thesis, Free University of Berlin (in German).
Grischek, T. (2002). Zur Bewirtschaftung von Uferfiltratfassungen an der Elbe. (Management of bank filtrationsites along the River Elbe), PhD thesis, Dresden University of Technology (in German).
Grischek, T., D. Schoenheinz, E. Worch, and K. Hiscock (2002). “Bank filtration in Europe - An overviewof aquifer conditions and hydraulic controls.” Management of aquifer recharge for sustainability, P. Dillon (ed.),Swets & Zeitlinger, Balkema, Lisse, 485-488.
Heberer, T. (2002). “Occurrence, fate, and removal of pharmaceutical residues in the aquatic environment:a review of recent date.” Toxicology Letters, 131: 5-17.
Heeger, D. (1987). Investigations on clogging of river beds, Unpublished PhD-thesis (in German).
Ingerle, K., A.P. Blaschke, A. Brugger, C. Hasenleithner, G.J. Herndl, H. Jarosch, I. Kolar, H.J. Lensing, S.Pöschl, N. Queric, B. Reitner, F. Schoeller, R. Sommer, and B. Wett (1999). Forschungsprojekt Uferfiltrat(Research Project Bank Filtration), Research Initiative Verbund, Vienna 60 (in German).
Kivimäki, A.L. (1995). “Production of artificially recharged groundwater using bank filtration” Publication ofthe Water and Environment Administration 573, Helsinki, Finland (in Finnish).
Kuehn, W., and U. Mueller (2000). “Riverbank filtration: An overview.” Journal AWWA, 92, (12): 60-69.
Mucha, I., D. Rodak, Z. Hlavaty, and L. Bansky (2002). “Groundwater quality processes after bankinfiltration from the Danube at Cunkovo.” Riverbank Filtration: Understanding Contaminant Biogeochemistryand Pathogen Removal, C. Ray (ed.), Kluwer Academic Publishers, The Netherlands, 177-219.
Mueller, U., B. Wricke, and H. Sontheimer (1993). “Wasserwerks- und trinkwasserrelevante Substanzen inder Elbe.” Vom Wasser 81, 371-386 (in German).
Nestler, W., W. Walther, F. Jacobs, R. Trettin, and K. Freyer (1998). “Water production in alluvial aquifersalong the River Elbe.” UFZ-Research Report 7, 203 p. (in German).
Schubert, J. (2001). “How does it work? Field studies on riverbank filtration.” Proceedings, InternationalRiverbank Filtration Conference, 2-4 Nov. 2000, Düsseldorf, Germany, IAWR-Rheinthemen 4, 41-55.
Schubert, J. (2000). “Entfernung von Schwebstoffen und Mikroorganismen sowie Verminderung derMutagenität bei der Uferfiltration (Removal of suspended matter and microorganisms and reduction ofmutagenity during bank filtration).” gwf Wasser Abwasser, 14(1/4): 218-225 (in German).
Sontheimer, H. (1980). “Experience with riverbank filtration along the Rhine River.” Journal AWWA,72: 386-390.
Sontheimer, H. (1991). Drinking water from the River Rhine? Academia Verlag, Sankt Augustin (in German).
Stuyfzand, P.J. (1998). “Fate of pollutants during artificial recharge and bank filtration in the Netherlands.”Artificial Recharge of Groundwater, Balkema, Rotterdam, 119-125.
Ziegler, D., C. Hartig, S. Wischnack, and M. Jekel (2000). “Behaviour of dissolved organic compounds andpharmaceuticals during lake bank filtration in Berlin.” Proceedings, International Riverbank FiltrationConference, IAWR, 4: 151-160.
Ziegler, D., C. Hartig, S. Wischnack, and M. Jekel (2002). “Organic substances in partly closed water cycles.”Management of aquifer recharge for sustainability, P. Dillon (ed.), Swets & Zeitlinger, Balkema, Lisse, 161-167.
109

Water chemist and treatment engineer MARTIN JEKEL has about 28 years of experiencein the field of water and wastewater treatment, as well as in water-quality analysis. Since1988, he has been a full Professor for water-quality control at the Institute forEnvironmental Engineering of the Technical University of Berlin. His research interestsinclude the development of the “Muelheim Process” for drinking-water treatment, basicand applied studies on the preoxidation mechanisms in coagulation of water treatment,advanced treatment processes for indirect potable water reuse, a new adsorption technique
with Granular Ferric Hydroxide for solving the worldwide problem of arsenic in groundwater, and theanalysis and fate of new organic trace organics, such as iodinated X-ray contrast agents. During the last5 years, he has conducted several studies on the processes of organics removal in lake bank filtration in theBerlin area, and he is Scientific Coordinator of Natural and Artificial Systems for Recharge and Infiltration,one of the largest bank-filtration and recharge research programs worldwide. Jekel received a diploma(M.Sc.) in Chemistry, a Ph.D. in Chemical Engineering, and the German degree of Habilitation(qualification for a tenure professorship) at the University of Karlsruhe, Germany.
110

Session 6: Microorganisms
Using Microscopic Particulate Analysisfor Riverbank Filtration
Jennifer L. Clancy, Ph.D.Clancy Environmental Consultants, Inc.St. Albans, Vermont
William D. GollnitzGreater Cincinnati Water WorksCincinnati, Ohio
Microscopic Particulate Analysis has been used since the mid-1980s as a tool to examine thenature of biological particulates in water. This methodology is used for two purposes:
• To examine groundwater for the presence of biological surface-water indicators. Thesespecies may indicate that the groundwater source is GWUDI and, hence, subject to therequirements of the Surface Water Treatment Rule.
• To determine filtration efficiency by comparing the types of particulates in raw andfinished waters. The log removal of particulates is calculated to determine the efficiencyof the filtration process. Both full-scale and pilot processes can be evaluated usingMicroscopic Particulate Analysis.
Microscopic Particulate Analysis samples are collected by filtering a relatively large volume ofwater through a cartridge filter. The sample is generally several hundred gallons, but volume canbe adjusted depending on the type of sample. The filter is shipped overnight on ice to the laboratory.The filter is cut apart and the fibers washed or backwashed directly (Envirochek capsule) toremove particulate matter. The particulates are concentrated into a pellet, a portion of which maybe subjected to buoyant density gradient centrifugation to separate biological particulates fromheavier debris. This material is examined in two ways:
• Direct microscopic observation using brightfield and phase or differential interferencecontrast to identify, enumerate, and classify biological particulates.
• A portion of the sample may be stained using fluorescent monoclonal antibodies specifictoGiardia cysts andCryptosporidium oocysts. The sample is examined using epifluorescencemicroscopy to detect the presence of these parasites.
The data are reported as the numbers and types of biological particulates. Categories include, butare not limited to, algae, diatoms, rotifers, crustaceans, insects, protozoa, plant debris,Giardia cysts,and Cryptosporidium oocysts. The log reduction of each bio-indicator category is determined bycomparing the numbers of particulates in raw and finished water samples. A filtration performancerating is determined, and the significance of any additional data or observations is explained.Other information that can be obtained includes the presence of alum/polymer floc, carbon fines,
111
Correspondence should be addressed to:
Jennifer L. Clancy, Ph.D.PresidentClancy Environmental Consultants, Inc.P.O. Box 314 • St. Albans, Vermont 05478 USAPhone: (802) 527-2460 • Fax: (802) 524-3909 • Email: [email protected]

and other material in the finished water. The overall microscopic quality of the water can be readilyassessed using Microscopic Particulate Analysis. If a surface-water sample has been analyzedsimultaneously, a comparison of particulates in surface-water and groundwater samples can be made.
The rationale in examining groundwater using Microscopic Particulate Analysis is that ifsurface-water indicators are observed, then the source may be at risk for contamination byGiardiacysts and Cryptosporidium oocysts. Groundwaters that are at risk of surface-water influence areconsidered to be surface waters under the Surface Water Treatment Rule and are required tocomply with filtration and disinfection requirements. An obvious extension of this technique is toexamine water samples in systems using RBF. Similar to conducting a filtration plant efficiencystudy, a river or source sample can be compared to samples from the groundwater collectiondevice, and a determination of the level of in situ natural filtration occurring through the aquifercan be made. This idea of natural filtration to improve water quality is not new. The concept ofusing the aquifer as a natural filtration device was termed “RBF” over 100 years ago, although theprocess has been used for centuries. RBF is a standard surface-water treatment practice in Europe.In 1997, the authors first proposed considering natural filtration when performing GWUDIevaluations of collection devices located in porous media aquifers. In a long-term study ofgroundwater collection devices in the North Platte Alluvial Aquifer in Casper Wyoming, theauthors found that natural filtration through the aquifer produced finished water of superiorquality to that produced by the water filtration plant, both using the North Platte River as asource. Surface-water indicators (algae and diatoms) were found in some of the groundwatercollection devices, and always at significantly lower concentrations than in surface water. Evenwhen algae and diatoms were present, cysts and oocysts were never observed in any of thegroundwater samples. The reduction of algae and diatoms through the aquifer ranged from 4.2 togreater than 5 log, while the removal range in the plant, which consistently met all compliancerequirements, ranged from 0.3 to 1.5 log.
The key to providing adequate RBF is the aquifer type. Natural filtration through porous mediaaquifers, particularly those with a matrix in the sand- and gravel-size range, is very effective forparticulate removal. Natural filtration is similar to engineered filtration in that we expect to see areduction of particulates through the process; the end result is not necessarily the observation ofno surface-water indicators, but adequate removal so as to minimize the risks to public health. Inthe Surface Water Treatment Rule, this is defined as 2-log removal of Giardia cysts throughfiltration, and in the Long Term 2 Enhanced Surface Water Treatment Rule (LT2ESWTR), 3-logCryptosporidium removal through some combination of processes, including RBF removal credit.
This paper examines the filtration efficiencies of six surface water treatment plants and six systemsusing in situ natural filtration or RBF. Each system was monitored regularly using MicroscopicParticulate Analysis for a minimum of 1 to 11 years. Samples were collected in pairs (raw andtreated surface water or river water and groundwater collection device) and analyzed by a singlegroup of analysts, minimizing some of the inherent variability noted between laboratories andanalysts. Sample sites are located in the United States and Canada, and the selected sites representa broad geographic region (California to Connecticut). Over 1,400 samples were analyzed in thiscomparison.
As noted in previous studies, surface-water samples showed the largest diversity and concentrationsof microorganisms. Algae and diatoms occurred in the highest concentrations, ranging from l02 togreater than 109 per 100 gallons. The reduction of indicators through engineered filtration rangedfrom no reduction to greater than 6 log10. Log10 reduction of biological indicators varied withintreatment plants, and poorer filtration performance noted using Microscopic Particulate Analysis
112

was independent of finished water turbidity. All plants in the study were considered well-operatedand met the requirements of the Surface Water Treatment Rule. In some cases, the levels of algaeand diatoms in finished water were actually higher than that observed in raw water. This may bedue to sampling anomalies, growth of algae in the filters, poor filtration performance, or vagariesassociated with the Microscopic Particulate Analysis method itself.
For RBF groundwater collection devices, log10 reduction of algae and diatoms ranged from about4 log10 to greater than 7 log10. Reductions across the aquifer through natural filtration were farmore consistent, and the minimum level of reduction was always greater than that required forfiltration performance under the Surface Water Treatment Rule (2-log10 Giardia and 3-log10Cryptosporidium). No Giardia cysts or Cryptosporidium oocysts were noted in any of the RBFgroundwater collection device samples.
While all samples met turbidity requirements, the biological water quality measured usingMicroscopic Particulate Analysis was far superior in the RBF groundwater collection devicesamples than that noted in the treatment plant effluents. This same observation has been notedwhen comparing surface-water treatment plant effluents and groundwater samples in previousstudies. RBF is a more effective process than engineered filtration for removing biological particlesfrom surface-water sources.
JENNIFER CLANCY is a microbiologist with 25 years of experience in environmentalmicrobiology, focusing on water. She is currently President of Clancy EnvironmentalConsultants, Inc., which provides microbiological testing and consulting services to thewater and wastewater industries. Clancy has spent years studying the issue of groundwaterunder the direct influence of surface water in systems in the United States and Canada.Prior to forming Clancy Environmental Consultants, Inc., in 1994, she was the Directorof Water Quality at the Erie County Water Authority in Buffalo, New York, and was
responsible for administration of the Water Quality Department. Clancy received a B.S. in Microbiologyfrom Cornell University, an M.S. in Microbiology and Biochemistry from the University of Vermont, a Ph.D.inMicrobiology and Immunology fromMcGill University, and anM.S. in Environmental Law fromVermontLaw School.
113

114

Session 6: Microorganisms
Transport and Removal of Cryptosporidium Oocystsin Subsurface Porous Media
Menachem Elimelech, Ph.D.Yale UniversityNew Haven, Connecticut
Garrett MillerYale UniversityNew Haven, Connecticut
Zachary KuznarYale UniversityNew Haven, Connecticut
Cryptosporidium parvum contamination is considered one of the most important water-supplyproblems today. Disinfectants commonly used by water treatment plants are ineffective at reducingCryptosporidium parvum risk, and deep-bed filtration represents one of the main barriers to oocystcontamination. RBF, which is gaining popularity in the United States, presents an alternativemethod of pretreating water to remove oocysts. Very little research has been done so far tounderstand the mechanisms controlling the transport and filtration behavior of Cryptosporidium insaturated porous media under chemical and physical conditions relevant to RBF. The objective ofthis study was to elucidate the role of electrostatic double layer interactions in the attachment andtransport of Cryptosporidium in flow through saturated porous media. Well-controlled columnexperiments were carried out using ultra-clean quartz sand and Cryptosporidium parvum oocysts.Complimentary experiments using a stagnation point flow system have been conducted underidentical chemical and hydrodynamic conditions. Initial bacterial cell deposition rates are comparedwith column breakthrough curves, and the results are used to highlight the controlling mechanismsof Cryptosporidium parvum adhesion and transport.
MENACHEM ELIMELECH is the Llewellyn West Jones Professor of EnvironmentalEngineering and Director of the Environmental Engineering Program at Yale University.His research interests center on problems involving physicochemical and colloidalprocesses in engineered and natural systems, and he has worked on the dynamics of colloidtransport and deposition in porous media, transport and fate of microbial particles (viruses,bacteria, and Cryptosporidium) in the subsurface environment, and contaminant removalby membrane processes. Elimelech is the author of over 90 journal publications and is the
principal author of Particle Deposition and Aggregation (1995). Among his recent honors, he was the recipientof the Association of Environmental Engineering and Science Professors (AEESP) Outstanding Paper Awardin 2002 and the AEESP Doctoral Dissertation Award, with his graduate student Eric M.V. Hoek, in 2002.He also has served on the Editorial Advisory Boards of Environmental Science & Technology, EnvironmentalEngineering Science, Desalination, and Journal of Colloid and Interface Science. Elimelech received both a B.S. inSoil and Water Sciences and an M.S. in Environmental Science and Technology from the HebrewUniversity in Jerusalem and a Ph.D. in Environmental Engineering from The Johns Hopkins University.
115
Correspondence should be addressed to:
Menachem Elimelech, Ph.D.Llewellyn West Jones Professor of Environmental EngineeringDepartment of Chemical Engineering • Environmental Engineering ProgramYale University • P.O. Box 208286 • New Haven, Connecticut 06520-8286 USAPhone: (203) 432-2789 • Fax: (203) 432-2881 • Email: [email protected]

116
Session 6: Microorganisms
Laboratory and Field Strategies for AssessingPathogen Removal by Riverbank Filtration
Monica B. Emelko, Ph.D.University of WaterlooWaterloo, Ontario, Canada
Mark T. WatlingUniversity of WaterlooWaterloo, Ontario, Canada
Martin M. CôtéUniversity of WaterlooWaterloo, Ontario, Canada
Introduction
RBF systems can significantly reduce the concentrations of many surface-water pollutants(Shubert, 2000; Wang et al., 2000; Kuehn and Mueller, 2000); however, predicting andquantifying those reductions is difficult. An understanding of subsurface pathogen transport,particularly Cryptosporidium and viruses, is critical for utilities faced with potential GWUDI ofsurface-water wells. In the United States, the LT2ESWTR prescribes Cryptosporidium removalcredits (0, 0.5, or 1.0 log) based on aquifer grain-size distribution and the distance between thewell and riverbed (USEPA, 2001). Regulations in Ontario, Canada, require utilities todemonstrate in situ filtration performance using particle counts (less than 100 particles greaterthan or equal to 10 micrometers per milliliter) and qualitative assessments of potential temporalchanges in well effluent particle counts and raw-water quality (Ontario Ministry of theEnvironment, 2001). While these approaches represent an attempt at demonstrating the efficacyof RBF as a treatment technology for reducing pathogen concentrations in drinking-water sources,it is generally acknowledged that they do not provide adequate assessments of pathogen removalby RBF.
Assessments of pathogen removal by RBF are difficult. Although column studies may approximatesome RBF performance, they are of limited value because they often fail to adequately representtemporal changes in regional groundwater conditions or microbiological activity, geologicheterogeneity, and physical scale (filtration length) of the true system. While full-scaleinvestigations are possible and have been conducted, they are costly and plagued by analyticallimitations such as low indigenous pathogen concentrations (that preclude representativesampling) and, in the case of Cryptosporidium, unreliable analytical methods with low and highlyvariable recoveries (Nieminski et al., 1995; Clancy et al., 1999). Full-scale investigations arefurther complicated by the use of more readily analyzed, but unproven, surrogates (which is
117
Correspondence should be addressed to:
Monica B. Emelko, Ph.D.Assistant ProfessorDepartment of Civil EngineeringUniversity of Waterloo • Waterloo, Ontario N2L 3G1 CanadaPhone: (519) 888-4567 ext. 2208 • Fax: (519) 888-6197 • Email: [email protected]

necessitated because of the aforementioned analytical limitations). As a result, the outcomes offull-scale performance or surrogate validation studies are difficult to interpret and compare,hindering the development of widely accepted protocols for assessing pathogen removal by RBF.
Objectives
In this paper, we highlight some recent laboratory and analytical advances that are useful forimproving assessments of pathogen removal by RBF. The specific objectives of this work include:
• Investigating the impact of column orientation (and the associated impacts ofgravitational force) on pathogen removal in laboratory studies investigating RBFperformance.
• Quantitatively demonstrating the impact of the actual number of discrete particles(e.g., pathogens or surrogates) counted from a sample on the uncertainty of inferencesdrawn from experimental and monitoring data.
• Proposing pathogen or surrogate count targets so that reasonably certain conclusions canbe drawn from experimental or monitoring data.
Methodology
Column Studies
It has been suggested that column orientation (horizontal versus vertical versus angled) may be animportant parameter in mimicking subsurface transport and filtration due to the impacts ofsedimentation (Harvey, 1997). To investigate the impact of the gravitational force on pathogenremoval during column studies, four 10-cm filter columns with 6-cm internal diameters werepacked with sieved aquifer material and were operated at conditions typical of those that may beencountered during RBF (flow of ~1 milliliter per minute). Two of the columns were operated ina horizontal mode and two of the columns were operated in an upflow vertical mode. Preliminaryinvestigations were conducted at water-quality conditions that do not favor pathogen removal(i.e., low ionic strength).
After the columns were flushed with degassed water for several hours, the influent reservoir —which fed the four columns simultaneously — was spiked with both Cryptosporidium oocysts andoocyst-sized polystyrene microspheres. The influent oocyst and microsphere concentrations weredetermined from influent reservoir samples. Effluent samples were collected at intervals of0.25-pore volumes until at least 6-pore volumes of influent had passed through the columns.Microsphere removals from samples collected during the passage of 0.3- to 5.2-pore volumesthrough the columns are discussed herein.
Polycarbonate membranes (25-millimeter, 0.40-micrometer nominal porosity) were used to filterthe samples. Samples were filtered directly on a manifold with a vacuum of ~5-inches of mercury.Microsphere enumeration was performed at 100× and 400× magnification (Nikon Labophot 2A,Nikon Canada Inc., Toronto, Ontario, Canada). The filtered sample volumes were selected toyield between 10 and 1,000 microspheres per membrane.
Data Reliability and Interpretation
The occurrence of waterborne pathogens such as Cryptosporidium is difficult to measure preciselybecause they are present in varied concentrations, often at concentrations so low that detectionis difficult (Lisle and Rose, 1995). Not surprisingly, current methods for quantifying
118
Cryptosporidium are unreliable, laborious, and expensive. Analytical recoveries are often low andhighly variable (Nieminski et al., 1995; Clancy et al., 1999).
Nahrstedt and Gimbel (1996) proposed a model for the process of estimating the concentrationof Cryptosporidium oocysts in a body of water; it addresses uncertainty associated with sampling andenumeration. The authors used:
• A Poisson distribution to model true sample counts (representative sampling).
• A binomial distribution tomodel the recovered fraction of oocysts (random analytical error).
• A Beta distribution to describe non-constant analytical recovery.
The authors provided only limited information on how to apply their model to obtainconcentration estimates and to quantify the uncertainty in these estimates.
To obtain both concentration and removal estimates and to quantify the associated uncertainties,Emelko (2001) presented a Bayesian analysis of the Nahrstedt and Gimbel (1996) model andutilized the Gibbs sampler to provide easy access to a wide variety of estimated quantities(e.g., point estimates, probability [confidence] intervals, probability density functions, etc.). Inbrief, this approach results in a joint posterior probability density function for the trueconcentration of pathogens in the water body (c), the probability of pathogen recovery from thewater sample (p), and the number of pathogens in the water sample (N) given the observedpathogen count (X). The uncertainty of recovery is accounted for by the Beta distribution’s shapeparameters (a and b). Replicate sampling is incorporated, if applicable (n replicate samples). Theposterior probability density function, after simplification and suppressing constant multipliers, is:
(1)
Since the parameter of interest is the true concentration c, the remaining (nuisance) parametersmay be integrated out (Box and Tiao, 1973). This operation finds the mathematical expectationof c over all values of the nuisance parameters. The posterior distribution given by Equation 1 isvery difficult, as it stands, to integrate or to use directly to make inferences about c. The Gibbssampler, a Monte Carlo method that produces an indefinitely long Markov chain of vectors ofparameter values (Geman and Geman, 1984), can handle these problems with relative ease.Applicable to all discrete particles, this technique was used in the present investigation; detailsregarding the development of this approach were provided in Emelko (2001).
The impact of the actual number of pathogens or surrogates counted from a sample on uncertainty(confidence interval for pathogen concentration) is demonstrated herein using a concentration ofone pathogen per 100 liters. Counts between one and 1,000 pathogens (and the associated samplevolumes that would yield a concentration of one pathogen per 100 liters) were utilized. The recoverydata and associated Beta parameters (a = 28.12, b = 8.43) used in this assessment correspond to oocystrecoveries ranging from 69 to 85 percent and average 77 percent, as reported by Emelko (2001).
Results
Column Studies
Preliminary investigations of Cryptosporidium oocyst-sized polystyrene microsphere removal byhorizontal and upflow vertical columns are summarized in a box and whisker plot (Figure 1). Thisfigure illustrates that a consistent level of microsphere removal was achieved during the period
119
Df [(c,p,Ni|Xi),i = 1,…, n] ∝ c–1+ Σ Ni×e–c+Σ Vi×pa–1+Σ Xi×(1–p)b–1+Σ(Ni–Xi)×Πn
i=1
n
i=1
n
i=1
n
i=1
n
i=1
ViNi
(Ni –Ni)
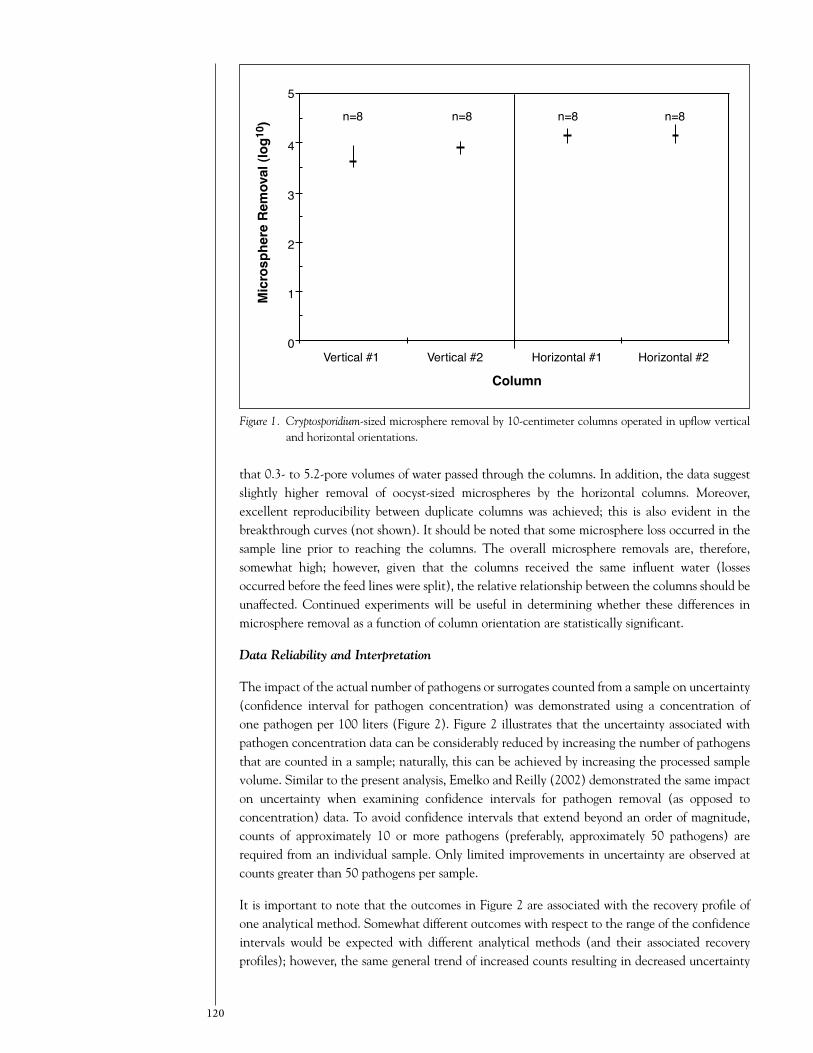
that 0.3- to 5.2-pore volumes of water passed through the columns. In addition, the data suggestslightly higher removal of oocyst-sized microspheres by the horizontal columns. Moreover,excellent reproducibility between duplicate columns was achieved; this is also evident in thebreakthrough curves (not shown). It should be noted that some microsphere loss occurred in thesample line prior to reaching the columns. The overall microsphere removals are, therefore,somewhat high; however, given that the columns received the same influent water (lossesoccurred before the feed lines were split), the relative relationship between the columns should beunaffected. Continued experiments will be useful in determining whether these differences inmicrosphere removal as a function of column orientation are statistically significant.
Data Reliability and Interpretation
The impact of the actual number of pathogens or surrogates counted from a sample on uncertainty(confidence interval for pathogen concentration) was demonstrated using a concentration ofone pathogen per 100 liters (Figure 2). Figure 2 illustrates that the uncertainty associated withpathogen concentration data can be considerably reduced by increasing the number of pathogensthat are counted in a sample; naturally, this can be achieved by increasing the processed samplevolume. Similar to the present analysis, Emelko and Reilly (2002) demonstrated the same impacton uncertainty when examining confidence intervals for pathogen removal (as opposed toconcentration) data. To avoid confidence intervals that extend beyond an order of magnitude,counts of approximately 10 or more pathogens (preferably, approximately 50 pathogens) arerequired from an individual sample. Only limited improvements in uncertainty are observed atcounts greater than 50 pathogens per sample.
It is important to note that the outcomes in Figure 2 are associated with the recovery profile ofone analytical method. Somewhat different outcomes with respect to the range of the confidenceintervals would be expected with different analytical methods (and their associated recoveryprofiles); however, the same general trend of increased counts resulting in decreased uncertainty
120
Figure 1. Cryptosporidium-sized microsphere removal by 10-centimeter columns operated in upflow verticaland horizontal orientations.
Vertical #1 Vertical #2 Horizontal #1 Horizontal #2Column
Mic
rosp
here
Rem
oval
(log1
0 )
0
1
2
3
4
5n=8 n=8 n=8 n=8

would be expected. This type of statistical analysis for already reported data can be somewhatdifficult as adequate recovery data (actual counts) are often lacking from the reported literature,underscoring the need for guidance on how to adequately report pathogen recovery information.
The analysis in Figure 2 does not address the issues of replicate sampling or pooled data. Emelkoand Reilly (2002) briefly discussed this issue and demonstrated that the largest improvementsassociated with decreasing data uncertainty were associated with increased total counts, regardlessof the number of samples from which they were derived. The impact of pathogen recovery profileson this relationship remains to be fully demonstrated.
Conclusions
Several preliminary conclusions have resulted from this work. They include the following:
• Pathogen removal appears to be slightly higher in horizontal laboratory columns ascompared to upflow vertical columns. As more data are collected, the statistical signifi-cance of this outcome must be determined.
• Column studies that are used to investigate RBF should be conducted using a columnorientation that is as representative of the site as possible; in most cases, this orientationshould be at or near horizontal.
• To minimize the uncertainty associated with pathogen data so that it ranges over lessthan an order of magnitude, total counts of between 10 and 50 pathogens are required.This can be achieved via increased sample volume processing or increased replication.
121
Figure 2. Ninety-five percent confidence intervals obtained for pathogen concentrations using theCryptosporidium recovery profile of Emelko (2001).
0.001
0.01
0.1
1.
10.
1 2 5 10 50 100 500 1000
Pathogen Count in Sample
Path
ogen
Conc
entra
tion
(pat
hoge
ns/1
00Li
ters
)

REFERENCES
Box, G.E., and G.C. Tiao (1973). Bayesian Inference in Statistical Analysis, Addison Wesley PublishingCompany, Reading, MA.
Clancy, J.L., Z. Bukhari, R.M. McCuin, Z. Matheson, and C.R. Fricker (1999). “USEPA Method 1622.”Journal AWWA, 91(9): 60-68.
Emelko, M.B. (2001). Removal of Cryptosporidium parvum by granular media filtration, Ph.D. Dissertation,University of Waterloo, Waterloo, Ontario, Canada.
Emelko, M.B., and P.M. Reilly (2002). “Reporting and Regulating Cryptosporidium Concentrations andRemovals.” Proceedings, AWWA WQTC, AWWA, Denver, CO.
Geman, S., and D. Geman (1984). “Stochastic Relaxation, Gibbs Distributions, and the Bayesian Restorationof Images.” IEEE Trans. Pattn. Anal. Bach. Intell., 6: 721.
Harvey, R.W. (1997). “In Situ Laboratory Methods to Study Subsurface Microbial Transport.” Manual ofEnvironmental Microbiology, C.J. Hurst, G.R. Knudsen, M.J. McInerney, L.D. Stetzenbach, and M.V. Walter(eds.), ASM Press, Washington, D.C., p. 586-589.
Kuehn, W., and U. Mueller (2000). “Riverbank filtration: An overview.” Journal AWWA, 82(12): 60-69.
Lisle, J.T., and J.B. Rose (1995). “Cryptosporidium Contamination of Water in the U.S.A. and U.K.: A MiniReview.” Jour. Water SRT–Aqua, 44(3): 103.
Nahrstedt, A., and R. Gimbel (1996). “A Statistical Method for Determining the Reliability of the AnalyticalResults in the Detection of Cryptosporidium and Giardia in Water.” Jour. Water SRT – Aqua, 45(3): 101.
Nieminski, E.C., F.W. Schaefer, and J.E. Ongerth (1995). “Comparison of two Methods for Detection ofGiardia Cysts and Cryptosporidium Oocysts in Water.” Appl. and Envir. Microbiol., 61(5): 1714.
Ontario Ministry of the Environment (MOE) (2001). Terms of Reference, Hydrogeological Study to ExamineGroundwater Sources Potentially Under Direct Influence of Surface Water, Ontario Ministry of the Environment.
Shubert, J. (2000). “How does it work? Field Studies on Riverbank Filtration.” Proceedings, InternationalRiverbank Filtration Conference, Düsseldorf, 2-4 November 2000, Internationale Arbeitsgemeinschaft derWasserwerke im Rheineinsugsgebiet (IAWR), Düsseldorf.
USEPA (2001). National Primary Drinking Water Regulations: Long Term 2 Enhanced Surface Water TreatmentRule, 40 CFR Parts 9, 141 and 142, United States Environmental Protection Agency.
Wang, J.Z., R. Song, and S.A. Hubbs (2000). “Particle removal through riverbank filtration process.”Proceedings, International Riverbank Filtration Conference, Düsseldorf, 2-4 November 2000, InternationaleArbeitsgemeinschaft der Wasserwerke im Rheineinsugsgebiet (IAWR), Düsseldorf.
MONICA EMELKO has research expertise in microbial pathogen and surrogate transportand removal by porous media, developing analytical methods for enumeratingmicroorganisms during porous media investigations, and developing statistical tools fordescribing analytical uncertainty. She was awarded the American Water WorksAssociation Academic Achievement Award for her doctoral dissertation, and has over25 publications on pathogen transport and filtration in porous media systems. Emelko hasbeen an advisor in the development of the Long-Term 2 Enhanced Surface Water
Treatment Rule and serves on several American Water Works Association Research Foundation advisorycommittees for projects focused on characterizing filter effluents and filtration performance; she is also theVice-Chair of the Particulate Contaminants Research Committee for the AmericanWaterWorks Association.At present, she is an Assistant Professor in the Department of Civil Engineering at the University ofWaterloo in Canada. Emelko received B.S degrees in Chemical Engineering and Environmental Engineeringfrom the Massachusetts Institute of Technology, an M.S. in Civil Engineering from the University ofCalifornia, Los Angeles, and a Ph.D. in Civil Engineering from the University of Waterloo.
122

Session 6: Microorganisms
Fate of Disinfection Byproduct Precursorsand Microorganisms During Riverbank Filtration
W. Joshua WeissThe Johns Hopkins UniversityBaltimore, Maryland
Edward J. Bouwer, Ph.D.The Johns Hopkins UniversityBaltimore, Maryland
William P. BallThe Johns Hopkins UniversityBaltimore, Maryland
Charles R. O’Melia, Ph.D.The Johns Hopkins UniversityBaltimore, Maryland
Kellogg J. Schwab, Ph.D.Bloomberg School of Public Health, The Johns Hopkins UniversityBaltimore, Maryland
Binh T. LeBloomberg School of Public Health, The Johns Hopkins UniversityBaltimore, Maryland
Ramon Aboytes, D.V.M., Ph.D.American Water, Belleville LaboratoryBelleville, Illinois
Experience with RBF in Europe and more recently in the United States has demonstratedsignificant improvements in raw-water quality, including the removal of NOM, biodegradablecompounds, pesticides, microbes, and other water-quality contaminants and compensation forshock loads of chemical contaminants (Kuehn and Mueller, 2000; Ray et al., 2002a and 2002b;Tufenkji et al., 2002; Weiss et al., 2003a and 2003b). Because of these potential improvements,regulators and utilities in the United States have recently looked more strongly at RBF as a meansfor providing high-quality sources for drinking water; however, little data are available to comparethe performance of RBF with that of conventional drinking-water treatment processes morecommonly used in the United States (e.g., coagulation, flocculation, sedimentation) from identicalriver-water sources, especially with regard to the removal of organic DBP precursor material. Inaddition, little is known about the extent to which RBF may serve to reliably remove Giardia,Cryptosporidium, and other pathogens (e.g., bacteria, viruses) from river water. In particular, dataare needed on the transport of microbial pathogens through riverbank systems relative to that ofmore easily measured indicator parameters, such as particles and coliform bacteria.
123
Correspondence should be addressed to:
W. Joshua WeissPh.D. Student/Research AssistantDepartment of Geography and Environmental EngineeringThe Johns Hopkins University • 3400 N. Charles Street • Baltimore, Maryland 21218 USAPhone: (410) 516-6220 • Fax: (410) 516-8996 • Email: [email protected]
In the above context, research was conducted to document water-quality benefits during RBF atthree major river sources in the Midwestern United States (the Ohio River at Jeffersonville,Indiana; Wabash River at Terre Haute, Indiana; and Missouri River at Parkville, Missouri),specifically with regard to reducing DBP precursor organic matter and microbial pathogens.Specific objectives were to:
1. Evaluate the merits of RBF for removing organic DBP precursor material.
2. Evaluate whether RBF can improve finished drinking-water quality by removing and/oraltering NOM in a manner that is not otherwise accomplished through conventionalprocesses of drinking-water treatment (e.g., coagulation, flocculation, sedimentation).
3. Evaluate changes in the character of NOM upon ground passage from the river to wells.
4. Evaluate the merits of RBF for removing pathogenic microorganisms.
5. Compare the transport of microbial pathogens with that of some potential surrogate orindicator parameters (e.g., particles, turbidity, coliforms, aerobic and anaerobic spores,diatoms, bacteriophage).
To address Objectives 1, 2, and 3, samples of river source waters and bank-filtered well waters fromthe three study sites were analyzed for a range of water-quality parameters, including:
• TOC.
• DOC.
• UV-absorbance at 254-nm (UV254).
• Biodegradable dissolved organic carbon.
• Biological AOC.
• Inorganic species.
• DBP formation potential.
In the second year of the project, river waters were subjected to a bench-scale conventionaltreatment train consisting of coagulation, flocculation, sedimentation, glass-fiber filtration, andozonation. The treated river waters were compared with the bank-filtered waters in terms of TOC,DOC, UV254, and DBP formation potential. In the third and fourth years of the project, NOMfrom the river and well waters was characterized using the XAD-8 resin adsorption fractionationmethod (Leenheer, 1981; Thurman and Malcolm, 1981). XAD-8 adsorbing (hydrophobic) andnon-adsorbing (hydrophilic) fractions of the river and well waters were compared with respect toDOC, UV254, and DBP formation potential to determine whether RBF alters the character of thesource-water NOM upon ground passage and, if so, which fractions are preferentially removed.
The ongoing research to address Objectives 4 and 5 consists of:
• Field studies at the three study sites to document actual changes in microorganismconcentrations upon subsurface travel between the rivers and wells.
• Parallel laboratory column studies with riverbank aquifer media to provide insights intoprocess mechanisms so that reliable treatment credits for pathogen removal can beestablished and the suitability of using indicator parameters for pathogens that aredifficult to measure in these systems can be determined.
The results of the DBP-precursor study demonstrate the effectiveness of RBF at removing organicprecursors to potentially carcinogenic DBPs. When compared to a bench-scale conventional
124
treatment train optimized for turbidity removal, RBF performed as well as treatment at one of thesites and substantially better than treatment at the other two sites in terms of removing organiccarbon and DBP-precursor material. Removals of TOC and DOC upon RBF at the three sitesgenerally ranged from 30 to 70 percent, compared to 20- to 50-percent removals upon bench-scaletreatment of river waters. Reductions in precursor material for a variety of DBPs (THMs, HAAs,haloacetonitriles, haloketones, chloral hydrate, and chloropicrin) upon RBF ranged from50 to 100 percent using both the formation potential (FP) and uniform formation conditions(UFC) tests (Standard Methods, 1998; Summers et al., 1996), while reductions upon bench-scaletreatment were generally in the range of 40 to 80 percent. The substantially higher reductions ofthe DBP precursors relative to those of TOC and DOC indicate a preferential reduction uponground passage in the NOM that reacts with chlorine to form DBPs.
Upon both bench-scale conventional treatment and RBF, a shift was observed in DBP formationfrom the chlorinated to the more brominated species due to the removal of DOC relative tobromide upon treatment or RBF. Brominated THMs have greater toxicity than chloroform, so theshift from chlorinated to brominated DBP species means that the reduction in risk is not directlyproportional to the reduction in DBP formation. Risk calculations demonstrated the ability ofRBF in all cases to reduce the theoretical excess cancer risk due to THMs formed uponchlorination, and with substantially better performance than the bench-scale treatment train.
The results of the NOM characterization study indicate that RBF appears to be equally capable ofremoving material of different character. The different removal mechanisms in the subsurface(e.g., sorption, biodegradation, filtration) combine to provide similar removal of the operationallydefined hydrophilic and hydrophobic fractions of organic material upon ground passage. Thus, theobserved reductions in DBP formation upon RBF were largely the result of a decrease in the NOMconcentration rather than a consistent change in NOM character.
Field monitoring of a number of microorganisms on a tri-monthly basis between 1999 and 2000(Table 1) indicated that RBF may also serve as a significant barrier for removing microbialcontaminants, including human pathogens. The monitoring data demonstrated:
• Greater than 3-log removal of Clostridium spores.
• Greater than 2.5-log removal of E. coli C bacteriophage (somatic phage host).
• Greater than1.9-log removal of E. coli Famp bacteriophage (male-specific host).
Log removals were calculated using “average” concentrations determined for each organism as thesum of the counts over all sampling rounds divided by the sum of the volumes sampled over allsampling rounds (Parkhurst and Stern, 1998); non-detects were treated as being zero (in the eventof no detects over all sampling rounds, the average concentration is reported as being less thanone count divided by the sum of the volumes sampled over all sampling rounds). Assuming thatthese indicator organisms can be used as surrogates for Giardia cysts and human enteric viruses,RBF at the three study sites met or surpassed the performance requirements in the United Statesfor conventional coagulation, sedimentation, and filtration (i.e., 2.5-log removal for Giardia cystsand 2.0-log removal of viruses). More recent monthly field-monitoring results (Table 2) indicategreater than 0.8-log reduction of Bacillus, greater than 3-log reduction of Clostridium, greater than1.8-log reduction of bacteriophage MS-2, and greater than 3.7-log reduction of bacteriophageφX174 concentrations in bank-filtered waters relative to river waters. Cryptosporidium and Giardiawere occasionally detected in river waters and were below the detection limits during all monthlysampling events in well waters.
125

Because of low and variable concentrations of pathogens such as Cryptosporidium in river waters,it is difficult to evaluate log removals for such parameters. Laboratory-scale column studies withriverbank media are currently underway to compare the behavior of pathogens (viruses Poliovirusand Feline Calicivirus; bacteria E. coli; and protozoans Giardia and Cryptosporidium) with that ofa number of potential surrogate parameters. The potential surrogate or indicator parameters beingstudied include:
• Bacteriophage MS-2 and PRD-1 (for human viruses).
• Particles (latex and native river particles).
• Turbidity.
• Aerobic and anaerobic spores.
Column studies are being conducted under a variety of physical/chemical conditions, with pH,ionic strength, multi-valent cation concentration (Ca2+), NOM concentration, and flow rate as thevariables, with laboratory-prepared water and river water collected from full-scale RBF systems.
Column experiments indicate that bacteriophage can travel through riverbank sediment columnsto a greater extent than Poliovirus, suggesting that bacteriophage may be useful as conservativeindicators of human viruses. Continuing studies will further explore this relationship under avariety of physical/chemical conditions. Similar studies will explore the relationship between thetransport of particle counts, turbidity, and aerobic and anaerobic spores with that of E.coli,Cryptosporidium, and Giardia.
126
Table 1. Results from 1999 to 2000 Tri-Monthly Field Monitoring(Seven Total Sampling Rounds)a,b
Bacteriophage
Clostridium E. coli C c E. coli F-ampc
Average counts/ pfu /100 mL pfu /100 mL100 mL
Indiana American Water at Jeffersonville, Indiana
Ohio River 122 49 12
Well 9 <0.07 [>3.2] <0.07 [>2.8] 0.09 [2.1]
Well 2 <0.07 [>3.2] <0.07 [>2.8] <0.07 [>2.2]
Indiana American Water at Terre Haute, Indiana
Wabash River 183 147 13
Collector Well 0.07 [3.4] <0.07 [>3.3] <0.07 [>2.3]
Well 3 <0.07 [>3.4] <0.07 [>3.3] <0.07 [>2.3]
Missouri American Water at Parkville, Missouri
Missouri River 143 31 6
Well 4 <0.07 [>3.3] <0.07 [>2.6] <0.07 [>1.9]
Well 5 <0.07 [>3.3] <0.07 [>2.6] <0.07 [>1.9]
aConcentrations calculated as Σ (counts for all sampling rounds)/Σ (volume sampled for all sampling rounds); see text.bLog removals shown in brackets.cE. coli C and E. coli F-amp are the host organisms.
pfu = Plaque-forming unit.

Acknowledgements
We gratefully acknowledge the support of the USEPA Office of Research and Development(Project CR-826337; Thomas F. Speth, Project Officer), USEPA Science to Achieve Results(STAR) program (Grant #R82901101-0; Angela Page, Project Officer), and the utilitysubsidiaries of American Water.
REFERENCES
Kuehn, W., and U. Mueller (2000). “Riverbank Filtration: An Overview.” Journal AWWA, 92(12): 60.
Leenheer, J.A. (1981). “Comprehensive Approach to Preparative Isolation and Fractionation of DissolvedOrganic Carbon from Natural Waters and Wastewaters.” Envir. Sci. & Technol., 15(5): 578.
Parkhurst, D.F., and D.A. Stern (1998). “Determining Average Concentrations ofCryptosporidium and OtherPathogens in Water.” Envir. Sci. & Technol., 32(21): 3,424.
Ray, C., T. Grischek, J. Schubert, J. Wang, and T. Speth (2002a). “A Perspective of Riverbank Filtration.”Journal AWWA, 94(4): 149.
127
Table 2. Results from January to December 2002 Monthly Field Monitoring(12 Total Sampling Rounds)a,b
Bacillus Clostridium Total E. coli Bacterio- Bacterio- Crypto- Giardia(cfu/L) (cfu/L) Coliforms (MPN/L) phage phage sporidium (cysts/L)
(MPN/L) MS-2 PhiX174 (oocysts/L)(pfu/L) (pfu/L)
Indiana-American Water Company at Jeffersonville, Indiana
Ohio River 8.9 × 10⁴ 3.8 × 10² 9.2 × 10⁴ 2.6 × 10³ 6 × 101 1.7 × 10³ 2.5 × 10⁻² 3 × 10⁻²
Well 9 2.5 × 10³ <1.7 × 10⁻¹ Not Not <1.7 × 10⁻¹ <1.7 × 10⁻¹ <1 × 10⁻² <1 × 10⁻²
[1.5] [>3.3] Available Available [>2.5] [>4.0] [>0.4] [>0.5]
Well 2 1.3 × 10⁴ <3.3 × 10⁻¹ Not Not <3.3 × 10⁻¹ <3.3 × 10⁻¹ <3 × 10⁻² <3 × 10⁻²
[0.8] [>3.1] Available Available [>2.3] [>3.7]
Indiana-American Water Company at Terre Haute, Indiana
Wabash 1.9 × 10⁵ 8.3 × 10² 1.4 × 10⁶ 1.2 × 10⁴ 6 × 101 2.3 × 10³ 2 × 10⁻² 8.6 × 10⁻²
River
Collector 1.8 × 10⁴ <2 × 10⁻¹ Not Not <2 × 10⁻¹ <2 × 10⁻¹ <2 × 10⁻³ <2 × 10⁻³
Well [1.0] [>3.6] Available Available [>2.5] [>4.1] [>1.0] [>1.6]
Well 3 <5 × 10⁻¹ <5 × 10⁻¹ Not Not <5 × 10⁻¹ <5 × 10⁻¹ <5 × 10⁻³ <5 × 10⁻³
[>5.6] [>3.2] Available Available [>2.1] [>3.7] [>0.6] [>1.2]
Missouri-American Water Company at Parkville, Missouri
Missouri 5.6 × 10⁵ 5.5 × 10² 2.1 × 10⁵ 2.6 × 10³ 3 × 101 2.5 × 10³ 2.5 × 10⁻² 4.1 × 10⁻²
River
Well 4 1.5 × 101 1.7 × 10⁻¹ Not Not 1.7 × 10⁻¹ 1.7 × 10⁻¹ <1 × 10⁻³ <1 × 10⁻³
[4.6] [3.5] Available Available [2.2] [4.2] [>1.4] [>1.6]
Well 5 9 × 10² <5 × 10⁻¹ Not Not <5 × 10⁻¹ <5 × 10⁻¹ <5 × 10⁻³ <5 × 10⁻³
[2.8] [>3.0] Available Available [>1.8] [>3.7] [>0.7] [>0.9]
aConcentrations calculated as Σ (counts for all sampling rounds)/Σ (volume sampled for all sampling rounds); see text.bLog removals shown in brackets.
pfu = Plaque-forming unit. cfu = Colony-forming unit. MPN = Most probable number.
Ray, C., G. Melin, and R.B. Linsky, editors (2002b). Riverbank Filtration: Improving Source-Water Quality,Kluwer Academic Publishers, Dordrecht.
Standard Methods for the Examination of Water and Wastewater, Twentieth Edition (1998). APHA, AWWA,& WEF, Washington.
Summers, R.S., S.M. Hooper, H.M. Shukairy, G. Solarik, and D.M. Owen (1996). “Assessing DBP Yield:Uniform Formation Conditions.” Journal AWWA, 88(6): 80.
Thurman, E.M., and R.L. Malcolm (1981). “Preparative Isolation of Aquatic Humic Substances.” Envir. Sci.& Technol., 15(4): 463.
Tufenkji, N., J.N. Ryan, and M. Elimelech (2002). “The Promise of Bank Filtration.” Envir. Sci. & Technol.,36(21): 423A.
Weiss, W.J., E.J. Bouwer, W.P. Ball, C.R. O’Melia, M.W. LeChevallier, H. Arora, and T.F. Speth (2003a).“Riverbank Filtration: Fate of Disinfection By-product Precursors and Selected Microorganisms.” JournalAWWA, in publication (expected October, 2003).
Weiss, W.J., E.J. Bouwer, W.P. Ball, C.R. O’Melia, H. Arora, and T.F. Speth (2003b). “Riverbank Filtration:Comparison with Bench-Scale Conventional Treatment for NOM and DBP Precursor Reductions.” JournalAWWA, in publication (expected December, 2003).
JOSHWEISS is a Research Assistant in the Department of Geography and EnvironmentalEngineering at The Johns Hopkins University, where he is currently investigating water-quality improvements during riverbank filtration at three Midwestern drinking-waterutilities. He expects to receive a Ph.D. in 2004 after the completion of his thesis,“Reduction in Disinfection Byproduct Precursors and Microorganisms During RiverbankFiltration.”Weiss is the co-author of seven publications — including a chapter in RiverbankFiltration: Improving Source-Water Quality (2002) — and several conference proceedings,
and was the 2000 recipient of the Chesapeake Section American Water Works Association Student PaperAward. Prior to attending Johns Hopkins, he researched the geochemical impact of proposed developmentson a Florida barrier island for the Georgia Institute of Technology and investigated the bioremediation of sitescontaminated by nitroaromatic compounds for Argonne National Laboratory. Weiss received a B.S. in CivilEngineering from the Georgia Institute of Technology and a M.S. in Environmental Engineering from TheJohns Hopkins University.
128

Session 6: Microorganisms
Assessment of the Microbial Removal Capabilitiesof Riverbank Filtration
Vasiliki PartinoudiNew England Water Treatment Technology Assistance CenterDepartment of Civil Engineering, University of New HampshireDurham, New Hampshire
M. Robin Collins, Ph.D., P.E.New England Water Treatment Technology Assistance CenterDepartment of Civil Engineering, University of New HampshireDurham, New Hampshire
Aaron B. Margolin, Ph.D.New England Water Treatment Technology Assistance CenterDepartment of Civil Engineering, University of New HampshireDurham, New Hampshire
Larry K. Brannaka, Ph.D., P.E.New England Water Treatment Technology Assistance CenterDepartment of Civil Engineering, University of New HampshireDurham, New Hampshire
Introduction
Riverbank filtrate includes both groundwater and river water that has percolated through theriverbank or riverbed to an extraction well. One of the primary objectives of this study was toassess the microbial removal capabilities of RBF independent of any groundwater dilution (i.e., aworse-case scenario). This study monitored total coliforms, E. coli, and aerobic spore-formingbacteria along with other water-quality parameters over a 12-month period in the followinglocations:
• Pembroke, New Hampshire.
• Milford, New Hampshire.
• Jackson, New Hampshire.
• Louisville, Kentucky.
• Cedar Rapids, Iowa.
This study also monitored the removal of male-specific coliphage achieved by RBF in Louisville,Kentucky, and Cedar Rapids, Iowa. Samples were collected at both of these sites for the detectionof enteric viruses.
129
Correspondence should be addressed to:
Vasiliki PartinoudiGraduate StudentEnvironmental Technology Building • Department of Civil Engineering • Environmental Research GroupUniversity of New Hampshire • 25 Colovos Road • Durham, New Hampshire 03824 USAPhone: (603) 862-1197 • Fax: (603) 862-3957 • Email: [email protected]

Objectives
The overall study objectives were to:
• Quantify the contributions of river water and groundwater to RBF-extraction water.
• Assess RBF as a viable treatment and pretreatment option.
• Compare RBF to slow sand filtration in regards to particulate, organic precursors, andmicrobiological removal capabilities expressed in terms of log-removal credits.
The focus of this paper will be on microbial removals achieved by RBF.
Characterization of Sampling Sites
Five RBF sites (three in New Hampshire, one in Kentucky, and one in Iowa) were chosen thatpossessed different characteristics, in terms of the degree of hydraulic connection between theriver and RBF extraction well, pumping rates, well construction criteria, geology, water source andquality, and distance of the RBF extraction well from the river. The sites were chosen to enablethe researchers to assess the abilities of RBF technology in different settings. The study sites inLouisville, Kentucky, and Cedar Rapids, Iowa, were chosen because these particular sites havebeen characterized in detail in previous studies.
Pembroke, New Hampshire: The well site lies within a stratified-drift aquifer located within theSoucook River Valley. The eastern aquifer boundary is delineated by contact with glacial till. Theaquifer consists of layers of fine to course sand of varying thickness grading with fine gravel toboulders in some locations. In the area of the RBF extraction well, aquifer thickness ranges from9.7 to 18.9 m, with a saturated thickness of 7.6 to 17.4 m. The distance between the RBFextraction well and river is approximately 55 m. The RBF extraction well has a diameter of30.5 centimeters and is 17-m deep. The subsurface material at that depth was dense silt and veryfine sand.
Milford, New Hampshire: The Milford State Fish Hatchery is located along the Souhegan Rivernear its confluence with Purgatory Brook. The Souhegan River Valley contains rich deposits ofglacial sand, gravel, and silt. The well is a 61-centimeter diameter gravel-pack well, constructedto a depth of 19.8 m. The screen is 50.8 centimeters in diameter and the length is 4.6 m. Theaquifer at the well site consists mainly of sand and gravel. The distance between the river and thewell is 23 m. The well is pumped continuously and delivers 1.6 MGD.
Jackson, New Hampshire: The JacksonWater Precinct infiltration gallery was constructed in theearly 1980s and is located on the banks of the Ellis River. Five infiltration galleries are connectedto the river to provide adequate flow to the RBF extraction well. The five infiltration galleryintakes are each 6.1-m long, 1.2-m deep, and 1.2-m wide, and are located underneath the riverbed.They were placed 1.2-m apart, thus covering a total area of 10.8 m. A 12.2-m long polyvinylchloride pipe connects each gallery to an intake pipe leading to the 20.3-centimeter diameter,7.3-m deep RBF extraction well equipped with a submersible pump. A new infiltration gallery isnow under construction.
Louisville, Kentucky: The construction of the collector well was completed in March 1999. TheLouisville Water Company has extensively characterized this site. The RBF extraction well is onthe bank of the Ohio River, about 30.5 m from the river. The depth of the well is 12.2-m belowthe river bottom and the pumping rate is 75.7-million liters per day. The well has seven horizontallaterals, which are each 73.1-m long and constructed of 30.5-centimeter stainless steel, with well
130

screens along the entire lateral length. Of the seven laterals, L4 is the lateral underneath the riverseparated by at least 40 ft of aquifer material; L1 is the furthest (perpendicular) to the river; andL2 is parallel to the river.
Cedar Rapids, Iowa: The Cedar River is a meandering steam that has cut into the bedrocksurface, exposing steep valley walls in the study area (Schulmeyer, 1995), where a total of53 vertical and horizontal wells have been installed. Seminole Valley Park Well Number 22 islocated on the banks of the Cedar River, and is 19.5 m from the crest of the riverbank. The RBFextraction well was drilled in 1991 to a total depth of 17.4-m below grade. The borehole diameterwas 10.7 centimeters to depth, and a 7.6-centimeter screen and casing were installed.
Microbial Analyses
Total Coliforms and E. coli: The IDEXX Quanti-Tray/2000 method was used for this analysis.
Aerobic Spore-Forming Bacteria:Procedureswere followed as outlined byBallester andMargolin (2000).
Virus Indicators: Male-specific and somatic coliphage viruses were monitored intensively for2 weeks in December 2002 at Louisville, Kentucky, and Cedar Rapids, Iowa, using a single agaroverlay (Method 1602, 1999) and a two-step enrichment method. Antibiotic-resistant strainsE. coli F-amp (resistant to Streptomycin and Ampicillin) and E .coli CN-13 (resistant to NalidixicAcid) were used as hosts for F-specific coliphage and somatic coliphage, respectively. Analysesfollowed the method as outlined by Ballester and Margolin (2000).
Viruses: The intensive coliphage monitoring was followed by the collection of samples to detecthuman enteric viruses (Adenovirus type 40 and 41, Astrovirus, Poliovirus, Coxsackie virus,Rotavirus, and Echovirus) using positive microwound filters. The virus samples were analyzedusing the Integrated Cell Culture-Reverse Transcription-Nested Polymerase Chain Reaction(ICC-RT-nPCR) method, due to its high specificity and sensitivity (Chapron et al., 2000).
Problems with Assessing RBF Removal Capabilities
It is essential to understand the extent and magnitude of river-aquifer interaction to address water-quality and supply issues, as well as to ensure the health of ecosystems (Winter et al., 1998). Thereare many questions to be answered as to how RBF works, how to establish travel time, and how toassess the mixing ratio of river water to groundwater in an RBF extraction well. These questionsneed to be answered to determine the removal efficiency of the RBF process independently ofgroundwater dilution.
What Is the Exact Travel Time from the River to the Well?
Table 1 provides a summary of travel time determinations for river water to reach the RBFextraction well and the selected method used for each site in this study.
How Much Removal Is Due to Filtration and How Much Is Due to Dilution with Groundwater?
A variety of water-quality parameters (Table 2) were analyzed to assess the contribution of riverand groundwater to RBF-extracted water. Knowledge of the mixing ratio would be necessary todetermine removals achieved solely by subsurface filtration. The degree of mixing depends onfactors such as hydraulic head gradient in the aquifer, aquifer properties, and hydrostatic pressurein the river, as well as the degree of connectivity between the river and parts of the aquifer.
131

The contribution of river water and groundwater to each of the RBF extraction wells wasevaluated based on a different parameter at each site due to different types of information availableat each site. The average source contributions to the RBF-extracted water during this study periodis summarized in Table 3.
Results and Discussion
RBF reduces DOC by as much as 82 percent and reduces temperature spikes by more than46 percent in the summer and 96 to 97 percent in the winter months. Turbidity was reduced towell below 1 ntu (80- to 86-percent removal). The reductions were computed from field valuespresented in Table 4.
Typical river-water concentrations ranged between:
• Below detection limit to 24,192 colony-forming units (cfu)/100milliliters for total coliforms.
• Below detection limit to 1,031 cfu/100 milliliters for E. coli.
• Eighty-four to 145,000 cfu/100 milliliters for aerobic spore-forming bacteria (see Table 4).
All three of thesemicrobial concentrations were below detection limit (less than 1 cfu/100milliliters)in RBF-extraction well water, even after eliminating the “dilution” effects with groundwater.
132
Sampling Site Travel Time Evaluation of Travel Time(from riverto RBF well)
Pembroke, 5 days Darcy’s Law in terms of seepage velocityNew Hampshire
Milford, 1 day Darcy’s Law in terms of seepage velocityNew Hampshire
Jackson, 1 day Infiltration gallery. Estimated from information basedNew Hampshire on the construction details of the gallery
Louisville, 1 day Estimated from information provided by theKentucky Louisville Water Company (initial pumping test data)
Cedar Rapids, 5 days Estimated from information provided by theIowa City of Cedar Rapids (Schulmeyer, 1995)
Table 1. Travel Times from the River to the RBF Extraction Well
Sulfate Color Hardness(true)
Chloride UV254 absorbance Alkalinity
pH Particle counts Redox potential
Temperature Selected radioisotopes (222Ra) Conductivity
Table 2. Sampling Parameters Used to Assess the Mixing Ratio in the RBF Extraction Well

Typical concentrations of aerobic spore-forming bacteria, total coliforms, E. coli, and male-specificcoliphage in river water and RBF-extracted water can be seen in Table 5. The total removal iscalculated by subtracting the concentration of an analyte in the river from that in the RBFextraction well. Total coliforms andE. coliwere reduced on average by at least 2.6- and 0.8-log removalcredits, respectively. These values were considered artificially low due to low numbers observed inriver water. RBF achieved a 4.4-log credit reduction of total coliforms on May 20, 2002, in
133
Percent of Percent of ParameterRiver Water Groundwater Upon Whichin RBF Wells in RBF Wells the Ratio Is Based
Pembroke, 40.7 ± 3.7 59.3 ± 3.7 ConductivityNew Hampshire
Milford, 40.8 ± 6.4 59.2 ± 6.4 SulfateNew Hampshire
Jackson, 100 0 Infiltration gallery receiving onlyNew Hampshire river water (due to an impermeable
barrier that prevents groundwaterfrom entering the well)
Louisville, 78.1 ± 4.4 21.9 ± 4.4 HardnessKentucky
Cedar Rapids, 70 30 Based on groundwater flow modelingIowa
Table 3. Average Distribution of River Water and Groundwater to RBF-Extracted Water
pH 6.3–7.3 6.1–6.6 5.6–6.2 6.3–7.6 5.8–6.6 5.9–6.7 6.3–7.3 6.0–7.5 NA NA NA 8.2–8.5 7.6–7.7 7.3–7.4
DOC (mg/L) 1.7–6.6 0.3–1.2 0.3–0.7 1.6–6.4 0.5–1.3 0.3-0.8 2.4–2.7 1.7–1.8 3.0–5.0 1.7–2.0 1.3–1.8 2.8–4.3 1.5–2.5 0.1–0.3
Temperature (°C) 0.3–25.7 8.5–13.8 8.3–11.8 0.4–26.1 7.3–16.2 6.7-15.3 10–21.1 9.5–11 3.6–29.7 13.3–26.415.5–16.6 0.4–20.6 8–22.9 9.4–13.1
Conductivity 42–150 193–269 294–395 119–214 107–152 113-194 23–83 52–69 NA NA NA 454–666 473–624 468–658(µS/cm)
Total 141– BDL BDL 423– BDL BDL 52–1,356 16–160 10– BDL BDL 75– BDL BDLColiforms 1,399 2,431 24,192 2,572(cfu /100 mL)
E. coli 4–108 BDL BDL 6–119 BDL BDL 2.0–20 2.0–10 2–1,031 BDL BDL 23–56 BDL BDL(cfu /100 mL)
Aerobic 84– BDL BDL 124-1,093 BDL BDL BDL BDL 3,500– BDL BDL 39–217 BDL BDLSpore-Forming 1,997 145,000Bacteria(cfu/100 mL)
Table 4. Typical Ranges of Selected Analytes of Interest
Parameter/Site
Pembroke,New Hampshire
Milford,New Hampshire
Jackson,New Hampshire
Louisville,Kentucky
Cedar Rapids, Iowa
Date 8/01 to 11/03 11/01 to 11/02 5/02 to 11/02 9/01 to 12/02 9/02 to 1/03
River RBF GW River RBF GW River RBF River RBF GW River RBF GW
NA = Not available. µS/cm = MicroSemens per centimeter. GW = Groundwater. BDL = Below detection limit.

Louisville, Kentucky. Aerobic spore-forming bacteria were removed by at least 1.9-log credit inPembroke, New Hampshire, and up to 5.2-log credits in Louisville, Kentucky. These values are inline with those reported for Louisville, Kentucky, by Wang et al. (2002).
The male-specific coliphages ranged between 3,453 and 4,622 plaque-forming units (pfu)/100 mLin river water. The concentration of the male-specific coliphages was reduced at least 80 percentby riverbank passage at all the study sites, as is indicated in the reduction summary presented inTable 5. Although there was a high concentration of male-specific coliphages in the river waterand RBF-extracted water, the virus samples collected in Cedar Rapids in December 2003 andLouisville in March 2003 were negative (ICC-nPCR method) for the viruses of interest.
Conclusions
At each study site, the water quality of the source water, aquifer material, distance from the riverto the RBF extraction well, travel time, and mixing ratio between river and groundwater wereevaluated and found to differ from site to site. Travel times and mixing ratios were evaluated bydifferent methods based on the information available at each site. RBF was found to be a site-specific process and should be treated as such. Based on differences between sites in source-waterquality, aquifer material, and other parameters, it will be difficult to develop guidelines applicableto all RBF sites.
In summary, the sites evaluated in this study indicated the conservative effectiveness of RBF inremoving bacteria and virus indicators (any groundwater dilution with RBF extract shouldcontribute to even lower microbial concentrations). Aerobic spore-forming bacteria, totalcoliforms, E. coli, and male-specific bacteriophage were removed by at least an average of 1.9, 1.0,0.3 and 0.2 logs, respectively. Based on this study, RBF shows potential to be a viable pretreatmentand treatment process and warrants additional study.
Acknowledgements
• USEPA for funding this project through the New England Water Treatment TechnologyAssistance Center at the University of New Hampshire.
• Jackson, New Hampshire Waterworks.
• Nicola A. Ballester and Justin H. Fontaine of the University of New Hampshire.
• Milford, New Hampshire Fish Hatchery personnel.
• Cedar Rapids Water Department, Iowa.
• Pembroke, New Hampshire Waterworks.
• Louisville Water Company, Kentucky.
• Melisa A. Smith of the University of New Hampshire.
134

135
Table 5. Average Reductions Achieved by RBF
Location Numberof
SamplingEvents[1]
River[2] RBF[2] Back-groundWell[2]
TotalLog
Removal
AveragePercentRemoval
Achieved bySubsurfaceFiltration
AveragePercentRemoval
Achieved byGroundwater
Dilution
Aerobic Spore Forming Bacteria (cfu/100 mL)
Pembroke, 19 502 BDL BDL >1.9 100% 0%New Hampshire ± 11
Milford, 13 673 BDL BDL >2.1 100% 0%New Hampshire ± 55
Jackson, 3 32 ± 1 BDL NA BDL 100% 0%New Hampshire
Louisville, 11 33, 404 BDL BDL >3.5 100% 0%Kentucky ± 5,672
Cedar Rapids, 5 101 ± 8 BDL BDL >2.6 100% 0%Iowa
Total Coliforms (cfu /100 mL)
Pembroke, 19 521 BDL BDL >2.1 100% 0%New Hampshire ± 63
Milford, 13 1,091 BDL BDL >2.6 100% 0%New Hampshire ± 114
Jackson, 3 504 85 NA >0.5 100% 0%New Hampshire ± 42 ± 12
Louisville, 11 3,921 BDL BDL >1 100% 0%Kentucky ± 182
Cedar Rapids, 5 1,391 BDL BDL >1.4 100% 0%Iowa ± 25
E. coli (cfu /100 mL)
Pembroke, 19 27 ± 4 BDL BDL >0.6 100% 0%New Hampshire
Milford, New 13 55 ± 10 BDL BDL >0.8 100% 0%Hampshire
Jackson, 3 30 ± 1 6.5 ± 1 NA >0.4 100% 0%New Hampshire
Louisville, 11 5 ± 2 BDL BDL >0.3 100% 0%Kentucky
Cedar Rapids, 5 16 ± 1 BDL BDL >0.7 100% 0%Iowa
Virus Indicators (Male-Specific Coliphage) (pfu/100 mL)
Louisville, 4 4,342 3,703 3,402 >0.2 80.2% 19.80%Kentucky ± 24 ± 22 ± 18
Cedar Rapids, 5 3,438 753 BDL >0.7 100% 0%Iowa ± 21 ± 9
Where: [1] = One sampling event includes the collection of a river water, groundwater, and RBF-extracted water sample.The RBF-extracted water sample was sampled with travel time taken into consideration.
Where: [2] = This value shows the average concentration of themicroorganism of interest throughout the study ± analytical error.BDL = Below detection limit. NA = Not available.

REFERENCES
Ballester, N.A., and A.B. Margolin (2000). Detection of Bacillus Spores in Environmental Samples, Universityof New Hampshire Waterborne Disease Laboratory SOP Manual.
Chapron, C.D., N.A. Ballester, J.H. Fontaine, C.N. Frades, and A.B. Margolin (2000). “Detection ofAstroviruses, Enteroviruses, and Adenovirus types 40 and 41 in Surface Waters Collected and Evaluated bythe Information Collection Rule and an Integrated Cell Culture-Nested PCR Procedure.” Applied andEnvironmental Microbiology, 66(6): 2,520-2,525.
Method 1602 (1999). Male-specific (F+) and Somatic Coliphages in Water by Single Agar Layer Procedure.United States Environmental Protection Agency-821-R-00-00X. Draft: July 1999.
Schulmeyer P.M. (1995). Effect of the Cedar River on the quality of the groundwater supply for Cedar Rapids,Iowa, U.S. Geological Survey Water Resources Investigations Report 94-4211.
Wang J.Z., S.A. Hubbs, and R. Song (2002). Evaluation of riverbank filtration as a drinking water treatmentprocess, American Water Works Association Research Foundation and American Water Works Association.
Winter T.C., J.W. Harvey, O.L. Franke, and W.M. Alley (1998). Groundwater and surface water – A singleresource, U.S. Geological Survey Circ. 1139, 79 pp.
VASO PARTINOUDI is a graduate student at the University of New Hampshire who isworking on her Master’s thesis, “Riverbank Filtration as a Viable Treatment andPretreatment Process.” She has worked as a Research Assistant at the New EnglandWaterTreatment Technology Assistance Center (WTTAC) at the University of New Hampshireand has participated in WTTAC projects, performing various tasks such as installing andmaintaining water monitoring equipment and pilot slow sand filters, and sampling andperforming various water-quality tests in the laboratory and in the field. She has presented
her thesis-related work at the New England Water Works Association conference in 2002 (paper titled,“Riverbank Filtration as a Viable Treatment and Pretreatment Method”) and in 2003 at the AmericanGeophysical Union conference in Nice, France (poster presentation titled, “Assessment of the microbialremoval capabilities of Riverbank Filtration”). Partinoudi has received a B.S. in Civil Engineering from theUniversity of Brighton, United Kingdom, and an M.S. in European Construction Engineering from theUniversity of Coventry, United Kingdom.
136

Session 7: Organics Removal
Riverbank Filtration: A Very Efficient TreatmentProcess for the Removal of Organic Contaminants?
Dr.-Ing. Heinz-Jürgen BrauchDVGW-Technologiezentrum WasserKarlsruhe, Germany
Dr. rer. nat. Frank SacherDVGW-Technologiezentrum WasserKarlsruhe, Germany
Prof. Dr. Wolfgang KühnDVGW-Technologiezentrum WasserKarlsruhe, Germany
Introduction
In Germany, RBF has been used for more than 100 years as a natural treatment process for theproduction of drinking water (Sontheimer, 1980 and 1991; Kühn and Müller, 2000; Sacher andBrauch, 2002). Nowadays, the major raw-water resource for drinking-water supplies in Germanyis groundwater (about 64 percent), whereas bank-filtrated (or infiltrated) water is about 16 percent(Sacher and Brauch, 2002; Brauch et al., 2001). Compared to this, the direct abstraction of riverwater is of minor importance (less than 1 percent). In many cases (and mostly along larger rivers),a clear distinction between bank-filtrated water and groundwater is difficult, and the raw waterused for drinking-water production is bank-filtrated water blended with groundwater.
Bank-filtrated water as a source of raw water provides high-quality river water, and its subsoil passageguarantees an efficient and lasting removal of suspended matter, microorganisms, and organicmicropollutants. Hence, the occurrence and fate of organic contaminants in river water and bank-filtrated water are of great concern for water suppliers worldwide using surface water or artificialgroundwater as a drinking-water resource. Due to the huge number of possible contaminants in riverwater, a necessary restriction has to be made on organic substances that may be relevant to drinking-water production (Sacher and Brauch, 2002 and 1999; Sacher et al., 2001a). These targetcompounds are characterized by criteria like microbial biodegradability, adsorbability onto activatedcarbon and onto soil material, behavior versus oxidation agents, bioaccumulation, and groundwatermobility, as well as specific data about production and consumption quantities. Toxicological data, ifavailable, are also important, but are not the main criterion.
Methodology
Within the last few years, the behavior of selected hydrophilic organic micropollutants duringRBF was studied in waterworks on the lower Rhine River, as well as by laboratory-scale
137
Correspondence should be addressed to:
Dr.-Ing. Heinz-Jürgen BrauchHead of the Analytical DepartmentDVGW-Technologiezentrum Wasser (TZW)Karlsruher Strasse 84 • D-76139 Karlsruhe, GermanyPhone: +49(0)721/9678-150 • Fax: +49(0)721/9678-104 • Email: [email protected]

experiments. Most of the hydrophilic compounds under investigation are industrial chemicalswith high production volumes and a broad range of applications; therefore, they are likely to enterriver water if they are not totally removed in industrial or municipal wastewater treatment plants.In this paper, data on their fate during RBF will be presented, whereby the results of both lab-scaleexperiments and long-time measurements of river water and bank-filtrated water will be given.
For the simulation of microbial degradation during RBF, a so-called “test filter” is used. Thisclosed-loop apparatus was developed and used by Sontheimer and Völker (1987) for thecharacterization of fractions of surrogate parameters from wastewater effluents. In the last fewyears, the method was adjusted and optimized to study the biodegradation of single compounds atconcentration levels relevant for the environment (Karrenbrock et al., 1999; Knepper at al.,1999). Details of the experimental set-up are given elsewhere (Karrenbrock et al., 1999).
Several waterworks along the lower Rhine River were selected to measure the behavior of organicmicropollutants during RBF. All use bank-filtrated water from the Rhine River as raw water fordrinking-water production (Schubert, 2000; Denecke, 1997; Brauch et al., 2000), whereby theirwells are situated in a distance of 30 to 50 m from the Rhine River. In all cases, the raw water is amixture between bank-filtrated water and groundwater, whereby the groundwater fraction rangesbetween 5 and 40 percent (i.e., the raw water is predominantly bank-filtrated water from theRhine River). Regular measurements were performed over a time period of several years to attainreliable and significant data on the removal of organic compounds during underground passage(Brauch et al., 2000).
Results
Complexing Agents
Aminopolycarbonic acids like nitrilotriacetic acid (NTA), EDTA, or diethylenetrinitrilopentaaceticacid (DTPA) are used as chelating agents in detergents and industrial cleaners, as well as in thephoto, textile, and pulp- and paper-making industries. Due to their widespread use, NTA andEDTA are permanently found in the Rhine River in concentration levels of more than 1 µg/L(ARW and AWBR annual reports; Sacher et al., 1998). Besides these compounds, othercomplexing agents like ß-alaninediacetic acid (ADA) or 1.3-propylenedinitrilotetraacetic acid(PDTA) are used for special applications or as substitutes for EDTA. To test the biodegradation ofthese synthetic compounds, test-filter experiments were performed in which water from the RhineRiver at Karlsruhe was spiked with NTA, EDTA, DTPA, PDTA, and ADA at a concentrationlevel of 10-µg/L each. These experiments showed that the concentration of NTA decreased quiterapidly, indicating a fast microbial degradation of this complexing agent. The concentration ofADA decreased much slower and, after 35 days, about 30 percent of the initial concentration wasstill present. The concentrations of EDTA, PDTA, and DTPA seemed to be more or less constant,indicating that these complexing agents are persistent under the conditions of the test-filterexperiment.
Looking at the concentrations of NTA, EDTA, and DTPA in the Rhine River and in the rawwater of the waterworks, which consists of at least 90-percent bank-filtrated water from the RhineRiver, it is clear that in correspondence to the results of the test-filter experiments, NTA is nearlytotally removed during RBF and is only sporadically found in raw water. On the other hand,EDTA proved to be recalcitrant and was present in the raw water under investigation. DTPA wasfound only once in raw water, but concentrations in the Rhine River are quite near to the limitof determination (which was 2 µg/L until 1996 and is currently 1 µg/L), and mixing with some
138

uncontaminated groundwater could lead to an apparent removal of DTPA; therefore, based onenvironmental data, no definite statement can be given on the behavior of DTPA during RBF.ADA is only sporadically found in the Rhine River, and PDTA could not be detected in the RhineRiver (but is often found in the Neckar River, for instance).
Aromatic Sulfonates
Aromatic sulfonates are the corresponding bases to sulfonic acids and, due to their permanentnegative charge, are highly soluble in water. Benzenesulfonates are mainly used as intermediatesduring the manufacture of azo dyestuffs, optical brighteners, ion-exchange resins, plasticizers, andpharmaceuticals. Amino- and hydroxynaphthalene-sulfonates and anthraquinonesulfonates areimportant building blocks for azo dyestuffs. A major source of sulfonated stilbenes is the productionof fluorescent whitening agents for laundry products and paper. Naphthalenesulfonates and theircondensates with formaldehyde are large-scale products that have widespread applications,including paper chemicals, superplasticisers for concrete, textile auxiliaries, and synthetic leathertanning agents (Redin et al., 1999).
Test-filter experiments with 2-naphthalene-sulfonate and 1,5-naphthalenedisulfonate showedthat the behavior of the 2-naphthalene-sulfonates is different. Whereas 2-naphthalene-sulfonatedegraded very fast and, after 2 days, could not be detected in water, 1,5-naphthalenedisulfonateproved to be persistent and no change in concentration could be observed even after 30 days. Thebehavior of 1,5-naphthalenedisulfonate is characteristic for many two- or threefold sulfonatednaphthalene compounds. Naphthalene-sulfonates with two sulfo groups in alpha position seem tobe especially persistent (Lange et al., 1995).
As could be expected from the results of the test-filter experiments, 1,5-naphthalenedisulfonate,which is almost always present in the Rhine River, is not removed during RBF and was alwaysfound in the raw water of the waterworks under investigation. The same behavior was found for2-amino-1,5- and 2-amino-4,8-naphthalene-disulfonate, for 1,3,5- and 1,3,6-naphthalene-trisulfonate, for cis-4,4’-dinitro-2,2’-stilbene-disulfonate, and for 8,8’-methylenebis-2-naphthalene-sulfonate (Lange et al., 1995).
Pharmaceutical Compounds
Drugs were produced, prescribed, and used in quantities up to some hundred tons per year (inGermany). Due to an incomplete elimination in wastewater treatment plants, residues ofpharmaceutical products have recently been found in surface waters and groundwaters (Ternes,1998; Heberer, 2002; Sacher et al., 2001b). In the Rhine River, compounds like diclofenac (anantirheumatic and analgesic), carbamazepine (an antiepileptic that is also used as antidepressant),and clofibric acid and bezafibrate (two lipid-regulating agents) are most often found withconcentrations in the 10- to 100-nanograms per liter range. To study their behavior during RBF,test-filter experiments were performed, yielding that only bezafibrate is biodegradable under theconditions of the test-filter experiment. The concentration of carbamazepine decreases as afunction of time, but even after 30 days, it is present in the test-filter system. The concentrationsof diclofenac and clofibric acid are more or less constant, indicating that the respectivecompounds are not easily biodegradable. Monitoring data on the behavior of diclofenac andcarbamazepine during RBF under environmental conditions show that that diclofenac was neverdetected in the raw water under investigation, although it was nearly always found in the RhineRiver. Qualitatively, the same results were found for bezafibrate and clofibric acid (even if clofibricacid was only found a few times in the Rhine River). For bezafibrate, this finding is in accordancewith the results of the test-filter experiments. For diclofenac and clofibric acid, there is a
139

contradiction to the results of the test-filter experiment, indicating that these two compounds arenot biodegradable during underground passage. A satisfying explanation for the more effectiveelimination of diclofenac and clofibric acid under environmental conditions cannot be given.
Furthermore, it can be seen from the monitoring data that carbamazepine is always present in theraw waters of all waterworks taking bank-filtrated water from the Rhine River, confirming thepoor biodegradability of this compound found in the test-filter experiment.
Conclusions
Many organic micropollutants present in the Rhine River (and other river waters) are eliminatedduring RBF. Test-filter experiments prove that this elimination is mainly due to a microbialdegradation of the compounds. Until now, less is known about metabolites and their behavior inthe environment and during treatment processes in waterworks. Only few compounds are nottotally removed during RBF and enter the raw waters used for drinking-water production. For thewaterworks under investigation at the Rhine River, the compounds found in raw water could betotally removed by subsequent treatment steps like ozonation or GAC filtration, in most cases.
Hence, the use of bank-filtrated water instead of river water is advisable if industrial or municipalwastewaters may affect river-water quality. The use of bank-filtrated water, however, cannotreplace further treatment steps.
REFERENCES
Annual reports of Arbeitsgemeinschaft Rhein-Wasserwerke e.V. (ARW) and Arbeitsgemeinschaft WasserwerkeBodensee-Rhein (AWBR).
Brauch, H.-J., F. Sacher, E. Denecke, and T. Tacke (2000). “Wirksamkeit der Uferfiltration für die Entfernungvon polaren organischen Spurenstoffen.” gwf-Wasser/Abwasser, 141: 226-234.
Brauch, H.-J., U. Müller, and W. Kühn (2001). “Experiences with riverbank filtration in Germany.”Proceedings, International Riverbank Filtration Conference, Rheinthemen 4, 33-39.
Denecke, E. (1997). “Auswertung langzeitlicher Messreihen zur aeroben Abbauleistung der Uferpassage einerWassergewinnungsanlage am Niederrhein. Z.” Wasser-Abwasser-Forschung, 25: 311-318.
Heberer, T. (2002). “Occurrence, fate, and removal of pharmaceutical residues in the aquatic environment:A review of recent research data.” Toxicology Letters, 131: 5-17.
Karrenbrock, F., T.P. Knepper, F. Sacher, and K. Lindner (1999). “Entwicklung eines standardisiertenTestfilters zur Bestimmung der mikrobiellen Abbaubarkeit von Einzelsubstanzen.” Vom Wasser, 92: 361-371.
Knepper, T.P., F. Sacher, F.T. Lange, H.-J. Brauch, F. Karrenbrock, O. Rörden, and K. Lindner (1999).“Detection of polar organic substances relevant for drinking water.” Waste Management, 19: 77-99.
Kühn, W. and U. Müller (2000). “Riverbank filtration — An overview.” Journal AWWA, 92: 60-69.
Lange, F.T., M. Wenz, and H.-J. Brauch (1995). “The behaviour of aromatic sulfonates in drinking waterproduction from River Rhine water and bank filtrate.” Analytical Methods and Instrumentation, 2: 277-284.
Redin, C., F.T. Lange, H.-J. Brauch, and S.H. Eberle (1999). “Synthesis of sulfonated naphthalene-formaldehyde condensates and their trace-analytical determination in wastewater and river water.” ActaHydrochim. Hydrobiol., 27: 136-142.
Sacher, F., E. Lochow, and H.-J. Brauch (1998). “Synthetische organische Komplexbildner - Analytik undVorkommen in Oberflächenwässern.” Vom Wasser, 90: 31-41.
Sacher, F., and H.-J. Brauch (1999). “Bewertung organischer Einzelstoffe im Hinblick auf ihr Verhalten beider Wasseraufbereitung.” Veröffentlichungen aus dem Technologiezentrum Wasser, 7: 111-127.
140

Sacher, F., H.-J. Brauch, and W. Kühn (2001a). “Fate studies of organic micropollutants in riverbankfiltration.” Proceedings, International Riverbank Filtration Conference, Rheinthemen, 4: 139-148
Sacher, F., F.T. Lange, H.-J. Brauch, and I. Blankenhorn (2001b). “Pharmaceuticals in groundwaters —Analytical methods and results of a monitoring program in Baden-Württemberg, Germany.” J. Chromatogr.,A 938: 199-210.
Sacher, F., and H.-J. Brauch (2002). “Experiences on the fate of organic micropollutants during riverbankfiltration.” Understanding contaminant biogeochemistry and pathogen removal, C. Ray (ed.), Kluwer AcademicPublishers, The Netherlands, p. 135-151.
Schubert, J. (2000). “Entfernung von Schwebstoffen und Mikroorganismen sowie Verminderung derMutagenität bei der Uferfiltration.” gwf-Wasser/Abwasser, 141: 218-225.
Sontheimer, H. (1980). “Experiences with riverbank filtration along the Rhine River.” Journal AWWA, 72: 3,386-3,392.
Sontheimer, H., and E. Völker (1987). Charakterisierung von Abwassereinleitungen aus der Sicht der Trinkwasser-versorgung. Veröffentlichungen des Bereichs und Lehrstuhls für Wasserchemie am Engler-Bunte-Institut derUniversität Karlsruhe 31.
Sontheimer, H. (1991). Trinkwasser aus dem Rhein? Bericht über ein Verbundforschungsvorhaben zur Sicherheitder Trinkwassergewinnung aus Rheinuferfiltrat, Academia Verlag, Sankt Augustin.
Ternes, T.A. (1998). “Occurrence of drugs in German sewage treatment plants and rivers.” Wat. Res.,32: 3,245-3,260.
HEINZ-JÜRGEN BRAUCH has over 20 years of experience in resolving water-qualityproblems, with special emphasis in drinking-water production. He has conducted manyresearch projects on the development and optimization of analytical determinationmethods for organic micropollutants, including emerging contaminants and fate studies onground surface and drinking water, as well as the design and implementation of monitoringstrategies for controlling hazardous substances. In addition, he has completed severalprojects in cooperation with water utilities to improve and optimize the treatment
techniques for removing organic substances. Brauch has published numerous articles and papers on modernanalytical techniques for detecting organic micropollutants, fate and behavior of organics in drinking-watertreatment, occurrence and distribution of organic substances between water, and sediment and soil, as wellas on water-quality problems in surface water and groundwater. Brauch has been the Head of the AnalyticalDepartment of DVGW-Technologiezentrum Wasser (Technology Center for Water) in Karlsruhe, Germanysince 1990, and is the Chairman or Member of many national and international working groups in this field.He received a Ph. D. in Chemical Engineering from the University of Karlsruhe.
141

142

Session 7: Organics Removal
Organics Removal by Riverbank Filtrationat the Greater Cincinnati Water Works Site
Jeffrey VogtGreater Cincinnati Water WorksCincinnati, Ohio
William FrommeGreater Cincinnati Water WorksCincinnati, Ohio
Bruce Whitteberry, P.G.Greater Cincinnati Water WorksCincinnati, Ohio
William D. GollnitzGreater Cincinnati Water WorksCincinnati, Ohio
Objective
With the upcoming promulgation of the Stage 2 Disinfectants and Disinfection By-Product Rule,water utilities are required to reduce DBPs in their finished water (USEPA, 2003). Theconcentration of NOM in source waters is directly related to the concentration of DBPs formedin finished waters (Owen et al., 1993). The challenge for water utilities is to reduce precursors andNOM prior to disinfection. The natural process of RBF may be an effective method to removeNOM. As part of a research study, TOC, UV254, and THM formation potential were used toevaluate the organic removal capabilities of RBF. This project was a cooperative study between theUSGS,MiamiUniversity inOxford,Ohio, and theGreaterCincinnatiWaterWorks. This was a verylarge project with many objectives. The objective of this paper is to evaluate the removal of NOMby RBF.
Background
The Greater Cincinnati Water Works owns and operates a 40-MGD drinking-water treatmentplant located in southwestern Ohio. The source water for the plant comes from 10 productionwells located in an alluvial aquifer system adjacent to the Great Miami River. The aquifer is amixture of sand and gravel and has a hydraulic conductivity of 200 to 300 ft (62 to 91 m) per day.Five monitoring wells were drilled adjacent to the river and close to a production well (CMB1).Each monitoring well was drilled at varying depths in relation to the production well. Well 1A isthe shallowest vertical well and is the nearest to the river. Well 1D is the deepest well and closestto CMB1. Wells 1B and 1C were placed at intermediate depths between Wells 1A and 1D.
143
Correspondence should be addressed to:
Jeffrey VogtChemistGreater Cincinnati Water Works5651 Kellogg Ave • Cincinnati, Ohio 45228 USAPhone: (513) 624-5624 • Fax: (513) 624-5670 • Email: [email protected]

Well 1C is located at the top of the production well screen, and Well 1D is located at the bottomof the production well screen. To identify discrete sections of the aquifer, the monitoring wellswere developed with 2-ft (0.6 m) screened interval. An inclined well (Well 1I) was drilled fromthe top of the riverbank at a 20- to 30-degree angle from the horizontal plane. This well allowedthe study team to collect samples approximately 5- to 10-ft (1.5- to 3.1-m) below the streambed.Samples were collected and analyzed on a weekly basis and, later, at monthly intervals fromSeptember 1999 until May 2001.
Materials and Methods
TOC and UV254 were used to evaluate NOM removal. TOC analyses were analyzed with aTekmar/Dohrman Phoenix 8000 using the UV-Persulfate Method. UV absorbance at 254-mnwavelength was performed with a Hach DR4000. UV absorbance is primarily related to the humicfraction of NOM. UV at a wavelength of 254 nm is absorbed by double bonds and/or aromaticstructures mostly produced from the breakdown of plant and animal matter (Owen et al., 1993).THM formation potential were used to evaluate the removal of DBP precursors. The conceptbehind the analysis is to maximize the THM formation reaction. Conditions (chlorine dose, pH,hold time, and high temperature) are set so that the reaction is “pushed” to form THMs. A doseof 15-mg/L free chlorine was applied to the samples using a sodium hypochlorite solution. Thesample pH was adjusted to 9.5 with a borate buffer and then incubated at 35-degrees Celsius for7 days. After incubation, residual chlorine was measured. Samples were poured off and analyzedfor THMs with a Varian 3400 Gas Chromatograph using USEPA Method 502.2.
Results and Discussion
All three of the parameters demonstrated the ability of RBF to remove organic material. Table 1represents water-quality data obtained from the river, inclined well, monitoring wells, and productionwell. The removal values represent removals from the Great Miami River through the wells. Theaverage river results show relatively high concentrations of NOM as compared to drinking-waterstandards. Organic material was removed through the streambed (Well 1I), and is continuallyreduced as it migrates downward into the aquifer. Peaks in organic concentrations in the GreatMiami River correlated with peak concentrations inWell 1I, yet at a reduced concentration (Figure 1).TOC is reduced 37 percent from the Great Miami River to Well 1I. An additional 20 percent ofTOC was removed to Well 1C. This produces a total reduction in TOC of 59 percent. UV andTHM formation potential demonstrated even better reductions of, respectively, 63 and 72 percent.
144
Table 1. Average Values and Percent Removals from the Great Miami RiverOver the Entire Study Period
Great Well 1I Well 1A Well 1B Well 1C Production Well 1DMiami WellRiver CMB1
DEPTH (ft) 5 to 10 31 46 60 60 88
Avg. Avg. % Avg. % Avg. % Avg. % Avg. % Avg. %
TOC 5.48 3.36 39 2.50 54 2.32 58 2.27 59 1.17 79 0.63 89
UV254 0.147 0.092 37 0.063 57 0.057 61 0.055 63 0.023 84 0.007 95
THMFP 924 404 56 277 70 267 71 260 72 131 86 55.3 94
THMFP = THM formation potential.

Figure 2 presents UV254 data for all study locations. The bulk of UV reduction is observed betweenthe Great Miami River and Well 1I (37 percent). An additional 20-percent reduction is seenbetween Wells 1I and 1A. The reduction between Wells 1A and 1B is about 4 percent. BetweenWells 1B and 1C, there is about 2-percent reduction. The downward trend of UV reductioncontinues through all of the locations, but the zone surrounding Wells 1A, 1B, and 1Cdemonstrates minor change. The similarities within that zone can be observed in the maximum,average, and minimum values for those wells. Additional reductions are seen at Well 1D. Resultsfor Well 1D showed very low organic concentrations in all measured parameters when comparedto others wells. It is likely that this water is a combination of regional groundwater and water witha much longer flow path to the production well. This downward trend or pattern for reduction canbe observed in data plots of all three parameters.
CMB1 has a 30-ft (9-m) intake screen. It draws in water from a much larger capture zone than themonitoring wells due to a much longer screen and significantly higher pumping rates. The waterentering the production well is a mixture of water passing through Wells 1D and 1C, as well asother parts of the aquifer. The results for CMB1 fall between the results for both Wells 1C and 1Din three parameters.
CMB1 showed the least amount of variation in the data, as compared to Wells 1A, 1B, and 1C inFigure 2. UV results of the samples collected at CMB1 showed a maximum value of 0.029 cm–1,an average value of 0.023 cm–1, and a minimum value of 0.016 cm–1. Figure 2 shows the UV resultsfor CMB1 plotting very close together. The calculated standard deviation for CMB1 UV data is0.003 cm–1. Comparing that value to the standard deviation of Well 1C (0.009 cm–1), it isobserved that CMB1 shows little variation in its results. This trend of consistent results betweenthe data points can be seen in the THM formation potential and TOC results for CMB1. This islikely due to the large capture zone normalizing the concentration.
145
Figure 1. TOC for the Great Miami River and well samples for the entire study period.
Site 1 Total Organic Carbon
GMR FP1i FP1A FP1B FP1C CMB1 FP1D
0
1
2
3
4
5
6
7
8
9
TOC
(mg/
L)
9/1/99 12/2/99 3/3/00 6/3/00 9/3/00 12/4/00 3/6/01 6/6/01 9/6/01 Date

Looking again at Figure 1, all of the wells except for the inclined well demonstrated veryconsistent results. The average results forWells 1A, 1B, and 1C are similar for all of the parameters(see Figure 2). These data demonstrate that RBF is very effective in reducing any organic shockload from the river. High concentration peaks in the river and inclined well are unnoticed in theremaining wells. Others (Kuehn et al., 2000) have also demonstrated this process when using RBF.
THM formation potential can be used as a surrogate for THM concentrations in finished water(Owen et al., 1993). The ultimate goal of the Stage 2 Disinfectants and Disinfection By-ProductRule is to reduce THMs in finished waters produced by water treatment utilities across thecountry. UV and TOC measure bulk concentrations of organic matter, but THM formationpotential is a measurement of actual THM concentrations. The organic matter, which directlyreacts with the chlorine to form THMs, was observed to be the most reduced through the aquifer.Fifty-six percent of that matter was reduced at Well 1I, with an additional reduction of 21 percentthrough the 1A, 1B, and 1C zone. At CMB1, the matter was reduced to a total reduction of86 percent. These results suggest that RBF does an excellent job in reducing organic matter thatforms THMs.
The data from this project also supports the concept that the natural process of RBF producesconsistent water quality through time. Through this study period, there was no apparent break-through of organic material. This would indicate that the processes, which remove NOM in theaquifer, do not reach a saturation point, as would be expected in an engineered system, such asGAC.
146
Figure 2. Maximum, average, and minimum UV values at sample locations.
GMR FP1i FP1A FP1B FP1C CMB1 FP1DLocation
0.00
0.05
0.10
0.15
0.20
0.25
0.30
Abso
rban
ce(c
m–1
)
UV254 AbsorbanceMaximum Average Minimum

Conclusions
RBF is very effective in reducing organic matter in source waters. The reduction of NOM wasdemonstrated using TOC and UV254 absorbance. THM precursor removal was demonstratedusing THM formation potential.
• TOC reductions ranged from 39 to 79 percent between the Great Miami River andCMB1.
• UV254 absorbance reductions ranged from 37 to 84 percent between the Great MiamiRiver and CMB1.
• THM formation potential demonstrated the greatest range of reductions between theGreat Miami River and CMB1, with values of 56 to 86 percent.
• RBF is very effective in reducing organic shock loading. The high concentrations seen inthe river were not seen in the 1A, 1B, or 1C monitoring wells. During the study period,there was never a breakthrough of organic matter. The results for the three parametersremained consistent when compared to varying concentrations in the Great Miami River.
• Production well (CMB1) data remained very consistent in all of the measured parameters.
REFERENCES
Owen, D.M., G.L. Amy, and Z.K. Chowdhury (1993). Characterization of Natural Organic Matter and ItsRelationship to Treatability, American Water Works Research Foundation, Denver, Colorado.
USEPA (2003). Stage 2 Disinfectants/Disinfection By Product Rule, United States Environmental ProtectionAgency, Washington, D.C.
Kuehn, W., and U. Mueller (2000). “Riverbank filtration: An Overview.” Journal AWWA, 92(12): 60-69.
JEFFREY VOGT is a Chemist with the Greater Cincinnati Water Works, where he hasworked since 1992. For the last 5 years, he has been involved in riverbank-filtrationissues/research and was largely involved in the 3-year Flowpath Study. His responsibilitiesduring the study involved planning, sampling, analyses, data evaluation, and interpre-tation of the results. In 2002, he presented and published at the American WaterResources Association’s Groundwater/Surface Water Interactions Conference inKeystone, Colorado. Some of his current responsibilities include managing continuing
riverbank-filtration issues, parasite-monitoring program for the Long Term 2 Enhanced Surface WaterTreatment Rule at the Greater Cincinnati Water Works’ Richard Miller Treatment Plant, and treatmentstudies for the Greater Cincinnati Water Works’ three treatment plants. Vogt holds a Class 3 WaterTreatment license in the State of Ohio and received a Science degree from the University of Cincinnati.
147

148
Lunch Presentation
Potential Uses of Riverbank Filtrationfor Regulatory Compliance
Stig RegliUnited States Environmental Protection AgencyWashington, D.C.
RBF may have its most general application for systems seeking compliance with the LT2ESWTR.On August 11, 2003, the USEPA proposed the LT2ESWTR and included provisions by whichRBF could be used as one of the compliance options for providing Cryptosporidium removal credits(USEPA, 2003). While the USEPA has previously recognized (through guidance implementationdecisions) that RBF is a technology that can achieve pathogen removal, the LT2ESWTR is thefirst United States drinking-water regulation that specifically recognizes RBF as a compliancetechnology option.
Under the proposed LT2ESWTR, filtered systems must monitor source water for Cryptosporidiumto determine what source-water bin concentration category it belongs in and whether additionaltreatment is required. As part of this determination, the USEPA provides a “toolbox” of tech-nologies by which systems can assess their total removal/inactivation credits for Cryptosporidium.The proposed LT2ESWTR recognizes RBF as a “toolbox” pretreatment technique that canprovide a system 0.5- or 1.0-log additional pretreatment credit, if it meets specified design criteriaand monitoring criteria.
For RBF to be eligible for credit as a pretreatment technique, the following proposed criteria mustbe met:
• Wells must be drilled in an unconsolidated, predominantly sandy aquifer, as determinedby grain-size analysis of recovered core material — the recovered core must containgreater than 10-percent fine-grained material (grains less than 1.0-millimeter diameter)in at least 90 percent of its length.
• Wells must be located at least 25 ft (in any direction) from the surface-water source to beeligible for 0.5-log credit; wells located at least 50 ft from surface water are eligible for1.0-log credit.
• The wellhead must be continuously monitored for turbidity to ensure that no systemfailure is occurring. If the monthly average of daily maximum turbidity values exceeds1 ntu, the system must report this finding to the State. The system must also conduct anassessment to determine the cause of high turbidity levels in the well and consult withthe State to determine whether the previously allowed credit is still appropriate.
Systems using RBF as pretreatment to a filtration plant at the time that the system is required tomonitor for Cryptosporidium must sample the well effluent for the purpose of determining the bin
149
Correspondence should be addressed to:
Stig RegliEnvironmental EngineerUnited States Environmental Protection AgencyOGWDW (4607M) • 1200 Pennsylvania Avenue NW • Washington, D.C. 20460 USAPhone: (202) 564-5270 • Fax: (202) 564-3767 • Email: [email protected]

classification. Where bin classification is based on monitoring the well effluent, systems are noteligible to receive additional credit for RBF. The rationale for the above proposed criteria andopportunity for public comment are described in detail in the Federal Register (68FR47692) andare available on the web at http://www.regulations.gov/fredpdfs/03-18295.pdf.
RBF also provides the opportunity for directly reducing organic DBP precursor levels or indirectlyfacilitating the application of advanced precursor removal technologies, such as nanofiltration.The USEPA is proposing the Stage 2 Disinfection By-Product Regulation to mitigate concerns forthe potential risk of developmental and reproductive effects from DBPs. Since the compliancedates of the LT2ESWTR will coincide with those of the Stage 2 Disinfection By-ProductRegulation, there may be opportunities for utilities to use RBF for helping to achieve compliancewith both regulations.
The simultaneous reduction of other regulated contaminants by irreversible adsorption, biodegra-dation, dilution with groundwater, or attenuation mechanisms is also possible with RBF. This isclearly a site-specific issue whose success cannot be assumed without adequate testing/monitoring.
REFERENCE
USEPA (2003). National Primary Drinking Water Regulations: Long Term 2 Enhanced Surface Water TreatmentRule; Propose Rule, Federal Register, 68(154): 47,691-47,696.
STIG REGLI is an Environmental Engineer for the Office of Ground Water and DrinkingWater of the United States Environmental Protection Agency. He has been with theUnited States Environmental Protection Agency since 1979 and is involved withdeveloping national drinking-water regulations for public water systems. His major focushas been as a Regulation Manager (1985 to 1996) and, more recently, as a Senior ScienceAdvisor pertinent to the control of pathogens and disinfection byproducts. He has alsobeen on extended leave to work on drinking-water related projects in Somalia and
Thailand. Prior to working at the United States Environmental Protection Agency, he taught environmentalengineering courses as a Peace Corps volunteer at Kabul University in Kabul, Afghanistan. Regli receivedboth a B.S. in Mechanical Engineering and an M.S. in Civil Engineering from Duke University.
150
Session 8: Emerging Contaminants Removal
Transport and Attenuation ofPharmaceutical Residues During Bank Filtration
Andy MechlinskiInstitute of Food ChemistryTechnical University of BerlinBerlin, Germany
Thomas Heberer, Ph.D.Institute of Food ChemistryTechnical University of BerlinBerlin, Germany
Bank filtration and artificial groundwater recharge are important, effective, and cheap techniquesto treat surface water and remove microbes and inorganic and (some) organic contaminants;however, the purification capacity of these techniques varies and is limited in the removal of some,but not all, potential impurities. Thus, bank-filtration research began investigating pharmaceutic-ally active compounds (PhACs) when a number of groundwater samples from bank filtration sitespositively detected these compounds. To date, the mechanisms for removing impurities andchemical reactions of the water components have not sufficiently been understood. These subjectsare currently addressed in a new research project called NASRI. In this interdisciplinary project,the fate and transport of some new emerging contaminants during bank filtration are investigatedat Tegel and Wannsee Lakes and at a groundwater replenishment infiltration pond in Berlin,Germany. The locations of the field-sites are shown in Figure 1.
The field sites are equipped with different types of monitoring wells that screen at various depthsand are drilled between the infiltration bank and water-supply wells, as well as behind the water-supply wells. An example of the transects is shown in Figure 2.
These transects are sampled monthly, which allows the fate and transport of PhACs duringgroundwater recharge to be monitored. The samples are analyzed by solid phase extraction,chemical derivatization, and gas chromatography-mass spectrometry (GC/MS) applying selectedion monitoring. Two novel analytical methods detect PhACs even in complex environmentalsamples (Reddersen, 2003). Additionally, some other PhACs (such as antibiotics and estrogenicsteroids) are analyzed by high-pressure liquid chromatography mass spectrometry (HPLC-MS/MS).
In Berlin surface waters, PhACs are found up to the microgram-per-liter level as highly persistentresidues. Six PhACs (Figure 3), including the analgesic drugs diclofenac and propyphenazone, theantiepileptic drugs carbamazepine and primidone, and the drug metabolites clofibric acid and1-acetyl-1-methyl-2-dimethyl-oxamoyl-2-phenylhydrazide (AMDOPH), were found to leach fromcontaminated watercourses into groundwater aquifers. They also occur at low concentrations inreceiving water-supply wells. Bank filtration was, however, also found to decrease concentrations(e.g., of diclofenac) or even remove some PhACs (bezafibrate, indomethacine, antibiotics, andestrogens). Other PhACs (such as carbamazepine and, especially, primidone) were identified asbeing excellent tracers of sewage contamination in surface water and groundwater.
151
Correspondence should be addressed to:
Andy MechlinskiGraduate StudentInstitute of Food ChemistryTechnical University of Berlin • Sekr. TIB 4/3-1 • Gustav-Meyer-Allee 25 • 13355 Berlin, GermanyPhone: +49 (30) 314-72267 • Fax: +49 (30) 314-72823 • Email: [email protected]

Acknowledgements
The authors would like to thank Veolia Water and the Berlin Water Company for financing theNASRI project.
REFERENCE
Reddersen, K., and T. Heberer (2003). “Multi-methods for the trace-level determination of pharmaceuticalresidues in sewage, surface and ground water samples applying GC-MS.” J. Sep. Sci. (in press).
152
33113310
33013302
3303
3337 3335
3334
Langsamsandfilter8 Peilrohre
Uferfiltration
KW Stahnsdorg
Kleinmachnow
KW Waßmannsdorf
Neue Mühle
Wernsdorf
Große Tränke
Woltersdorf
Flakenfließ und Löcknitz
KW Münchehofe
KW SchönerlindeWW Stolpe
WW Friedrichs- hagen
Fredersdorfer Fließ
Dahme
ErpeWuh
le
WW Wuhlheide
WW Johannisthal
Tettowkanal
Neukölln
(KW Marienfelde)
MHG
KW Falkenberg
Wasserwerk waterworks
Klärwerk sewage treatment plant
Phospat-Eliminationsanlage�surface water treatment plantTS Transsekte Testfield
Wehr weir
Schleuse lock
Pank
e
Nordgraben
WW Tegel
PEA-Tegel
Tegeler Fließ
Panke
Tege
lerSe
e
Spandau
Have
l
KW RuhlebenUnterschleuse
Charlottenburg
WW Jungfernheide
Spree
WW Tiefwerder
WW Kladow
WW und PEABeelitzhof
Einleitung KW Ruhleben
Teitk
owka
nal
WW Spandau
Mühlendamm
SpreeOberschleuseLandwehrkanal
Nottekanal
SpeicherteichMessstellen
33363339
3338
3332
3333
TEG365
TEG364TEG247
Br.20
TEG248
14
Berna
uerst
.Gale
neWest
Galer
ieW
anns
ee
TegelerSee
Sick
erbe
cken
Unte
rhav
el
13
4
12
330933083307
3306
3304
3305
Free University of Berlin Federal Environmental Agency (UBA)
©
TS Müggelsee E.
TS Müggelsee C.
TS Tegeler See
GWA Tegel
TS Lieper Bucht
TS Wannsee
Testfeld Marienfelde
Figure 1. Locations of the Tegel transect,Wannsee transect, and groundwater recharge area in Berlin, Germany.
33113310 3309
Pegel
Tegler
See
TEG37
1OP
TEG37
1UP
TEG37
2
33013308 3302 3307 3303
3306 3304 33050 m
5 m
10 m
15 m
20 m
25 m
30 m
35 m
40 m
45 m
Br 13
glacial till
NE
depth below ground [m]
approximately 120 m
SW
new observation wells (08/2002)existing observation wells
? ?
?
Freie Universität Berlin
veritas iustitia libertas
Figure 2. Profile of the Tegel transect with 14 observation wells and Water Works Well Br. 13.

ANDY MECHLINSKI is a Ph.D. student at the Institute of Food Chemistry of theTechnical University of Berlin in Germany. His research interests include the analysis ofpharmaceutically active compounds by gas chromatography-mass spectrometry and theinvestigation of the environmental fate and transport of pharmaceuticals duringgroundwater recharge at bank-filtration sites in Berlin. In 2001, he took the first part ofthe final examination covering food chemistry at the Technical University of Berlin. Afterthis, he prepared a diploma thesis concerning the transport and attenuation of pharma-
ceuticals during bank filtration at two field sites in Berlin. From 2002 until 2005, he will be involved in theinterdisciplinary Natural and Artificial Systems for Recharge and Infiltration project. Mechlinski recievedhis undergraduate degree at the Institute for Food Chemistry of the Technical University of Berlin, where heinvestigated the behavior of several pharmaceuticals and other contaminants during riverbank filtration attwo field sites in Berlin.
153
H3CO O
N
NNN
NN Cl
Cl
Cl
ClH N
H N
Cl
AMDOPH Bezafibrate
Clofibric Acid
Primidone Propyphenazone Indometacine
Diclofenac
Carbamazepine
C C COOH
COOH
HOOC
CO
O
O
O
O
O
NH
CNH-CH2CH2
OC CH2
N
H3C
H3C CH3
CH3
CH3
CH3
CH3
CH3
CH3 CH2
C 2H2
CH3
H5C6
H5C2CH3
Figure 3. Structures of some detected PhACs.

154

Session 8: Emerging Contaminants Removal
Attenuation of PharmaceuticalsDuring Riverbank Filtration
Traugott Scheytt, Ph.D.Institute of Applied GeosciencesTechnical University BerlinBerlin, Germany
Petra MersmannInstitute of Applied GeosciencesTechnical University BerlinBerlin, Germany
Marcus LeidigInstitute of Applied GeosciencesTechnical University BerlinBerlin, Germany
Thomas Heberer, Ph.D.Institute of Food ChemistryTechnical University BerlinBerlin, Germany
Objective
Occurrences of PhACs from human medical care are reported in groundwater not only from theBerlin (Germany) area (Heberer et al., 1998; Scheytt et al., 1998), but also from several placesworldwide (Heberer, 2002). These findings initiated more specific investigations concerning the fateand transport of those pharmaceuticals under water-saturated and unsaturated conditions (Scheyttet al., in preparation). Field investigations at the bank infiltration site at Lake Tegel (Berlin,Germany) show the presence of several classes of pharmaceuticals, such as antirheumatics(e.g., diclofenac), analgesics (e.g., propyphenazone), and blood lipid regulators (clofibric acid) inboth surface water and groundwater (Verstraeten et al., 2003). At Lake Tegel, clofibric acid was foundat concentrations up to 290 nanograms per liter and propyphenazone up to 250 nanograms per liter,whereas concentrations of diclofenac were around detection limit.
These results will be compared to preliminary results from an ongoing study at the Santa AnaRiver in Orange County, California. Using its forebay facilities, the Orange CountyWater District
155
Correspondence should be addressed to:
Traugott Scheytt, Ph.D. (after December 2003)Department of Civil and Environmental Engineering609 Davis Hall • University of California • Berkeley, California 94720 USAPhone: (510) 642-0151 • Fax: (510) 642-7483 • Email: [email protected]
Traugott Scheytt, Ph.D. (until December 2003)Associate Professor for HydrogeologyInstitute of Applied GeosciencesTechnical University Berlin • Ackerstr. 71-76 • 13355 Berlin, GermanyPhone: +49 30 314-72417 • Fax: +49 30 314-25674 • Email: [email protected]

recharges surface water from the Santa Ana River into the Orange County Groundwater Basin.The fact that a high amount of the Santa Ana River’s flow is of wastewater origin has promptedconcern that PhACs that survive secondary and tertiary treatment and groundwater transport mayend up in the aquifer.
To understand the transport and attenuation processes of those substances, laboratory columnexperiments were conducted (Mersmann et al., 2002). Based on these results, it is possible toidentify and predict the transport and fate of PhACs during bank infiltration and to identify thepharmaceuticals, which may enter the aquifer via bank infiltration.
Materials and Methods
Pleistocene sediments from a well drilling campaign carried out by the Berlin Water Works wereused to prepare the soil column for the column leaching experiment. The sediment was sampledat a depth of approximately 60-m below ground level and consisted of medium-grained sand. Thesediment was manually packed into a stainless steel column measuring 35 × 14 centimeters (innerdiameter). A gauze net and 0.5-diameter globes were placed at both the top and bottom of thecolumn to prevent soil particles from leaching. The column was pre-wetted and, afterwards,equilibrated with groundwater originating from the same location and depth like the sedimentitself. Groundwater was led through the column with a flow rate of about 0.3 m per day and abottom-to-top flow direction to ensure saturated conditions in the column.
Equilibration of the column with pure groundwater took about 5 days (4.83 pore volumes) beforepharmaceutical compounds were applied. The groundwater used for the column experimentrepresents a typical groundwater from the Berlin area not contaminated by any PhAC residues.Lithium chloride (LiCl) (used as tracer) and the pharmaceuticals were applied to the samegroundwater, which was then passed through the column for approximately 10 days. Beside thetracer and pharmaceutical compounds, all other parameters (e.g., flow rate) were kept the sameduring all three phases of the study. The experiments took place at a room temperature ofapproximately 20-degrees Celsius and all parts of the column experiment, including the tank, wereprotected against exposure to light. The eluted liquid was collected in fractions of approximately25 milliliters and analyzed for contents of anions, cations, pharmaceutical chemicals, and thelithium chloride used as a tracer.
The concentration of the lithium chloride tracer was 10 mg/L, and the pharmaceuticals had aconcentration of 10 µg/L in the spiked water. Physico-chemical parameters (redox potential, pH,temperature, oxygen saturation, specific conductance) were measured every 10 minutes usingrespective electrodes coupled to a data logger. Lithium chloride was chosen as a tracer because thebackground concentration of lithium was definitely below detection limit in all sediment andgroundwater samples used for the experiments. Lithium also shows a transport behavior comparableto a nonreactive tracer and can be analyzed in a rapid and cost-effective manner.
For the analysis of pharmaceutical compounds, water samples were adjusted to a pH of 2 and thenextracted by solid-phase extraction using a non-endcapped reversed phase adsorbent(RP-C18 Bakerbond Polar Plus). Then the analytes and surrogate standard were derivatized,making them amendable to gas chromatographic separation (Heberer et al., 1998).Two microliters of the sample extracts (100 microliters for each sample) were analyzed by capillaryGC-MS with selected ion monitoring. Depending on the sample volume (100 to 1,000 milliliters),the limits of determination were between 1 and 10 nanograms per liter, and the limits of quantitationwere between 5 and 25nanograms per liter. The analytical recoveries range between 80 and 120 percent.For further analytical details, refer to Heberer et al. (1998).
156

Results and Conclusion
The Santa Ana River study will provide information about the concentration of some high-volumepharmaceuticals from human medical care in the Santa Ana River, especially acetaminophen,carbamazepine, diclofenac, gemfibrozil, ibuprofen, metoprolol, naproxen, primidone, and propranolol.Laboratory experiments show that clofibric acid exhibits no degradation and almost noretardation (Rf = 1.1). After spiking groundwater with lithium chloride and diclofenac, themovement of diclofenac within the column is much slower than the movement of the lithiumtracer (Figure 1), leading to a retardation factor of Rf = 2.6 for diclofenac. Propyphenazone(Rf = 2.0) is also retarded, whereas significant degradation was not observed for both pharmaceu-ticals, diclofenac and propyphenazone, under prevailing conditions in the soil column. Ibuprofenis degraded under aerobic conditions, whereas only little degradation was observed underanaerobic conditions. The retardation factor for ibuprofen was extrapolated to be 4.0.Carbamazepine shows no degradation in the soil column experiments, but significant retardation(Rf = 2.8) under prevailing conditions.
It was concluded that at least clofibric acid, propyphenazone, and carbamazepine are recalcitrantunder groundwater conditions and will be transported within the aquifer at the Berlin bank-filtrationsite. Additionally, due to anaerobic conditions in the deeper part of the aquifer, diclofenac andibuprofen may also occur in groundwater and are transported if these compounds are not completelydegraded in surface water or in the aerobic part of the aquifer.
Compared to the bank-infiltration site at Lake Tegel in Berlin, the situation is quite different atthe Santa Ana River, especially in respect to the climate and hydrogeological setting. Among thealready mentioned pharmaceuticals of interest at the Santa Ana River, acetaminophen isprescribed in high amounts, but it is expected that this compound will be attenuated during bankinfiltration due to its high biodegradability. Additionally, due to mostly aerobic conditions in theaquifer at the Santa Ana River, diclofenac and ibuprofen will be degraded under these aerobicconditions. Among the pharmaceuticals that might be expected in groundwater are carbamazepine,primidone, gemfibrozil, metoprolol, naproxen, and propranolol.
157
0.0
0.2
0.4
0.6
0.8
1.0
1.2
0.0 5.0 10.0 15.0 20.0 25.0 30.0
Pore Volume
C/C
0
Lithium Diclofenac
Figure 1. Concentration of lithium and diclofenac at the outflow of the soilcolumn; results from a single-substance laboratory soil column experiment.

Acknowledgments
Deutsche Forschungsgemeinschaft has funded parts of this work, and the National Water ResearchInstitute is funding the research on attenuation of pharmaceuticals during recharge at the SantaAna River. The authors appreciate the cooperation of the Berliner Wasserbetriebe in gainingaccess to waterworks wells and the help of the Orange County Water District, which has greatlycontributed to the study.
REFERENCES
Heberer, T. (2002). “Occurrence, fate, and removal of pharmaceutical residues in the aquatic environment:A review of recent research data.” Toxicology Letters, 131: 5-17.
Heberer, T., K. Schmidt-Bäumler, and H.-J. Stan (1998). “Occurrence and distribution of organic contami-nants in the aquatic system in Berlin. Part I: Drug residues and other polar contaminants in Berlin surfaceand groundwater.” Acta Hydrochimica et Hydrobiologica, 26: 272-278.
Mersmann, P., T. Scheytt, and T. Heberer (2002). “Column experiments on the transport behavior ofpharmaceutically active compounds in the saturated zone.” Acta Hydrochimica et Hydrobiologica,30(5-6): 1-10.
Scheytt, T., T. Mersmann, M. Leidig, A. Pekdeger, and T. Heberer (in preparation). “Transport ofpharmaceutically active compounds (PhACs) clofibric acid, diclofenac, and propyphenazone under watersaturated conditions.” Ground Water, Westerville, OH.
Scheytt, T., S. Grams, and H. Fell (1998). “Occurrence and behavior of drugs in groundwater.” Gambling withgroundwater – physical, chemical, and biological aspects of aquifer-stream relations, J.V. Brahana, Y. Eckstein,L.K. Ongley, R. Schneider, and J.E. Moore, eds., IAH/AIH Proc., St. Paul., MN.
Verstraeten, I.M., T. Heberer, and T. Scheytt (2003). “Occurrence, characteristics, transport, and fate of pesticides,pharmaceutically active compounds, and industrial products and personal care products at bank-filtrationsites.” Riverbank Filtration: Improving Source-Water Quality, C. Ray, G. Melin, and R.B. Linsky, eds.,Kluwer Academic Publishers, Dordrecht.
TRAUGOTT SCHEYTT has been an Associate Professor for Hydrogeology in theDepartment of Civil Engineering and Applied Geosciences at the Technical UniversityBerlin since 1996. His teaching duties include courses on groundwater chemistry,groundwater flow, and transport of organic contaminants. Current research areas includethe transport and attenuation of pharmaceutically active compounds, natural attenuationof contaminants emanating from landfills, and prediction of transport and degradation oforganic contaminants in groundwater. Presently, he is on sabbatical at University of
California, Berkeley, and will stay in California until January 2004 to conduct research on the transport andattenuation of pharmaceutically active compounds during riverbank filtration at the Santa Ana River inOrange County, California. Scheytt received an M.S. and Ph.D. in Geology from Christian-Albrechts-University Kiel in Germany.
158

Session 8: Emerging Contaminants Removal
The Fate of Bulk Organics and Emerging ContaminantsDuring Soil-Aquifer Treatment
Dr. Jörg E. DrewesColorado School of MinesGolden, Colorado
Dipl.-Ing. Tanja RauchColorado School of MinesGolden, Colorado
Introduction
Wastewater reuse employing soil-aquifer treatment is becoming an increasingly important strategyfor many utilities in the United States and abroad to augment local drinking-water sources wheresupplies are limited. One major water-quality issue associated with soil-aquifer treatment leadingto indirect potable or nonpotable reuse of wastewater effluents is the fate and transport of organicconstituents. Effluent-derived bulk organic matter can impair the quality of recovered water byinterfering with post-treatment processes, such as coagulation, adsorption, or membranetreatment. Bulk organic matter is also a known precursor for DBPs. The presence of bioavailableorganic carbon after soil-aquifer treatment could also increase the microbial regrowth potential indistribution systems. In addition, BOM might be comprised of organic micropollutants, whichsurvive during soil-aquifer treatment and which are associated with potential adverse humanhealth effects. The objective of this study was to investigate the fate and transport of bulk andtrace organics present in reclaimed water during soil-aquifer treatment leading to indirect potablereuse. The American Water Works Association Research Foundation and USEPA funded this study.
Methodology
The fate of organics during soil-aquifer treatment was investigated using controlled biodegradationstudies in adapted soil-columns and full-scale infiltration facilities in Arizona and California. Thestudy design followed a watershed-guided approach considering hydraulically correspondingsamples of drinking-water sources, soil-aquifer treatment-applied wastewater effluents, andsubsequent post-soil-aquifer treatment samples representing a series of different travel times in thesubsurface. Extensive characterization of organic carbon in the different samples was performedusing state-of-the-art analytical techniques (such as size-exclusion chromatography with onlineDOC and UV absorbance detection, carbon-13 nuclear magnetic resonance spectroscopy, Fouriertransform infrared spectroscopy, and elemental analysis) and biomass/bioactivity measurements(dehydrogenase activity; total viable biomass through phospholipid extraction; substrate inducedrespiration) to distinguish between primary removal mechanisms (biodegradation versus adsorption).The mechanisms contributing to bulk organic matter removal during initial recharge were
159
Correspondence should be addressed to:
Dr. Jörg E. DrewesAssistant ProfessorEnvironmental Science & Engineering DivisionColorado School of Mines • Golden, Colorado 80401-1887 USAPhone: (303) 273-3401 • Fax: (303) 273-3413 • Email: [email protected]

identified by isolating three bulk fractions from treated wastewater effluents:
• Hydrophilic carbon (HPI).
• Hydrophobic acids (HPO-A).
• Colloidal organic matter.
HPI and HPO-A were isolated from a domestic secondary effluent by XAD-8 fractionation.Colloidal organic matter was operationally defined as organic matter in the size range ofapproximately 6,000 Dalton to 1 micrometer and was isolated using dialysis diffusion after a pre-concentration using large volume rotary evaporation. Trace organics selected for this study werePhACs and personal care products, as well as selected endocrine disrupting compounds(17β-estradiol, estriol, and testosterone).
Pharmaceutical compounds were selected for this study based on their production, per-capitaconsumption, and occurrence in domestic effluents and surface waters in the United States andMiddle Europe. Caffeine has been a well-known PhAC of wastewater origin for more than20 years. In the category of analgesics/anti-inflammatory drugs, diclofenac, ibuprofen, ketoprofen,naproxen, fenoprofen, propyphenazone, meclofenamic acid, and tolfenamic acid were identified.Carbamazepine and primidone were identified as antiepileptic drugs. Pentoxifylline represented acommon blood viscosity-affecting agent. Gemfibrozil, clofibric acid, and fenofibrate were selectedto represent blood lipid regulators. Organic iodine was used as a surrogate parameter for thedetection of X-ray contrast agents (triiodinated benzene derivates such as iopromide anddiatrizoate) and their halogenated metabolites.
Results
Data derived from several soil-aquifer treatment field sites consistently indicate a substantialremoval of DOC during travel through the subsurface. At one site employing tertiary treatmentprior to recharge, average DOC concentrations of 5.6 mg/L in the tertiary effluent decreased from5.6 mg/L to approximately 1.45 mg/L in groundwater monitoring wells after traveling 6 to 12 monthsin the subsurface. At the same time, the specific UV absorbance increased, indicating a preferredremoval of aliphatic compound groups within bulk organic matter. Further DOC removaloccurred during long-term travel in the subsurface of 1 to 2 years from 1.45 mg/L to approximately1.1 mg/L. At another site employing only secondary treatment without nitrification prior torecharge, the DOC concentration was efficiently reduced to approximately 2 mg/L afterpercolating through the vadose zone. The specific UV absorbance increased only slightly from1.7 liters per milligram and meter (L/mg m) in the secondary treated effluent to 2.0 L/mg m ingroundwater samples. These findings pointed to a fast and substantial removal of biodegradableorganic carbon during the initial phase of groundwater recharge. The results of spectroscopicinvestigations generally demonstrated that naturally derived and effluent-derived organic matterafter SAT overlap extensively in molecular weight distribution, amount and distribution ofhydrophobic and hydrophilic carbon fractions, and chemical characteristics based on elementalanalysis and structural analysis; however, the residual portion of DOC contained botheffluent-derived organic matter and NOM.
Results of this study indicate that during vadose zone treatment, HPI is removed by a combinationof physical and biological mechanisms. HPO-A is least efficiently removed of all fractions duringsoil infiltration. Both adsorption and biotransformation seem to contribute to this removal. Lowbiomass activity responses in soil-columns fed with HPO-A indicated that these substances arerefractory in nature. The fate of effluent-derived colloidal organic matter during groundwater
160

recharge is not well understood. Our studies give reason to believe that colloidal organic mattercan be efficiently removed during initial soil recharge, and that this removal is based on thefiltration mechanism and biodegradation. Colloidal organic matter stimulated high biomassactivities, but was not fully mineralized. Remobilization and the breakthrough of colloidal organicmatter was observed in column experiments fed with colloidal organic matter under higherinfiltration rates. The removal of colloidal organic matter might, therefore, depend upon hydraulicregimes in the aquifer during recharge operation. The majority of biological removal in the HPIand HPO-A fractions occurred in the first 30-centimeters of soil infiltration.
Findings of this study demonstrated that the dominating removal mechanism for steroids duringsoil-aquifer treatment is adsorption, although biodegradation is also taking place and is importantfor a sustainable operation avoiding compound accumulation in the system. The study showedthat steroid removal was not dependent upon the type of organic background matrix present (HPI,HPO-A, colloidal organic matter) or redox and flox conditions (aerobic versus anoxic; saturatedversus unsaturated). 17β-estradiol, estriol, and testosterone were efficiently removed from initialconcentrations as high as 500 nanograms per liter after only 5.2 hours of contact with subsurfacemedia in the presence of soil microbial activity.
In addition, the study revealed that the stimulant caffeine, analgesic/anti-inflammatory drugs, andblood lipid regulators were efficiently removed to concentrations near or below the detection limitof the analytical method after retention times of less than 6 months during groundwater recharge.The antiepileptics carbamazepine and primidone were not removed during groundwater rechargeunder either anoxic saturated or aerobic unsaturated flow conditions during travel times of up to8 years. Organic iodine showed a partial removal only under anoxic saturated conditions (ascompared to aerobic conditions) and persisted in recharged groundwater.
Conclusions
Findings of this study demonstrated that soil-aquifer treatment represents an efficient treatmentstep to reduce bulk organic carbon and to remove trace pollutants of concern present in reclaimedwater.
JÖRG DREWES is an Assistant Professor of Environmental Science and Engineering atthe Colorado School of Mines. He has been actively involved in research in the area ofwater reclamation, water reuse, and groundwater recharge for more than 11 years. Hisresearch interests include water and wastewater treatment engineering; potable and non-potable water reuse (soil-aquifer treatment and microfiltration/reverse osmosis); state-of-the-art characterization of natural and effluent organic matter; contaminant transferamong environmental media; and the fate of endocrine disrupting compounds and
pharmaceuticals in natural and engineered systems. Drewes has published more than 50 journal papers, bookcontributions, and conference proceedings. Among his honors, he was awarded the Willy-Hager Award in1997, Quentin Mees Research Award in 1999, and Dr. Nevis Cook Excellence in Teaching Award in 2003.Drewes received both an M.S. and Ph.D. in Environmental Engineering from the Technical University ofBerlin, Germany.
161

162

Session 8: Emerging Contaminants Removal
Ethylenediaminetetraacetic Acid Occurrence andRemoval Through Bank Filtration in the Platte River,Nebraska
Jason R. Vogel, Ph.D.United States Geological SurveyLincoln, Nebraska
Larry B. Barber, Ph.D.United States Geological SurveyBoulder, Colorado
Tyler B. Coplen, Ph.D.United States Geological SurveyReston, Virginia
Ingrid M. Verstraeten, Ph.D.United States Geological SurveyBaltimore, Maryland
Thomas F. Speth, Ph.D., P.E.United States Environmental Protection AgencyCincinnati, Ohio
Jerry Obrist, P.E.City of Lincoln Water SystemLincoln, Nebraska
The USGS, USEPA, and City of Lincoln Water System (Nebraska) have conducted a study todetermine the occurrence and removal of EDTA, NTA, and nonylphenol monoethoxycarboxylateto nonylphenol pentaethoxycarboxylate (NP1EC-NP5EC) in the hydrologic system at the City ofLincoln well field. The objective of the study is to evaluate the occurrence and removal of EDTA,NTA, and total nonylphenolpolyethoxycarboxylate (NPEC) by bank filtration at the City ofLincoln well field. This presentation will discuss removal during two sampling periods — May andAugust 2002 — based upon surface-water fractions in the collector well calculated using stableisotope ratios of hydrogen and oxygen.
The rationale for selecting compounds evaluated in this study was based on the hierarchicalanalytical approach and includes a range of compounds covering a spectrum of uses and effects.For example, EDTA is a low-toxicity, high-production volume chemical used in multipledomestic, commercial, and industrial applications to form stable, water-soluble complexes withtrace metals. Because of its uses and chemical characteristics, EDTA occurs at relatively highconcentrations and can persist in the aquatic environment (Barber et al., 1996; Barber et al., 2000;Leenheer et al., 2001; Barber et al., 2003).
163
Correspondence should be addressed to:
Jason R. Vogel, Ph.D.HydrologistUnited States Geological SurveyRoom 406, Federal Building • 100 Centennial Mall North • Lincoln, Nebraska 68508 USAPhone: (402) 437-5129 • Fax: (402) 437-5139 • Email: [email protected]

Site Description
There are 40 active production wells at the City of Lincoln well field. Two of these wells arehorizontal collector wells screened in alluvial sand and gravel approximately 26-m below thePlatte River; they provide approximately 50 percent of the municipal water during most times ofthe year. The remaining 38 wells are vertical production wells that are developed in alluvialsediments mainly consisting of sand and gravel. At this location, the quality of the river water hasa large effect on the quality of the bank-filtered water obtained from the collector wells. Similarly,the water quality of the groundwater in the vertical production wells directly corresponds to thedistances of the wells from the river. Because of the direct link between the collector wells andriver, the collector well is usually turned off during the month of May and first part of June to avoidthe flush of herbicides associated with spring planting in this agricultural area. After collection,well water is treated by ozonation, filtration, and chlorination before distribution.
Sampling
Representative surface-water samples were collected quarterly from the Platte River at the well-field site using equal width-increment, flow-weighted sampling. Groundwater samples were alsocollected quarterly from one of the collector wells and from two of the vertical groundwater wells.One groundwater well was located relatively close to the river (within 100 m), with anotherlocated away from the river (1,000 m). All samples were filtered through 0.7-m glass fiber filtersand collected in pre-cleaned amber glass bottles. Samples for EDTA, NTA, and NPEC analyseswere preserved with 2-percent by volume formalin. This presentation will discuss the results ofsamples from May and August 2002.
Analysis
EDTA, NTA, and NP1EC-NP5EC were measured using a modification (Barber et al., 2000) ofthe method of Schaffner and Giger (1984). Samples (100 milliliters) were evaporated to dryness,acidified with 5-milliliter 50-percent (volume per volume) formic acid/distilled water, and evapo-rated to dryness. Acetyl chloride/propanol (10-percent volume per volume) was added, the sampleheated at 90-degrees Celsius for 1 hour to form the propyl-esters, and the propyl-esters wereextracted into chloroform. The chloroform extracts were evaporated to dryness and re-dissolvedin toluene for analysis by GC/MS, as described below.
The propyl-ester extracts were analyzed by electron-impact GC/MS in both the full-scan andselect ion monitoring modes. The general GC conditions were:
• Hewlett Packard (HP) 6890 GC.
• Column-HP Ultra II (5-percent phenylmethyl silicone), 25 m × 0.2 millimeters,33-micrometer film thickness.
• Carrier gas, ultra-high purity helium,with a linear-flow velocity of 27 centimeters per second.
• Injection port temperature, 300-degrees Celsius.
• Initial oven temperature, 50-degrees Celsius.
• Split vent open, 0.75 minutes.
• Ramp rate, 6-degrees Celsius per minute to 300-degrees Celsius.
• Hold time, 15 minutes at 300-degrees Celsius.
164

The MS conditions were as follows:
• HP 5973 Mass Selective Detector.
• Tune with perflurotributylamine.
• Ionization energy, 70 electron volt (eV).
• Source pressure, 1 × 10⁻⁵ torr.
• Source temperature, 250-degrees Celsius.
• Interface temperature, 280-degrees Celsius.
• Full scan, 40 to 550 atomic mass units at one scan per second.
Concentrations were calculated based on select ion monitoring data using diagnostic ions for eachcompound. Each compound was identified based on the matching of retention times (±0.02 minutes)and ion ratios (±20 percent) determined from the analysis of authentic standards. An eight-pointcalibration curve (typically ranging from 0.01 to 50 nanograms per microliter) and internalstandard procedures were used for calculating concentrations. Surrogate standards were added tothe samples prior to extraction and derivatization to evaluate compound recovery and wholemethod performance.
Results
In general, based upon results from May and August 2002, measured EDTA concentrations forsurface-water samples were larger than for groundwater samples. In addition, EDTA concentra-tions decreased and total NPEC concentrations increased in the groundwater as the distance ofthe well from the river increased. NTA was only detected in one surface-water sample at very lowlevels and not at all in groundwater samples.
Using surface-water fractions in the collector well determined from deuterium and oxygen-18 ratios,the transport of EDTA was nearly conservative during these two sampling periods. Total NPECconcentrations were lower than predicted. Further analysis will be forthcoming in the presentation.
REFERENCES
Barber, L.B., G.K. Brown, and S.D. Zaugg (2000). “Potential endocrine disrupting organic chemicals intreated municipal wastewater and river water.” Analysis of Environmental Endocrine Disruptors, L.H. Keith,T.L. Jones-Lepp, and L.L. Needham, eds., American Chemical Society Symposium Series 747, AmericanChemical Society, Washington, DC, p. 97-123.
Barber, L.B., E.T. Furlong, S.H. Keefe, G.K. Brown, and J.D. Cahill (2003). “Natural and ContaminantOrganic Compounds in Boulder Creek, Colorado under High-Flow and Low-Flow Conditions, 2000.”Comprehensive water quality of the Boulder Creek Watershed, Colorado, under high-flow and low-flow conditions,S.F. Murphy, L.B. Barber, and P.L. Verplanck, eds., U.S. Geological Survey Water Resources InvestigationsReport 03-4045.
Barber, L.B., J.A. Leenheer, W.E. Pereira, T.I. Noyes, G.A. Brown, C.F. Tabor, and J.H. Writer (1996).“Organic contamination of the Mississippi River from municipal and industrial wastewater.” U.S. GeologicalSurvey, Circular 1133, p. 114-135.
Leenheer, J.A., C.E. Rostad, L.B. Barber, R.A. Schroeder, R. Anders, andM.L. Davisson (2001). “Nature andchlorine reactivity of organic constituents from reclaimed water in groundwater, Los Angeles County,California.” Environmental Science and Technology, 35: 3,869-3,876.
Schaffner, C., and W. Giger (1984). “Determination of nitrilotriacetic acid in water by high-resolution gaschromatography.” Journal of Chromatography, 312: 413-421.
165

Hydrologist JASON VOGEL has been with the United States Geological Survey inLincoln, Nebraska, for a little over a year. During that time, he has been the Project Chieffor a bank-filtration study in cooperation with the United States Environmental ProtectionAgency and the City of LincolnWater System, and is also Lead Scientist of the agriculturalchemical transport team in the Nebraska District. Before joining the United StatesGeological Survey, Vogel was a research engineer in the Biosystems Engineering Departmentat Oklahoma State University for 5 years. He has published articles on a wide variety of
topics, including geostatistics and stochastic design, vadose zone transport, and microbial transport ingroundwater, and co-authored the chapter on Geostatistics in Statistical Methods in Hydrology, Second Edition,with C.T. Haan. Vogel received a B.S. in Biological Systems Engineering from the University of Nebraska,anM.S. in Agricultural Engineering from Texas A&MUniversity, and Ph.D. in Biosystems Engineering fromOklahoma State University.
166

Session 9: Public Policy and Regulatory
Riverbank Filtration as a Regional Supply Optionfor the United States
Leo Gentile, P.G., CPGJordan Jones & GouldingNorcross, Georgia
David Haas, P.E.Jordan Jones & GouldingNorcross, Georgia
D. Joseph Hagerty, Ph.D., P.E.University of Louisville, KentuckyLouisville, Kentucky
Peggy H. Duffy, P.E.Hagerty EngineeringJeffersonville, Indiana
Introduction
RBF has been used on the lower Rhine River for over 130 years and, today, comprises 15 to 20 percentof the water supply in Germany as a whole (Schubert, 2000). In the United States, the majorityof larger water systems (serving 10,000 or more) use surface water (Wang et al., 2002). Smallersystems supplying 10,000 or less often rely on groundwater for supply because of reduced treatmentrequirements. RBF is employed in communities in the United States such as Cedar Rapids, Iowa;Lincoln, Nebraska; Louisville, Kentucky; and Sonoma County, California. Some communitiessuch as St. Helens, Oregon, and Sioux Falls, South Dakota, essentially use RBF by drawing waterfrom collector wells constructed adjacent to rivers, although this is usually recognized as GWUDI(Wang et al., 2002). Still, RBF is an underutilized supply whose benefits are likely available tomore communities to help provide better and more uniform raw-water quality. RBF potential isgreatest for communities in the Midwestern United States that are located where glacial valley-fill aquifers occur that are interconnected to adjacent surface-water bodies.
Conditions
The need for water is the basic condition for RBF or any other supply source. The magnitude ofthe demand and physical conditions dictates what supply source is most feasible. If a communityis located along a major river or stream, then surface-water intake is a relatively simple solution;however, when water treatment issues and costs are considered, then groundwater — which mayrequire no more treatment than disinfection — is the next logical choice. RBF is an alternative
167
Correspondence should be addressed to:
Leo Gentile, P.G., CPGSenior Project HydrogeologistJordan, Jones & Goulding, Inc.6801 Governors Lake Parkway • Norcross, Georgia 30071 USAPhone: (678) 333-0148 • Fax: (770) 455-7391 • Email: [email protected]

supply option when these conditions are not available that provides typically larger quantitiesthan wells, and more uniform and higher quality raw water compared to surface-water intake.
Aquifer Thickness and Extent: To supply the millions of gallons a day needed for a typicalmunicipal water supply, the aquifer needs to be sufficiently thick and extensive to sustain such ayield without depleting the aquifer. If the aquifer is thin (less than about 100-ft thick), the coneof depression and amount of drawdown from wells penetrating the aquifer will be narrow andsteep, and the well will likely not be efficient in producing the required yields. Excessivedrawdown indicates an inefficient well and/or an over-drafted aquifer. Constructing collector wellswith multiple horizontal lateral collector galleries will help increase well efficiency and create abroader cone of depression with less drawdown. Still, if the aquifer is relatively thin and limitedin aerial extent, the sustained (or safe yield) may not be sufficient to meet demand. With RBF,conventionally constructed wells, collector wells, or specially designed tunnels overcome thephysical shortcomings of the aquifer. The leakance from an adjacent river or lake recharges theaquifer, augmenting the safe yield (Figure 1). Thus, a relatively thin and aerially limited aquifercan yield the water quantities needed for municipal supplies. RBF also yields water of moreconsistent and better overall quality.
Aquifer Characteristics: Glacial and alluvial sand and gravel deposits are some of the mostproductive aquifers in the world (Todd, 1980). The hydraulic conductivities and amount of waterin storage are often high. The recharge potential from adjacent streams, rivers, or lakes is alsoconsidered highly favorable as natural or induced vertical gradients, coupled with good hydraulicconductivity, allows for leakance from the surface-water body to the aquifer. Pleistocene-age sandand gravel deposits have been used for well fields and RBF sites. By comparison, high hydraulicconductivity and yields can also occur in bedrock aquifers with fracture or karst porosity; however,storage capacity may be limited. Furthermore, groundwater flow through fractures or karst porosityis essentially conduit flow. Recharge from adjacent rivers or lakes would be minimally filtered,reducing the benefit from RBF.
Other Considerations: There must be effective interconnection between the aquifer and surface-waterbody. Occasionally, an aquifer is confined or semi-confined by a layer of finer sediments thatreduces the potential for leakance from the surface to the aquifer (Figure 2). RBF sites are moreefficient where there is good interconnection (over 90 percent of withdrawn water can be bankfiltrate [Eckert et al., 2000]). Clogging of the interconnection through RBF use, or the naturalaccumulation of fines, also reduces the efficacy of RBF. The removal of streambed fines by waterflow from naturally high-gradient streams and rivers or during floods will help restore infiltration.
168
Figure 1. Groundwater flow recharge to a river (A) and an RBF well (B) in a sand and gravel aquifer (fromLloyd and Lyke, 1995).
Modified from Gallaher and Prize, 1966
Water TablePumping WellRiver or
Recharge PondRiver or
Recharge Pond Water Table
NOT TO SCALENOT TO SCALE
EXPLANATION
A B

German researchers experimented with excavating a “window” by dredging accumulatedsediment. While the measure increased RBF efficiency, it was considered temporary, lasting onlyweeks before silting over (Schubert, 2000). Rivers whose flow has been altered for flood controland navigation improvement, such as the Ohio River, are particularly prone to clogging. Steepgradients and floodwaters that may have scoured the riverbed in the past have been eliminated.
Wells or specially designed tunnels used to extract groundwater and bank filtrate must also beproperly located to maximize system efficiency. Rivers and streams that occur with the thumbprintof the most recent continental glacial period in the United States (e.g., Wisconsin ice age) havea similar terraced profile. The unaltered modern river channel carries normal stage flows withinthe primary terrace. This terrace corresponds to a 100-year flood plain. Where significantly alteredfor flood control or navigation, the river may now have inundated the primary terrace extendingfrom bank to bank up to the secondary terrace. The secondary terrace extends outward to the500-year flood plain. This channel was cut into the bedrock by glacially fed rivers. The rivers werelarge braided streams laden with sand and gravel. As the glacial outwash diminished, the scourchannels filled with sand and gravel to become aquifers. The tertiary terrace is the remnant ofpeak stage flooding and its resultant scouring into the bedrock. Relatively thin and finer grainedsediments were deposited as the flood stage fell (see Figure 2). These sediments may have formedlocal, relatively less-productive aquifers that are not connected to the modern river channel. Thesecondary terrace is the most productive place to locate RBF wells (e.g., out of main navigation,interconnected to the river, relatively thicker aquifer, greater potential for effective filtration).
Potential RBF Regions
The greatest potential for RBF — and, in fact, where RBF has been implemented — in the UnitedStates is in the Midwestern states. Figure 3 shows the location of mid- to large-sized communitiesin the United States that are located along rivers and on alluvial aquifers. Due to site conditions,RBF is a viable water supply option for many, but not all, communities.
Midwest stream-valley aquifers in Midwestern states west of the Mississippi River are importantsources of water for communities and industries (Figure 4). These aquifers are unconsolidated sandand gravel deposits that are thicker, greater in extent, and more productive in the major rivervalleys of the region. The stream-valley aquifers are unconfined and in direct connection to adjacentstreams and rivers. Average yields from wells range from 100 to 1,000 gallons per minute, with somewells yielding over 3,000 gallons per minute (Olcott, 1992). RBF opportunities may be available
169
Figure 2. Glacial valley-fill aquifer overlain by fine grained sediments in the Great Miami River Valley, Ohio(from Miller and Appel, 1997).
Modified from Gann and others, 1973DATUM IS SEA LEVEL0 1 2 MILES
0 1 2 KILOMETERS
Grand
River
BuriedValley
BBFEET
1,000
900
800
700
600VERTICAL SCALE GREATLY EXAGGERATED
EXPLANATION
Clay, silt, and fine-grained sand
Coarse-grained sand and gravel
Sand, gravel, and boulders
Till
Bedrock

using stream-valley aquifers that are located along major rivers such as the Arkansas, Des Moines,Grand (Michigan), Mississippi, Platte, Missouri, and Wisconsin rivers, plus numerous medium-sized streams that course the region (Miller and Appel, 1997).
170
West
Precipitation
Recharge
EXPLANATION
Discharge
Evapotranspiration
EvaporationCanal Diversion System
Crop Consumptive Use
Irrigation Well
Arkansas River
Deep Percolation of Precipitation and
Applied Irrigation Water
PumpageAquifer
Water Table
Dune Sand
NOT TO SCALE
Modified from Barker and Others, 1983
Bedrock
Stream to Aquifer Leakage
South
East
North
Figure 4. Midwestern stream valley site favorable for RBF (Arkansas River Valley) (from Miller and Appel,1997).
Figure 3. Potential RBF areas in the United States (from USGS, 1965).
Legend
N
Metropolitan Areas with Bank Infiltration Potential
Population 250,000–1,000,000
Population 1,000,001–2,500,000
Population greater than 2,500,000
Unconsolidated Aquifers Alluvial aquifers suitable for bank infiltration
Sand and gravel
Consolidated Rock Aquifers Sandstone: includes some unconsolidated sand Carbonate rock: limestone and dolomite; and in Texas and Oklahoma, some gypsum Sandstone and carbonate rocks Volcanic rocks, chiefly basalt Crystalline rocks, igneous and metamorphic Withdrawals from wells

The surficial aquifers in Midwestern states that border the Ohio River and are east of theMississippi River are similar to those described previously, but are primarily of glacial origin. Theseaquifers are very productive (1,000 gallons per minute) and supply almost 50 percent of the freshgroundwater produced in the region. The course-grained aquifers are divided into two categories:
• Deposits at or near the land surface occurring in stream and river valleys.
• Deposits buried by a layer of fine-grained material that occur in former river valleys cutinto bedrock and filled with coarse-grained glacial outwash.
The sands and gravels range in thickness from less than 100 to over 600 ft in some buried bedrockvalleys. Large yields are possible from wells completed in the glacial outwash aquifers that arehydraulically connected to streams, rivers, and lakes, and the wells are sufficiently close to the surface-water body (Lloyd and Lyke, 1995). Communities located near rivers such as the Illinois, Kaskaski,Wabash, White, Kankakee, Maumee, Great Miami, and Scioto rivers could benefit from RBF.
Valley-fill glacial aquifers also occur in the Northeastern United States. While extensive, theaquifer thickness and productivity is less than those occurring in Midwestern states (Olcott,1995). In general, the valley-fill aquifers are less common along major streams and rivers, so thepotential for RBF is considered lower than in the Midwestern United States. Alluvial aquifersoccur along streams and rivers in the Northwestern states, but sparse population and relatively lowwater demands can be met through either surface-water intakes or groundwater wells. In the aridSouthwest, few major rivers or streams are perennial, thereby limiting RBF potential. Watersupplies in Gulf Coast states are met through groundwater withdrawals from productive regionalaquifers and surface water. In the Piedmont region, water needs are met through surface water, asrainfall is usually adequate to meet demands and aquifers are fractured crystalline rock, which arenot considered viable RBF areas.
REFERENCES
Eckert, P., C. Blomer, J. Gothardt, S. Kamphausen, D. Liebich, and J. Schubert (2000). “Correlation betweenthe Well Field Catchment and Transient Flow Conditions.” Proceedings, International Riverbank FiltrationConference, November 2 - 4, Dusseldorf, Germany.
Lloyd, O.B., and W.L. Lyke (1995). “Ground Water Atlas of the United States, Segment 10 - Indiana,Illinois, Kentucky, Ohio.” U.S. Geological Survey Hydrologic Investigations Atlas 730 -K.
Miller, J.A., and C.L. Appel (1997). “Ground Water Atlas of the United States, Segment 3- Kansas,Missouri, Nebraska.” U.S. Geological Survey Hydrologic Investigations Atlas 730 -D.
Olcott, P.G. (1995). “Ground Water Atlas of the United States, Segment 12 - Connecticut, Maine,Massachusetts, New Hampshire, New York, Rhode Island, Vermont.” U.S. Geological Survey HydrologicInvestigations Atlas 730 -J.
Olcott, P.G. (1992). “Ground Water Atlas of the United States, Segment 12 - Iowa, Michigan, Minnesota,Wisconsin.” U.S. Geological Survey Hydrologic Investigations Atlas 730 -M.
Schubert, J. (2000). “How Does it Work: Field Studies on Riverbank Filtration.” Proceedings, InternationalRiverbank Filtration Conference, November 2 - 4, Dusseldorf, Germany.
Todd, D.K. (1980). Groundwater Hydrology, John Wiley & Sons, New York.
United States Geological Survey (1965). Productive Aquifers in the Conterminous United States, United StatesGeological Survey.
Wang, J.Z., S.A. Hubbs, and R. Song (2002). Evaluation of Riverbank Filtration as a Drinking Water TreatmentProcess, AmericanWater Works Association Research Foundation and AmericanWater Works Association.
171

LEO GENTILE is Senior Hydrogeologist and Group Manager with Jordan, Jones &Goulding in Atlanta, Georgia. He has a broad range of experience in applied geology andhydrogeology in the United States. His background includes over 20-years of experiencein technical support and management on a broad range of projects, including water-resources development, remedial investigations, and feasibility studies at ComprehensiveEnvironmental Resource Compensation and Liability Act sites; Resource Conservationand Recovery Act facility investigation and closure; investigation and remediation of
agricultural chemical sites; and assessments and reclamation for mining and petroleum-related sites. Gentilereceived a B.S. in Geology/Mineralogy from Ohio State University, an M.S. in Petroleum Geology fromOklahoma State University, and an MBA in Enterprise Risk Management/Finance from Georgia StateUniversity. He is a Registered Professional Geologist in seven states and Puerto Rico, and is a CertifiedProfessional Geologist by the American Institute of Professional Geologists.
172

Session 9: Public Policy and Regulatory
Application of the Long Term 2 Enhanced SurfaceWater Treatment Rule Microbial Toolbox at ExistingWater Plants
Richard A. BrownEnvironmental Engineering and Technology, Inc.Newport News, Virginia
All surface-water utilities in the United States will be required to comply with specific Cryptosporidiumremoval/inactivation targets in the LT2ESWTR, depending upon their bin classification as aresult of raw-water Cryptosporidium occurrence levels. The “microbial toolbox” is intended toprovide utilities with a range of treatment options for meeting LT2ESWTR compliancerequirements.
This presentation will include a general discussion of LT2ESWTR requirements, including two ofits main components:
• Cryptosporidium sampling.
• Treatment credits from the microbial toolbox.
In particular, this will include a discussion of how these requirements relate to systems with RBFor other groundwater wells that are GWUDI. LT2ESWTR requirements for RBF are different forsystems in place at the time the Rule is published versus well systems installed later. New systemsare eligible for treatment credits if they meet USEPA-defined requirements for media gradation,separation distance from the associated surface-water source, and turbidity monitoring. ExistingRBF and GWUDI wells are not eligible for any direct credits, but will produce indirect credits ifCryptosporidium bin assignment samples are collected from well effluent. According to theLT2ESWTR, these Cryptosporidium samples must be collected from well effluent if well water issent to a subsequent treatment process before being delivered to consumers. Public water-supplyGWUDI or RBF wells that provide water directly to customers without subsequent physicaltreatment must collect Cryptosporidium bin assignment samples from the surface-water source.Additional benefits of RBF (removal or degradation of other contaminants and microorganisms,dampening of water quality and temperature spikes, etc.), as well as potential issues of concern(clogging of pores, scour associated with flooding/high stage events), will also be outlined.
Other microbial toolbox alternatives will be outlined, though in less detail, and cost comparisonsfor different treatment strategies will also be discussed. Strategies for source-water sampling andthe preparation of contingency plans will also be addressed.
173
Correspondence should be addressed to:
Richard A. BrownEngineerEnvironmental Engineering and Technology712 Gum Rock Court • Newport News, Virginia 23606 USAPhone: (757) 873-1534 • Fax: (757) 873-2392 • Email: [email protected]

RICHARD BROWN, an Environmental Engineer at Environmental Engineering andTechnology, Inc. in Newport News, Virginia, has almost 20 years of experience workingon surface-water and groundwater quality, regulatory compliance, and water-treatmentprojects. Recently, this has included extensive involvement with the American WaterWorks Association, Association of Metropolitan Water Agencies, and various UnitedStates drinking-water utilities during negotiations with the United States EnvironmentalProtection Agency regarding the Stage 2 Disinfection By-Products Rule and Long Term 2
Enhanced Surface Water Treatment Plant. Prior, Brown worked for 11 years at the Los Angeles CountySanitation Districts, performing and directing numerous projects involving the investigation andinterpretation of groundwater chemistry at six municipal solid waste landfills. The American Water WorksAssociation Research Foundation study that is the subject of Brown’s presentation during the SecondInternational Riverbank Filtration Conference will be published in the American Water Works Association’se-Journal in September 2003. Brown received a B.S. in Civil Engineering from Purdue University and anM.S. in Environmental Engineering from the University of North Carolina at Chapel Hill.
174
Session 9: Public Policy and Regulatory
Draft Protocol for the Demonstration ofEffective Riverbank Filtration
William D. GollnitzGreater Cincinnati Water WorksCincinnati, Ohio
Verna J. Arnette, P.E.Greater Cincinnati Water WorksCincinnati, Ohio
Bruce L. WhitteberryGreater Cincinnati Water WorksCincinnati, Ohio
Introduction
RBF is a natural in situ filtration process by which microbial pathogens in surface water areremoved via the porous media of the streambed and aquifer under induced infiltration conditionscreated by a pumping well. With the promulgation of the LT2ESWTR, the USEPA will allow0.5- and 1.0-log treatment credit for Cryptosporidium removal using RBF (USEPA, 2003).Based upon a review of data from several RBF systems in the United States, it is not uncommonfor RBF to achieve a removal performance better than the proposed 1.0-log reduction credit. The0.5- and 1.0-log credits are based on general conservative requirements obtainable by most RBFsystems; however, there are still several concerns with the effectiveness of RBF during worst-casehydrologic and water-quality conditions. For example, high flow events may significantly scour astreambed, thus reducing its filtration capabilities. To date, there has been a reluctance to provideadditional credit because an acceptable procedure has not been developed that will allow for thedemonstration of consistent removal during these periods of high risk.
The Greater Cincinnati Water Works has developed the following draft protocol for demonstratingRBF pathogen removal. The draft protocol will:
• Allow utilities a method arguing for the re-designation of a groundwater from GWUDIback to “groundwater.”
• Allow for demonstration of 2.0-log Cryptosporidium removal in lieu of engineered filtrationunder the Interim Enhanced Surface Water Treatment Rule.
• Allow for greater than 1.0-log treatment credit under LT2ESWTR.
• Provide consistency for evaluating RBF sites.
The draft protocol is based upon a review of several regulatory guidance publications dealing withGWUDI evaluations and “alternative filtration technology”(USEPA, 1991; USEPA, 1992;
175
Correspondence should be addressed to:
William D. GollnitzSupervisor of Treatment, Water Quality & Treatment DivisionGreater Cincinnati Water Works5651 Kellogg Ave • Cincinnati, Ohio 45228 USAPhone: (513) 624-5657 • Fax: (513) 624-5670 • Email: [email protected]

Wilson et al., 1996; USEPA, 2001). In addition, the Greater Cincinnati Water Works hasreviewed data from an extensive flowpath study conducted in cooperation with the USGS at theGreater Cincinnati Water Works’ Charles M. Bolton Well Field (Sheets et al., 2002; Gollnitz etal., 2003), as well as published data from other RBF sites such as Louisville, Kentucky (Wang etal., 2002); Casper, Wyoming (Gollnitz et al., 1997); and others (Cote et al., 2002). The protocolis in response, in part, to requests for comments on additional RBF credit in the LT2ESWTR. Itis hoped that the protocol will provide initial guidance to the USEPA, primacy agencies, andwater utilities. The draft format of the protocol will facilitate comment and modification byregulatory and utility personnel.
The RBF process is very complex and is still not fully understood; however, our knowledge to datedoes pinpoint several controlling factors that are primary with respect to the removal of microbialpathogens and surrogates. These factors are identified in Cote et al. (2002) and include:
• Assessment of river and groundwater quality.
• Flow velocity through the streambed and aquifer.
• Dilution with regional groundwater.
The RBF protocol has, therefore, been designed around:
• Characterizing the aquifer and its capability as a RBF system.
• Identifying conditions for testing during periods of high flow velocity.
• Testing during periods of minimal dilution with regional groundwater.
The latter two items involve identifying periods of maximum induced filtration during high stageevents (as related to storm or reservoir release events) and maximum groundwater pumping. Theoretic-ally, these two factors would correspond with periods of high velocity and minimum dilution.
Pre-Demonstration Evaluation
The purpose of the pre-demonstration evaluation is to characterize the aquifer and collectiondevices with respect to hydrology and water quality. This includes a determination of the worst-caseconditions for minimal natural filtration of pathogenic protozoa. This evaluation will then identifythe type of demonstration project needed for determining treatment credit. The pre-demonstrationevaluation will organize and evaluate existing data and will identify what additional data is neededto complete this first phase. The pre-demonstration project will specifically look at the followingimportant aspects of the natural filtration process:
1. Surface-water and groundwater quality.
• Filtration capability.
• Contaminant and surrogate concentrations.
• Continuous monitoring of turbidity.
2. Potential infiltration rate variability.
3. Time of travel between surface-water and groundwater collection devices.
The first aspect of Item 1 is to characterize source-water quality with respect to its filtrationcapability. It is recommended that the utility perform analyses to determine the ionic strength ofboth surface water and groundwater. The ionic strength may provide an indication of the filtrationcapability of the sediments. Cote et al. (2002) and others have suggested that a high ionic strengthimproves the removal of particles; however, its role is not yet fully understood. It should be noted
176

that multiple samples should be evaluated. Ionic strength may vary between low (primarilygroundwater inflow) and high (primarily runoff) river flow conditions.
The second aspect of Item 1 is to determine the level of contaminant (Giardia, Cryptosporidium)and surrogate (algae, diatoms, spores, particle counts) concentrations and their seasonalvariability. If this data does not already exist, it is recommended that the utility perform monthlyGiardia / Cryptosporidium monitoring using Method 1623 (the same as required underLT2ESWTR), monthly Microscopic Particulate Analysis using the USEPA Consensus Method(1992), and weekly endospore analysis (Rice, 1996). Another optional surrogate parameter isparticle counts. Particle counts should be in the two size ranges for Giardia (7 to 10 micrometers)and Cryptosporidium (3 to 5 micrometers). Data collection for all parameters selected should berepresentative of one full hydrologic cycle (e.g., 1 year). The concentrations of pathogens,primarily Cryptosporidium, will determine the level of treatment needed. Because Giardia andCryptosporidium concentrations are typically low in surface waters, combined with detectionlimitations during sample analysis, they cannot be used to determine log-reduction credit. Logreductions should be based upon levels of algae, diatoms (from Microscopic Particulate Analysis),endospores, and particle counts; however, prior to performing the demonstration project,measurable concentrations need to be established. Particle counts may be used; however, theyshould be considered secondary due to the fact that they detect sediment or natural microbialgrowth (e.g., iron bacteria) in groundwater from wells. Typically, log reductions using particlecounts are lower as compared to algae and spores due to the measurement of other inert andmicrobial particles.
The third aspect of Item 1 is the continuous monitoring of turbidity. Turbidity monitoring is arequirement for engineered filtration systems, and has been included as a requirement on eachcollection device for RBF credit under LT2ESWTR for the period that the device is in use.Groundwater from RBF sites should be consistently low (0.01 to 1.0 ntu). Significant excursionsabove the normal level, especially after high infiltration periods, should be investigated. As withparticle counts, turbidity also measures inert geologic material and other non-pathogenic microbials.
As part of the pre-demonstration phase, it is important to estimate the range of potential unitinfiltration rates out in the active area of the streambed, articularly to estimate the highest valueunder conditions of high-river stage and high groundwater pumping during periods when riverwater is warm. Typically, infiltration rates at RBF sites are lower than slow sand filters, but shouldbe investigated to see if they are higher. Infiltration rates can be calculated using Darcy’s Law, withinput variables being river stage, groundwater elevations below the river stage, streambed permea-bility, streambed thickness, and surface-water temperature (affecting viscosity) (Gollnitz et al.,2002). River-stage data may be obtained from a local United States geological gaging station. Ifthis data is not available, the maximum stage elevation may be estimated from the depth of theriver channel. The groundwater elevation should be measured below the active infiltration areaof the streambed using piezometers in the streambed or monitoring wells on each side of the river.Streambed permeability can be estimated using pump test analysis (preferred, but costly), seepagemeters, temperature probes, and piezometers (each method has inherent problems and should beconsidered carefully before selection). Streambed thickness can be estimated by visuallyinspecting sediments from shallow excavations of the streambed during low flow. Temperature canbe measured directly in surface water. Surface-water temperature typically reflects the averagedaily ambient air temperature. If this data is not available, it may be necessary to collect it duringthe pre-demonstration period. Another important aspect is to look at the frequency of theoccurrence of high infiltration events. Frequency analysis requires long-term river stage data,which may be limited for most RBF sites.
177

Water-quality monitoring during the demonstration project should consider the travel timebetween the river and collection device. Travel time should be calculated for the shortest flowpath(e.g., fastest potential time of travel) during continuous pumping of the collection device. Time oftravel can be estimated using various techniques ranging from tracer studies (conductivity,temperature, and chloride), analytical flow calculations, and groundwater flow modeling. Eachmethod has inherited limitations that must be considered. It is recommended that the utilitydetermine a sampling window based upon a realistic range of travel times using two or more methods.Another important consideration is the travel time of particles. Larger particles such as algae mayhave longer travel times due to retardation in the aquifer. Sampling windows should be longenough to take these into consideration. For example, Table 1 lists various travel-time estimatesfor Production Well 1 at the Charles M. Bolton Well Field, including limitations. The fastesttheoretical time is 1 day; however, a more accurate estimate using conductivity indicates that thetravel time of groundwater ranges from 10 to 14 days (Sheets et al., 2002). Interestingly, algaeappear to arrive at the production well much later (approximately 38 days). In this case, a highinfiltration-event monitoring sampling window may be from 1 to 60 days after the event peak. Itis recommended that 10 to 15 samples be collected during this time period, with increasedsampling frequency around the anticipated period for possible breakthrough of microbial surrogates.
Demonstration Evaluation
The demonstration evaluation is broken down into three options: 1-year monitoring, multi-eventmonitoring, or seasonal monitoring. One of these options is selected based upon the results of thepre-demonstration evaluation. Log reduction for all three options should be based upon theaverage of Microscopic Particulate Analysis and endospore data.
The 1-year monitoring option is for systems with little or limited infiltration rate and water-quality data.It is recommended that utilities monitor river stage, groundwater elevations, and surface-watertemperature on a daily basis. Daily calculations can be made with Darcy’s law using conservativevalues of permeability (e.g., highest measured value) and thickness (lowest measured value).These calculations can be easily made using a computer spreadsheet (Gollnitz et al., 2002). Withrespect to water quality, it is recommended that utilities collect weekly samples of turbidity andendospores from surface water, along with monthly Giardia, Cryptosporidium, and MicroscopicParticulate Analysis. Each collection device being evaluated should be continuously monitored for
178
TOTMethodology (Days) Comments
Calculated Fixed Radius 1 Short TOT; considers only horizontal flowpath;no gradient
Groundwater Flow Model 8 Limitations with model design and scale
Conductivity 10 to 14 Real time measurement; range based upon multiplemeasurements; considered most accurate method
Event Temperature Lag 26 Real-time measurement; problems due tothermodynamics
Algae Event Peak 11 to 38 Limited data; considers flow characteristics of algae
Table 1. Time of Travel Estimates between the Great Miami River and Production Well 1at the Charles M. Bolton Well Field
TOT = Time of travel. CMB = Charles M. Bolton Well Field.
turbidity. Endospores, Giardia, Cryptosporidium, and Microscopic Particulate Analysis data shouldbe sampled at each collection device on a period and frequency determined from the time-of-traveldata. During the 1-year period, an attempt should be made to identify conditions for highinfiltration and to monitor one or more events, if possible.
The multi-event monitoring option is provided for systems with infiltration rates that aresignificantly high, as compared to engineered filtration systems, during storm events, upstreamreservoir releases, and during periods of heavy groundwater pumping. Water-quality monitoringshould include multiple turbidity, Giardia, Cryptosporidium, Microscopic Particulate Analysis, andendospore data collected from the river during and shortly after the river stage peak. As with alloptions, groundwater turbidity should be continuously monitored. Groundwater samples for theother parameters should be collected within a defined sampling window using the time-of-traveldata. Endospores and particle counts should be collected more frequently due to their lower cost.A major advantage to this option is that monitoring resources can be concentrated during theseperiods, which in turn may reduce overall costs. Infiltration rate parameters should be monitoredto determine the magnitude of the event.
Option three is seasonal monitoring. Pre-demonstration evaluations may identify if a system is atrisk during a 2- to 4-month period of the year. For example, a controlled river in the arid Westmay have a high stage only during the summer months, when water is released from reservoirs forirrigation. Water-quality monitoring should be concentrated during this high-risk period, takingtime of travel into consideration, as well as estimating the magnitude of infiltration.
REFERENCES
Cote, M.M., M.B. Emelko, and N.R.Thomson (2002). “Factors Influencing Prediction of CryptosporidiumRemoval in Riverbank Filtration Systems: Focus on Filtration.” Proceedings, American Water Works AssociationWQTC Conference, Denver, CO.
Gollnitz, W.D., J.L. Clancy, and S.C. Garner (1997). “Reduction of Microscopic Particulates by Aquifers.”Journal AWWA, 89(11).
Gollnitz, W.D., J.L. Clancy, B.L. Whitteberry, and J.A. Vogt (2003). “Riverbank Filtration as a MicrobialTreatment Process.” Journal AWWA (in press).
Gollnitz, W.D., B.L. Whitteberry, and J.A. Vogt (2002). “Induced Infiltration Rate Variability and WaterQuality.” Proceedings, SW-GW Interactions Conference, American Water Resource Association, Keystone, CO.
Rice, E.W., K.R. Fox, R.J. Miltner, D.A. Lytle, and C.H. Johnson (1996). “Evaluating Plant Performancewith Endospores.” Journal AWWA, Denver, CO.
Sheets, R.A., R.A. Darner, and B.L. Whitteberry (2002). “Lag Times of Bank Filtration at a Well Field,Cincinnati, Ohio, USA.” Journal of Hydrology, 233: 162-174.
USEPA (1991). Guidance Manual for Compliance with the Filtration and Disinfection Requirements for PublicWater Systems using Surface Water Sources, American Water Works Association, Denver, CO.
USEPA (1992). Consensus Method for Determining Groundwaters under the Direct Influence of Surface Waterusing Microscopic Particulate Analysis (MPA), Port Orchard, WA.
USEPA (2001). Draft, Considerations for Evaluating the Effectiveness of Alternative Filtration at Central WyomingRegional Water System (CWRWS), Region 8, Denver, CO (unpublished letter to CWRWS).
USEPA (2003). National Primary Drinking Water Regulations: Long Term 2 Enhanced Surface Water TreatmentRule, 40 CFR 141 and 142, Washington, D.C.
Wang, J.Z., S.A. Hubbs, and R. Song (2002). Evaluation of Riverbank Filtration as a Drinking Water TreatmentProcess, Tailored Collaboration with Louisville Water Co., American Water Works Association ResearchFoundation, Denver, CO.
Wilson, M.P., W.D. Gollnitz, S.N. Boutros, and W.T. Boria (1996). Determining Ground Water under the DirectInfluence of Surface Water, American Water Works Association Research Foundation Project 605, Denver, CO.
179

BILL GOLLNITZ is a Supervisor of Treatment for the Greater Cincinnati Water Works,where he is responsible for water quality and treatment for both the Charles M. Bolton andMason Ground Water Facilities. Gollnitz has been in the water supply industry for over30 years, having previously managed surface-water and groundwater utilities in New Yorkand Rhode Island. He has also had extensive experience in water-supply protection andsurface-water/groundwater interactions. In addition, he was a Project Manager and co-authoron the American Water Works Association Research Foundation’s project “Determining
Ground Water under the Direct Influence of Surface Water.” Gollnitz has completed groundwater under thedirect influence of surface water evaluations in Connecticut, New York, Ohio, Rhode Island, and Wyoming,and he has been published in the Journal American Water Works Association and elsewhere. In 1992, he washonored with an American Water Works Association Best Paper Award. Gollnitz received a B.S. in Biologyfrom Mount Union College in Alliance, Ohio, and a M.S. in Environmental Science-Water Resources fromthe State University of New York, College of Environmental Science and Forestry in Syracuse, New York.
180
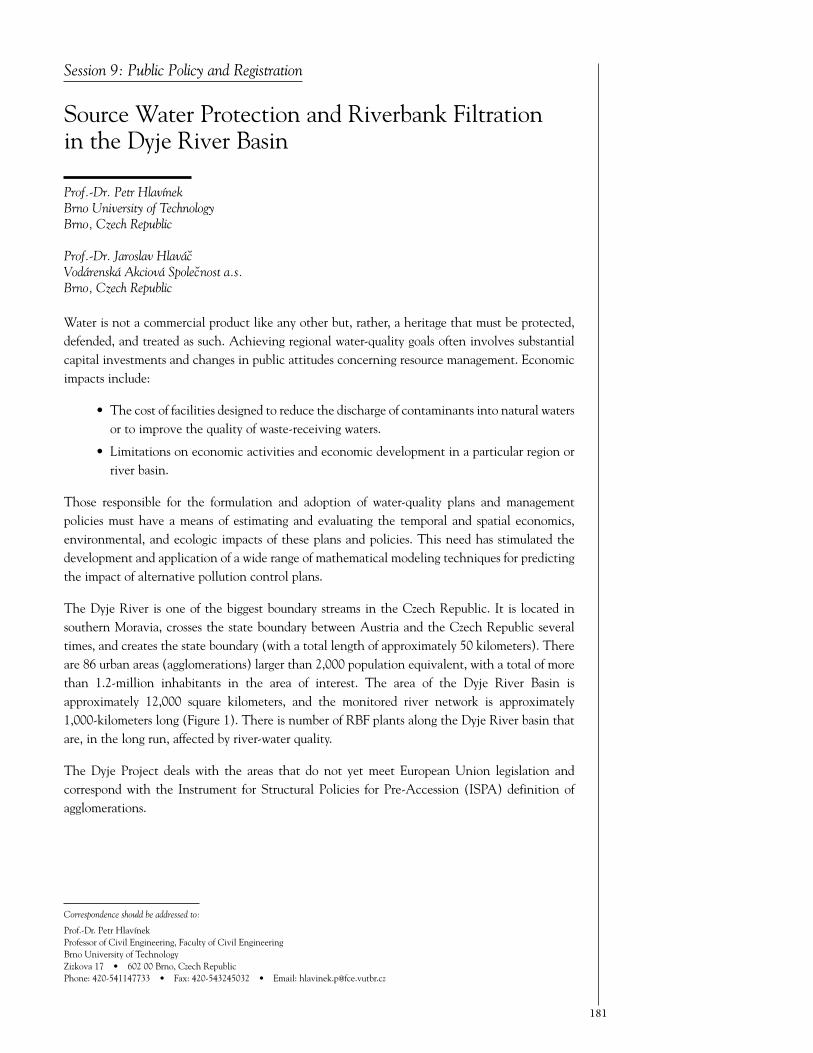
Session 9: Public Policy and Registration
Source Water Protection and Riverbank Filtrationin the Dyje River Basin
Prof.-Dr. Petr HlavínekBrno University of TechnologyBrno, Czech Republic
Prof.-Dr. Jaroslav Hlavác̆Vodárenská Akciová Spolec̆nost a.s.Brno, Czech Republic
Water is not a commercial product like any other but, rather, a heritage that must be protected,defended, and treated as such. Achieving regional water-quality goals often involves substantialcapital investments and changes in public attitudes concerning resource management. Economicimpacts include:
• The cost of facilities designed to reduce the discharge of contaminants into natural watersor to improve the quality of waste-receiving waters.
• Limitations on economic activities and economic development in a particular region orriver basin.
Those responsible for the formulation and adoption of water-quality plans and managementpolicies must have a means of estimating and evaluating the temporal and spatial economics,environmental, and ecologic impacts of these plans and policies. This need has stimulated thedevelopment and application of a wide range of mathematical modeling techniques for predictingthe impact of alternative pollution control plans.
The Dyje River is one of the biggest boundary streams in the Czech Republic. It is located insouthern Moravia, crosses the state boundary between Austria and the Czech Republic severaltimes, and creates the state boundary (with a total length of approximately 50 kilometers). Thereare 86 urban areas (agglomerations) larger than 2,000 population equivalent, with a total of morethan 1.2-million inhabitants in the area of interest. The area of the Dyje River Basin isapproximately 12,000 square kilometers, and the monitored river network is approximately1,000-kilometers long (Figure 1). There is number of RBF plants along the Dyje River basin thatare, in the long run, affected by river-water quality.
The Dyje Project deals with the areas that do not yet meet European Union legislation andcorrespond with the Instrument for Structural Policies for Pre-Accession (ISPA) definition ofagglomerations.
181
Correspondence should be addressed to:
Prof.-Dr. Petr HlavínekProfessor of Civil Engineering, Faculty of Civil EngineeringBrno University of TechnologyZizkova 17 • 602 00 Brno, Czech RepublicPhone: 420-541147733 • Fax: 420-543245032 • Email: [email protected]

The goal of the project is to ensure that:
• The quality and volume of water collected from polluters and treated in wastewatertreatment plants complies by the year 2005 and is within the area managed by Unionwater supply and sewer systems with the values set down by Directive No. 91/271/EEC.
• All wastewater discharged to the sewer is collected.
• Within any drained area serviced by a wastewater treatment plant, all wastewater iscarried to that wastewater treatment plant and treated in compliance with the values setdown by Directive No. 91/271/EEC.
• National parks and landscape-protected areas within the region are protected in terms ofsurface-water and groundwater quality.
A group of related projects covers the following priority measures, as classified below:
Category A.1: Reconstruct and upgrade existing wastewater treatment plants in municipalitieswith populations over 2,000 (or equivalent).
Category A.2: Refurbish existing large wastewater treatment plants (for populations over 10,000[or equivalent]), including equipment for the removal of nitrogen compounds and phosphorus.
Category A.3: Reconstruct existing sewer systems connected to existing wastewater treatmentplants to provide sufficient capacity and a high level of treatment.
Category A.4: Complete sewer systems and connect them to existing wastewater treatment plantsto provide sufficient capacity and a high level of treatment.
Category A.5: Construct wastewater treatment plants in municipalities with populations over2,000 (or equivalent).
Category A.6: Complete sewer systems and wastewater treatment plants in municipalities withpopulations over 2,000 (or equivalent).
182
Figure 1. Location of the Dyje River Basin in the Cezch Republic. A= Austria. SK = Slovakia.PL = Polland. D = Germany.

For the first phase of the Dyje Project, 10 agglomerations were chosen based on area investigationsand comparisons with European Union standards. A technical solution was designed for thoselocations. Wastewater treatment and collection needs were identified and their standardscompared with European Union standards. See Figure 2 and Table 1.
183
1. Dyje – Moravská Dyje2. Jihlava – lower part3. Jihlava – upper part4. Oslava5. Bobrava6. Svratka – lower part7. Svratka – upper part8. Litava
Figure 2. Sub-catchments 1 through 8 of the Dyje River.
Table 1. Basic Data of the Dyje River Catchment Area
Increase in Connected Inhabitants PE 203,606
Increase in Removed Pollution PE 154,905
Total Capacity of New and Upgraded WWTP PE 350,133
Increase in Removed Pollution – SS ton/year 3,110
Increase in Removed Pollution – BOD5 ton/year 3,392
Increase in Removed Pollution – COD ton/year 6,785
Increase in Removed Pollution – N-NH4 ton/year 622
Increase in Removed Pollution – Total ton/year 141
Increase in Treated Wastewater m3/year 9,103,587
Wastewater Treated on WWTPs m3/year 20,975,687
Total Length of New and Upgraded WWTP kilometers 601
WWTP = Wastewater treatment plant. SS= Suspended solid. BOD5 = Biochemical oxygen demand.COD = Chemical oxygen demand. N-NH4 = Ammonia nitrogen. PE = Population equivalent.

As a result of improvements in pollution source-management at the Dyje River Basin, mathe-matical modeling techniques were used to assess stream-water quality. The study aimed to evaluatethe effect of improvements on stream-water quality at main streams in the Dyje River basin, withspecial respect to the Dyje River transboundary profile (downstream of the City of Br̆eclav). Theresults were used as bases in the decision-making process. By doing this, financial sources can bedistributed more efficiently in the basin and the application of remediation measures would betterimprove water quality while considering the whole spectrum of requirements connected to theprocess of approaching the European Union.
There are a number of RBF plants along the Dyje River Basin. After decades of safe operation,some came under heavy pressure due to increasing river-water pollution. As an example, the RBFplant at Vojkovice is discussed. See Figures 3 and 4.
In 1967, 170,000 tons of biochemical oxygen demand (BOD5) per year were discharged into riversin the Czech Republic. From 1957 to 1970, 800 new wastewater treatment plants were built, and theload decreased to 142,000 tons of BOD5 in 1975. Between 1970 and 1980, the construction ofwastewater treatment plants was stifled; therefore, the load increased to 198,000 tons of BOD5 in1980. In 1990, the load decreased to 148,000 tons of BOD5. Due to the massive construction ofwastewater treatment plants after 1990, the load decreased to 67,000 tons of BOD5 in 1995 andto 65,000 tons of BOD5 in 2000.
Gradual improvements in quality are expected after the construction and completion of theproject, “Protection of Water in the Dyje River Basin.” It is expected that a number of RBF plantswill be immediately affected (Ivancice, Moravské Bránice), while others will be gradually affected(Lomnicka, Omice, Vojkovice).
184
2.5
MaximumAverage
2.0
1.5
1.0
0.5
0
Conc
entra
tion
mg/
L
Date
1979
1981
1983
1985
1987
1989
1991
1993
1995
1997
1999
Figure 3. Maximum and average concentration of N-NH4 at the RBF plant at Vojkovice from 1979 to 2000.
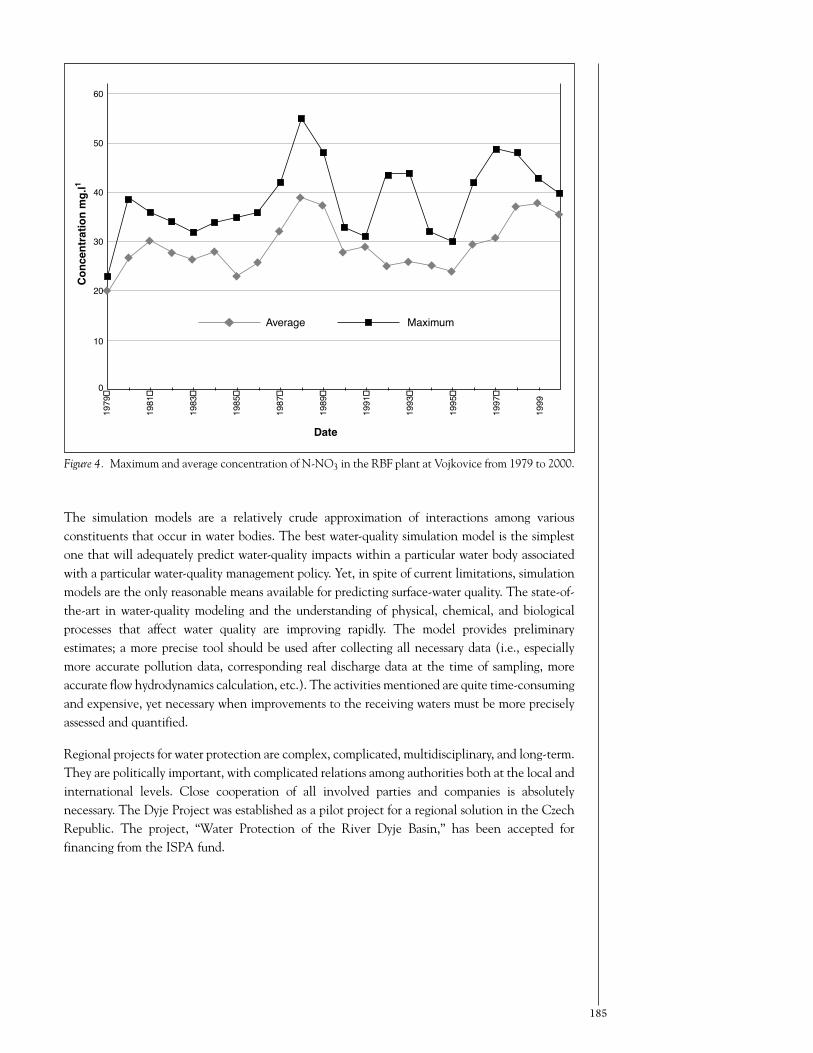
The simulation models are a relatively crude approximation of interactions among variousconstituents that occur in water bodies. The best water-quality simulation model is the simplestone that will adequately predict water-quality impacts within a particular water body associatedwith a particular water-quality management policy. Yet, in spite of current limitations, simulationmodels are the only reasonable means available for predicting surface-water quality. The state-of-the-art in water-quality modeling and the understanding of physical, chemical, and biologicalprocesses that affect water quality are improving rapidly. The model provides preliminaryestimates; a more precise tool should be used after collecting all necessary data (i.e., especiallymore accurate pollution data, corresponding real discharge data at the time of sampling, moreaccurate flow hydrodynamics calculation, etc.). The activities mentioned are quite time-consumingand expensive, yet necessary when improvements to the receiving waters must be more preciselyassessed and quantified.
Regional projects for water protection are complex, complicated, multidisciplinary, and long-term.They are politically important, with complicated relations among authorities both at the local andinternational levels. Close cooperation of all involved parties and companies is absolutelynecessary. The Dyje Project was established as a pilot project for a regional solution in the CzechRepublic. The project, “Water Protection of the River Dyje Basin,” has been accepted forfinancing from the ISPA fund.
185
60
MaximumAverage
50
40
30
20
10
0
Conc
entra
tion
mg.
l1
Date
1979
1981
1983
1985
1987
1989
1991
1993
1995
1997
1999
Figure 4. Maximum and average concentration of N-NO3 in the RBF plant at Vojkovice from 1979 to 2000.

PETR HLAVÍNEK has 20 years experience in wastewater treatment and water quality. Hehas 10 years of experience as a lead designer in the design company, HYDROPROJECT.At present, he is Professor of Civil Engineering at Brno University of Technology, Facultyof Civil Engineering. He also acts as Vice-President of the Czech Wastewater TreatmentExperts Association, as well as Deputy Head of the Institute of Urban Water Managementand as Member of the governing board of the Faculty of Civil Engineering at BrnoUniversity of Technology. Hlavínek has completed more than 200 research reports, expert
opinions, and reports dealing with water quality and wastewater treatment. He has published more than 120articles dealing with wastewater treatment and water quality, and is author and co-author of six books,including Industrial Wastewater Treatment, Upgrading of Wastewater Treatment Plants, Hydraulics of WWTP,Wastewater Treatment-Examples of Calculation, Drainage of Urban Areas — Conceptual Approach and WaterStructures, and Water Structures. Hlavínek received an M.S. at Brno University of Technology, a Dipl. inSanitary Engineering at IHE Delft Netherlands, and a Ph.D. at Brno University of Technology.
186

Session 11: Case Studies “Lessons Learned”
Greater Cincinnati Water Works Flowpath StudyField Design: Methodology and Evaluation
Bruce Whitteberry, P.G.Greater Cincinnati Water WorksCincinnati, Ohio
William D. GollnitzGreater Cincinnati Water WorksCincinnati, Ohio
Jeffrey VogtGreater Cincinnati Water WorksCincinnati, Ohio
Objective
The Greater Cincinnati Water Works, USGS, and Miami University of Oxford, Ohio, enteredinto a joint research study to evaluate the effectiveness of RBF on an unconsolidated sand andgravel aquifer at the Greater Cincinnati Water Works’ Charles M. Bolton Well Field. One of thegoals of this study was to better understand the aquifer’s effectiveness at reducing biologicaldrinking-water contaminants. The purpose of this presentation is to describe and evaluate thestudy’s field design to determine its effectiveness for achieving study goals. This presentation willalso discuss water-quality anomalies in the observed data and how they relate to field design.
Methodology
The Charles M. Bolton Well Field is located within the Great Miami Buried Valley Aquifer, which iscomposed of sand and gravel. The well field consists of 10 production wells located 50 to 600 ftfrom the Great Miami River. The well field is situated along the southern edge of the GreatMiamiBuried ValleyAquifer and is bounded by the bedrock valley wall to the south and the Great MiamiRiver to the north. Due to this configuration, the well field is dependent upon the river as a majorsource of induced recharge or infiltration.
Two study sites were chosen within the well field. The sites are adjacent to Production Well 1(referred to as Site 1) and to Production Well 8 (referred to as Site 8). At each site, four verticalmonitoring wells with 2-ft long well screens were installed along a theoretical flowpath betweenthe river and production well. Each well was installed progressively deeper, moving away from theriver and toward the well. The two deepest wells were installed to correspond to the top andbottom of the production well screen. In addition, an inclined well was installed at each site. Theinclined wells were installed at 20- to 30-degree angles from the horizontal and drilled beneath
187
Correspondence should be addressed to:
Bruce Whitteberry, P.G.HydrogeologistGreater Cincinnati Water Works5651 Kellogg Ave • Cincinnati, Ohio 45228 USAPhone: (513) 624-5611 • Fax: (513) 624-5670 • Email: [email protected]

the river. This allowed water-sample collection from approximately 5- to 10-ft beneath the GreatMiami River.
Each of the vertical flowpath wells was constructed using 4-inch diameter polyvinyl chloride wellswith 2 ft of 10-slot (0.010-inch) screen. The lengths of the screens were designed to provide theshortest interval necessary to accommodate a sample pump and downhole data.
Once the wells were installed and developed (to clean the well of construction-induced silt), adata sonde was installed in each well. The data sonde was used to record temperature, conduc-tivity, pH, dissolved oxygen, and water levels. Each well was fitted with a bladder pump to collectwater samples. By using dedicated equipment for sampling, the possibility of introducing contami-nation into the well was minimized, sampling was more consistent and efficient, and eliminatingequipment blank samples from the quality control program reduced analytical costs. The inclinedwells were constructed similarly to vertical wells, but with a 6-inch diameter polyvinyl chloridewell casing and 5 ft of 10-slot (0.010-inch) well screen. A submersible sampling pump and datasonde were installed in each inclined well.
To monitor the river, USGS installed a stream gage station at Site 1. The gage continuouslymeasured and recorded river stage. It was also fitted with an automated sampling pump and datasonde to collect readings of the same parameters measured in the wells.
Prior to each sampling event, the monitoring wells were purged using low-flow (minimaldrawdown) purging methodology. Each well was pumped at a rate of less than 1 liter per minute(1 to 3 liters per minute for the inclined wells), while minimizing drawdown in the wells (usuallyless than 0.02 ft). Temperature, pH, specific conductance, and dissolved oxygen were measuredduring purging, and the well was sampled when the parameters stabilized according to USGSNational Water-Quality Assessment Program Sampling Protocol (Koterba et al., 1995). Withlow-flow techniques, sampling-induced turbidity problems can sometimes be minimized. Becausethe goal of this study was to sample discrete portions of the aquifer in close proximity, thistechnique was also desirable to minimize the mixing from portions of the aquifer above or belowthe screened area.
Anomalous Data
Because the purpose of this study was to evaluate the effectiveness of the aquifer in acting as afiltration system, significant anomalies in the data were of concern because of their potential torepresent a preferred flowpath through which water is not effectively filtered. One anomalyobserved was the concentrations of TOC inWell FP8B. Because this well is of intermediate depth,the TOC concentration was expected to be between the concentrations of shallower (FP8A) anddeeper (FP8C) wells. This is the trend seen at Site 1; however, during the first 2 months of thestudy, FP8B had TOC concentrations several times higher than the river (Figure 1). Throughoutthe first 2 months of monitoring, TOC dropped steadily and stabilized, with concentrationsbetween those of Wells FP8A and FP8C.
Another anomaly identified in the study was high particle counts in Wells FP8B and FP8D. WellFP8B particle counts were lower than the river, but higher than FP8A (a shallower well closer tothe river). Particle counts in Well FP8D, the deepest monitoring well, were higher or very nearthe levels of particles in the river (Figure 2).
188
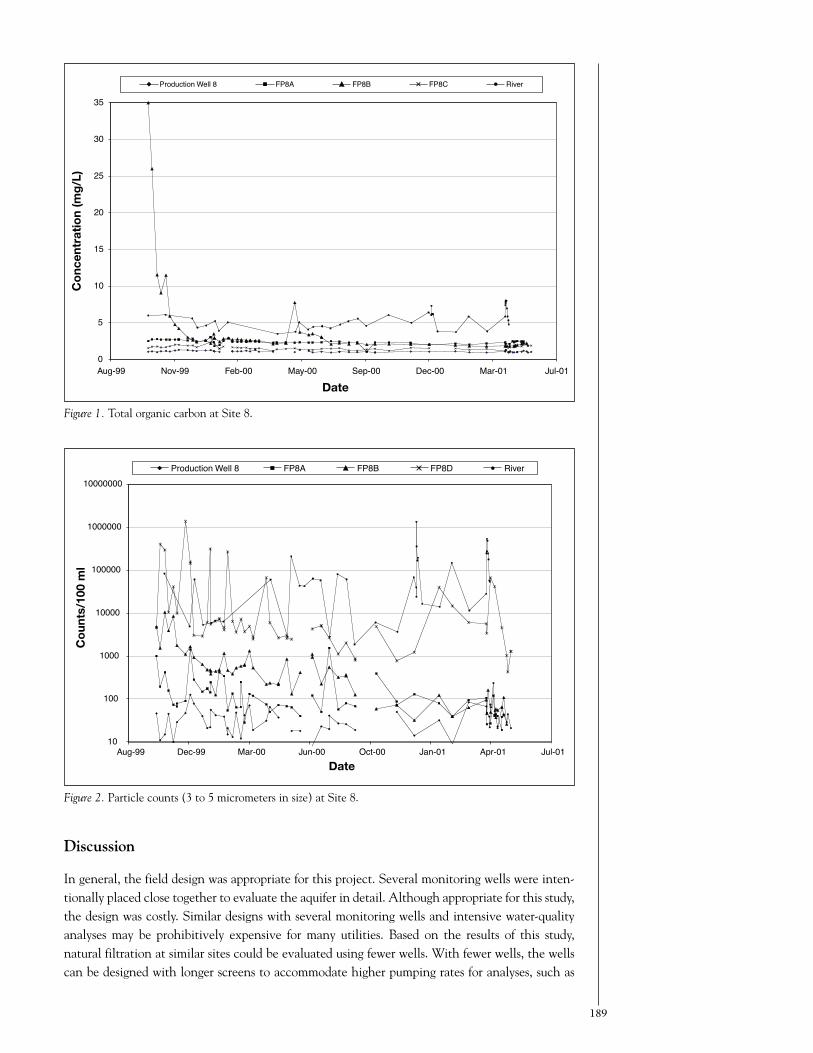
Discussion
In general, the field design was appropriate for this project. Several monitoring wells were inten-tionally placed close together to evaluate the aquifer in detail. Although appropriate for this study,the design was costly. Similar designs with several monitoring wells and intensive water-qualityanalyses may be prohibitively expensive for many utilities. Based on the results of this study,natural filtration at similar sites could be evaluated using fewer wells. With fewer wells, the wellscan be designed with longer screens to accommodate higher pumping rates for analyses, such as
189
0
5
10
15
20
25
30
35
Aug-99 Nov-99 Feb-00 May-00 Sep-00 Dec-00 Mar-01 Jul-01Date
Co
ncen
trat
ion
(mg
/L)
Production Well 8 FP8A FP8B FP8C River
Figure 1. Total organic carbon at Site 8.
10
100
1000
10000
100000
1000000
10000000
Aug-99 Dec-99 Mar-00 Jun-00 Oct-00 Jan-01 Apr-01 Jul-01Date
Co
unts
/100
ml
Production Well 8 FP8A FP8B FP8D River
Figure 2. Particle counts (3 to 5 micrometers in size) at Site 8.
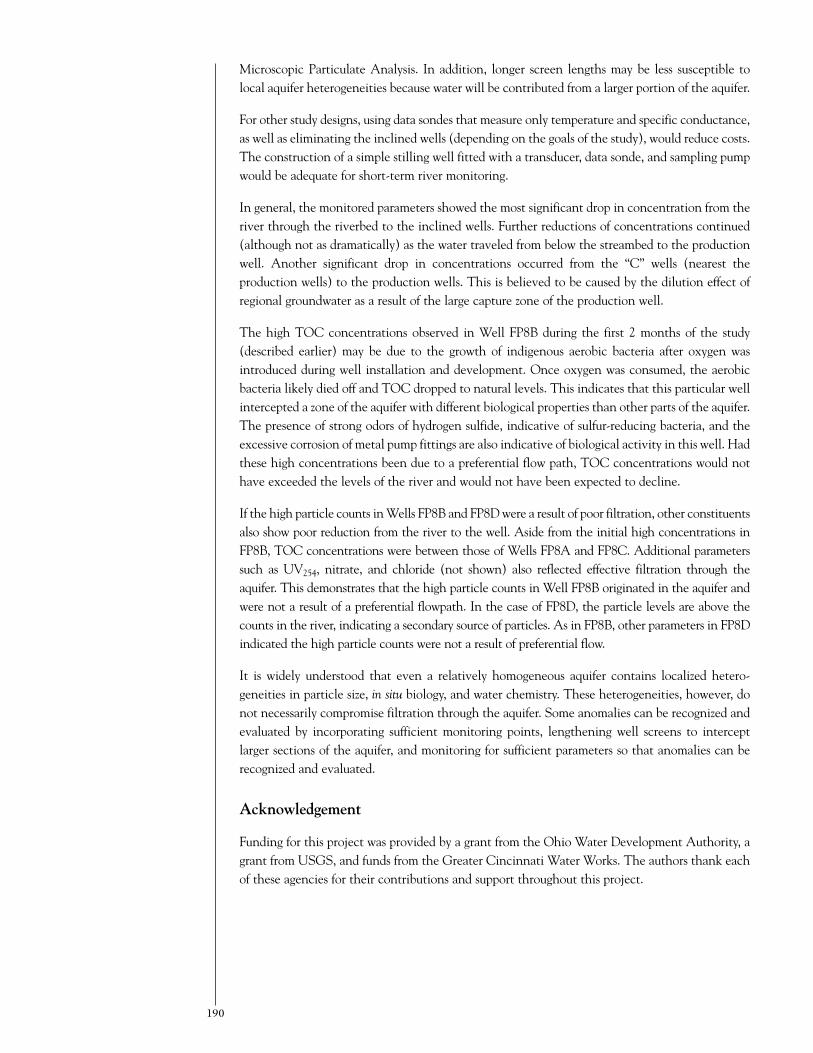
Microscopic Particulate Analysis. In addition, longer screen lengths may be less susceptible tolocal aquifer heterogeneities because water will be contributed from a larger portion of the aquifer.
For other study designs, using data sondes that measure only temperature and specific conductance,as well as eliminating the inclined wells (depending on the goals of the study), would reduce costs.The construction of a simple stilling well fitted with a transducer, data sonde, and sampling pumpwould be adequate for short-term river monitoring.
In general, the monitored parameters showed the most significant drop in concentration from theriver through the riverbed to the inclined wells. Further reductions of concentrations continued(although not as dramatically) as the water traveled from below the streambed to the productionwell. Another significant drop in concentrations occurred from the “C” wells (nearest theproduction wells) to the production wells. This is believed to be caused by the dilution effect ofregional groundwater as a result of the large capture zone of the production well.
The high TOC concentrations observed in Well FP8B during the first 2 months of the study(described earlier) may be due to the growth of indigenous aerobic bacteria after oxygen wasintroduced during well installation and development. Once oxygen was consumed, the aerobicbacteria likely died off and TOC dropped to natural levels. This indicates that this particular wellintercepted a zone of the aquifer with different biological properties than other parts of the aquifer.The presence of strong odors of hydrogen sulfide, indicative of sulfur-reducing bacteria, and theexcessive corrosion of metal pump fittings are also indicative of biological activity in this well. Hadthese high concentrations been due to a preferential flow path, TOC concentrations would nothave exceeded the levels of the river and would not have been expected to decline.
If the high particle counts inWells FP8B and FP8Dwere a result of poor filtration, other constituentsalso show poor reduction from the river to the well. Aside from the initial high concentrations inFP8B, TOC concentrations were between those of Wells FP8A and FP8C. Additional parameterssuch as UV254, nitrate, and chloride (not shown) also reflected effective filtration through theaquifer. This demonstrates that the high particle counts in Well FP8B originated in the aquifer andwere not a result of a preferential flowpath. In the case of FP8D, the particle levels are above thecounts in the river, indicating a secondary source of particles. As in FP8B, other parameters in FP8Dindicated the high particle counts were not a result of preferential flow.
It is widely understood that even a relatively homogeneous aquifer contains localized hetero-geneities in particle size, in situ biology, and water chemistry. These heterogeneities, however, donot necessarily compromise filtration through the aquifer. Some anomalies can be recognized andevaluated by incorporating sufficient monitoring points, lengthening well screens to interceptlarger sections of the aquifer, and monitoring for sufficient parameters so that anomalies can berecognized and evaluated.
Acknowledgement
Funding for this project was provided by a grant from the Ohio Water Development Authority, agrant from USGS, and funds from the Greater Cincinnati Water Works. The authors thank eachof these agencies for their contributions and support throughout this project.
190

REFERENCE
Koterba, M.T, F.D. Wilde, and W.W. Lapham (1995). Ground-water data-collection protocols and procedures forthe National Water-Quality Assessment Program: Collection and documentation of water-quality and samples andrelated data, U.S. Geological Survey Open File Report 95-399.
BRUCE WHITTEBERRY has been a Professional Hydrogeologist for Greater CincinnatiWater Works for the past 5 years. In addition to RBF research, Whitteberry oversees thewellhead protection programs for two well fields and addresses various groundwaterquantity and quality concerns for the Greater Cincinnati Water Works. He is one of theGreater Cincinnati Water Works’ representatives for the Hamilton to New BaltimoreGround Water Consortium, and he also oversees the Consortium’s regional groundwatermonitoring program, as well as serves in an advisory capacity on groundwater issues. Prior
to joining the Greater Cincinnati Water Works, he spent several years in the groundwater industry, both inconsulting and in a regulatory capacity. Whitteberry received a B.S. in Geology from Olivet NazareneUniversity and an M.S. in Hydrogeology from Wright State University.
191

192
Session 11: Case Studies “Lessons Learned”
The Hungarian Experience with Riverbank Filtration
Ferenc Laszlo, Ph.D.Institute for Water Pollution ControlWater Resources Research CentreBudapest, Hungary
The water-supply systems of Hungary provide drinking water for 9.5-million inhabitants(95 percent of the population) in 2,100 settlements of the country. About 88 percent of the totalvolume supplied originates from groundwater sources. About 30 percent of this (approximately800,000 m3/d) is abstracted from RBF water resources.
There is an additional 3-million m3/d free RBF capacity along the Hungarian section of theDanube River.
The largest RBF system in Hungary provides drinking water for 2-million inhabitants in Budapest.The present capacity is about 900,000 m3/d. Approximately 850 RBF wells are located on twoislands (Szentendre Island and Csepel Island) of the Danube River. Some parts of this RBF systemhave operated for more than 100 years (Laszlo and Homonnay, 1986). The hydraulic conductivityof the gravel terraces, the composition of the filtration layer, and the water quality of the riverenables the production of high-quality drinking water.
In recent years, considerable efforts were focused on investigating and developing methods ofpractical application for the reliable utilization and protection of bank-filtered water resources.The activities were mainly directed toward evaluating pollution impacts and exploring theprocesses and causes of water-quality changes in RBF systems.
Studies in an RBF pilot area on Szentendre Island included:
• An extended field investigation to provide adequate data for a comprehensivewater-quality evaluation and for modeling activities.
• Adsorption experiments in the laboratory.
• Application and development of numerical models to assess and predict water-qualitychanges in the RBF system that are induced by various potential changes in theconditions of the river and filtration media.
Numerical modeling was applied to:
• Calibrate hydraulic and transport parameters.
• Calculate the transport of various pollutants from the Danube River to the wells.
• Assess quality changes in the water of the production wells.
• Predict the consequences of accidental pollution in the Danube River.
193
Correspondence should be addressed to:
Ferenc Laszlo, Ph.D.Director, Institute for Water Pollution ControlWater Resources Research CentreH-1095 Budapest • Kvassay ut 1., HungaryPhone: +36 1 215 9045 • Fax: +36 1 216 8140 • Email: [email protected]

During the field investigation program, hydrogeological, hydraulic, hydrological, chemical,physico-chemical, biological, and microbiological data were collected and evaluated. The results ofthe water-quality studies revealed characteristic quality changes in the filter media: the chemicaloxygen demand concentration gradually decreased from the river towards abstraction sites,indicating the decomposition of organic pollutants. Hydro-biological studies indicated that theDanube River had considerable fecal coliform pollution, but that bacteria removal during RBF wasvery efficient. Coliphages used as indicators of virus pollution were also measured. The results ofthese tests verified that coliphages were not able to pass through filter media.
The retardation of specific organic micropollutants is very different depending on their biodegrada-bility, sorption affinity, etc. The mobile, persistent organic micropollutants (e.g., atrazine,simazine, trichloroethene, and benzene) have low removal efficiency (less than 30 percent); onthe other hand, some pesticides (e g., terbutrin, 2,4-D, and carbaryl) and petroleum hydrocarbonsare removed substantially. The retardation or remobilization of some heavy metals is influencedby redox conditions.
Adsorption experiments in the laboratory provided information on the partition coefficients ofvarious micropollutants between spiked Danube water and the material of filtration medium takenfrom RBF sites (Laszlo and Literathy, 2002). Two riverbed materials were used: one represented thesandy alluvium having low organic material; the other was taken from a sedimentation zone of theriverbed where river water infiltrates through sediment having high organic material content and fineparticle size. The partition coefficient varied widely for the different organic micropollutants andheavy metals, depending mainly on the character of the pollutants. The type of bed material was alsoimportant: the partition coefficients were higher in silty riverbed material than in the sandy matrixfor all pollutants.
Numerical transport modeling — based on measured hydraulic, hydrogeological, and physico-chemical parameters — concluded that relatively short-duration accidental pollution has limitedrisk for RBF schemes along the Danube River due to a wide range of travel times from the river toabstraction wells. Higher risk would be long-lasting, continuous pollution of the Danube.
Another concern is the impacts of river training and gravel dredging on the quality of riverbank-filtered water (Laszlo et al., 1990). Training structures (groynes, parallel dykes) and dredgingoperations affect the hydraulic conditions in the river that are conducive to silting in areas withreduced flow velocities. Adverse hydrochemical changes occur in the silted filter layer, especiallythe dissolution of iron and manganese, and higher concentrations of ammonium are observable.Bed degradation owing to dredging causes changes in the inflow ratio to the abstraction wells,increasing the proportion of polluted groundwater from the background areas in the wells.
Conclusions
RBF has been an effective method for drinking-water supply in Hungary for a long time.
The sustainability of RBF abstraction schemes depends on several factors, including the quality ofriver water, characteristics of the filtration media, retention time within the aquifer, and qualityof the groundwater adjacent to the extraction site.
194
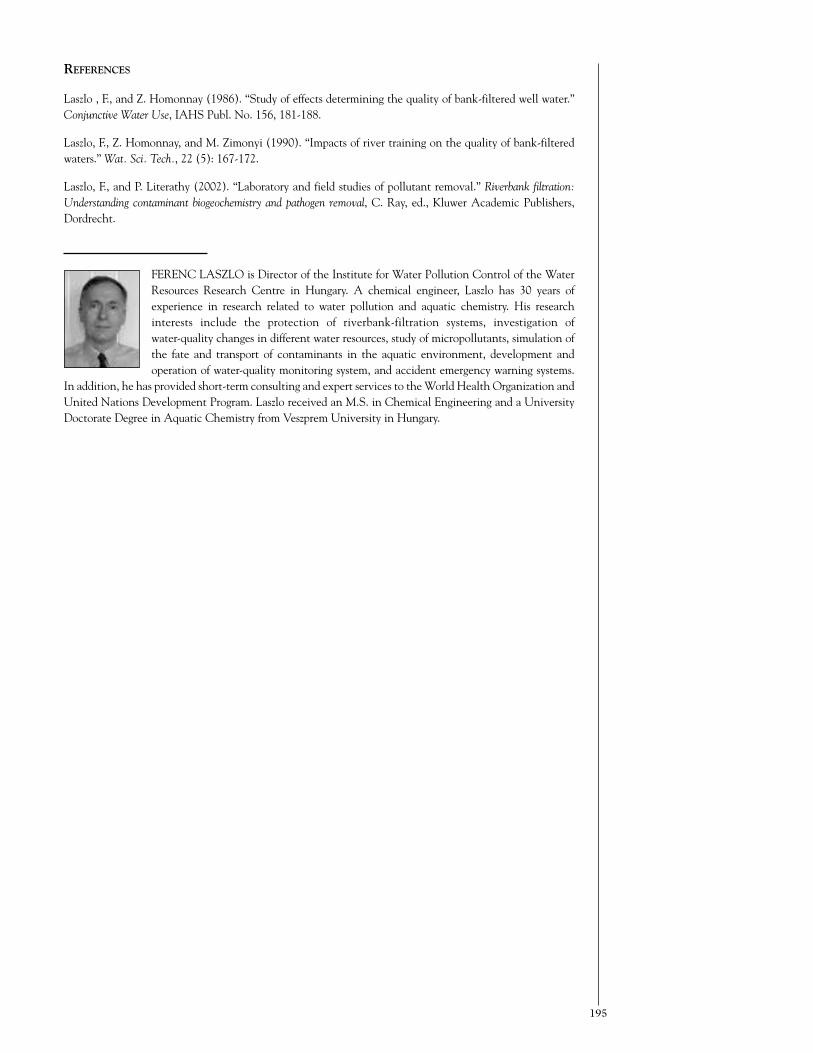
REFERENCES
Laszlo , F., and Z. Homonnay (1986). “Study of effects determining the quality of bank-filtered well water.”Conjunctive Water Use, IAHS Publ. No. 156, 181-188.
Laszlo, F., Z. Homonnay, and M. Zimonyi (1990). “Impacts of river training on the quality of bank-filteredwaters.”Wat. Sci. Tech., 22 (5): 167-172.
Laszlo, F., and P. Literathy (2002). “Laboratory and field studies of pollutant removal.” Riverbank filtration:Understanding contaminant biogeochemistry and pathogen removal, C. Ray, ed., Kluwer Academic Publishers,Dordrecht.
FERENC LASZLO is Director of the Institute for Water Pollution Control of the WaterResources Research Centre in Hungary. A chemical engineer, Laszlo has 30 years ofexperience in research related to water pollution and aquatic chemistry. His researchinterests include the protection of riverbank-filtration systems, investigation ofwater-quality changes in different water resources, study of micropollutants, simulation ofthe fate and transport of contaminants in the aquatic environment, development andoperation of water-quality monitoring system, and accident emergency warning systems.
In addition, he has provided short-term consulting and expert services to theWorld Health Organization andUnited Nations Development Program. Laszlo received an M.S. in Chemical Engineering and a UniversityDoctorate Degree in Aquatic Chemistry from Veszprem University in Hungary.
195

196

Session 11: Case Studies “Lessons Learned”
Nitrate Pollution of a Water Resource – 15N and 18OStudy of Infiltrated Surface Water
Frantisek Buzek, Ph.D.Czech Geological SurveyPrague, Czech Republic
Renata KadlecovaCzech Geological SurveyPrague, Czech Republic
Miroslav Knezek, Ph.D.Prague, Czech Republic
This study was undertaken to determine the effects of agricultural and human activities at thevillage of Karany near Prague, the Czech Republic, on the quality of water resources. Three groups ofwells use bank infiltration water from the Jizera River to produce about 1,000 liters per second ofquality drinking water for Prague. Some wells have exhibited a steady increase in nitrate contentin recent years (Figure 1), although river-water quality remains good. A question arises of theorigin of nitrate contamination and its transportation to wells, and to what extent bank-filteredwater contributes to produced water. Also of interest are other contributions and how long it takesfor these contributions to reach the wells.
197
Correspondence should be addressed to:
Frantisek Buzek, Ph.D.Head of Stable Isotope LabCzech Geological SurveyGeologicka 6 • 152 00 Prague 5, Czech RepublicPhone: 420 251085345 • Fax: 420 251818748 • Email: [email protected]
Figure 1. Nitrate content (in milligrams per liter, 6-months average value) of contaminated capture wells.

Site Description
The study area is formed by Cretaceous sandstones andmarlstones (the Jizera formation) of Turonianage. The Jizera River represents a base for local drainage. A shallow aquifer is situated in LatePleistocene and Holocene alluvial deposits. They consist of sands and sandy gravel 7- to 9.5-m thick.The Quaternary aquifer is 2.5- to 5-m thick. It is hydraulically connected with the Jizera Riverstream. The Quaternary sediments have a high degree of transmissivity and high permeability. TheCretaceous deposits have an average transmissivity and free groundwater surface.
On the right bank of the Jizera River, where the Turonian aquifer has a sandy development, itstransmissivity is only about 1 order inferior to that of the alluvial plain deposits. On the left bankof the Jizera River, the permeability is lower due to a higher proportion of marly component in theTuronian sediments. Contamined water Wells 227 to 299 (Skorkov capture wells) are locatedalong the Jizera River at a distance of 200 to 300 m from the right bank (Wells 227 to 270) andleft bank (Wells 271 to 299) (Figure 2). Sojovice capture wells are located on the left bank only;one part is recharged by artificial infiltration (Wells 120 to 187), another part is traditional bankinfiltration at a distance 300 m from the river (Wells 188 to 226). The river terraces are used bylocal farmers for the cultivation of corn, potatoes, and maize. Local villages have poor sewersystems, and there are several landfills located in the area.
Methods
From 1999 to 2000, we took water samples at various time intervals from the river, precipitationin the recharge area, precipitation at the site, and wells for the oxygen isotope composition ofwater (δ18O - H2O), and river and wells for the isotope composition of nitrogen in nitrate(δ15N-NO3).
1
δ18O data were used to:
• Describe the river system.
• Specify groundwater recharge.
• Calculate the contribution of infiltrated river water to well production.
• Model infiltration water flow and transportation time to the well.
• Specify additional water contributing to well water.
δ15N-NO3 data were used to:
• Specify the origin of nitrate and possible mixtures.
• Trace seasonal trends in nitrate content.
• Follow reactions in the groundwater system (denitrification).
River System
The mean residence time T equals 7.2 months, as calculated from variations of δ18O values of theriver and precipitation in the recharge area. An average contribution of direct precipitation torunoff is about 13 percent, with a maximum of 36 percent during the highest flood event.
198
1 Isotopic composition is measured in delta units, δ(in ‰) = Rx/Rs -1) × 1000, where R denotes the ratio of the heavy-to-light isotope (e.g., 18O/16O or 15N/14N), and Rx and Rs are the ratios in the sample and standard, respectfully. Asinternational reference standard is used, Standard Mean Ocean Water (SMOW) stands for water and atmospheric N2
for nitrogen.

Nitrate content and δ15N-NO3 of the Jizera River follow seasonal variations. δ15N-NO3 varies from8 ‰ in the winter to about 1.5 ‰ (base flow only). The highest nitrate content (about 25 mg/L)was measured during snowmelt. Base flow nitrate content is very low (about 8 to 10 mg/L).Additional nitrate to base flow originates mostly from drained precipitation events (short time orfast component of runoff), flushing fertilizers bringing mostly organic nitrogen in the spring(manure applied in the winter period), and inorganic nitrogen during the growing season(fertilizers applied on leaves).
199
Figure 2. A sketch of the study area.
Key: 1 = Forested area.2 = Jizera-Elbe watershed.
3 = Capture well.4 = Groundwater flow.
5 = Deep well.6 = Landfill.

The nitrate content and δ15N-NO3 of the Jizera River do not follow the same seasonal variation.δ15N-NO3 varies from 8‰ in winter to about 1.5‰ (base flow only). The highest nitrate content(about 25 mg/L) was measured during snowmelt. Base flow nitrate content is very low (about 8 to10 mg/L). Figure 3 shows the nitrate content and isotopic composition of the Jizera River.
As the response of river runoff to precipitation is quite fast (from 3 to 5 days after a storm), asimplified two-component model of runoff generation is applicable. The discharged water consistsof groundwater and short residence-time components. Short time components are formed bydrained precipitation events flushing fertilizers — predominantly the organic nitrogen applied inwinter — and by inorganic nitrogen applied during the growing season. Increasing δ15N-NO3
levels during the autumn corresponds to residual nitrate levels from the unsaturated soil zonebelow root level. A similar seasonal variability was observed during the next year as well.
Infiltration System
Water Balance
The actual and modeled δ18O data were compared during a flood event and steady-stateconditions. At flood conditions, the contribution of infiltrated river water increased up to100 percent, with a transit time of only about 5 days. At steady-state conditions, infiltrated riverwater forms about 60 percent of infiltrated water, with a transit time of 28 days. The additional40 percent of infiltrated water cannot be explained by local groundwater only. It must originatefrom a shallow aquifer. Fast transit times of this recharging water were confirmed by a variabilityof δ18O in the wells, which is higher than in the river. Additional recharging water can bemodeled by local precipitation input, with a delay in the order of weeks.
Nitrate Contamination of Skorkov Wells
From comparing the high nitrate content of contaminated wells and their seasonal δ15N-NO3
variability, it is obvious that:
• Nitrate originates mostly from water other than infiltrated water.
• Sources of nitrate are very similar to river sources (i.e., similar sequences of nitrogeninputs during the year.
Wells have a higher concentration of nitrates than river water.
200
Figure 3. Nitrate content and isotopic composition of the Jizera River.

By analyzing the δ15N-NO3 of single wells along the contaminated part of bank infiltration, weidentified the possible sources of nitrate. Besides the seasonal application of fertilizers and manure,village sewer systems and landfills in the recharge area also contribute to water pollution in thewells (Figure 4).
The importance of local precipitation for recharging wells is obvious from the long-time variationof nitrate content of contaminated wells (see Figure 1). Minimal values on an otherwisecontinuously increasing plot correspond to years with very low precipitation input (25-percent lessthan average). With low precipitation input, wells are recharged preferentially by deepergroundwater with a lower nitrate content. Within a high precipitation period, wells are rechargedby fast infiltrated local precipitation washing out nitrate in the unsaturated zone.
Nitrate Contamination of Sojovice Wells
Sojovice capture wells have two parts: one part is recharged by artificial infiltration (Wells 120 to187), another part is traditional bank filtration at a distance of 300 m from the river (Wells 188to 126). Contrary to the Skorkov system, the Sojovice wells are not affected directly byprecipitation (Figure 5). Besides, both the bank infiltration and artificial infiltration parts arepartially recharged by denitrified groundwater. From a time sequence of nitrate content and itsδ15N-NO3 on single wells, we could separate three components of the recharge:
• River water.
• Shallow groundwater with a nitrate source typical for infiltration in the left bank.
• Deep groundwater with a reduction zone and denitrification.
Flow paths of groundwater components are different — perpendicular to river flow (shallowcomponent) and along the river (deep component).
Conclusions
Nitrate contamination of the bank infiltration systems originates in local sources of nitrate,including inappropriate uses of manure/fertilizers and leaking village sewers. A considerable
201
Figure 4. Nitrate content and isotopic composition of contaminated water (Skorkov single wells).

increase of nitrate in the 1980s originated both because of the change in agriculture practices (dueto an increased proportion of maize cultivation) and the change in hydrology dynamics of thesystem (due to the extensive use of water resources, new infiltration pathways were developed thatrecharge more shallower groundwater than before).
FRANK BUZEK has worked for the Czech Geological Survey for about 25 years, and isHead of the Stable Isotope Group. His primary research interest includes the applicationof isotope geochemistry to environmental problems, hydrology, and organic geochemistry.As an all-round geochemist, he was responsible for stable isotope data on carbon andnitrogen cycling in forest soils (European Union international projects CANIF, NIPHYS,and FORCAST) and tracing atmospheric emissions and groundwater pollution(International Atomic Energy Agency project on isotope technique in groundwater
pollution). Most of the recent case studies solved by Buzek and his team have dealt with nitrate in waterresources. Buzek received an M.S. in Physical Chemistry from the Institute of Chemical Technology and aPh.D. in Applied Surface Chemistry from the Institute of Chemical Processes Fundamentals at the CzechAcademy of Sciences in Prague.
202
Figure 5. Nitrate isotopic composition of contaminated water (Sojovice single wells).

Session 11: Case Studies “Lessons Learned”
Microbial Growth inArtificially RechargedGroundwater:Experiences from a 4-Year Project
Ilkka T. Miettinen, Ph.D.National Public Health InstituteKuopio, Finland
Markku J. Lehtola, Ph.D.National Public Health InstituteKuopio, Finland
Prof. Terttu VartiainenNational Public Health InstituteKuopio, Finland
Prof. Pertti J. MartikainenKuopio UniversityKuopio, Finland
Introduction
There are regions in Finland where large groundwater aquifers are not available and where theartificial groundwater recharge technique is an important alternative for drinking-water production.In Finland, 9 percent of drinking water is produced using the artificial recharge of groundwater orbank-filtration techniques. The production of artificially recharged groundwater has increasedduring the last decade. The high content of organic carbon (humus) present in surface water is aserious problem when this water is used to produce drinking water.
Organic carbon can react with chlorine during disinfection, forming halogenated byproducts. Thehigh availability of organic carbon may also cause microbial problems in distribution networks.The fraction of organic carbon that microbes can use for growth (i.e., AOC) is considered to bethe most important nutrient affecting microbial growth in drinking waters (van der Kooij, 1992).In boreal areas, phosphorus — in addition to organic carbon — has been shown to regulatemicrobial growth in drinking waters (Miettinen et al., 1996).
Objectives
A 4-year project examined how the artificial recharge of lake water affects the following:
• Molecular weight distribution of organic matter.
• AOC content.
• Microbially available phosphorus (MAP) content.
• Microbial growth potential in water.
203
Correspondence should be addressed to:
Ilkka Miettinen, Ph.D.Researcher, Laboratory of Environmental MicrobiologyNational Public Health InstituteDepartment of Environmental Health • P.O. Box 95 • FIN-70701 Kuopio FinlandPhone: (358) 17-201371 • Fax: (358) 17-201155 • Email: [email protected]

Methodology
Experimental Sites
Changes in water quality during artificial groundwater recharge were studied in five water works.All water works (WaterWorks A, B, C, D, and E) are located in esker areas, where the soil consistsmainly of sand and gravel. Lake water is filtrated into the ground by basin infiltration in WaterWorks A, C, D, and E. Water Works A, B, and E use sprinkling infiltration through forest soil,while Water Works B and C use the same lake as their raw-water source.
Water Analyses
The quality of raw-water samples and water samples from different monitoring wells at differentfiltration distances (raw water, the first monitoring point after infiltration, and the last monitoringpoint after filtration) were analyzed from 1998 to 2001. Filtration distance varied from 10 to 280 m inthe first monitoring point and from 390 to 1,200 m in the last monitoring point (artificially rechargedgroundwater). The quality of organic carbonwas analyzed in terms of its molecular weight distributionusing the high-pressure size-exclusion chromatography (HPSEC) method (Vartiainen et al., 1987).AOC was measured with a modified bioassay (Miettinen et al., 1999) originally presented by van derKooij et al. (1982), and MAP was analyzed by bioassay (Lehtola et al., 1999). Microbial growthpotential (heterotrophic growth potential) was tested using a method by Miettinen et al. (1997).
Results and Discussion
Organicmatter in lakewaters consistedmainly of high and intermediatemolecular-size fractions. Thesefractions decreased rapidly in the filtration process. In contrast, the lowest molecular weight fractionsof organic matter decreased only slightly during filtration. The strongest reduction in the content ofAOC occurred in the beginning of filtration. Later on, there was only a slight decrease in AOCcontent. On average, there was a 53-percent reduction in the concentration of AOC during theartificial recharge of groundwater (Table 1). Changes in MAP concentrations during filtration variedamong water works. MAP content decreased strongly (89- to 99.9-percent removal) during filtrationin Water Works A, B, and D. Water Works E was the only exception where MAP content increasedduring the filtration process, indicating that phosphorus was dissolving from soil intowater (seeTable 1).
204
Table 1. Concentrations (Range and Mean Value in Parentheses) of AOC and MAPin Raw Water and Artificially Recharged Groundwater. Number of Observations: 4 to 11.
Water AOC: µg Acetate eq. C/L MAP: µg MAP-P/LWorks RW ARW RW ARW
A 54 to 366 (134) 17 to 132 (46) 0.98 to 9.90 (3.84) 0.22 to 0.34 (0.27)
B 15 to 120 (56) 15 to 73 (46) 1.79 to 5.31 (2.57) 0.15 to 0.37 (0.28)
C 39 to 144 (78) 27 to 90 (49) Not Determined Not Determined
D 27 to 288 (151) <1 to 3 (2) 2.42 to 8.66 (4.57) <0.01 to 0.01 (0.01)
E 29 to 120 (54) 17 to 51 (31) 2.60 to 4.26 (3.08) 4.52 to 13.20 (8.34)
RW = Raw water. ARG = Artificially recharged groundwater. µg Acetate eq.C/L = Micrograms of acetateequivalent carbon per liter. µg MAP-P/L = Micrograms of microbially available phosphorous per liter.

Microbial growth was weak in all lake-water samples, despite the fact that these waters had highAOC and MAP contents; however, there was strong microbial growth in artificially rechargedgroundwater. Lower microbial growth in surface water could be associated with the grazing activityof protozoa (Hahn and Hofle, 2001). The microbial growth potential in groundwater was strongestin the first sampling point and weakened during filtration (Figure 1). The AOC content did notcorrelate with microbial growth potential; however, the maximum microbial counts correlatedwith the MAP content (r = 0.70, p = 0.000, n = 26) when raw-water samples and samples withMAP over 5 µg/L (no phosphorus limitation) were excluded from the data.
Conclusions
• The quality of organic matter changed during artificial recharge: high and intermediatemolecular weight organic compounds were removed from infiltrated lake water.
• The decrease in AOC content was strongest in the beginning of infiltration. An increasein filtration distance had a minor effect on AOC removal.
• MAP removal depended on soil characteristics. In most of the studied water works,removal was good.
• Microbial growth was higher in artificially recharged groundwater than in raw water(surface water). The microbial growth potential decreased during filtration.
• Because the removal efficiency for phosphorus was higher than that for carbon, phosphorusbecame the main nutrient regulating microbial growth in artificially rechargedgroundwater.
205
Figure 1. Increase in microbial cell numbers (R2A plate counts) with time when water samples wereincubated in the laboratory. The figure shows mean numbers in samples taken from raw water orartificially recharged groundwater of Water Works A, B, D, and E. Symbols: RW = Raw water.1.point = The first monitoring point after infiltration. 2. Point = The last monitoring point afterfiltration). Number of observations: 18 to 21.

REFERENCES
Hahn, M.W., and M.G. Höfle (2001). “Grazing of protozoa and its effect on populations of aquatic bacteria.”FEMS Microbiol. Ecol., 35: 113-121.
Lehtola, M., I.T. Miettinen, T. Vartiainen, and P.J. Martikainen (1999). “A new sensitive bioassay fordetermination of microbially available phosphorus in water.” Appl. Environ. Microbiol., 65(5): 2,032-2,034.
Miettinen, I.T., T. Vartiainen, and P.J. Martikainen (1996). “Contamination of drinking water.” Nature,381: 654-655.
Miettinen, I.T., T. Vartiainen, and P.J. Martikainen (1997). “Microbial growth and assimilable organiccarbon in Finnish drinking waters.” Wat. Sci. Techn., 35(11/12): 301-306
Miettinen, I.T., T. Vartiainen, and P.J. Martikainen (1999). “Determination of assimilable organic carbon(AOC) in humus-rich waters.” Wat. Res., 3(10): 277-2,282.
Vartiainen, T., A. Liimatainen, and P. Kauranen (1987). “The use of size exclusion columns in determinationof the quality and quantity of humus in raw waters and drinking waters.” Sci. Total Environ., 62: 75-84.
van der Kooij, D., W.A.M. Hijnen, and A. Visser (1982). “Determinating the concentration of easilyassimilable organic carbon.” Journal AWWA, 74: 540-545.
van der Kooij, D. (1992). “Assimilable organic carbon as an Indicator of Bacterial Regrowth.” Journal AWWA,84(2): 57-66.
ILKKA MIETTINEN has been a researcher for the National Public Health Institute inFinland since 1987. Currently, he serves as Researcher of the Laboratory of EnvironmentalMicrobiology at the Institute, as well as Researcher for Kuopio University. For the past3 years, his research has focused on the role of phosphorous in microbial growth potentialand biofilm formation in distribution networks. A recent project of his is called,“Surveillance and control of microbiological stability in drinking-water distributionnetworks.” Past research has focused on chemical and microbiological quality in humus-
rich lake water during bank filtration, as well as the effects of strong oxidants on the quantity and quality oforganic matter and microbial regrowth in treated waters. Miettinen received a B.S. in Biochemistry, M.S. inBiotechnology, and Ph.D. in Environmental Sciences at the University of Kuopio, where he currently isDocent of Environmental Sciences.
206

Session 11: Case Studies “Lessons Learned”
Evaluation of the Existing Performance of InfiltrationGalleries in Alluvial Deposits of the Parapeti River
Dip.-Eng. Alvaro CamachoBolivian Association of Sanitary EngineersLa Paz, Bolivia
Introduction
The Parapeti River is part of the drainage system of the Parapeti-Izozog watershed, which coversabout 52,000 square kilometers and is the sole water resource for supplying drinking water to theCity of Camiri, Bolivia. The strata of the basin consist of Quaternary deposits and the permeabilityis good; however, precipitation is low (only 700 to 800 millimeters) and, as this zone is located inthe watershed between the Amazon and La Plata river systems, existing groundwater quantity isvery low. The aquifer depth is between 100 to 200 m in the vicinity of Camiri (yield capacity isless than 1.0 liters per second). The City is located in the region of Santa Cruz, Bolivia, at analtitude of 810-m above sea level, in the southeast, and has a population of 25,000 inhabitants.The average temperature is 25-degrees Celsius, with a maximum of 38-degrees Celsius in thesummer and a minimum of 11-degrees Celsius in the winter.
The City’s water demand is supplied by five infiltration galleries buried below the riverbed(Figure 1), on the bedrock, at a depth of about 4 to 5 m. The galleries are interconnected through
207
Correspondence should be addressed to:
Dip.-Eng. Alvaro CamachoConsultant EngineerBolivian Association of Sanitary EngineersCasilla 9348 • La Paz, BoliviaPhone and Fax: (591-2) 241- 6283 • Email: [email protected]
Camiri
Study Area
Location of the Infiltration Galleries
Collector Well
Pumping Station
Collector Well Collector
Well
Collector Well Collector
Well
Gallery 1
Gallery 2 Gallery
5Gallery
3 Gallery 4
Parapeti River
Figure 1. Location of the study area.

a network and linked to a collector well sited on the riverbank. From there, the collected water ispumped to a disinfection tank prior to delivery to customers.
The infiltration galleries are channels with a 1.0-m × 1.0-m section or drains of 12-inch coveredby four layers (Table 1) of a filter medium (Figure 2)
In this area of the Parapeti River, where the galleries are in operation, the riverbed consists ofpermeable alluvial material, sand, and gravel of about 4- to 5-m deep, which creates favorableconditions for groundwater flow through the unconfined aquifer (Huisman, 1978). Because themovement of groundwater develops small velocities in granular material, the flow is laminar (Harr,1990) and this is the driving force for the sedimentation process in the sand and gravel layers ofthe river. The Parapeti is a mountain river whose water flow is subject to dramatic variations, bothin quality and quantity, during the dry season (May to October) and rainy season (November toApril). With a relatively steep slope (0.5 to 1 percent), intensive sediment transport rates occurin the rainy season (the maximum flow exceeds 1,000 m3/s, as compared to 5 m3/s in the dryseason). Regarding water quality in the river, turbidity levels in the rainy season have been reportedat about 15,000 ntu and suspended solid concentrations at 30,000 mg/L (Binnie & PartnersConsultants, 1982).
In spite of Parapeti’s water quality, infiltration galleries have worked continuously for more than15 years, producing water of good quality and using disinfection as the only treatment process,with a discharge of 48 to 50 liters per second. The only annual O&M consists of removing thefinest particles of sand that have reached the bottom of the galleries.
208
Water Surface
Natural Sand River
Gravel 1 to 2 inches
Gravel 2 to 3 inches
Gravel 3 to 6 inches
Bed RockSection 1 m × 1 m
4 to 5 m
River Bed
Permeable Alluvial
Deposits
Figure 2. Infiltration gallery system.
Bed Layers Type/Size Height
First Layer (Top) Coarse Sand 1.75 m
Second Layer Gravel, 1 to 2 inches 1.0 m
Third Layer Gravel, 2 to 3 inches 1.0 m
Fourth Layer (Bottom) Small Stone, 3 to 6 inches 1.0 m
Table 1. Artificial Filterbed Layers of Infiltration Galleries

Objectives
The aim of the study was to evaluate the existing performance of infiltration galleries to improveon the water quality of surface waters. The study was oriented to answer the following question:“To what extent do infiltration galleries work to remove contaminants from surface-water supplies?”
Materials and Methods
A sampling program was implemented during the dry and rainy seasons. Two complete sets of watersamples were collected and analyzed between 2002 and 2003 (Schubert, 2002). The first set of sampleswas taken in the dry season, from early October to November 2002, when suspended-solidconcentrations in the river are low. The second set of samples was collected during the rainyseason, from February and April, when the river carries higher suspended-solid concentrations. Inboth periods, water samples were taken over a period of 41 to 45 days. Grab samples were collectedthree times per day in the Parapeti River and in two of the five infiltration galleries (Numbers 1and 4). Raw-water samples collected in the river were taken from a depth of 0.30-m below thesurface and 100-m upstream of the galleries. At the same time, water samples were taken from theeffluents of the two infiltration galleries (Numbers 1 and 4) at the inlet point of the disinfection tank.
Eight water-quality parameters were chosen: temperature, color, turbidity, suspended solids, totaldissolved solids, pH, conductivity, and fecal coliform counts. Grab samples for temperature and pHwere collected in glass bottles and analyzed on site. Random samples for color, turbidity, suspendedsolids, total dissolved solids, and conductivity were collected in glass bottles for analysis in alaboratory. Microbiological samples were collected in sterile 50-mL Pyrex glass for analysis in alaboratory within 24 hours. The test was conducted using a portable OXFAM-DEL AGUA watertest kit (membrane filtration technique). A duplicate was prepared from each sample. All theexperimental tests were based on the “Standard Methods for the Examination of Water andWastewater” (1975).
In addition, exploration holes were dug into different layers of the coarse material to take samples fromdifferent filter media that cover the galleries. Each layer of the filter media, from Galleries 3, 4, and 5,was washed with distilled water to perform a column-settling test. This experiment was conducted todetermine the frequency distribution of settling velocities and particle diameters. Also, each samplewas subject to physical analysis, such as mass density, porosity, and granular grain-size distribution.
Results and Discussion
Figures 3 to 5 illustrate seasonal variations in water quality in the Parapetí River and infiltrationgalleries. For the purposes of this paper, only two indicators of water quality were chosen: suspendedsolids and fecal coliform.
During the rainy season, raw water in the Parapeti River had suspended-solid levels ranging from45 to 4,850 mg/L, with a mean value of 618 mg/L. These figures differ substantially in comparisonto the dry season, where the average value was 72 mg/L and the maximum was 410 mg/L. In therainy season, because the river’s flow is high (from 5 to 1,000 m3/s, with a mean value of 30 m3/s),the elevated suspended-solid concentration is caused by erosion that occurs on the steep slopes ofwatershed highlands. As shown in Figures 3 to 8, the infiltration galleries that were evaluatedduring the same period had very low levels. The values were ranged from 0 to 7 mg/L, with an averageof 2 mg/L far below the common standards. From this evidence, it has been demonstrated that theperformance of the infiltration galleries reached a removal ratio of more than 90 percent. Turbidityof 5 ntu or less in 98 percent of the daily samples was reported in the effluents (see Figure 5).
209

210
Feb-03 Feb-03 Feb-03 Mar-03 Mar-03 Mar-03 Mar-03 Mar-03 Mar-03 Apr-03 Apr-03
012345678
45104520453045404550456045
Gal. 1Gal. 4
River
Suspended Solids (mg/L)
Figure 3. Raw water and infiltration gallery water quality.
050
100150200
1 5 010150201503015040150501506015070150
Feb-03 Feb-03 Feb-03 Mar-03 Mar-03 Mar-03 Mar-03 Mar-03 Apr-03
Gal. 1Gal. 4
River
Fecal Coliforms (FC/100 mL)
Figure 4. Raw water and infiltration gallery water quality.
NTU
Faecal Coliforms in Galleries. Frequency Distribution. Rainy Season (2003)
0 20 40 60 80 100 120 140 160 1800%
20%
40%
60%
80%
100%
120%
%Cu
mm
ulat
ive
Dist
ribut
ion
Gallery 1Galeria 4
Figure 5. Quality of water produced in the infiltration galleries.

Microbiological water-quality parameters in the Parapeti River show poor quality with a wide rangeof 160 to 60,000 fecal coliform counts/100 milliliters, with an average value of 9,000 fecal coliformcounts/100 milliliters. The infiltration gallery data illustrate that in one gallery (Gallery 1), themean value was zero fecal coliform counts/100 milliliters, with a maximum of 20 fecal coliformcounts/100 milliliters achieving a removal ratio of more than 90 percent. Three fecal coliformcounts /100 milliliters or less in 98 percent of the samples was found. In the other gallery (Gallery 4),the mean value was a concentration of 32 fecal coliform counts/100 milliliters, with a maximumof 169 fecal coliform/100 milliliters representing a removal ratio of more than 90 percent. In thisgallery, 120 fecal coliform counts/100 milliliters or less in 98 percent of the daily samples was found.These differences may be attributed to variations in gallery O&M.
211
Gallery 1 0 1 5Gallery 4 0 2 7River 45 618 4850
Minimum Mean Maximum0
2000
4000
6000
Suspended Solids (mg/L)
Figure 6. A comparison of raw water and water produced by the galleries.
Gallery 1 1 0 20Gallery 4 1 32 169River 160 8958 60685
Minimum Mean Maximum0
20000
40000
60000
80000
FE Faecal RMS (FC/100 mL)
Figure 7. A comparison of raw water and water produced by the galleries.
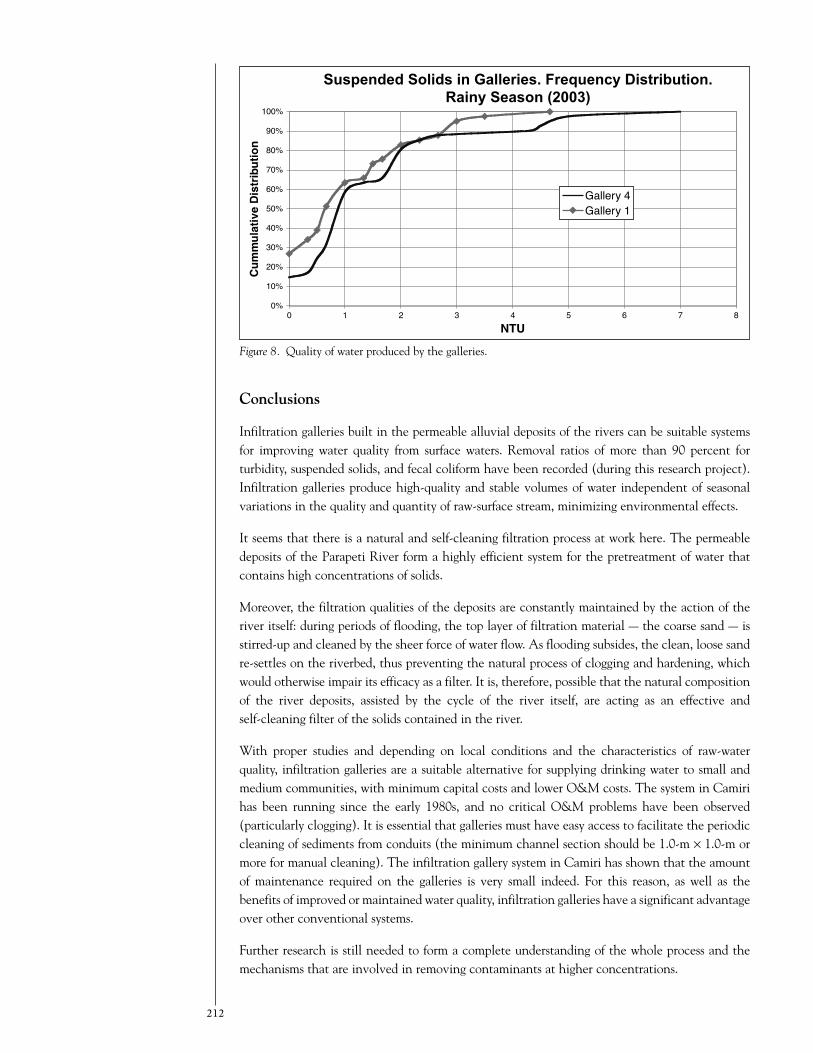
Conclusions
Infiltration galleries built in the permeable alluvial deposits of the rivers can be suitable systemsfor improving water quality from surface waters. Removal ratios of more than 90 percent forturbidity, suspended solids, and fecal coliform have been recorded (during this research project).Infiltration galleries produce high-quality and stable volumes of water independent of seasonalvariations in the quality and quantity of raw-surface stream, minimizing environmental effects.
It seems that there is a natural and self-cleaning filtration process at work here. The permeabledeposits of the Parapeti River form a highly efficient system for the pretreatment of water thatcontains high concentrations of solids.
Moreover, the filtration qualities of the deposits are constantly maintained by the action of theriver itself: during periods of flooding, the top layer of filtration material — the coarse sand — isstirred-up and cleaned by the sheer force of water flow. As flooding subsides, the clean, loose sandre-settles on the riverbed, thus preventing the natural process of clogging and hardening, whichwould otherwise impair its efficacy as a filter. It is, therefore, possible that the natural compositionof the river deposits, assisted by the cycle of the river itself, are acting as an effective andself-cleaning filter of the solids contained in the river.
With proper studies and depending on local conditions and the characteristics of raw-waterquality, infiltration galleries are a suitable alternative for supplying drinking water to small andmedium communities, with minimum capital costs and lower O&M costs. The system in Camirihas been running since the early 1980s, and no critical O&M problems have been observed(particularly clogging). It is essential that galleries must have easy access to facilitate the periodiccleaning of sediments from conduits (the minimum channel section should be 1.0-m × 1.0-m ormore for manual cleaning). The infiltration gallery system in Camiri has shown that the amountof maintenance required on the galleries is very small indeed. For this reason, as well as thebenefits of improved or maintained water quality, infiltration galleries have a significant advantageover other conventional systems.
Further research is still needed to form a complete understanding of the whole process and themechanisms that are involved in removing contaminants at higher concentrations.
212
Suspended Solids in Galleries. Frequency Distribution.Rainy Season (2003)
0%
10%
20%
30%
40%
50%
60%
70%
80%
90%
100%
0 1 2 3 4 5 6 7 8NTU
Cum
mul
ativ
eDi
strib
utio
n
Gallery 4Gallery 1
Figure 8. Quality of water produced by the galleries.

REFERENCES
American Public Health Association (1975). Standard Methods for the Examination of Water and Wastewater,Fourteenth Edition, American Public Health Association, New York.
Binnie & Partners Consultants (1982). Final Report on the design of the surface water treatment plant in Camiri,Binnie & Partners Consultants, Santa Cruz, Bolivia.
Harr, M.E. (1990). Groundwater and Seepage, General Publishing Company, Toronto, Ontario.
Huisman, L. (1978). Ground Water Recovery, International Institute for Hydraulic and EnvironmentalEngineering, Technical University of Delft, The Netherlands.
Schubert, J. (2002). “German Experience with Riverbank Filtration Systems Ray.” Riverbank FiltrationImproving Source-Water Quality, C. Ray, G. Melin, and R.B. Linsky, editors, Kluwer Academic Publishers,Dordrecht.
Since 2002, ALVARO CAMACHO has been a consultant engineer for the water andsanitation sectors, including the Bolivian Association of Sanitary Engineers. Prior, he wasthe Director General of Water Supply and Sanitation for the Ministry of Housing Servicesof the Republic of Bolivia, a Project Leader in the Water and Sanitation Program for ruralareas in Bolivia for the World Bank, and Guest Lecturer of Sanitary Engineering at theUniversidad Mayor de San Andrés in Bolivia. He is also the author of several reports ontopics such as water-treatment plants designed within the multi-stage filtration concept,
developing the water and sanitation sector in Bolivia, technical standards for the design of unconventionalsewer systems in Bolivia, and guidelines for the design of water-treatment plants in small and mediumcommunities. Camacho received a degree in Civil Engineering from the Universidad Mayor de San Andrésin Bolivia and a Dipl.-Engineer in Sanitary Engineering from the International Institute for Hydraulics andEnvironmental Engineering, in conjunction with the Technical University of Delft, The Netherlands. He isa M.S. researcher at the Universidad del Valle in Cali, Columbia, where he is conducting a field study oninfiltration galleries for water supply.
213

214

Session 11: Case Studies “Lessons Learned”
Sensitivity and Implications of Microscopic ParticulateAnalysis – A Collector Well Owner’s Perspective
Barry C. BeyelerCity of BoardmanBoardman, Oregon
The City of Boardman, Oregon, owns two horizontal collector wells situated along the banks ofthe Columbia River, which provides the City’s water supply. The horizontal collector well systemwas chosen in 1975 for its unique ability to produce high volumes of high-quality water. Thehorizontal collector wells fill a role of vital importance in the City by addressing the balance ofplentiful water supplies for industrial development and the need for high-quality drinking waterfor the citizens of the community.
The City has been confident of the water quality produced by the collector and the filtrationeffectiveness it possesses; however, under provisions of the Surface Water Treatment Rule, thepotential water-quality effects of the hydraulic connectivity to the Columbia River came underquestion. The City chose to perform Microscopic Particulate Analysis on the collector and ColumbiaRiver in the attempt to indicate and quantify the filtration effectiveness of the horizontal collectorwell system.
Performance of Microscopic Particulate Analysis in the field presented many challenges thatneeded to be addressed to ensure that a quality representative sample was taken. There are manyways this sample can be compromised, which could produce non-representative or inaccurateresults. Understanding the sensitivity of the Microscopic Particulate Analysis process from start tofinish, combined with an assessment of what the indicated results would trigger under the SafeDrinking Water Act concerning additional treatment and subsequent associated costs, requiredsignificant care and diligence.
As a result of the sampling and analysis that the City performed, the State of Oregon Departmentof Human Resources Drinking Water Program has determined that the City is operating a“groundwater” system. This is based on the quality of the water and assurances provided byaccurate and representative data obtained through Microscopic Particulate Analysis. As the Citybrings its second collector online, the coordination of the Microscopic Particulate Analysissampling efforts are being discussed with the Department of Human Resources Drinking WaterProgram to ensure that this collector performance can be quantified appropriately. The MicroscopicParticulate Analysis process will be accomplished over the next year to provide the informationto make appropriate decisions. The City will follow the same process of sampling the river andcollector to indicate filtration effectiveness.
In retrospect, there have been numerous other benefits to the process of Microscopic ParticulateAnalysis sampling. The increased knowledge of how the system works has been invaluable in
215
Correspondence should be addressed to:
Barry C. BeyelerCommunity Development DirectorCity of Boardman, Oregon202 N Main Street • P.O. Box 229 • Boardman, Oregon 97818 USAPhone: (541) 481-9252 • Fax: (541) 481-3244 • Email: [email protected]

forums concerning Endangered Species Act listings of salmon and steelhead populations in theColumbia and Snake River basins. As proposals for river operations are brought forward, the Cityof Boardman can more accurately respond to what the potential impacts may be. The increasedknowledge and communication between the City and State and Federal agencies has also beenbeneficial in allowing the City to get through permitting processes associated with this water right.Although there is no direct method to measure the impact Microscopic Particulate Analysis hashad in this regard, there is no doubt that it has played a role in improving communication linkagesand the level of understanding between the agencies and public involved.
Since April 2003, BARRY BEYELER has been Community Development Director for theCity of Boardman, Oregon, where he has been employed for over 22 years. Among hisresponsibilities, he coordinates and reviews all land-use activities within the City and itsurban growth boundary. He also oversees all planning and land-use issues relating toutilities operations (water, wastewater, storm drainage, and traffic infrastructure), naturalresource impacts and environmental policy, wellhead protection, and public education.Among his professional affiliations, Beyeler is a member of the Oregon Water Resources
Department Ground Water Advisory Committee, where he is currently serving a third 4-year term and isformer Committee Chair. Beyeler received the Northeastern Oregon Sub-Section American Water WorksAssociation Activities Award in both 1992 and 1995.
216

![POSTER Riverbank Proj[1]](https://static.fdocuments.us/doc/165x107/577d263d1a28ab4e1ea0a0e9/poster-riverbank-proj1.jpg)