RiskTech 100, 2017 - EY - Ernst & YoungFILE/EY... · Chartis is the leading provider of research...
34
Research partner November 2016 Media partner Independent research by
Transcript of RiskTech 100, 2017 - EY - Ernst & YoungFILE/EY... · Chartis is the leading provider of research...

Research partner
November 2016
Media partner
Independent research by

Chartis is the leading provider of research and analysis on the global market for risk technology and is part of Incisive Media which has market leading brands such as Risk and Waters Technology. Chartis’s goal is to support enterprises as they drive business performance through better risk management, corporate governance and compliance and to help clients make informed technology and business decisions by providing in-depth analysis and actionable advice on virtually all aspects of risk technology. Areas of expertise include:
• Credit risk
• Operational risk and governance, risk and compliance (GRC)
• Market risk
• Asset and liability management (ALM) and liquidity risk
• Energy and commodity trading risk
• Financial crime including trader surveillance, anti-fraud and anti-money laundering
• Cyber risk management
• Insurance risk
• Regulatory requirements including Basel 2, Basel 3, Dodd-Frank, MiFID and Solvency II
Chartis is solely focused on risk and compliance technology giving it significant advantage over generic market analysts.
Chartis has brought together a leading team of analysts and advisors from the risk management and financial services industries. This team has hands-on experience of implementing and developing risk management systems and programs for Fortune 500 companies and leading consulting houses.
Visit www.chartis-research.com for more information.
Join our global online community at www.risktech-forum.com.
© Copyright Chartis Research Ltd 2016. All Rights Reserved. Chartis Research is a wholly owned subsidiary of Incisive Media Ltd.
No part of this publication may be reproduced, adapted, stored in a retrieval system or transmitted in any form by any means, electronic, mechanical, photocopying, recording or otherwise, without the prior permission of Chartis Research Ltd.
The facts of this report are believed to be correct at the time of publication but cannot be guaranteed.
Please note that the findings, conclusions and recommendations that Chartis Research delivers will be based on information gathered in good faith, whose accuracy we cannot guarantee. Chartis Research accepts no liability whatever for actions taken based on any information that may subsequently prove to be incorrect or errors in our analysis. See Chartis “Terms of Use” on www.chartis-research.com.
RiskTech100®, RiskTech Quadrant®, FinTech Quadrant™ and The Risk Enabled Enterprise® are Registered Trade Marks of Chartis Research Limited.
Unauthorized use of Chartis’s name and trademarks is strictly prohibited and subject to legal penalties.
2 © Copyright Chartis Research Ltd 2016 | All Rights Reserved
About Chartis

© Copyright Chartis Research Ltd 2016 | All Rights Reserved 3
About our partners
EY is a global leader in assurance, tax, transaction and advisory services. The insights and quality services we deliver help build trust and confidence in the capital markets and in economies the world over. We develop outstanding leaders who team to deliver on our promises to all of our stakeholders. In so doing, we play a critical role in building a better working world for our people, for our clients and for our communities.
About EY’s Fraud Investigation & Dispute ServicesDealing with complex issues of fraud, regulatory compliance and business disputes can detract from efforts to succeed. Better management of fraud risk and compliance exposure is a critical business priority – no matter what the industry sector is. With over 4,500 fraud investigation and dispute professionals around the world, we can assemble the right multidisciplinary and culturally aligned team to work with you and your legal advisors. We work to give you the benefit of our broad sector experience, our deep subject matter knowledge and the latest insights from our work worldwide.
With over 84,000 registered members, RiskTech Forum (www.risktech-forum.com) is the leading independent information resource for the global risk technology community. RiskTech Forum is dedicated to the role of technology as an enabler for risk management. It aims to build the premier network of risk, compliance, and technology professionals and to act as a single hub for high quality research and news relating to risk technology.
RiskTech Forum provides free access to over a thousand research papers, videos and opinions. The content covers multiple industries including banking, capital markets, insurance, and corporates. It also covers multiple risk and technology subjects, including market risk, credit risk, operational risk/GRC, financial crime, regulatory risk, risk analytics, and data management. For more information, visit RiskTech Forum at www.risktech-forum.com
44 © Copyright Chartis Research Ltd 2016 | All Rights Reserved
1. Foreword 5
2. Overview 6
3. Key trends 8
4. Corporate misconduct – individual consequences 18
5. RiskTech100® Rankings 2017 25
6. Category winners 28
7. Appendix A: Research methodology 29
8. Appendix B: How to read the RiskTech100® rankings 30
9. How to use research and services from Chartis 32
10. Further Chartis reading 34
List of figures and tables
Figure 1 RiskTech100® Taxonomy 6
Figure 2 Unethical behaviors, regional differenes 20
Figure 3 Spotlight on finance 21
Figure 4 Why don’t executives report unethical conduct? 22
Figure 5 RiskTech100® research methodology 29
Contents

© Copyright Chartis Research Ltd 2016 | All Rights Reserved 55
Welcome to Chartis’s RiskTech100® report for 2017. Now in its eleventh year, the RiskTech100® is globally acknowledged as the most comprehensive independent study of the world’s major players in risk and compliance technology. This year we’re delighted to feature additional insight from our research partner EY. Chapter 4 on page 18 includes the key findings of EY’s 14th global fraud survey, which highlights how corporate misconduct remains a challenge for company boards, despite the efforts of governments and institutions around the world to deal with the problem.
Globally, expenditure on risk technology has been rising by about 10% in the past 12 months, but we believe this will slow to about 6% in 2017. This development highlights an interesting trend – a shift from ‘knee-jerk’ risk IT investment to ‘smart’ investment. We’ve been asked to advise on several system selection and technology transformation programs for organizations that have reached compliance, but which are aiming to optimize and simplify fragmented risk technology systems and processes. We are seeing this trend across the globe, in all vertical industries and tiers.
For me, the most significant demand-side driver in the market is the shift in risk management responsibilities and accountability to the front office. This is partly because of regulatory requirements – but it’s also better risk management. Business lines are having to take ownership for risk, and this has significant implications for technology, data and analytics. For organizations, the key enabler for success will be accessing the right information – trusted information – at the moment it’s needed.
To compete in the rapidly changing risk technology marketplace, vendors will need sustainable product, technology and business strategies. New and innovative vendors are finding creative solutions to complex risk management problems, applying artificial intelligence, advanced natural language processing, Big Data infrastructures and robotic process automation to a variety of compliance activities.
To reflect all these trends, we have made some minor changes to the RiskTech100® scoring criteria and methodology. This year we have replaced the category of ‘Organizational Strength’ with a new one called ‘Strategy’ (see page 31 for more information). We have also slightly increased the weighting for data management capabilities in our ‘Core Technology’ category, because poor data management is still the number one obstacle to organizations’ success.
At Chartis, our goal continues to be providing clarity and insight on all aspects of the risk technology and financial technology markets, and RiskTech100® remains a key pillar of our analysis.
I hope you enjoy this year’s report.
Peyman Mestchian
Managing Partner
Foreword

© Copyright Chartis Research Ltd 2016 | All Rights Reserved6
Overview
The companies featured in RiskTech100® are drawn from a range of risk technology specialisms, and meet the needs of both financial and non-financial organizations. However, they share a number of qualities that rank them among the top 100 risk technology providers in the world.
The rankings are determined based on the classifications illustrated below, which this year focus on solutions, industry segments and success factors. We have removed the geographical categorization, to reflect the global nature of risk and financial technology markets.
Reflecting the continued challenges and opportunities facing financial firms, the increasing importance of data, and the ongoing evolution of technology, this year’s report includes some additional categories: ‘Artificial Intelligence’, ‘Data Integrity and Control’, ‘Model Risk Management’, ‘Risk as a Service’ and ‘XVA’. We have also replaced the category of ‘Organizational Strength’ with a new one, ‘Strategy’, to reflect changes in the wider enterprise and vendor landscape.
Figure 1: RiskTech100® Taxonomy
Source: Chartis Research
Solution categoriesCredit riskMarket riskPricing & valuationLiquidity risk & ALMEnergy tradingCommodity tradingFinancial crimeCyber riskOperational risk & GRCRegulatory reporting
Risk & finance integration
Risk data aggregation & reportingEnterprise stress testingModel risk managementArtificial intelligenceXVAData integrity & controlEnterprise collateral managementRisk as a service
Industry categoriesBankingSell-sideBuy-sideInsuranceCorporations
Chartis categoriesFunctionalityCore technologyCustomer satisfactionStrategyInnovationMarket presence
RiskTech

© Copyright Chartis Research Ltd 2016 | All Rights Reserved 7
The RiskTech100® report only includes companies that sell their own risk management software products and solutions. While many provide professional services and consulting offerings to support companies that implement and use their software solutions, we have excluded pure consulting or professional services firms from this study.
Highlights of this year’s rankings:
• FIS remained overall winner, following its 30-place rise in last year’s report.
• Oracle moved up to 2nd place, from last year’s 4th, while MSCI rose two places to 3rd.
• There were 18 new entrants to the rankings this year. Five of these made it into the top half of the table:
- LexisNexis (ranked 24)
- Ayasdi (27)
- Accuity (29)
- Digital Reasoning (42)
- ICE (43)
Two of these – LexisNexis and Accuity – were included in the RELX Group’s score last year, but have been separated out for this year’s rankings.
• Two vendors moved into the top 10:
- IHS Markit (which rose from 14th place last year to 9th this year)
- NICE Actimize (which rose from 13th to 10th, having slipped out of the top 10 in recent years).
• Seven companies enjoyed a notable rise in ranking:
- StatPro moved up 35 places, from 63 to 28.
- BearingPoint moved up 27 places, from 57 to 30.
- Fenergo moved up 25 places, from 66 to 41.
- Linedata moved up 25 places, from 98 to 73.
- BlackRock Solutions moved up 24 places, from 72 to 48.
- Axioma moved up 22 places, from 59 to 37.
- Bloomberg moved up 13 places, from 32 to 19.

© Copyright Chartis Research Ltd 2016 | All Rights Reserved8
Key trends
Global risk IT expenditure in financial servicesGrowth on the slide as we enter a new phase of spend
In recent years, expenditure on risk IT and consulting has enjoyed double-digit growth of 10% to 12%. But in 2017 growth will dip to 6%, as financial institutions (FIs) lessen their knee-jerk, post-regulatory expenditure. As they enter a phase of ‘smart’ technology modernization, driven by wide-ranging and transformative legislation such as the Fundamental Review of the Trading Book (FRTB), they will increasingly switch or drop suppliers, pushing down the growth for vendors too.
The momentum behind much of the activity in this new phase will be the easy availability of Cloud and Open-Source solutions, which will have a deep impact on FIs’ IT infrastructure and expenditure. Entire Open-Source solution stacks are now available – as are the small, ‘agile’ companies that can handle them. And the development of new database management environments and programming languages – such as Hadoop, Python, Scala, and R – is creating new solution ecosystems and widening FIs’ options.
Against an overall trend for cost-based simplification (whether via new technology options, outsourcing, or a mixture of the two), tier 1 FIs’ biggest area of spend is on risk, governance and integration technology – dominated by data aggregation. In a typical risk system project, about 80% of the total project lifecycle costs will be spent on getting the data ready, making aggregation the natural home for reducing costs and rationalizing data. Unsurprisingly, many such projects target the data layer first.
Other key trends shaping risk IT expenditure in 2017 will be:
• Geographic consolidation and the emergence of regional ‘hubs’.
• The convergence of finance and risk functions in many organizations.
• The spread of risk technology expenditure into non-traditional areas, including client-facing services such as prime brokerage, securities services, collateral and wealth management, all of which increasingly embed risk analytics into their business processes.
All these reflect changing attitudes to risk that will filter into overall expenditure, across most categories of spend.
Risk data aggregation and reporting solutionsMost firms see the potential, but can’t make it happen
Risk data aggregation and reporting (RDAR) solutions are increasingly important for all global FIs, as the interplay of technology and regulation creates ever more data to process and exploit. FIs want to integrate trusted data more fully into their business, and keep it out of silos to align it better with regulators’ demands. RDAR is also good for business, helping with operations, pricing and other risk elements.
New solutions account for almost half the $10.46bn global RDAR market. But, as Chartis’s research shows, most FIs are struggling to realize the potential of their RDAR implementations: for about a fifth, improving the granularity of their data could take five years. They are also largely failing to align their risk and data strategies – only 56% had completely or partially integrated RDAR into their Enterprise Data Management strategy or Chief Data Officer function. And only 21% thought that managing unstructured Big Data was ‘critical’ or ‘important’ for their data initiatives. Clearly, given that most of a typical FI’s data is unstructured, many RDAR projects have troubling gaps.
One framework for successful RDAR programs comes via the Basel Committee on Banking Supervision (BCBS) 239 Principles for Effective Risk Data Aggregation and Risk Reporting, part of Basel 3, which cover data accuracy, timeliness and governance. Although aimed at Global

© Copyright Chartis Research Ltd 2016 | All Rights Reserved 9
Systemically Important Banks (G-SIBs), Chartis believes they can help all FIs get to grips with RDAR. Ironically, given the clear demand for RDAR solutions, following the principles is proving hard for banks. Chartis’s data suggests that most G-SIBs missed the 2016 compliance deadline.
BCBS 239 A deadline no-one was going to hit
The reality is that the original January deadline for all banks to comply with BCBS 239 was unrealistic. This wasn’t just about banks being tardy. Problems with data governance and implementing risk aggregation systems slowed progress, and adopting a principles-based approach with no benchmarks for compliance also confused many banks, which simply didn’t know what they were supposed to aspire to. Banks’ reluctance to share their data has created much uncertainty about the state of their risk information, and complex leadership structures in many large FIs can slow things down further. Complying with the rules can also stifle opportunities to move into new business areas, and operational, security and privacy issues add further to the FIs’ complications.
Ultimately, risk data aggregation should be motivated by greater intelligence, reduced costs, and improved business performance. Concentrating on compliance is likely to produce tactical short-term fixes, creating more complexity and risk in the long term.
Data integrity and controlLonger-term benefits in a fertile market
Reduced profit margins and regulations (especially the BCBS 239 principles, FRTB, the Solvency II legislation, and the Supervisory Guidance on Model Risk Management) mean that FIs now need higher-quality data and better processes to analyze it. Technology budgets are tight, however, and FIs have to get more out of their current infrastructure. Boosted by advances in technology such as low-cost computing, an emerging sector of solutions is starting to address this need.
The phenomenal increase in data in recent years has created added pressure on FIs to categorize, tag and manage their data throughout its lifecycle. Part of this will be redefining how they assess
their data as structured or unstructured, which Chartis believes should now follow a continuum rather than an either/or categorization.
Historically, organizations have treated specialized data integrity and control capabilities as natural extensions of their workflow and operational processes (such as reconciliation systems). However, the pace of change of technology, and regulators’ demands for adaptable infrastructure, suggest that these solutions are now here for the long term. Indeed, it’s a sign of an FI’s organizational maturity if it can integrate data integrity and control solutions into its future architecture, and ultimately use them to gain a competitive edge. Automation and reconciliation will be key elements of any future system.
Quantification of end-user computing risk in financial servicesTime for a new way to tackle the hidden loss maker
Lurking among the assortment of human shortcomings that can lead to losses at FIs – corruption, greed and poor investment decisions – is a significant one that is often under-reported: errors in the way computers are used. A single discrepancy in an FI’s interlinked systems, documents and spreadsheets can change a crucial trade, or mushroom through a system. Improper use of end-user systems, which often occurs because non-programmers are able to develop their own applications, can incur huge losses for an FI.
According to Chartis’s estimates, the current End User Computing (EUC) Value at Risk (VaR) for the largest 50 FIs is $12.1bn (at a confidence interval of 97.5%, over a one-year period), and the annual average VaR for large FIs is $285m per institution. There are also significant potential secondary effects from EUC, among them regulatory fines, reputational damage and loss of customers.
Banking bookCredit risk management systems for the banking bookChallenging assumptions and reassessing strategies
Regulators, investors and banks – which use the Standardized Approaches to measuring credit risk – are now challenging the role of Internal

© Copyright Chartis Research Ltd 2016 | All Rights Reserved10
Ratings Based (IRB) models, a fact not lost on the Basel Committee on Banking Supervision. Its 2013 paper, The Regulatory Framework: Balancing Risk Sensitivity, Simplicity and Comparability, is influencing the current and proposed prudential regulatory framework.
There is now wider recognition that modeled Risk Weighted Assets (RWAs) – no matter which approach is used – are merely one estimate of a bank’s exposure to credit risk. Some banks are renewing their efforts to develop Economic Capital models and active portfolio management, while stress testing is now required by law for larger institutions, and is becoming widespread in others. And new accounting standards – International Financial Reporting Standard (IFRS) 9 and the Current Expected Credit Loss (CECL) standard – are having a profound impact on how risk models are designed and risk data is collected. This in turn affects Pillar 3 disclosures, and the way that risk and finance data is reconciled and reported to central repositories and regulators to facilitate stress testing.
Enterprise stress testingSolutions are critical to survival, but are still a work in progress
Despite improvements in governance, modeling, consistency, efficiency, data management, macro-economic scenarios and optimization across all areas of the financial services (FS) industry, stress testing is still very much a work in progress. Enterprise stress testing (EST) solutions are fragmented, and EST platforms have to embrace multiple technologies covering performance, data storage and delivery.
Across all FS market segments, regulation is still by far the biggest driver of progress and investment in EST, although the specific techniques and methodologies used vary by sector. For a typical large bank, stress tests can cost as much as $250m a year. But banks are spending a lot of effort and money on short-term, departmental goals, and are failing to invest in sustainable processes.
Overall stress testing is critical to the success – and profitability – of all aspects of financial services operations, and senior managers recognize that some discipline around EST will be vital to their companies’ survival in the next few
years. Which makes the fragmentation of stress testing tools in many organizations – and the use of spreadsheets in the last mile of regulatory reporting – especially strange.
Optimal balance sheet management for banksA complex balancing act needs a thorough, holistic approach
To manage a bank’s balance sheet to maximize reward and minimize risk, the board must do two things:
• Assess and clearly state its appetite for risk, and then establish Key Risk Indicators (KRIs) within that framework.
• Determine the measures of success (its Key Performance Indicators [KPIs]), such as return on assets and return on equity, that are acceptable to its stakeholders.
Chartis refers to this complex process as the Optimal Balance Sheet Management (OBSM) of assets, liabilities and shareholder equity. For OBSM to work, banks need:
• A thorough understanding of the prudential regulatory framework.
• A holistic approach that recognizes the entire scope of BSM.
• To recognize the challenges that arise from the competing objectives of regulators and bank managers.
• Effective governance, organizational structures and planning functions that embrace longer-term strategic plans and shorter-term operating ones.
• A methodology for the process, and the right technology to support it.
Chartis also believes that a revitalized Asset and Liability Management Committee (ALCO) is the appropriate forum to manage this process and achieve its objective. One vital tool is a simulation engine that can manage stochastic scenarios and the evolving balance sheet, as well as Profit and Loss (P&L) and a bank’s capital and financial resources.

© Copyright Chartis Research Ltd 2016 | All Rights Reserved 11
Trading bookSell-side risk management technologyPotential transformations in a complex, nuanced market
Sell-side risk management is a complex and varied area, but several notable developments are morphing its basic nature. Sell-side firms’ overall business has been transformed by a wave of regulations (such as Basel 2.5 and 3, the European Market Infrastructure Regulation (EMIR) and the Dodd-Frank Act), and the shift toward cleared derivatives has changed the way these firms approach derivatives in general. Their business and operating models are likely to be transformed further by the Fundamental Review of the Trading Book (FRTB) and the standardized approach for measuring counterparty credit risk exposures (SA-CCR).
It’s now much clearer how exactly FIs will be affected by FRTB – which, with associated regulations (such as FRTB Credit Valuation Adjustment [CVA] and SA-CCR), is a transformational piece of legislation that will shift trading into a more industrial model. In terms of market risk, FRTB is effectively Basel 4.0, and lays down the structure it expects banks to follow, with significant implications. To comply with it, FIs will have to restructure their core technology infrastructure, placing a greater emphasis on scalability and repeatability. Increasing regulatory requirements, and demand for specific tests and analysis, will also increase the volumes of data that sell-side firms have to deal with.
Buy-side risk management technologyEnterprise-wide solutions for a strategic edge
In a fragmented market with heightened competition, low interest rates, low returns, and regulatory scrutiny, buy-side firms increasingly view risk management technology as a strategic, enterprise-wide capability that can make them stronger and more competitive. They now also tend to emphasize processes that enhance investment strategies, diversify risk, and create a best-practice platform for analyzing markets, credit and liquidity risk management. All this forms a backdrop to several key shifts in the market:
• Buy-side firms are increasingly incorporating risk into the whole value chain, boosting value and enabling them to better align investors with their desired risk appetite. The role of the Chief Risk Officer has also become more salient, as firms realize the added value that risk analysis brings.
• Risk as a Service (RaaS) models continue to grow in popularity, largely because many buy-side firms can’t create in-house solutions. Several vendors have embraced RaaS, and provide a variety of offerings, from Cloud solutions to managed services with full Business Process Outsourcing (BPO).
• Operational and market structures are changing. Buy-side firms are turning to risk data aggregation systems, and looking for new enterprise-wide and hybrid ways to implement risk management technology. But there is still a time lag between the point at which a buy-side firm takes on exposure and the point at which the risk management system reports it, so there is a continuing drive toward intra-day reporting.
• More pressure from regulators and investors remains a key driver. Investors, for their part, now expect a high level of transparency. Firms are also anticipating several things:
– A drip-down effect of BCBS 239.
– The need to prepare for increased risk data aggregation capabilities.
– A heightened focus on capital and liquidity, particularly for insurance firms.
Enterprise collateral management systems for the trading bookRegulations and technology creating a febrile market
Four key developments are shaping the landscape for collateral management systems:
• Stricter regulatory demands. Regulators’ influence in this market is now stronger than ever. The procedures by which FIs enter collateral agreements, repurpose collateral, maintain their liquidity balance and trade volatile and complex derivatives are now much stricter.

© Copyright Chartis Research Ltd 2016 | All Rights Reserved12
• The need for more sophisticated collateral management. Collateral is no longer seen just as something that reduces the potential for benefit in line with risk. Firms that manage their collateral well now have more opportunities to generate revenue directly.
• The role of technology in linking silos in FIs. As the traditional siloed view of firms breaks down, the need to provide more, faster, timely data to a larger audience with varying specialist knowledge is placing serious demands on technology. This is pushing FIs to re-architect their systems, whether they’re internal systems or provided by third parties.
• Changes in the supply-side landscape as the drive for efficiency takes hold. FIs expect their systems to be able to handle the new requirements they have to meet, and to handle their processes in the most efficient way possible. The pressure is on suppliers to offer full, optimized solutions, and this could transform the vendor landscape.
Financial crimeFinancial crime risk management systemsMore risks, more challenges
In financial crime new risks appear constantly, but the old ones don’t go away. As FIs battle with existing challenges, new ones continue to emerge, such as managing huge and ever-increasing amounts of data, and a lack of people with expertise in Financial Crime Risk Management (FCRM). On the positive side, Financial Intelligence Units (FIUs) are starting to prove their worth, now processing data from multiple sources, and offering some standardization across businesses, geographies and specific crimes.
FraudChanging business models need new approaches
Tackling credit, debit and wire fraud is still a priority for FIs everywhere, and payments fraud remains a big issue across the market. Check fraud still leads to significant losses, particularly in the Americas. Continued growth in internet and mobile banking has made it harder and more complex for FIs to stay secure, but many still use fraud detection methods built for earlier times.
The analytics they must now use to counter fraud range from simpler scorecard approaches to more complex predictive modeling and Artificial Intelligence solutions.
Mobile finance is a notable trend: in some developing markets, mobile banking is supplanting retail banking among the ‘unbanked’, and more ‘co-opetition’ between mobile payment providers and traditional banks is creating a new payments model, with its own issues. Anti-fraud systems must now align the security systems of banks and mobile firms, often under constraints on time and the information that can be shared.
Anti-money-launderingStill a priority; suitable technology needed
Anti-money-laundering (AML) is still a priority for FIs, and a growing number of international regulations are pushing up demand for appropriate technology. These include the Fourth European Union (EU) Anti Money Laundering Directive, and the Financial Action Task Force (FATF) Guidance for a Risk-Based Approach for the Banking Sector. Regulations are also helping to boost demand for AML and sanctions-monitoring systems among corporations and non-financial-services companies such as casinos.
Know your customerMoving from manual takes the right planning and solutions
Know Your Customer (KYC) processes, now frequently required by law, are a big challenge. FIs often take an inefficient and error-prone manual approach, but can address the problem by investing time and effort in the right planning, scoping and solutions. As well as authenticating their customers’ identity and rating their risk, FIs need ongoing due diligence using analytics that can monitor transactions for illegal activity. Finally, FIs must integrate their optimized KYC systems seamlessly into their end-to-end customer life-cycle, and use open communication architectures.
Watch-list filteringKnow the law, and keep lists up to date
FIs should continuously update their watch lists to include a variety of potentially threatening

© Copyright Chartis Research Ltd 2016 | All Rights Reserved 13
countries and individuals, and must be able to apply this information in real time. One challenge for screening solutions is how to deal with different spellings of names and locations, while avoiding too many false positives or negatives.
FIs must be completely aware of all sanctions and regulations in any jurisdiction they do business, to avoid heavy fines for violating them. In some cases, abuses have been approved at the highest levels and have continued for years; some banks have even treated fines as a cost of doing business. But certainly in the US, FIs that continue to break the law risk losing their ability to clear US dollar transactions.
Cyber-risk management in financial servicesMove to managing cyber risk
Recent high-profile cyber attacks have made cyber risk a priority for FIs. New technologies have given cyber criminals new attack routes, and persistent threats from organized crime groups and even nation states undermine firms’ claims of impenetrability.
Regulators are demanding more cyber-related compliance from organizations as diverse as telecom companies and hotel chains, with stiff penalties for those that don’t conform. So far, FIs have largely escaped significant regulatory censure, but this will change once there’s a fining precedent.
Unsurprisingly, FIs are investing in cyber-risk management solutions (now a $1.9bn market), but this expenditure is often tactical, siloed and non-standardized. Their approach should now be more about managing cyber risk; cyber security must become a tactical subset of a firm-wide strategic risk management framework. But cyber security and risk management technologies have largely evolved separately. There has been a move to integrate cyber-security data into financial crime and GRC networks, but this is still a relatively minor development.
FIs must also be able to quantify cyber risk, to protect themselves from attack, and to justify their business decisions to regulators. However, most are barely starting to move toward proper cyber-risk management. To do so, they should
focus first on parts of the process that are relatively easy to implement: establishing clear lines of communication between risk and cyber-security staff, and developing processes to deliver cyber-security information to the board. Best practices will depend on how much data is shared between FIs, and the way that individual risk silos or third parties are handled. Boardroom support is essential for any policy to thrive.
Enterprise Risk Management in insuranceFrom compliance to performance
The big driver for Enterprise Risk Management (ERM) in the insurance sector in recent years has been regulation – largely Solvency II (in Europe) and its equivalents in the US and elsewhere. For most insurers globally, however, the flurry of troublesome compliance activity is over, and they are now looking for ways to turn the regulatory-driven changes in their risk-management structures to their advantage. Other global dynamics – not least the low interest rate environment and specific geographical factors – are creating ripple effects of their own, as insurers seek out new business on both the claims and investment sides of their operations.
ERM is a potential game-changer for insurers, but most are still feeling the residual effects of having to comply with the law. The post-regulation environment is complex, and many insurers – although by no means all – are investing in ways to streamline their operations and portfolios to make them more effective and profitable. Most realize that data provides a real opportunity – and insurers have plenty of data to work with. But, echoing a common theme, data management is a big issue, as insurers strive to become more predictive about potential claims, and/or exploit their customer data for better returns. Most insurers are still struggling with data integration, and those looking to make new investments will need new tools to assess the extra risks they may be taking on. But finding the right technologies – and the people to use them – is an ongoing challenge.
© Copyright Chartis Research Ltd 2016 | All Rights Reserved14
Commodity and energy tradingCommodity Trading Risk Management systemsMore consolidation in a complex market
As trading firms’ focus shifts from pure derivatives to a more derivative/physical mix, vendors are enhancing the functionality of their offerings, blurring the line between Commodity Trading Risk Management (CTRM) and Enterprise Resource Planning (ERP) solutions. CTRM offerings can now help firms develop their strategies and identify new opportunities.
The complexity within the CTRM marketplace makes it difficult for any one vendor to cover all types of assets and analytics. Vendors tend to specialize in a few related commodities, despite merger and acquisition-led consolidation in the market. As this consolidation continues, and smaller niche vendors are snapped up by larger vendors to fill gaps in their capabilities, more vendors will offer broader coverage.
Producers, processors and end users of physical commodities are increasingly adopting CTRM solutions, as these offerings take on more functionality that is geared toward supply chains. And compared to more traditional CTRM users, these buyers often prefer solutions that are more suited to firms with relatively small HR departments, further spreading the vendors’ focus.
Meanwhile, changes to regulations are creating an uncertain world for commodities traders, putting pressure on them to implement new processes and systems at a time when commodity prices are generally low, and profit margins slim. Many firms want lightweight, affordable solutions to ensure compliance in the first instance, with a view to gradually upgrading their systems.
Energy Trading Risk Management systemsBecoming more central as firms shift to physical assets
Many of the dynamics in the Energy Trading Risk Management (ETRM) space echo those in CTRM. ETRM solutions’ enhanced capabilities now give them much of the functionality normally
found in ERP systems. Consequently, many firms are starting to give their ETRM solutions a more central role, in areas such as determining strategies, optimizing assets, fulfilling their accounting requirements, and providing universal data stores.
ETRM solutions that cover a range of physical commodities require access to multiple data sources covering aspects such as pricing, processing costs and efficiency, warehouse space, shipping fees, and losses during transit. The growing demand for data has made big successes of many specialist suppliers, including large data firms that aggregate data from other sources, and smaller firms that gather data directly, often using advanced technology.
Again largely because of FIs’ shift in focus toward physical assets, credit risk is featuring more in ETRM solutions, increasing their appeal. The volatility of physical energy commodities means that default rates are often high or uncertain, boosting the value of credit risk analytics. As a result, many vendors are now building integrated credit risk solutions into their ETRM offerings.
The regulators, meanwhile, are emphasizing improvements in trade surveillance and transparency via regular reporting, as stipulated by legislation such as Market Abuse Regulation (MAR), Regulation on Wholesale Energy Market Integrity and Transparency (REMIT), and the Dodd-Frank Act. This growing demand for transparency is not new to financial services. But so far it has not been enforced in energy trading firms, so only a few have trade surveillance processes already in place
Enterprise Governance, Compliance and Operational RiskSophisticated demands, dangerous disconnects
The desire to link risk and compliance to performance is still strong across industries, and the convergence of Governance, Risk and Compliance (GRC) functions with finance functions continues apace. The impact of Big Data continues to shape the way that solutions work, and Artificial Intelligence, Natural Language Processing, Real-Time Processing and Supercomputing are all making their presence felt in top-tier FIs and organizations.

© Copyright Chartis Research Ltd 2016 | All Rights Reserved 15
Still of vital importance, however, is the notion of ‘connected GRC’ – but this level of integration across the enterprise requires cutting-edge data management, business intelligence and analytics. Some sections of the marketplace have underestimated the level of technology innovation required, retreating instead into the relative security of silo-based approaches. Supply-side firms, meanwhile, continue to take a traditional selling approach that is increasingly out of touch with those end-user companies out on the leading edge.
OpRisk measurement for banks: flawed regulations based on flawed models
In March 2016, the Basel Committee proposed the Standardized Measurement Approach (SMA) to operational risk, as an alternative to the Advanced Measurement Approach (AMA). According to the Committee, the SMA provides a single method for estimating operational risk capital that is not model-based. Building on the simplicity and comparability of a standardized approach, SMA also includes the risk-sensitivity of a more advanced method.
Future historians may conclude that the SMA consultation was the point at which the conceptual soundness of operational risk modeling ceased to matter. The decision to abolish the AMA seems to be about complexity: there is considerable variation in the preferred approaches banks use to combine the four elements of operational risk defined in Basel Pillar 1. SMA is the Committee’s attempt to smooth out the variables and simplify the banks’ approach.
IFRS 9 technology solutionsA successful marriage embraces change
In the worlds of finance and risk, International Financial Reporting Standard (IFRS) 9 is little short of transformational for most FIs. Since its inception, an uneasy courtship between finance and risk has finally blossomed into a powerful and successful partnership. IFRS 9 also shares common foundations with a number of other regulations encouraging FIs to invest in sustainable best practice.
For most FIs, implementing and running IFRS 9 means change – in particular the closer participation of departments with little previous finance-related involvement. Large FIs’ complex
structures will require big in-house development, implementation and operations teams, with support from external advisers. Other FIs can rely on packaged software, but they will still require close support from the big audit firms – and extra consultants, developers and integrators. But throughout 2016 and 2017 suitably experienced support teams will be in relatively short supply.
Market players generally are turning to software vendors, most of which have little previous experience of the new risk/finance pairing. ‘One-stop’ packages covering the whole accounting process are relatively rare, encouraging many integrated, multi-vendor solutions. And few complete packages reflect FIs’ target operational state, so early solutions’ success will depend largely on vendors’ credibility and trust.
Crucially, though, because IFRS 9 shares common foundations with other regulations, FIs can get their projects off to a good start if they have already succeeded in addressing similar issues, namely BCBS 239, stress testing, enterprise credit and counterparty risk management.
Risk as a ServiceThe search for clarity in a dynamic, competitive market
Risk as a Service (RaaS) solutions in some form have been available for a while, but now cover a broad range of delivery and usage options, including Software as a Service, BPO, managed services and risk platforms. Vendors and users often use these concepts interchangeably when talking about RaaS, so anyone involved with it must:
• Specify how particular RaaS options deliver the service or technology.
• Understand how much flexibility end users have in how they use RaaS, and how they access, manage and control their particular solutions.
On the demand side of the market, firms have been especially responsive to the idea of managed services, partly because these services are a logical extension of the significant levels of outsourcing they already employ. Buy-side firms are also becoming more structurally complex, stretching their resources as they embrace more analytics and a broader range of assets.

© Copyright Chartis Research Ltd 2016 | All Rights Reserved16
Data is a big issue, across the market. For many customers, having the flexibility to construct and shape the derived data that goes into their RaaS models is a bug, not a feature (users want a derived data package that solves all their problems, not one that puts the onus of data cleansing onto them). Indeed, for the vast majority of RaaS users, acquiring standardized, cleaned, derived data that perfectly matches the analytics they need is a huge undertaking.
Finally, risk analytics (particularly in the buy side and in wealth management) are now embedded in a range of processes (such as market data collection, order management, securities processing and clearing). This is opening up the RaaS landscape to a variety of new vendors, many of which already sell a range of ‘services’, or offer service-like platforms that deliver trading, market data or wealth management services.
Artificial Intelligence in risk managementThink carefully, use appropriately
Many of the terms used to describe the much-hyped phenomenon of ‘intelligent machines’ – Machine Learning, Deep Learning, Cognitive Computing and so on – are used loosely, often with considerable overlap. Artificial Intelligence (AI) is an umbrella term to describe a multi-disciplinary subject that combines elements of computer science, mathematics, psychology, linguistics and data science.
Machine Learning is one branch of AI – a particular type of computational statistics that works well in environments that can provide a large number of time-series datasets. The exponential growth in computing power and the availability of more data have increased the power of these systems. Nevertheless, contrary to hype, they only work well in some contexts.
Concurrent technology trends, Open Source and the Cloud, are making this software category more easily available, so it’s vital to understand why and how AI’s algorithms are being applied. One immediate opportunity for ‘virtual robots’ is in risk and compliance, carrying out thousands of standardized checks, reducing the number of errors, and making significant cost savings.
Finally, behind every piece of AI is a model, and FIs will have to prove the integrity of these models – that they’re making the right decisions. This unintended consequence of intelligent machines emphasizes how important it is to think carefully about them.
Open Source in risk managementFrom free software to fast standards
The Open Source movement has become a powerful way to develop software: in the coming years it is likely to be the dominant approach in many business categories. The entire software stack – operating systems, databases, middleware and analytics – is now available as Open Source, or has an Open Source equivalent. And as Open Source and the Cloud intersect, ever more software will be visible to buyers and users, increasing transparency, and putting pressure on some software companies to improve their development practices or adapt their licensing models.
In recent years, Chartis has seen the application of open-source technology stacks to a variety of risk-management requirements, including buy-side risk analytics, the calculation of regulatory capital, and enterprise fraud
RiskTech vendorsMergers, acquisitions and partnerships continue apace among vendors in the risk and compliance technology market. These deals range from large to small; some focus on filling product and technology gaps, while others are driven by the need to defend market share and acquire new clients. Below is a representative list (selected by Chartis) of deals announced in the past 12 months:
• Broadridge acquires 4sight.
• Bridgepoint and Summit Partners acquire Calypso.
• IHS and Markit merge.
• Axioma acquires ConceptONE.
• Fiserv acquires ACI Worldwide Community Financial Services assets.
• BISAM acquires FinAnalytica.

© Copyright Chartis Research Ltd 2016 | All Rights Reserved 17
• StatPro acquires Investor Analytics.
• Bloomberg acquires Barclays Risk Analytics and Index Solutions.
• Dell acquires EMC (RSA).
• Equiniti acquires KYCnet.
• Wolters Kluwer acquires Enablon.
Leading risk technology vendors are focusing their growth strategies on the following initiatives:
• Cloud-based risk and compliance as a service.
• ‘Big Data’ and non-relational database technologies, and a move toward artificial intelligence and machine learning.
• ‘Toolkit’-based solutions targeted at end users. These solutions bypass internal IT departments, reducing ‘time to compliance’.
• Managed service and utility-based offerings through strategic partnerships.
• Open-Source technology stacks and agile architectures.

© Copyright Chartis Research Ltd 2016 | All Rights Reserved18
Corporate misconduct — individual consequences
About this surveyBetween October 2015 and January 2016, our researchers, Ipsos MORI, conducted 2,825 interviews in the local language with senior decisionmakers in a sample of the largest companies in 62 countries and territories. The polling sample was designed to target those responsible for tackling fraud, including C-suite, general counsel and heads of internal audit.
Global enforcement focuses the spotlight on executive integrity
This article is excerpted from EY’s 14th Global Fraud Survey, published in April 2016.
Combating corruption as a global priorityThe global focus on anti-corruption has never been greater. Cross-border cooperation by regulators and law enforcement agencies is increasing the pressure on those who seek to gain advantage through fraudulent or corrupt means. The transnational nature of the issue led the G20 major economies to recognize bribery and corruption as an important impediment to economic growth, and the group’s focus on corruption has continued under its Chinese presidency in 2016. It has identified key areas where economies and multinational organizations must strengthen their cooperation.
Among the issues identified, the G20 highlighted the abuse of legal and corporate structures to hide or conceal criminal activity as a “critical issue in the global fight against corruption”. It committed to increasing transparency over the
beneficial ownership of companies and assets through the application of international standards. The World Bank too is aligned with the G20 approach, issuing guidance in 2015 requiring greater beneficial ownership transparency in its contracting processes.
In this context, our 14th Global Fraud Survey finds overwhelming support for business ownership transparency — with 91% of respondents agreeing it is important to understand the ultimate beneficial ownership of the entities with which they do business.
Our survey also finds that many respondents still maintain the view that fraud, bribery and corruption are other people’s problems, despite recognizing the prevalence of the issue in their own countries. There remains a worryingly high tolerance or misunderstanding of conduct that can be considered inappropriate — particularly among respondents from finance functions.
Our survey also shows that the conduct of individual executives is now clearly in the spotlight. Eighty-three percent of respondents agree that prosecuting individual executives will help deter fraud, bribery and corruption. This is supported by the behavior of regulators who are also increasingly focusing their investigations on individual culpability when looking at corporate misconduct. Firms are encouraging their staff to raise their concerns over unethical behavior, but many employees are still reluctant to do so. In such an environment, the data that a company holds can be the key to identifying instances of potential impropriety.
Ongoing challenges of bribery and corruptionDespite the sharp focus of governments on bribery and corruption, and the increasingly coordinated efforts to manage it, the scale of misconduct remains significant. In our survey, 39% of respondents consider bribery and corruption to happen widely in their country. The situation appears to have deteriorated in
© Copyright Chartis Research Ltd 2016 | All Rights Reserved 19
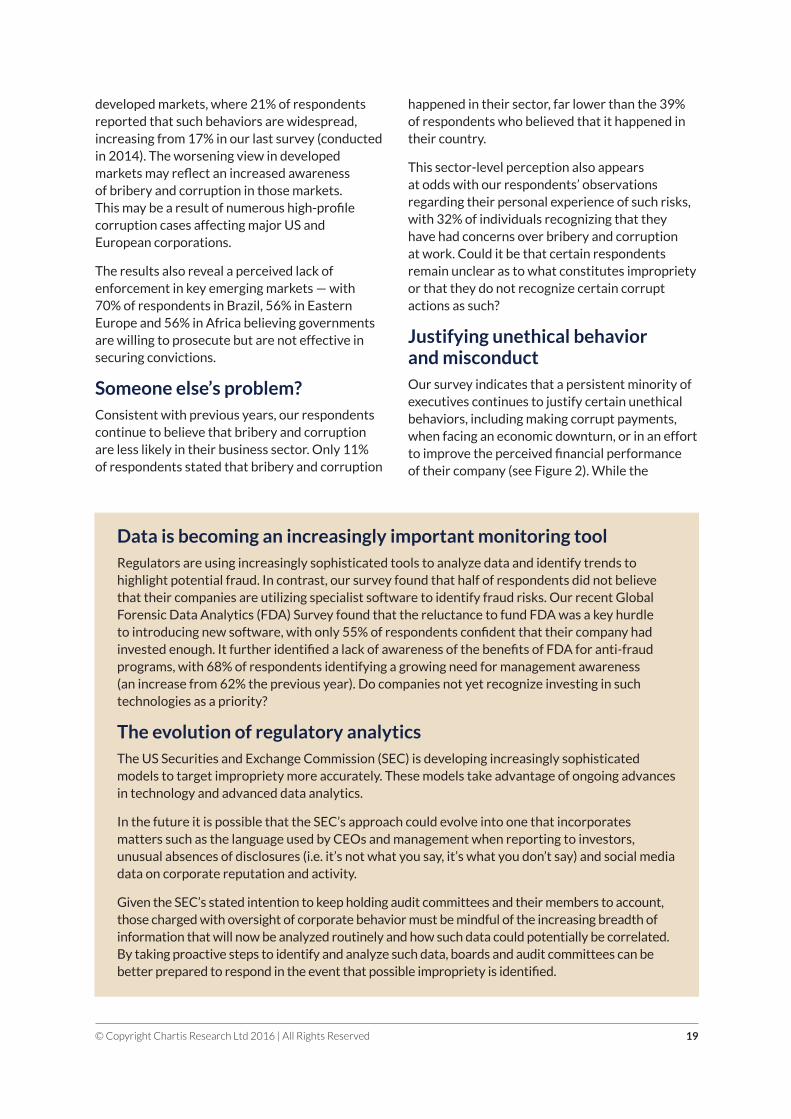
Data is becoming an increasingly important monitoring toolRegulators are using increasingly sophisticated tools to analyze data and identify trends to highlight potential fraud. In contrast, our survey found that half of respondents did not believe that their companies are utilizing specialist software to identify fraud risks. Our recent Global Forensic Data Analytics (FDA) Survey found that the reluctance to fund FDA was a key hurdle to introducing new software, with only 55% of respondents confident that their company had invested enough. It further identified a lack of awareness of the benefits of FDA for anti-fraud programs, with 68% of respondents identifying a growing need for management awareness (an increase from 62% the previous year). Do companies not yet recognize investing in such technologies as a priority?
The evolution of regulatory analyticsThe US Securities and Exchange Commission (SEC) is developing increasingly sophisticated models to target impropriety more accurately. These models take advantage of ongoing advances in technology and advanced data analytics.
In the future it is possible that the SEC’s approach could evolve into one that incorporates matters such as the language used by CEOs and management when reporting to investors, unusual absences of disclosures (i.e. it’s not what you say, it’s what you don’t say) and social media data on corporate reputation and activity.
Given the SEC’s stated intention to keep holding audit committees and their members to account, those charged with oversight of corporate behavior must be mindful of the increasing breadth of information that will now be analyzed routinely and how such data could potentially be correlated. By taking proactive steps to identify and analyze such data, boards and audit committees can be better prepared to respond in the event that possible impropriety is identified.
developed markets, where 21% of respondents reported that such behaviors are widespread, increasing from 17% in our last survey (conducted in 2014). The worsening view in developed markets may reflect an increased awareness of bribery and corruption in those markets. This may be a result of numerous high-profile corruption cases affecting major US and European corporations.
The results also reveal a perceived lack of enforcement in key emerging markets — with 70% of respondents in Brazil, 56% in Eastern Europe and 56% in Africa believing governments are willing to prosecute but are not effective in securing convictions.
Someone else’s problem?Consistent with previous years, our respondents continue to believe that bribery and corruption are less likely in their business sector. Only 11% of respondents stated that bribery and corruption
happened in their sector, far lower than the 39% of respondents who believed that it happened in their country.
This sector-level perception also appears at odds with our respondents’ observations regarding their personal experience of such risks, with 32% of individuals recognizing that they have had concerns over bribery and corruption at work. Could it be that certain respondents remain unclear as to what constitutes impropriety or that they do not recognize certain corrupt actions as such?
Justifying unethical behavior and misconductOur survey indicates that a persistent minority of executives continues to justify certain unethical behaviors, including making corrupt payments, when facing an economic downturn, or in an effort to improve the perceived financial performance of their company (see Figure 2). While the

© Copyright Chartis Research Ltd 2016 | All Rights Reserved20
Figure 2: Unethical behaviors, regional differencesbehaviors that these respondents can rationalize differ between regions, they should be deeply concerning to all companies.
Spotlight on CFOsDeeper analysis of our survey results identifies that many respondents who are CFOs and finance team members, individuals with key roles in protecting companies from risks, appear ready to justify unethical conduct.
Almost half of all finance team members interviewed stated that they would be prepared to engage in at least one form of unethical behavior to meet financial targets, a greater proportion than the 36% that could justify such behavior to help a company survive in an economic downturn (see Figure 3). Our survey also suggests that finance teams do not appreciate the extent of the threat posed by evolving external risks, such as cybercrime, with only 41% of CFOs viewing it as a concern.
Given the subjective nature of the accounting judgments often required when preparing financial reports, it is perhaps unsurprising that members of finance teams can rationalize some actions that might help their companies to meet financial targets as falling within a ‘grey’ area. However, given the potential impact that such behaviors could have on a company, and the reliance that boards place on CFOs and finance teams to provide them with accurate financial information, these results are worrying.
Executive misconduct under the spotlightThe continued prevalence of such unethical behavior places businesses at risk of illegal conduct, which could lead to subsequent enforcement action. Board members and companies’ audit committees should be aware that regulators are focusing on these behaviors, and that they and their employees are under increased personal scrutiny in matters in which, in the past, only the company might have been held accountable. A 2015 memorandum issued by the Deputy Attorney General of the United States, Sally Yates (‘the Yates Memo’), detailed steps that prosecutors will take to strengthen their pursuit of individuals.
Regarded by some as a response to criticism about the lack of executives held accountable for
the financial crisis, the Yates Memo prioritizes individual prosecutions. The memo states that individual prosecutions are one of the most effective ways to combat corporate misconduct.
Furthermore, in April 2016, the US Department of Justice (DoJ) announced the introduction of a one-year pilot program which will make companies that come forward and cooperate with it fully – including identifying culpable individuals – eligible for a 50% reduction in fines and potentially avoid being subject to a court-appointed monitor.
These policy initiatives are consistent with recent enforcement trends, with 175 individuals charged by the SEC for financial reporting violations in
Source: EY

© Copyright Chartis Research Ltd 2016 | All Rights Reserved 21
the past two years. In light of the increased focus on the prosecution of individuals, especially in combination with the SEC’s continuing effort to incentivize whistleblowing, companies can increasingly expect their executives to have a clear incentive to cooperate with regulators.
The trend is global. In January 2015 the Serious Fraud Office (SFO) announced its first successful prosecution for an individual under the UK Bribery Act, and it continues to investigate individual executives among its active cases. Many other jurisdictions in Europe, Asia and South America are taking similar actions.
Our survey found that the majority of our respondents support this type of action, with 83% of respondents viewing enforcement against management as an effective deterrent.
The spotlight on individuals places additional pressure on boards. Boards should confirm that their company’s compliance and investigations functions are sufficient and independent enough to manage such eventualities and that procedures are in place when necessary to protect the functions’ independence. If not, companies may receive little or no cooperation credit in any eventual settlement.
In this evolving context, board members need to recognize that they may be held accountable in the event that fraud or impropriety happen under their watch. They must therefore be alert to the potential risks their companies face and how they can demonstrate that they have responded appropriately.
Bolstering defensesWith a significant minority of global executives willing to justify unethical activity, and given increased enforcement efforts of regulators, boards need to continuously assess their ability to identify and mitigate fraud, bribery and corruption risk.
Such actions take on particular importance as companies enter emerging markets such as Africa, Brazil, China, India and Eastern Europe, where they may be exposed to heightened risks. Companies need to continually update their risk management policies and procedures so that they are able to identify new risks and respond to new challenges.
To identify and mitigate risks, companies should utilize both traditional and innovative fraud detection tools. Whistleblowers are often a
0 10 20 30 40 50
Figure 3: Spotlight on finance
Source: EY
Base: Global (2,825); CFO/FD (655); Other Finance (769)
Which, if any, of the following do you feel can be justified if they help a business survive an economic downturn?
Offering entertainment
Cash payments
Personal gifts or service
Misstate financial performance
At least one of these
Global
CFO/FD
Other Finance
24%
13%13%
16%
12%13%
15%
4%3%
7%
36%36%
46%
24%32%

© Copyright Chartis Research Ltd 2016 | All Rights Reserved22
Figure 4: Why don’t executives report unethical conduct?
critical source of information to identify alleged misconduct. Recognizing this fact, regulators are adopting new tools to support and encourage individuals to come forward. In the US, for example, the Dodd-Frank Act provides financial incentives for whistleblowers to provide information. And the SFO actively encourages company insiders to provide it with information at the start of any investigation. Such efforts appear to have paid off – last year the SFO received more tips from whistleblowers than from self-reports.
While 55% of companies have whistleblowing hotlines in place, however, companies should not assume that such mechanisms are always effective. There remain obstacles to the use of internal reporting channels. Almost half of our survey respondents in Kenya and Nigeria, for example, said they would fear for their personal safety if they reported concerns internally.
Beyond safety fears, respondents highlighted their loyalty to the company as one of the main deterrents to reporting an incident of fraud, bribery or corruption. Globally, 19% of our respondents cited loyalty to their company and 18% cited loyalty to their colleagues as impacting them in this way (see Figure 4). These issues were more prevalent in emerging markets, with 24% of respondents citing loyalty to their company and 22% citing loyalty to their colleagues as a factor.
Boards need to recognize the role that misplaced loyalty can play in stopping people from coming forward with their concerns and hiding unethical behavior. They must also lead by example and demonstrate the same behaviors that they expect of their employees and their business partners. Executives need to be aware that they can raise uncomfortable issues without being seen as disloyal; the absence of such openness can cause far more harm than good. Some of the regional findings from our survey support this notion.
• According to a representative of one of the leading companies we interviewed in Eastern Europe, in their experience most people want to do the right thing; the key is in making them proud to act ethically.
• Leading companies in India not only have strong policies but are also embedding ethical behavior into their daily business practices,
with teams empowered to do the right thing by a strong tone from the top.
• In Brazil, leading companies measure their employees’ performance against values and behavior, as opposed to purely financial performance – the intention being that the “motivation to cheat decreases and doing the right thing increases”.
Source: EY

© Copyright Chartis Research Ltd 2016 | All Rights Reserved 23
Know with whom you are doing businessDespite record levels of M&A activity in recent years, our survey also finds that respondents are not yet taking potential steps to identify and mitigate key corruption risks before entering into joint ventures or local partnerships.
Businesses should be aware that entering into such partnerships can bring additional risks and that there is appetite from regulators to hold companies responsible for the conduct of any third party acting on its behalf. Regardless of whether the inappropriate conduct is by a company itself or a third party acting on its behalf, there is potential liability for the company.
Foreign Corrupt Practices Act (FCPA) enforcement activity has continued to focus on relationships with third parties, particularly the use of agents to win business in emerging markets. In 2015, the US Securities and Exchange Commission (SEC) and DoJ revised their guidance on the enforcement and application of the FCPA, providing greater clarity on issuers’ obligations to joint ventures and minority-owned affiliates. The revised guidance made it clear that issuers should use “good faith efforts” to influence these entities to devise and maintain a system of internal accounting controls consistent with the issuer’s obligations.
Despite the DoJ’s focus on relationships with third parties, almost one in five respondents are not identifying third parties as part of their anti-corruption due diligence. A greater proportion, more than one in three, are not assessing country or industry-specific risks before an investment.
The overall proportion of respondents undertaking any common anti-corruption due diligence measures has decreased since our last survey. Could this be a product of cost constraints or are companies simply becoming complacent?
What does good look like?With a global focus on combating fraud, bribery and corruption, and regulators scrutinizing executive behavior, companies need to do more. Our survey highlights steps that businesses should take to minimize the risk of corruption in their operations.
• Adequately resource compliance and investigations functions, so that they can proactively engage before regulatory action.
• Establish clear whistleblowing channels and policies that not only raise awareness of reporting mechanisms, but encourage employees to report misconduct.
• Undertake regular fraud risk assessments, including an assessment of potential data-driven indicators of fraud and/or FDA indicators of fraud.
• Develop a cyber breach response plan that brings all parts of the business together in a centralized response structure.
• Undertake robust anti-corruption due diligence on third parties, before entering into a business relationship.
• Execute a comprehensive anti-corruption compliance program that incorporates FDA and tailored bribery and corruption training.
Companies and their boards need to deliver on these priorities. The risks faced by companies as they continue to expand their global reach are evolving, and the scrutiny under which businesses and individuals now come is greater than ever. Boards must respond proactively and be able to demonstrate that they are stepping up to the challenge.

24 © Copyright Chartis Research Ltd 2016 | All Rights Reserved
David Remnitz, Global Leader, FIDS Forensic Technology & Discovery Services
David Remnitz leads the Forensic Technology & Discovery Services team within EY’s Fraud Investigation & Dispute Services (FIDS) practice.
David is internationally recognized in the fields of eDiscovery, data analytics and cyber investigations, assisting companies, their boards and other stakeholders to respond to regulatory and litigation matters. David has served as a founding member of the Electronic Crimes Task Force for the US Secret Service, a member of FBI InfraGard, as well as The Sedona Conference Working Group 1. David has more than 25 years of experience consulting with a number of leading financial services organizations, regulators and law enforcement agencies in jurisdictions around the world.
Jim McCurry, EMEIA and UKI Leader, Fraud Investigation & Dispute Services
Jim McCurry is the EMEIA and UK leader of EY’s Fraud Investigation & Dispute Services practice, and a member of the firm’s EMEIA and UK Assurance Executive Boards.
Having joined EY in 1996, Jim has led numerous high-profile matters in the Americas, including those relating to financial statement fraud, financial services misconduct and transaction forensics. Since relocating to London in 2008, Jim has managed numerous fraud, bribery and corruption-related investigations and compliance engagements in financial services and other sectors.
Chris Sercy, Principal, Fraud Investigation & Dispute Services
Chris Sercy is the co-leader of the EY Fraud Investigation & Dispute Services practice in financial services, based in Charlotte, North Carolina.
Chris specializes in matters pertaining to regulatory and internal investigations, including those related to money laundering, sanctions and other financial crimes. In addition to having served in a Federal regulatory agency, his experience also includes work in investment banking, regulatory compliance and securities transaction technology. Chris brings an in-depth knowledge of banking, capital markets and the associated regulatory requirements necessary to address the financial and accounting aspects of regulatory inquiries and litigation matters.
About the EY contributors

© Copyright Chartis Research Ltd 2016 | All Rights Reserved 25
RiskTech 100® rankings 2017
Rank
2017
Rank
2016
Company HQ Total
score
Functionality Core
technology
Strategy Customer
satisfaction
Market
presence
Innovation
1 1 FIS US 70.5% 85% 74% 60% 60% 77% 67%
2 4 Oracle US 69.2% 80% 79% 65% 60% 67% 64%
3 5 MSCI US 69.0% 70% 70% 72% 65% 70% 67%
4 2 SAS US 68.8% 83% 82% 58% 57% 66% 67%
5 7 Moody's
Analytics
US 67.0% 71% 68% 68% 63% 69% 63%
6 3 IBM US 66.2% 81% 74% 57% 53% 69% 63%
7 8 Murex France 66.0% 69% 70% 67% 61% 66% 63%
8 9 Misys UK 65.7% 76% 69% 61% 59% 69% 60%
9 14 IHS Markit UK 64.5% 71% 69% 66% 58% 61% 62%
10 13 NICE Actimize US 64.3% 66% 62% 67% 57% 70% 64%
11 15 Numerix US 64.3% 58% 57% 74% 68% 65% 64%
12 10 BAE Systems UK 64.2% 69% 65% 60% 62% 61% 68%
13 6 Wolters Kluwer US 64.0% 78% 59% 55% 63% 73% 56%
14 20 Nasdaq US 63.8% 69% 63% 64% 60% 66% 61%
15 11 OpenLink US 63.8% 69% 67% 61% 61% 63% 62%
16 16 FICO US 62.7% 72% 60% 59% 60% 60% 65%
17 19 Thomson Reuters US 62.2% 69% 65% 57% 59% 68% 55%
18 17 MetricStream US 61.0% 60% 58% 64% 59% 68% 57%
19 32 Bloomberg US 60.7% 59% 55% 64% 61% 66% 59%
20 18 Fiserv US 60.5% 68% 63% 52% 64% 61% 55%
21 25 Calypso US 60.5% 65% 65% 60% 56% 59% 58%
22 24 Allegro US 60.0% 61% 60% 61% 60% 59% 59%
23 30 AxiomSL US 59.5% 57% 63% 59% 64% 57% 57%
24 _ LexisNexis Risk
Solutions
US 58.7% 65% 58% 54% 55% 60% 60%
25 26 Quantifi US 58.7% 65% 63% 53% 57% 54% 60%
26 29 SS&C US 58.7% 58% 57% 63% 59% 58% 57%
27 _ Ayasdi US 58.5% 50% 66% 62% 55% 50% 68%
28 63 StatPro UK 58.0% 52% 56% 62% 60% 53% 65%
29 _ Accuity UK 57.8% 58% 54% 56% 60% 65% 54%
30 57 BearingPoint Germany 57.7% 62% 57% 58% 66% 50% 53%
31 28 RSA US 57.7% 59% 55% 54% 56% 65% 57%
32 33 Prometeia Italy 57.5% 59% 55% 57% 68% 48% 58%
33 27 Imagine US 57.5% 61% 58% 54% 59% 55% 58%
34 34 Lombard Risk UK 57.5% 58% 58% 58% 60% 57% 54%
35 21 FINCAD Canada 57.2% 59% 56% 48% 65% 55% 60%
36 49 Intellect India 57.2% 64% 63% 58% 60% 40% 58%
37 59 Axioma US 56.8% 59% 56% 60% 57% 49% 60%
38 43 Gresham UK 56.7% 52% 62% 60% 57% 52% 57%
39 40 Safe Banking
Systems
US 56.2% 48% 56% 50% 70% 50% 63%
40 36 ACI Worldwide US 55.8% 58% 54% 56% 54% 58% 55%

2626 © Copyright Chartis Research Ltd 2016 | All Rights Reserved
Rank
2017
Rank
2016
Company HQ Total
score
Functionality Core
technology
Strategy Customer
satisfaction
Market
presence
Innovation
41 66 Fenergo Ireland 55.7% 58% 58% 59% 55% 50% 54%
42 _ Digital Reasoning US 55.5% 52% 60% 65% 55% 32% 69%
43 _ ICE US 55.3% 56% 57% 56% 58% 45% 60%
44 38 Broadridge US 55.0% 59% 54% 60% 60% 54% 43%
45 31 QRM US 55.0% 61% 50% 48% 54% 59% 58%
46 56 BISAM US 54.8% 60% 55% 48% 55% 46% 65%
47 37 ION Ireland 54.5% 60% 57% 54% 48% 58% 50%
48 72 BlackRock
Solutions
US 54.5% 58% 46% 55% 54% 58% 56%
49 47 EastNets UAE 54.2% 54% 51% 58% 58% 54% 50%
50 45 Protiviti Risk
Technologies
US 54.0% 49% 50% 59% 58% 60% 48%
51 60 ClusterSeven UK 53.8% 50% 57% 60% 63% 41% 52%
52 53 Conning US 53.7% 61% 53% 52% 53% 48% 55%
53 39 Fernbach Luxemburg 53.7% 59% 58% 47% 56% 47% 55%
54 41 RiskVal US 53.7% 57% 58% 50% 53% 47% 57%
55 _ SmartStream UK 53.3% 45% 55% 51% 57% 60% 52%
56 44 Experian UK 53.2% 49% 48% 54% 57% 62% 49%
57 12 SAP Germany 53.0% 63% 66% 50% 50% 40% 49%
58 54 Palantir US 52.8% 52% 58% 46% 53% 48% 60%
59 _ Sageworks US 52.2% 52% 53% 52% 55% 51% 50%
60 42 Bottomline US 52.2% 55% 55% 49% 55% 49% 50%
61 _ Workiva US 52.0% 40% 50% 52% 55% 55% 60%
62 _ Aspect UK 51.3% 51% 54% 59% 53% 35% 56%
63 51 Xenomorph UK 51.2% 53% 60% 45% 60% 30% 59%
64 46 Quartet FS UK 51.2% 41% 58% 52% 60% 46% 50%
65 55 MathWorks US 51.0% 43% 53% 48% 60% 50% 52%
66 65 Brady UK 50.8% 53% 48% 50% 52% 52% 50%
67 52 Verafin Canada 50.8% 54% 50% 45% 63% 40% 53%
68 67 FireEye Netherlands 50.3% 45% 50% 55% 45% 52% 55%
69 50 ACL Canada 50.0% 55% 51% 40% 57% 50% 47%
70 74 Willis Towers
Watson
US 49.7% 50% 50% 45% 54% 54% 45%
71 58 SimCorp Denmark 49.5% 46% 47% 47% 50% 52% 55%
72 69 UBS Delta UK 49.3% 49% 44% 49% 55% 42% 57%
73 98 Linedata France 49.0% 50% 50% 53% 50% 48% 43%
74 70 TMX Group Canada 49.0% 55% 59% 50% 50% 26% 54%
75 62 Asset Control UK 47.8% 30% 60% 47% 51% 50% 49%
76 64 MEGA France 47.7% 50% 52% 45% 45% 49% 45%
77 68 Trintech US 47.7% 45% 48% 40% 51% 55% 47%
78 61 Jack Henry US 47.5% 53% 50% 40% 50% 49% 43%
79 _ Ancoa Software UK 47.2% 48% 55% 50% 50% 25% 55%
80 91 MORS Software Finland 47.2% 60% 60% 30% 63% 25% 45%
81 77 Savvysoft US 47.0% 46% 46% 45% 56% 39% 50%
82 _ Message
Automation
UK 46.7% 30% 55% 55% 57% 30% 53%
83 _ Avaro Solutions US 46.3% 48% 52% 49% 48% 27% 54%
84 93 CustomerXPs India 46.3% 57% 51% 42% 47% 34% 47%

© Copyright Chartis Research Ltd 2016 | All Rights Reserved 2727
Rank
2017
Rank
2016
Company HQ Total
score
Functionality Core
technology
Strategy Customer
satisfaction
Market
presence
Innovation
85 73 AIM Software Austria 46.2% 35% 58% 45% 50% 46% 43%
86 87 Vadis Belgium 46.2% 56% 48% 45% 42% 37% 49%
87 _ Equiniti Netherlands 45.8% 47% 48% 50% 50% 30% 50%
88 84 Loxon Hungary 45.8% 55% 52% 38% 50% 40% 40%
89 _ CaseWare
Analytics
Canada 45.8% 48% 48% 45% 48% 48% 38%
90 75 eFront France 45.7% 54% 48% 45% 48% 35% 44%
91 78 Reval US 45.7% 47% 44% 45% 48% 44% 46%
92 _ Technancial UK 45.0% 52% 50% 41% 50% 25% 52%
93 99 CIMCON US 44.7% 45% 45% 43% 55% 39% 41%
94 86 Rockall
Technologies
Ireland 44.7% 40% 55% 35% 58% 30% 50%
95 71 BPS Resolver Canada 44.5% 45% 52% 40% 50% 35% 45%
96 _ CloudMargin UK 44.5% 30% 55% 57% 52% 27% 46%
97 _ ZEB Germany 44.3% 62% 55% 37% 40% 27% 45%
98 _ RiskSpan US 44.3% 48% 53% 45% 50% 30% 40%
99 97 Pegasystems US 42.7% 25% 45% 53% 50% 40% 43%
100 89 Temenos Switzerland 42.5% 40% 40% 47% 49% 40% 39%

© Copyright Chartis Research Ltd 2016 | All Rights Reserved28
Category winners
Solution categories:• Credit Risk: Moody’s Analytics
• Market Risk: FIS
• Pricing & Valuation: Numerix
• Liquidity Risk & ALM: QRM
• Energy Trading: OpenLink
• Commodity Trading: Allegro
• Financial Crime: NICE Actimize
• Cyber Risk: BAE Systems
• Operational Risk & GRC: Nasdaq
• Regulatory Reporting: Wolters Kluwer
• Risk & Finance Integration: Oracle
• Risk Data Aggregation & Reporting: Oracle
• Enterprise Stress Testing: Moody’s Analytics
• Model Risk Management: SAS
• Artificial Intelligence: Ayasdi
• XVA: Quantifi
• Data Integrity & Control: Gresham
• Enterprise Collateral Management: Murex
• Risk as a Service: MSCI
Industry categories:• Banking: SAS
• Sell-Side: Murex
• Buy-Side: MSCI
• Insurance: FIS
• Corporations: MetricStream
Chartis categories:• Functionality: FIS
• Core Technology: SAS
• Customer Satisfaction: Safe Banking Systems (SBS)
• Strategy: Numerix
• Innovation: Digital Reasoning
• Market Presence: FIS

© Copyright Chartis Research Ltd 2016 | All Rights Reserved 29
Appendix A: Research methodology
Chartis’s RiskTech100® report is the most comprehensive study of its kind, and is a core element of our annual research cycle. The rankings in the report reflect our analysts’ expert opinions, along with research into market trends, participants, expenditure patterns and best practices. We started collecting the data for this study in January 2016, and validated the analysis through several phases of independent verification.
Figure 5: RiskTech100® research methodology
• Performed a market sweep of 50,000 risk and compliance technology buyers and end users globally (70% in financial services; 30% in non-financial services).
• Completed 1,500 surveys and interviews with risk technology buyers and end users.
• Collected data on organizations’ expenditure priorities and vendor preferences.
• Collated 400 completed questionnaires, briefing documents and product specifications from risk technology vendors.
• Conducted and attended 200 interviews, product demonstrations and strategy briefings with risk technology vendors.
• Conducted 130 interviews with risk technology buyers to validate our survey findings.
• Conducted 53 interviews with independent consultants and systems integrators specializing in risk technology.
• Applied RiskTech100® assessment criteria to filter the top 150 vendors.
• Reviewed data with 30 independent consultants and 110 risk technology buyers.
• Interviewed 60 ex-employees of the top 50 risk technology vendors to validate our findings.
• Undertook final data validation with 108 vendors, receiving 90 completed questionnaires and 50 vendor briefings.
• Completed 100+ independent reference checks to validate vendor claims and client satisfaction levels.
• Developed the final top 100 rankings, identified the category winners and finalized the report.
Source: Chartis Research
Jan-May 2016
June-July 2016
Aug-Sept 2016
Sept-Oct 2016

© Copyright Chartis Research Ltd 2016 | All Rights Reserved30
Appendix B: How to read the RiskTech100® rankings
• Depth of functionality (0.5). The level of sophistication and detailed features in the software product. Aspects assessed include: innovative functionality, practical relevance of features, user-friendliness, flexibility and embedded intellectual property. High scores are given to those firms that achieved an appropriate balance between sophistication and user-friendliness. In addition, functionality that links risk to performance is given a positive score.
• Breadth of functionality (0.5). The spectrum of risks covered as part of an enterprise risk management solution. The risk spectrum under consideration includes treasury risk management, trading risk, market risk, credit risk, operational risk, energy risk, business/strategic risk, actuarial risk, asset-liability risk, financial crime and compliance. Functionality within and integration between front-office (customer-facing) and middle-back office (compliance, supervisory and governance) risk management systems are also considered. High scores are given to those firms achieving (or approaching) integrated risk management – breaking the silos between different risk management functions.
• Chartis evaluates a vendor’s overall technology stack by benchmarking it against latest best practice. Key considerations this year have been the use of Cloud and Big Data technologies, as well as the agility and openness of the overall technology architecture.
• Data management (0.4). The ability of enterprise risk management systems to interact with other systems and handle large volumes of data. Data quality is often cited as a critical success factor, and ease of data access, data integration, data storage and data movement capabilities are all important factors.
• Risk analytics (0.35). The computational power of the core system, the ability to analyze large amounts of data in a timely manner (e.g., real-time analytics), and the ability to improve analytical performance are all important factors.
• Reporting and visualization (0.25). The ability to surface risk information in a timely manner. The quality and flexibility of visualization tools, and their ease of use, are important for all risk and compliance management systems.
Functionality
Core technology
The RiskTech100® assessment criteria comprises six equally weighted categories:
Table 1: RiskTech100® assessment criteria (sub-category weightings are shown in brackets)
Within each category, we have weighted a number of sub-categories according to the level of importance end users and system integrators attach to these aspects of risk technology provision (see Table 1).
• Functionality
• Core technology
• Strategy
• Customer satisfaction
• Market presence
• Innovation

© Copyright Chartis Research Ltd 2016 | All Rights Reserved 31
• Vision and leadership (0.3). Market understanding, a scalable business model, product strategy, technology strategy and go-to-market strategy are critical success factors. Both organic and inorganic growth strategies are considered, as well as strategic alliances and partnerships.
• Ability to execute (0.4). The size and quality of the sales force, the sales distribution channels, the global footprint, partnerships, differentiated messaging and positioning are all important factors. Specific consideration is given to the quality of implementation and support functions, post-sales support and training.
• Financial performance (0.3). Revenue growth, profitability, sustainability, financial backing and the percentage of recurring revenues. The ratio of license to consulting revenues is key to business scalability.
• Value for money (0.4). The price to functionality ratio, and the total cost of ownership versus license price.
• After-sales service and support (0.4). Important factors include the ease of software implementation, the level of support and the quality of training.
• Product updates (0.2). Important considerations for end users include how often vendors issue updates, and how well they keep pace with best practice and regulatory changes.
• Market penetration (0.4). The number of customers in chosen markets, and the rate of growth relative to sector growth rate.
• Market potential (0.3). Brand awareness, reputation, thought-leadership, and the vendor’s ability to use its current market position to expand horizontally (with new offerings) or vertically (into new sectors).
• Momentum (0.3). Performance in the past 12 months, including financial performance, new product releases, quantity and quality of contract wins and market expansion moves.
• New product development (0.4). New ideas, functionality and technologies to improve risk management for target customers. Chartis assesses new product development not in absolute terms, but in relation to a vendor’s closest competitors.
• Exploitation (0.4). Developing new products is only the first step in generating success. Speed to market, positioning of new products and translation to incremental revenues are critical success factors.
• New business models (0.2). Innovation is not limited to the product dimension. Some risk technology vendors are also actively working toward new business models for generating profitable growth.
Strategy
Customer satisfaction
Market presence
Innovation

© Copyright Chartis Research Ltd 2016 | All Rights Reserved32
How to use research and services from Chartis
In addition to our flagship industry reports, Chartis offers customized information and consulting services. Our in-depth knowledge of the financial technology market and best-practice allows us to provide high-quality and cost-effective advice to our clients. If you found this report informative and useful, you may be interested in the following services from Chartis.
For risk technology buyers
If you are purchasing risk management software, Chartis’s vendor selection service is designed to help you find the most appropriate risk technology solution for your needs.
We monitor the market to identify the strengths and weaknesses of the different risk technology solutions, and track the post-sales performance of companies selling and implementing these systems. Our market intelligence includes key decision criteria such as TCO (total cost of ownership) comparisons and customer satisfaction ratings.
Our research and advisory services cover a range of risk and compliance management topics such as credit risk, market risk, operational risk, governance risk and compliance (GRC), financial crime, liquidity risk, asset and liability management, collateral management, regulatory compliance, risk data aggregation, risk analytics and risk business intelligence.
Our vendor selection services include:
Buy vs. build decision support.
• Business and functional requirements gathering
• Identification of suitable risk and compliance implementation partners
• Review of vendor proposals
• Assessment of vendor presentations and demonstrations
• Definition and execution of Proof-of-Concept (PoC) projects
• Due diligence activities
For risk technology vendors
Strategy
Chartis can provide specific strategy advice for risk technology vendors and innovators, with a special focus on growth strategy, product direction, go-to-market plans, and more. Some of our specific offerings include:
• Market analysis, including market segmentation, market demands, buyer needs, and competitive forces
• strategy sessions focused on aligning product and company direction based upon analyst data, research, and market intelligence
• Advice on go-to-market positioning, messaging, and lead generation
• Advice on pricing strategy, alliance strategy, and licensing/pricing models

© Copyright Chartis Research Ltd 2016 | All Rights Reserved 33
Thought leadership
Risk technology vendors can also engage Chartis to provide thought leadership on industry trends in the form of in-person speeches and webinars, as well as custom research and thought-leadership reports. Target audiences and objectives range from internal teams to customer and user conferences. Some recent examples include:
• Participation on a ‘Panel of Experts’ at a global user conference for a leading Global ERM (Enterprise Risk Management) software vendor
• Custom research and thought-leadership paper on Basel 3 and implications for risk technology
• Webinar on Financial Crime Risk Management
• Internal education of sales team on key regulatory and business trends and engaging C-level decision makers
Visit www.chartis-research.com for more information.

© Copyright Chartis Research Ltd 2016 | All Rights Reserved34
Further Chartis reading
• Buy-Side Risk Management Technology: Market Update 2016
• Credit Risk Management Systems for the Banking Book: Market Update 2016
• Enterprise Collateral Management Systems for the Trading Book: Market Update 2016
• Cyber Risk Management in Financial Services 2016
• Financial Crime Risk Management Systems: Market Update 2016
• Global Risk IT Expenditure in Financial Services 2016
• IFRS 9 Technology Solutions 2016
• Risk Data Aggregation & Reporting Solutions 2016
• Spotlight on BCBS 239
• Spotlight on KYC
• Spotlight on Blockchain in Financial Services
For all of these reports see www.chartis-research.com