RISK MITIGATION STRATEGIES AND PERFORMANCE OF INSURANCE …
85
RISK MITIGATION STRATEGIES AND PERFORMANCE OF INSURANCE INDUSTRY IN KENYA: A CASE OF MOTOR INSURANCE COMPANIES JANET MAKOKHA OKUMU D53/OL/CTY/24244/2014 A RESEARCH PROJECT SUBMITTED IN PARTIAL FULFILLMENT OF THE REQUIREMENTS THE DEGREE OF MASTER OF BUSINESS ADMINISTRATION (STRATEGIC MANAGEMENT OPTION) OF KENYATTA UNIVERSITY November, 2017
Transcript of RISK MITIGATION STRATEGIES AND PERFORMANCE OF INSURANCE …

RISK MITIGATION STRATEGIES AND PERFORMANCE OF INSURANCE
INDUSTRY IN KENYA: A CASE OF MOTOR INSURANCE COMPANIES
JANET MAKOKHA OKUMU
D53/OL/CTY/24244/2014
A RESEARCH PROJECT SUBMITTED IN PARTIAL FULFILLMENT OF
THE REQUIREMENTS THE DEGREE OF MASTER OF BUSINESS
ADMINISTRATION (STRATEGIC MANAGEMENT OPTION)
OF KENYATTA UNIVERSITY
November, 2017

ii
DECLARATION
This research project is my original work and to the best of my knowledge has not
been submitted for a degree in any other university. No part of this Project should be
reprinted without permission from the Kenya University.
Signature: ____________________________ Date___________________________
Student: Janet Makokha Okumu
Declaration by the Supervisor
This research Project has been submitted for examination with my approval as the
University Supervisor.
Dr Jane Wanjira
Lecturer, Department of Business Administrations
Signature: ___________________________________ Date______________

iii
DEDICATION
This Project is dedicated to my parents Mr & Mrs Okumu and to my siblings.

iv
ACKNOWLEDGEMENTS
I am grateful to God Almighty for seeing me through this Project. I acknowledge my
supervisor, Dr. Jane Wanjira who mentored me throughout this journey. I must
confess that through your input, I have managed to reach this far it is very true that it
is good to be mentored by experts. I would also like to thank my friends, relatives,
and classmates for their support throughout the project work. May God bless you.

v
TABLE OF CONTENTS
DECLARATION........................................................................................................... ii
DEDICATION.............................................................................................................. iii
ACKNOWLEDGEMENTS ........................................................................................ iv
TABLE OF CONTENTS .............................................................................................. v
LIST OF TABLES ....................................................................................................... ix
LIST OF FIGURES ...................................................................................................... x
ABBREVIATIONS AND ACRONYMS .................................................................... xi
OPERATIONAL DEFINITION OF TERM ............................................................ xii
ABSTRACT ................................................................................................................ xiii
CHAPTER ONE: INTRODUCTION ......................................................................... 1
1.1 Background of the Study .......................................................................................... 1
1.1.1 Risk Mitigation Strategies...................................................................................... 3
1.1.2 Organization Performance ..................................................................................... 3
1.1.3 Key Performance Indicators of Insurance Companies in Kenya ........................... 4
1.1.4 Insurance Companies in Kenya ............................................................................. 4
1.1.5 Motor Insurance ..................................................................................................... 5
1.2 Statement of the Problem .......................................................................................... 6
1.3 Research Objectives .................................................................................................. 7
1.3.1 General Objective .................................................................................................. 7
1.3.2 Specific Objectives ................................................................................................ 7
1.4 Research Questions ................................................................................................... 7
1.5 Research Hypotheses ................................................................................................ 8
1.6 Significance of the study ........................................................................................... 8
1.7 Scope of the Study .................................................................................................... 9

vi
1.8 Limitations of the Study............................................................................................ 9
1.9 Organization of the Study ....................................................................................... 10
CHAPTER TWO: LITERATURE REVIEW .......................................................... 11
2.1 Introduction ............................................................................................................. 11
2.2 Theoretical Framework ........................................................................................... 11
2.2.1 Agency Theory..................................................................................................... 11
2.2.2Contingency Planning Theory .............................................................................. 12
2.2.3 Arbitrage pricing theory ....................................................................................... 12
2.2.4 Resource Based Theory ....................................................................................... 13
2.3 Conceptual literature ............................................................................................... 13
2.3.1 Risk controlling Strategy ..................................................................................... 13
2.3.2 Risk Avoidance Strategy...................................................................................... 13
2.3.3 Risk based audit strategy ..................................................................................... 14
2.4 Empirical Review.................................................................................................... 15
2.4.1 Risk Control Strategy and Performance .............................................................. 15
2.4.2 Risk Avoidance Strategy and Performance ......................................................... 16
2.4.3 Risk based audit strategy and Performance ......................................................... 16
2.4.4 Product Mix Strategy and Performance ............................................................... 18
2.5 Summary of Research Gaps .................................................................................... 18
2.6 Conceptual Framework ........................................................................................... 23
CHAPTER THREE: RESEARCH METHODOLOGY ......................................... 25
3.1 Introduction ............................................................................................................. 25
3.2 The Research Design .............................................................................................. 25
3.3 Population of the study ........................................................................................... 25
3.4. Data sources and collection instruments ................................................................ 27

vii
3.5 Validity and reliability of Research instrument ...................................................... 27
3.5.1 Pilot Study…… ................................................................................................... 27
3.5.2 Validity………. ................................................................................................... 28
3.5.3Reliability……… .................................................................................................. 28
3.6 Data Collection Procedure ...................................................................................... 28
3.7 Data analysis and Presentation................................................................................ 28
3.8 Ethical considerations ............................................................................................. 29
CHAPTER FOUR: DATA ANALYSIS, INTERPRETATION AND
DISCUSSION OF THE FINDINGS.......................................................................... 31
4.1 Introduction ............................................................................................................. 31
4.2 Response Rate ......................................................................................................... 31
4.3 Reliability Test of the Instrument ........................................................................... 31
4.4 Demographic Characteristics of the Respondents .................................................. 32
4.4.1 Gender and Age of the respondents ..................................................................... 32
4.4.2 Period of Work and Department .......................................................................... 33
4.5 Descriptive Statistics ............................................................................................... 34
4.5.1 Risk Controlling Strategy .................................................................................... 34
4.5.2 Risk Avoidance Strategy...................................................................................... 36
4.5.3 Risk based audit strategy ..................................................................................... 40
4.5.4 Product Mix Strategy ........................................................................................... 41
4.5.5 Performance of Regulated Motor Insurance Companies ..................................... 44
4.6 Inferential Statistics ................................................................................................ 45
4.6.1 Correlation Analysis ............................................................................................ 45
4.6.1.1 Diagnostic test ................................................................................................... 47
4.6.1.2 Test for Multicollinearity .................................................................................. 47

viii
4.6.1.3 Test for Normality............................................................................................. 47
4.6.1.4 Heteroskedasticity test ...................................................................................... 48
4.7 Regression Analysis ................................................................................................ 49
CHAPTER FIVE: SUMMARY OF THE FINIDNGS, CONCLUSIONS AND
RECOMMENDATIONS ............................................................................................ 53
5.1 Introduction ............................................................................................................. 53
5.2 Summary of the findings ......................................................................................... 53
5.3 Conclusion .............................................................................................................. 54
5.4 Recommendations ................................................................................................... 55
5.4 Areas for Further Research ..................................................................................... 56
REFERENCES ............................................................................................................ 57
APPENDICES ............................................................................................................. 60
Appendix I: Questionnaire for Employees ................................................................... 60
Appendix II: List of Registered Insurance Companies ................................................ 69
Appendix III: Nacosti Permit Letter ............................................................................ 71
Appendix IV: Data Collection Authorization ............................................................. 72

ix
LIST OF TABLES
Table 2.1 Summary of Literature and Research gaps ................................................20
Table 3.1: Distribution of Target Population of the companies and Employees .........26
Table 3.2: Distribution of the sample size ...................................................................27
Table 4.1 Reliability of Risk Mitigation Strategies and Performance of Insurance
Industry ........................................................................................................................32
Table 4.2 Gender and Age of Respondents .................................................................32
Table 4.3 Period of Work and Department ..................................................................33
Table 4.4 Risk Controlling Policy ...............................................................................34
Table 4.5: Risk Controlling Strategy and Performance of Motor Insurance
Companies....................................................................................................................35
Table 4.6: Types of Risks ............................................................................................37
Table 4.7: Risk Avoidance Strategy and Performance of Motor Insurance
Companies....................................................................................................................38
Table 4.8: Risk-based Auditing Strategy and Performance of Motor Insurance
Companies....................................................................................................................40
Table 4.9: Effectiveness of Product Mix Strategies in Mitigating Risks ....................42
Table 4.10: Product Mix Strategy and Performance of Motor Insurance Companies ....43
Table 4.11 Performance of Regulated Motor Insurance Companies ...........................44
Table 4.12: Correlation Matrix ...................................................................................46
Table 4.13: Multicollinearity results using VIF ...........................................................47
Table 4.15: Model Fitness............................................................................................49
Table 4.16: Analysis of Variance.................................................................................50
Table 4.17: Regression Coefficients ............................................................................50

x
LIST OF FIGURES
Figure 2.1: Conceptual Framework ......................................................................................... 24
Figure 4.1: Test for Normality ................................................................................................. 48

xi
ABBREVIATIONS AND ACRONYMS
AKI: Association of Kenya Insurance
CEOs: Chief Executive Officers
MBO: Management by Objectives
GDP: Gross Domestic Product
MIP: Medical Insurance Providers
IRA: Individual Retirement Account
xii
OPERATIONAL DEFINITION OF TERM
Performance: The process of executing a task against a set standard.
Product mix strategy: Its determined by the size and growth of the market
products a company sells. Product mix entails the total
number of product lines that a firm offers to its clients.
Risk avoidance: It is the elimination of hazards, activities and exposures
that can negatively affect an organization.
Risk control strategy: Risk control is the method by which firms measure
potential losses and take action to reduce or eliminate
such threats.
Risk management: This is the human activity which integrates
identification of risk, risk assessment measurement,
monitoring, developing strategies to manage it, and of
those risks which can threaten firm achieving
Performance.
Risk mitigation strategy: It is a structured and coherent approach to identifying,
assessing, and managing project risk
Risk transfer strategy: An act of moving losses, damage to another
organisation or person.
xiii
ABSTRACT
Effective risk mitigation strategies are the key to achieve performance in the Motor
insurance industry. This involves knowing and analysing risks, making, and
reviewing risk handling techniques and checking the progress of these to avoid and/or
reduce the impact of risk on the performance of the firm. It is against this background
that this Project assessed risk mitigating strategies on performance of motor insurance
companies. The study’s general objective was to establish the effects of risk
mitigation strategies on performance of insurance industry in Kenya: a case of motor
insurance companies. Specifically, the Project focused on the Risk control, risk
avoidance, risk transfer and product mix strategies on performance of the insurance
industry. The study was anchored on Agency theory which is based on the outreach as
a way of mitigating risks. The research used descriptive survey research designs. The
target population of this study was the management and the other employees of all the
18 Motor insurance companies, the sample size of the study was54.The sampling
procedure was both simple random sampling and purposive sampling. Primary data
entailed using of questionnaires. Content validity was ensured by asking questions
that are relevant and captured the research objectives, reliability was measured with
the help of cronbach’s alpha (α). Descriptive statistics such as means, standard
deviation and frequency distribution tables were used to analyse the data. Qualitative
data was analyzed using content analysis to generate qualitative report which were
presented in a continuous prose. Inferential statistics such as regression and
correlation analysis were used to establish the effects of risk mitigation strategies on
performance of insurance industry in Kenya, a case of motor insurance companies.
Data presentation was done by the use of bar charts and graphs, percentages and
frequency tables for ease of understanding and interpretation. The study found out
that risk control strategy and performance of regulated motor insurance companies in
Kenya are positively and significantly related. The results further indicate that risk
avoidance strategy and the performance of regulated motor insurance companies were
positively and significantly related. It was further established that product mix
strategy and performance of regulated motor insurance companies were positively and
significantly related while risk based audit strategy and performance of regulated
motor insurance companies were also positively and significantly related. The study
concluded that risk controlling strategy, risk avoidance strategy, risk based audit
strategy and product mix Strategy have a positive and significant effect on
performance of Motor Insurance Companies. Based on the findings and conclusions
that risk controlling, risk avoidance Strategy, risk based audit strategy and product
mix strategy has a positive and significant effect on performance of Motor Insurance
Companies, the study recommends motor insurance companies should work toward
investing more on risk reduction strategies in order to improve their performance.

1
CHAPTER ONE
INTRODUCTION
1.1 Background of the Study
Today’s world presents serious challenges. Fundamental changes in natural,
economic, social, and political spheres, shifting stakeholder expectations and wide-
reaching technological innovations lead to a perpetually changing and demanding risk
environment. This calls for continuous adaptation from businesses around the globe.
(The Geneva Papers on Risk and Insurance, 2013).
External forces must be death within the insurance industry and continuation of
growth of the frontiers of risk mitigation. Law frameworks and procedures too must
adapt. It is important that the Law responses to the new challenges be made to support
the economy.
Insurers have expanded into new geographic markets and developing a greater range
of insurance product offerings and services to improve on their performance in that
some insurers and non-insurance are engaging in activities such as banking and asset
management services.
Affordability of insurance products is low in Africa due to poor standards of living in
that only upper and middle income earners can access the insurance products.
Nevertheless, the relatively unexplored insurance industry is expected to be resilient
thanks to consistent GDP growth, rapid urbanization and increases in the working
aged population across the continent.
South Africa, one of the region’s most advanced, is currently troubled, economies,
unsurprisingly accounted for almost 75 percent, or $51.6bn, of all insurance premiums
on the continent in 2013 according to global reinsurance firm Swiss Re. According to
South African Insurance Association report (2015), However South Africa’s
dominance is set to be challenged by a number of promising countries.
MsMaïdou also points to Kenya and Ethiopia as significant up-and-coming insurance
markets, “especially due to the size of their population and growing middle class”.
Although the penetration rate for insurance in Kenya stood at only 2.75 percent in
2013, the market has grown by just over 15 percent each year from 2010 to 2013.

2
Premiums reached $1. 5bn.The recent $350m investment partnership between
Prudential Financial and Leapfrog Investments, which targets high-growth insurance
markets in Africa, is a clear sign that global companies are keen to tap this potential.
In 2015 Group Jubilee Holdings Limited (JHL) achieved a turnover of Kshs 30.16
Billion hence increase in growth by 25 percent to Ksh. 1.72 Billion in 2015. In recent
years Jubilee Holdings, a strategy was implemented to expand investments to reduce
the risk of volatility from stock market movements. This strategy entailed increasing
investments in government bonds and diversifying into investments in the energy
sector, such as Tsavo power and Bujagali, and in other infrastructure projects such as
SEACOM, that are giving returns in dollar terms (Abuogi, 2014).
Kenya being developed has the best insurance markets although the competition is
tough. Currently, according to the Association of Kenyan Insurers (AKI), Kenya
represents 70% of the East African insurance market, which also includes Tanzania,
Uganda, Rwanda and Burundi. Insurance penetration and accessibility have been
improving steadily in Kenya. There is a potential for increase in demand for insurance
as middle class is growing, more Kenyans have disposable income. Increase in
urbanisation, giant infrastructure projects, new energy schemes and growing industry.
Huge infrastructure plans have made investment opportunities in insurance. Some of
the main ventures include the construction of the second runway and new terminal at
Jomo Kenyatta International Airport, the Lamu Transport Corridor project, and the
Standard Gauge Railway (SGR) project (Abuogi, 2014).
Life insurance penetration is 1.2% of GDP and general insurance about twice that,
bringing the total to 3.44% in 2013, according to AKI figures. This measure of
insurance penetration dropped to 2.93% in 2014 after GDP was rebased with a 25%
increase. Now 4% penetration by year-end looks possible; this compares favourably
to the majority of Africa’s markets, although it is slightly down from the 2010 target
of 5% by 2015. Worldwide insurance penetration is about 6.5% of GDP, so Kenyan
insurers say there is great room for growth. William Maara, managing director of
Barclays Life Assurance Kenya, told OBG that, “Given low penetration rates, the
Kenyan insurance sector has significant growth potential. This is particularly true
following the expansion of the branch network into previously untapped markets;
expansion was further supported by the introduction of new products to the market.”
3
1.1.1 Risk Mitigation Strategies
Risk mitigation strategy is the method of evaluating, knowing, and determining the
behaviour risks that arises during the course of the project lifecycle (Chacko and
Harris, 2006). It entails a series of steps to support better decision making through
good understanding of the risks inherent in a Project and their likely impact.
The risk management planning describes risk identification, risk analysis and risk
handling. The plan should illustrate the role of risk evaluation in design reviews,
technical outcome, observing and changing control processes. The strategies to
mitigate risks entail moving the risks to another party, avoiding the risks, minimising
the negative effect or probability of the risk, or even accepting some or all of the
potential or actual consequences of a particular threat, and the opposites for
opportunities.
Controlling asset quality is only guaranteed when the credit risk department has
strong policies and risk systems. The optimal control risk strategy is the one that is in
line with the business strategy. It is not the one that minimizes losses, but the one that
provides a good policy value in line with the insurance business objectives.
1.1.2 Organization Performance
Organizational performance constitutes of the actual output of an organization as
measured against its intended outputs (or goals and objectives). Performance can be
assessed through evaluating a firm’s profitability, solvency, and liquidity. The
performance of a company can be measured by monitoring the firm’s profitability
levels. The return on equity (ROE) and the return on assets (ROA) are the used as
measures of profitability. By monitoring a firm’s profitability levels, one can measure
its financial performance.
Organizational performance is therefore the ability of an organization to fulfil its
mission through sound management, strong governance, and a persistent rededication
to achieving results. Organization performance measurement is considered a
multifaceted concept that occurs at different of levels for industry, corporate and
business sectional unit.

4
1.1.3 Key Performance Indicators of Insurance Companies in Kenya
A Key Performance Indicator (KPI) is used by an organization to evaluate its success
in reaching its strategic objectives by measuring the performance of the critical
activities towards an objective examples are financial ratios and sales growth rates.
Key among the indicators in insurance company are: Net income ratio, policy sales
growth, percentage of sales growth, claims ratio, and quotas-to-production are all
commonly used key performance indicators, or KPIs, in the insurance industry.
Insurance premiums represents total sales in the insurance industry. The net income
ratio is calculated by dividing net income by the total of earned premiums for a given
period. It measures the effectiveness of the company at generating profits with each
dollar of earned premium. A net income ratio of 10 percent is worse than a net income
ratio of 20 percent. The latter is 10 percent more efficient at creating net income out
of earned insurance premiums and is considered more profitable.
The claims ratio is an insurance KPI that measures how well your sales are covering
the cost of claims. It is calculated by dividing total claims per period by the total
earned premium per period. It is often used as an auditing KPI -- a high metric could
be a sign of fraud. The average time to settle a claim can be used in conjunction with
the claims ratio. It is calculated by dividing the total number of days taken to settle a
claim by the total claim. A high time to settle and a high claims ratio is cause for
concern.
1.1.4 Insurance Companies in Kenya
The insurance sector in Kenya is divided into two broad sub sectors namely; General
and Life insurance. The general insurance sector is by far the larger of the two in
terms of size and market penetration. The main players in the Kenyan insurance
company are insurance companies, reinsurance companies, insurance brokers,
insurance agents and the risk managers. The statute regulating the companies is the
insurance Act; Laws of Kenya, Chapter 487. The office of the commissioner of
insurance was established under its provisions to strengthen the government
regulation under the Ministry of Finance. There is also self-regulation of insurance by
the Association of Kenya Insurers (AKI). The professional body of the industry is the
Insurance Institute of Kenya (IIK), which deals mainly with training and professional

5
education. There were 49 operating insurance companies as at the end of 2015. 25
companies wrote non-life insurance business only, 13 wrote life insurance business
only while 11were composite (both life and non-life). There were 198 licensed
insurance brokers, 29 medical insurance providers (MIPs) and 5,155 insurance agents.
Other licensed players included 133 investigators, 108 motor assessors, 25 loss
adjusters and 24insurance surveyors (Ernst & Young, 2012)
Kenyan insurance industry consist of insurance companies, reinsurance companies,
intermediaries such as insurance brokers and insurance agents, risk managers or loss
adjusters and other service providers (Insurance Regulatory Authority, 2010). The
statute regulating the industry is the insurance Act; Laws of Kenya, Chapter 487. The
office of the commissioner of insurance was established under its provisions to
strengthen the government regulation under the Ministry of Finance. There is also
self-regulation of insurance by the Association of Kenya Insurers (AKI) established in
1987 as a consultative and advisory body to insurance companies and registered under
the Society Act Cap 108 of Kenyan law (AKI, 2010).
In Kenya Insurance availability and affordability are both policy concerns, as
evidenced by government’s many regulations of the insurance market. Legislation of
any country creates an enabling environment and business opportunities for all
entrepreneurs. Insurance service providers were 21 loss adjusters, 2 claims settling
agents, 193 loss assessors/investigators, 26 insurance surveyors, and 8 risk managers
during the year. The gross written premium by the industry was Kshs76.9 billion
compared to Kshs65.0 billion in 2006 representing a growth of 18%. The gross
written premium from General insurance was Kshs49.76 billion while that from long
term business was Kshs23.1 (AKI, 2014).
1.1.5 Motor Insurance
Level of risk determines insurance premiums. Generally, insurance policy with
increase of risk in claims insurance leads to higher rates (Gollier, 2003). With much
information at hand, insurers can evaluate risk of insurance policies at much higher
accuracy. To this end, insurers collect a vast amount of information about
policyholders and insured objects.

6
Due to increase in completion and dynamic change, a firm ought to have effective risk
mitigation strategies such as risk avoidance, risk reduction, risk retention and risk
transfer for a firm to excel (Olsson, 2008).
1.2 Statement of the Problem
Insurance companies are the backbone for most small business development of any
country and as such several studies have been carried out in line with this. Several
empirical studies have been carried out in this area of organizational performance;
Tripp, M., and Bradley, H., (2004). Conducted study on How to Quantify Operational
Risk in General Insurance Companies. Belasco, E. (2008). Conducted a study on ‘The
Role of Price Risk Management in Mitigating Risks in profits of Motor Insurance’.
Faure, M. (2006). Did a study on the Economic Criteria for Compulsory
Insurance. The Geneva Papers on Risk and insurance: Issues and practice. However
none of these studies seem to address comprehensively the issue of Risk mitigating
strategies and performance in motor insurance therefore that is the concern for this
paper.
Locally, Essendi (2013) examined the effects of risk management on the performance
of insurance companies. Results showed that formulation of new motor policy is
based on the existing credit policy of the insurance companies. Wanja (2013)
investigated the effects of credit policy used by commercial banks on their
performance.
These studies failed to indicate the extent to which risk mitigation strategies such as
risk control, risk limitation, risk auditing strategy influence performance in motor
vehicle insurance companies. Despite the significant role played by risk mitigation
strategies on performance in insurance companies, this has not attracted attention of
many authors. This study therefore sought to fill the existing knowledge gap by
determining the effects of risk mitigation strategies on performance of motor
insurance companies in Kenya
7
1.3 Research Objectives
1.3.1 General Objective
The general objective of this study was to establish the effects of risk mitigation
strategies on performance of Insurance Industry, a case of Motor Insurance
Companies
1.3.2 Specific Objectives
The specific objectives of this study were;
i. To determine the effects of risk controlling strategy on performance of Motor
Insurance Companies.
ii. To establish the extent to which risk avoidance influences performance of
Motor Insurance Companies.
iii. To establish influence of risk based audit strategy on performance of Motor
Insurance Companies.
iv. To determine influence of product mix strategy on performance of Motor
Insurance Companies.
1.4 Research Questions
This study sought to answer the following research questions:
i. How does risk controlling affect performance of Motor Insurance Companies?
ii. To what extent does risk acceptance strategy influences performance of Motor
Insurance Companies?
iii. To what extent does risk transfer strategy affects performance of Motor
Insurance Companies?
iv. How does product mix strategy affect performance of Motor Insurance
Companies?

8
1.5 Research Hypotheses
i) H0: Risk controlling does not affect performance of Motor Insurance
Companies.
ii) H0: Risk acceptance strategy does not affect performance of Motor Insurance
Companies.
iii) H0: Risk transfer strategy does not affect performance of Motor Insurance
Companies.
iv) H0: Product mix strategy does not affect performance of Motor Insurance
Companies.
1.6 Significance of the study
This study is significant to insurance companies, general public, students and the
insurance regulators as it offers valuable contributions from both a theoretical and
practical perspective.
Theoretically, the study shows to the general understanding of risk management
practices and their effect on financial performance. The study shall enable Insurance
companies in Kenya to improve their risk management process and to adopt efficient
strategies to improve firm financial performance through the risk management
processes.
This shall enable the insurance companies to perform better and to grow their
businesses and maintain a competitive advantage. Apart from benefiting the insurance
companies, the general public will also benefit from the study through improved
insurance services and better management of risks. This will result to affordable rates
of insurance premiums and reduction in levels of non-payment and fraud.
The study will be helpful to the government in setting regulations on insurance
practices in Kenya through the IRA and safeguarding the resources of the country. It
will also be helpful to the government in the developing policy papers, policy making
regarding risk mitigation strategy and other regulatory requirements of insurance
companies in Kenya may also benefit from the findings of this study. The policy
makers may gain insight on how well to incorporate the sector effectively to ensure

9
effective mitigation of risks for the insurance industry to achieve high company
performance.
The study shall also add value to the existing body of knowledge on risk management
to benefit academicians and aid further research on risk management in the insurance
sector and the financial sector. The findings of the study shall be relevant to scholars
and researchers as it may provide information regarding effects of risk mitigation
strategies on insurance company performance in Kenya.. This may aid further research
on risk management in the insurance sector and the financial sector.
1.7 Scope of the Study
The study sought to investigate the effects of risk mitigation strategies on
performance of insurance industry with special focus on Motor Insurance Companies
in Nairobi. The study focused on risk controlling strategy, risk avoidance, risk based
audit strategy and product mix strategy as independent variables. Legislation and
inflation as moderating variables and performances dependent variables. The study
covered all the branches in Nairobi. The study adopted descriptive research. The area
of the study was done in Nairobi as this is the location of the Motor Insurance
Companies are. The study considered a study period of 5 year from 2011 to 2015.
1.8 Limitations of the Study
There was a shortage of literature on the relationship between risk mitigation and
employee productivity. Majority of the studies within the risk mitigation sector have
focused on the relationship between risk and productivity and not performance. This
study focused on obtaining additional information from the respondents by
conducting informal discussions.
The study encountered unwillingness by respondents to reveal information, which
may be thought confidential. However, the researcher assured the respondents that the
information they offered held confidentially and might be used for academic purposes
only in seeking to establish the effects of risk mitigation strategies on performance of
Motor Insurance Companies

10
1.9 Organization of the Study
This document was organized into five chapters. Chapter one presented the
background of the study, the motor insurance companies in Kenya, statement of the
problem, objectives of the study, significance of the study, delimitations, and
limitations of the study.
Chapter two outlined theoretical review, empirical review, and conceptual framework.
Chapter three focused on methodology which included the research design, empirical
model, target population, sampling design and procedure, data collection instrument,
validity of the instrument, reliability of the instrument, data collection procedure and
data analysis. Chapter four presents the findings, interpretation, and discussion of the
data, while chapter five, made a conclusion and recommendations of the study.

11
CHAPTER TWO
LITERATURE REVIEW
2.1 Introduction
This chapter critically reviewed the available literature on risk management and
performance. It began by reviewing theories underpinning this study, then an
overview of the empirical studies and literature on the risk mitigation and
performance. It also presented the summary of knowledge gaps and conceptual
framework.
2.2 Theoretical Framework
The following theories guided it: Agency theory, contingency planning theory
arbitrage pricing theory and results based theory.
2.2.1 Agency Theory
Agency theory extends the analysis of the firm to include separation of ownership and
control, and managerial motivation. Theory also elaborates differences on interest
between shareholders, management, and debt holders due to variance in earning
distribution, which can result in the firm taking too much risk or not engaging in
positive net value projects (Mayers and Smith, 1987).
Stulz (1984) asserts that managers are presumed to be working on behalf of firm
owners and concern themselves with both expected profit and the distribution of firm
returns around their expected value. They have an obligation to avoid risk in so as to
minimize the variability of firm returns and hence achieve it
Agency theory provides strong support for risk management as a response to
mismatch between managerial incentives and shareholder interests. Shareholders and
managers have different interests to the firm and risk management objectives vary for
the different stakeholders. While shareholders may require high risk – high return
investments, management prefer low risk and return investments. The agency theory
emphasizes the need for risk controlling in the firm to align the interests of mangers
and shareholders and to contribute to the performance of the firm.

12
2.2.2 Contingency Planning Theory
Contingency planning (CP) also known as is an important element in risk
management since a risks cannt be fully eliminated despite organization efforts to
avoid, mitigate or prevent them.Entails making major plans for preparation of
distaters incidents and availing resources to be used in such events when they occur.
This theory support risk acceptance strategies as in Contigency planning the firm
indentify the risks and determine the response to specific risks. Due to change in the
external enviroment, firm would mitigate risk through acceptance strtaegies . The
study focused on determining the effect of risk acceptance strategy on performance of
the motor insurance companies.
2.2.3 Arbitrage pricing theory
The Arbitrage Pricing Theory (APT) was developed primarily by Ross (1976). It is a
one-period model that has the stochastic properties of returns of capital assets are
consistent with a factor structure. The Arbitrage Pricing Theory (APT) describes the
price where a mispriced asset is expected to be.
It is often viewed as an alternative to the capital asset pricing model (CAPM), since
the APT has more flexible assumption requirements. Whereas the CAPM formula
requires the market's expected return, APT uses the risky asset's expected return and
the risk premium of a number of macro-economic factors. Arbitrageurs use the
APT model to profit by taking advantage of mispriced securities. A mispriced security
has a price that differs from the theoretical price predicted by the model.
The theory states that price of a security is driven by factors which are divided into
two groups: macro factors, and company specific factors. Linear pricing relation is a
must for equilibrium in a market where agents maximize certain types of utility. It
derives that either from the assumption of the preclusion of arbitrage or the
equilibrium of utility-maximization.
Expected returns and the betas helps identification of the stochastic discount factor.
APT relates to the price of the security to the fundamental factors driving it. The
theory does not show the factors hence need to be determined empirically which may
include economic growth and interest rates.

13
2.2.4 Resource Based Theory
According to the Resource Based Theory all inputs that allow the firm to function and
to implement its strategies are firm resources.
There are input factors which are generic resources that can be acquired in the market
and logistics input factors which include raw skills loading skills, driving skills,
picking skills, computer operating skills factors forklift trucks, warehouse racking,
packaging materials, and inventory. When input factors are transformed they become
part of the firm’s assets, hence contributing to the outputs of the firm (Grant, 2002).
When resources enable a firm to implement product mix strategy that improves
performance and exploit market opportunities or neutralizes risks only then is when
they are considered valuable (Barney, 2001).
The theory stipulates clearly that through utilization of the organization resources,
insurance will be in a position to consider its assets and its financial capability to
evaluate and produce product based on the need in the market.
2.3 Conceptual literature
2.3.1 Risk controlling Strategy
The method by which firms evaluate potential losses and take action to reduce or
eliminate such threats is called Risk control .It is a technique that uses findings from
risk assessments and implements changes to reduce risk in these areas.
The expected amount of loss is inversely related to its corresponding likelihood that
risks that will cause a high damage to corporation like earthquakes or fire as
compared to risks that occur daily such as interest rate risks or foreign exchange risks
which often cause relatively minor losses only, (Fatemi and Glaum 2000).
2.3.2 Risk Avoidance Strategy
Risk Avoidance strategy involves taking some action hence limiting the firms
exposure. For example a company should have backups as a disk drive may fail. A
situation is often intensified by lack of clearly defined risk limits, deliberately
misleading reports, lack of intra-organizational communication concerning risk
vulnerability, poor knowledge of the business environment and lack of timely
decision making.

14
Some risk events can be dealt with by obtaining information, improving
communication, clarifying requirements, or acquiring expertise. Usage of a familiar
approach, reduction of scope, increase of resources may be examples of avoidance
(Meinhard, 2006).
2.3.3 Risk based audit strategy
Accountability in corporate has been raised in various developed nations hence the
need of an appropriate Risk Based Audit.
By issuance of qualified opinions to firms with unreliable financial statements could
improve the precision of financial statement information investor’s screen out such
firms by the help of auditors.
Life insurance companies and intermediaries understand the risks and are able to
exercise sound judgment on implementation of rick based strategy. This is done
through training, recruitment, taking professional advice and learning by doing, good
practice guidance is also valuable.
2.3.4 Product Mix Strategy
The rate of transparency of insurance products is low taking into account of a larger
risk orientation in product design and pricing as compared to the past might hence
resulting in more complexity.
Diversification of products within each product line, makes it hard for the company
to know the required effort and timing for experience monitoring a product level
hence making it a challenge to set a risk limit .
Different product mix results to rise of exposures to risk hence insurance companies
provide protection at price exposures. An insurance company may opt to drop one or
more product lines or product items resulting into increase in profits from fewer
products. Modification product of already established is more profitable than making
a new product.

15
2.4 Empirical Review
This section reviewed literature from past studies which were related to this study.
2.4.1 Risk Control Strategy and Performance
A study by Yusuwan, Adnan & Omar, (2008) carried out the level of awareness,
policies used when encountering risks and problems faced when implementing risk
management in a construction project
A conclusion was carried out that risk management affects project finances
production, outcome, and efficiency and that risk management is conducive for
project with specific characteristics such as new technology.
A research carried out by Manabet al., (2010) focused on the drivers: mandate from
board of directors globalization, shareholders pressure, technology, improved decision
making, competitive pressure, good business practice catastrophic event and good
business practices which contributes to the success of Enterprise Wide Risk
Management (EWRM) implementation with corporate governance compliance and
improvement in for profit companies in Malaysia. Only 85 participated in this study
two types of companies were chosen that is financial companies and non-financial
companies. The conclusion of the study corporate governance, mandate from board of
directors, shareholder value, improved decision making and good business practices
results to success of Enterprise Wide Risk Management (EWRM).
Strutt (1993) conducted a study on impact of risk management on financial
performance of banking industry in US. The study used panel-corrected covariance
matrix of the coefficient estimates and uses panel-corrected standard errors. The
program used in the study can show unbalanced panel data. The main of this research
was to investigate the relationship between prepayment risk and credit union
performance. Results show that credit was significantly related to return on loans
(RETLNS) for the Controlling of all credit unions thus borrowers can either refinance
or default on a loan and therefore incorporate the risk premium into the required rate
of return on loans. It was evident that the relationship between risk and return on
loans was consistent for all but one credit controlling.

16
2.4.2 Risk Avoidance Strategy and Performance
A study by Eisenmann (2002) found that the Managerial risk connects with
organizational risk and further showed that the risk taking and risk avoidance
behaviour was dependend on the ownership structure. They analysed whether to
diversify their assets or not under increasing perishable business environment. Bettis
and Mahajan (1985) found that diversification minimises risk and enhances
performance. Diversification is the best way for minimising risks to target level
among the securities and in firm assets.
Kor and Leblebici (2005) & Hamilton and Shergill (1993) finds that managing
resources will results to higher outcome under diversification. Minimisation of risks
and attainment of high firm size will lead towards achievement of goals
Ruefli, Collins & Lacugna (1999), illustrates that diversification of products and
systematic risks of pricing are related to the Monopolistic market power. Risk is
inappropriately measured if the focus is on the distribution of outcomes. Risk
measurement assumes losses that might occur throughout an investment period, hence
investor ought to use the methods best related to project of their investment,
(Kritzman and Rich, 2002).
Laurentis and Mattei (2004) conducted a research on Lessors’ recovery risk
management capability and found that the development of modern reliable systems of
risk management can enhance even more those management capabilities. This means
that credit firms should invest resources in projects aimed at correctly implementing
rating systems and risk models, and highlights once more the importance of these
tools well beyond the scope of regulatory compliance. The research method used is
that mixed research method.
2.4.3 Risk based audit strategy and Performance
Empirical studies on effect of risk assessment on financial performance are reviewed
in this section. According to McCord (2002), risk evaluation of material misstatement
at the financial statement level and also at the planning stage, shows the way on

17
performing a combined assessment of inherent and control risk, hence making room
for the auditors to evaluate other risk factors in an audit.
A study on the impact of risk-based audit on financial performance in Kenya’s
insurance companies conducted by Kasiva (2012) found out that risk-based auditing
through risk management should be enhanced to enable the organization concerned to
detect risks on time.
A survey was carried out of internal auditors’ risk management practices in the
Kenya’s banking sector, Kibaara (2007) concluded that, most banks in Kenya were in
the process of making the ERM process and strategies in line with risk assessment.
Implementing a risk-based strategy requires that life insurance companies and
intermediaries have a good understanding of the risks and are able to exercise sound
judgment. This requires the building of expertise within life insurance companies and
intermediaries, including for example, through training, recruitment, taking
professional advice and learning by doing.
According to Momo and Ukpong (2013), Equitable Life Assurance Society of United
Kingdom collapsed in the year 2000 due to mismanagement of funds by the directors
subsidize current annuity rate policies instead of the guaranteed annuity rate policies.
Skandia, Sweden's largest insurance company which leads in providing variable
annuities and other savings products also ruined its reputation in 2003 when three of
its top executives were investigated on misuse of firms assets.
The Kenyan insurance industry was mainly found to be vulnerable to economic risks
and legal risks. However, the industry was also affected by political risks,
technological risks, socio- cultural risks, geographical risks, management risks and
personnel risks to a moderate extent. These were mainly mitigated using, risk
avoidance, risk retention, risk transfer and risk reduction techniques. Towards
ensuring sustainability in the industry, there is an urgent need for the insurance firms
to frequently train their staff on risk mitigation, empower risk managers, identify and
train internal risk experts, and provide adequate budgetary allocations for risk
mitigation.

18
2.4.4 Product Mix Strategy and Performance
The indirect resource demand in addition to the effort involved in direct
implementation and maintenance with respect to product design and pricing processes
is considered to be rather significant. This product mix strategy concerns with finding
and communicating new uses of products. Lundholm, (2012) in their study using a
sample of 51,866 firms from 69 countries, found that credit facilities influence a
company’s profitability in that profitability negatively by leverage hence making
highly profitable firms to raise their capital through internal financing.
Memba (2015) evaluated the impact of risk management practices on financial
performance of life assurance firms in Kenya. The study found that adaptation of
premium valuation should be considered by the management on insurance firms to
enable financial performance of life assurance firms in Kenya.
Linbo & Sherril (2004) assessed the efficiency in relation to risk in large domestic
USA banks. They found that profit efficiency is related to credit risk and insolvency
risk but not to liquidity risk or to the mix of loan products..
2.5 Summary of Research Gaps
The empirical studies were reviewed in the preceding section focused on the different
credit institutions issues that affect the financial performance of credit unions. Much
has not been done on the financial performance of insurance firms in Kenya.
According to Boadi, et al. (2013), studies on profitability of Insurance industry have
not carried out especially in emerging and developing markets. Cagil and Karabay
(2010) assert that most of the studies on insurance industry have used Data
Envelopment Analysis to assess their financial performance with a few studies using
multivariate analysis. It is because of this reason that the present research used
multivariate analysis to study the influence of risk management practices on financial
performance of life assurance firms in Kenya with a concentration on adverse
selection problem. As a result, this study is designed to fill the aforementioned gaps
and provide concluding recommends having the main objective of analyzing.
However, these studies failed to whether there is a significant relationship between
risk mitigation strategies which as risk control strategy, risk limitation strategy,

19
product mix strategy has significant impact on performance of motor insurance
companies on the performance of motor insurance companies in Nairobi.

20
Table 2.1 Summary of Literature and Research gaps
Author Focus of the study Findings Research gaps Focus of the current study
Laurentis and
Mattei (2004
The study focused on Lessors’
recovery risk management
capability
The study found that
the development of
modern reliable
systems of
risk management can
enhance even more
those management
capabilities
The study failed to determine
influence of risk management
on performance specifically in
motor insurance companies
The current study focused on the effect of
risk mitigation strategies on performance
of motor insurance companies
Carey (2001) A survey of risk management
practices
The study found that
on average the lowest
percentage is on the
measuring, mitigating
and monitoring risk
that is 69% score as
compared to risk
management policies
and procedures that is
82.4%, and internal
control of banks that
is 76%.
The study failed to establish
whether risk management
practices impacted on
performance of the organization
The current study focused on the extent to
which risk mitigation strategies would
impact on organization performance
focusing on motor insurance companies

21
Liewellyn,
(1998
Effects of risk management
practices on Value Creation in
credit unions in Slovenia
The study found that
risk management
practice influence
Performance in
respect to ,efficiency
, productivity , capital
structure and liquidity
ratio
The study failed to establish
whether risk management
strategies had significant
influence on performance
The current study focused on the extent to
which risk mitigation strategies would
impact on organization performance
focusing on motor insurance companies
Kiragu (2014) The study focus on management
of change
The study found that
management of
change influence
growth in size and
profits and reduction
in the cost of
products
The study was limited to
establishing effects of change
management on performance of
insurance companies
The current study focused on the effects of
risk mitigation strategies on performance
of the motor insurance companies
Ndungu and
Gekara (2014
Impact of risk management
practices on performance of
insurance companies in Kenya
The study found that
risk avoidance,
transfer, control and
most importantly
accepting influence
performance
The study failed to establish
whether risk management
strategies impacted significantly
on performance
The current study filled the gap by
focusing on Risk control Strategy, Risk
limitation Strategy, Product Mix Strategy
and Risk Based Auditing Strategy.

22
Memba (2015 Assessment the influence of risk
management practices on
financial performance of life
assurance firms in Kenya
The study revealed
that underwriting
practices, claims
adjustment provisions
and premium
valuation methods
influence the
financial performance
of life assurance
firms in Kenya.
The study focus on underwriting
practices, claims adjustment
provisions and premium
valuation methods as risk
management practices
influencing performance in life
insurance firms
This study focused on risk mitigation
strategies, product mix, risk control, and
Risk limitation Strategy
Karabay (2010 The study focus on determining
influence of risk management
practices on financial
performance of life assurance
firms in Kenya with a
concentration on adverse
selection problem
The study found that
risk management
practices on financial
performance of life
assurance
This study sought the extent to
which risk management
practices on financial
performance of life assurance
firms in Kenya
However, this study found out that there
is a significant relationship between risk
mitigation strategies on the performance of
motor insurance companies in Nairobi
Source: (Author, 2017

23
2.6 Conceptual Framework
Conceptual framework is a schematic presentation which shows variables that when
combined together explains the issue of concern. The conceptual framework is a set of
ideas used to show the relationship between the independent variables (factors) and
the dependent variables (outcome). Conceptual framework creates a link between the
research title, the objectives, the study methodology and the literature review
(Coulthard, 2004). Conceptual framework explaining the relationship between risks
mitigation strategies as the independent variable andperformance of insurance firms
as the dependent variable is presented in Figure 2.1.
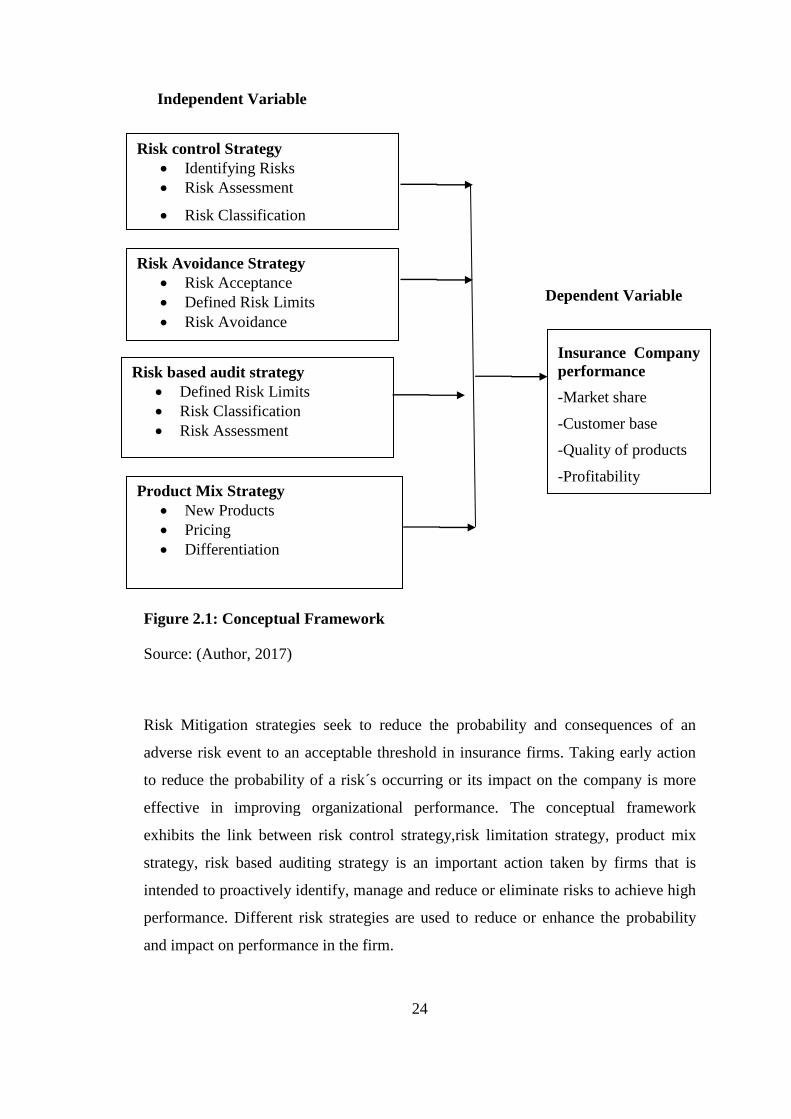
24
Figure 2.1: Conceptual Framework
Source: (Author, 2017)
Risk Mitigation strategies seek to reduce the probability and consequences of an
adverse risk event to an acceptable threshold in insurance firms. Taking early action
to reduce the probability of a risk´s occurring or its impact on the company is more
effective in improving organizational performance. The conceptual framework
exhibits the link between risk control strategy,risk limitation strategy, product mix
strategy, risk based auditing strategy is an important action taken by firms that is
intended to proactively identify, manage and reduce or eliminate risks to achieve high
performance. Different risk strategies are used to reduce or enhance the probability
and impact on performance in the firm.
Risk Avoidance Strategy
Risk Acceptance
Defined Risk Limits
Risk Avoidance
Insurance Company
performance
-Market share
-Customer base
-Quality of products
-Profitability Product Mix Strategy
New Products
Pricing
Differentiation
Risk based audit strategy
Defined Risk Limits
Risk Classification
Risk Assessment
Risk control Strategy
Identifying Risks
Risk Assessment
Risk Classification
Dependent Variable
Independent Variable

25
CHAPTER THREE
RESEARCH METHODOLOGY
3.1 Introduction
The chapter presents the research design and methodology of the study. The chapter
therefore entails the way the study was designed, the data collection techniques and
the data analysis procedures.
3.2 The Research Design
The research used descriptive research design. This research design involves
collection of data that illustrates events and then organizes, tabulates, depicts, and
describes the data. (Onen & yuko, 2011). The descriptive survey research design
refers to a set of methods and procedures that describe variables. According to
Kothari (2004), a descriptive design involves execution of a plan, re-arranging,
collecting and analysis of data so as to provide information being sought.
This design is also used in collecting qualitative data to provide a great depth of
responses resulting in a better and elaborate understanding of the phenomenon under
study. Descriptive survey design portrays the variables by answering who, what, and
how questions. According to Mugenda and Mugenda (2003), descriptive design is a
procedure of acquiring quantitative and qualitative data so as to test hypotheses or to
answer the questions of the current status of the subject under study. Descriptive
research is used to illustrate the general characteristic of the study population and
show the relationship between the dependent and independent variables. The research
design was deemed fit to establish the effects risk mitigation strategies on
performance of motor insurance companies in Kenya.
3.3 Population of the study
According to Ngechu (2004), a population is a set of people, services, elements, and
events, group of things or households that are being investigated. This definition
ensures that population of interest is homogeneous. The study targeted all the 18
Motor insurance companies. The study population comprised of staff working in
motor insurance companies namely: the management, the staff at the corporate level
and the functional level who were credit officer, operation managers, finance officer,

26
chief auditors and chief IT officers and human resource directors making a total of
108 staff. Association of Kenya Insurers (2016).
Table 3.1: Distribution of Target Population of the companies and Employees
Population Category per Company Frequency
Operation Officers 18
Chief Auditors 18
Financial managers 18
Chief Accountants 18
Human resource directors 18
Chief IT officers 18
Total 108
Source: Association of Kenya Insurers (2016)
Cooper and Schinder (2003) defines sampling as a selection of a few items (a sample)
from a bigger group (population) to used on estimation on the relevance of an
unknown piece of information or outcome regarding the bigger group. A sample is a
representative part of the population that the researcher is interested in (Kumar, 2005).
Stratified sampling was used to select the sample of the study the method assures the
researcher that the sample was representative of the population in terms of certain
critical factors that had been used as a basis for stratification. Stratified samplings as
noted by Neuman (2003) is a procedure in which the population from which a sample
is to be drawn does not entail an identical group and hence requires comparisons
between various sub-groups. Kothari (2004) indicated that a minimum sample size of
20% or 30% of a large study population is sufficient for a study. Therefore the study
adopted a stratified random sampling and adopted a sample proportion of 50% as
indicated by Kothari (2004) to determine a sample size of 54 respondents.

27
Table 3.2: Distribution of the sample size
Strata Frequency Sample
Proportion
Sample
Size
Chairman of Audit Committee 18 0.5 9
Chief Auditors 18 0.5 9
Financial managers 18 0.5 9
Chief Accountants 18 0.5 9
Human Resource directors 18 0.5 9
Chief IT officers 18 0.5 9
Total 108 54
Source: Researcher 2016
3.4. Data sources and collection instruments
The main sources of data for this study were primary and secondary sources. This
data was collected using the questionnaires. Questionnaires ensured that details and
relevant information on the subject of study was collected. Questionnaires were used
in collecting data and consisted of a mixture of open ended and close ended questions.
According to Babbie, (1998), questions ought to be open ended and closed ended in a
questionnaire give room for intensity and richness of individual perceptions in
respondent responses.
The study used questionnaires because it is flexible and facilitates the capture of in-
depth knowledge of the respondents, promotes respondent cooperation and allows the
interviewer to probe further for clarification of issues. As a method of data collection
questionnaires are appropriate because of ease to analysis and is cost friendly
(Andersn, 2003).
3.5 Validity and reliability of Research instrument
3.5.1 Pilot Study
Piloting was carried out before the questionnaires are administered to the participants,
to certify that the questions are relevant, made sense and are clearly understandable.
The pilot study involved (10% of the sample size). The respondents were randomly be
selected to form the requisite sample size in the pilot study.

28
3.5.2 Validity
Creswell (2003) emphasizes that validity is the extent to which results are obtained
from data analysis of the data actually under study. There are two kinds of validity.
These include content validity and face validity. Face validity refers to the probability
that a question is misinterpreted or misunderstood. According to Cooper and
Schindler (2006) pre-testing is an efficient way to increase the chances of face
validity. Alternatively, content validity, also called logical validity, refers to the
degree to which a measure depicts all facets of a given social construct. This study
ensured both the face validity and the content validity.
3.5.3 Reliability
Reliability is the extent to which research instruments come up with consistent results.
The questionnaires reliability was statistically established by measuring the internal
consistency. In turn, internal consistency was measured by the use of Cronbach’s
Alpha (α). The alpha value ranges between 0 and 1 with reliability increasing
consistently with increase in value. Coefficient of 0.6-0.7 is a normally accepted rule
of thumb that designates acceptable reliability and 0.8 or higher indicates good
reliability (Greener, 2008). This study used cronbach’s Alpha test for the reliability of
the data collection tools, this was generated electronically with the help of SPSS.
3.6 Data Collection Procedure
The researcher sought a letter of introduction from Kenyatta University to be
presented to the motor insurance companies’ management. This may help the
researcher to gather information easily and the respondents involved in the study were
to be informed through writing. The researcher also obtained consent to collect data
through a letter to companies for the study and to be permitted to collect data and be
accorded assistance during collection of data. How the questionnaires were
distributed and how you ensured you collected appropriate data.
3.7 Data analysis and Presentation
The collected data was well examined and checked for completeness and
comprehensibility. Data was then summarized, coded and tabulated. Qualitative data
was analysed using content analysis to generate qualitative report which were

29
presented in a continuous prose. Quantitative data was analysed using descriptive
statistics such as means, standard deviation and frequency distribution were used to
analyse the data to establish the effects of risk mitigation strategies on performance of
insurance industry in Kenya: a case of motor insurance companies
Inferential statistics such as regression and correlation analysis was used to establish
the effects of risk mitigation strategies on performance of insurance industry in
Kenya: a case of motor insurance companies.The response on risk mitigation
strategies were measured by computing indices based on the responses derived from
the Likert-Scaled questions. The study adopted linear equation model as presented.
Y = α+ βX1 + β2X2 + β3X3 + β4X4+ є
Y= Performance
X1 = Risk Controlling Strategy
X2= Risk Avoidance Strategy
X3= Risk based audit strategy
X4= Product Mix Strategy
α = Constant
β= Coefficient factor
β1-4 = the regression coefficient or change included in Y by each χ,
є = error term
3.8 Ethical considerations
The ethical principle of confidentiality and respect are relevant and important in this
study. This is because slum upgrading project has encountered enough shares of
political witch hunt and envy. In this regard, informed consent of the respondents
were sought before recruitment into the study. Confidentiality and anonymity were
ascertained by using codes to represent the respondents instead of names and data was
collected in private and secure environment, only the people involved in collecting the
data had access to it.

30
Plagiarism which is an academic theft was avoided at all cost. With the help of
incitation and reference list, the researcher honestly acknowledged borrowed
resources from other previous scholars and authors. The study adopted APA 6th
edition to help evade plagiarism and any other form of academic dishonesty.

31
CHAPTER FOUR
DATA ANALYSIS, INTERPRETATION AND DISCUSSION OF THE
FINDINGS
4.1 Introduction
This section presents and discusses the findings on Risk mitigation strategies and
performance of insurance industry in Kenya. The findings are presented according to
the research objectives. The demographic characteristics were presented first,
followed by findings based on the objectives of the study.
4.2 Response Rate
The study targeted 54 respondents from the insurance sector and managed to get data
from all of them, this was a response rate of (100%), which was a sufficient response
rate for a valid scientific generalization. Onen and Yuko (2011) recommend a
response rate of above 80% as good enough for a scientific study.
4.3 Reliability Test of the Instrument
Five questionnaires were piloted by giving to individuals who were not included in
the final study sample. The 5 questionnaires were coded and responses input into
SPSS which was used to generate the reliability coefficient. The researcher used the
most common internal consistency measure known as Cronbach’s Alpha (α) which
will be generated by SPSS. It indicates the extent to which a set of test items can be
treated as measuring a single latent variable (Cronbach, 1951). The recommended
value of 0.7 was used as a cut–off of reliability for this study. All the variables were
found to be reliable since their Cronbach alpha was above 0.7 which was used as a
cut-off of reliability for the study. Table 4.1 shows the reliability results.

32
Table 4.1 Reliability of Risk Mitigation Strategies and Performance of Insurance
Industry
Variable No of Items Respondents α=Alpha Comment
Risk Control Strategy 8 5 0.723 Reliable
Risk Avoidance Strategy 6 5 0.758 Reliable
Risk-based audit Strategy 8 5 0.777 Reliable
Product Mix Strategy 7 5 0.764 Reliable
Performance 5 5 0.795 Reliable
Source: Survey Data (2016)
4.4 Demographic Characteristics of the Respondents
This section consists of information that describes the basic characteristics of the
respondents such as their gender, department of their work, the years of working in
the current company as well as their age brackets. These variables were carefully
selected as they were deemed to add more value to the findings and were in line with
the objectives.
4.4.1 Gender and Age of the respondents
The respondents were asked to indicate their age and gender. The findings are
presented in Table 4.2
Table 4.2 Gender and Age of Respondents
Count
Age
Total
Percent
(gender)
21-25 26-30 31-35 36-40 41-45 46-50
Gender
Male 0 2 8 14 5 4 33 61.1
Female 1 4 5 7 3 1 21 38.9
Total
1 6 13 21 8 5 54 100.0
Percent
(age) 1.90% 11.10% 24.1% 38.9% 14.8% 9.30% 100.0%
Source: Survey Data (2016)
The findings presented in Table 4.2 reveals that 61.1% of the respondents were male
while 38.9% were female, implying that most of the employees in the insurance

33
industry are male. 21 employees were aged between 36 to 40 years; 13employees
were aged between 31to 35 years, 8 employees aged between 41 to 45 years, 6
employees aged between 26 to 30 years, 5 employees aged between 46 to 50 years
and only one employee aged between 21 to 25 years implying that motor insurance
industry has more middle aged employees.
4.4.2 Period of Work and Department
The respondents were asked to indicate the period they had worked in the
organisation and the departments they were in. The findings are presented in Table
4.3.
Table 4.3 Period of Work and Department
Count
Department
Total
Percent
(Period
of
service)
Risk Finance Audit
Human
resource Operations
Years of
service in
the current
company
Less
than 1
year 1 0 2 0 2 5
9.3
1-2years 3 0 3 1 6 13 24.1
2-5years 4 1 2 1 0 8 14.8
5-
10years 0 6 5 4 6 21
38.9
Over
10years 3 4 0 0 0 7
13.0
Total
11 11 12 6 14 54 100
Percent
(Departme
nt) 20.4 20.4 22.2 11.1 25.9 100.0
Source: Survey Data (2016)
The findings presented in Table 4.3 reveals that Majority of the respondents, 51.9%,
had been in their organization for more than five years, this added a lot of value to the
study because of the wealth of information they provided and experience they brought
to the study. The results in Table 4.3 further show that organizations tend to entrust
those who are well grounded in sensitive issues like the finances and risk mitigation
departments. According to one of the human resource officers from one of the motor

34
vehicle insurance companies sampled, this was because; those who had been in the
organization for long period had better understanding of issues and work ethics.
4.5 Descriptive Statistics
This section presents the descriptive results based on the research objectives of this
study. It presents the descriptive results on risk control strategy, risk limitation
strategy, product mix strategy, risk based auditing strategy and performance of
insurance industry in Kenya.
4.5.1 Risk Controlling Strategy
Risk control is the method by which firms evaluate potential losses and take action to
reduce or eliminate such threats. Risk control is a method that uses findings from risk
assessments such as knowing potential risk factors in a company’s operations
originating from technical and non-technical aspects of the business, financial
policies, and other policies that may affect the well-being of the company, and
implementing changes to reduce risk in these areas. Descriptive Results for Risk
Controlling strategy are presented in table 4.4
Table 4.4 Risk Controlling Policy
Descriptive Statistics
Risk controlling
Total
N Mean Standard Deviation
Assessing risks 54 3.833 1.270
Overhead cost 54 3.370 1.405
General risk control 54 3.907 1.217
Operating efficiency 54 3.407 1.339
Policy controlling indicators 54 2.833 1.424
Valid N
Source: Survey Data (2016)
Results in table 4.4 shows that, a mean of 3.833 and standard deviation of 1.270, the
findings showed that a majority of the respondents felt that assessing risks was
considered to a great extent in their company. Similarly, overhead costs were also
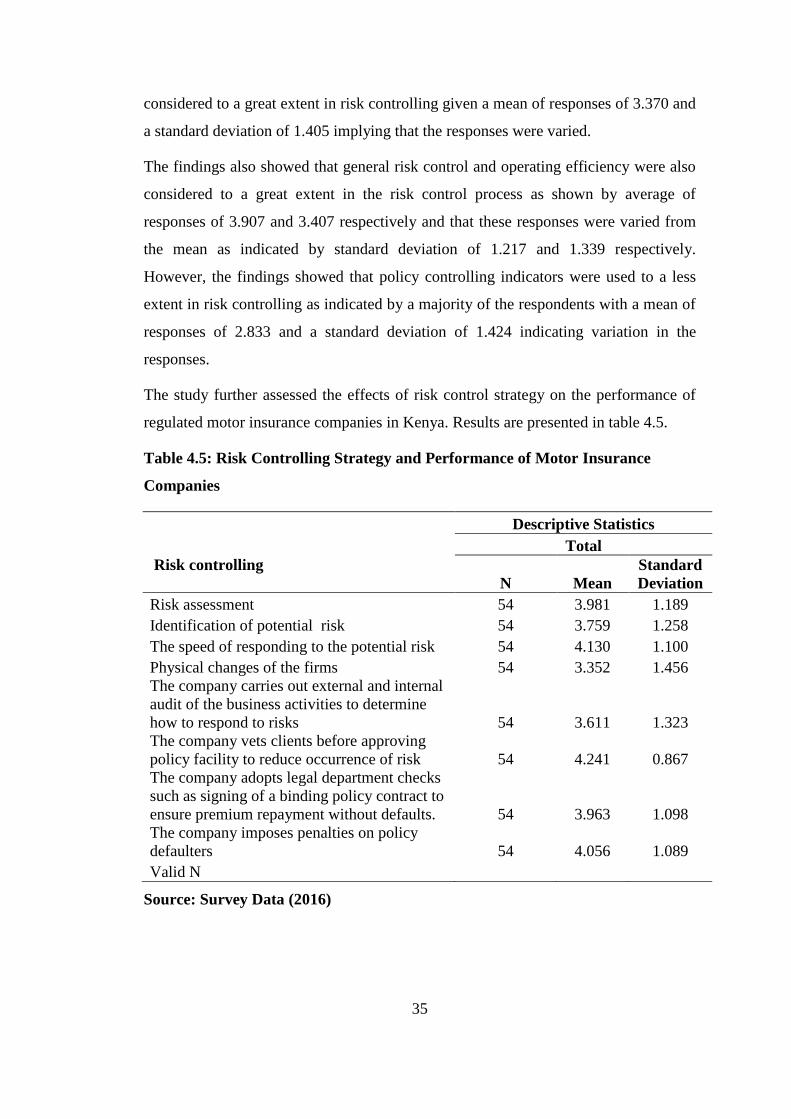
35
considered to a great extent in risk controlling given a mean of responses of 3.370 and
a standard deviation of 1.405 implying that the responses were varied.
The findings also showed that general risk control and operating efficiency were also
considered to a great extent in the risk control process as shown by average of
responses of 3.907 and 3.407 respectively and that these responses were varied from
the mean as indicated by standard deviation of 1.217 and 1.339 respectively.
However, the findings showed that policy controlling indicators were used to a less
extent in risk controlling as indicated by a majority of the respondents with a mean of
responses of 2.833 and a standard deviation of 1.424 indicating variation in the
responses.
The study further assessed the effects of risk control strategy on the performance of
regulated motor insurance companies in Kenya. Results are presented in table 4.5.
Table 4.5: Risk Controlling Strategy and Performance of Motor Insurance
Companies
Risk controlling
Descriptive Statistics
Total
N Mean
Standard
Deviation
Risk assessment 54 3.981 1.189
Identification of potential risk 54 3.759 1.258
The speed of responding to the potential risk 54 4.130 1.100
Physical changes of the firms 54 3.352 1.456
The company carries out external and internal
audit of the business activities to determine
how to respond to risks 54 3.611 1.323
The company vets clients before approving
policy facility to reduce occurrence of risk 54 4.241 0.867
The company adopts legal department checks
such as signing of a binding policy contract to
ensure premium repayment without defaults. 54 3.963 1.098
The company imposes penalties on policy
defaulters 54 4.056 1.089
Valid N
Source: Survey Data (2016)

36
Results presented in table 4.5 showed that risk assessment influenced performance of
motor insurance companies to large extent as shown by a mean of responses of 3.981
and a standard deviation of 1.189 meaning that the responses were varied
Majority of the respondents also indicated that identification of potential risk
influenced the performance of the companies to a great extent as shown by a mean of
responses of 3.759 and a standard deviation of 1.258. Similarly, the speed of
responding to potential risk also influenced their performance to a great extent as
indicated by a mean of responses 4.130 and standard deviation of 1.100. Physical
changes of the firms were also stated as influencing performance to a great extent
given a mean of responses of 3.352 and standard deviation of 1.456.
The results further showed that conducting external and internal audit of the business
activities to determine how to respond to risks and vetting of before approving policy
facility to reduce occurrence of risk influenced the performance of motor insurance
companies to a great extent as indicated by means of responses of 3.611 and 4.241
respectively and the responses were varied given standard deviations of 1.323 and
0.867 respectively.
Adopting legal department checks such as signing of a binding policy contract to
ensure premium repayment without defaults and imposing penalties on policy
defaulters were also found to influence the performance of the companies to a great
extent given mean of responses of 3.963 and 4.056 respectively and standard
deviation of 1.098 and 1.089 respectively
4.5.2 Risk Avoidance Strategy
The study sought to find out the extent to which motor insurance companies focused
on various types of risks in the risk identification step. The results are as presented in
Table 4.6.

37
Table 4.6: Types of Risks
Descriptive Statistics
Types of risks
Total
Mean Standard Deviation
Interest rate risks 3.852 0.899
Liquidity risks 3.778 1.176
Political risks 3.019 1.325
Market risks 3.741 1.152
Credit risk 3.667 0.911
Technological risks 3.093 1.444
Valid N
Source: Survey Data (2016)
Results in table 4.6 revealed that these companies focused to a great extent on interest
rate risks, liquidity risks, market risks and credit risks as shown by the mean of
responses of 3.852, 3.778, 3.741 and 3.667 respectively and these responses were
varied. The companies also focused on political risks and technological risks but on a
moderate extent given the mean of responses of 3.019 and 3.093.
It is important to clarify the different risks in relation to the amount of damage they
possibly cause (Fuser, Gleine, & Meier, 1999). This ensures division of risks by the
management that are threatening the existence of the corporation from those which
can cause slight damages. There is a relationship between the expected amount of loss
and its corresponding likelihood that risks that will cause a high damage to a
corporation like earthquakes or fire occur seldom, while risks that occur daily such as
interest rate risks or foreign exchange risks often cause relatively minor losses only,
(Fatemi & Glaum, 2000).
The study further sought to assess the influence of risk limitation strategy on the
performance of regulated motor insurance companies in Kenya. The respondents were
therefore asked to rate the importance of various aspects of risk limitation in
influencing the performance of the companies. The results are as presented in Table
4.7.

38
Table 4.7: Risk Avoidance Strategy and Performance of Motor Insurance
Companies
Descriptive Statistics
Total
Risk limitation N Mean
Standard
Deviation
Adequate intra company
communication 54 3.574 1.283
Realistic risk control 54 3.778 1.254
Reducing scope to avoid high-risk
activities 54 3.370 1.186
Use of expertise in assessing risk 54 4.019 1.205
Adopting a familiar approach
instead of an innovative risk
measures 54 3.815 1.245
Avoidance of risk 54 3.889 1.127
Valid N 54
Source: Survey Data (2016)
The results presented in Table 4.7 showed that adequate intra company
communication was important in influencing the performance of these companies as
indicated by a majority of the respondents where the mean of responses was 3.574
and a standard deviation of 1.283 implying that the responses were varied. Realistic
risk control was also stated by a majority of the respondents as important in
influencing the performance of motor insurance companies as portrayed by a mean of
responses of 3.778 and standard deviation of 1.254 showing that there was variation
in the responses.
In addition, reducing scope to avoid high-risk activities was also noted as important
factor influencing the performance of these companies as shown by a mean of
responses of 3.370 and a standard deviation of 1.186. The findings further showed
that a majority of the respondents asserted that the use of expertise in assessing risk

39
was very important in influencing the performance of these companies as shown by a
mean of responses of 4.019 and a standard deviation of 1.205 which showed that the
responses from the respondents were varying.
Similarly, adopting a familiar approach instead of an innovative risk measures and
avoidance of risks were important influencers of the companies’ performance given a
mean of responses of 3.815 and 3.889 respectively and these responses were also
varied as portrayed by the standard deviations.
These findings are in line with that of Kieyah (2011) who found that lack of clearly
defining limits, misguiding report, inadequate communication concerning risk
sensitivity, unrealistic risk control, inefficient knowledge of the business environment
and lack of timely decision making. As a result, various interested parties such as
shareholders and other corporate entities are deprived of valuable information, which
could lead to the formulation of more comprehensive and reliable risk systems,
particularly as they relate to information systems.
The findings are also in line with the traditional risk limitation strategies which
suggest that risk evaluation process may allow individual biases to affect the
assessment. Assessments by unknowledgeable participants get in the way often
skewing the results.
Second, the process is doesn’t address the unique characteristics of the company’s
risks. While using a common analytical framework to assess risks with different
characteristics and time horizon considerations may make the process easier to
execute, it is not robust enough to add value continuously over time, may ignore the
interplay among related risks and does not alleviate the fundamental problem of
limited information.
The integrity of the risk assessment process can be impaired by the overconfidence
that can be bred by an overly simplified view of the future. Overconfidence is often
driven by the degree of success managers have experienced in the past and the quality
and coherence of the story line managers construct regarding the future, rather than by
business realities
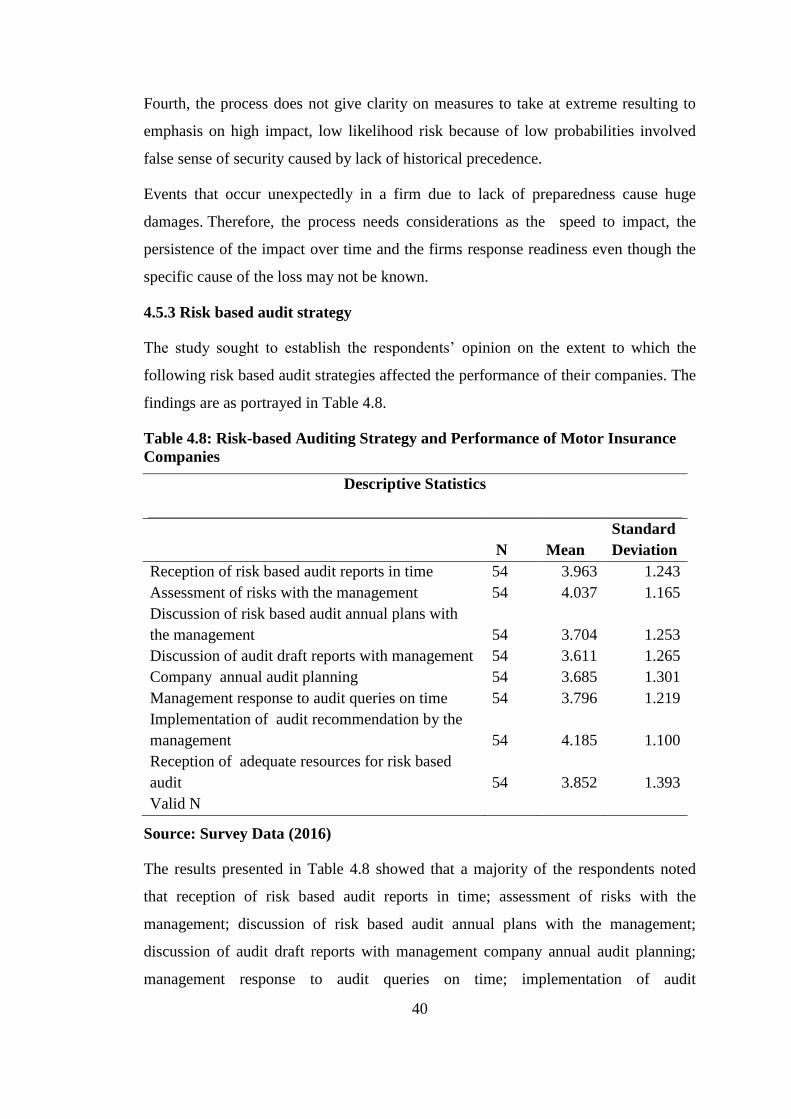
40
Fourth, the process does not give clarity on measures to take at extreme resulting to
emphasis on high impact, low likelihood risk because of low probabilities involved
false sense of security caused by lack of historical precedence.
Events that occur unexpectedly in a firm due to lack of preparedness cause huge
damages. Therefore, the process needs considerations as the speed to impact, the
persistence of the impact over time and the firms response readiness even though the
specific cause of the loss may not be known.
4.5.3 Risk based audit strategy
The study sought to establish the respondents’ opinion on the extent to which the
following risk based audit strategies affected the performance of their companies. The
findings are as portrayed in Table 4.8.
Table 4.8: Risk-based Auditing Strategy and Performance of Motor Insurance
Companies
Descriptive Statistics
N Mean
Standard
Deviation
Reception of risk based audit reports in time 54 3.963 1.243
Assessment of risks with the management 54 4.037 1.165
Discussion of risk based audit annual plans with
the management 54 3.704 1.253
Discussion of audit draft reports with management 54 3.611 1.265
Company annual audit planning 54 3.685 1.301
Management response to audit queries on time 54 3.796 1.219
Implementation of audit recommendation by the
management 54 4.185 1.100
Reception of adequate resources for risk based
audit 54 3.852 1.393
Valid N
Source: Survey Data (2016)
The results presented in Table 4.8 showed that a majority of the respondents noted
that reception of risk based audit reports in time; assessment of risks with the
management; discussion of risk based audit annual plans with the management;
discussion of audit draft reports with management company annual audit planning;
management response to audit queries on time; implementation of audit

41
recommendation by the management and reception of adequate resources for risk
based audit affected the performance of the regulated insurance companies to a great
extent as given by mean of responses of 3.963, 4.037, 3.704, 3.611, 3.685, 3.796,
4.185 and 3.852 respectively. The standard deviations which were greater than 1
implied that the answers given were varied.
Based on the findings above, the respondents felt reception of risk based audit reports
on time and timely assessment of the risk may significantly reduce and mitigate risk.
The mean responses of the above data indicated that the companies had succeeded in
mitigating risks based on the two strategies. This confirms the findings of an earlier
study by Ochome (2011) that implementing a risk-based strategy requires that life
insurance companies and intermediaries have a good understanding of the risks and
are able to exercise sound judgment.
4.5.4 Product Mix Strategy
The study assessed the effectiveness of use of various product mix strategies in
mitigating risk in regulated motor insurance companies. The respondents were
therefore asked to rate the extent to which the use of these product mix strategies were
effective. The findings are as shown in Table 4.9.

42
Table 4.9: Effectiveness of Product Mix Strategies in Mitigating Risks
Descriptive Statistics
Product Mix Strategies Total
N Mean
Standard
Deviation
Number of total products 54 3.815 1.214
Number of new product lines that your
company sells 54 2.852 1.595
Total number of variations for each product 54 3.685 1.286
Valid N
Source: Survey Data (2016)
Results presented in table 4.9 shows that a majority of the respondents were of the
opinion that the number of total products provided by a company was effective to a
great extent in mitigating risks as shown by a mean of responses of 3.815 and
standard deviation of 1.214 meaning that the responses were varied.
Similarly, the findings showed that the total number of variations for each product
was effective to a great extent in mitigating risks in these companies as supported by a
mean of responses of 3.685 and standard deviation of 1.286. However, the number of
new product lines that a company sold was found to be effective to a less extent in
risk mitigation as illustrated by a mean of responses of 2.852 and standard deviation
of 1.595.
These findings support that of Amonde (2013) who found that diversification of
products in a company featured even within each product line, may create challenges
regarding the required efforts and timing for experience monitoring at the product
level. In addition its not to set assumptions and a risk limit for new products. From
this perspective, it may be more valuable as a tool to identify risks and adverse trends
than to set a limit (Shang & Chen, 2012).

43
Insurance companies manage to provide protection from insured risk at a reasonable
price developing different product mix and due to the pooling of individual exposures.
Sometimes, an insurance company contracts its product mix. Contraction consists of
dropping or eliminating one or more product lines or product items. This strategy
results into more profits from fewer products. Instead of developing completely a new
product, marketer may improve one or more established products. Improvement or
alteration can be more profitable and less risky compared to completely a new
product.
The study further assessed the influence of product mix strategy on the performance
of regulated motor insurance companies in Kenya. The findings are as show in Table
4.10.
Table 4.10: Product Mix Strategy and Performance of Motor Insurance
Companies
Descriptive Statistics
Total
Product mix strategies N Mean
Standard
Deviation
Product designing of the motor policy 54 3.852 1.106
Pricing of the motor vehicle policy premium 54 3.741 1.2
Communication of new product to clients 54 3.537 1.37
Saving features attached to motor policy 54 3.574 1.326
Channel for premium pay 54 3.519 1.059
Implementation and maintenance with respect
to motor vehicle policy 54 3.648 1.334
Premium payment process 54 3.722 1.295
Valid N 54
Source: Survey Data (2016)
From results in table 4.10, it was found that product designing of the motor policy;
pricing of the motor vehicle policy premium and communication of new product to
clients were found to influence the performance of motor insurance companies to a

44
great extent as shown by a mean of responses of 3.852, 3.741 and 3.537 respectively.
The standard deviation showed that the responses given were varied.
The findings also showed that the saving features attached to motor policy, channel
for premium pay; implementation and maintenance with respect to motor vehicle
policy and premium payment process also contributed to a great extent to the
performance of the companies as depicted by the mean of responses of 3.574, 3.519,
3.648 and 3.722 respectively where the standard deviations showed that the answers
given were spread from the mean.
4.5.5 Performance of Regulated Motor Insurance Companies
The study further sought to establish the measures of performance that motor
insurance companies used in assessing the impact of risk management strategies. The
findings are as shown in Table 4.11.
Table 4.11 Performance of Regulated Motor Insurance Companies
Descriptive Statistics
Total
Performance indicators N Mean
Standard
Deviation
Increasing savings 54 3.556 1.538
Improve Motor Insurance Wealth 54 3.852 1.352
Development of alternative investment
products e.g. insurance 54 3.722 1.14
Increase in shareholders of the Motor
Insurance 54 3.704 1.327
Improved reduction of defaults 54 3.759 1.427
Valid N
Source: Survey Data (2016)

45
The study findings in Table 4.11 reveal that increasing savings; improved motor
insurance wealth; development of alternative investment products e.g. insurance;
increase in shareholders of the motor insurance and improved reduction of defaults
were used to a great extent as performance indicators in the motor insurance
companies. This is supported by mean of responses of 3.556, 3.852, 3.722, 3.704 and
3.759 respectively and these responses were varied.
The findings also imply that improved motor insurance wealth was the highest
indicator for success in this industry as a majority of the respondents felt that it was
the most measurable indicator. Business entities exist for profits, profits are then
supposed to translate to growth in asset base and wealth for the organization. In the
industry of motor vehicle insurance industry, the fewer the number of reported cases
the better for the company in terms of business and profits.
4.6 Inferential Statistics
Inferential analysis was conducted to generate correlation results, model of fitness,
and analysis of the variance and regression coefficients.
4.6.1 Correlation Analysis
Table 4.12 presents the results of the correlation analysis.

46
Table 4.12: Correlation Matrix
Correlations
Risk
Control
Strategy
Risk
Avoidance
Strategy
Product
Mix
Strategy
Risk
based
Audit
Strategy Performance
Risk
Control
Strategy
Pearson
Correlation 1.000
Sig. (2-tailed)
Risk
Limitation
Strategy
Pearson
Correlation 0.235 1.000
Sig. (2-
tailed) 0.088
Product Mix
Strategy
Pearson
Correlation 0.276* 0.340* 1.000
Sig. (2-
tailed) 0.044 0.012
Risk based
Audit
Strategy
Pearson
Correlation 0.273* 0.211 0.299* 1.000
Sig. (2-
tailed) 0.046 0.126 0.028
Performance
Pearson
Correlation 0.514** 0.494** 0.547** 0.482** 1.000
Sig. (2-
tailed) 0.000 0.000 0.000 0.000
* Correlation is significant at the 0.05 level (2-tailed).
** Correlation is significant at the 0.01 level (2-tailed).
Source: Survey Data (2016)
The results in table 4.12 revealed that risk control strategy and performance of
regulated motor insurance companies were positively and significantly
associated(r=0.514, p=0.000). The results further indicated that risk avoidance
strategy and performance of regulated motor insurance companies were positively and
significantly associated (r=0.494, p=0.000). It was further established that product
mix strategy had a positive and significant association with the performance of
regulated motor insurance companies (r=0.547, p=0.000). Similarly, the results
showed that risk based audit strategy and performance of regulated motor insurance
companies were positively and significantly related (r=0.482, p=0.000). This implies

47
that an increased usage of any of these risk mitigation strategies leads to an increase
in the performance of regulated motor insurance companies in Kenya.
4.6.1.1 Diagnostic test
Prior to running a regression model pre-estimation and post estimation tests were
conducted. The pre-estimation tests conducted in this case were the multicollinearity
test while the post estimation tests were normality test and test for heteroskedasticity.
This is usually performed to avoid spurious regression results from being obtained.
4.6.1.2 Test for Multicollinearity
According to William et al. (2013), multicollinearity refers to the presence of
correlations between the predictor variables. In severe cases of perfect correlations
between predictor variables, multicollinearity can imply that a unique least squares
solution to a regression analysis cannot be computed (Field, 2009).
Multicollinearity inflates the standard errors and confidence intervals leading to
unstable estimates of the coefficients for individual predictors (Belsleyet al., 1980).
Multicollinearity was assessed in this study using the variance inflation factors (VIF).
According to Field (2009) VIF values in excess of 10 is an indication of the presence
of Multicollinearity. Results are presented in Table 4.13.
Table 4.13: Multicollinearity results using VIF
Variable VIF 1/VIF
Risk Control Strategy 1.31 0.764558
Risk avoidance Strategy 1.23 0.812079
Risk based audit strategy 1.14 0.880611
Product Mix Strategy 1.08 0.926855
Mean VIF 1.19
The results in Table 4.13 present variance inflation factors results and were
established to be 1.19 which is less than 10 and thus according to Field (2009)
indicates that there was no Multicollinearity.
4.6.1.3 Test for Normality
The test for normality was examined using the graphical method approach as shown
in the Figure 4.1 below.

48
Figure 4.1: Test for Normality
The results in figure 4.1 indicate that the residuals are normally distributed.
4.6.1.4 Heteroskedasticity test
The error process may be Homoskedastic within cross-sectional units, but its variance
may differ across units: a condition known as group wise Heteroscedasticity. The
hettest command calculates Breuch Pagan for group wise Heteroscedasticity in the
residuals. The null hypothesis specifies that σ2
i =σ2 for i =1...Ng, where Ng is the
number of cross-sectional units. Results are presented in table 4.14.
Table 4.14: Heteroskedasticity Results
Breuch-Pagan / Cook-Weisberg test for heteroskedasticity
Ho: Constant variance
Variables: fitted values of Growth
chi2(1) = 83.66
Prob> chi2 = 0.0710
The results in Table 4.14 indicate that the null hypothesis of Homoskedastic error
terms is not rejected as supported by a p-value of 0.0710.
0
.05
.1.1
5.2
.25
Den
sity
-5 0 5 10 15Residuals

49
4.7 Regression Analysis
The results presented in Table 4.15 present the fitness of model used of the regression
model in explaining the study phenomena.
Table 4.15: Model Fitness
Model Summary
Model R R Square Adjusted R Square Std. Error of the Estimate
1 .756a 0.572 0.537 0.459866
a Predictors: (Constant), Risk based audit strategy, Risk avoidance Strategy, Risk
Control Strategy, Product Mix Strategy
Source: Survey Data (2016)
Results in table 4.15 revealed that Risk control strategy, risk avoidance strategy,
product mix strategy and risk based audit strategy were found to be satisfactory
variables in explaining the performance of regulated motor insurance companies in
Kenya. This is supported by coefficient of determination also known as the R square
of 57.2%.This means that risk control strategy, risk avoidance strategy, product mix
strategy and risk based audit strategy explained 57.1% of the variations in the
dependent variable which is the performance of regulated motor insurance companies
in Kenya. These results also imply that the model applied to link the relationship of
the variables was satisfactory.
In statistics, significance testing using the p-value indicates the level of relation of the
independent variable to the dependent variable. If the significance number is found to
be less than the critical value also known as the probability value (p) which is
statistically set at 0.05, then the conclusion would be that the model is significant in
explaining the relationship; otherwise the model would be regarded as non-
significant. Table 4.16 provides the results on the analysis of the variance (ANOVA).

50
Table 4.16: Analysis of Variance
ANOVA
Model
Sum of
Squares Df
Mean
Square F Sig.
1 Regression 13.839 4 3.46 16.36 .000
Residual 10.362 49 0.211
Total 24.201 53
a Dependent Variable: Performance
b Predictors: (Constant), Risk based audit strategy, Risk avoidance Strategy, Risk
Control Strategy, Product Mix Strategy
Source: Survey Data (2016)
The results in table 4.16 indicate that the overall model was statistically significant.
Further, the results imply that the independent variables are good predictors of
performance of regulated motor insurance companies in Kenya. This was supported
by an F statistic of 16.36 and the reported p value (0.000) which was less than the
conventional probability of 0.05significance level.Table 4.17 shows results of
Regression of coefficients.
Table 4.17: Regression Coefficients
Coefficients
Model
Unstandardized
Coefficients
Standardized
Coefficients t Sig.
B
Std.
Error Beta
1 (Constant) -2.098 0.723
-2.901 0.006
Risk
Control
Strategy 0.431 0.144 0.299 2.983 0.004
Risk
Limitation
Strategy 0.370 0.139 0.269 2.658 0.011
Product
Mix
Strategy 0.429 0.15 0.297 2.855 0.006
Risk
based
Audit
Strategy 0.323 0.127 0.255 2.536 0.014
a Dependent Variable: Performance
Source: Survey Data (2016)

51
Hence, the optimal model for this study was as shown;
Performance of regulated motor insurance companies = -2.098+ 0.323Risk based
Audit Strategy + 0.370Risk Limitation Strategy + 0.429Product Mix Strategy +
0.431Risk Control Strategy
Results in Table 4.18 shows that risk control strategy and performance of regulated
motor insurance companies in Kenya are positively and significantly related (r=0.431,
p=0.004). An increase in the unit change in risk control strategy would lead to an
increase in the performance of regulated motor insurance companies by 0.431 units.
The results further indicate that risk avoidance strategy and the performance of
regulated motor insurance companies were positively and significantly related
(r=0.370, p=0.011). These results imply that an increase in the unit change in risk
limitation strategy would lead to an increase in the performance of regulated motor
insurance companies by 0.370 units.
It was further established that product mix strategy and performance of regulated
motor insurance companies were positively and significantly related (r=0.429,
p=0.006) while risk based audit strategy and performance of regulated motor
insurance companies were also positively and significantly related (r=0.323,
p=0.014). This shows that an increase in the unit change in product mix strategy and
risk based audit strategy would lead to an increase in the performance of regulated
motor insurance companies by 0.429 and 0.323 units respectively.
The findings are consistent with that of Yusuwan, Adnan & Omar, (2008) who
studied on the risk management practices on construction project companies
specifically in Klang Valley, Malaysia and found out that risk management affects
production, outcome, efficiency and project finances and that risk management is
suitable to apply for project with certain characteristics such as new technology.
The finding is also consistent with that of Salesio,(2013) who carried out a study with
an aim of identifying the types of risks mitigated by the Kenyan insurers, mitigation
strategies and. techniques adopted, and the challenges facing the insurers in risk
mitigation process and found out that the Kenyan insurance industry was mainly
found to be vulnerable to economic risks and legal risks.

52
However, the industry was also affected by political risks, technological risks, socio-
cultural risks, geographical risks, management risks and personnel risks to a moderate
extent. These were mainly mitigated using, risk avoidance, risk retention, risk transfer
and risk reduction techniques. Towards ensuring sustainability in the industry, there is
an urgent need for the insurance firms to frequently train their staff on risk mitigation,
empower risk managers, identify and train internal risk experts, and provide adequate
budgetary allocations for risk mitigation.

53
CHAPTER FIVE
SUMMARY OF THE FINIDNGS, CONCLUSIONS AND
RECOMMENDATIONS
5.1 Introduction
This chapter deals with the summary of the findings, the conclusion and
recommendations. This was done in line with the objectives of the study. Areas of
further research were suggested and limitations of the study were taken into account.
5.2 Summary of the findings
The study targeted 54 respondents from the insurance sector and managed to get data
from all of them, this was a response rate of (100%), which was a sufficient response
rate for a valid scientific generalization. Five questionnaires were piloted by issuing to
individuals who were not included in the final study sample. The 5 questionnaires
were coded and responses input into SPSS which was used to generate the reliability
coefficient. The researcher used the most common internal consistency measure
known as Cronbach’s Alpha (α) which will be generated by SPSS. All the variables
were found to be reliable since their Cronbach alpha was above 0.7 which was used as
a cut-off of reliability for the study.
The first objective of the study was to determine the effects of risk controlling
strategy on performance of Motor Insurance Companies. Correlation analysis revealed
that risk control strategy and performance of regulated motor insurance companies
were positively and significantly associated(r=0.514, p=0.000). Further, regression
analysis shows that risk control strategy and performance of regulated motor
insurance companies in Kenya are positively and significantly related (r=0.431,
p=0.004). An increase in the unit change in risk control strategy would lead to an
increase in the performance of regulated motor insurance companies by 0.431 units.
The second objective of the study was to establish the extent to which risk avoidance
influences performance of Motor Insurance Companies.Correlation analysis revealed
that risk avoidance strategy and performance of regulated motor insurance companies
were positively and significantly associated (r=0.494, p=0.000). Further, regression
analysis shows that risk avoidance strategy and the performance of regulated motor
54
insurance companies were positively and significantly related (r=0.370, p=0.011).
These results imply that an increase in the unit change in risk limitation strategy
would lead to an increase in the performance of regulated motor insurance companies
by 0.370 units.
The third objective of the study was to establish influence of risk based audit strategy
on performance of Motor Insurance Companies. Correlation analysis showed that risk
based audit strategy and performance of regulated motor insurance companies were
positively and significantly related (r=0.482, p=0.000). This implies that an increased
usage of any of these risk mitigation strategies leads to an increase in the performance
of regulated motor insurance companies in Kenya. Further, regression analysis shows
that risk based audit strategy and performance of regulated motor insurance
companies were also positively and significantly related (r=0.323, p=0.014). This
shows that an increase in the unit change in risk based audit strategy would lead to an
increase in the performance of regulated motor insurance companies by 0.323 units.
The fourth objective of the study was determine influence of product mix strategy on
performance of Motor Insurance Companies .Correlation analysis revealed that
product mix strategy had a positive and significant association with the performance
of regulated motor insurance companies (r=0.547, p=0.000). Further, regression
analysis shows that product mix strategy and performance of regulated motor
insurance companies were positively and significantly related (r=0.429, p=0.006).
This shows that an increase in the unit change in product mix would lead to an
increase in the performance of regulated motor insurance companies by 0.429 units.
5.3 Conclusion
The study concluded that when proper Risk Controlling Strategies are adopted, it
leads to an improvement in performance of Motor Insurance Companies. Risk control
uses information gained during risk assessments and develops and applies changes to
control the risks. Risk control can involve the implementation of new polices and
standards, physical changes and procedural changes that can reduce or eliminate
certain risks within the business.

55
The study concluded that an improvement in Risk avoidance Strategy translates to an
improvement in performance of Motor Insurance Companies. Risk avoidance strategy
is modification of the project plan to eliminate the risk or condition or to protect the
project objectives from its impact. Although the management team can never
eliminate all risk events, some specific risks may be avoided. Some risk events that
arise early in the company can be dealt with by clarifying requirements, obtaining
information, improving communication, or acquiring expertise.
In addition, the study concluded that adoption of proper Risk based audit leads to an
improvement in performance of Motor Insurance Companies. Increased concerns
regarding corporate accountability in insurance companies have been associated with
the need for appropriate Risk Based Audit which involves risk management and
internal control systems. This has been reflected through recent voluntary corporate
governance guidelines.
Lastly, the study concluded that the adoption of proper product mix Strategy leads to
an improvement in performance of Motor Insurance Companies.Insurance Company
selling costly, prestigious, and premium insurance quality products can opt to add
lower- priced items in its costly and prestigious product lines. This is a unique product
mix strategy which eventually translates to better performance.
5.4 Recommendations
The study recommends that the motor insurance companies should work toward
investing more on risk controlling, risk avoidance, risk based audit and product mix
strategies in order to improve their performance. This because the study found out
that risk controlling, risk avoidance strategy, risk based audit strategy and product mix
strategy has a positive and significant effect on performance of Motor Insurance
Companies
The study recommends for insurance companies to deal with some risk events that
arise early in the company by identifying requirements, acquiring information,
improving communication, or acquiring expertise. Minimisation of scope to avoid
high-risk activities, increasing resources or time, using a familiar approach instead of
an innovative one, or avoiding an unfamiliar subcontractor may be examples of
avoidance.

56
Lastly the study recommends that the Project stakeholders should use multiple models
for estimating motor vehicle insurance companies in Kenya and duration rather than
relying on past experience and cost data from consultants. Lastly, motor vehicle
insurance companies in Kenya stakeholders should improve on performance of
projects by introducing a risk management models in each projects execute.
5.4 Areas for Further Research
This study made the following suggestions for further study; Effect of Credit risks
practices on the performance of insurance companies and the role of financial
facilities on risk mitigation in insurance companies.

57
REFERENCES
AKI (2014). The Association of Kenya Insurance. Insurance Industry Annual Report.
Nairobi: Sentrim.
AKI (2010). The Association of Kenya Insurance. Insurance Industry Annual Report.
Nairobi: Sentrim.
Allan, N., & Beer, L. (2006). Strategic Risk: It’s All in Your Head. Working Paper
Series. Bath: University of Bath, School of Management Publishers.
Andersen, K., &Terp, A. (2006). Risk Management. In T.J. Andersen (Ed.), Nairobi:
University of Nairobi Press.
Ali Fatemi & Martin Glaum (2000) Risk management practices of German firms.
Managerial Finance ,Vol 26(3),1-17.
Ellul, A. &Yerramilli, V. (2010). Stronger Risk, Lower Controls: Evidence from U.S.
Bank Holding Companies, National Bureau of Economic Research, Working
Paper 16178.
Ernst & Young (2012). Turning Risk into Results: How Leading Companies Use Risk
Management to Fuel Better Performance.
Finlay, P.N. (2000). Strategic Management: An introduction to business and corporate
strategy. Brussels: Prentice Hall.
GOK. (2010). Development and Employment in Kenya. Sessional Paper No.
4.Nairobi: Government Printer.
Henriksen, P., & Uhlenfeldt, T. (2006). Contemporary Enterprise-Wide Risk
Management Frameworks: A Comparative Analysis. In T.J. Andersen (Ed.),
Perspectives on Strategic Risk Management (pp. 107-129).
Johnson, G., & Scholes, K. (2002). Exploring Corporate Strategy: Text and cases (6th
ed.). Prentice Hall.
Richard Hall (1992). The strategic analysis of intangible resources, Strategic
Management Journal, Vol 13(2),135-144.
KPMG. (2006). Enterprise Risk Management in the United States: A 2006 Report
Card.

58
Magezi, J.K. (2003). A New Framework for Measuring the Credit Risk of a
Controlling. Institute for Monetary and Economic Studies (IMES), 1-45.
Meredith, L. (2004). The Ultimate Risk Manager. Boston: CUSP Communications
Group Inc.
David Mayers & Clifford W. Smith, Jr.(1987). Corporate Insurance and the Underinvestment
Problem, The Journal of Risk and Insurance, Vol 54 (1), 45-54
Merton, R.C. (1995). A Functional Perspective of Financial Intermediation, Financial
Management Journal, 24 (2), 23-41.
Merton, R.C. (2005). A Functional Perspective of Financial Intermediation, Financial
Management Journal, 24 (2), 23-41.
Mikes A. & R.S Kaplan. (2014).Towards a contingency. Theory of Enterprise Risk
Management. Working Paper 13-63.
Miller, K.D. (2007). A Framework for Integrated Risk Management in International n
Business. Journal of International Business Studies, 23(2), 311-331.
Monira, J.(2009). on Strategic Risk Management Copenhagen: Business School Press.
Power, M. (2004). The Risk Management of Everything: Rethinking the Politics of
Uncertainty, Demos, and London.
Quach, M. (2005). Problems in Managing Internal Development Projects in Multi-
Project Environments, International Journal of Project Management, 21 (395-
402)
Rejda, G. E. (2008). Principles of Risk Management and Insurance, Prentice Hall,
10th Ed.
Stulz, R.M. (2003). Risk Management and Derivatives. South-Western: Mason, Ohio.
Vaughan, E.J. & Vaughan, T.M. (2008). Fundamentals of Risk and Insurance, John
Wiley & Sons, Inc. 10 th Edition.
Vedpurishwar, A.V. (2001). A Strategic Approach to Enterprise Risk
Management.London: Global CEO Press.

59
Momo.O.A and Ukpong.M.S.(2013).Corporate Governance and its effects on the
Nigerian Insurance, European Journal of Globalization and Development
Research Vol 8 No 1.
Linbo Fan and Sherril Shaffer.(2004) Efficiency versus risk in large domestic US
banks; Managerial Finance ,Vol 30 No 9.
Venette, S. J. (2003). Risk Communication in a High Reliability Organization: APHIS
PPQ's Inclusion of Risk in Decision Making. Ann Arbor, MI: UMI Proquest
Information and Learning.
Timothy.W.Ruefli, James.M.Collins & Joseph.R.Lacugna (1999).Measures in
Strategic Management research,Vol 20,issue 2.
Fite.D. and P.Pfeiderer (1995). “Should firms use derivatives to manage risk?
In:Beaver.W. and G.Parker(eds) Risk management: Problems and solutions
Mc Graw-Hill, New York,NY,139-169.
Wanjohi, A. & Mugure, A. (2008). Factors affecting the growth of MSEs in
rural areas of Kenya: A case of ICT firms in Kiserian Township, Kajiado
District of Kenya. Unpublished.
Ward, S. and Chapman, C. (2003), Transforming project risk management into project
uncertainty management. International Journal of Management, Vol. 21(2),
Zwikael, O. and Ahn, M. (2011), The effectiveness of risk management: An analysis
of risk planning across enterprise industries and countries. Journal for Risk
analysis, Vol. 31 (1), 25-37
Thomas R. Eisenmann (2002) ,The effects of CEO equity ownership and firm
diversification on risk taking .Strategic Management Journal, Vol 23(6), 513-
534.
John.J.Y.Seo (2001) Demand Diversification under uncertainty and Market Power,
Vol 15, issue 4.
Antony Carey (2001) “Effective Risk Management in financial institutions: the turn
bull approach”, Balance Sheet, Vol 9, issue
60
APPENDICES
Appendix I: Questionnaire for Employees
Dear Respondent,
I am Janet Makokha Okumu, a student at Kenyatta University Reg no.
D53/OL/CTY/24244/2014, pursuing Master Degree in Strategic Management. In
order to achieve this, I am supposed to conduct a study on the Risk Mitigation
Strategies and Performance of Insurance Industry: Case of Motor Insurance. I
therefore request you to assist me with any information on this topic. Your responses
will be treated with utmost confidentiality for purposes of this academic report only.
I thank you most sincerely for your participation.
Signature: ------------------------------------------- Date: ----------------------------
Section A: Socio-Demographic Information. Indicate with a (tick) in the spaces
provided
1. Indicate department you work in
Credit [ ]
Finance [ ]
Audit [ ]
Human resource [ ]
Operation [ ]
2. Kindly state your age bracket
18-30 years [ ]
30- 40 years [ ]
40-50 years [ ]
Above 50 years [ ]
3. Years of service in your current company?
Less than 1 year
1-2 years [ ]
2-5 years [ ]
5-10 years [ ]

61
Over 10 years [ ]
4. Gender of the Respondents Male ( ) Female ( )
SECTION B: RISK CONTROL STRATEGY Indicate with a (tick) in the
spaces provided
4 How would you rate the following Risk control strategies involved in risk control
for the policies in your regulated Motor Insurance? Use a scale of 1 to 5 where 1
is to a great extent and 5 is to no extent.
Risk Controlling Strategies 1 2 3 4 5
Termination of Risk
Treatment of the Risk
Transfer
Tolerate
6. Indicate the rating on how regulated Motor Insurance considers the following
risk\control measures in establishing a policy Controlling policy? Where 1 is to a very
great extent and 5 is to no extent.
Risk Controlling 1 2 3 4 5
assessing risks
Overhead cost
General risk control
Operating efficiency
Policy Controlling indicators

62
7. To what extent do the following Risk Control strategies influence performance in
Your Company?.Use a scale of 1 to 5 where:
1. No extent at all 2. No extent 3. Little extent 4. Great extent 5. Very great extent
Credit Risk Control 1 2 3 4 5
Risk assessment
Identification of potential risk
The speed of responding to the potential risk
Physical changes of the firms
The company carries out external and internal audit of the business
activities to determine how to respond to risks.
The company vets clients before approving policy facility to reduce
occurrence of risk.
The company adopts legal department checks such as signing of a
binding policy contract to ensure premium repayment without defaults.
The company imposes penalties on policy defaulters

63
5 Risk Avoidance Strategy
8. Rate the extent to which this Motor Insurance companies focuses on the types of
risks in the risk identification step. Use a scale of 1 to 5 where 1 is to a great extent
and 5 is to no extent.
Risk identification 1 2 3 4 5
Interest rate risks
Liquidity risks
Political risks
Market risks
Credit risk
Technological risks
9. Rate the extent of use of the risk limitations in managing risks in Motor vehicle
influence performance? Use a scale of 1 to 5 where, 1-No Extent, 2- Less extent, 3-
Moderate, 4- Great Extent and 5- Very Great Extent.
Where 1 represents means not used at all and 4 most used means.
Means Not At All least Moderate Most used
Regular meetings
Regular training
Using supervision on one to one basis

64
10. Rate the importance of risk limitation in risk management in Motor Insurance
influence performance? Rate using a scale of 1 to 5 where 1 is Not Importance2= Less
Importance. 3= Moderately Importance, 4= Importance and 5 =Very importance,
Risk limitation in risk management 1 2 3 4 5
Adequate intra company communication
Realistic risk control
Reducing scope to avoid high-risk activities
Use of expertises in assessing risk
Adopting a familiar approach instead of an innovative risk measures
Avoidance of risk
Ensure accurate reporting
Provision of knowledge
Making timely decisions in risk management

65
6 PRODUCT MIX STRATEGY
11. How effective is the use of the following product mix strategies in mitigating risk
in your company? In a scale of 1-5, where: 1. No Extent at All 2. No Extent 3. Little
Extent 4. Great extent 5. Very Great Extent
1 2 3 4 5
Number of total products
Number of product lines that your company sells
Total number of variations for each product
12. Rate the extent to which the following product mixes strategy influence
performance in Motor Insurance companies? Use a scale of 1 to 5 where, 1-No
Extent, 2- Less extent, 3-Moderate, 4- Great Extent and 5- Very Great Extent.
Product mix in risk management 1 2 3 4 5
Product designing of the motor policy
Pricing of the motor vehicle policy premium
Communication of new product to clients
Saving features attached to motor policy
Channel for premium pay
Implementation and maintenance with respect to motor vehicle
policy
Premium payment process

66
8. RISK BASED AUDITING STRATEGY
13.To what extent do you agree with the statement, risk auditing influence financial
performance in the company?
i. No extent at all [ ]
ii. Little extent [ ]
iii. Moderate extent [ ]
iv. Great extent [ ]
v. Very great extent [ ]
14. To what extent do the following risk based audit services affect performance at
your company?
Risk Based Services Very
great
extent
Great
extent
Average
extent
Low extent Very
low
extent
Reception of Risk Based
Audit Reports in time
Assessment of risks with the
management
Discussion of Risk Based
audit Annual plans with the
Management
Discussion of audit draft
reports with Management
Company annual audit
planning
Management response to
audit queries on time
Implementation of audit
recommendation by the
Management
Reception of adequate
resources for Risk Based
Audit

67
15. To what extent does risk based audit planning contribute to performance in your
company? Use a scale of 1 to 5 where: 1 = No extent at all; 2 = little extent; 3 =
Moderate extent; 4 = Great extent; 5 = A very great extent
5 4 3 2 1
Accuracy
Completeness
Clarity
Timeliness
Convenience
16. To what extent are the following auditing standards affect the performance in
your company?
Very
great
extent
Great
extent
Averag
e extent
Low
extent
Very
low
extent
Company Auditors
technical and professional
skills
Company Auditors
Readiness to embrace
change
Quality audit reports
Quality criteria to measure
internal auditors
performance
68
9. PERFORMANCE INDICATORS
17. Which measures of performance does your Motor Insurance use in assessing the
impact of risk management? Use a scale of 1 to 5 where 1 is to a great extent and 5 is
to no extent.
1 2 3 4 5
Increasing savings
Improve Motor Insurance Wealth
Development of alternative investment products e.g. insurance
Increase in shareholders of the Motor Insurance
Improved reduction of defaults
Other (specify............................................)

69
Appendix II: List of Registered Insurance Companies
No. Company Address
1. AAR Insurance Kenya Limited P.O Box 41766 00100, NAIROBI
2. A P A Insurance Limited P.O Box 30065 00100, NAIROBI
3. Africa Merchant Assurance Company Limited P.O Box 61599 –00200, NAIROBI
4. Apollo Life Assurance Limited P.O Box 30389 00100, NAIROBI
5. AIG Kenya Insurance Company Limited P.O. Box 49460 00100, NAIROBI
6. British American Insurance Company (Kenya) Limited P.O Box 30375
7. Cannon Assurance Limited P. O. Box 3021600100, NAIROBI
8. Capex Life Assurance Company Limited P. O. Box 12043 00400, NAIROBI
9. CFC Life Assurance Limited P.O. Box 30364 00100, NAIROBI
10. CIC General Insurance Limited P.O. Box 59485 00200, NAIROBI
11. CIC Life Assurance Limited P.O. Box 59485 00200, NAIROBI
12. Continental Reinsurance Limited P.O. Box 76326-00508, NAIROBI
13 Corporate Insurance Company Limited P.O. Box 34172 00100, NAIROBI
14 Direct line Assurance Company Limited P.O. Box 40863 00100, NAIROBI
15 East Africa Reinsurance Company Limited P.O. Box 20196 00200, NAIROBI
16 Fidelity Shield Insurance Company Limited P. O. Box 47435 00100, NAIROBI
17 First Assurance Company Limited P.O. Box 30064–00100, NAIROBI
18 G A Insurance Limited, P.O. Box 42166–00100, NAIROBI
19 Gateway Insurance Company Limited P.O. Box 60656 00200, NAIROBI
20 Geminia Insurance Company Limited P.O. Box 61316 00200, NAIROBI
21 ICEA LION General Insurance Company Limited P.O. Box 30190 00100, NAIROBI
22 ICEA LION Life Assurance Company Limited P.O. Box 46143 00100, NAIROBI
23 Intra Africa Assurance Company Limited P.O. Box 43241 00100, NAIROBI
24 Invesco Assurance Company Limited P.O. Box 5296400200, NAIROBI
25 Kenindia Assurance Company Limited P.O. Box 44372 00100, NAIROBI
26 Kenya Orient Insurance Limited P.O. Box 3453000100, NAIROBI
27 Kenya Reinsurance Corporation Limited P.O. Box 30271 00100, NAIROBI
28 Madison Insurance Company Kenya Limited P.O. Box 47382 00100, NAIROBI
29 Mayfair Insurance Company Limited P.O. Box 45161 00100, NAIROBI
30 Mercantile Insurance Company Limited P.O. Box 20680 00200, NAIROBI
31 Metropolitan Life Insurance Kenya Limited P.O. Box 46783 00100, NAIROBI
32 Occidental Insurance Company Limited P.O. Box 39459 00623, NAIROBI
33 Old Mutual Life Assurance Company Limited P.O. Box 30059 00100, NAIROBI
34 Pacis Insurance Company Limited P.O. Box 1870 00200, NAIROBI
35 Pan Africa Life Assurance Limited P.O. Box 44041 00100, NAIROBI
36 Phoenix of East Africa Assurance Company Limited P.O. Box 30129
37 Pioneer Assurance Company Limited P.O. Box 20333 -00200, NAIROBI
38 Real Insurance Company Limited P.O. Box 4000100100, NAIROBI
39. Resolution Insurance Company Limited P.O Box 4469 00100, NAIROBI
40. Shield Assurance Company Limited P.O. Box 25093, 00100, NAIROBI
41. Takaful Insurance of Africa Limited P.O Box 1811 00100, NAIROBI
42. Tausi Assurance Company Limited P.O. Box 2888900200, NAIROBI

70
43. The Heritage Insurance Company Limited P. O. Box 30390 00100, NAIROBI.
44. The Jubilee Insurance Company of Kenya Limited P.O. Box 3037600100, NAIROBI
45 The Monarch Insurance Company Limited P.O. Box 44003 00100, NAIROBI
46 Trident Insurance Company Limited P.O. Box 55651 00200, NAIROBI
47 UAP Insurance Company Limited P.O. Box4301300100, NAIROBI
48 UAP Life Assurance Limited P.O. Box 23842 00100, NAIROBI
49 Xplico Insurance Company Limited P.O Box 38106 00623, NAIROBI

71
Appendix III: Nacosti Permit Letter

72
Appendix IV: Data Collection Authorization