Risk measures in Islamic Banks MounaMoualhi 1 volatility ...
19
HAL Id: hal-01761031 https://hal.archives-ouvertes.fr/hal-01761031 Submitted on 7 Apr 2018 HAL is a multi-disciplinary open access archive for the deposit and dissemination of sci- entific research documents, whether they are pub- lished or not. The documents may come from teaching and research institutions in France or abroad, or from public or private research centers. L’archive ouverte pluridisciplinaire HAL, est destinée au dépôt et à la diffusion de documents scientifiques de niveau recherche, publiés ou non, émanant des établissements d’enseignement et de recherche français ou étrangers, des laboratoires publics ou privés. Risk measures in Islamic Banks MounaMoualhi 1 volatility of return on assets, volatility of return equity Monia Ltaifa To cite this version: Monia Ltaifa. Risk measures in Islamic Banks MounaMoualhi 1 volatility of return on assets, volatility of return equity. International Journal of Business Continuity and Risk Management, Inderscience, 2018. hal-01761031
Transcript of Risk measures in Islamic Banks MounaMoualhi 1 volatility ...

HAL Id: hal-01761031https://hal.archives-ouvertes.fr/hal-01761031
Submitted on 7 Apr 2018
HAL is a multi-disciplinary open accessarchive for the deposit and dissemination of sci-entific research documents, whether they are pub-lished or not. The documents may come fromteaching and research institutions in France orabroad, or from public or private research centers.
L’archive ouverte pluridisciplinaire HAL, estdestinée au dépôt et à la diffusion de documentsscientifiques de niveau recherche, publiés ou non,émanant des établissements d’enseignement et derecherche français ou étrangers, des laboratoirespublics ou privés.
Risk measures in Islamic Banks MounaMoualhi 1volatility of return on assets, volatility of return equity
Monia Ltaifa
To cite this version:Monia Ltaifa. Risk measures in Islamic Banks MounaMoualhi 1 volatility of return on assets, volatilityof return equity. International Journal of Business Continuity and Risk Management, Inderscience,2018. �hal-01761031�
Page 1
Risk measures in Islamic Banks
MounaMoualhi1
Monia Ben Ltaifa2
ABSTRACT
The aim of this study is to examine empirically the variables of the risks of Islamic
banks in the Gulf countries. Methodologically, we use a sample of 23 Islamic banks
during the period from 2007 to 2012. From the empirical findings, we can show that
the variablevolatility of return on assetsand the regulatory variable explains the
banking risks. Nous avons aussi montré que la taille influence les risques
bancaires.We have alsoshownthat size influences bankingrisks. In addition, we find
that the sizeinfluences banking risks.It has allowed us to see that the big banks can
invest in more risky projects.
Keywords: Islamic banks, risks, volatility of return on assets, volatility of return equity
1Doctor, PS2D, FSEGT, University Tunis El-Manar, Tunisia, e -mail: [email protected] 2pHD student in Finance at the Faculty of Economic Sciences and Management of Sfax, Department of Finance, University of Sfax, [email protected]

Page 2
1. Introduction
Islamic finance is still recent compared to his counterpart conventional. It is based on
financial instruments specific to its specific nature. Islamic banks are also exposed to financial
risks. These risks are multiple and multidimensional. They affect the performance of the
banking system. In fact, the definition of risk is a classic approach but important since it
constitutes the point of departure of their management. Therisk in a banking sector is
generally a result of movements of deregulation, regulation and the competition. Where,
financial institutions must increase their monitoring in the management of risks and comply
with the standards of prudential regulation.
The concept of risks is probably one of the subjects that arouse the most research in the field
of mathematical finance. So in this paper, we try to answer at the question related to the risks
in Islamic banks. In addition, the study of the risks in Islamic banks is one of the main
objectives in the recent financial literature. In our paper, we investigate empirically for
thedeterminants of the risk in Islamic banks. To do, we employ a sample composed by 23
Islamic banks during the period of study from 2007 to 2012. We employ a regression by
Ordinary Least Square.
Furthermore, the observation of the empirical results allowed us to remark that the variable
volatility of return on assets (SD ROA) and the regulatory variable explains the banking risks.
We have also shown that size influences banking risks. In addition, we find that the size
influences banking risks.
The rest of our paper is organized as follows. In section 2, we present the literature review
relative to the risks in banks.Section 3 describes the data used in this study. Section 4
describes the econometric methodology. Section 5 discusses the main empirical results.
Section 6 concludes.
2. Literature review
Islamic finance is a new branch of finance.Studies that are interested in Islamic
finance are now multiple and diverse.But most of this work was in the form of a
comparative study between Islamic banks and conventional banks.

Page 3
The practice of Islamic finance also differs from one country to another.In this sense
K. Brown3,(2003), has done a job where he compares Islamic banks in different
countries.
Iqbal M., (2001)4Published an article that focuses on a period from 1990 to 1998. He
found that Islamic banks have worked well during this period and have resisted
problems well.
The literature devoted to the study of risks in Islamic banks is scarce.In 2001, Khan
and T. Ahmed H5,Carried out a study in the form of a questionnaire addressed to the
different Islamic banks in different countries.The authors found that the most
important risk for the sample of banks studied is the risk of margin followed by
operational risk.
In addition, credit risk plays an important role and is considered one of the most
important risks.This risk is related to non-payment of consideration.It can be at the
root of other risks, namely liquidity risk.Other research by Iqbal et al (2007) in his
book "An introduction to Islamic finance"6Have shown that the biggest risk in
lending banks is credit.
Furthermore, Van H. and Z. Iqbal asserts in its "Risk analysis for Islamic banks'
book that the credit risk is the main cause of failure of banks7.They also added that it
is important to carefully analyze the risks.This analysis enriches the risk
management debate.
In the same context Romzie R., (2008), showed that there is "a positive relationship
between risk management and the risk management process.This process consists of
two steps the first is to identify the variables that is to say, identify sources of risk,
while the second is to develop methods to quantify risk using mathematical models
".
3. The data
The purpose of this paper is to examine empirically the variable of risks in Islamic banks. We
employ a sample of 23 Islamic banks in the gulf countries during the period of study from
2007 to 2012.
Financial data and accounts are extracted from the site of the Islamic Development Bank and
Financial publications and annual reports of Islamic banks.
4. The model
Iqbal,Z et Mirakhor. A., (2007) « An introduction to islamic finance », John Wiley et Sons (Asia) Pte Ltd 7Hennie VAN Greuning and Zamir Iqbal (2008)« Risk analysis for Islamic banks »
Page 4
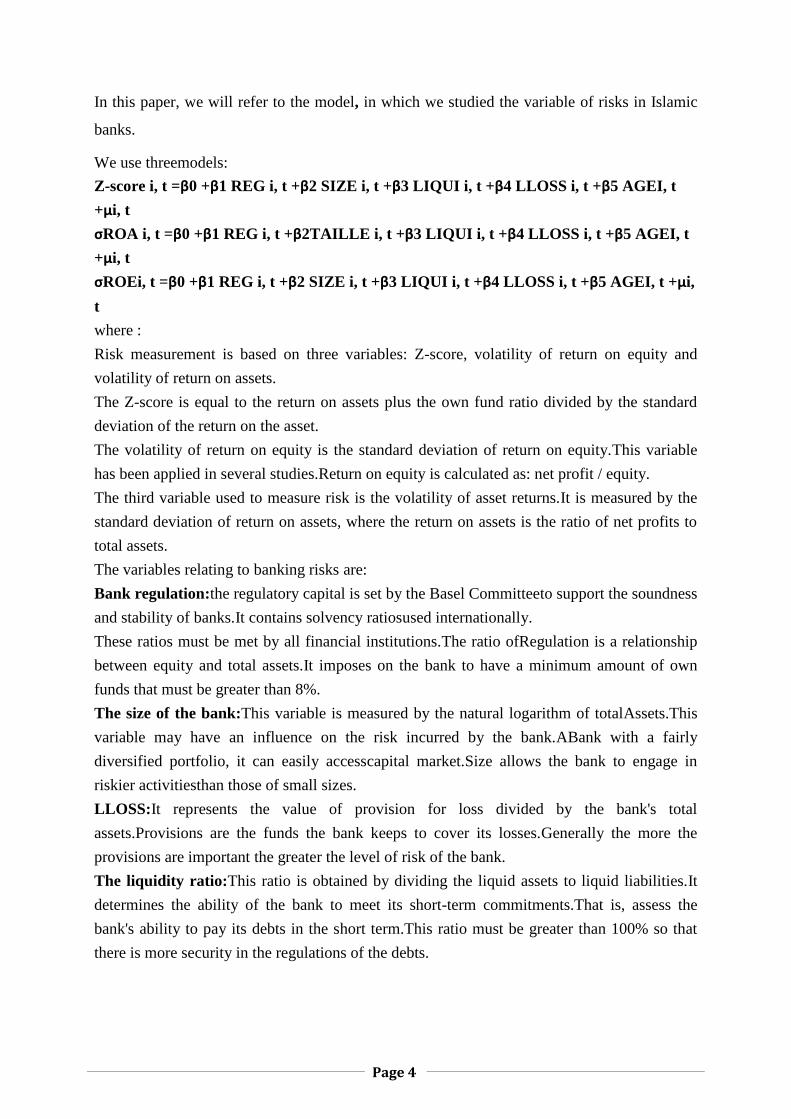
In this paper, we will refer to the model, in which we studied the variable of risks in Islamic
banks.
We use threemodels:
Z-score i, t =β0 +β1 REG i, t +β2 SIZE i, t +β3 LIQUI i, t +β4 LLOSS i, t +β5 AGEI, t
+μi, t
σROA i, t =β0 +β1 REG i, t +β2TAILLE i, t +β3 LIQUI i, t +β4 LLOSS i, t +β5 AGEI, t
+μi, t
σROEi, t =β0 +β1 REG i, t +β2 SIZE i, t +β3 LIQUI i, t +β4 LLOSS i, t +β5 AGEI, t +μi,
t
where :
Risk measurement is based on three variables: Z-score, volatility of return on equity and
volatility of return on assets.
The Z-score is equal to the return on assets plus the own fund ratio divided by the standard
deviation of the return on the asset.
The volatility of return on equity is the standard deviation of return on equity.This variable
has been applied in several studies.Return on equity is calculated as: net profit / equity.
The third variable used to measure risk is the volatility of asset returns.It is measured by the
standard deviation of return on assets, where the return on assets is the ratio of net profits to
total assets.
The variables relating to banking risks are:
Bank regulation:the regulatory capital is set by the Basel Committeeto support the soundness
and stability of banks.It contains solvency ratiosused internationally.
These ratios must be met by all financial institutions.The ratio ofRegulation is a relationship
between equity and total assets.It imposes on the bank to have a minimum amount of own
funds that must be greater than 8%.
The size of the bank:This variable is measured by the natural logarithm of totalAssets.This
variable may have an influence on the risk incurred by the bank.ABank with a fairly
diversified portfolio, it can easily accesscapital market.Size allows the bank to engage in
riskier activitiesthan those of small sizes.
LLOSS:It represents the value of provision for loss divided by the bank's total
assets.Provisions are the funds the bank keeps to cover its losses.Generally the more the
provisions are important the greater the level of risk of the bank.
The liquidity ratio:This ratio is obtained by dividing the liquid assets to liquid liabilities.It
determines the ability of the bank to meet its short-term commitments.That is, assess the
bank's ability to pay its debts in the short term.This ratio must be greater than 100% so that
there is more security in the regulations of the debts.
Page 5
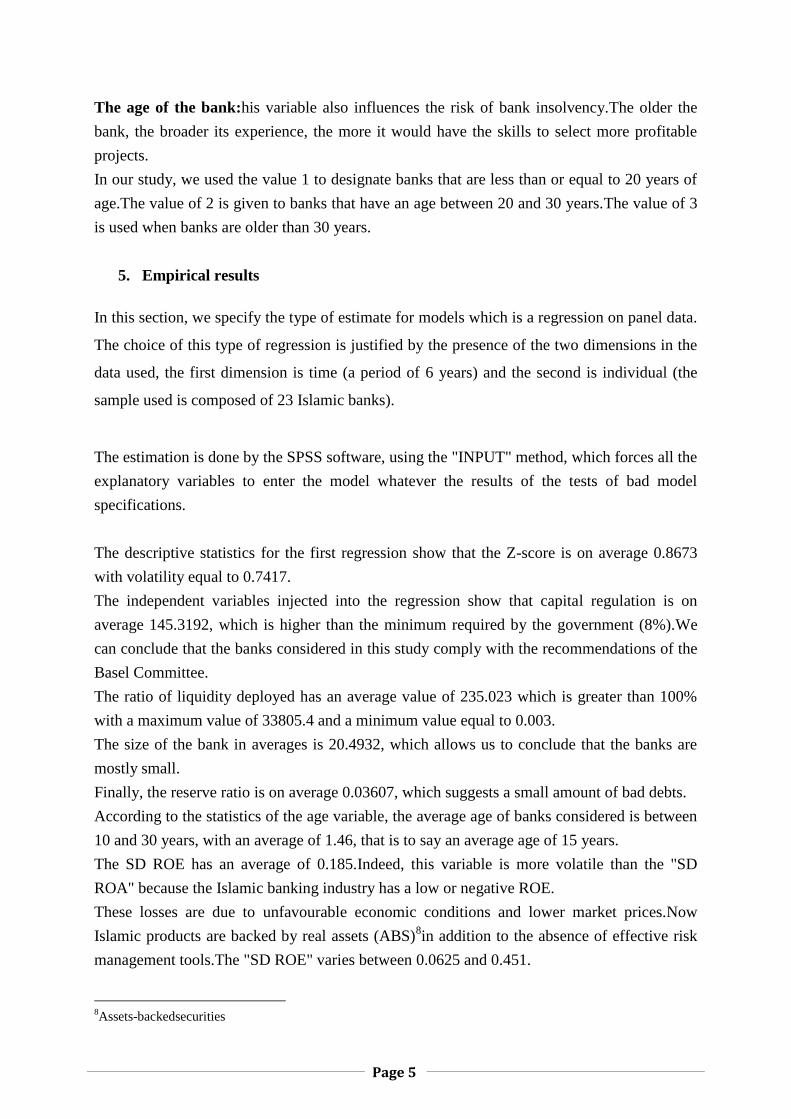
The age of the bank:his variable also influences the risk of bank insolvency.The older the
bank, the broader its experience, the more it would have the skills to select more profitable
projects.
In our study, we used the value 1 to designate banks that are less than or equal to 20 years of
age.The value of 2 is given to banks that have an age between 20 and 30 years.The value of 3
is used when banks are older than 30 years.
5. Empirical results
In this section, we specify the type of estimate for models which is a regression on panel data.
The choice of this type of regression is justified by the presence of the two dimensions in the
data used, the first dimension is time (a period of 6 years) and the second is individual (the
sample used is composed of 23 Islamic banks).
The estimation is done by the SPSS software, using the "INPUT" method, which forces all the
explanatory variables to enter the model whatever the results of the tests of bad model
specifications.
The descriptive statistics for the first regression show that the Z-score is on average 0.8673
with volatility equal to 0.7417.
The independent variables injected into the regression show that capital regulation is on
average 145.3192, which is higher than the minimum required by the government (8%).We
can conclude that the banks considered in this study comply with the recommendations of the
Basel Committee.
The ratio of liquidity deployed has an average value of 235.023 which is greater than 100%
with a maximum value of 33805.4 and a minimum value equal to 0.003.
The size of the bank in averages is 20.4932, which allows us to conclude that the banks are
mostly small.
Finally, the reserve ratio is on average 0.03607, which suggests a small amount of bad debts.
According to the statistics of the age variable, the average age of banks considered is between
10 and 30 years, with an average of 1.46, that is to say an average age of 15 years.
The SD ROE has an average of 0.185.Indeed, this variable is more volatile than the "SD
ROA" because the Islamic banking industry has a low or negative ROE.
These losses are due to unfavourable economic conditions and lower market prices.Now
Islamic products are backed by real assets (ABS)8in addition to the absence of effective risk
management tools.The "SD ROE" varies between 0.0625 and 0.451.
8Assets-backedsecurities
Page 6
In continuation of the analysis of the results, we conduct a test of correlation between the
variables used. Table 1 presents the empirical results of correlation test. Furthermore, the
empirical findings show that the majority of Pearson correlation coefficients do not exceed the
tolerance limit (0.7), which does not cause problems in estimating the two models of the two
models.
The table of the matrix correlation shows that the variables "liqui" and "Coarse" are
perfectly and positively correlated.In addition, according to Cohen tags9(1988), the variable
"LLOSS" is strongly and positively correlated with the variables "Liqui" and
"Coarse".This said that we will have problems of multi-collinearity in the regressions that
we will perform.Indeed, the variable "LLOSS" is approximated by the ratio reserves / total
assets due to the lack of data on the total amount of credit.
There is also a positive correlation between regulation and default risk for Islamic banks that
follow logic of sharing profits and risks.By seeking an adequate security cushion, bank
executives are relaxing efforts to select and monitor projects.They then choose more risky
projects and provide less effort in their supervision.
- Test for poor model specification
* Normality (Jarque-Bera)
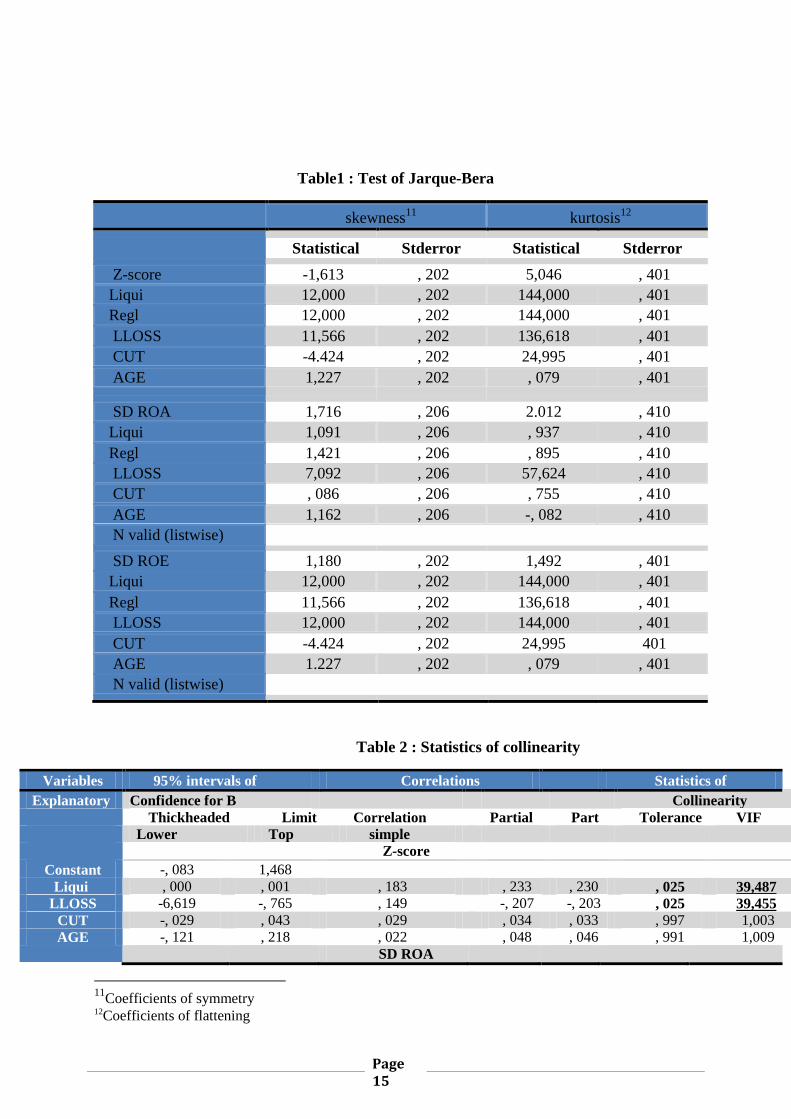
The normality test (Jarque-Bera) conventionally refers to the calculation of symmetry
coefficient (skewness) and kurtosis (kurtosis).Indeed, if these coefficients differ respectively
from zero and three then the process generating a series of returns follows a non-normal
distribution.Otherwise, the normal distribution is completely characterized by the expectation
and variance10
.
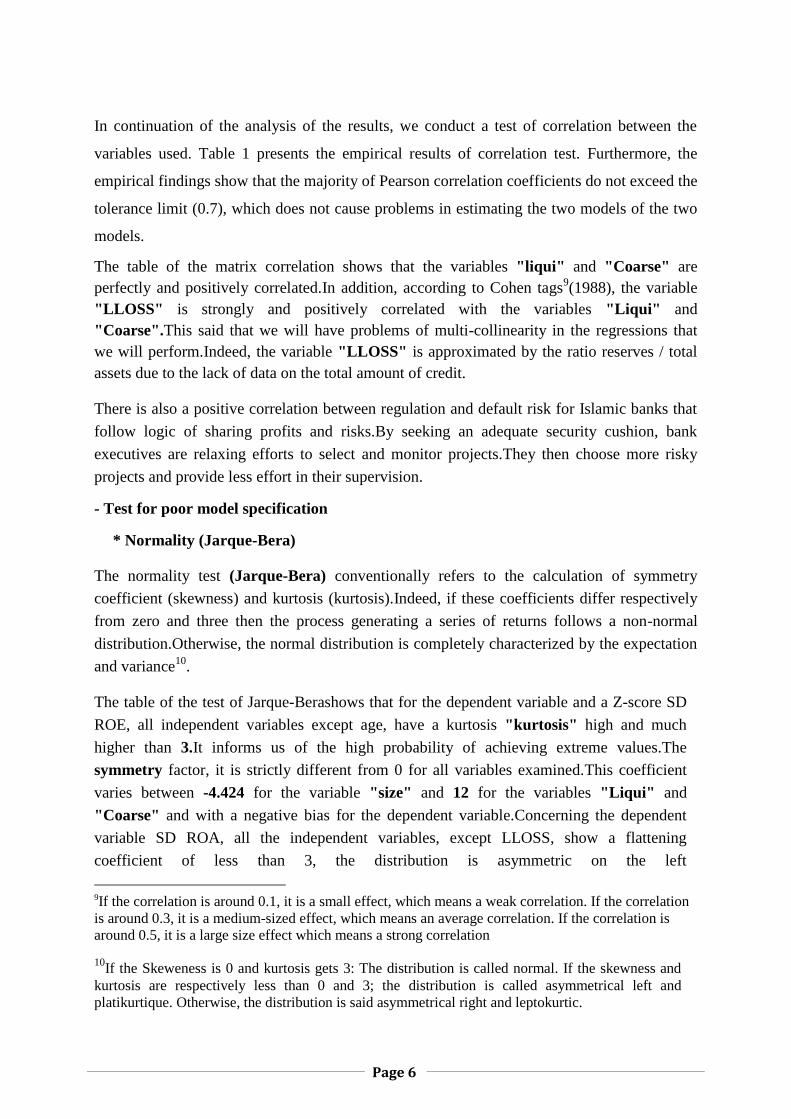
The table of the test of Jarque-Berashows that for the dependent variable and a Z-score SD
ROE, all independent variables except age, have a kurtosis "kurtosis" high and much
higher than 3.It informs us of the high probability of achieving extreme values.The
symmetry factor, it is strictly different from 0 for all variables examined.This coefficient
varies between -4.424 for the variable "size" and 12 for the variables "Liqui" and
"Coarse" and with a negative bias for the dependent variable.Concerning the dependent
variable SD ROA, all the independent variables, except LLOSS, show a flattening
coefficient of less than 3, the distribution is asymmetric on the left
9If the correlation is around 0.1, it is a small effect, which means a weak correlation. If the correlation
is around 0.3, it is a medium-sized effect, which means an average correlation. If the correlation is
around 0.5, it is a large size effect which means a strong correlation 10
If the Skeweness is 0 and kurtosis gets 3: The distribution is called normal. If the skewness and
kurtosis are respectively less than 0 and 3; the distribution is called asymmetrical left and
platikurtique. Otherwise, the distribution is said asymmetrical right and leptokurtic.

Page 7
(platikurticdistribution).The coefficient symmetry is different from 0 for all variables.This
coefficient varies between 0.086 for the variable "size" and 7092 for "LLOSS" variable.
We can then conclude that the distribution is biased in both directions (negative and
positive).In light of these figures, the hypothesis of symmetry is rejected in this investigation.
For the regression of Z-score, Distributive Durbin Watson displays a value of 1.653 which is
close to 2.That said, a priori, there is a lack of autocorrelation of errors.However, the graph
shows that to the left of the normal distribution lies residual autocorrelations.Therefore, it is
necessary to refer to the statistical table for a firm and precise interpretation.
According to the statistical table for the 1stregression, the Durbin Watson statistic is less than
the lower limit of1= 1.66.Residuewe reject the hypothesis H0autocorrelation of absence and in
accordance with graph that shows the existence of autocorrelation left of the normal
distribution of residuals.
For the second regression, the Durbin Watson statistic has a value of 1.973 which is greater
than the upper terminal d2 = 1.8.We do not reject H0Of non-autocorrelation of residues,
although the graph indicates that there are correlations to the right of the normal distribution
of residues.For the third regression, the Durbin Watson has a value of 2.2 which is equal to
the upper bound 4-d2 = 2.2.Residuewe reject the hypothesis H0of no autocorrelation in
accordance with graphic indicating the existence of autocorrelation to the right of the normal
distribution of residuals.
Autocorrelation of the residuals of the variables Z-score, SDROA, SDROE
-Multi-collinearity test - Variance Inflation Factor (VIF)
The independent variable "Coarse" is excluded from the regression seen the collinearity
problem remains.In other words, according to hypothesis 1 of the multiple regression, the
explanatory variables are linearly related.
Economically, these variables that present near-exact linear relations generally satisfy an
accounting identity.When the variables are linearly related, the X matrix is of a lower rank to
the number of variables.Therefore, the X'X matrix is not invertible (singular).
Klein testingmark only the bivariate collinearity.To estimate the multicollinearity, one should
perform the regression of each exogenous variable Xj with the other exogenous (p-1), and
then examine the coefficient of determinationAssociated.They baptized the variance inflation
factor (VIF) the quantity (Saporta, page 422).
We speak of an inflation factor because we have the following relation:

Page 8
The standard deviation of the estimate is multiplied by a factor .
The table of collinearity statistics shows the variables "Liqui" and "LLOSS" the values of
the partial correlations and party down below the zero order correlation (simple).This means
that SDROE and the Z-score, within Islamic banks, are explained by other variables.As for
the second regression, the independent variables contribute to explain the SDROA within the
Islamic banks to the countries of the Golf.
The tolerances of the variable "Liqui" and "LLOSS" are near 0, there is a multicollinearity
manifest and the standard deviation of the regression coefficients will be inflated.A variance
inflation factor (VIF) is generally considered to be greater than 2.
In our case, for the two variables already mentioned, the FIV is well above 2, namely 39,487
and 39,455 respectively in the first and third regression.This suggests the existence of a multi-
collinearity problem.By cons, in the second regression, the tolerances of all dependent
variables are well above zero, with lower VIF the critical value 2.
In this paper, we examine the relationship between independent variables and banking risk,
taking into account the age of the banks.We can use the OLS method (ordinary least
squares).
For a model to be of quality the improvement obtained with the independent variables must
be large and the residuals between the observed values and the regression line must be
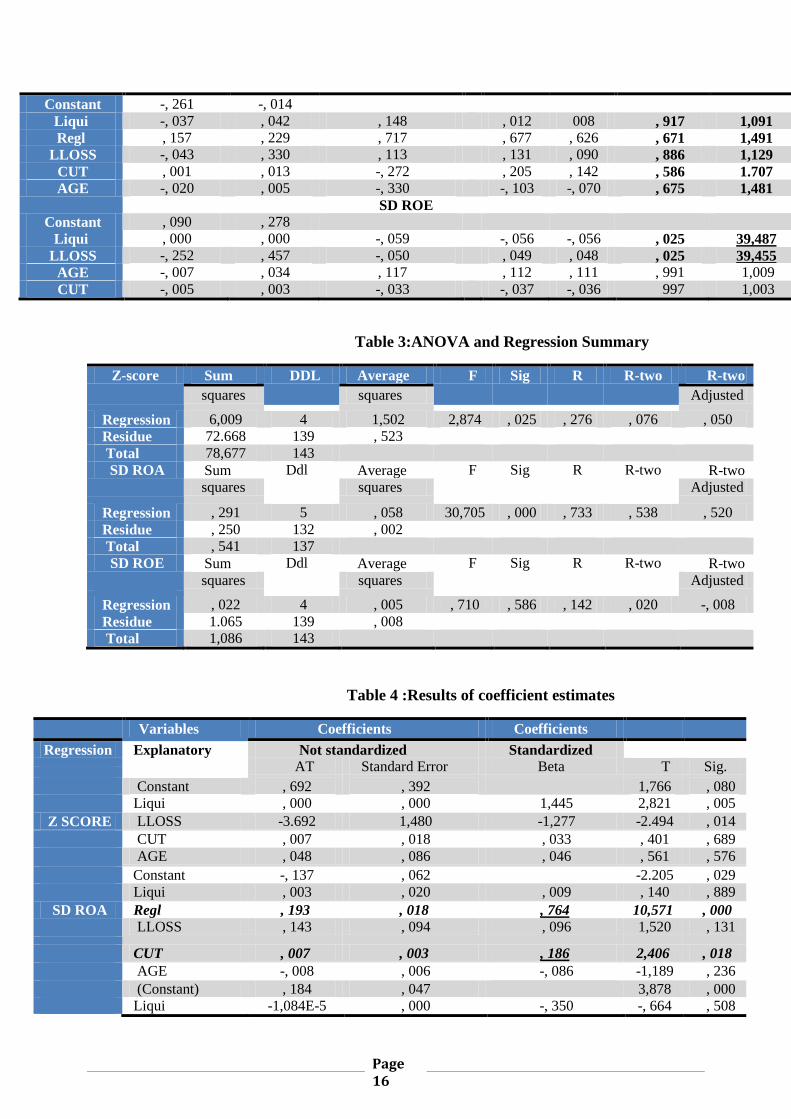
small.To examine this, we use the SPSS tests of the F value.
In our case, the value of F is 30,705 and is significant at p <0.0005.This means that the
probabilities of obtaining an F-value of this size by chance are less than 0.05%.Independent
variables explain, on average, the variability of the dependent variable.However, for the first
and third regression, we find that the variability ofDependent variable explained by the
regression is very low and the respective F values are not significant at the 5%
threshold.When the model provides a significant improvement, it should be reported to what
extent the data are adjusted to this model.In a way, it is possible to measure in what weighting
the model represents the dispersion of points in the graph.
This information exists in the table above with the index "R" which represents the value of
the multiple correlation of the model.It represents the combined correlation of all
independent variables of a model with the dependent variable.The R2valueindicates the
percentage of variability of the dependent variable explained by the regression model.We can
Page 9
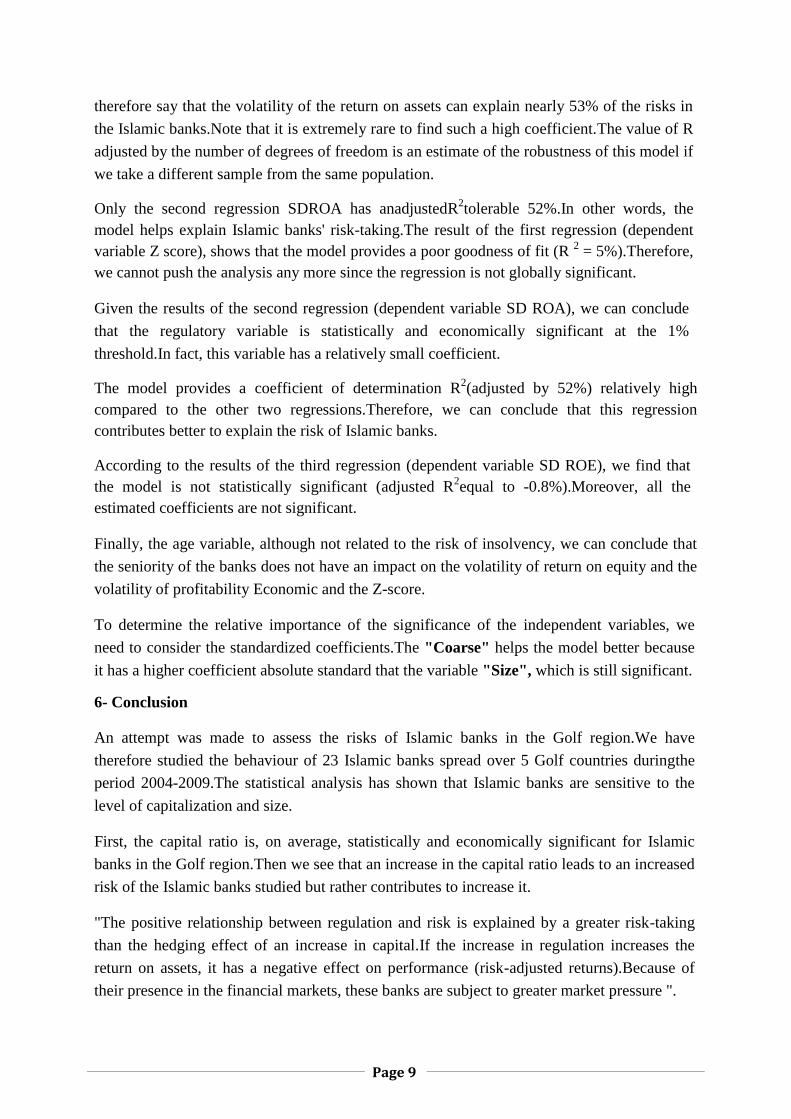
therefore say that the volatility of the return on assets can explain nearly 53% of the risks in
the Islamic banks.Note that it is extremely rare to find such a high coefficient.The value of R
adjusted by the number of degrees of freedom is an estimate of the robustness of this model if
we take a different sample from the same population.
Only the second regression SDROA has anadjustedR2tolerable 52%.In other words, the
model helps explain Islamic banks' risk-taking.The result of the first regression (dependent
variable Z score), shows that the model provides a poor goodness of fit (R 2 = 5%).Therefore,
we cannot push the analysis any more since the regression is not globally significant.
Given the results of the second regression (dependent variable SD ROA), we can conclude
that the regulatory variable is statistically and economically significant at the 1%
threshold.In fact, this variable has a relatively small coefficient.
The model provides a coefficient of determination R2(adjusted by 52%) relatively high
compared to the other two regressions.Therefore, we can conclude that this regression
contributes better to explain the risk of Islamic banks.
According to the results of the third regression (dependent variable SD ROE), we find that
the model is not statistically significant (adjusted R2equal to -0.8%).Moreover, all the
estimated coefficients are not significant.
Finally, the age variable, although not related to the risk of insolvency, we can conclude that
the seniority of the banks does not have an impact on the volatility of return on equity and the
volatility of profitability Economic and the Z-score.
To determine the relative importance of the significance of the independent variables, we
need to consider the standardized coefficients.The "Coarse" helps the model better because
it has a higher coefficient absolute standard that the variable "Size", which is still significant.
6- Conclusion
An attempt was made to assess the risks of Islamic banks in the Golf region.We have
therefore studied the behaviour of 23 Islamic banks spread over 5 Golf countries duringthe
period 2004-2009.The statistical analysis has shown that Islamic banks are sensitive to the
level of capitalization and size.
First, the capital ratio is, on average, statistically and economically significant for Islamic
banks in the Golf region.Then we see that an increase in the capital ratio leads to an increased
risk of the Islamic banks studied but rather contributes to increase it.
"The positive relationship between regulation and risk is explained by a greater risk-taking
than the hedging effect of an increase in capital.If the increase in regulation increases the
return on assets, it has a negative effect on performance (risk-adjusted returns).Because of
their presence in the financial markets, these banks are subject to greater market pressure ".

Page 10
The Basel Capital Regulatory Agreements seek to promote market discipline.They require
banks to disclose market information in order to get an idea of their state of health.
Our sample refers to banks with different sizes.In fact, we note that the size effect positively
influences the risk taking of these banks.That said, larger banks, which benefit from a large
security cushion, are at greater risk than smaller banks.
On the one hand, this state of affairs is in conformity with the orthodoxy which stipulates that
banks of size and size bear a higher risk.On the other hand, the paradigm of sharing profits
and losses, on which Islamic banks are founded, represents a safety net for banks in terms of
moral risk and anti-selection.
However, we find that age, does not explain the risk run by Islamic banks.Indeed, although
the age of the banks studied varies between 10 and 30 years, it is clear that this variable does
not affect the risk since, on the one hand, most of these banks have changed activity only
recently and On the other hand, the reputation and the originality of the Islamic banks ensue
essentially from their conformity with the rules of the Sharia ' and not on the age of the bank.
As for liquidity, we absolutely tolerate the neutrality of this variable vis-à-vis the risk. Unlike
conventional banks, Islamic banks are established in connection with the prohibition of
interest and usury. Therefore, Islamic banks are not subject to liquidity crises in the absence
of the activity of the creation of the currency, although they are exposed to a potential
liquidity risk triggered by insolvency such as case of " Mourabha" .
The empirical part of this work was based on the exploitation of a model. The results show
that the volatility of variable yield assets (ROA SD) is the one that explains more than other
variables, the banking risks. The variable regulation has also had a significant impact on
banking risks. We have also shown that the size influences the banking risks. It allowed us
to see that the bank is larger more it can invest in riskier projects.
After this study, some research approaches could be explored. In this sense, we can examine
the effect of the composition of Sharia 'board on risk-taking in Islamic banks. In addition, we
can test the influence of the capital structure of Islamic banks on the risk to them.
References
Chong, BS. and Liu, MH. (2009), Islamic Banking: Interest-free or interest-based, Pacific-
Basin Finance Journal (17),125-144.
Cumming, CM. and Hirtle BJ. (2001), The challenges of risk management in
diversifiedFinancial companies, Economic Policy Review, Federal Reserve Bank of
New York (1), 17.

Page 11
Esch, L., Kieffer, R. and Lopez, T.(2003), Asset and risk management : la finance orientée
risques, Comptabilité, contrôle et finance ; Bruxelles, 29.
El Garari MA. (2003), Crédit risk in islamic banking and finance, Islamic Economic Studies,
vol. 10, N°2, 25.
Greuning, HV. andZamir, I. (2008), Risk analysis for Islamic banks, The world
bank,Washington, D.C, 335.
Habib, A. (2002), A micro economic model of an Islamicbank, Institut Islamique de
Recherches et de Formations, Banque Islamique de Développement, document
périodique (59), 40.
Iqbal, M., Ahmad, A. and Khan, T. (1998), Challenges facingislamicbanking, Institut
Islamique de Recherches et de Formations, Banque Islamique de Développement,
document occasionnel (1), 98.
Jachi, A. (2008), Islamic Financial Risk management, GARP’S 9th Annul Risk Management
Convention and Exhibition, New York, 19.
Khan, RS.(1984), An Analysis of a PLS model for the financial sector», Pakistan Journal of
Applied Economics, vol. 3 (2).
OldField. andSantomero. (1997), Commercial bank Management: An analysis of the process,
Journal of financial services research, 49.
Rifaat, Ahmed AK. (2001), International Accounting harmonization, banking regulation, and
islamic banks, The International Journal of Accounting, p 169-193.
Saunders A., Strock, E. and Travlos, N. (1990), Ownership structure, deregulation, and bank
risk taking, The journal of finance, (2), 13.
State Bank of Pakistan, Draft Risk Management Guidelines For Islamic BankingInstitutions,
State Bank of Pakistan, 19.
Sundarajan, V. and Erico, L. (2002), Islamic Financial Institutions in the global financial
system: Key issues in risk management and challenges Ahead, IMF working paper 25.
Vogel, EF. and Hayes, SL. (1998), Islamic law and finance, religion, risk and return,
EditionKluwer Law International, 223.

Page 12
Apendix -A
List of Banks
Country banks Number of banks
ABC islamic Bank
Al Baraka Bank islamic
Arcapita Bank
Bahrainislamicbank
Capivest Bank
bahrain Gulf Finance House 12
Internetionalinvestmentbank
Investors Bank
Khaleej Commercial Bank
Kuwait Finance House Bahrain
Liquidity management center
Unicorninvestmentbank
Abu Dhabi islamicbank
United ArabEmirates DubaiIslamic Bank 4
EmiratesIslamic Bank
Sharjah Islamic Bank
SaudiArabia Al rajhi Bank 2
Bank Aljazira
First Finance Company
Qatar International Islamic 3
Qatar Islamic Bank
kuwait Kuwait Finance House 2
Gulf Investment House

Page 13
The correlation matrix
N = 138
Regression SD ROA SD ROA Liqui Regl LLOSS CUT AGE
Pearson SD ROA Correlation 1,000 , 148 , 717 , 113 -, 272 -, 330
Liqui , 148 1,000 , 232 -, 028 -, 233 -,
097
Regl , 717 , 232
1,000
, 090 -, 513 -,
445
LLOSS
, 113 -, 028 , 090 1,000 -, 239 , 076
CUT -, 272 -, 233 -, 513 -, 239 1,000 , 482
AGE -, 330 -, 097 -, 445 , 076 , 482
1,000
Sig. (Unilateral) SD
ROA
. , 042 , 000 , 093 , 001 , 000
Liqui , 042 . , 003 , 372 , 003 , 129
Regl , 000 , 003 . , 146 , 000 , 000
LLOSS
, 093 , 372 , 146 . , 002 , 187
CUT , 001 , 003 , 000 , 002 . , 000
AGE , 000 , 129 , 000 , 187 , 000 .
The "SD ROA" marries a negative relationship with the variable "Size" and the variable
"Age".A priori, that said, as the age of the bank and its size increases the risk is low.
The correlation matrix
N = 144
Regression SD ROE SD ROE Liqui Regl LLOSS AGE CUT
Correlation of Pearson SD ROE 1,000 -, 059 -,
059
-, 050 , 117 -, 033
Liqui -, 059 1,000
1,000
, 987 -,
054
, 024
Regl -, 059 1,000
1,000
, 987 -,
054
, 024
LLOSS -, 050 , 987 , 987 1,000 -,
042
, 031
AGE , 117 -, 054 -,
054
-, 042 1,000 , 026
Page 14
CUT -, 033 , 024 , 024 , 031 , 026 1,000
Sig. (Unilateral) SD
ROE
. , 241 , 241 , 278 , 081 , 349
Liqui , 241 . , 000 , 000 , 259 , 388
Regl , 241 , 000
.
, 000 , 259 , 388
LLOSS , 278 , 000 , 000 . , 309 , 356
AGE , 081 , 259 , 259 , 309 . , 379
CUT , 349 , 388 , 388 , 356 , 379 .
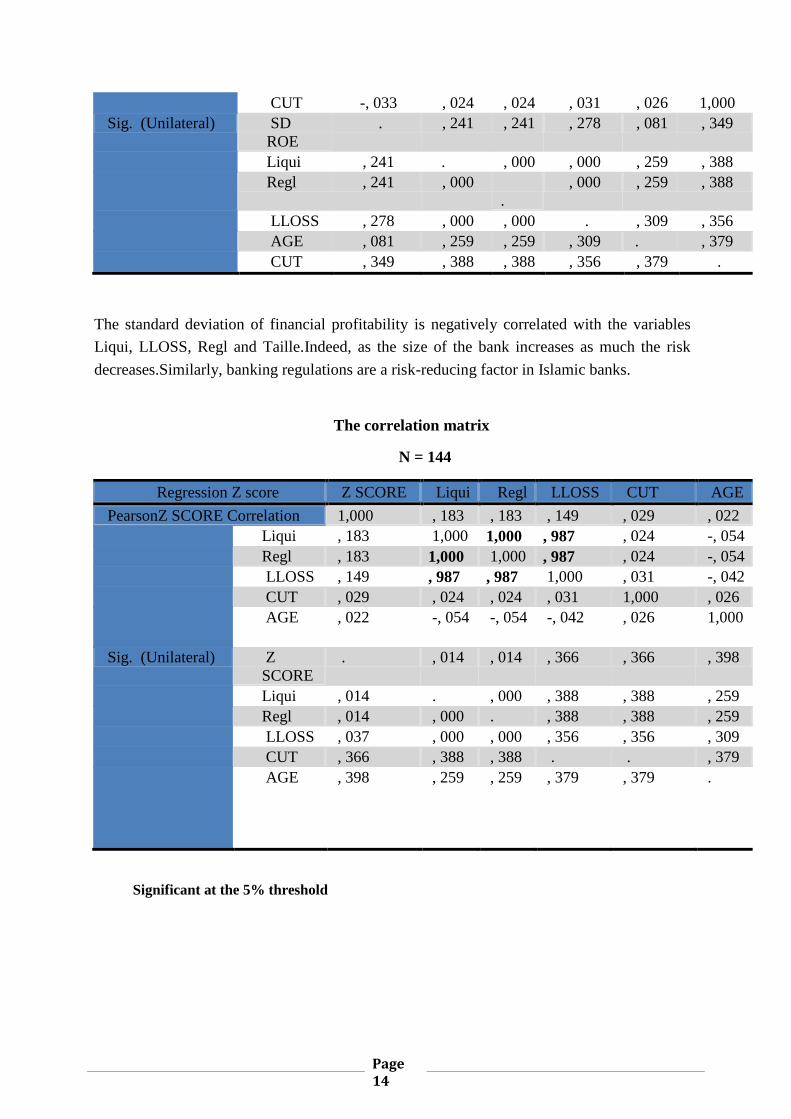
The standard deviation of financial profitability is negatively correlated with the variables
Liqui, LLOSS, Regl and Taille.Indeed, as the size of the bank increases as much the risk
decreases.Similarly, banking regulations are a risk-reducing factor in Islamic banks.
The correlation matrix
N = 144
Regression Z score Z SCORE Liqui Regl LLOSS CUT AGE
PearsonZ SCORE Correlation 1,000 , 183 , 183 , 149 , 029 , 022
Liqui , 183 1,000 1,000 , 987 , 024 -, 054
Regl , 183 1,000 1,000 , 987 , 024 -, 054
LLOSS , 149 , 987 , 987 1,000 , 031 -, 042
CUT , 029 , 024 , 024 , 031 1,000 , 026
AGE , 022 -, 054 -, 054 -, 042 , 026 1,000
Sig. (Unilateral) Z
SCORE
. , 014 , 014 , 366 , 366 , 398
Liqui , 014 . , 000 , 388 , 388 , 259
Regl , 014 , 000 . , 388 , 388 , 259
LLOSS , 037 , 000 , 000 , 356 , 356 , 309
CUT , 366 , 388 , 388 . . , 379
AGE , 398 , 259 , 259 , 379 , 379 .
Significant at the 5% threshold
Page 15
Table1 : Test of Jarque-Bera
skewness11
kurtosis12
Statistical Stderror Statistical Stderror
Z-score -1,613 , 202 5,046 , 401
Liqui 12,000 , 202 144,000 , 401
Regl 12,000 , 202 144,000 , 401
LLOSS 11,566 , 202 136,618 , 401
CUT -4.424 , 202 24,995 , 401
AGE 1,227 , 202 , 079 , 401
SD ROA 1,716 , 206 2.012 , 410
Liqui 1,091 , 206 , 937 , 410
Regl 1,421 , 206 , 895 , 410
LLOSS 7,092 , 206 57,624 , 410
CUT , 086 , 206 , 755 , 410
AGE 1,162 , 206 -, 082 , 410
N valid (listwise)
SD ROE 1,180 , 202 1,492 , 401
Liqui 12,000 , 202 144,000 , 401
Regl 11,566 , 202 136,618 , 401
LLOSS 12,000 , 202 144,000 , 401
CUT -4.424 , 202 24,995 401
AGE 1.227 , 202 , 079 , 401
N valid (listwise)
Table 2 : Statistics of collinearity
Variables 95% intervals of Correlations Statistics of
Explanatory Confidence for B Collinearity Thickheaded Limit Correlation Partial Part Tolerance VIF Lower Top simple
Z-score
Constant -, 083 1,468
Liqui , 000 , 001 , 183 , 233 , 230 , 025 39,487
LLOSS -6,619 -, 765 , 149 -, 207 -, 203 , 025 39,455
CUT -, 029 , 043 , 029 , 034 , 033 , 997 1,003
AGE -, 121 , 218 , 022 , 048 , 046 , 991 1,009 SD ROA
11
Coefficients of symmetry 12Coefficients of flattening
Page 16
Constant -, 261 -, 014
Liqui -, 037 , 042 , 148 , 012 008 , 917 1,091
Regl , 157 , 229 , 717 , 677 , 626 , 671 1,491
LLOSS -, 043 , 330 , 113 , 131 , 090 , 886 1,129
CUT , 001 , 013 -, 272 , 205 , 142 , 586 1.707
AGE -, 020 , 005 -, 330 -, 103 -, 070 , 675 1,481 SD ROE
Constant , 090 , 278
Liqui , 000 , 000 -, 059 -, 056 -, 056 , 025 39,487
LLOSS -, 252 , 457 -, 050 , 049 , 048 , 025 39,455
AGE -, 007 , 034 , 117 , 112 , 111 , 991 1,009
CUT -, 005 , 003 -, 033 -, 037 -, 036 997 1,003
Table 3:ANOVA and Regression Summary
Z-score Sum DDL Average F Sig R R-two R-two
squares squares Adjusted
Regression 6,009 4 1,502 2,874 , 025 , 276 , 076 , 050
Residue 72.668 139 , 523
Total 78,677 143
SD ROA Sum Ddl Average F Sig R R-two R-two
squares squares Adjusted
Regression , 291 5 , 058 30,705 , 000 , 733 , 538 , 520
Residue , 250 132 , 002
Total , 541 137
SD ROE Sum Ddl Average F Sig R R-two R-two
squares squares Adjusted
Regression , 022 4 , 005 , 710 , 586 , 142 , 020 -, 008
Residue 1.065 139 , 008
Total 1,086 143
Table 4 :Results of coefficient estimates
Variables Coefficients Coefficients
Regression Not standardized Standardized Explanatory AT Standard Error Beta T Sig.
Constant , 692 , 392 1,766 , 080
Liqui , 000 , 000 1,445 2,821 , 005
Z SCORE LLOSS -3.692 1,480 -1,277 -2.494 , 014
CUT , 007 , 018 , 033 , 401 , 689
AGE , 048 , 086 , 046 , 561 , 576
Constant -, 137 , 062 -2.205 , 029
Liqui , 003 , 020 , 009 , 140 , 889
SD ROA Regl , 193 , 018 , 764 10,571 , 000 LLOSS , 143 , 094 , 096 1,520 , 131
CUT , 007 , 003 , 186 2,406 , 018
AGE -, 008 , 006 -, 086 -1,189 , 236
(Constant) , 184 , 047 3,878 , 000
Liqui -1,084E-5 , 000 -, 350 -, 664 , 508

Page 17
SD ROE LLOSS. , 103 , 179 , 302 , 573 , 568
AGE , 014 , 010 , 112 1,326 , 187
CUT -, 001 , 002 -, 036 -, 433 , 665

Page 18