Risk Matrix - ge.com · Overview of the Risk Matrix Module The Risk Matrix, which can be accessed...
83
Risk Matrix © 2020 General Electric Company
Transcript of Risk Matrix - ge.com · Overview of the Risk Matrix Module The Risk Matrix, which can be accessed...

Risk Matrix
© 2020 General Electric Company
Contents
Chapter 1: Overview 1Overview of the Risk Matrix Module 2
Chapter 2: Risk and Risk Assessment 3About Risk and Risk Assessment 4
Specify Risk Values to Determine an Overall Risk Rank 5
Specify That a Risk Category Does Not Apply to the Current Risk 6
Chapter 3: Protection Level Slider 8About the Protection Level Slider 9
Add a Protection Level Slider with Default Name and Description 10
Chapter 4: Operations 15Overview 16
Risk Matrix 16
Risk Assessment Feature 34
Customize the Risk Matrix 36
Chapter 5: Reference 42General Reference 43
Family Field Descriptions 62
Chapter 6: Release Notes 77Third Quarter of 2019 78
First Quarter of 2019 78
Third Quarter of 2018 79
ii Risk Matrix

Copyright GE Digital© 2020 General Electric Company.
GE, the GE Monogram, and Predix are either registered trademarks or trademarks of All other trademarks are the property of their respective owners.
This document may contain Confidential/Proprietary information of and/or its suppliers or vendors. Distribution or reproduction is prohibited without permission.
THIS DOCUMENT AND ITS CONTENTS ARE PROVIDED "AS IS," WITH NO REPRESENTATION OR WARRANTIES OF ANY KIND, WHETHER EXPRESS OR IMPLIED, INCLUDING BUT NOT LIMITED TO WARRANTIES OF DESIGN, MERCHANTABILITY, OR FITNESS FOR A PARTICULAR PURPOSE. ALL OTHER LIABILITY ARISING FROM RELIANCE UPON ANY INFORMATION CONTAINED HEREIN IS EXPRESSLY DISCLAIMED.
Access to and use of the software described in this document is conditioned on acceptance of the End User License Agreement and compliance with its terms.
© 2020 General Electric Company iii


Chapter
1OverviewTopics:
• Overview of the Risk MatrixModule
© 2020 General Electric Company 1

Overview of the Risk Matrix ModuleThe Risk Matrix, which can be accessed in various places throughout the GE Digital APM application, isused to evaluate mitigated and unmitigated risk in various contexts.
2 © 2020 General Electric Company

Chapter
2Risk and Risk AssessmentTopics:
• About Risk and RiskAssessment
• Specify Risk Values toDetermine an Overall Risk Rank
• Specify That a Risk CategoryDoes Not Apply to the CurrentRisk
© 2020 General Electric Company 3

About Risk and Risk AssessmentIn GE Digital APM, risk is the combination of a harmful event or condition and its negative outcome. Inaddition to identifying risks, in GE Digital APM, you can also perform a risk assessment, which assesses:
• The probability that the negative outcome will have an impact on safety, the environment, operations,or finances.
• The severity of the safety, environmental, operational, or financial impact.
In some GE Digital APM modules, you will assess risk using the Risk Matrix. In other modules, you willassess risk using datasheets or other forms. Keep in mind that the type of impact that each moduleallows you to assess might differ. For example, Asset Strategy Optimization (ASO) allows you to assesssafety, environmental, and operational impact. Asset Strategy Management (ASM), on the other hand,allows you to assess safety, environmental, operational, and financial impact.
More About Risk
In any company, equipment and locations can fail. In some cases, these failures do not cause anyimmediate problems. For instance, consider a clothes dryer with a switch that shuts off the dryerautomatically if the temperature inside the drum reaches 180 degrees Fahrenheit (F). If the switch stopsworking but the temperature never reaches 180 degrees F, meaning that the switch is never activated, theswitch failure would not present any problems.
In other cases, however, a failure can cause not only problematic but catastrophic consequences.Consider the same clothes dryer and safety switch. If the safety switch stops working and thetemperature inside the drum does reach 180 degrees F, the switch will not perform its intended function:shutting off the dryer. Instead, the dryer would continue to run, allowing the temperature to potentiallyrise even further, which could ultimately cause the dryer to catch on fire.
From this example, you can see that the safety switch failure is problematic because it could cause a fire,which would have safety, financial, and operational impacts.
In GE Digital APM, a risk is the combination of a harmful event or condition and the negative outcome ofthat event or condition. In the example described above:
• The switch failure is the harmful event.• A fire is the negative outcome.
So, the risk in this example is the combination of the switch failure and the negative outcome. In otherwords, the risk is that the switch stops working and the dryer overheats, eventually causing a fire.
To perform a risk assessment of this situation, you would consider:
• The probability that the fire will have a safety, environmental, operational, or financial impact. Forexample, you might determine that an operational impact is inevitable, while an environmental impactis possible but not likely.
• The severity of the safety, environmental, operational, or financial impact. For example, you mightdetermine that the severity of a safety impact is very high (homeowners could be killed), but theseverity of an environmental impact is low (damage only to immediate, surrounding landscaping).
4 © 2020 General Electric Company
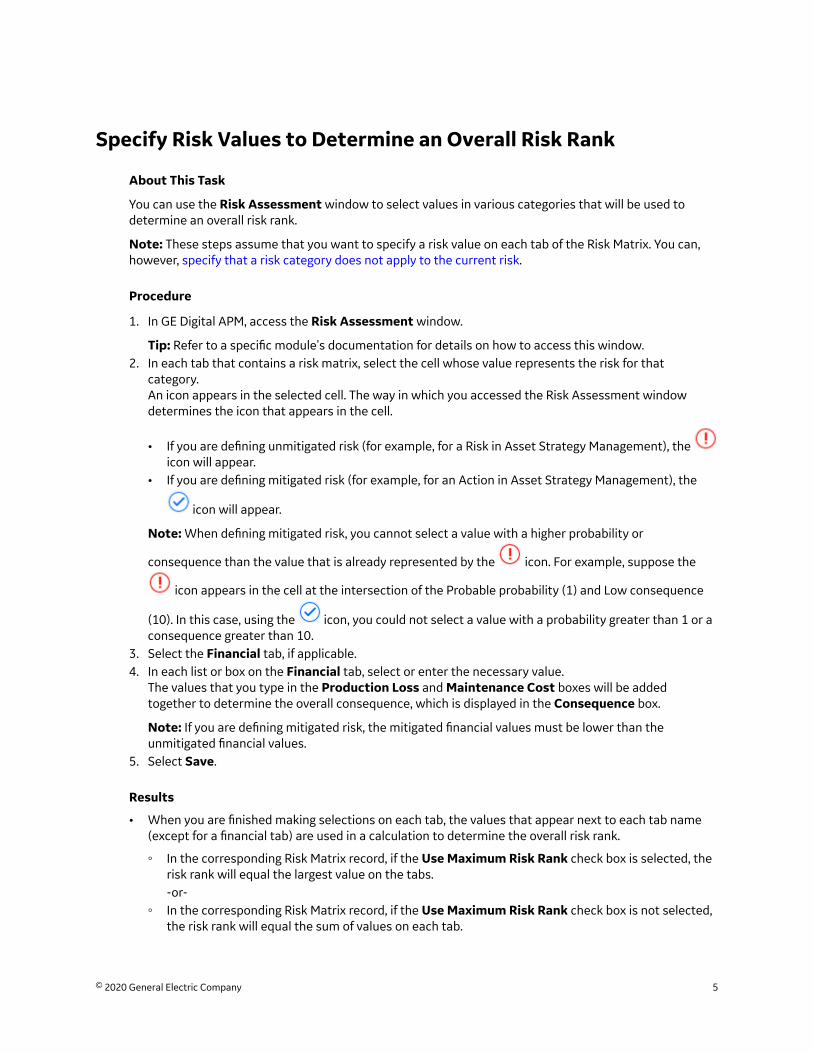
Specify Risk Values to Determine an Overall Risk Rank
About This Task
You can use the Risk Assessment window to select values in various categories that will be used todetermine an overall risk rank.
Note: These steps assume that you want to specify a risk value on each tab of the Risk Matrix. You can,however, specify that a risk category does not apply to the current risk.
Procedure
1. In GE Digital APM, access the Risk Assessment window.
Tip: Refer to a specific module's documentation for details on how to access this window.2. In each tab that contains a risk matrix, select the cell whose value represents the risk for that
category.An icon appears in the selected cell. The way in which you accessed the Risk Assessment windowdetermines the icon that appears in the cell.
• If you are defining unmitigated risk (for example, for a Risk in Asset Strategy Management), theicon will appear.
• If you are defining mitigated risk (for example, for an Action in Asset Strategy Management), the
icon will appear.
Note: When defining mitigated risk, you cannot select a value with a higher probability or
consequence than the value that is already represented by the icon. For example, suppose the
icon appears in the cell at the intersection of the Probable probability (1) and Low consequence
(10). In this case, using the icon, you could not select a value with a probability greater than 1 or aconsequence greater than 10.
3. Select the Financial tab, if applicable.4. In each list or box on the Financial tab, select or enter the necessary value.
The values that you type in the Production Loss and Maintenance Cost boxes will be addedtogether to determine the overall consequence, which is displayed in the Consequence box.
Note: If you are defining mitigated risk, the mitigated financial values must be lower than theunmitigated financial values.
5. Select Save.
Results
• When you are finished making selections on each tab, the values that appear next to each tab name(except for a financial tab) are used in a calculation to determine the overall risk rank.
◦ In the corresponding Risk Matrix record, if the Use Maximum Risk Rank check box is selected, therisk rank will equal the largest value on the tabs.-or-
◦ In the corresponding Risk Matrix record, if the Use Maximum Risk Rank check box is not selected,the risk rank will equal the sum of values on each tab.
© 2020 General Electric Company 5

• The calculated risk rank is displayed in either the Unmitigated Risk Rank section or the MitigatedRisk Rank section, depending on the type of risk you are working with.
The calculated risk rank is displayed in either the Unmitigated Risk Rank section or the Mitigated RiskRank section, depending on the type of risk you are working with.
Specify That a Risk Category Does Not Apply to the Current Risk
Procedure
1. In GE Digital APM, access the Risk Assessment window.
Tip: Refer to a specific module's documentation for details on how to access this window.2. In any tab that represents a risk category that does not apply to the risk that you are assessing, below
the matrix, select the Not Applicable check box.The values on that tab will be disabled and the tab label will contain the text N/A.
6 © 2020 General Electric Company
3. Select Save.Your changes are saved. In the Risk Rank record that is associated with the tab on which you selectedthe check box, the value in the Not Applicable field is set to True.
© 2020 General Electric Company 7

Chapter
3Protection Level SliderTopics:
• About the Protection LevelSlider
• Add a Protection Level Sliderwith Default Name andDescription
8 © 2020 General Electric Company

About the Protection Level SliderEach Risk Matrix can use multiple Protection Level records, where each Protection Level recordcorresponds to one level on a protection level slider. The baseline Risk Matrix does not include aProtection Level record. Protection Level records can be linked to Risk Category records through the HasReference Values relationship, which determines the section in which the protection level slider willappear.
In this image, you can see that the protection level slider name is Normal, and the description isProcedural controls; inherent design controls. You can also see in the Unmitigated cell (below the slider)that the factor for this protection level is 1. In this case, any number that is selected in the Environmentsection will be multiplied by 1 to determine the total risk value for the Environment risk category.
Note that when the protection level slider is displayed in a section, the values in the cells in that sectionchange depending on the level at which the slider is positioned. The factor associated with the currentposition of the slider is multiplied by the baseline values in the matrix cells to determine the new numbersthat are displayed in each cell.
For example, in the baseline Risk Matrix, the value in the cell at the intersection of the Remote probabilityand Low consequence is 1. If the protection level slider were displayed and the slider was positionedwhere the factor was 5, the value in the cell at the intersection of the Remote probability and Lowconsequence would be 5 (1 x 5).
© 2020 General Electric Company 9

Add a Protection Level Slider with Default Name andDescription
About This Task
The baseline Risk Matrix does not display a protection level slider by default, but the appropriate SystemCodes exist to allow you to add a protection level slider to the baseline Risk Matrix. Using these baselineSystem Codes, the default name and description of the protection level slider is Default. The name anddescription are concatenated in the tooltip when you pause on the protection level slider, as shown in thefollowing image.
10 © 2020 General Electric Company

If you want to add a protection level slider with the default name and description, Default, you can do sousing the following workflow, which assumes that:
• You want to add the protection level slider to the Safety section of the Risk Matrix.• You want the protection level slider to contain levels 1 through 10.
Procedure
1. Open the Risk Matrix record for the Risk Matrix to which you want to add the protection level slider.2. In the Record Explorer pane, expand the Risk Category node, and then expand the Safety node.
© 2020 General Electric Company 11

3. Below the Safety node, select the Protection Level node, then select , and then select Add NewRecord.
Tip: If you do not see the Protection Level node at the bottom of the Record Explorer pane, select
next to Related Families, and then select All Possible Families.4. In the new Protection Level record, in the Name list, select Default.
Note: The Description cell is populated automatically with the value Default.
12 © 2020 General Electric Company

5. In the Alias box, enter any value If the Alias Format Mask field in the associated Risk Matrix recordcontains the value {pl}, the value in the Alias field in the Protection Level record will be displayed in thecell in the Risk Matrix (according to the complete template that is defined in the Alias Format Maskfield).
6. In the Factor box, enter a number by which you want to multiply each consequence and probabilityvalue that is selected in the Risk Matrix. Using our example, for this first Protection Level record, youwould enter 1.
7. Save the record.8. Repeat steps 3 through 7 until you have created ten Protection Level records with the factors 1
through 10.When you are finished completing these steps, when you access the Safety section for an item thatuses this Risk Matrix (e.g., an Action in ASM), the protection level slider will look like this:
© 2020 General Electric Company 13

In this image, you can see that the highest level of the slider is selected (with the factor of 10), causingthe value in the selected cell to be 50 (the result of the calculation 1 x 5 x 10, where 1 is the selectedconsequence and 5 is the selected probability). You can also see that the tooltip displays the defaultname and description as a concatenated value, Default: Default.
14 © 2020 General Electric Company

Chapter
4OperationsTopics:
• Overview• Risk Matrix• Risk Assessment Feature• Customize the Risk Matrix
© 2020 General Electric Company 15

Overview
Access the Risk Matrix Admin Page
Procedure
In the module navigation menu, select Admin > Operations Manager > Risk Matrix.The Risk Matrix Admin page appears.
Risk WorkflowThis workflow provides the basic, high-level steps for configuring a Risk Matrix. The steps and links in thisworkflow do not necessarily reference every possible procedure.
1. Access the Risk Matrix record for the Risk Matrix that you want to configure, create a new Risk Matrixfrom scratch, or copy an existing Risk Matrix.
2. Add or Modify the records associated with a Risk Matrix to define the probabilities, consequences, riskthresholds, and site for the Risk Matrix.
3. Customize the appearance of the Risk Matrix and the Risk Assessment window within which itappears.
4. Preview the Risk Matrix.
Risk Matrix
About the Risk MatrixThe Risk Matrix that appears in the Risk Assessment window allows you to make selections that areused in calculations to determine an overall risk rank value.
16 © 2020 General Electric Company

The values that you see in the Risk Matrix are determined by various records. The baseline GE Digital APMdatabase contains a Risk Matrix that you can use when evaluating risk, but if you do not want to use thebaseline values, an administrative user can customize the default Risk Matrix or create a new Risk Matrix.
The following image displays the Risk Matrix that is provided in the baseline database, where no riskvalues have yet been specified.
Each tab in the Risk Matrix represents an area that might be affected if risk were to be presented. TheSafety, Environment, and Operations tab each contains its own matrix, which combines in a grid formatprobability factors with consequence factors. The Financial tab contains text boxes that serve the samepurpose.
Depending on how you access the Risk Assessment window, the risk matrix will represent eithermitigated or unmitigated risk:
• If you have accessed the Risk Assessment window from a record that represents risk before anyactions have mitigated it (for example, a Failure Risk record in ASM or a Failure Effect node in an RCM
Analysis), the specified risk values in each matrix are represented by a icon.• If you have accessed the Risk Assessment window from a record that represents an action that
might mitigate risk (for example, an Action record in ASM or a Recommendation node in an RCM
Analysis), the previously specified unmitigated risk values are represented by a icon and the
mitigated risk values are represented by a icon.
When a risk value is selected, the number on the corresponding tab is updated to indicate the specifiedrisk.
© 2020 General Electric Company 17

In addition, the cumulative values specified in the risk matrix are used in a calculation to determine theoverall risk rank, which is displayed in either the Mitigated Risk Rank or Unmitigated Risk Rank sectionon the right side of the window.
Example
The Risk Assessment window shown in the following image was accessed from an Action record in ASM.
You can see that the icon appears in the Risk Matrix, so you know that the values representmitigating action (the name of the window also indicates this, by default).
You can see that the icon appears in the cell that contains the value 5, indicating that the mitigatedrisk for the Safety category is 5. This value also appears on the Safety tab. The cumulative MitigatedRisk Rank appears to the left of the Risk Matrix.
Disabled cells in a risk matrix
A cell may be disabled in the risk matrix when you are defining a mitigated risk assessment. This isbecause you can only select a consequence or probability value that is less than the unmitigatedconsequence or probability value.
18 © 2020 General Electric Company

Disabled cells will be colored slightly lighter than the enabled cells of the same color. For example, in thefollowing image, you can see that some cells are slightly lighter, indicating that you must select aprobability value less than or equal to 1 and a consequence value less than or equal to 100.
Another scenario where certain cells will be disabled in each matrix is if the Lock MitigatedConsequence check box is selected in the Risk Matrix record. In this scenario, when you are defining amitigated risk assessment, you will not be able to modify the consequence value. Instead, you will be ableto modify only the probability value.
About the Not Applicable Check Box
Each tab in the Risk Matrix contains the Not Applicable check box. If this check box is selected, itindicates that the risk category that is represented by that tab does not apply to the risk.
You might, for example, determine that a leak does not have a safety impact. In this case, when you areassessing the risk of the Leak Risk record, you would select the Not Applicable check box on the Safetytab. The following image shows the selected Not Applicable check box on the Safety tab for the LeakRisk record.
© 2020 General Electric Company 19

When you select the Not Applicable check box, the values on that tab will be disabled, and nounmitigated risk rank icon will appear. In addition, the tab label will contain the text N/A.
After you perform a risk assessment, multiple Risk Rank records are created, where the value in theCategory field in each Risk Rank record represents a specific risk category (for example, Safety) that youassessed. If, for example, you create a Risk record with the name Leak, when you assess the risk using theRisk Matrix, multiple Risk Rank records will be created and linked to that Risk record. Each Risk Rankrecord will contain a value in the Category field to indicate the risk rank per category (for example, Safety).In addition, each Risk Rank record will contain the value True or False in the Not Applicable field toindicate whether or not you selected the Not Applicable check box on the tab representing that category.
So, using the Leak Risk record example, if you selected the Not Applicable check box on the Safety tab,the Leak Risk record would be linked to a Risk Rank record with the following values:
• Category: Safety• Not Applicable: True
20 © 2020 General Electric Company

Preview a Risk Matrix
About This Task
When configuring Risk Matrices, you can preview a Risk Matrix to see how it will appear in the RiskAssessment window in other areas of GE Digital APM.
Procedure
1. Access the Risk Matrix Admin page.2. Select the row containing the Risk Matrix record that you want to preview.3. Select Preview.
The Risk Assessment window appears, displaying the Risk Matrix.
Access a Risk Matrix Record
Procedure
1. Access the Risk Matrix Admin page.
© 2020 General Electric Company 21

2. Select the name of a Risk Matrix.The corresponding Risk Matrix record opens in Record Manager. The Record Explorer pane containslinks to the related record that make up the values that appear on the Risk Matrix.
Create a New Risk Matrix
Procedure
1. Access the Risk Matrix Admin page.2. Select Create New.
A blank Risk Matrix datasheet appears.
22 © 2020 General Electric Company

3. As needed, enter values in the available fields, and then select .The new Risk Matrix is saved. At this point, you can customize the Risk Matrix appearance as needed.
Next Steps
• Add a New Risk Category• Add a Consequence
Copy a Risk Matrix
Procedure
1. Access the Risk Matrix Admin page.
2. Select the row containing the Risk Matrix record that you want to copy.
3. Select Copy.The list is refreshed and displays the new Risk Matrix record in the list with the name Copy of<Name>. At this point, you can modify the new record.
Access the Risk Categories Associated with a Risk Matrix
Procedure
1. Access the Risk Matrix record whose risk category details you want to access.
2. In the Record Explorer pane, under Related Families, select Risk Category.
© 2020 General Electric Company 23

A list of the linked Risk Category records appears in the Record Explorer pane. You can select a recordto view its datasheet.
Access the Consequences and Probabilities Associated with a Risk Matrix
About This Task
You can access the details of the Consequence and Probability records associated with a Risk Matrix viaRecord Manager.
Note: When viewing a Consequence or Probability record, you can make changes only if thecorresponding Risk Matrix has not been used by a module in GE Digital APM.
Procedure
1. Access the Risk Categories associated with a Risk Matrix.2. Select the category associated with the consequence or probability that you want to access.
The datasheet for the selected Risk Category record appears and the Record Explorer pane lists thefamilies related to the selected Risk Category record.
24 © 2020 General Electric Company
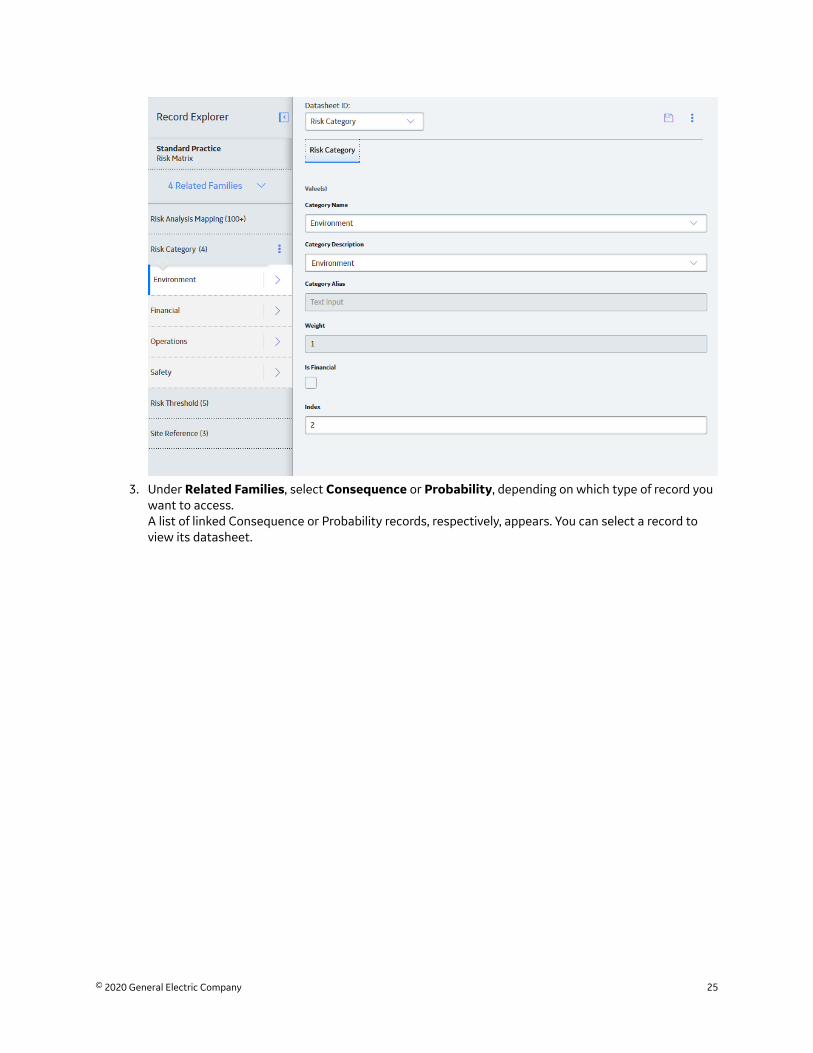
3. Under Related Families, select Consequence or Probability, depending on which type of record youwant to access.A list of linked Consequence or Probability records, respectively, appears. You can select a record toview its datasheet.
© 2020 General Electric Company 25
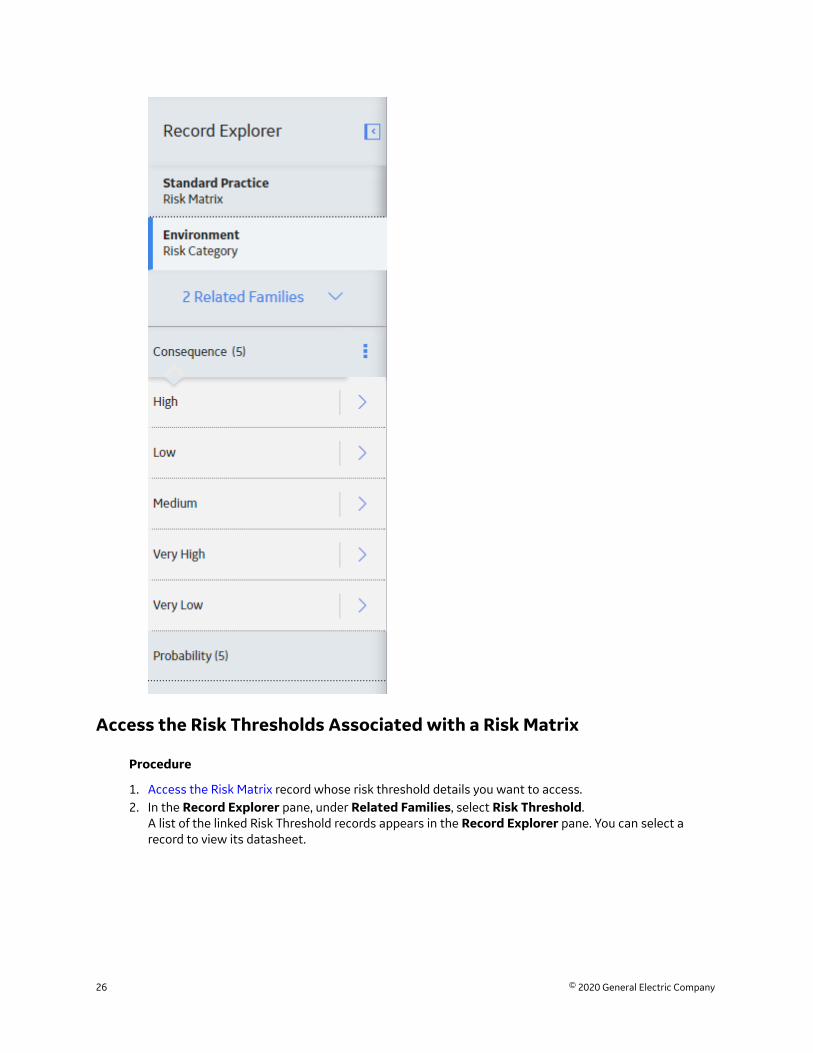
Access the Risk Thresholds Associated with a Risk Matrix
Procedure
1. Access the Risk Matrix record whose risk threshold details you want to access.2. In the Record Explorer pane, under Related Families, select Risk Threshold.
A list of the linked Risk Threshold records appears in the Record Explorer pane. You can select arecord to view its datasheet.
26 © 2020 General Electric Company
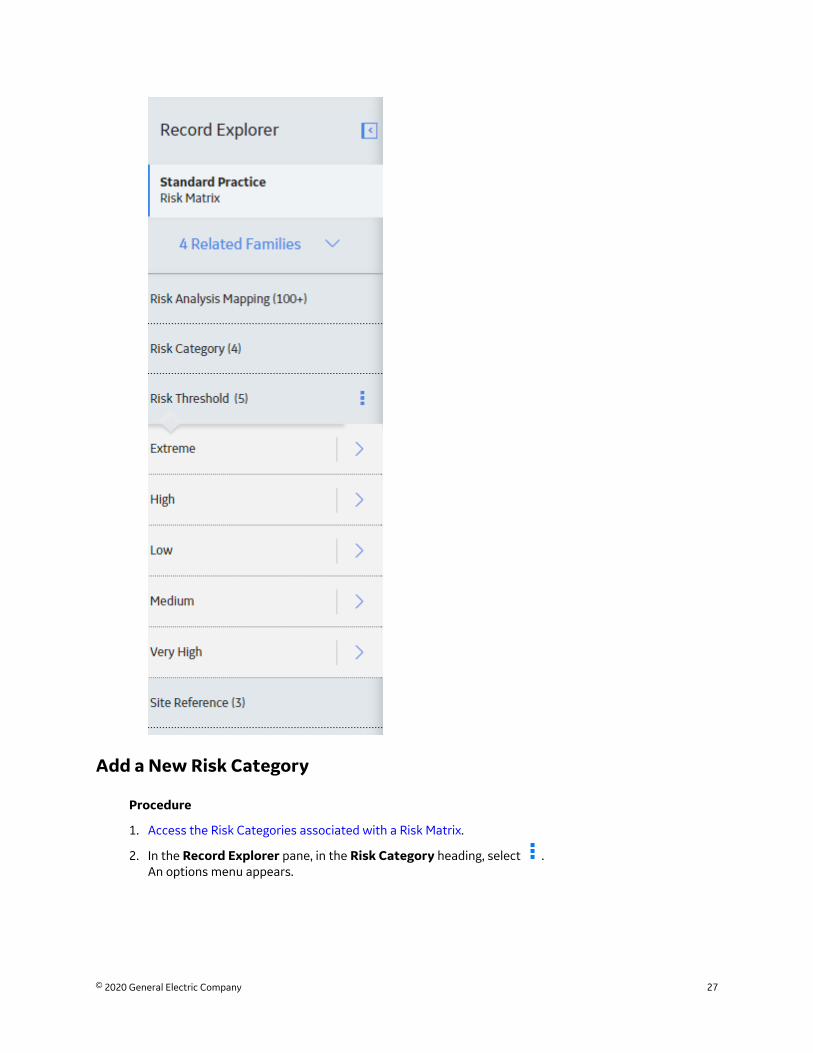
Add a New Risk Category
Procedure
1. Access the Risk Categories associated with a Risk Matrix.
2. In the Record Explorer pane, in the Risk Category heading, select .An options menu appears.
© 2020 General Electric Company 27
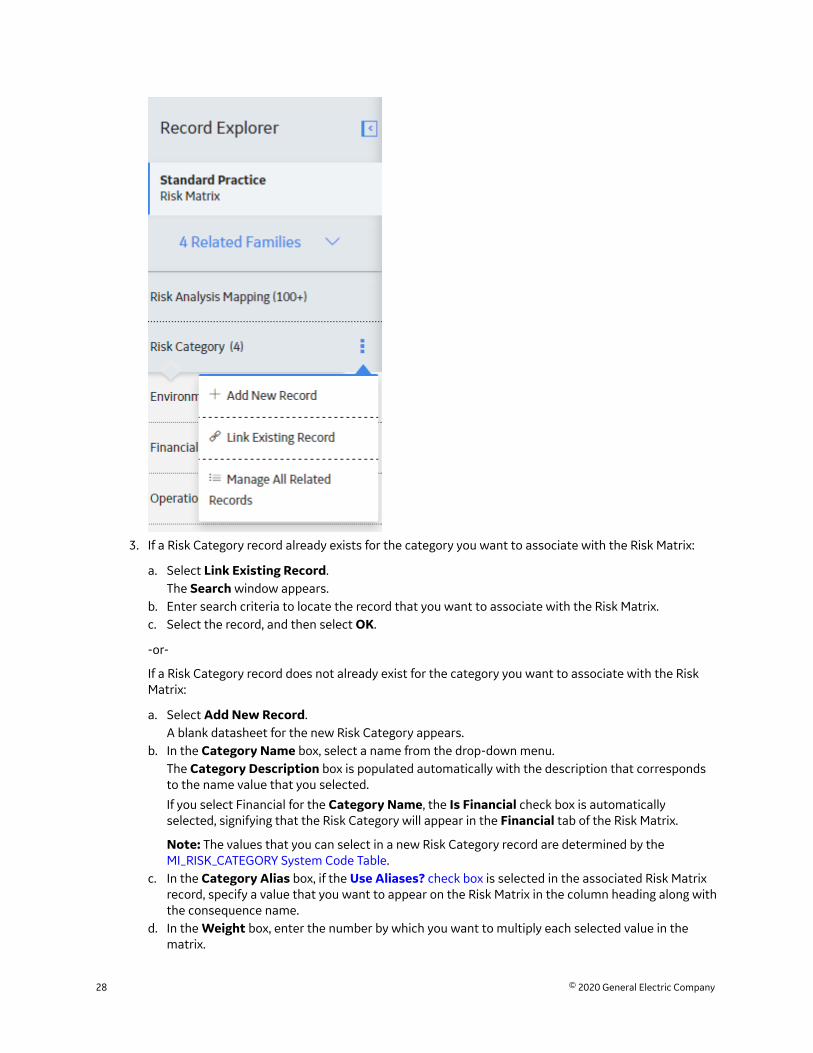
3. If a Risk Category record already exists for the category you want to associate with the Risk Matrix:
a. Select Link Existing Record.The Search window appears.
b. Enter search criteria to locate the record that you want to associate with the Risk Matrix.c. Select the record, and then select OK.
-or-
If a Risk Category record does not already exist for the category you want to associate with the RiskMatrix:
a. Select Add New Record.A blank datasheet for the new Risk Category appears.
b. In the Category Name box, select a name from the drop-down menu.The Category Description box is populated automatically with the description that correspondsto the name value that you selected.
If you select Financial for the Category Name, the Is Financial check box is automaticallyselected, signifying that the Risk Category will appear in the Financial tab of the Risk Matrix.
Note: The values that you can select in a new Risk Category record are determined by theMI_RISK_CATEGORY System Code Table.
c. In the Category Alias box, if the Use Aliases? check box is selected in the associated Risk Matrixrecord, specify a value that you want to appear on the Risk Matrix in the column heading along withthe consequence name.
d. In the Weight box, enter the number by which you want to multiply each selected value in thematrix.
28 © 2020 General Electric Company

e. In the Index box, enter the number corresponding to the order in which you want the tab toappear, relative to all other tabs defined for the same Risk Matrix.
f. Select .Your changes are saved and can be viewed in the matrix on the Risk Matrix Preview window.
Add a Consequence
About This Task
Note: You should not create more than ten Consequence records within a given Risk Matrix configuration.Creating more than ten Consequence records will cause the Risk Matrix to become visually unusable (forexample, it will contain scroll bars, and the cells and text will be too small to read easily).
Procedure
1. Access the Consequence records associated with a Risk Matrix.
2. In the Record Explorer pane, in the Consequence heading, select .An options menu appears.
3. If a Consequence record already exists for the consequence you want to associate with the RiskMatrix:
a. Select Link Existing Record.The Search window appears.
b. Enter search criteria to locate the record that you want to associate with the Risk Matrix.
© 2020 General Electric Company 29
c. Select the record, and then select OK.
-or-
If a Consequence record does not already exist for the consequence you want to associate with theRisk Matrix:
a. Select Add New Record.A blank datasheet for the new Consequence appears.
b. In the Name box, select a name from the list.The Description box is populated automatically with the description that corresponds to the namevalue that you selected.
Note: The values that you can select in a new Consequence record are determined by theMI_RISK_CONSEQUENCE System Code Table.
c. In the Alias box, if the Use Aliases? check box is selected in the associated Risk Matrix record,specify a value that you want to appear on the Risk Matrix in the column header along with theconsequence name.
d. In the Consequence box, enter a number to indicate the severity of the consequence.
e. Select .
Your changes are saved and can be viewed in the matrix on the Risk Matrix Preview window.
Add a Probability
About This Task
Note: You should not create more than ten Probability records within a given Risk Matrix configuration.Creating more than ten Probability records will cause the Risk Matrix to become visually unusable (forexample, it will contain scroll bars, and the cells and text will be too small to read easily).
Procedure
1. Access the Probability records associated with a Risk Matrix.
2. In the Probability heading, select .An options menu appears.
30 © 2020 General Electric Company

3. If a Probability record already exists for the probability you want to associate with the Risk Matrix:
a. Select Link Existing Record.The Search window appears.
b. Enter search criteria to locate the record that you want to associate with the Risk Matrix.c. Select the record, and then select OK.
-or-
If a Probability record does not already exist for the probability you want to associate with the RiskMatrix:
a. Select Add New Record.A blank datasheet for the new Probability record appears.
b. In the Name box, select a name from the list.The Description box is populated automatically with the description that corresponds to the namevalue that you selected.
Note: The values that you can select in a new Probability record are determined by theMI_RISK_PROBABILITY System Code Table.
c. In the Alias box, if the Use Aliases? check box is selected in the associated Risk Matrix record,specify a value that you want to appear on the Risk Matrix in the column heading along with theconsequence name.
d. In the Probability box, enter a number to indicate the likelihood that the risk will occur.
© 2020 General Electric Company 31
e. Select .
Note: The Failure Interval and Failure Interval Units values are used only for a specific workflowwithin the Asset Strategy Optimization module.
Your changes are saved and can be viewed in the matrix on the Risk Matrix Preview window.
Add a Risk Threshold
Procedure
1. Access the Risk Threshold records associated with a Risk Matrix.
2. In the Record Explorer pane, in the Risk Threshold heading, select .An option menu appears.
3. If a Risk Threshold record already exists for the consequence you want to associate with the RiskMatrix:
a. Select Link Existing Record.The Search window appears.
b. Enter search criteria to locate the record that you want to associate with the Risk Matrix.c. Select the record, and then select OK.
-or-
If a Risk Threshold record does not already exist for the consequence you want to associate with theRisk Matrix:
a. Select Add New Record.A blank datasheet for the new Risk Threshold appears.
b. In the Alias box, , if the Use Aliases? check box is selected in the associated Risk Matrix record,specify a value that you want to appear on the Risk Matrix in the column heading along with theconsequence name.
c. In the Description box, select from the drop-down menu.
Note: The values that you can select in a new Risk Threshold record are determined by theMI_RISK_THRESHOLD System Code Table.
d. In the Value box, enter the value that you want to correspond to the risk threshold.e. In the Color field, select the color that you want to set for this risk threshold.
f. Select .
Your changes are saved and can be viewed in the matrix on the Risk Matrix Preview window.
Associate a Risk Matrix with a Site
Procedure
1. Access the Risk Matrix record that you want to associate with a site.2. In the Record Explorer pane, under Related Families, select Site Reference.
Note: If Site Reference does not appear, select , and then select All Possible Families.
3. Select .An options menu appears.
32 © 2020 General Electric Company

4. If a Site Reference record already exists for the site you want to associate with the Risk Matrix:
a. Select Link to Existing Record.The Search window appears.
b. Enter search criteria to locate the record that you want to associate with the Risk Matrix.c. Select the record, and then select OK.
-or-
If a Site Reference record does not already exist for the site you want to associate with the Risk Matrix:
a. Select Add New Record.A blank datasheet for the new Site Reference record appears.
b. In the Name box, enter the name of the site.
c. Select .
The Risk Matrix is associated with the specified site.
© 2020 General Electric Company 33

Access the System Code Tables Used by Risk Matrices
Procedure
1. Access the Risk Matrix Admin page.
2. Select System Codes and Tables.The System Codes and Tables page appears.
3. In the System Tables list, select the System Code Table that you want to view.The details of the System Code Table appear in the page.
In this page you can manage the System Code Table values for the families that are linked to RiskMatrix records. Refer to the System Codes and Tables section of the documentation for additionalinformation.
Risk Assessment Feature
About the Risk Assessment FeatureThe Risk Assessment feature is a combination of:
• The Risk Assessment window, which is an interface that displays a Risk Matrix and other riskinformation.
-and-• The Risk Matrix data model, which includes entity families, relationship families, and records that
determine:
◦ The values that you will see in the Risk Assessment interface.◦ The calculations that will be performed based on the values that you select.
The baseline GE Digital APM database contains a set of baseline records that determine the values thatyou will see on the Risk Assessment window and the calculations that are performed using those values.You can access this window through modules such as:
• Asset Strategy Management (ASM)• Asset Criticality Analysis (ACA)• Risk Based Inspection (RBI)
34 © 2020 General Electric Company

If you do not want to use the baseline values and calculations, you can customize them or configure yourown.
Tip: Refer to the Risk Matrix section of the end user documentation for additional information aboutunderstanding the Risk Matrix.
Modify the Risk Assessment Window Title
About This Task
You can modify the default title of the Risk Assessment window using the Risk Matrix record.
Note:
When you modify the title, the new title will be used everywhere that the Risk Matrix record is used todisplay the Risk Assessment window. For example, if an Asset Strategy and an RCM Analysis use the sameRisk Matrix, if you modify the title in that Risk Matrix record, the new title will be displayed when youaccess the Risk Assessment interface from any of the following items:
• An Action or Risk in that Asset Strategy• A Failure Effect or Recommendation in that RCM Analysis.
Procedure
1. Access the Risk Matrix record for the Risk Matrix that you want to modify.
2. In the Risk Matrix Layout datasheet, select3. In the Appearance section, in the Dialog Title box, enter the new title for the Risk Assessment
window.
Note: The default title is not displayed on the datasheet. If the Dialog Title text box is empty, itindicates that the default title is being used.
4. Select .
Your changes are saved. The next time you view the Risk Assessment window from any item thatuses this Risk Matrix (for example, an Asset Strategy or RCM Analysis), the new title will appear.
Modify Text Box Labels in the Risk Assessment Window
About This Task
If the default labels Risk Of, Mitigated By, Unmitigated Risk Rank, and Mitigated Risk Rank that appear inthe Risk Assessment window are not suitable for your organization and terminology, you can modify thelabels using the Risk Matrix record.
Note:
When you modify a label, the new label will be used everywhere that the Risk Matrix record is used todisplay the Risk Assessment window. For example, if an Asset Strategy and an RCM Analysis use the sameRisk Matrix, if you modify the labels in that Risk Matrix record, the new labels will be displayed when youaccess the Risk Assessment interface from any of the following items:
• An Action or Risk in that Asset Strategy.• A Failure Effect or Recommendation in that RCM Analysis.
Procedure
1. Access the Risk Matrix record for the Risk Matrix that you want to modify.
© 2020 General Electric Company 35

2. In the Risk Matrix Layout datasheet, select3. In the Appearance section, in the following boxes, type the new titles:
• Unmitigated Risk Label: The label of section that displays the name of the risk. This will be usedin place of Risk Of.
• Mitigation Label: The label of the section that displays the name of the item that is mitigating therisk. This will be used in place of Mitigated By.
• Unmitigated Risk Rank: The label of the section that displays the unmitigated risk rank. This willbe used in place of Unmitigated Risk Rank.
• Mitigated Risk Rank: The label of the section that displays the mitigated risk rank. This will beused in place of Mitigated Risk Rank.
Note: The default titles are not displayed on the datasheet. If the text boxes are empty, it indicatesthat the default titles are being used.
4. Select .Your changes are saved. The next time you view the Risk Assessment window from any item thatuses this Risk Matrix (for example, an Asset Strategy or RCM Analysis), the new titles will appear.
Customize the Risk Matrix
About Customizing a Risk MatrixYou can customize the Risk Matrix that appears in the Risk Assessment window throughout GE DigitalAPM. You can do so by modifying values in the corresponding Risk Matrix record and the records to whichit is linked.
You can modify the baseline Risk Matrix record without creating a completely new one, or you can make acopy of the baseline Risk Matrix and customize the copy. Note that only one Risk Matrix record can bespecified as the default.
If a Risk Matrix has been used by a module in GE Digital APM, the values in the following fields in the RiskMatrix record cannot be modified:
• Currency• Use Maximum Risk Rank• Use Aliases?• Alias Format Mask
In addition, you will not be able to add or remove probabilities or consequences from the Risk Matrix.
Change the Axis on which Values Appear
About This Task
On the baseline Risk Matrix, values in Consequence records appear on the x-axis, and values in Probabilityrecords appear on the y-axis. If desired, you can flip the axes for these families so that values in Probabilityrecords appear on the x-axis and values in Consequence records appear on the y-axis.
When you modify the axis setting for one family, the axis setting for the other family is updatedautomatically to the opposite axis setting. In other words, if you specify that values in Consequencerecords should appear on the y-axis instead of the x-axis, the axis setting for values in Probability recordswill automatically appear on the x-axis instead of the y-axis.
36 © 2020 General Electric Company

Procedure
1. Access the Risk Matrix record for the Risk Matrix that you want to modify.
2. On the Risk Matrix Layout datasheet, select3. In the Consequence Axis or Probability Axis lists, select the axis on which you want to view the
family.The axis setting for the family whose option you did not change is updated automatically to display theopposite axis.
4. Select .Your changes are saved.
Change the Order in Which Consequence or Probability Values Appear
About This TaskIn the baseline Risk Matrix, consequence values appear in ascending order from left to right, andprobability values appear in descending order from top to bottom. You can change the sort order for oneor both of these families.
Procedure
1. Access the Risk Matrix record for the Risk Matrix that you want to modify.
2. On the Risk Matrix Layout datasheet, select3. In the Consequence Sort Order or Probability Sort Order box, select the sort order that you want
to apply: Ascending or Descending.
4. Select .The order of the consequence or probability values has been changed.
Unlock the Mitigated Consequence
About This Task
By default, the baseline Risk Matrix is configured to lock the mitigated consequence. This means that formitigated risk assessments, you will be able to modify only the probability value. You will not be able tomodify the consequence value.
Procedure
1. Access the Risk Matrix record for the Risk Matrix that you want to modify.
2. On the Risk Matrix Layout datasheet, select3. Clear the Lock Mitigated Consequence check box.
4. Select .Your changes are saved, and when you view the Risk Matrix via the Risk Assessment window, you willbe able to change the probability value or the consequence value in mitigated risk assessments.
Hide the Probability and Consequence Names
About This TaskIn the baseline Risk Matrix, Probability and Consequence names appear as row and column headers in theRisk Matrix. If necessary, you can hide the Consequence and Probability names.
© 2020 General Electric Company 37

Procedure
1. Access the Risk Matrix record for the Risk Matrix from which you want to hide Consequence andProbability names.
2. In the Risk Matrix Layout datasheet, select3. In the Appearance section, select the Hide Probability and Consequence Names check box.
4. Select .Your changes are saved. The next time the Risk Matrix is displayed, the Consequence and Probabilitynames will be hidden from the column and row headings, as shown in the following image.
Display Custom Values in the Risk Matrix
About This Task
In the baseline Risk Matrix, numeric values appear in each cell in a Risk Matrix. You can hide these numericvalues and then use the Use Aliases? option to display aliases in place of the numeric values. Forexample, instead of the value 1, you could display the alias value Credible - Low.
Procedure
1. Access the Risk Matrix record for the Risk Matrix that you want to modify.
2. On the Risk Matrix Layout datasheet, select3. Select the Hide Numeric Risk Rank? check box.
At this point, if you were to save the Risk Matrix, the numeric risk rank values would be hidden asshown in the following image.
38 © 2020 General Electric Company

4. Select the Use Maximum Risk Rank check box. This causes the total risk rank value to be themaximum risk rank across all categories (tabs) versus the sum of all risk rank values. This box must beselected in order to use enable the Use Aliases? check box.
5. Select the Use Aliases? check box.
6. Select7. Access the Consequence and Probability records linked to the Risk Matrix record.8. In the Alias field in each Consequence and Probability record, specify the custom values that you want
to appear.9. Save all changes.
The specified alias values will appear in the cells of the associated Risk Matrix.
Show the Unmitigated Financial Impact for Each Risk Category
About This Task
The Unmitigated Financial Impact value, stored in Risk Rank records, specifies the estimated monetaryvalue attributed to a specific Risk category. On the baseline Risk Matrix, the Unmitigated Financial Impactvalue is not displayed by default. These steps describe how to show this value on the Risk Matrix.
Procedure
1. Access the Risk Matrix record for the Risk Matrix for which you want to show the Unmitigated FinancialImpact.
2. In the Risk Matrix Layout datasheet, in the Appearance section, select the Show Financial Impactcheck box.
3. Select .Your changes are saved. The next time the Risk Matrix is displayed, the Unmitigated FinancialImpact box appears on each category section.
Note: The value in the Unmitigated Financial Impact box is a calculated value and cannot bemodified.
© 2020 General Electric Company 39

Change the Financial Precision of the Risk Matrix
About This Task
The Financial Precision value, stored in Risk Matrix records, specifies the number of decimal places todisplay when rendering financial values in a Risk Matrix. If no Financial Precision value is specified, aFinancial Precision of 2 (for example, 1.00) will be used. These steps describe how to change the FinancialPrecision of a Risk Matrix.
Procedure
1. Access the Risk Matrix record for the Risk Matrix for which you want to change the Financial Precision.2. In the Risk Matrix Layout datasheet, in the Appearance section, enter a value in the Financial
Precision field.
3. Select .The Financial Precision for the selected Risk Matrix is saved.
Define a Template for Displaying Risk Values
About This Task
If you have decided to display custom values in the Risk Matrix, you can create a template that willdetermine how values will be displayed in individual cells and on the tab labels.
For example, suppose your custom aliases appear in the Risk Matrix like this:
40 © 2020 General Electric Company

You can see that the risk value in each cell is a combination of the row alias and column alias, without adelimiter. You can also see that the selected risk value is reflected on the tab label. For instance, at theintersection of the Probable E row and the Very Low 1 column, you see the value E1, which is alsodisplayed on the tab label.
You could change this so that the risk values use a delimiter, such as a dash, so you would see E-1 insteadof E1.
Procedure
1. Access the Risk Matrix record for the Risk Matrix for which you want to specify how risk values will bedisplayed.
2. In the Risk Matrix Layout datasheet, make sure the Use Maximum Risk Rank and Use Aliases? boxesare checked.
3. In the Alias Format Mask box, enter a formula that represents the format in which you want riskvalues to be displayed, using any combination of the following parameters, with or without delimiters:
• {c}: The alias for the column (specified in the Alias field in the corresponding Consequence record).• {r}: The alias for the row (specified in the Alias field in the corresponding Probability record).• {t}: The alias for the risk threshold (specified in the Alias field in the corresponding Risk Threshold
record).
For example, suppose you want risk values to be displayed using the format <row alias> - <columnalias>. In other words, if the row alias is E and the column alias is 1, you want the risk value will bedisplayed as E-1. In this case, you would type the following formula in the Alias Format Mask box:{r}-{c}
4. Select .The template has been defined.
© 2020 General Electric Company 41

Chapter
5ReferenceTopics:
• General Reference• Family Field Descriptions
42 © 2020 General Electric Company

General Reference
Risk Assessment Data ModelThe values that appear on the baseline Risk Matrix come from values that are stored in records in thefollowing families:
• Risk Matrix• Risk Category• Consequence• Probability• Risk Threshold• Protection Level
The following diagram illustrates the families that are used to create a Risk Matrix and how they arerelated to one another in the baseline GE Digital APM database. GE Digital APM leverages its fundamentalentity and relationship family infrastructure to store data about the Risk Matrix.
Note: The Criticality Mapping entity family and the Has Criticality Mapping relationship family are usedonly by the Asset Criticality Analysis (ACA) module.
Risk Matrix System Code TablesThe following table lists the System Code Tables that are used by the Risk Matrix feature.
Table ID Table Description Function
MI_RISK_CATEGORY Risk Category Populates the Category Name field in RiskCategory records.
MI_RISK_CATEGORY_DESC Risk Category Description Populates the Category Description fieldin Risk Category records.
© 2020 General Electric Company 43

Table ID Table Description Function
MI_RISK_CONSEQUENCE Consequence Populates the Name field in Consequencerecords.
MI_RISK_CONSEQUENCE_DESC Consequence Description Populates the Description field inConsequence records.
MI_RISK_MATRIX_AXIS Risk Matrix Axis Selection Populates the Consequence Axis andProbability Axis fields in Risk Matrixrecords.
MI_RISK_MATRIX_SORT_ORDER Risk Matrix Sort Order for Consequenceand Probability
Populates the Consequence Sort Orderfield in Risk Matrix records.
MI_RISK_PROBABILITY Probability Populates the Name field in Probabilityrecords.
MI_RISK_PROBABILITY_DESC Probability Description Populates the Description field inProbability records.
MI_RISK_PROTECTION_LEVEL Protection Level Populates the Name field in ProtectionLevel Slider records.
MI_RISK_PROTECTION_LEVEL_DESC Protection Level Description Populates the Description field inProtection Level Slider records.
MI_RISK_THRESHOLD Risk Threshold Populates the Description field in RiskThreshold records.
MI_RISK_THRESHOLD_DESC Risk Threshold Description This table is not used.
About the Risk Assessment WindowThis documentation uses the term Risk Assessment window to refer to the window that displays theRisk Matrix and other risk information, and which can be accessed in various places throughout the GEDigital APM application. The actual name of the window that appears in the application may beUnmitigated Risk Assessment or Mitigated Risk Assessment, depending on how you accessed thewindow. Various aspects of the window, including its name, may be customized by an administrative user.
Note: For details on accessing the Risk Assessment window using a particular module, see thedocumentation for that module.
The following image illustrates what the Risk Assessment window looks like when accessed from AssetCriticality Analysis.
44 © 2020 General Electric Company
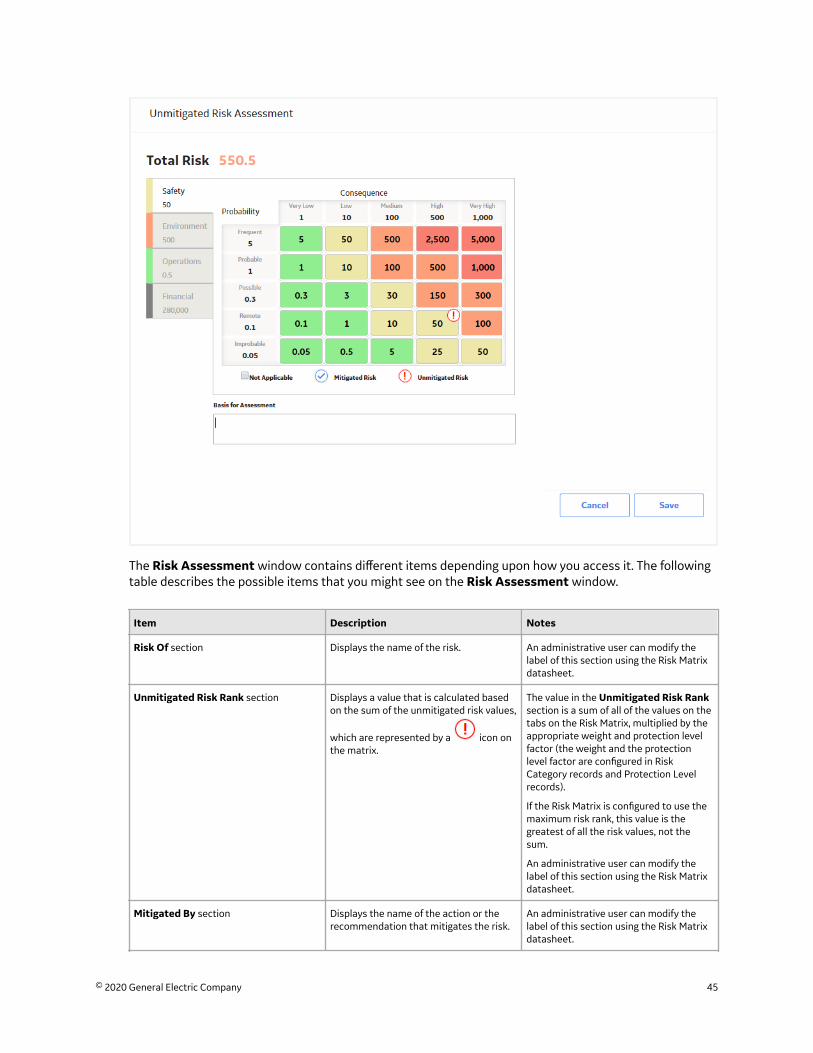
The Risk Assessment window contains different items depending upon how you access it. The followingtable describes the possible items that you might see on the Risk Assessment window.
Item Description Notes
Risk Of section Displays the name of the risk. An administrative user can modify thelabel of this section using the Risk Matrixdatasheet.
Unmitigated Risk Rank section Displays a value that is calculated basedon the sum of the unmitigated risk values,
which are represented by a icon onthe matrix.
The value in the Unmitigated Risk Ranksection is a sum of all of the values on thetabs on the Risk Matrix, multiplied by theappropriate weight and protection levelfactor (the weight and the protectionlevel factor are configured in RiskCategory records and Protection Levelrecords).
If the Risk Matrix is configured to use themaximum risk rank, this value is thegreatest of all the risk values, not thesum.
An administrative user can modify thelabel of this section using the Risk Matrixdatasheet.
Mitigated By section Displays the name of the action or therecommendation that mitigates the risk.
An administrative user can modify thelabel of this section using the Risk Matrixdatasheet.
© 2020 General Electric Company 45
Item Description Notes
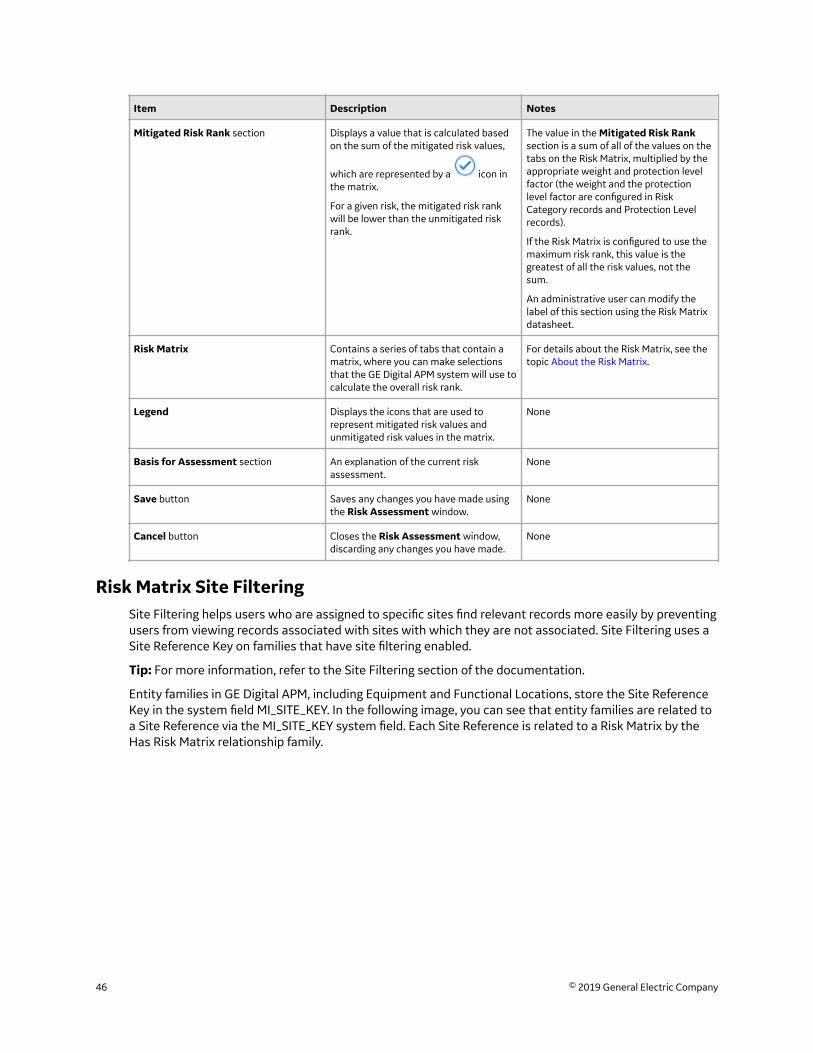
Mitigated Risk Rank section Displays a value that is calculated basedon the sum of the mitigated risk values,
which are represented by a icon inthe matrix.
For a given risk, the mitigated risk rankwill be lower than the unmitigated riskrank.
The value in the Mitigated Risk Ranksection is a sum of all of the values on thetabs on the Risk Matrix, multiplied by theappropriate weight and protection levelfactor (the weight and the protectionlevel factor are configured in RiskCategory records and Protection Levelrecords).
If the Risk Matrix is configured to use themaximum risk rank, this value is thegreatest of all the risk values, not thesum.
An administrative user can modify thelabel of this section using the Risk Matrixdatasheet.
Risk Matrix Contains a series of tabs that contain amatrix, where you can make selectionsthat the GE Digital APM system will use tocalculate the overall risk rank.
For details about the Risk Matrix, see thetopic About the Risk Matrix.
Legend Displays the icons that are used torepresent mitigated risk values andunmitigated risk values in the matrix.
None
Basis for Assessment section An explanation of the current riskassessment.
None
Save button Saves any changes you have made usingthe Risk Assessment window.
None
Cancel button Closes the Risk Assessment window,discarding any changes you have made.
None
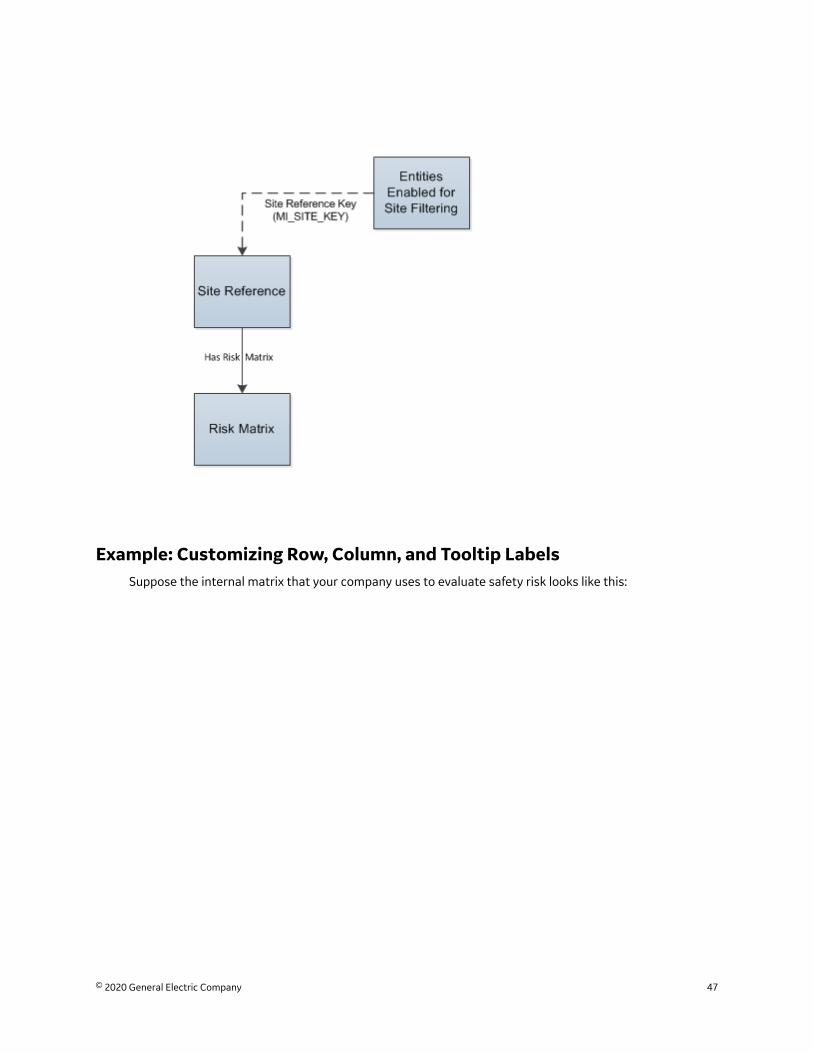
Risk Matrix Site FilteringSite Filtering helps users who are assigned to specific sites find relevant records more easily by preventingusers from viewing records associated with sites with which they are not associated. Site Filtering uses aSite Reference Key on families that have site filtering enabled.
Tip: For more information, refer to the Site Filtering section of the documentation.
Entity families in GE Digital APM, including Equipment and Functional Locations, store the Site ReferenceKey in the system field MI_SITE_KEY. In the following image, you can see that entity families are related toa Site Reference via the MI_SITE_KEY system field. Each Site Reference is related to a Risk Matrix by theHas Risk Matrix relationship family.
46 © 2019 General Electric Company
Example: Customizing Row, Column, and Tooltip LabelsSuppose the internal matrix that your company uses to evaluate safety risk looks like this:
© 2020 General Electric Company 47

You want to begin using GE Digital APM Asset Strategy Management to create Asset Strategies andevaluate risk, and the baseline GE Digital APM Risk Matrix that will be used in ASM looks like this:
48 © 2020 General Electric Company

You could modify the baseline Risk Matrix so that the probability and consequence labels more closelyresemble the Risk Matrix that you are familiar with.
To do so, in the Risk Matrix record, you would need to:
• Select the Hide Numeric Risk Rank check box, which hides the probability values 0.0001 through 1and consequence values 1 through 1000 from the Risk Matrix.
• Select the Use Maximum Risk Rank check box, which causes the total risk rank value to be themaximum risk rank across all categories (tabs) versus the sum of all risk rank values.
• Select the Use Aliases check box, which allows you to define your own custom labels.• Type the text {r}{c} in the Alias Format Mask text box.
Then, in the Probability and Consequence records that are linked to the Safety Risk Category record, youwould need to create aliases to specify the labels that you want to see in the Risk Matrix. Specifically, youwould need to:
• Specify the probability values A through E in the Alias field in the Probability records. For example, inthe Unlikely Probability record with the Probability value 0.0001, you would type A in the Alias textbox.
If you were to view the Risk Matrix, you would see a row with the label Unlikely A, as shown in thefollowing image.
In each remaining Probability record, you would specify the aliases B, C, D, and E.• Specify the consequence values 1 through 5 in the Alias field in the Consequence records. For example,
in the Very High Consequence record with the Consequence value 1000, you would type 5 in the Aliasbox.
If you were to view the Risk Matrix, you would see a column with the label Very High 5, as shown in thefollowing image.
© 2020 General Electric Company 49

In each remaining Consequence record, you would specify the aliases 2, 3, 4, and 5.
When you finished defining the aliases, the completed Safety section in the Risk Matrix would look likethis:
50 © 2020 General Electric Company

About the Risk Matrix System Code TablesWhen you create or modify certain records linked to a Risk Matrix record, the values that you can select inthe Name and Description lists are defined by System Code Tables. The following table lists theserecords and the corresponding tables.
Record Table that defines the Name list Table that defines the Description list
Risk Category MI_RISK_CATEGORY MI_RISK_CATEGORY_DESC
Consequence MI_RISK_CONSEQUENCE MI_RISK_CONSEQUENCE_DESC
Probability MI_RISK_PROBABILITY MI_RISK_PROBABILITY_DESC
Risk Threshold N/A MI_RISK_THRESHOLD_DESC
You can modify or add new entries to these System Code Tables via the System Codes and Tables pagewithin the Risk Matrix Admin section of the application.
For each entry in a System Code Table that defines the Name list, there must be a corresponding entry(i.e., an entry with the same ID) in the System Code Table that defines the Description list. After youselect a value in the Name box, the Description box is populated automatically with the value defined bythe corresponding system code.
Example
When you create a new Probability record, suppose that the following list appears in the Name box.
© 2020 General Electric Company 51

These values are defined in the MI_RISK_PROBABILITY System Code Table, where the values that appearin the Name list are the Descriptions for each System Code.
52 © 2020 General Electric Company

Further, after you select a value in the Name box, the Description box is populated automatically. Thevalue that is populated is specified by the entry in the MI_RISK_PROBABILITY_DESC table that containsthe same ID as the selected entry in the MI_RISK_PROBABILITY System Code Table, where the valuepopulated is stored in the Description field of the System Code.
For example, suppose you create a new Probability record and select Frequent in the Name box. TheDescription box is populated automatically with the text Likely to occur more frequent than missiontime.
The following System Code in the MI_RISK_PROBABILITY System Code Table represents the valueFrequent.
© 2020 General Electric Company 53

The following System Code in the MI_RISK_PROBABILITY_DESC System Code Table has the same ID. Thevalue from this System Code is used to populate the Description box for the Probability record with thetext Likely to occur more frequent than mission time.
54 © 2020 General Electric Company

How the Values in the Risk Matrix are ConfiguredYou can configure each Risk Matrix to display values in certain places to guide users in selecting theappropriate risk values.
Values in a Risk Matrix are determined as follows:
• The Risk Matrix as a whole that appears in the Risk Assessment window is specified by a Risk Matrixrecord. Risk Matrix records store the values that determine how the Risk Matrix looks. Some of thevalues in a Risk Matrix record are also used to filter the values that you can select in other records inthe Risk Matrix data model.
• Each tab in the Risk Assessment window is specified by a Risk Category record linked to the RiskMatrix record.
• Within the Risk Matrix that appears upon selecting given tab, each row identifies a probability levelassociated with the matrix. Each probability level is specified by a Probability record. The Risk Categoryrecord to which the Probability record is linked determines the section in which the row will appear.
• Within the Risk Matrix that appears upon selecting a given tab, each column identifies a consequencelevel associated with the matrix. Each consequence level is specified by a Consequence record. TheRisk Category record to which the Consequence record is linked determines the section in which thecolumn will appear.
• Within each Risk Matrix, each cell contains a color and a tooltip that explains the threshold withinwhich the risk value falls. The threshold values and corresponding colors are specified by RiskThreshold records that are linked to the Risk Matrix record.
Example
Consider the following Risk Matrix.
© 2020 General Electric Company 55

The values shown in this Risk Matrix are determined by the following records:
• Risk Matrix records: Determines the look of the Risk Matrix, such as the appearance, order, and axison which the probability and consequence values appear.
• Risk Category records: There are 4 Risk Category records linked to the Risk Matrix record shown:Safety, Environment, Operations, and Financial. Each Risk Category record corresponds to one tabwithin the Risk Assessment window. The image shown above displays the values in Probability andConsequence records that are linked to the Safety Risk Category record.
• Probability records: There are 5 Probability records linked to the Environment Risk Category record.Each Probability record corresponds to one row in the Risk Matrix.The Probability record for the first row shown in this example contains the following values:
◦ Name: Probable◦ Value: 1◦ Description: Likely to occur the same as mission time
Note: This value appears as a tooltip when you pause over the row heading.• Consequence records: There are 5 Consequence records linked to the Environment Risk Category
record. Each Consequence record corresponds to one column in the Risk Matrix.
The Consequence record for the first column shown in this example contains the following values:
◦ Name: Very Low◦ Value: 1◦ Description: None to minor first-aid
Note: This value appears as a tooltip when you pause over the column heading.
56 © 2020 General Electric Company

• Risk Threshold records: There are 5 Risk Threshold records linked to this Risk Matrix record. EachRisk Threshold record corresponds to a range of values that are represented with the same color in thematrix, as well as the risk threshold value that appears when you pause on a cell in the matrix.
The Risk Threshold record representing the cell in this example contains the following values:
◦ Description: Medium◦ Value: 1◦ Color: PaleGoldenrod
Note: Risk Threshold records represent a range of values. Refer to the topic About Risk ThresholdRecords for more information about how Risk Threshold records are used.
About Risk Threshold RecordsEach Risk Matrix is linked to multiple Risk Threshold records, where each Risk Threshold recordcorresponds to a range of values that are represented with the same color in the matrix, as well as therisk threshold value that appears when you pause on a cell in the matrix.
When you select a tab on the Risk Matrix, the cells in the matrix are shaded according to the value in thatcell and where it falls within the ranges as they are defined in the Risk Threshold records. For example, inthe following image, you can see that the cells contain in the number 0.1 and 0.01 are colored LightGreen.If you pause on the cell, the tooltip says Low.
The following Risk Threshold records are provided in the baseline GE Digital APM database to support thebaseline Risk Matrix.
© 2020 General Electric Company 57

58 © 2020 General Electric Company

© 2020 General Electric Company 59

From the values in these records, we can determine that the following criteria will be applied to numbersthat appear on the baseline Risk Matrix:
• Any number greater than or equal to 0 and less than 1 will be considered low risk. Cells in the matrixthat contain numbers greater than or equal to 0 and less than 1 will be shaded LightGreen.
• Any number greater than or equal to 1 and less than 10 will be considered medium risk. Cells in thematrix that contain numbers within this range will be shaded PaleGoldenrod.
• Any number greater than or equal to 10 and less than 100 will be considered high risk. Cells in thematrix that contain numbers within this range will be shaded LightSalmon.
• Any number greater than or equal to 100 and less than 1000 will be considered very high risk. Cells inthe matrix that contains numbers within this range will be shaded Salmon.
• Any number greater than or equal to 1000 will be considered extreme risk. Cells in the matrix thatcontains numbers greater than or equal to 1000 will be shaded IndianRed.
About the Baseline Risk Matrix RecordsThe baseline GE Digital APM database contains two Risk Matrices:
• Standard Practice• Default
Note: If you are upgrading from a previous version of GE Digital APM, you will not receive the StandardPractice Risk Matrix. You will receive only the Default Risk Matrix (and any Risk Matrices that you createdmanually). The Default Risk Matrix will be phased out over the next several releases. If you are an existingcustomer, you should continue using the Risk Matrix that you were using before you upgraded. Newcustomers, however, will receive both Risk Matrices but should use the Standard Practice Risk Matrix orcreate their own Risk Matrix. In other words, the Standard Practice Risk Matrix is recommended forcustomers who are not already using a different Risk Matrix. For this reason, the GE Digital APMdocumentation explains the functionality of the Standard Practice Risk Matrix, not the Default Risk Matrix.Throughout this documentation, when we use the phrase baseline Risk Matrix, we are referring to theStandard Practice Risk Matrix. The Standard Practice Risk Matrix is not set automatically as the defaultRisk Matrix. If you are planning to use it as the default Risk Matrix, you will need to select the Defaultcheck box on the datasheet (after clearing the Default check box for the Default Risk Matrix).
60 © 2020 General Electric Company

The following image shows the Standard Practice Risk Matrix.
The Standard Practice Risk Matrix consists of a Risk Matrix record and the following additional records:
• 4 Risk Category records: Safety, Environment, Operations, and Financial.• 5 Consequence records: Very Low, Low, Medium, High, and Very High.
In the baseline GE Digital APM database, each Consequence record is linked to the following RiskCategory records: Environment, Operations, Safety. The Risk Category record Financial is not linked toa Consequence record.
• 8 Probability records: Frequent, Probable, Likely, Credible, Remote, Possible, Improbable, Unlikely.5 of these Probability records are linked to each Risk Category record, as shown in the following table.
Safety Environment Operations Financial
Probable Probable Frequent Frequent
Credible Credible Probable Probable
Remote Remote Likely Likely
Improbable Improbable Credible Credible
Unlikely Unlikely Possible Possible
• 5 Risk Threshold records: Low, Medium, High, Very High, and Extreme.
© 2020 General Electric Company 61

Family Field Descriptions
Consequence RecordsConsequence records determine the consequence levels available within a Risk Matrix. This topic providesan alphabetical list and description of the fields that exist for the Consequence family and appear on theConsequence Definition datasheet. The information in the table reflects the baseline state and behaviorof these fields.
Field Data Type Description Behavior and Usage
Alias Character An alias for the consequence. When the Use Aliases? check
box is selected in the
associated Risk Matrix record,
the value in the Alias field in
the Consequence record
appears in the column heading
along with the consequence
name.
In addition, if the Alias Format
Mask field in the associated
Risk Matrix record contains the
value {c}, the value in the Alias
field in the Consequence
record will be displayed in the
cell in the Risk Matrix
(according to the complete
template that is defined in the
Alias Format Mask field).
Color Code Character The HEX or RGB code for the
specific colors used in Risk
Matrix
None
Consequence Numeric A numeric value representing
the severity of the
consequence.
This value appears on the
column heading in the risk
matrix.
After the Risk Matrix has been
used by a module in GE Digital
APM, this field is disabled, and
you will not able to modify it.
62 © 2020 General Electric Company

Field Data Type Description Behavior and Usage
Description Character A description of the severity of
consequence.This field is populated
automatically based upon the
value in the Name field. It is
populated with a System Code
in the
MI_RISK_CONSEQUENCE_DES
C System Code Table, which
contains the same ID as the
System Code that is stored in
the Name field.
In the risk matrix, this value
appears when you pause on
the column heading.
Name Character The name of the consequence. This field contains a list that is
populated based upon the
MI_RISK_CONSEQUENCE
System Code Table.
This value appears on the
column heading in the risk
matrix.
Probability RecordsProbability records determine the probability levels available within a Risk Matrix. This topic provides analphabetical list and description of the fields that exist for the Probability family and appear on theProbability Definition datasheet. The information in the table reflects the baseline state and behavior ofthese fields.
© 2020 General Electric Company 63
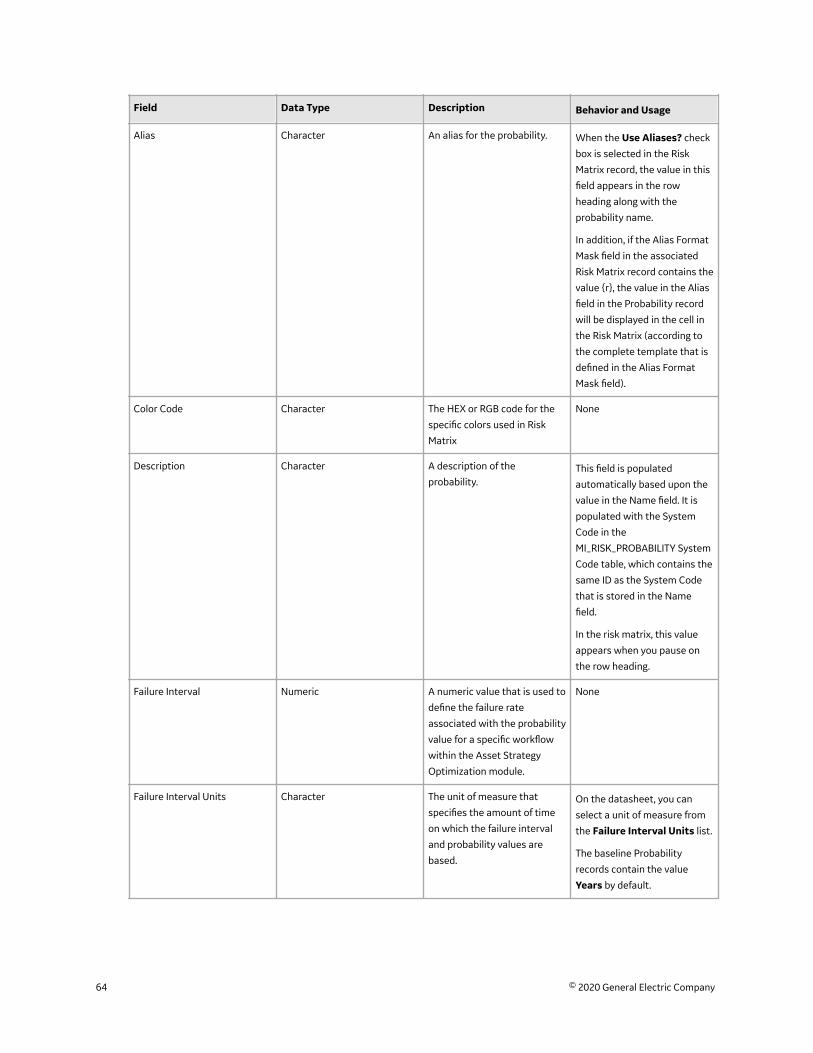
Field Data Type Description Behavior and Usage
Alias Character An alias for the probability. When the Use Aliases? check
box is selected in the Risk
Matrix record, the value in this
field appears in the row
heading along with the
probability name.
In addition, if the Alias Format
Mask field in the associated
Risk Matrix record contains the
value {r}, the value in the Alias
field in the Probability record
will be displayed in the cell in
the Risk Matrix (according to
the complete template that is
defined in the Alias Format
Mask field).
Color Code Character The HEX or RGB code for the
specific colors used in Risk
Matrix
None
Description Character A description of the
probability.This field is populated
automatically based upon the
value in the Name field. It is
populated with the System
Code in the
MI_RISK_PROBABILITY System
Code table, which contains the
same ID as the System Code
that is stored in the Name
field.
In the risk matrix, this value
appears when you pause on
the row heading.
Failure Interval Numeric A numeric value that is used to
define the failure rate
associated with the probability
value for a specific workflow
within the Asset Strategy
Optimization module.
None
Failure Interval Units Character The unit of measure that
specifies the amount of time
on which the failure interval
and probability values are
based.
On the datasheet, you can
select a unit of measure from
the Failure Interval Units list.
The baseline Probability
records contain the value
Years by default.
64 © 2020 General Electric Company

Field Data Type Description Behavior and Usage
Name Character The name of the probability
level.This field contains a list that is
populated based upon the
MI_RISK_PROBABILITY System
Code Table.
The value that you select
appears on the row heading in
the risk matrix.
Probability Numeric A numeric value that
represents the probability that
the risk will occur.
After the Risk Matrix has been
used by a module in GE Digital
APM, this field is disabled, and
you will not able to modify it.
Risk Category Character The name of the risk category
to which this probability
applies (stored in the Category
Name field of the Risk
Category record to which this
Probability record is linked).
This field does not appear on
the datasheet.
Protection Level SliderThe following table provides an alphabetical list and description of the fields that exist in the ProtectionLevel family and that are displayed on the baseline Protection Level Definition datasheet (unlessotherwise noted). The information in the table reflects the baseline state and behavior of these fields.
This topic provides an alphabetical list and description of the fields that exist for the Protection Levelfamily and appear on the Protection Level Definition datasheet. The information in the table reflects thebaseline state and behavior of these fields.
© 2020 General Electric Company 65

Field Data Type Description Behavior and Usage
Alias Character An alias for the protection
level.
If the Alias Format Mask field
in the associated Risk Matrix
record contains the value {pl},
the value in the Alias field in
the Protection Level record will
be displayed in the cell in the
Risk Matrix (according to the
complete template that is
defined in the Alias Format
Mask field).
Description Character A description of the protection
level.
This field is populated
automatically based upon the
value in the Name field. It is
populated with the System
Code in the
MI_RISK_PROTECTION_LEVEL_
DESC System Code Table,
which contains the same ID as
the System Code that is stored
in the Name field. A Super User
can modify the System Codes
that are available via the
Protection Level tab in the Risk
Matrix record to which this
Protection Level record is
linked. When you pause on a
level in the Protection Level
Definition slider, this value
appears to the right of the
protection level name
(separated by a colon). For
example, if the name is 1 and
the description is One, when
you pause on that level in the
slider, you will see the value
1:One.
66 © 2020 General Electric Company
Field Data Type Description Behavior and Usage
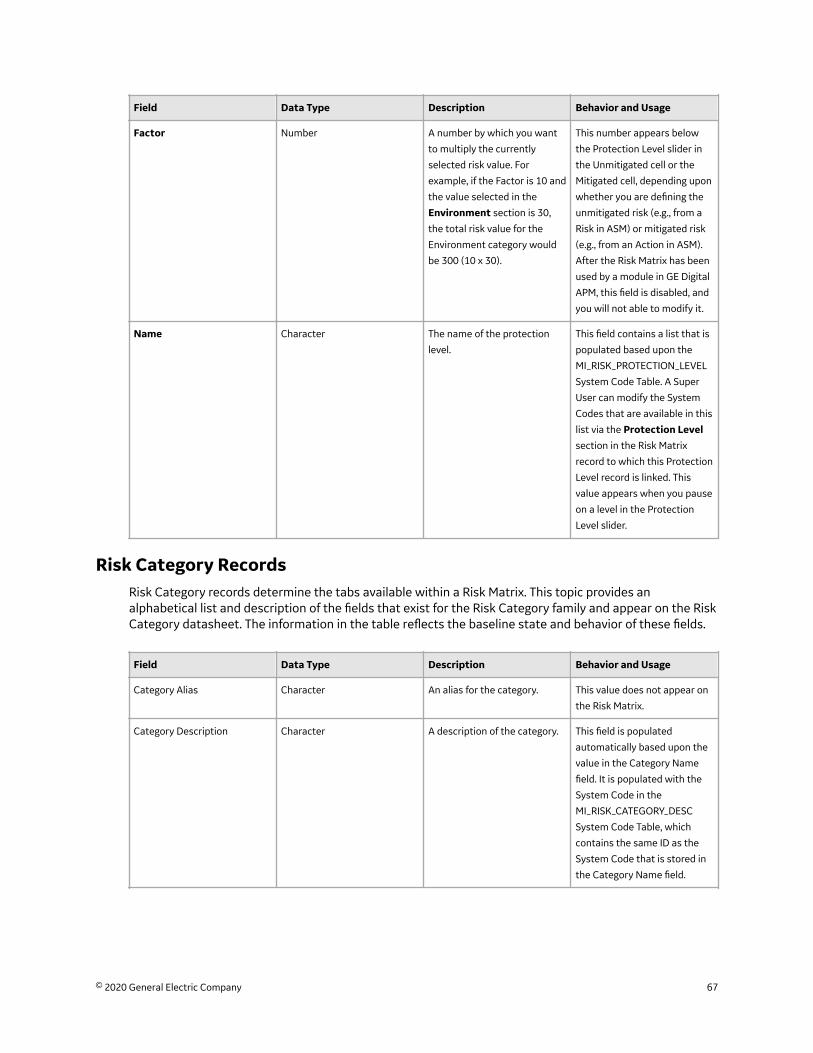
Factor Number A number by which you want
to multiply the currently
selected risk value. For
example, if the Factor is 10 and
the value selected in the
Environment section is 30,
the total risk value for the
Environment category would
be 300 (10 x 30).
This number appears below
the Protection Level slider in
the Unmitigated cell or the
Mitigated cell, depending upon
whether you are defining the
unmitigated risk (e.g., from a
Risk in ASM) or mitigated risk
(e.g., from an Action in ASM).
After the Risk Matrix has been
used by a module in GE Digital
APM, this field is disabled, and
you will not able to modify it.
Name Character The name of the protection
level.
This field contains a list that is
populated based upon the
MI_RISK_PROTECTION_LEVEL
System Code Table. A Super
User can modify the System
Codes that are available in this
list via the Protection Levelsection in the Risk Matrix
record to which this Protection
Level record is linked. This
value appears when you pause
on a level in the Protection
Level slider.
Risk Category RecordsRisk Category records determine the tabs available within a Risk Matrix. This topic provides analphabetical list and description of the fields that exist for the Risk Category family and appear on the RiskCategory datasheet. The information in the table reflects the baseline state and behavior of these fields.
Field Data Type Description Behavior and Usage
Category Alias Character An alias for the category. This value does not appear on
the Risk Matrix.
Category Description Character A description of the category. This field is populated
automatically based upon the
value in the Category Name
field. It is populated with the
System Code in the
MI_RISK_CATEGORY_DESC
System Code Table, which
contains the same ID as the
System Code that is stored in
the Category Name field.
© 2020 General Electric Company 67
Field Data Type Description Behavior and Usage
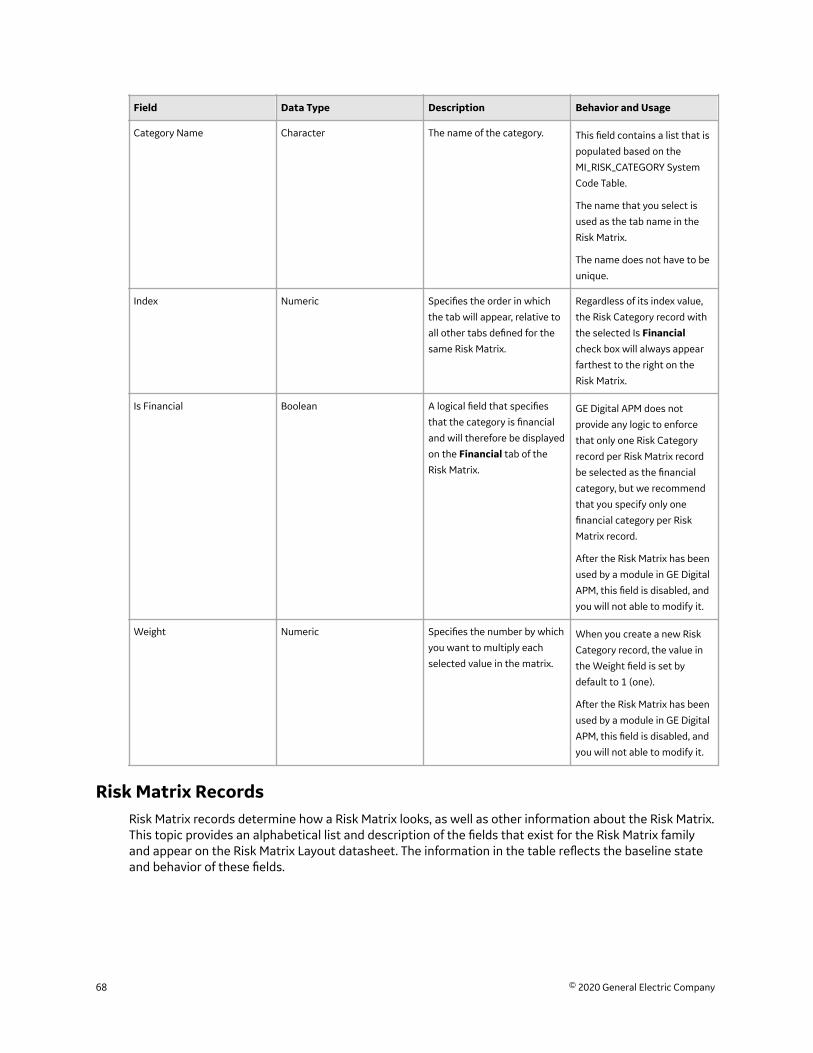
Category Name Character The name of the category. This field contains a list that is
populated based on the
MI_RISK_CATEGORY System
Code Table.
The name that you select is
used as the tab name in the
Risk Matrix.
The name does not have to be
unique.
Index Numeric Specifies the order in which
the tab will appear, relative to
all other tabs defined for the
same Risk Matrix.
Regardless of its index value,
the Risk Category record with
the selected Is Financialcheck box will always appear
farthest to the right on the
Risk Matrix.
Is Financial Boolean A logical field that specifies
that the category is financial
and will therefore be displayed
on the Financial tab of the
Risk Matrix.
GE Digital APM does not
provide any logic to enforce
that only one Risk Category
record per Risk Matrix record
be selected as the financial
category, but we recommend
that you specify only one
financial category per Risk
Matrix record.
After the Risk Matrix has been
used by a module in GE Digital
APM, this field is disabled, and
you will not able to modify it.
Weight Numeric Specifies the number by which
you want to multiply each
selected value in the matrix.
When you create a new Risk
Category record, the value in
the Weight field is set by
default to 1 (one).
After the Risk Matrix has been
used by a module in GE Digital
APM, this field is disabled, and
you will not able to modify it.
Risk Matrix RecordsRisk Matrix records determine how a Risk Matrix looks, as well as other information about the Risk Matrix.This topic provides an alphabetical list and description of the fields that exist for the Risk Matrix familyand appear on the Risk Matrix Layout datasheet. The information in the table reflects the baseline stateand behavior of these fields.
68 © 2020 General Electric Company

Field Data Type Description Behavior and Usage
Alias Format Mask Character Specifies the format in which
you want to display the risk
rank values in the cells on the
risk matrix.
The format must be defined
using the following formula:
{c} - {r} - {pl} - {t}
Where:
• {c} is the alias for the
column.
• {r} is the alias for the row.
• {pl} is the alias for the
protection level.
• {t} is the alias for the risk
threshold.
The delimiter in this formula is
a dash (-), but it can be
customized. For example, you
could use a colon (:), in place of
a dash.
You can exclude from the
format any parameter that you
do not want to see on the risk
matrix.
The default format is {c} - {r}.
Consequence Axis Character Specifies the axis on which the
consequence values are
displayed.
You can choose from:
• X-Axis: Displays the
consequence values along
the x-axis.
• Y-Axis: Displays the
consequence values along
the y-axis.
When you change this value,
the value in the Probability
Axis field is updated
automatically to display the
opposite value.
In the baseline Risk Matrix
record and all new Risk Matrix
records that you create, the
default value is X-Axis.
Consequence Sort Order Character Specifies the order in which
the consequence values are
displayed.
In the baseline Risk Matrix
record and all new Risk Matrix
records that you create, the
default value is Ascending.
© 2020 General Electric Company 69

Field Data Type Description Behavior and Usage
Currency Character Specifies the unit of measure
that appears next to the
Consequence box on the
Financial tab of the Risk
Matrix.
After the Risk Matrix has been
used by a module in GE Digital
APM, this field is disabled, and
you cannot modify the value.
In the baseline Risk Matrix
record and all new Risk Matrix
records that you create, the
default value is USD.
Default Boolean Indicates whether or not this
Risk Matrix is the default Risk
Matrix.
You can specify only one Risk
Matrix record as the default.
In the Standard Practice Risk
Matrix record, the Defaultcheck box is cleared. In the
Default Risk Matrix record, the
Default check box is selected.
Dialog Title Character Specifies the title on the RiskAssessment window that
appears when accessed from
an item that uses this Risk
Matrix (e.g., an Action in an
Asset Strategy).
In the baseline Risk Matrix
record and all new Risk Matrix
records that you create, the
Dialog title box is empty,
indicating that the default title
is being used.
Financial Precision Numeric Specifies the number of
decimal places to display
when rendering financial
values in a Risk Matrix.
If no Financial Precision value
is specified, a Financial
Precision of 2 (e.g., 1.00) will
be used.
In the baseline Risk Matrix
record and all new Risk Matrix
records that you create, the
Financial Precision box is
empty, indicating that the
default precision value is being
used.
Hide Numeric Risk Rank? Boolean Indicates whether or not you
want to display the numeric
risk rank values in the Risk
Matrix.
If this check box is cleared, the
numeric risk rank values are
displayed. If this check box is
selected, the numeric risk rank
values are hidden in the Risk
Matrix.
In the baseline Risk Matrix
record and all new Risk Matrix
records that you create, this
check box is cleared.
70 © 2020 General Electric Company
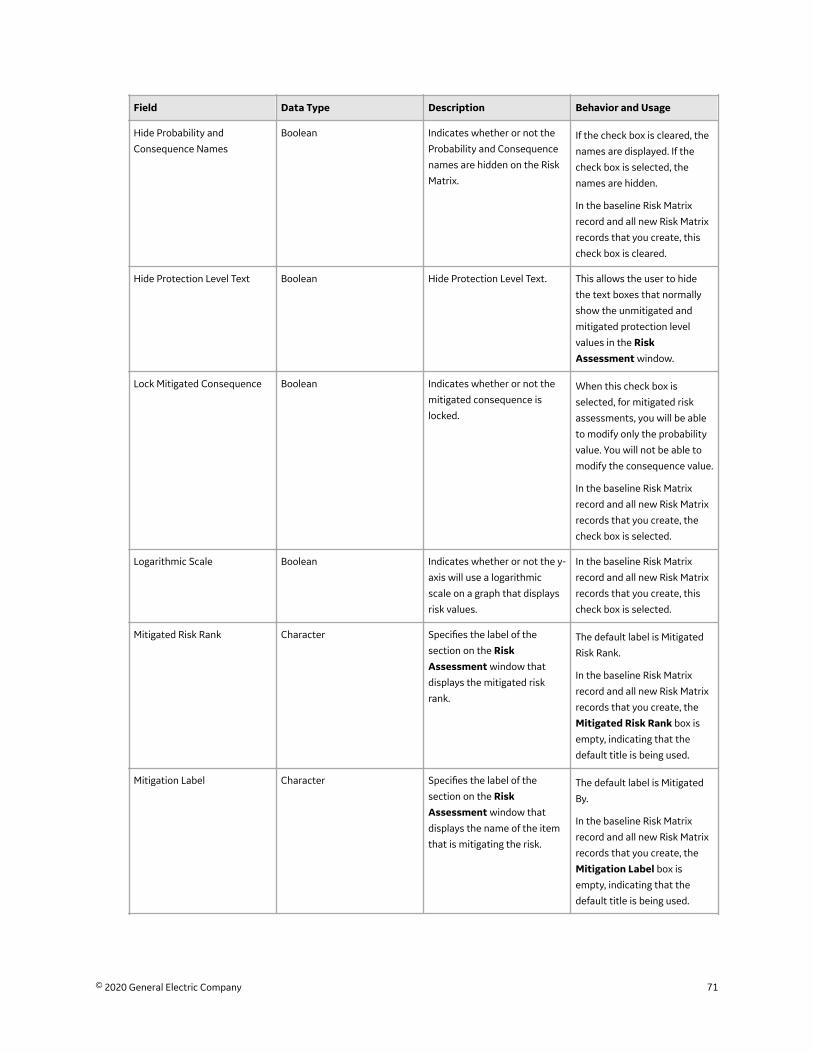
Field Data Type Description Behavior and Usage
Hide Probability and
Consequence Names
Boolean Indicates whether or not the
Probability and Consequence
names are hidden on the Risk
Matrix.
If the check box is cleared, the
names are displayed. If the
check box is selected, the
names are hidden.
In the baseline Risk Matrix
record and all new Risk Matrix
records that you create, this
check box is cleared.
Hide Protection Level Text Boolean Hide Protection Level Text. This allows the user to hide
the text boxes that normally
show the unmitigated and
mitigated protection level
values in the RiskAssessment window.
Lock Mitigated Consequence Boolean Indicates whether or not the
mitigated consequence is
locked.
When this check box is
selected, for mitigated risk
assessments, you will be able
to modify only the probability
value. You will not be able to
modify the consequence value.
In the baseline Risk Matrix
record and all new Risk Matrix
records that you create, the
check box is selected.
Logarithmic Scale Boolean Indicates whether or not the y-
axis will use a logarithmic
scale on a graph that displays
risk values.
In the baseline Risk Matrix
record and all new Risk Matrix
records that you create, this
check box is selected.
Mitigated Risk Rank Character Specifies the label of the
section on the RiskAssessment window that
displays the mitigated risk
rank.
The default label is Mitigated
Risk Rank.
In the baseline Risk Matrix
record and all new Risk Matrix
records that you create, the
Mitigated Risk Rank box is
empty, indicating that the
default title is being used.
Mitigation Label Character Specifies the label of the
section on the RiskAssessment window that
displays the name of the item
that is mitigating the risk.
The default label is Mitigated
By.
In the baseline Risk Matrix
record and all new Risk Matrix
records that you create, the
Mitigation Label box is
empty, indicating that the
default title is being used.
© 2020 General Electric Company 71
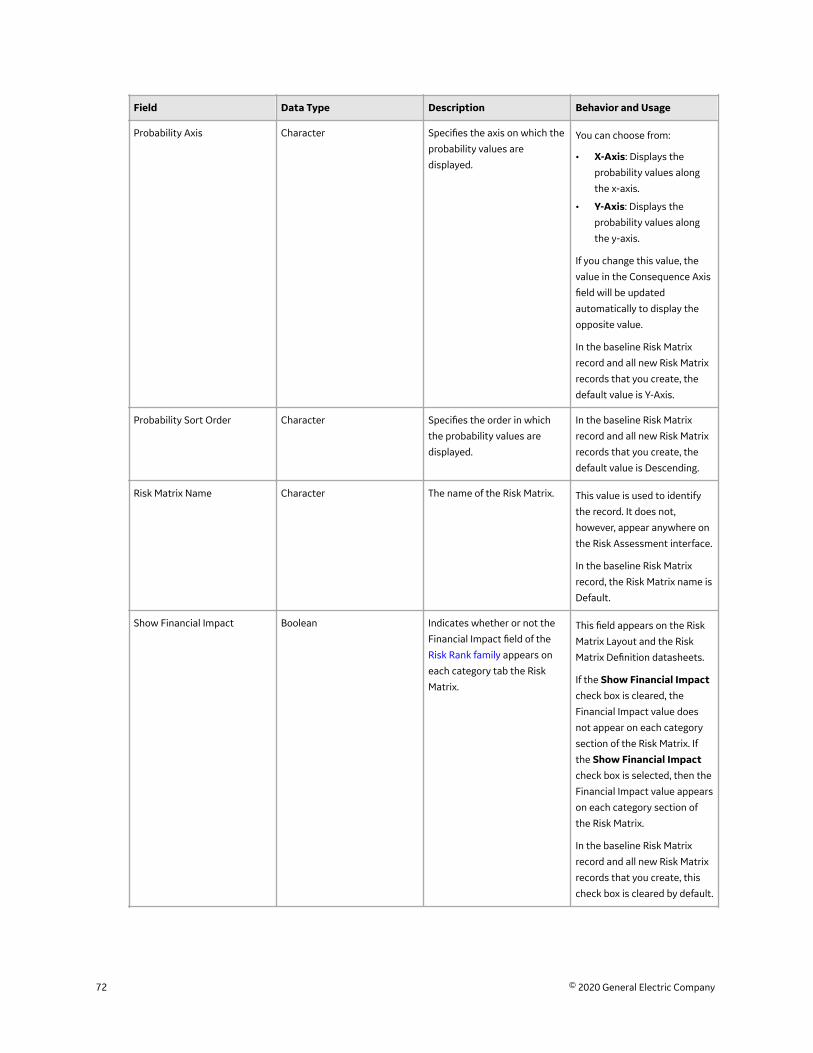
Field Data Type Description Behavior and Usage
Probability Axis Character Specifies the axis on which the
probability values are
displayed.
You can choose from:
• X-Axis: Displays the
probability values along
the x-axis.
• Y-Axis: Displays the
probability values along
the y-axis.
If you change this value, the
value in the Consequence Axis
field will be updated
automatically to display the
opposite value.
In the baseline Risk Matrix
record and all new Risk Matrix
records that you create, the
default value is Y-Axis.
Probability Sort Order Character Specifies the order in which
the probability values are
displayed.
In the baseline Risk Matrix
record and all new Risk Matrix
records that you create, the
default value is Descending.
Risk Matrix Name Character The name of the Risk Matrix. This value is used to identify
the record. It does not,
however, appear anywhere on
the Risk Assessment interface.
In the baseline Risk Matrix
record, the Risk Matrix name is
Default.
Show Financial Impact Boolean Indicates whether or not the
Financial Impact field of the
Risk Rank family appears on
each category tab the Risk
Matrix.
This field appears on the Risk
Matrix Layout and the Risk
Matrix Definition datasheets.
If the Show Financial Impactcheck box is cleared, the
Financial Impact value does
not appear on each category
section of the Risk Matrix. If
the Show Financial Impactcheck box is selected, then the
Financial Impact value appears
on each category section of
the Risk Matrix.
In the baseline Risk Matrix
record and all new Risk Matrix
records that you create, this
check box is cleared by default.
72 © 2020 General Electric Company

Field Data Type Description Behavior and Usage
Unmitigated Risk Label Character Specifies the label of the
section on the RiskAssessment window that
displays the name of the risk.
The default label is Risk Of.
In the baseline Risk Matrix
record and all new Risk Matrix
records that you create, the
Unmitigated Risk Label box
is empty, indicating that the
default label is being used.
Unmitigated Risk Rank Character Specifies the label of the
section on the RiskAssessment window that
displays the unmitigated risk
rank.
Note: If you are using the
Asset Criticality Analysis
feature, this value will also be
used as the label of the
column that displays the
unmitigated risk rank in ACA.
The default label is
Unmitigated Risk Rank.
In the baseline Risk Matrix
record and all new Risk Matrix
records that you create, the
Unmitigated Risk Rank box
is empty, indicating that the
default label is being used.
Use Aliases? Boolean Indicates whether or not you
want to display the aliases
that have been defined for the
records that are linked to the
Risk Matrix record. For
example, if the Alias field in the
Consequence record High
contains the value E, when the
Use Aliases? check box is
selected, instead of seeing
only the value High in the Risk
Matrix, the value E will appear.
In the baseline Risk Matrix
record and all new Risk Matrix
records that you create, this
check box is disabled and
cleared. It becomes enabled
only when you select the UseMaximum Risk Rank check
box.
Use Maximum Risk Rank Boolean Indicates whether or not the
overall risk rank will equal the
largest value of all selected
values (except for the
Financial value) in Risk Matrix.
If this check box is cleared, the
overall risk rank will equal the
sum of all selected values
(except for the Financial
value).
After the Risk Matrix has been
used by a module in GE Digital
APM, this field is disabled, and
you cannot modify the
selection.
In the baseline Risk Matrix
record and all new Risk Matrix
records that you create, this
check box is cleared.
© 2020 General Electric Company 73

Risk Rank RecordsRisk Rank records are used to determine a single instance of risk for a specific category within a RiskAssessment. This topic provides an alphabetical list and description of the fields that exist for the RiskRank family and appear on the Risk datasheet. The information in the table reflects the baseline state andbehavior of these fields. This list is not comprehensive.
Field Data Type Description Behavior and Usage
Category Character The ID of the Risk Category
record used to assess the Risk.The value in this field is
populated automatically with
one of the following values:
• Safety
• Environment
• Operations
• Financial
Consequence Numeric A numeric value representing
the severity of the
consequence.
The value in this field is
populated based on the
selections made on the RiskAssessment window.
Financial Impact Numeric The estimated monetary value
attributed to a specific Risk
Category.
A value is not required.
The value in this field can be
configured to appear on the
Risk Matrix. The default label
on the Risk Matrix is
Unmitigated Financial Impact.
Probability Numeric A numeric value representing
the probability that the risk
will occur.
The value in this field is
populated based on the
selections made on the RiskAssessment window.
Risk Numeric Specifies the total risk of the
assessment.The value in this field appears
at the top of the Risk Matrix
and is calculated as follows:
Risk = Probability xConsequence
Risk Threshold RecordsRisk Threshold records determine the threshold values and colors that appear within a Risk Matrix. Thistopic provides an alphabetical list and description of the fields that exist for the Risk Threshold family andappear on the Risk Threshold datasheet. The information in the table reflects the baseline state andbehavior of these fields.
74 © 2020 General Electric Company

Field Data Type Description Behavior and Usage
Alias Character An alias for the risk threshold. When the Use Aliases? check
box is selected in the Risk
Matrix record, when you pause
on a cell in the risk matrix,
instead of the value in the
Description field in the Risk
Threshold record, this value
will appear.
In addition, if the Alias Format
Mask field in the associated
Risk Matrix record contains the
value {t}, the value in the Alias
field in the Risk Threshold
record will be displayed in the
cell in the Risk Matrix
(according to the complete
template that is defined in the
Alias Format Mask field).
Color Character A value indicating the color
that will appear in all cells in
the matrix that contain a
number that falls within this
risk boundary (according to
the number in the Value box
of this Risk Threshold record
and other Risk Threshold
records that are linked to the
same Risk Matrix record).
None
© 2020 General Electric Company 75

Field Data Type Description Behavior and Usage
Description Character A description of the risk level. This value is used to identify
the record. This value appears
when you pause on a cell in
the risk matrix.
Value Numeric A number that represents the
risk level associated with the
number in a cell in the matrix.
If a cell in the matrix contains
a number greater than or
equal to the risk level and less
than the next highest risk level
in a Risk Threshold record that
is linked to the same Risk
Matrix record, the number will
be considered to reside within
this risk level.
For example, if the Value field
in the Risk Threshold record
Medium contains the number
10, and the Value field in the
Risk Threshold record High,
which is linked to the same
Risk Matrix record, contains
the number 100, then any cell
in the matrix that contains a
number greater than or equal
to 10 and less than 100 will be
considered Medium risk. Any
number greater than or equal
to 100 will be considered High
risk.
76 © 2020 General Electric Company

Chapter
6Release NotesTopics:
• Third Quarter of 2019• First Quarter of 2019• Third Quarter of 2018
© 2020 General Electric Company 77

Third Quarter of 2019
Risk MatrixThis topic provides a list of product changes released for this module on the dates listed below.
Release Date: September 27, 2019
Table 1: Enhancements and New Features
The following enhancements and new features have been added.
Description Tracking ID
In the default risk matrix, the colors associated with risk thresholds have been modified to
improve contrast.
US335434
Table 2: Resolved Issues
The following issues that existed in one or more previous versions have been resolved.
Description Tracking ID
Previously, in the financial risk control, you could not calculate the financial consequence if the
following fields did not contain a value:
• Production Loss
• Maintenance Cost
This issue has been resolved. Now, you can calculate the financial consequence if any one of the
fields contain a value.
US333940
First Quarter of 2019
Risk MatrixThis topic provides a list of product changes released for this module on the dates listed below.
Release Date: March 29, 2019
Table 3: Resolved Issues
The following issues that existed in one or more previous versions have been resolved.
Description Tracking ID
Previously, if the Not Applicable check box was selected for a Risk Matrix category, the overall
risk would not update until the Risk Matrix was saved. This issue has been resolved.
DE89701
78 © 2020 General Electric Company

Third Quarter of 2018
Risk MatrixThis topic provides a list of product changes released for this module on the dates listed below.
Release Date: September 21, 2018
Table 4: Resolved Issues
Note Tracking ID(s)
Previously, you could not select the Not Applicable check box if your Risk Matrix was configured
to show aliases. This issue has been resolved.
DE85123
© 2020 General Electric Company 79