Risk Management Presentation Mechanical Analysis · The DLI Vibration System. y. The DLI...
82
Risk Management Presentation Mechanical Analysis
Transcript of Risk Management Presentation Mechanical Analysis · The DLI Vibration System. y. The DLI...

Risk Management PresentationMechanical Analysis
The DLI Vibration SystemThe DLI ExpertAlert Vibration System utilized by Hannon Electric is the only automated diagnostic system on the market today that is being utilized by its customer base.It has been tested and shown to be 87% to 95% accurate in its diagnoses for machine faults and severity, when mature.This presentation shows a slice of the system set-up and capabilities.
Vibration AnalysisThe investment in this equipment provides for more thorough analysis and trending of rotating equipment through the use of automated diagnostics combined with analysis tools that quickly and accurately confirm problems.

The Expert ReportThe alarm base is set from initial machine measurements or measurements from a like machine. The expert system runs diagnostic templates from the machine design to diagnose the faults.
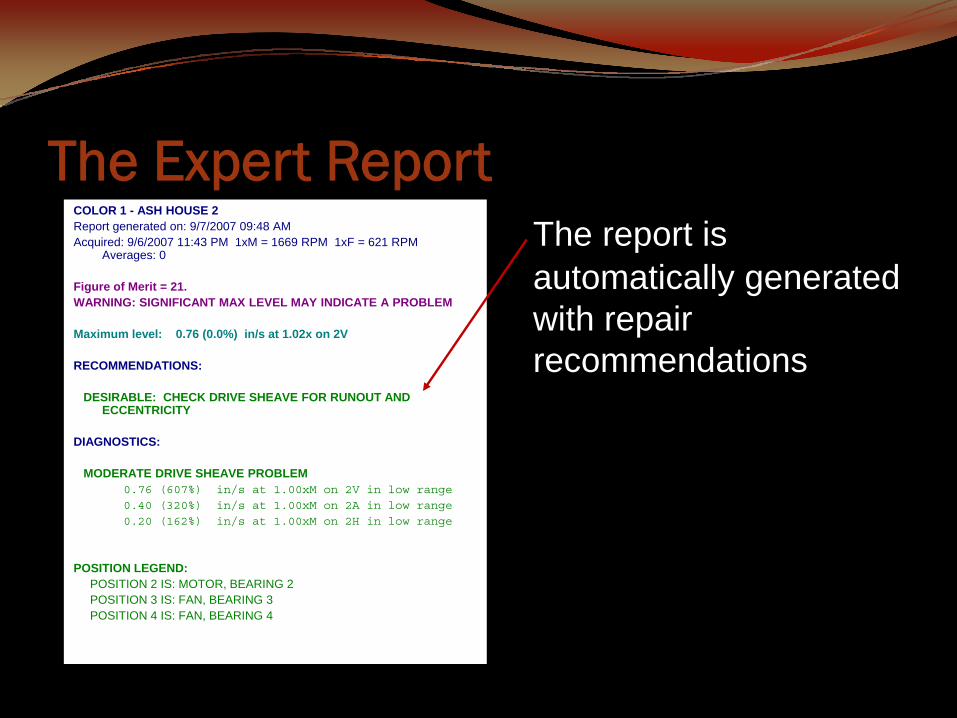
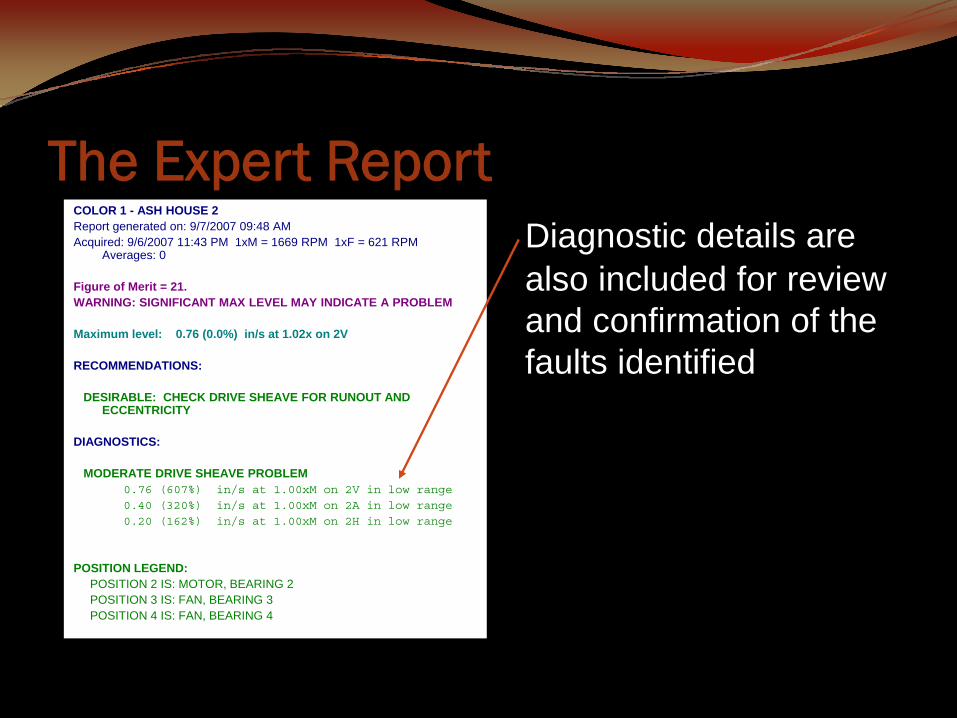
COLOR 1 - ASH HOUSE 2Report generated on: 9/7/2007 09:48 AMAcquired: 9/6/2007 11:43 PM 1xM = 1669 RPM 1xF = 621 RPM
Averages: 0
Figure of Merit = 21. WARNING: SIGNIFICANT MAX LEVEL MAY INDICATE A PROBLEM
Maximum level: 0.76 (0.0%) in/s at 1.02x on 2V
RECOMMENDATIONS:
DESIRABLE: CHECK DRIVE SHEAVE FOR RUNOUT AND ECCENTRICITY
DIAGNOSTICS:
MODERATE DRIVE SHEAVE PROBLEM 0.76 (607%) in/s at 1.00xM on 2V in low range
0.40 (320%) in/s at 1.00xM on 2A in low range
0.20 (162%) in/s at 1.00xM on 2H in low range
POSITION LEGEND:POSITION 2 IS: MOTOR, BEARING 2POSITION 3 IS: FAN, BEARING 3POSITION 4 IS: FAN, BEARING 4
The Expert ReportThe report is automatically generated with repair recommendations
The Expert ReportCOLOR 1 - ASH HOUSE 2Report generated on: 9/7/2007 09:48 AMAcquired: 9/6/2007 11:43 PM 1xM = 1669 RPM 1xF = 621 RPM
Averages: 0
Figure of Merit = 21. WARNING: SIGNIFICANT MAX LEVEL MAY INDICATE A PROBLEM
Maximum level: 0.76 (0.0%) in/s at 1.02x on 2V
RECOMMENDATIONS:
DESIRABLE: CHECK DRIVE SHEAVE FOR RUNOUT AND ECCENTRICITY
DIAGNOSTICS:
MODERATE DRIVE SHEAVE PROBLEM 0.76 (607%) in/s at 1.00xM on 2V in low range
0.40 (320%) in/s at 1.00xM on 2A in low range
0.20 (162%) in/s at 1.00xM on 2H in low range
POSITION LEGEND:POSITION 2 IS: MOTOR, BEARING 2POSITION 3 IS: FAN, BEARING 3POSITION 4 IS: FAN, BEARING 4
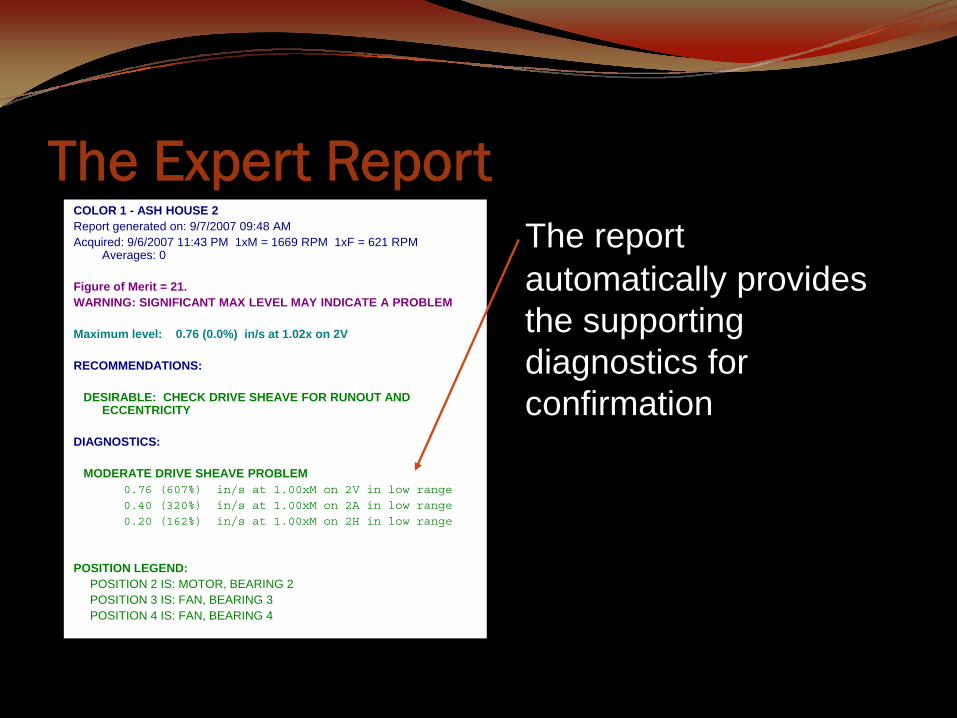
The report automatically provides the supporting diagnostics for confirmation
The Expert ReportCOLOR 1 - ASH HOUSE 2Report generated on: 9/7/2007 09:48 AMAcquired: 9/6/2007 11:43 PM 1xM = 1669 RPM 1xF = 621 RPM
Averages: 0
Figure of Merit = 21. WARNING: SIGNIFICANT MAX LEVEL MAY INDICATE A PROBLEM
Maximum level: 0.76 (0.0%) in/s at 1.02x on 2V
RECOMMENDATIONS:
DESIRABLE: CHECK DRIVE SHEAVE FOR RUNOUT AND ECCENTRICITY
DIAGNOSTICS:
MODERATE DRIVE SHEAVE PROBLEM 0.76 (607%) in/s at 1.00xM on 2V in low range
0.40 (320%) in/s at 1.00xM on 2A in low range
0.20 (162%) in/s at 1.00xM on 2H in low range
POSITION LEGEND:POSITION 2 IS: MOTOR, BEARING 2POSITION 3 IS: FAN, BEARING 3POSITION 4 IS: FAN, BEARING 4
Diagnostic details are also included for review and confirmation of the faults identified
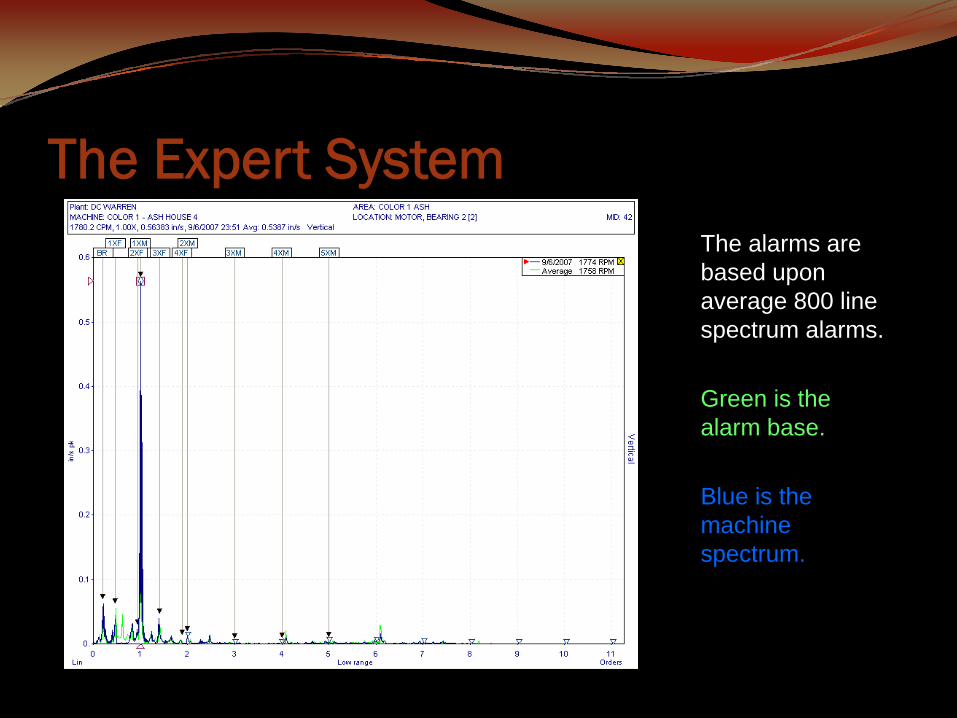
The Expert SystemThe alarms are based upon average 800 line spectrum alarms.
Green is the alarm base.
Blue is the machine spectrum.
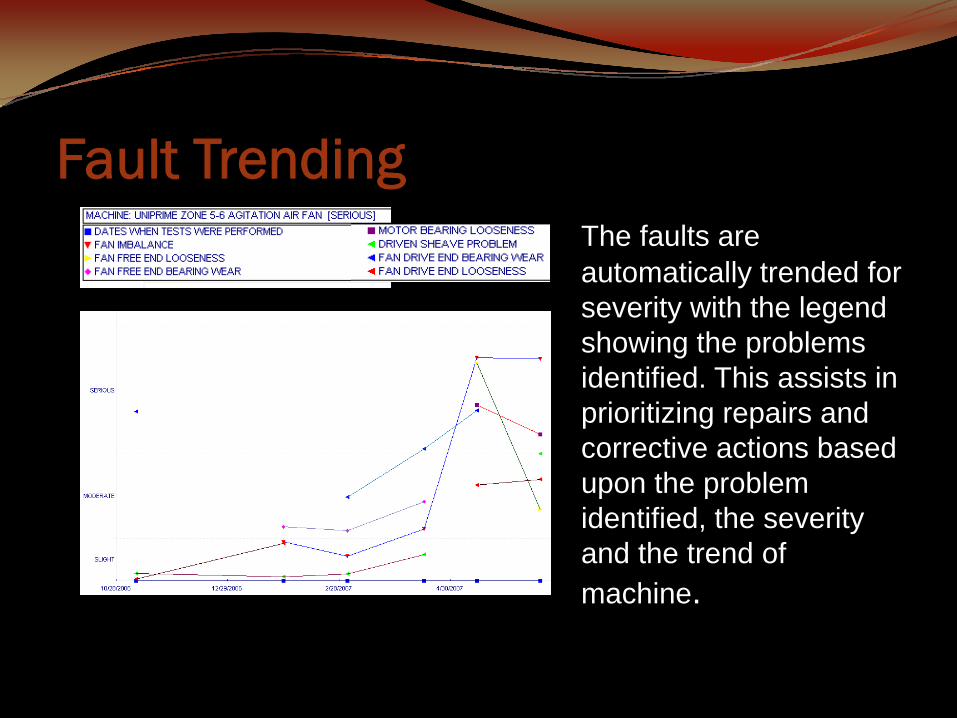
Fault TrendingThe faults are automatically trended for severity with the legend showing the problems identified. This assists in prioritizing repairs and corrective actions based upon the problem identified, the severity and the trend of machine.
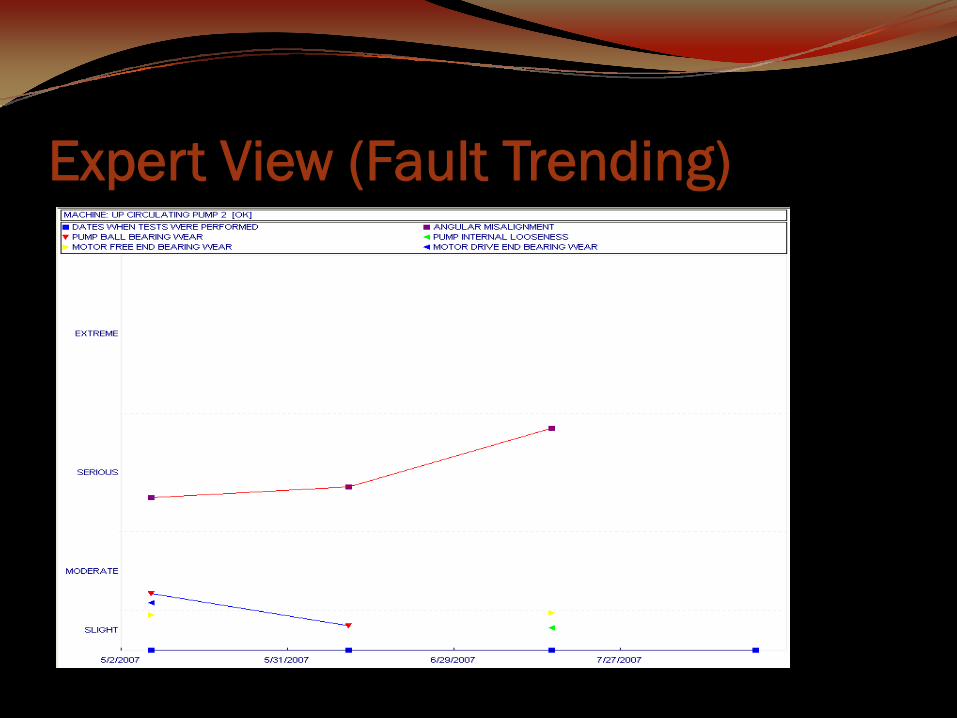
Expert View (Fault Trending)
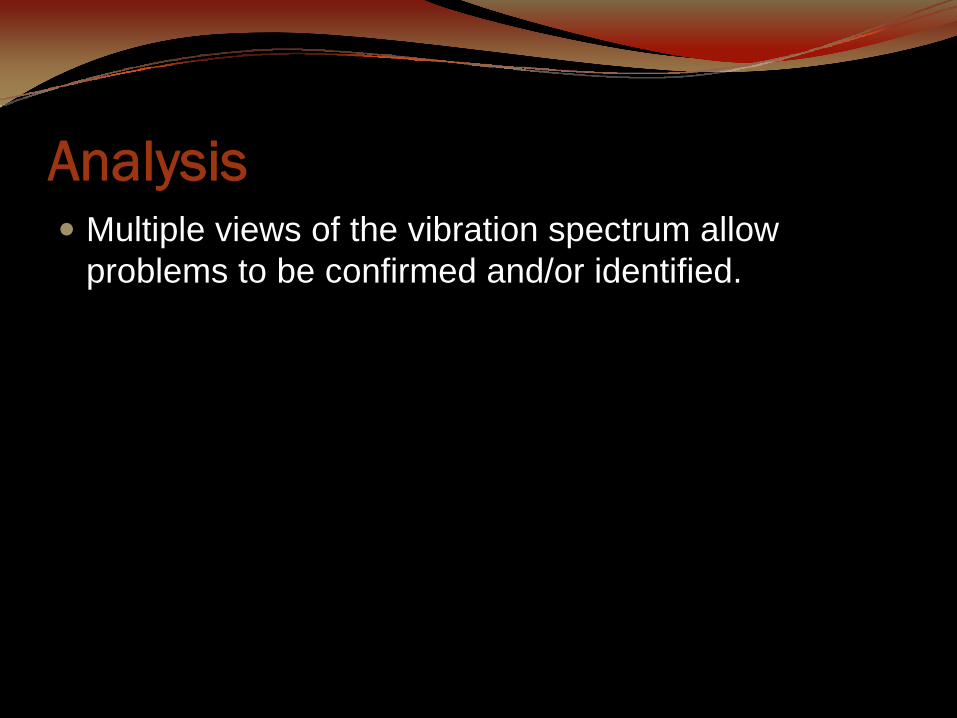
AnalysisMultiple views of the vibration spectrum allow problems to be confirmed and/or identified.

Spectrum Views (Alarm)

Spectrum Views (Triax)
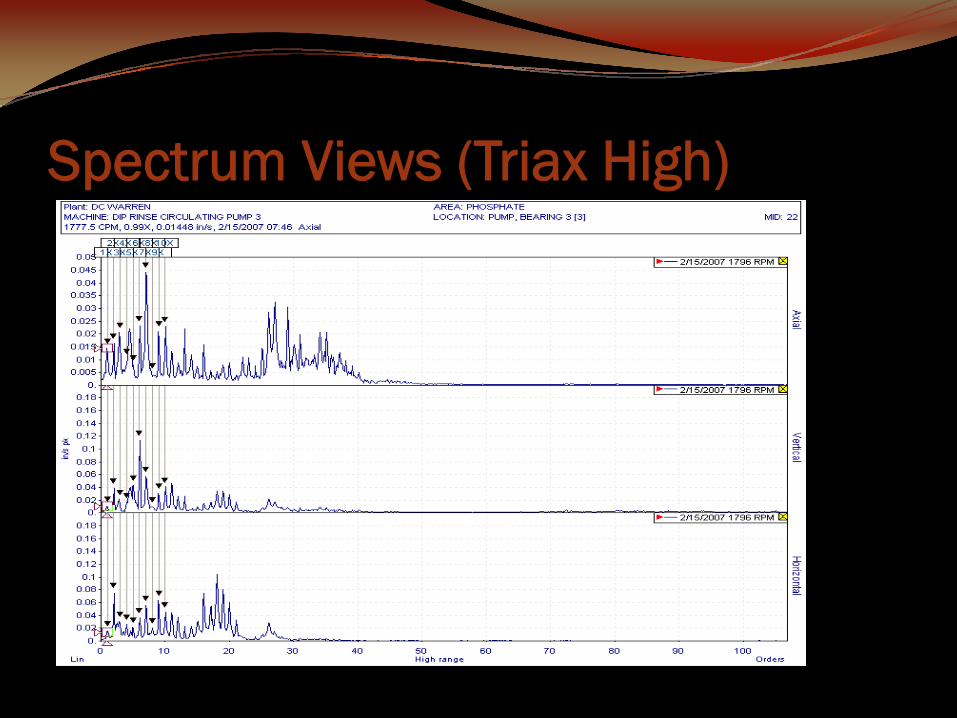
Spectrum Views (Triax High)
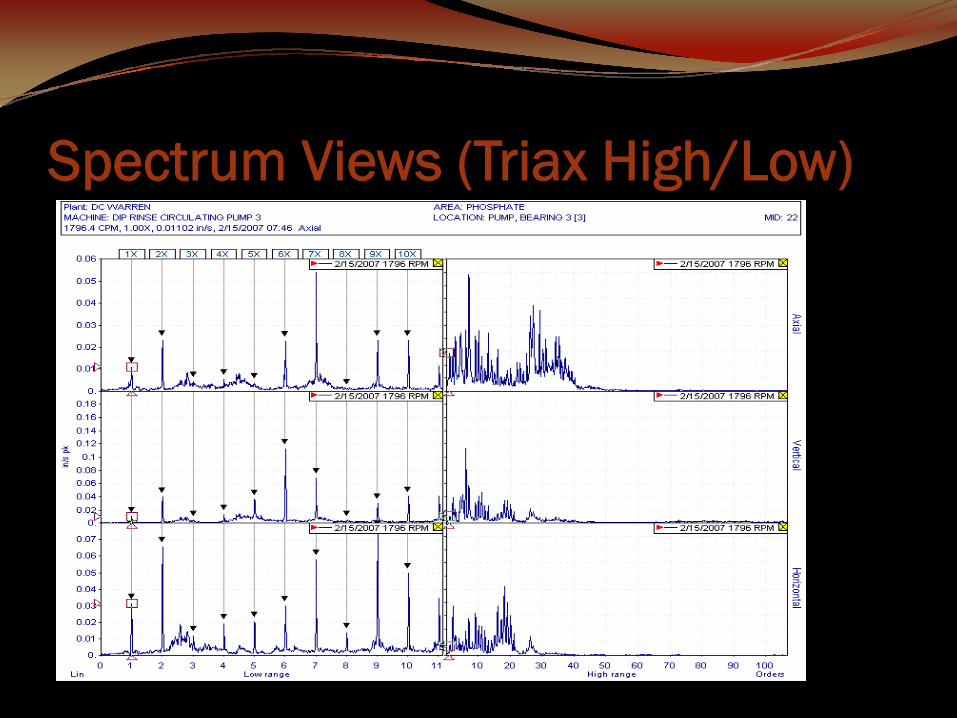
Spectrum Views (Triax High/Low)
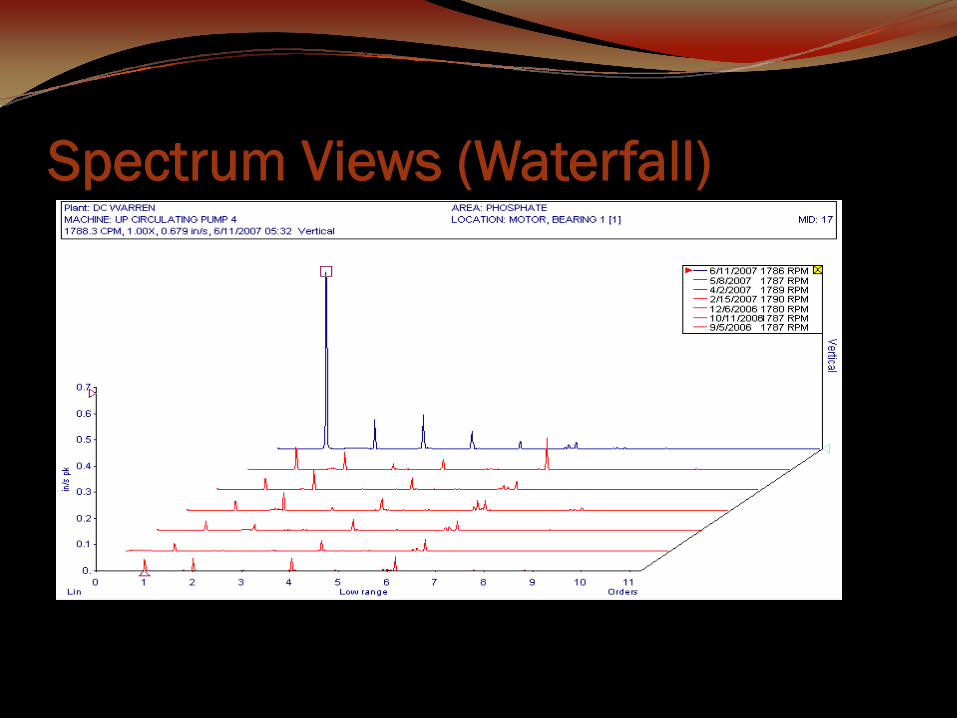
Spectrum Views (Waterfall)
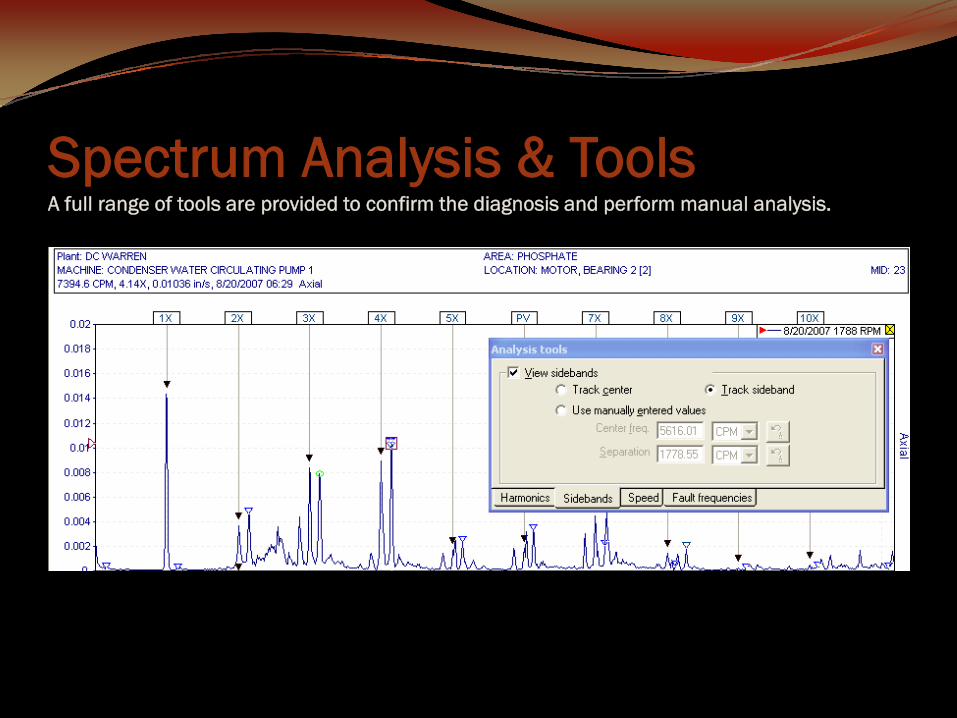
Spectrum Analysis & ToolsA full range of tools are provided to confirm the diagnosis and perform manual analysis.
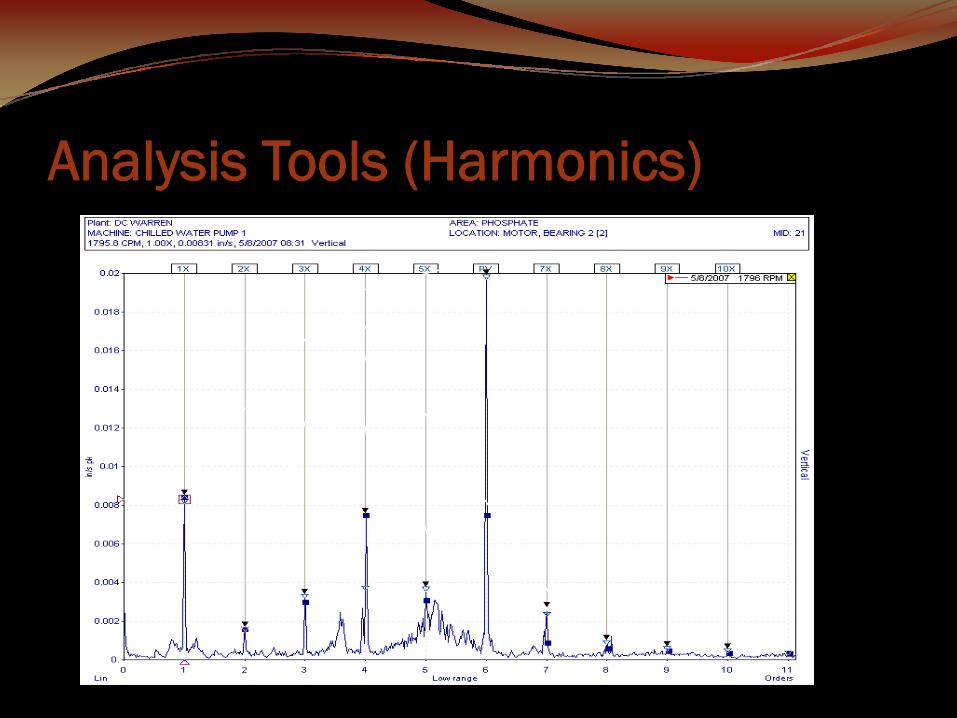
Analysis Tools (Harmonics)

Analysis Tools (Side Band)

SummaryThe system does not eliminate the need for training and developing vibration expertise. What is does is automatically identify issues with the machine and trends the problem and provides information to the analysis where to look to confirm the analysis.The analysts job is to confirm the problem and severity and make a judgment on the action to be taken.The speed and quality of analysis is improved along with improving the learning curve of someone new to vibration analysis.

Set-upTo set upCreate PlantCreate AreasThen Create MID’sThen Create Machines
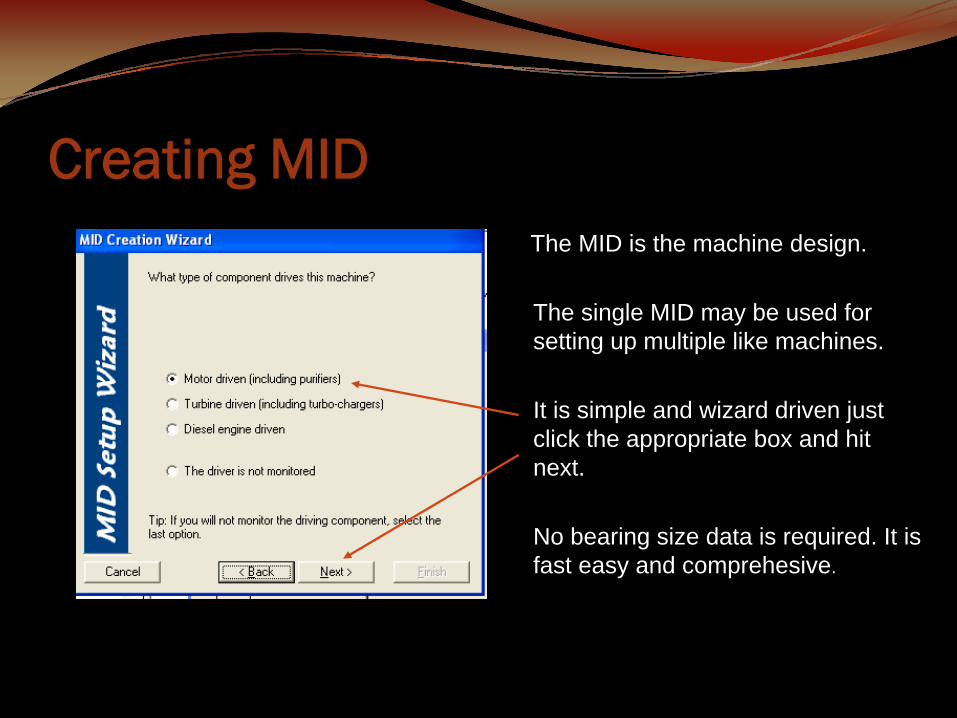
Creating MIDThe MID is the machine design.
The single MID may be used for setting up multiple like machines.
It is simple and wizard driven just click the appropriate box and hit next.
No bearing size data is required. It is fast easy and comprehesive.

MID Set-up The MID setup develops all of the forcing frequency data and sets up the machines for the automated diagnostic system.
Here is an example of a blower.
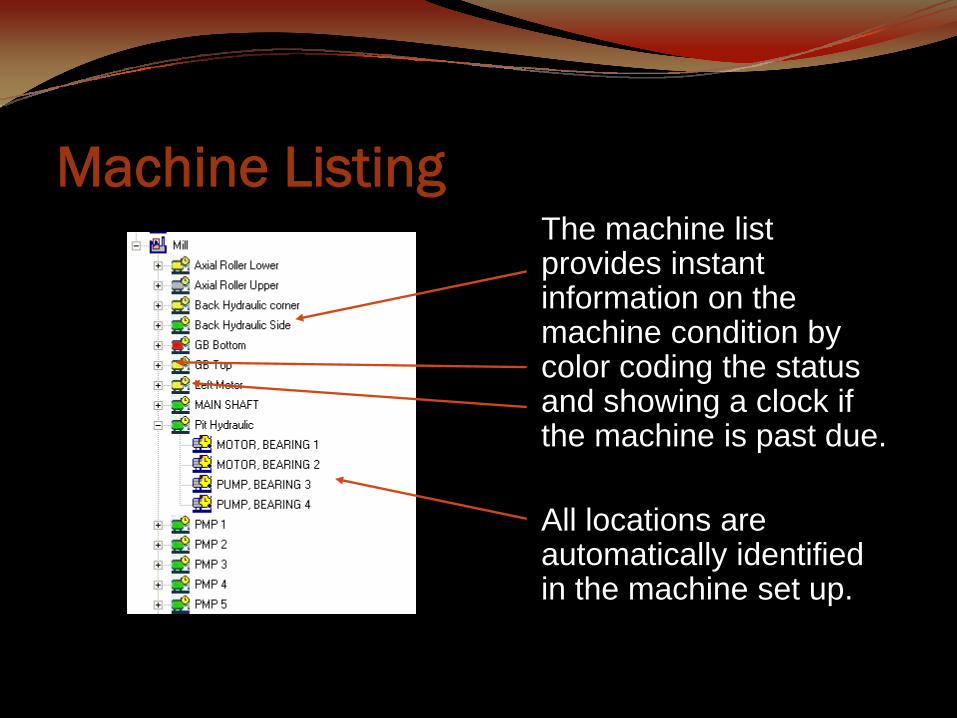
Machine ListingThe machine list provides instant information on the machine condition by color coding the status and showing a clock if the machine is past due.
All locations are automatically identified in the machine set up.

Vibration AnalysisThe most widely used CM technology. Trending and analysis of vibration signatures are used to rate equipment condition and allow for corrective actions prior to breakdown. Primary diagnosis's include; misalignment, imbalance, and bearing problems.

Vibration AnalysisPositives
Identifies many problems earlyTrends condition and severityCan ID the component failingApplicable on virtually all rotating components.
Vibration Analysis (Traditional)Drawbacks
Requires a CM philosophyRequires management and labor supportInvestment in manpower and equipmentLong start-up timeRequires expertise and experienceDependent on sustainable expertise

Vibration Analysis (New)Drawbacks
Requires a CM philosophyRequires management and labor supportInvestment in manpower and equipment
What is Vibration Analysis?The measurement and trending of vibration amplitudes broken down by frequency to assess changes to the mechanical and electrical health of rotating equipment.
Common Problems IdentifiedImbalanceMisalignmentBall Bearings LoosenessBent shaft
Journal BearingsGear ProblemsImpeller Blade ProblemsMotor Problems650 more

Incoming Spectra
What machine is this &what are its vibration sources?
How does this spectra compareto that of a healthy machine?
How are Vibration Diagnostics Performed?

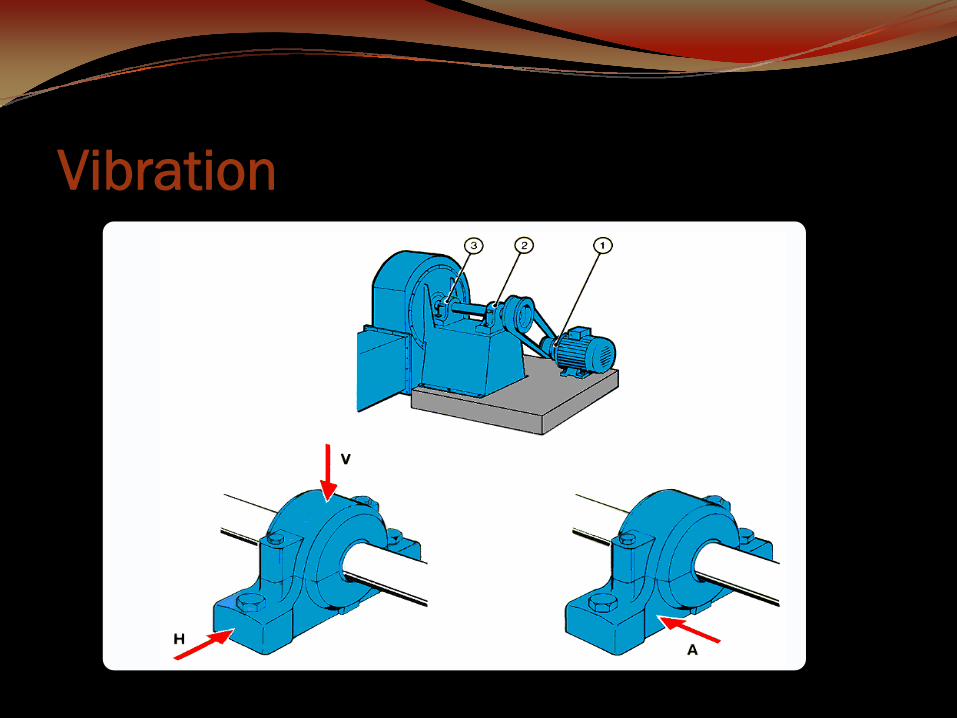
Vibration
Vibration

Vibration MeasurementFor trending and monitoring
Data needs to be taken on the correct machine and location.At the same spotAt the same angleAt the same pressureAt approx. the the same location

Waveform to Spectrumto
0 2 4 6 8 10 12

Forcing Frequencies• Five-Bladed Fan
Fly swatter against the bladesCauses five hits for each rotation (1X) or 5x frequency

Spectral Data
Machinery Diagnostics

Vibration Analysis TermsNormalization
CPM vs RPM vs HZ vs OrdersForcing FrequenciesHarmonicsSidebands

Common Machine Faults• Imbalance• Misalignment• Bearing Problems• Looseness

Imbalance• At the Rotational Rate in the Radial directions Equal
excitation in all radial directions
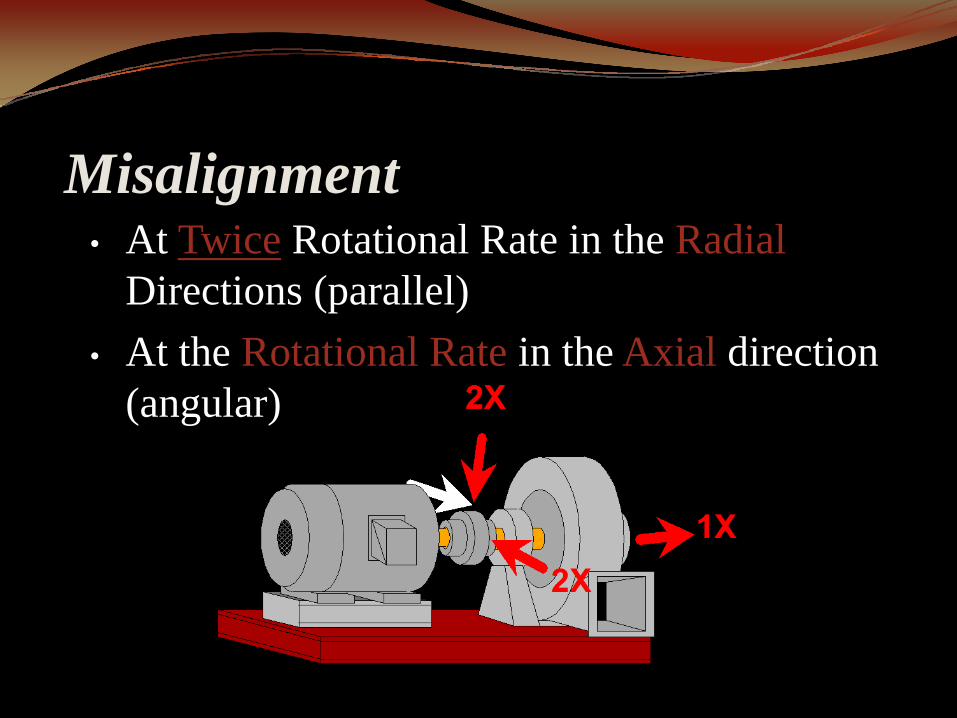
Misalignment• At Twice Rotational Rate in the Radial
Directions (parallel)• At the Rotational Rate in the Axial direction
(angular)
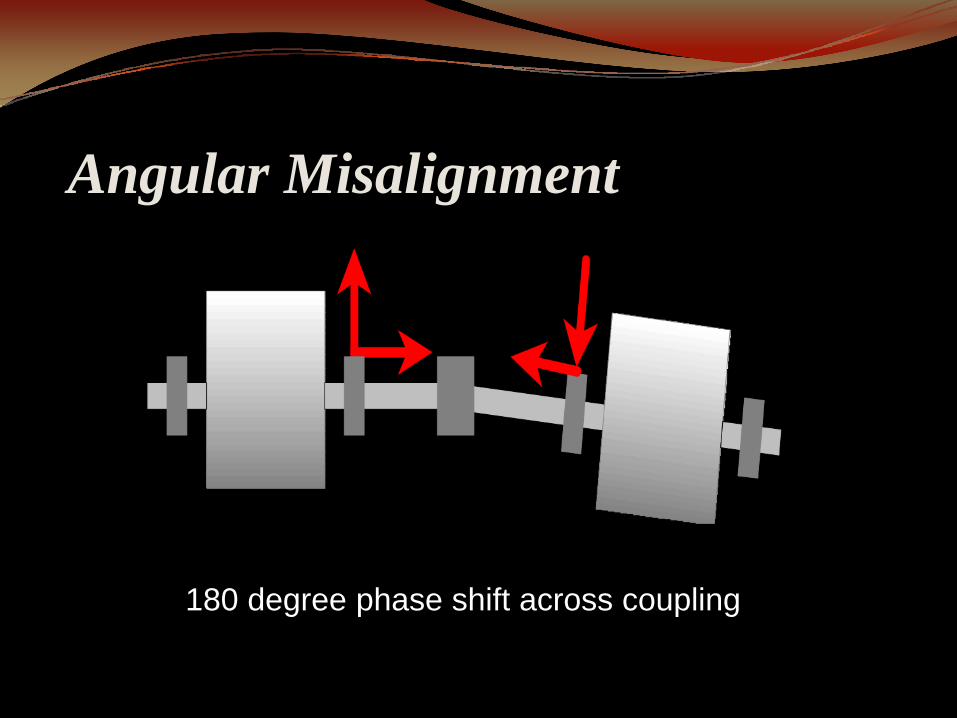
Angular Misalignment
180 degree phase shift across coupling

Parallel Misalignment
180 degree phase shift across coupling

Mechanical Looseness
0 2 4 6 8 10 12
Orders
60
70
80
90
100
110
120
130VdB

Rolling Contact BearingNon-integer fundamental peaks in ANYdirectionHarmonics of the fundamental frequencySidebands at the 1X rotational rate

Rolling Element BearingsFor each shaft revolution:
4.6 balls will pass an outer race defectThe ball will make 2.02 revolutions
7.4 balls will pass an inner race defectThe cage will make 0.38 revolutions
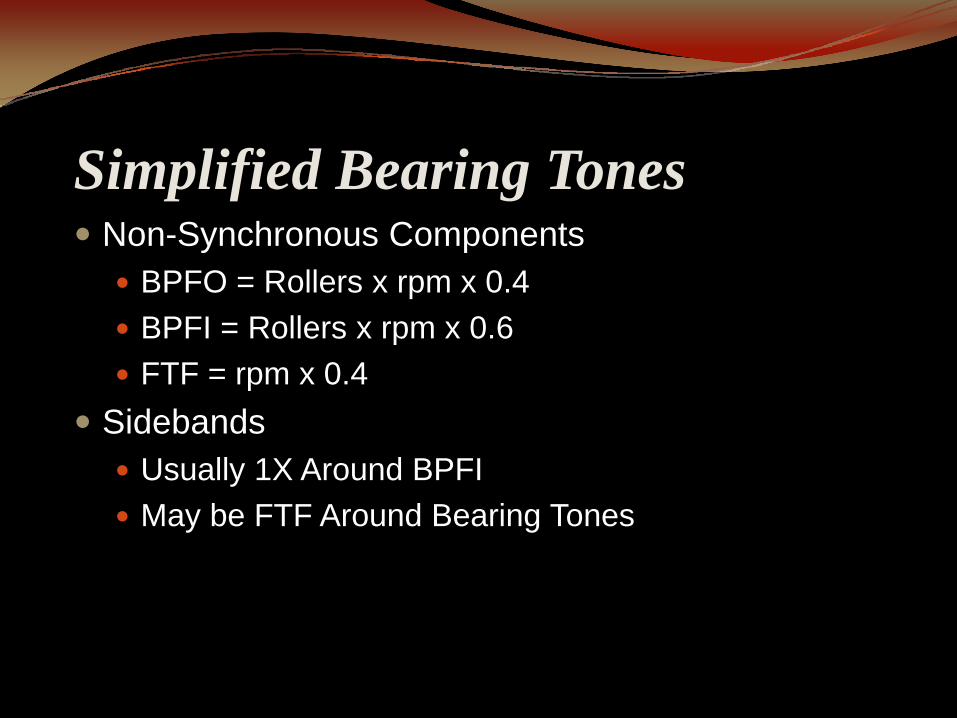
Simplified Bearing TonesNon-Synchronous Components
BPFO = Rollers x rpm x 0.4BPFI = Rollers x rpm x 0.6FTF = rpm x 0.4
SidebandsUsually 1X Around BPFIMay be FTF Around Bearing Tones

Bearing Tones in SpectrumNon-Synchronous Frequencies
VdB
0 1 2 3 4 5 6
60
70
80
90
100
110
120
ORDERS
4X3X
2X
1X 3.1X
6.2X

Progression of Bearing Faults
Machine without Bearing Problems
0 1 2 3 4 5 6ORDERS
60
70
80
90
100
110
120
VdB
11X
2X
3X4X
0 1 2 3 4 5 6ORDERS
60
70
80
90
100
110
120VdB
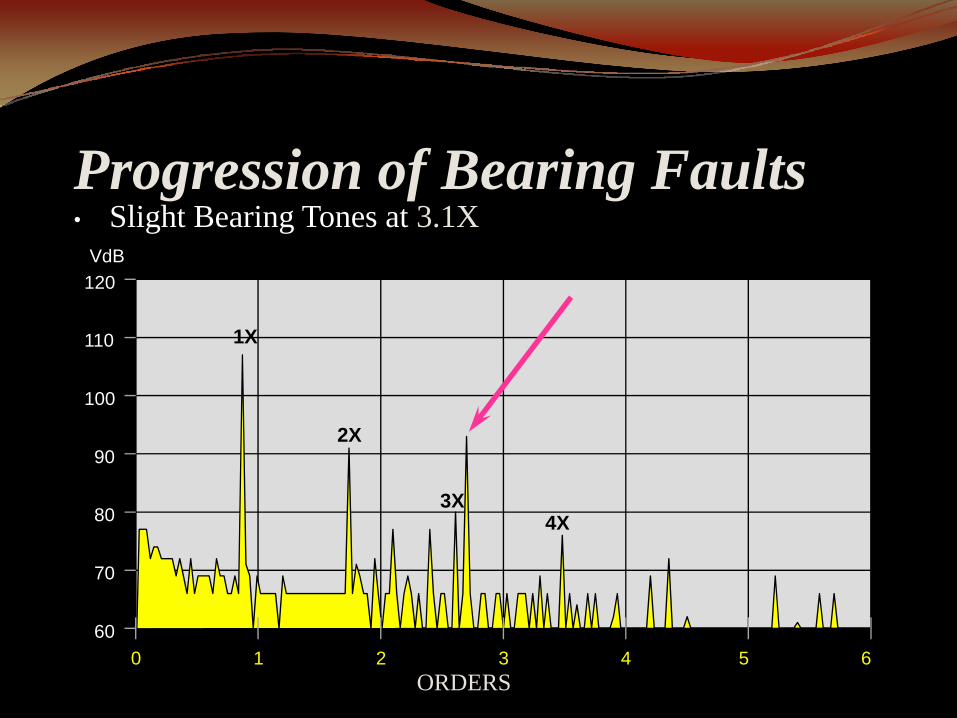
• Slight Bearing Tones at 3.1X
1X
2X
3X4X
Progression of Bearing Faults

0 1 2 3 4 5 6
ORDERS
60
70
80
90
100
110
120VdB
• As defect worsens - 2nd harmonic rises
1X
2X
3X4X
Progression of Bearing Faults

0 1 2 3 4 10 12
ORDERS
60
70
80
90
100
110
120VdB
• Increased machine looseness - 1X harmonics increase
1X
2X3X
4X
Progression of Bearing Faults
0 2 4 6 8 10 12
ORDERS
60
70
80
90
100
110
120VdB
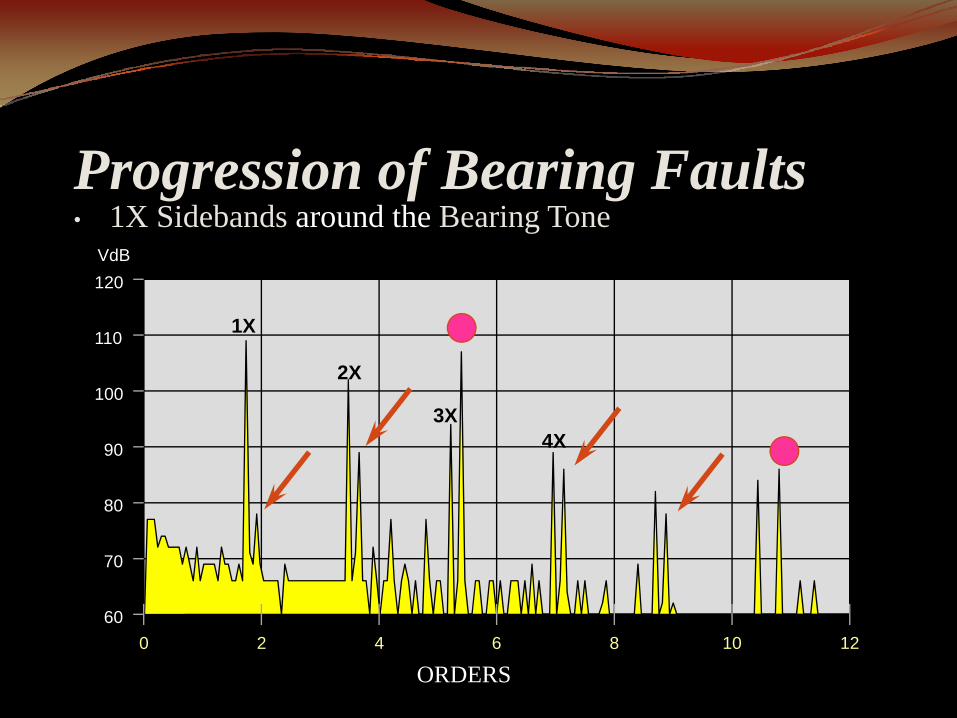
• 1X Sidebands around the Bearing Tone
1X
2X
3X4X
Progression of Bearing Faults
0 2 4 6 8 10 12
ORDERS
60
70
80
90
100
110
120VdB
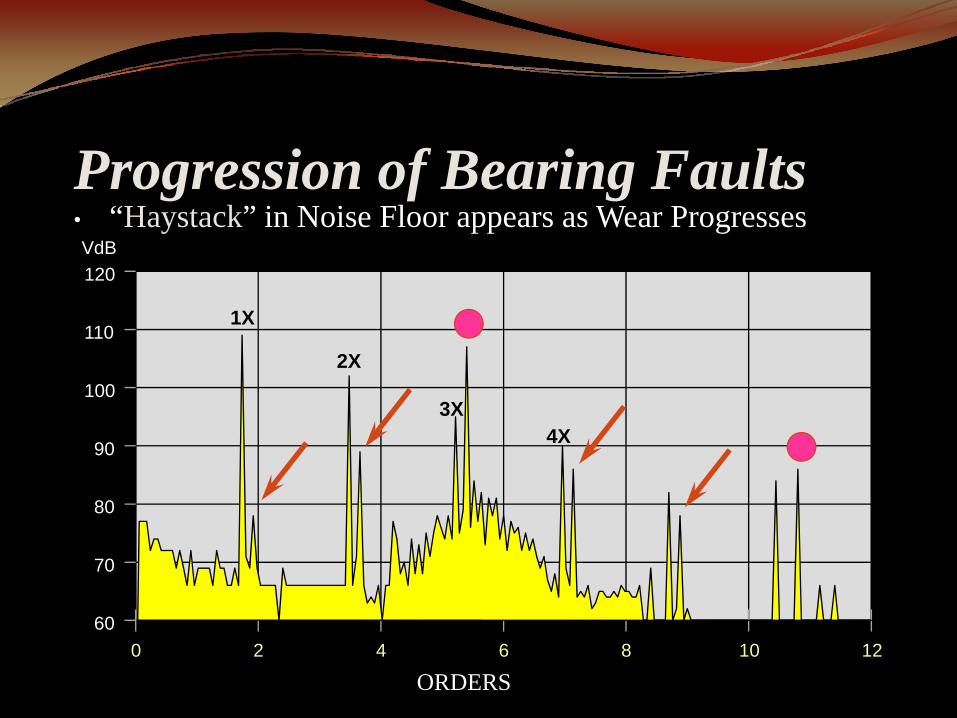
• “Haystack” in Noise Floor appears as Wear Progresses
1X
2X
3X4X
Progression of Bearing Faults
0 2 4 6 8 10 12
ORDERS
60
70
80
90
100
110
120
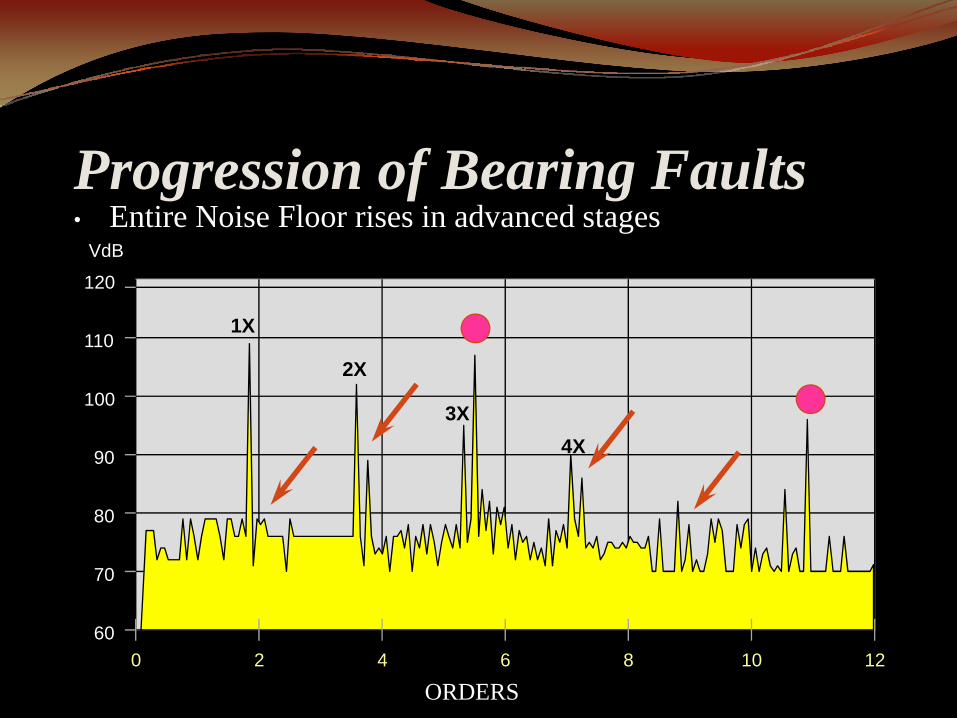
VdB• Entire Noise Floor rises in advanced stages
1X
2X
3X4X
Progression of Bearing Faults
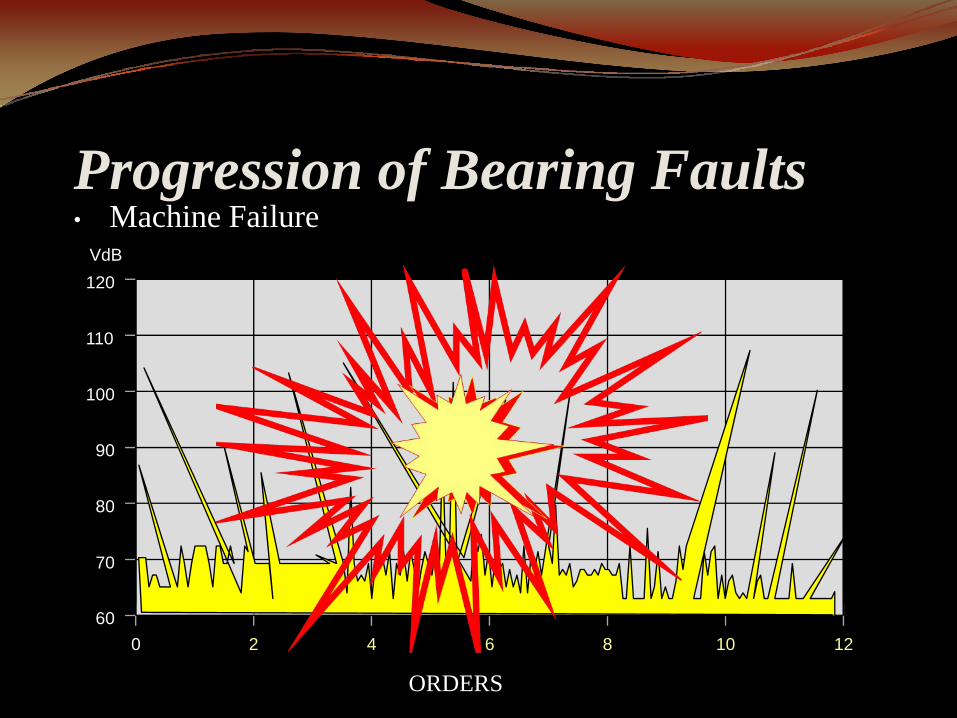
0 2 4 6 8 10 12
ORDERS
60
70
80
90
100
110
120VdB
• Machine FailureProgression of Bearing Faults
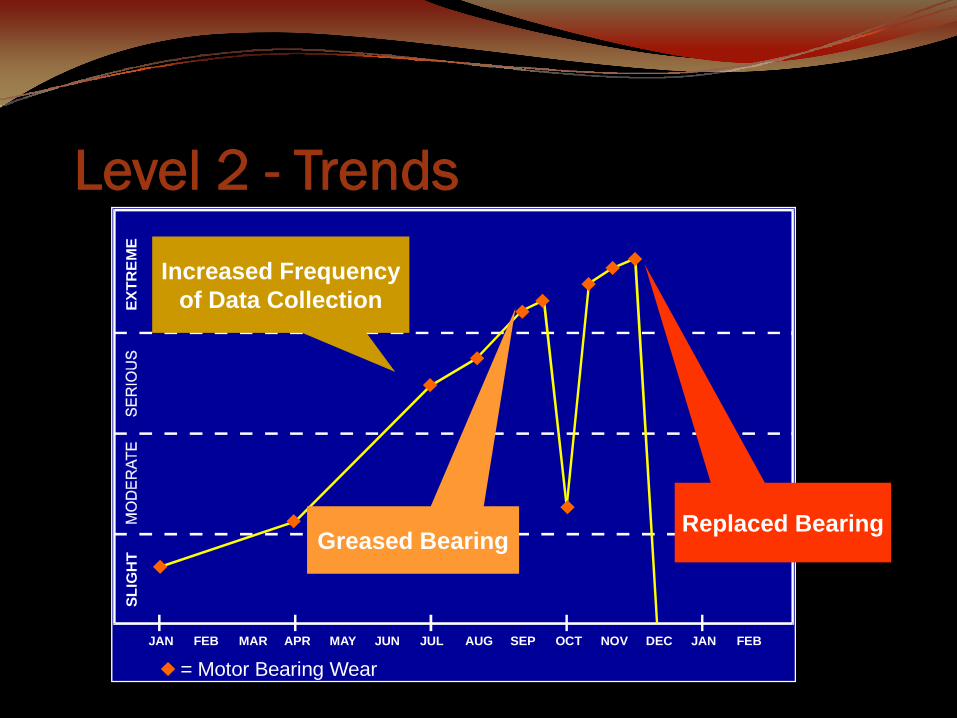
SLIG
HT
EXTR
EME
MARFEB APR MAY JUN JUL AUG SEP OCT NOV DEC JAN FEBJAN
= Motor Bearing Wear
Increased Frequencyof Data Collection
Greased BearingReplaced Bearing
Level 2 - Trends
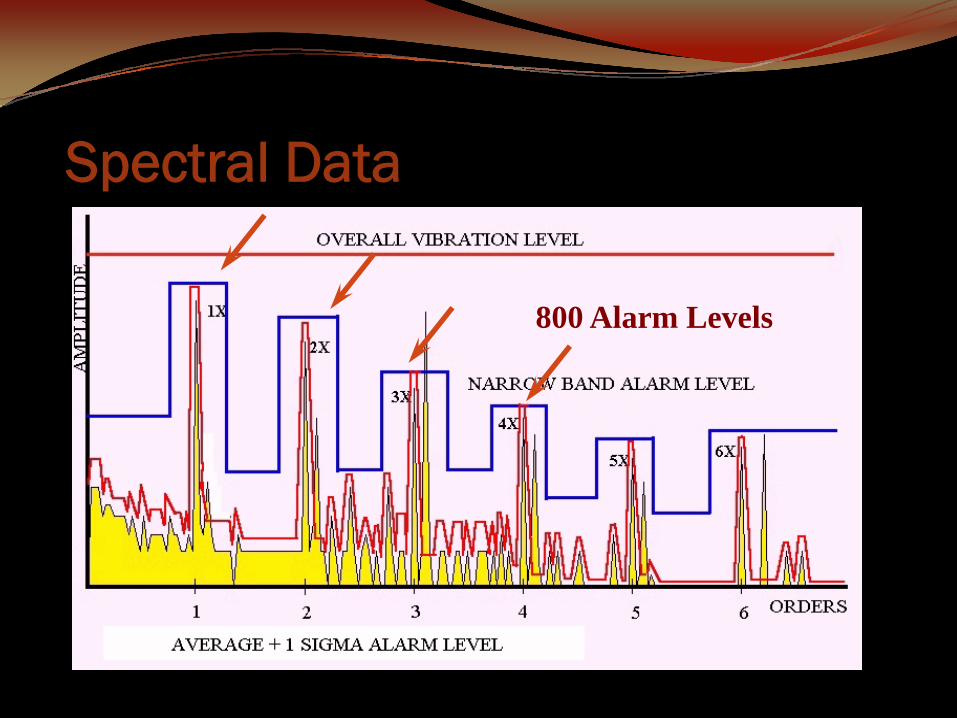
800 Alarm Levels
Spectral Data

Machine Set-upFor Forcing Frequencies High Speed Centrifugal Compressor
(Input Shaft)
(Drive Gear)
(CompressorShaft)
(Impeller)
(Pre-Rotation Vanes)
Motor - 1800 RPM

Forcing FrequenciesCentrifugal Compressor
Motor = 1800 rpm (Input Shaft)
Gearbox = 1:3.1875 (Helical Gear)*
Drive Gear = 51 teethDriven Gear = 16 teeth
Compressor = 5742 rpm (Output Shaft)
Compressor impeller = 14 vanesCompressor pre-rotation = 9 vanes
* ratio rounded to 3.19

800 Alarm Levels
Spectral Data

10-1000 Hz
mm/s or
in/sec RMS
Vibration Severity
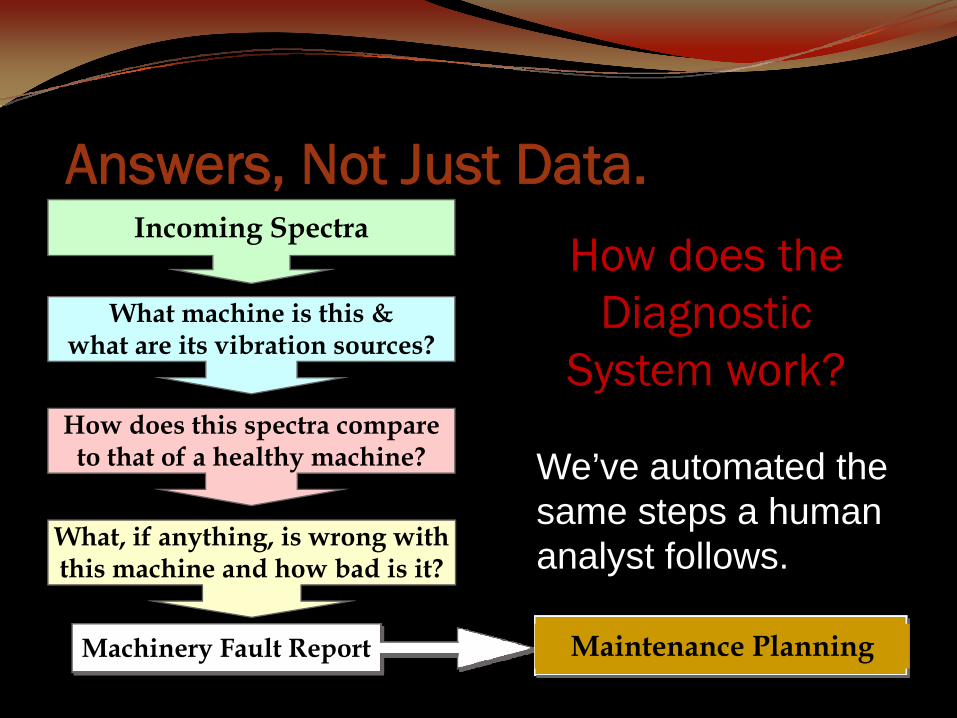
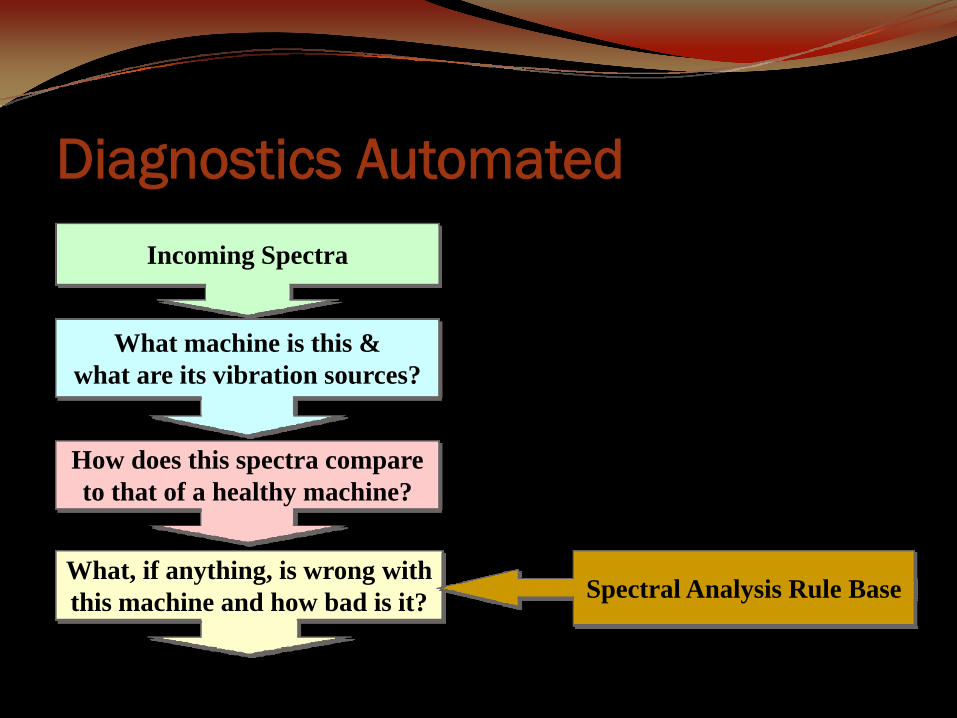
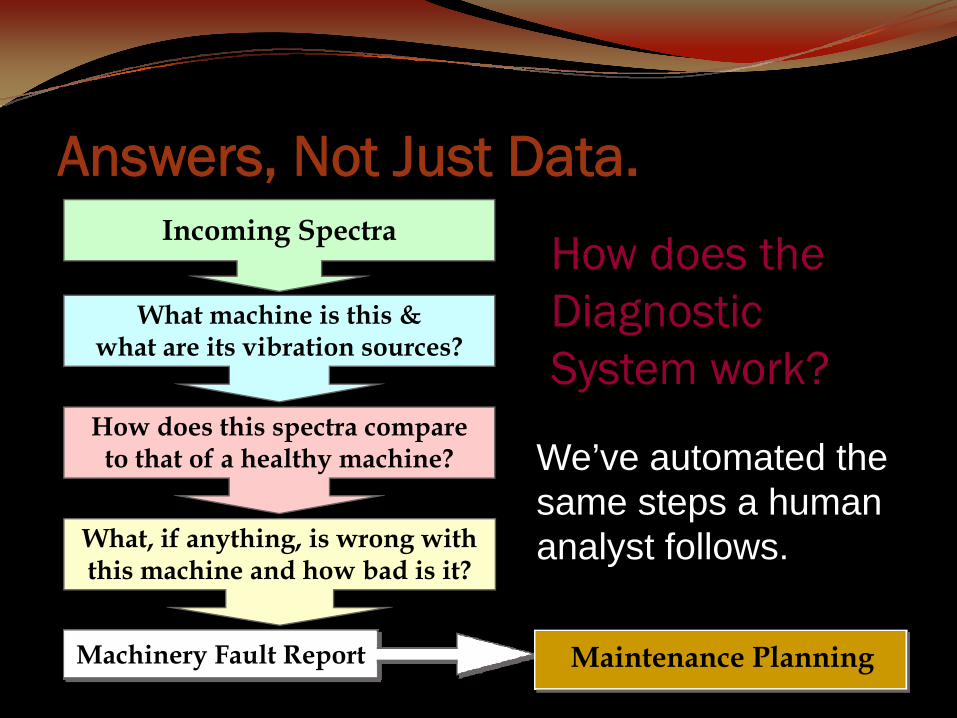
Incoming Spectra
Machinery Fault Report
What machine is this &what are its vibration sources?
How does this spectra compareto that of a healthy machine?
What, if anything, is wrong withthis machine and how bad is it?
Maintenance Planning
How does theDiagnostic
System work?
Answers, Not Just Data.
We’ve automated the same steps a human analyst follows.

Reliable and Complete DataTriaxial Sensor
All 3 axes - more complete analysisImproves accuracy of diagnosis
Permanently Mounted Stud Excellent frequency responseRepeatability = accurate trending
BarcodingFaster and more accuratePrevents human error

Processing Vibration Data
Level IReports
Level IIISignatures
Level IITrends
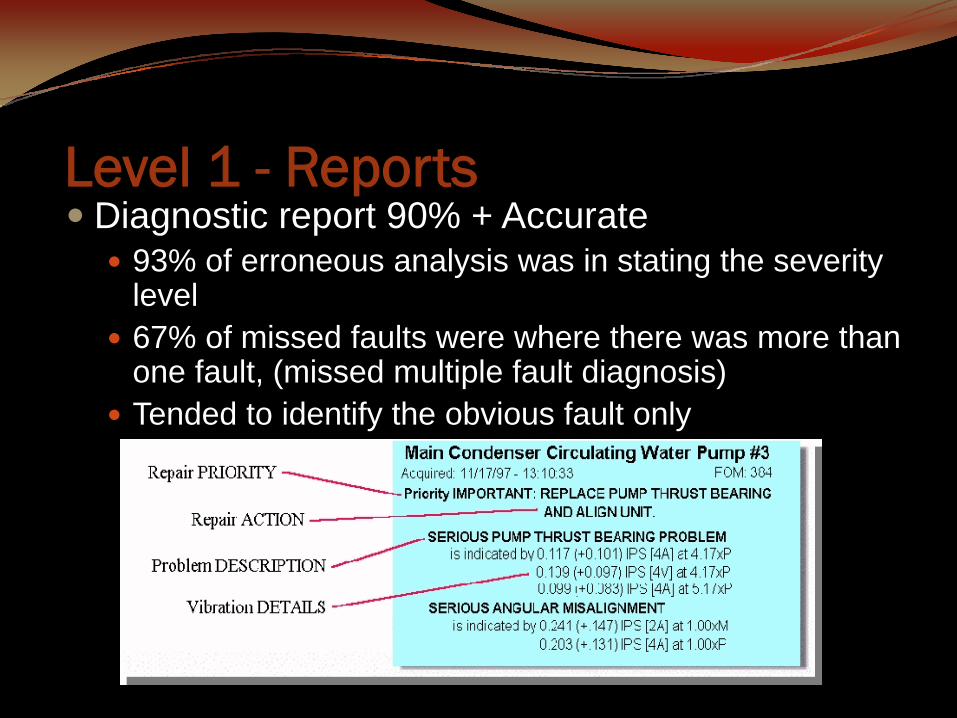
Level 1 - ReportsDiagnostic report 90% + Accurate
93% of erroneous analysis was in stating the severity level67% of missed faults were where there was more than one fault, (missed multiple fault diagnosis)Tended to identify the obvious fault only

Maintenance PlanningSchedule immediate repairs (Extreme Faults)
Avoid catastrophic failure or secondary damageSchedule normal repairs (Serious Faults)
Planned outage or maintenance periodReview parts availability (Moderate Faults)
Stock long-lead-time parts for critical equipmentOrder parts in advance for planned shut downs
Retest following maintenance or replacementReset baseline & reference informationVerify maintenance was performed correctly

SLIG
HT
EXTR
EME
MARFEB APR MAY JUN JUL AUG SEP OCT NOV DEC JAN FEBJAN
= Motor Bearing Wear
Increased Frequencyof Data Collection
Greased Bearing Replaced Bearing
Level 2 - Trends

Incoming Spectra
Machinery Fault Report
What machine is this &what are its vibration sources?
How does this spectra compareto that of a healthy machine?
What, if anything, is wrong withthis machine and how bad is it?
Maintenance Planning
How does theDiagnostic
System work?
Answers, Not Just Data.
We’ve automated the same steps a human analyst follows.
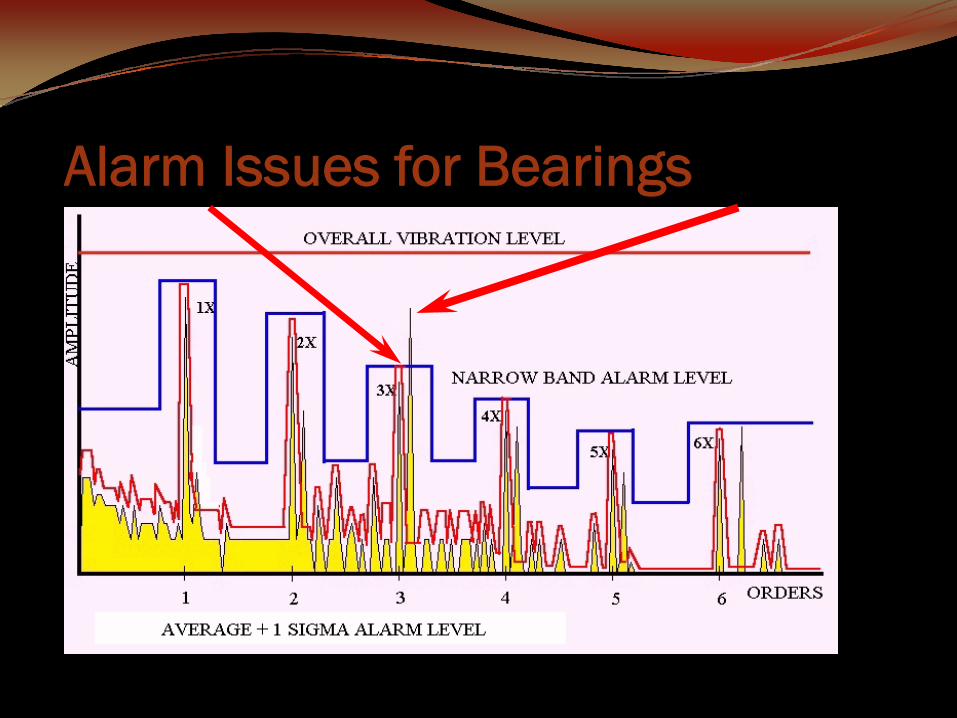
Alarm Issues for Bearings
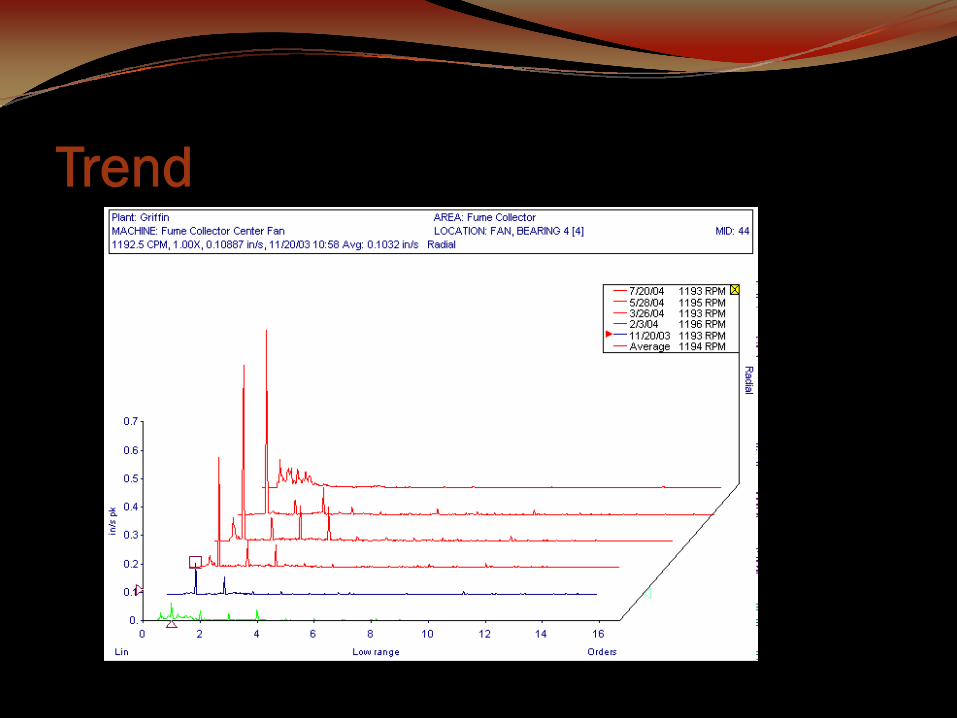
Trend

Keys to a successful program…Ensure reliable and complete data collectedEnsure you get answers, not just dataEnsure you get First Rate support and trainingUse the right technology for the right applicationDistribute the information everywhere it is needed for planning of repairs

Setups are easywith setup Wizards
ExpertALERT
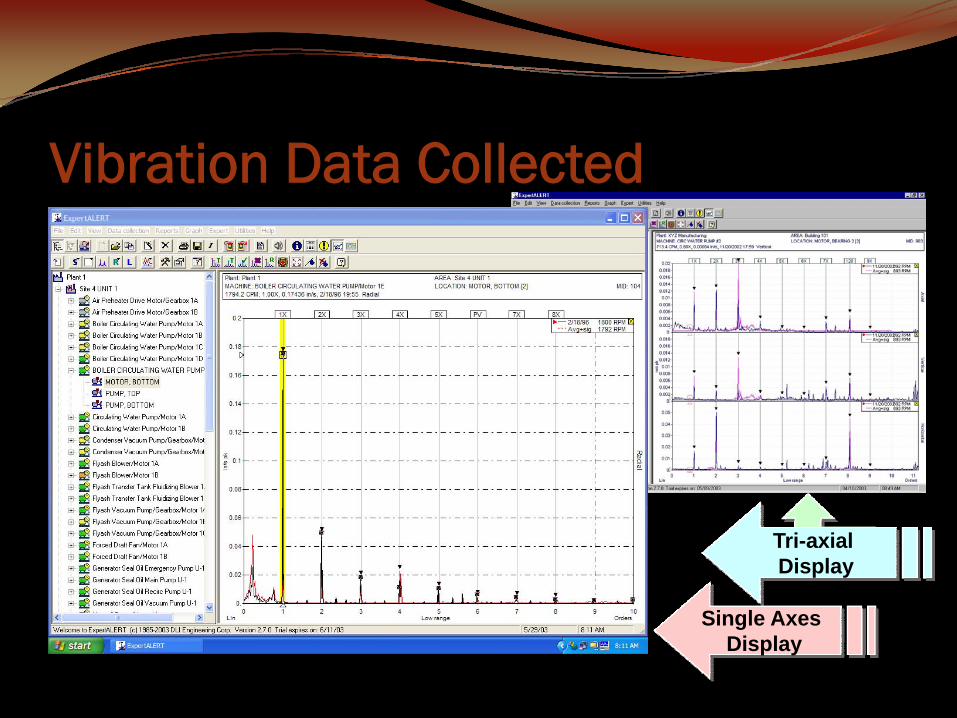
Vibration Data Collected
Tri-axialDisplay
Tri-axialDisplay
Single AxesDisplay

MACHINE: MAIN CONDENSATE PUMP (TD)SHIP APPLICABILITY: 61,62,63,64CVN63 UNITS: 1B,2B,3B,4B
SWAB: 255-5 MID: 53DATE: DECEMBER 1992
DRIVER INTERMEDIATE DRIVEN
CID#: 05790037MFR DWG#: 347-2918MFR: WHITONHP: 40STEAM CONDITIONS:
Chest: 575 PSIGExhaust: 15 PSIG
RPM: 6410TYPE: HELICAL FLOW,IMPULSE
CID : 05790037TECH MANUAL : 347-2918MFR: WHITONRATIO: 5.479 TO 1RPM (INPUT/OUTPUT):
6410/1170TYPE: SINGLE HELICAL,
DOUBLE REDUCTION
CID : 016000340TECH MANUAL : 347-2918MFR: ALLIS CHALMERSOUTPUT: 595 GPM @ 65 PSIGRPM: 1160TYPE: DOUBLE STAGE,
SINGLE SUCTION,VOLUTE
TEST RPM’s AND OPERATING CONDITIONS
TURBINE: 6400 PUMP: 1168
ANALYSIS RANGES
REF RPM: 1 X TURBINEORDERS: 2, 100FREQ HZ : 220, 11000
What machine is this?
Data Compared to Knowledge BaseIncoming Spectra
Machinery Knowledge Base

What machine is this & what are it’s vibration sources?
Incoming Spectra
Machinery Knowledge Base
1
3
Z1
S1
G1
E
G4
F
T1
A
B
G2
C
G3
D
G6
G
H
J
p
t
i
oG5
FLEXIBLE COUPLING
P1
P2
OP
High SpeedDrive Pinion
BEARINGSKF 6211
Oil Pump
Machine Frequencies Identified

Incoming Spectra
What machine is this &what are its vibration sources?
How does this spectra compareto that of a healthy machine? Average Spectra Data Base
Peaks Compared to Average Data

Baseline DataOf a healthy machine - Average + 1 Sigma Alarm Level
800 Alarm Levels
Incoming Spectra
What machine is this &what are its vibration sources?
How does this spectra compareto that of a healthy machine?
What, if anything, is wrong withthis machine and how bad is it? Spectral Analysis Rule Base
Diagnostics Automated

Diagnosis Rule AppliedMisalignment (Parallel)
1. 2X Vertical or Horizontal > .03 IPSand
> 20% above Baseline on both sides of the coupling
3. The Maximum 2X > .06 IPSor
The sum (V & H) of 2X exceedances > 10 times the 1X (V & H) for at least one side of the coupling
2. 2X Vertical > 1X Verticalor
2x Horizontal > 1X Horizontal for one side of coupling
Incoming Spectra
Machinery Fault Report
What machine is this &what are its vibration sources?
How does this spectra compareto that of a healthy machine?
What, if anything, is wrong withthis machine and how bad is it?
Maintenance Planning
How does theDiagnostic System work?
Answers, Not Just Data.
We’ve automated the same steps a human analyst follows.