RISK MANAGEMENT OF OFFSHORE LOGISTICS SUPPORT OPERATIONS ...
229
RISK MANAGEMENT OF OFFSHORE LOGISTICS SUPPORT OPERATIONS IN REMOTE HARSH ENVIRONMENTS by © Md Samsur Rahman, B.Sc.Engg., M.Eng. A Thesis submitted to the School of Graduate Studies in partial fulfillment of the requirements for the degree of Doctor of Philosophy Faculty of Engineering and Applied Science Memorial University of Newfoundland October 2020 St. John’s Newfoundland
Transcript of RISK MANAGEMENT OF OFFSHORE LOGISTICS SUPPORT OPERATIONS ...

RISK MANAGEMENT OF OFFSHORE LOGISTICS SUPPORT
OPERATIONS IN REMOTE HARSH ENVIRONMENTS
by
© Md Samsur Rahman, B.Sc.Engg., M.Eng.
A Thesis submitted to the
School of Graduate Studies
in partial fulfillment of the requirements for the degree of
Doctor of Philosophy
Faculty of Engineering and Applied Science
Memorial University of Newfoundland
October 2020
St. John’s Newfoundland

ii
To
my
parents

iii
ABSTRACT
Activities in northern offshore regions are increasing due to proven reserves of natural
resources. These regions are considered to have a harsh marine environment due to
extreme weather conditions, namely low temperatures, frequent storms and the presence
of sea ice. In general these activities are moving further offshore. Thus many new
developments are faced with operations in extreme environments at long distances from
shore support. Design, operational and regulatory planning for such offshore installations
must consider the environmental challenges along with additional difficulties that arise
due to remoteness.
The most significant aspects of an offshore development that are affected by the factors of
environment and remoteness, are the logistical support functions required for daily
operations and the rapid response required for emergencies. In the early stages of design
it would be beneficial to have a means of assessing the high risk elements of such
operations and the risk reduction cost effectiveness of proposed solutions.
This study presents an end-to-end risk reduction analysis of the logistical support
functions for a typical remote harsh-environment offshore operation including; risk
assessment to provide identification of most significant risks, risk reduction modeling and
development of a solution to provide the identified most effective reduction strategy, and
finally a cost benefit analysis that includes the costed initial risk factors, the solution cost
and the costed net reduction in risk arising from implementation.

iv
This research serves three functions. It develops a procedure for evaluating offshore
operations that have inherently high logistical risks due mainly to distance but also
applicable to other factors. It provides a risk analysis based solution to the specific
problem of remote operations in harsh environments. Finally it develops a method of
determining the utility of a possible solution or of alternative solutions through rational
risk based cost analysis.
The study is divided into four phases, Risk Analysis, Risk Reduction, Specific Solution
and Cost-Benefit Analysis. In phase one – risk analysis, an advanced probabilistic model
is developed using fault trees to identify the main contributing factors of the logistical
challenges. A fuzzy-based and evidence-based approach is implemented to address
inherent data limitations. It is found that existing modes of logistics support such as
marine vessel or helicopter are not sufficiently reliable and quick for remote offshore
operations. Moving towards in phase two – risk reduction, a conditional dependence-
based Bayesian model is developed that has integrated multiple alternative risk reduction
measures. The analysis depicts that a nearby offshore refuge and an additional layer of
safety inventory are found to the most effective measures. In phase three – specific
solution, the concept of a moored vessel, which is termed as offshore resource centre
(ORC) is proposed that can meet the functions of both these measures. The overall
dimensions of the ORC are derived based on the functional requirements and the model is
validated for stability and mooring requirements. In phase four – cost-benefit analysis, the

v
life cycle costs of an ORC is estimated from historical vessel data using regression
analysis. A loss model is developed for a hypothetical blowout incident, which is a
function response time and the distance from shore support. These models are integrated
into a single framework that can project the costed risk with or without the ORC. The
analysis reveals that an ORC becomes more and more viable when the offshore distance
becomes longer and if there is a higher probability of any platform incident, recognizing
that it is desirable to keep the probability as low as possible. Taken together these phases
form a full analysis from problem identification through solution cost-benefit.

vi
ACKNOWLEDGEMENTS
I would like to express my sincerest gratitude to my supervisors, Drs. Faisal Khan, Salim
Ahmed, Syed Imtiaz and Bruce Colbourne for their guidance, support and motivation
throughout my doctoral program.
I am thankful to Dr. Faisal Khan, who accepted me in his research group and provided me
an opportunity to work in this research project. His dynamic supervision, direction and
prompt feedback helped me to stay focused and reach to my milestones. I extend my
sincere thanks to Drs. Salim Ahmed and Syed Imtiaz for the helpful discussion, insightful
comments and great advice. I was also benefited from useful discussion with Dr.
Arifusalam Shaikh. I acknowledge my sincerest appreciation to Dr. Bruce Colbourne for
his extraordinary support, generous help and guidance in my work even after his
retirement. I am fortunate to be his mentee and it is always a pleasure to work with him.
Thanks are extended to the staff of the Faculty of Engineering and Applied Science and
School of Graduate Studies, Memorial University of Newfoundland. Thanks to the
members of the Centre for Risk, Integrity and Safety Engineering (C-RISE) for many
useful discussions.
I extend my thanks to all of my friends in St. John’s, especially Tanvir, Ashim, Mashrura
and Abir for their friendships, and making my stay enjoyable. I am profoundly grateful to
my lovely wife, who is always by my side in good and bad times and for her endless care,

vii
motivation and patience. Thanks to my other family members for their continuous support
and encouragement. Finally, I owe my deepest thanks to my mother for her boundless
love, inspiration and patience during my studies abroad.

viii
Table of Contents
ABSTRACT ....................................................................................................................... iii
Table of Contents ............................................................................................................. viii
List of Tables ................................................................................................................... xiii
List of Figures ................................................................................................................... xv
Nomenclature ................................................................................................................. xviii
1. INTRODUCTION ...................................................................................................... 1
1.1 Problem statement ...................................................................................................... 1
1.2 Knowledge and technological gaps............................................................................ 3
1.3 Summary and Research Hypothesis ........................................................................... 7
1.4 Novelty and contribution ......................................................................................... 12
1.5 Organization of the thesis ........................................................................................ 13
References ...................................................................................................................... 17
2. Development of Risk Model for Marine Logistics Support to Offshore Oil and Gas
Operations in Remote and Harsh Environments ............................................................... 23
Co-authorship statement ................................................................................................ 23
Abstract .......................................................................................................................... 24
2.1 Introduction .............................................................................................................. 25
2.2 Methodology to Develop Logistics Risk Model ................................................. 27

ix
2.2.1 Logical modelling of marine logistics support ............................................ 29
2.2.2 Adaption of advanced probabilistic approach to develop risk model .......... 37
2.2.3 Data Uncertainty .......................................................................................... 43
2.3 Application of the Proposed Model .................................................................... 47
2.3.1 Application of fuzzy theory ......................................................................... 49
2.3.2 Application of evidence theory .................................................................... 51
2.4 Discussion ........................................................................................................... 54
2.5 Conclusions ......................................................................................................... 57
References ...................................................................................................................... 59
3. A Conditional Dependence-based Marine Logistics Support Risk Model ............... 65
Co-authorship statement ................................................................................................ 65
Abstract .......................................................................................................................... 66
3.1 Methodology to Develop Logistics Risk Model ................................................. 66
3.2 Methodology ....................................................................................................... 70
3.3 Application of the Proposed Methodology ......................................................... 83
3.3.1 Description of the Case Study ...................................................................... 83
3.3.2 Probability Data ........................................................................................... 85
3.3.3 Critical Factor Analysis ............................................................................... 90
3.4 Risk Management Strategies ............................................................................... 93

x
3.4.1 Identification of Safety Measures ................................................................ 93
3.4.2 Safety Measures Allocation to the Model .................................................... 98
3.5 Conclusions ....................................................................................................... 107
References .................................................................................................................... 108
4. Conceptual Development of an Offshore Resource Centre in Support of Remote
Harsh Environment Operations ....................................................................................... 117
Co-authorship statement .............................................................................................. 117
Abstract ........................................................................................................................ 117
4.1 Introduction ....................................................................................................... 118
4.2 ORC Performance Requirements ...................................................................... 122
4.2.1 Risk reduction objectives ........................................................................... 123
4.2.2 Environmental Conditions ......................................................................... 125
4.3 Concept Development ....................................................................................... 129
4.3.1 Platform Type ............................................................................................ 129
4.3.2 Positioning ................................................................................................. 129
4.3.3 Vessel Development .................................................................................. 132
4.3.4 Layout, dimensions and functional relationships ....................................... 136
4.3.5 Arrangement of Functional Blocks and Overall Sizing ............................. 146
4.4 Validation of Concept ....................................................................................... 149

xi
4.4.1 Vessel Stability .......................................................................................... 149
4.4.2 Mooring Analysis ....................................................................................... 151
4.5 Discussion ......................................................................................................... 155
4.6 Conclusion ......................................................................................................... 160
References .................................................................................................................... 161
5. Risk-Based Cost Benefit Analysis of Offshore Resource Centre to Support Remote
Offshore Operations in Harsh Environment ................................................................... 166
Co-authorship statement .............................................................................................. 166
Abstract ........................................................................................................................ 167
5.1 Methodology to Develop Logistics Risk Model ............................................... 167
5.2 The Proposed Methodology .............................................................................. 172
5.2.1 Cost model ................................................................................................. 173
5.2.2 Benefit model ............................................................................................. 175
5.2.3 Aggregate cost and benefit model .............................................................. 178
5.2.4 Uncertainty analysis ................................................................................... 180
5.3 The Application of the Proposed Methodology: Case Study ............................ 180
5.3.1 Example location of ORC .......................................................................... 180
5.3.2 Cost estimation of the ORC ....................................................................... 182
5.3.3 Offshore blowouts and corresponding loss function ................................. 185
xii
5.3.4 Comparison of Cost-benefits and Monte Carlo simulations ...................... 192
5.4 Discussion ......................................................................................................... 194
5.5 Conclusions ....................................................................................................... 198
References .................................................................................................................... 199
6. Summary, Conclusions and Future works .............................................................. 203
6.1 Summary ........................................................................................................... 203
6.2 Technical Challenges and Limitations .............................................................. 205
6.3 Recommendations and Future Work ................................................................. 207
6.4 Conclusion ......................................................................................................... 210

xiii
List of Tables
Table 1.1: Organization of the thesis ................................................................................. 14
Table 2.1: Model assumptions in the traditional FT model and approaches to relax the
assumptions ........................................................................................................................ 38
Table 2.2: Data assumptions in marine logistics risk analysis ........................................... 43
Table 2.3: Arithmetic expressions for fuzzy FTA ............................................................. 46
Table 2.4: Failure probabilities of basic events ................................................................. 48
Table 2.5: Triangular Fuzzy Number at α=0.95 ................................................................ 50
Table 2.6: Error robustness of fuzzy approach .................................................................. 51
Table 2.7: Basic probability assignments .......................................................................... 52
Table 2.8: Combination of beliefs ..................................................................................... 53
Table 2.9: Belief structures and "Bet" estimation of the top event .................................... 54
Table 2.10: Top event failure probability based on different approach ............................. 54
Table 3.1: Performance shaping factors of different scenarios of human error ................. 78
Table 3.2: Failure probabilities .......................................................................................... 85
Table 3.3: The ratio of prior and posterior probabilities of critical factors ....................... 92
Table 3.4: Sensitivity of the main phases of logistics operation ........................................ 93
Table 3.5: Summary of safety measures in the context of ER failure ............................... 95
Table 3.6: Comparison of probabilities with and without safety measures ..................... 100
Table 3.7: Consequence types .......................................................................................... 102
Table 3.8: Risk of ER failure with and without safety measures ..................................... 103

xiv
Table 4.1: Physical environmental conditions of Flemish Pass and Grand Banks regions
.......................................................................................................................................... 128
Table 4.2: General characteristics of Sikorsky S-92 ........................................................ 134
Table 4.3: List of functional blocks ................................................................................. 140
Table 4.4: Space for hospital ........................................................................................... 142
Table 4.5: ORC turret specification ................................................................................. 144
Table 4.6: Helidecks specifications ................................................................................. 145
Table 4.7: Hangar specifications ...................................................................................... 146
Table 4.8: Model input parameters .................................................................................. 153
Table 4.9: ORC Principal Dimensions and Characteristics ............................................. 157
Table 5.1: ORC Principal Dimensions and Characteristics ............................................. 181
Table 5.2: Regression analysis of ORC cost .................................................................... 184
Table 5.3: Total costs of ORC ......................................................................................... 185
Table 5.4: Previous offshore blowouts ............................................................................ 188
Table 5.5: Monte Carlo simulation of cost-benefit analysis ............................................ 193

xv
List of Figures
Figure 1.1: Logistics operation or emergency response (ER) process ................................. 3
Figure 1.2: Objectives of this research ................................................................................ 9
Figure 1.3: Exploration drilling location in the Flemish Pass Basin (Source: Canadian
Environmental Assessment Agency, date retrieved: August 21, 2018) ............................. 11
Figure 2.1: Location of Statoil exploration drilling project in the Flemish Pass Basin ..... 27
(Source: News/ June 10, 2016/Statoil Canada Limited) .................................................... 27
Figure 2.2: The proposed framework for marine logistics support risk modelling in harsh
environments ...................................................................................................................... 28
Figure 2.3: Logistics operation or emergency response (ER) process ............................... 29
Figure 2.4: Fault Tree model for logistics support to an offshore facility in remote harsh
environment ....................................................................................................................... 35
Figure 2.5: Fault Tree model for unobstructed voyage failure .......................................... 36
Figure 2.6: Fault Tree model for equipment functionality failure ..................................... 36
Figure 2.7: Fault Tree model for on-site operational failure.............................................. 37
Figure 2.8: Modified Fault Tree model for marine logistics support in remote harsh
environment ....................................................................................................................... 41
Figure 2.9: Modified Fault Tree model for unobstructed voyage failure .......................... 42
Figure 2.10: Modified Fault Tree model for onsite operational failure ............................. 42
Figure 2.11: Representation of triangular fuzzy number of an event ................................ 45
Figure 2.12: Ratio of Improvement Index and ER failure probability of basic events (See
Table 2.4 for legends) ........................................................................................................ 56

xvi
Figure 3.1: Simplified BN showing CPTs and inter dependency between nodes ............. 73
Figure 3.2: The proposed methodology for marine logistics risk management in harsh
environments ...................................................................................................................... 74
Figure 3.3: Logistics operation or emergency response (ER) process (Rahman et al.,
2019) .................................................................................................................................. 75
Figure 3.4: The basic BN model for marine offshore logistics operation ......................... 76
Figure 3.5: A sample BN for estimating human error during offshore onboard operation78
Figure 3.6: The modified BN model for marine offshore logistics operation ................... 80
Figure 3.7: Exploration drilling location in the Flemish Pass Basin (Source: Canadian
Environmental Assessment Agency, date retrieved: August 21, 2018) ............................. 84
Figure 3.8: Combination of conditional probabilities from the experts using DS rule ...... 89
Figure 3.9: BN model is simulated using GeNIe as the probability of ER failure is 1.0. .. 91
Figure 3.10: Risk reduction measures for different phases of marine logistics operation . 94
Figure 3.11: Safety measures allocation to the BN model. ................................................ 98
Figure 3.12: Example of updated failure probability calculation with safety measure ..... 99
Figure 3.13: Percentage of risk reduction after the application of safety measures ........ 104
Figure 3.14: Belief structure of consequences ................................................................. 105
Figure 3.15: An influence diagram for decision making in the risk management of
offshore logistics support in a remote harsh environment ............................................... 106
Figure 4.1: A solution for logistics support and emergency response in remote harsh
environments .................................................................................................................... 122
Figure 4.2: The possible location of the ORC offshore Newfoundland .......................... 126

xvii
Figure 4.3: An example of estimation the dimension of a functional block .................... 137
Figure 4.4: Example of functional blocks that requires space ......................................... 138
Figure 4.5: Function space blocks arranged within ship envelope .................................. 139
Figure 4.6: The proposed ORC profile to illustrate the arrangement of all functional
blocks ............................................................................................................................... 148
Figure 4.7: Main deck layout ........................................................................................... 148
Figure 4.8: ORC hydrostatics particulars ......................................................................... 151
Figure 4.9: ORC mooring leg arrangements .................................................................... 152
Figure 4.10: Leg 3 tensions for extreme weather and 0 degree weather heading ............ 154
Figure 4.11: Average and maximum mooring line tensions for all 4 cases ..................... 155
Figure 5.1: A solution for logistics support and emergency response in remote harsh
environments [revised after Rahman et al., 2020b] ......................................................... 168
Figure 5.2: Flow chart of the proposed methodology ...................................................... 173
Figure 5.3: Breakdown of overall blowout loss ............................................................... 177
Figure 5.4: Cruise ships building costs vs year ................................................................ 183
Figure 5.5: Response time vs offshore distance curve ..................................................... 189
Figure 5.6: CDF of blowout cost ..................................................................................... 190
Figure 5.7: CDF of response time in days ....................................................................... 190
Figure 5.8: Offshore blowout loss curve as a function of response time ......................... 191
Figure 5.9: Histogram of residual risk ............................................................................. 193
Figure 5.10: Mean and SD of residual risk vs probability of accident ............................ 194
Figure 5.11: Sensitivity of blowout probability and residual risk ................................... 196

xviii
Nomenclature
BN Bayesian network
CAT Commercial air transport
DAG Directed acyclic graph
DST Dempster-Shafer theory.
ER Emergency response
FT Fault tree
FTA Fault tree analysis
LCC Life cycle cost
NPV Net present value
ORC Offshore resource centre
MCS Minimal cut sets
TFN Triangular fuzzy number
FOD Frame of discernment
C-RISE Centre for Risk, Integrity and Safety Engineering
CPT Conditional probability table
HRA Human reliability analysis
HEP Human error probability
PSF Performance shaping factor
MAIB Marine Accident Investigation Branch
HSE Health and Safety Executive
WOAD Worldwide Offshore Accident Databank

xix
ERV Emergency response vessel
SBV Standby vessel
ID Influence diagrams
MOB Mobile offshore base
DP Dynamic positioning
FRC Fast rescue craft
ILO International Labor Organization
SOLAS International Convention for Safety of Life
LF Loss function
MCS Monte Carlo Simulation
MLR Multiple linear regression
CDF Cumulative Density Function
BP British Petroleum
AMSA Australian Maritime Safety Authority

1
1. INTRODUCTION
1.1 Problem statement
Harsh offshore environments are characterized by extreme weather conditions, which are
not favorable for human, infrastructure or habitat (Khan et al., 2014a). Northern ocean
frontiers have the harshest environmental conditions with the presence of various ice
features, extreme cold temperature, freezing rain, high wind and waves, and marine fog
(Walsh, 2008; Arctic Marine Shipping Assessment, 2009; Hamilton, 2011; Meling, 2013;
Necci et al., 2019). In addition, these regions, including the high Arctic, are most often
also located at long distances from established large communities and infrastructure.
However, these regions contain proven and speculative reserves of hydrocarbons and
mineral resources leading to increased interest from the oil and gas and mining industries
(Tellier, 2008). Exploration and development of natural resources in these regions faces
significant safety and integrity challenges, which are identified as the lack of details in
construction and operation standards, restricted operating conditions, presence of
different ice features such as pack ice and icebergs, remoteness, human factors, and
knowledge and data scarcity (Khan et al., 2014b). There are several standards and
practices such as ABS 2010, ISO 19906:2010, NORSOK S-002, and Barents 2020 that
provide guidance for operations in harsh environments. However, there is a lack of design
and operational guidelines or experience for further north, which must consider the
additional distance and more extreme environmental conditions (Hamilton, 2011; Meling,

2
2013). Planning for normal logistics supply, and support during emergencies, is an
important aspect of any resource development and a key part of regulatory evaluation.
There is a need to be able to assess risk and develop new strategies and technologies prior
to launching operations in these regions (Milaković et al., 2014; Malykhanov and
Chernenko, 2015; Borch, 2018; Uthaug, 2018).
Logistics operations are conducted to transport personnel and to provide routine supplies
as well as emergency support to recover from hazardous incidents. The sequence of
activities involved in the process of an emergency logistics operation is presented in
Figure 1.1. This process consists of the following phases: departure readiness of a vessel
when an incident has been reported, an uninterrupted voyage, functionality of on-board
equipment, arrival at the site within the desired time limit and on-site operation. A
successful logistics operation is unlikely if any of these phases fails.

3
Figure 1.1: Logistics operation or emergency response (ER) process
1.2 Knowledge and technological gaps
Logistics for offshore operations is, in the majority of cases, provided by supply vessels
and/or helicopters. In general, marine vessels are used for transporting materials and
supplies from an onshore supply base to support offshore exploration activities.
Helicopters are used to transport personnel and light cargo to and from offshore
platforms. Besides the routine logistics for supply, the role of emergency response (ER) is
to support emergency evacuation should the platform need to be abandoned. Prompt
response, which can be critical due to the distance and environment, is required to
enhance the resilience of an offshore system and minimize the severity of an accident.

4
Faster response can be provided by helicopter than by support vessel but the use of
helicopter is limited when the distance is too long (beyond helicopter reach), and subject
to adverse weather conditions. Also, helicopters cannot be used if the platform itself is
sinking or any situation that is not safe for the helicopter to land or winch.
Accident rates in the offshore helicopter industry are still at least one order of magnitude
greater than those of commercial fixed-wing operations (Oil & Gas UK, 2017; OGP,
2010). The crash of a helicopter is almost always a very serious event - often leading to
fatalities and serious economic loss (Sutton, 2014; Okstad et al., 2012; Olsen and Lindøe,
2009; Hokstad et al., 2001; Vinnem, 2011, 2010). Baker et al. (2011) published an article
on helicopter crashes related to oil and gas operations in the Gulf of Mexico, where an
average of 6.6 crashes occurred per year during 1983 – 2009 and resulted in a total of 139
fatalities. During that period, bad weather led to a total of 29 crashes, which accounted to
40% of the 139 deaths. According to the Civil Aviation Authority and Oil & Gas UK
records, there were 73 UK Continental Shelf offshore commercial air transport (CAT)
accidents reported from 1976 to 2013 in which a total of 119 fatalities occurred. 11% of
these accidents occurred due to external factors such as icing, turbulence, wind shear,
thunderstorm, or bird strike. These problems are particularly acute at night, when the
accident rates are considerably higher than those in the daytime. Knowledge of the
hazards and risks associated with such accidents is very limited (Ross and Gibb, 2008).
This is aggravated by the expected increase in nighttime or low light offshore helicopter
activities associated with, for example, the beginning of exploration for oil and gas in

5
polar regions (Nascimento, 2014). Marine vessels could become the only mode for
transportation if these circumstances lead to unacceptably high risk. The feasibility of
marine logistics operations in remote harsh environments is not well-understood (Khan et
al., 2014a, 2014b). A marine logistics operation can be hampered by many factors, such
as equipment failure, operational and navigational failure, failure due to the prevailing
environment, human related error, etc. Logistics support failure due to inadequate voyage
plans has been addressed in detail by Kum and Sahin (2015). Working in northern regions
can endanger the crew unless proper preparations are made to equip both vessel and crew
for operating in cold, dark, and icy conditions. The reliability information about
lifesaving appliances in ice-covered regions is presented in Bercha et al. (2003). Faulty
equipment in any system of a ship may result in operation failure (Antao et al., 2006).
Navigational failure may occur for many reasons including radar failure, control error,
propulsion system failure, human error, or difficulties arising from prevailing weather
conditions such as poor visibility. Probabilistic assessment of a ship’s navigational failure
is presented by Pietrzykowski (2007) and Amrozowicz et al. (1997).
The term “risk” refers to the probability of an undesirable event and its consequence to
people, property and environment. Various modelling techniques are available to assess
the risk of a system qualitatively or quantitatively in which Fault Tree (FT) or Bayesian
Networks (BN) are commonly used. However, choosing the right approach is key for
useful risk assessment (Crowl and Louvar, 2002; Andrews and Moss, 2002; Modaress,
2006). In a Fault Tree, a system or component failure is graphically presented as a logical

6
relationship with possible causes that can contribute to the system or component failure.
A system failure is referred to as a “top event” and all primary causes are defined as basic
events, which are connected by logic gates in the FT. Basic events have binary states, i.e.,
success/failure, and are considered as mutually independent (Khakzad et al., 2011). There
are several forms of logic gates that determine the effects of the basic events; the AND-
gate and OR-gate are most commonly used in the FT. A fault tree is usually adapted to its
top event and includes only the most credible faults as assessed by the risk analyst(s) and
may not represent all possible system failure causes (Vesely et al., 1981). Amrozowicz et
al. (1997); Kum and Sahin (2015); Laskowski (2015); Pietrzykowski (2007) present the
application of fault trees to analyze marine accidents.
A Bayesian Network is a Directed Acyclic Graph (DAG) that satisfies the Markovian
condition. A DAG is a directed graph with no cycles and the Markovian condition for
Bayesian network states that every node in a Bayesian network is conditionally
independent of its non-descendants, given its parents. A DAG consists of two sets: the set
of nodes and the set of directed edges. In a BN, nodes represent random variables while
the edges represent conditional relationships (casual relationships) between the connected
nodes (Jensen and Nielsen, 2007; Ben-Gal, 2007). Several studies are found in the
literature that apply BN to analysis various types of marine accidents (Afenyo et al.,
2017; Hänninen, 2014). However, no studies are found that have conducted formal risk
analysis of marine logistics support in distant harsh environments.

7
Based on the literature review, the main logistics issues in a remote platform operating in
harsh environment are identified as:
- There are two modes for logistics operation: helicopter and marine vessels.
Helicopter operation is limited by the environmental conditions and remoteness.
Long-distance operation of helicopters is particularly risky.
- Marine vessels are relatively reliable and versatile alternative to helicopters.
Although, quick response is not possible by a vessel from an onshore base to
remote locations.
- Risk associated with regular and emergency marine logistics operation is not well-
quantified or understood as no publicly available formal risk analysis has been
conducted to date.
- There is considerable uncertainty associated with operations and risk assessment
for remote harsh environments due to the lack of operational experience in such
operating conditions.
- A viable solution is yet to be developed to address the logistics challenges of
harsh environment remote offshore development.
1.3 Summary and Research Hypothesis
In summary, there are two significant levels of problem identified in the literature
associated with development of increasingly distant and harsh offshore projects. A
significant high level problem is the lack of a risk based methodology to evaluate the
most significant risks and the most effective solutions to these risks in dollar terms; and

8
the low level problem is a lack of well-developed concept solutions for the problem of
long travel distances from shore base to offshore site.
The goal of this research is to address these two problems by setting up a more general
risk analysis methodology and evaluating the methodology by performing a specific case
study. This will consist of an in-depth study to identify the challenges of offshore
logistics operations, assessing risk, and developing a feasible solution to the identified
logistics issues, all focused on the specific case of a remote harsh environment
installation. The work is concentrated on logistical supports and operations as this is
identified in the literature as the longest term and most risk-prone stage in the life of an
offshore development. Figure 1.2 illustrates the organization of the thesis that includes the
goal, objectives and associated research tasks.

9
Figure 1.2: Objectives of this research
The research is divided into four phases in which each phase addresses one of the
objectives identified in Figure 1.2. In phase one, a risk model is developed to find the
most significant factors related to failure of a marine logistics support operation in a
remote harsh environment. A probabilistic approach is adopted using advanced fault-
trees, which is integrated with fuzzy logic theory and evidence theory to address the
limitation of existing data. This work serves to identify the higher risk aspects of the
logistics operations for remote offshore developments and to improve the methodology
for offshore risk assessment in the face of limited historical data.

10
In the second phase, a framework is developed to identify the most effective risk
reduction measures for logistics operations. A Bayesian approach is implemented in this
framework that considers the interdependencies among the contributing risk factors. This
work introduces the idea of conditional dependence as a means of improving the risk
reduction analysis procedure.
In the next phase of this research, using the knowledge gathered from the phase 1 and
phase 2 analyses, a specific solution in the form of an intermediate offshore resource
centre (ORC) is proposed for effective risk reduction. This novel solution is conceived as
a practical means of providing the most effective risk reduction measure to address the
identified highest risk aspects of a logistics operation in a remote harsh environment.
In phase four, the research develops a cost-benefit analysis procedure for the proposed
solution that can guide decision making to assess the feasibility of any proposed risk
reduction measure. This provides a novel engineering economics approach to assessing
the viability of a proposed risk reduction strategy. As a case study using the developed
methodology, the costed risk of a hypothetical offshore blowout incident is estimated
using a loss function developed based on historical blowout events. The capital and
operating costs of the solution proposed in phase 3 are estimated and the net benefit,
expressed in economic terms, of the risk reduction strategy is presented. This provides
both a methodology and a demonstration of utility through a specific solution case.

11
The Flemish Pass Basin is chosen as the case study location. This drilling location is
approximately 500 nautical miles east of St. John’s, Newfoundland and Labrador. The
water depths in this area range from 500 to over 3,000 m (Project Description Summary –
Equinor, 2016). Figure 1.3 shows the location of Flemish Pass drilling project. This
region exhibits harsh environmental conditions including intense storms and the presence
of ice (sea ice and icebergs). The distance between the onshore supply base and the
offshore drilling location is sufficiently long to be considered remote and needing special
consideration.
Figure 1.3: Exploration drilling location in the Flemish Pass Basin (Source: Canadian
Environmental Assessment Agency, date retrieved: August 21, 2018)

12
1.4 Novelty and contribution
This research identifies the logistical challenges of remote offshore operation in harsh
environments. The contributions includes new methodology to better understand the risk
profile of a new development scenario with minimal background data, formal analysis
process with better understanding of conditional dependence to evaluate possible
measures to overcome these challenges. The work also develops a unique practical
solution to the logistical problem, in the form of the ORC Concept, and finally provides a
novel method of evaluating the cost effectiveness of this or any proposed risk reduction
measure. A brief description of the contributions and novelties of this research is provided
below.
Logistics risk model development
A novel marine logistics risk model is developed to support offshore operations is
challenging environmental conditions. The model identifies and considers key failure
modes and develops appropriate failure models. The model relaxes the assumption of
independence of causes. Data and model uncertainties are considered. Application of the
proposed model is demonstrated through a case-study concerning a remote North Atlantic
offshore operation.
Solution for logistics risk
A Bayesian network (BN) based risk model is developed to consider interdependencies
and conditional relationships among the contributing factors to an offshore logistics

13
failure. Appropriate risk management strategies are proposed to support marine logistics
operations. This allows identification and ranking of the major sources of risk.
Concept development of proposed solution
An intermediate offshore resource centre (ORC) as a potential solution to the logistics
problem is presented. A vessel or platform of this type and functionality has not been
previously developed or proposed. The purpose, functional requirements and the
conceptual design of an ORC are discussed. A modular volume-limited ship design
concept is adopted to determine the principal particulars of the ORC. The concept design
of the ORC is tested and validated for the vessel stability and mooring requirements.
Framework for risk-based cost-benefit analysis
A new framework is developed for risk-based cost-benefit analysis that helps to assess the
net financial cost or benefit of using a system, such as an ORC, as a risk reduction
strategy for remote offshore developments. This presents a structured but flexible
approach that can be easily modified for different scenarios. The methods can be applied
to any potential risk mitigation system.
1.5 Organization of the thesis
The thesis is written in manuscript format that includes four journal papers as chapters.
Table 1.1 shows the papers written during the course of this research and establishes their
connection to the overall objectives listed in Figure 1.2.

14
Table 1.1: Organization of the thesis
Papers as chapters Research objectives Associated tasks
Chapter 1: Introduction.
Not applicable for
publication.
To specify Problem statement of
offshore logistics support operation.
To present overall research objectives
and organization of the thesis.
Conduct literature review.
Identify knowledge gaps.
Define research objectives and research hypothesis.
Chapter 2: Development of
risk model for marine
logistics support to
offshore oil and gas
operations in remote and
harsh environments.
To develop a framework for formal
risk analysis of logistical problem.
To provide an understanding of
associated risk.
Identify key challenges from literature survey.
Develop probabilistic risk model using advance fault trees.
Identify model and data limitations.
Address data uncertainty using fuzzy theory and evidence
theory.
Chapter 3: A conditional
dependence-based marine
logistics support risk
model.
To identify potential risk reduction
measures. To assess the feasibility of
each measure.
Develop a conditional dependence-based risk model that
integrates reduction measures.
Address data limitation using evidence-based approach.
Detect effective measure using sensitivity analysis.
Chapter 4: Conceptual
development of an
offshore resource centre in
support of remote harsh
environment operations.
To develop the concept of the
identified viable measure (Offshore
resource centre) from previous study.
Define functional requirements for logistics support
operation.
Identify suitable platform to meet this purpose. Concept
design of offshore resource centre.
Validation of concept design.

15
Table 1.1: Organization of the thesis (continued)
Papers as chapters Research objectives Associated tasks
Chapter 5: Risk-Based
Cost Benefit Analysis of
Offshore Resource Centre
to Support Remote
Offshore Operations in
Harsh Environment.
To develop a framework to assess
economic viability of offshore resource
centre.
Estimate cost of the ORC using historical ships data.
Develop loss function of an accident scenario (blowout).
Benefit measured as the reduction of cost a blowouts due
to ORC.
Cost-benefit comparison. Analyze sensitivity of blowout
probability with the net risk reduction.
Chapter 6: Summary,
Conclusion and Future
Works.
Not applicable for
publication.
To provide a summary, outcome of
this research and recommendations for
future work.
Conclusion drawn from the overall study.
Acknowledge limitations of this study and possible future
work.

16
An outline of each chapter is presented below.
Chapter 2 identifies the risk contributing factors of marine logistics operation in a remote
harsh environment. An advanced fault tree analysis is used to develop the logical
relationships among these factors and a sensitivity analysis is conducted to rank the most
critical factors that cause emergency response failure. The fault-tree model is integrated
with fuzzy logic theory and evidence theory to address the limitation of existing data.
Chapter 3 presents a Bayesian network model that establishes a causal relationship among
factors contributing to offshore logistics risk and possible risk reduction measures. A
framework is developed to identify the most effective risk reduction measures for
logistics operations. An uncertainty analysis is conducted based on evidence theory to
address inherent data limitation.
Chapter 4 proposes a specific solution in the form of an intermediate offshore resource
centre (ORC) for effective risk reduction based on the most critical factors identified in
Chapter 3. The functional requirements of an ORC are defined in an aim to reduce
logistical risk of remote offshore operation in challenging environments. Conceptual
development of the ORC includes overall sizing estimation and validation of preliminary
stability and mooring requirements.
Chapter 5 provides a framework for risk-based cost-benefit analysis. The cost model is
the life-cycle cost of the proposed ORC, which is estimated based on historical ship data

17
using regression analysis. The benefit model is expressed as a loss function of blowout
incidents, which is a function of response time and the distance from the nearest logistics
support. This study presents an integrated framework that evaluates the net benefit,
expressed in economic terms, of the risk reduction strategy is presented.
Chapter 6 concludes this thesis with a summary of key developments and conclusions. It
presents recommendations for potential future work.
A co-authorship statement is provided at the beginning of each chapter. The statement
describes the contribution of each author in different stages of the research.
References
Afenyo, M., Khan, F., Veitch, B., & Yang, M. (2017). Arctic shipping accident scenario
analysis using Bayesian Network approach. Ocean Engineering, 133, 224–230.
http://doi.org/10.1016/j.oceaneng. 2017.02.002.
Amrozowicz, M., Brown, A.J., Golay, M., 1997. Probabilistic analysis of tanker
groundings. International Offshore and Polar Engineering Conference. Honolulu,
Hawaii.
Andrews, J.D. and Moss, T.R., 2002, Reliability and Risk Assessment, Publisher: Wiley-
Blackwell.
Antao, P. and Soares, C.G., 2006. Fault-tree Models of Accident Scenarios of RoPax
Vessels. International Journal of Automation and Computing 2 (2006) 107-116.

18
Arctic Council, 2009. Arctic Maritime Shipping Assessment 2009 Report. Available
at:https://www.pmel.noaa.gov/arctic-
zone/detect/documents/AMSA_2009_Report_2nd_print.pdf, Accessed: December,
2019.
Baker, S. P., Shanahan, D. F., Haaland, W., Brady, J. E., & Li, G. (2011). Helicopter
crashes related to oil and gas operations in the Gulf of Mexico. Aviation Space and
Environmental Medicine, 82(9), 885-889. DOI: 10.3357/ASEM.3050.2011.
Ben-Gal, I., 2007. Bayesian Networks. In: Ruggeri, F., Faltin, F., Kenett, R. (Eds.),
Encyclopedia of Statistics in Quality and Reliability. John Wiley and Sons, New
York.
Bercha, F.G., 2003. Escape, evacuation, and rescue research project phase II., Report for
Transportation Development Centre Transport Canada, Available
at: http://citeseerx.ist.psu.edu/viewdoc/download;jsessionid=E05FE72D947CF92D50
A2162CE4888206?doi=10.1.1.120.5848&rep=rep1&type=pdf, Accessed: September
2019.
Borch, O.J., 2018. Offshore service vessels in high arctic oil and gas field logistics
operations. FoU-rapport nr, 22 (2018) Bodø 2018.
Crowl, D.A., and Louvar, J.F., 2002. Chemical Process Safety: Fundamentals with
Applications, Prentice Hall Publication Inc.
Hamilton, J.M., 2011. The challenges of deep water arctic development. Proceedings of
the Twenty-first (2011) International Offshore and Polar Engineering Conference
Maui, Hawaii, USA (2011) June 19–24.

19
Hänninen, M., 2014. Bayesian networks for maritime traffic accident prevention: Benefits
and challenges. ACCIDENT ANALYSIS AND PREVENTION, (73), 305312.
https://doi.org/10.1016/j.aap.2014.09.017.
Hokstad, P., Jersin, E., Sten, T., 2001, A risk influence model applied to North Sea
helicopter transport, December 2001, Reliability Engineering System Safety
74(3):311-322, DOI: 10.1016/S0951-8320(01)00083-7.
Jensen, F.V. and Nielsen, T.D., 2007, Bayesian Networks and Decision Graphs, 2nd
edition, Springer, ISBN-10: 0-387-68281-3.
Khakzad, N., Khan F, and Amyotte, P., 2011, Safety analysis in process facilities:
Comparison of fault tree and Bayesian network approaches. Journal of Reliability
Engineering and System Safety 96 (2011) 925–932.
Khan, F., Ahmed, S., Hashemi, S.J., Yang, M., Caines, S., Oldford, D., 2014. Integrity
challenges in harsh environments: Lessons learned and potential development
strategies. Inst. Chem. Eng. Symp. Ser. 1–7.
Khan, F., Ahmed, S., Yang, M., Hashemi, S. J., Caines, S., Rathnayaka, S. and Oldford,
D., 2014. Safety challenges in harsh environments: Lessons learned. Proc. Safety
Prog., 34: 191–195. doi:10.1002/prs.11704.
Kum, S. and Sahin, B., 2015. A root cause analysis for Arctic Marine accidents from
1993 to 2011. Safety Science, Volume 74, Pages 206-220.
Laskowski, R., 2015, Fault Tree Analysis as a tool for modelling the marine main engine
reliability structure, Scientific Journals of the Maritime University of Szczecin, 2015,
41 (113), 71–77.

20
Lin, Ching-Torng and Wang, Mao-Jiun J., 1997, Hybrid fault tree analysis using fuzzy
sets, Reliability Engineering and System Safety 58 (1997) 205-213.
Malykhanov, A.A. and Chernenko, V.E., 2015. Strategic planning of logistics for
offshore arctic drilling platforms supported by simulation. Proceedings of the 2015
Winter Simulation Conference, Huntington Beach, CA (2015).
Meling, T.S., 2013. Deepwater floating production systems in harsh environment - a look
at a field development offshore Norway and need for technology qualification. OTC
Brasil, Rio de Janeiro, Brazil (2013) 29-31 October
Milaković, A.S., Ehlers, S., Westvik, M.H., Schütz, P., Offshore upstream logistics for
operations in arctic environment, 2015, MTEC 2014 - International Maritime and Port
Technology and Development Conference, Trondheim.
Modaress, M., 2006, Risk Analysis in Engineering: Techniques, Tools, and Trends, CRC
press, ISBN 9781574447941.
Nascimento, F. A. C., 2014, Hazard identification and risk analysis of nighttime offshore
helicopter operations, Ph.D. thesis, Imperial College London, UK.
Necci, A., Tarantola, S., Vamanu, B., Krausmann, E., Ponte, L., 2019. Lessons learned
from offshore oil and gas incidents in the Arctic and other ice-prone seas. Ocean Eng.
185, 12–26. https://doi.org/10.1016/j.oceaneng.2019.05.021.
OGP, Safety Performance Indicators 2011 data, 2012. International association of oil &
gas producers, Available at: http://old.ogp.org.uk/pubs/2011s.pdf. Accessed:
September 2019.

21
Okstad, E., Jersin, E., Tinmannsvik, R.K., 2012. Accident investigation in the Norwegian
petroleum industry – common features and future challenges. Saf Sci, 50 (6) (2012),
pp. 1408-1414.
Olsen, O.E. and Lindøe, P.H. Risk on the ramble: The international transfer of risk and
vulnerability, Safety Science, 2009, 47, (6), pp. 743-755.
Pietrzykowski, Z., 2007, Assessment of Navigational Safety in Vessel Traffic in an Open
Area, International Journal on Marine Navigation and Safety of Sea Transportation,
vol. 1, no. 1, March 2007.
Project Description Summary - Statoil Canada Ltd., 2016. Available at:
https://www.statoil.com/en/news/efficient-exploration-offshore-newfoundland.html.
Accessed: June 2016.
Reportable Accidents, Civil Aviation Authority and Oil & Gas UK records, 2017.
Available at: https://oilandgasuk.co.uk/wp-content/uploads/2017/07/Appendix-
1_Reportable-Helicopter-Accidents-2017.pdf. Accessed: September 2019.
Ross, C. and Gibb, G. (2008). A Risk Management Approach to Helicopter Night
Offshore Operations [Online]. Available: http://asasi.
Sutton, I., 2014. Offshore safety management implementing a SEMS program.
Elsevier, USA (2014).
Tellier, F.B., 2008. The Arctic: Hydrocarbon Resources, Parliament of Canada
publication, PRB 08-07E.
Vesely W.E, Goldberg F.F., Roberts N.H., Haasl D.F., 1981. Fault Tree Handbook. U.S.
Nuclear Regulatory Commission, Washington, DC (1981).

22
Vinnem, J.E. Evaluation of offshore emergency preparedness in view of rare accidents,
Safety Science, 2011. 49, (2), pp. 178-191.
Vinnem, J.E. Risk indicators for major hazards on offshore installations, Safety Science,
2010, 48, (6), pp. 770-787.

23
2. Development of Risk Model for Marine Logistics Support to
Offshore Oil and Gas Operations in Remote and Harsh
Environments
Md Samsur Rahman, Faisal Khan, Arifusalam Shaikh, Salim Ahmed, and Syed Imtiaz
Centre for Risk, Integrity and Safety Engineering (C-RISE)
Faculty of Engineering & Applied Science
Memorial University, St John’s, NL, Canada A1B 3X5
Co-authorship statement
A version of this manuscript has been published in Ocean Engineering. The lead author
Md Samsur Rahman performed the literature review, developed the fault trees for the
offshore logistics support risk model, collected failure probability data, performed the
model analysis, generated the results, and prepared the draft of the manuscript. The co-
author Faisal Khan helped in developing and testing the risk models, reviewed and
corrected the models and results, and contributed in preparing, reviewing and revising the
manuscript. The co-author Arifusalam Shaikh also helped in the development of the
model. All co-authors including Salim Ahmed and Syed Imtiaz reviewed and provided
feedback on the manuscript. Md Samsur Rahman revised the manuscript based on the co-
authors’ feedback and during the peer review process.

24
Reference: Rahman, M.S., Khan, F., Shaikh, A., Ahmed, S., Imtiaz, S., 2019.
Development of risk model for marine logistics support to offshore oil and gas operations
in remote and harsh environments, Ocean Engineering, 174.
https://doi.org/10.1016/j.oceaneng.2019.01.037.
Abstract
Logistics support to offshore operations is challenging, especially under severe
environmental conditions such as those in the Arctic and sub-Arctic. The dominant
environmental conditions, including waves, wind, poor visibility and the presence of
icebergs and sea ice determine the mode and success of logistics support. Use of
helicopters as a mode of logistics transport becomes ineffective when the distance is
longer, the visibility is low, or the weather is stormy. Marine logistics support is more
reliable and versatile. The present work focuses on developing a model for assessing risk
associated with marine logistics operations in remote offshore locations (beyond
helicopter reach) frequented with harsh environmental conditions. The key factors that
affect such operations are identified and failure models are developed. As an
improvement, advance fault trees are adopted to relax the inherent limitations of the
primary model. Uncertainties in both data and model are considered using the fuzzy
inference system and evidence theory. Application of the proposed model is demonstrated
through a case-study concerning a remote North Atlantic offshore operation. The
contribution of this study is the identification of the key factors and a robust risk model to
help developing innovative risk management strategies to support offshore operations.

25
Keywords: Logistics risk, offshore safety, fault tree analysis, fuzzy set theory, evidence
theory.
2.1 Introduction
Operations in harsh environmental conditions are challenging and pose significant risks to
people and infrastructures as well as to the environment. The Arctic and sub-Arctic
regions are considered to have the harshest environmental conditions in the world, due to
the presence of ice, extreme cold, high winds and unpredictable weather changes. Despite
the challenging conditions, these regions contain proven reserves of hydrocarbons and
mineral resources leading to increased interest of the oil and gas and the mining industries
(Tellier, 2008). The exploration and development of natural resources in these regions
present significant safety and integrity challenges, which are identified as the lack of
detail in construction and operation standards, restricted operating conditions due to
extreme weather including different ice features such as pack ice and icebergs,
remoteness, human factors and knowledge and data scarcity (Khan et al., 2014). The
stakeholders need an improved understanding of operational challenges to ensure safe
operations in such conditions.
A recent drilling project conducted by Statoil Canada Ltd. (Statoil) in the Flemish Pass
Basin is an example of distant offshore exploration in the harsh Arctic environment. The
Basin is located approximately 480 kilometres east of St. John’s, Newfoundland and
Labrador (Figure 2.1). This is the furthest offshore that Statoil has developed a project,
which adds to the cost and logistics challenges (Project Description Summary - Statoil

26
Canada Ltd., 2016). Additional fuel requirements to cover the long distance from shore
means less cargo capacity for vessels and helicopters. The long trip distance, poor
visibility due to the prevalent occurrence of marine fog, particularly in summer and
spring, and recurrent storms negatively affect the safety and effectiveness of using
helicopters for logistics operations (Jan-Erik, 2014). Therefore, marine vessels become
the only mode of transport in such conditions. However, the presence of icebergs (March
to July) and sea ice (winter and spring) may hamper timely vessel transit. In addition,
strong winds, snow and freezing rain raise difficulties for on-board vessel operations. A
formal risk assessment of marine logistics operations is required to consider these
additional threats so that vessels can perform routine supply as well as successful
emergency response.
The objective of this work is to develop a methodology for assessing risk and to identify
critical factors associated with marine logistics operations in remote and ice-covered
regions. The innovations in this work stem from: i) adapting an advance fault tree to
overcome the assumption of independence of faults, ii) considering a fuzzy inference
system to incorporate data uncertainty (vagueness and subjectivity), and iii) considering
evidence theory to integrate data from multiple sources and incomplete data. The
proposed unique model will help to analyze risk factors for marine logistics operations in
quantitative terms. This will also help in developing effective and efficient risk
management strategies.

27
Figure 2.1: Location of Statoil exploration drilling project in the Flemish Pass Basin
(Source: News/ June 10, 2016/Statoil Canada Limited)
The rest of this paper is organized as follows. Section 2.2 broadly describes the
methodology for risk analysis of marine logistics operations and an illustrated example is
presented in section 2.3. Section 2.4 discusses results and conclusions are provided in
section 2.5.
2.2 Methodology to Develop Logistics Risk Model
The aim of this work is to develop a basis for assessing risk for logistics operations in
harsh environments and to provide guidelines for safety measures to overcome associated

28
challenges. The framework for this study is illustrated in Figure 2.2. The possible factors
that may affect the successful operation at each stage of a logistics operation are
identified. A fault tree-based risk model is developed. This model is revised considering
interdependence of parameters. The risk model is subsequently integrated with fuzzy and
evidence theory to overcome the uncertainties of failure probability data. These steps are
elaborated in the following sections.
Figure 2.2: The proposed framework for marine logistics support risk modelling in harsh
environments

29
2.2.1 Logical modelling of marine logistics support
Identification of Main Contributing Factors
Logistics operations are conducted to transport personnel and to provide routine supplies
as well as emergency support to recover from hazardous incidents. The sequence of
activities involved in the process of an emergency logistics operation is presented in
Figure 2.3. This process consists of the following phases: departure readiness of a supply
vessel when an incident has been reported, an uninterrupted voyage, functionality of on-
board equipment, arrival at the site within the desired time limit and on-site operation. A
successful logistics operation will not be possible if any of these phases fails. The risk
factors that are involved in each phase of an operation are discussed in the following
paragraphs.
Figure 2.3: Logistics operation or emergency response (ER) process
30
Failure/delay due to departure readiness
The ship cannot depart for ER or logistics support if there is insufficient crew, a shortage
of fuel for the distance, lack of safety equipment, or engine problems. Working in cold
weather can endanger the crew unless proper preparations are made to equip the vessel
and the crew for operating in the cold, dark, and icy conditions. Failure due to improper
voyage plans has been addressed in detail by Kum and Sahin (2015). The vessel should
be equipped with the following safety features for safe operation:
Lifesaving appliances: Lifeboats should be enclosed, and specially designed to operate in
cold weather and turbulent water. Launching equipment should be designed to avoid the
effects of freezing ice. Immersion suits are necessary for crew survival. The reliability
information about lifesaving appliances is obtained from Bercha et al. (2003).
Firefighting equipment: Significant risks are associated with the use of firefighting
equipment in extremely low temperatures, the most significant being the potential
freezing of fluids in lines. Specific risks include:
- Freezing of firefighting equipment such as water hoses, piping, and nozzles.
- Portable fire extinguisher storage may be obstructed or frozen.
- Fire dampers may freeze in the stowage position.

31
Navigation equipment: Navigational equipment of a ship includes steering, hydraulic and
propulsion systems. Faulty equipment may result in departure failure (Antao et al., 2006).
A modern marine engine has a very complex structure that consists of many mechanical
components as well as a fuel system, lubricating system, cooling system, auxiliary system
and a control and safety system. The reliability features of a vessel engine were described
in detail by Laskowski (2015); Khorasani (2015).
Unobstructed voyage
The main factors that can disrupt the transit of a vessel are environmental factors (wind,
waves and ice), loss of hull integrity and operational, navigational or communication
failure.
Environmental factors: The northern regions have extreme climatic conditions that
include prolonged winters with sub-zero temperatures, the presence of different forms of
ice features and high wind and waves. Any precipitation in low temperatures results in
snow, freezing rain or ice pellets that can reduce visibility and cause the accretion of ice
on ships. Ice movement due to high wind and currents and presence of icebergs can
impose the risk of ship besetting incidents. The reported ice conditions on ice charts or
satellite imagery can change frequently, particularly the positions of the ice edge and the
location of leads through the pack ice (ABS, 2010).

32
Loss of hull integrity: Ship hull integrity failure may lead to an unsuccessful operation.
This failure can occur due to causes such as collision with an iceberg, human error or
operational failure.
Navigational and operational Failure: Navigational failure may occur for many reasons
that include radar failure, control error, propulsion system failure, human error, and
difficulties arising from prevailing weather conditions such as poor visibility.
Probabilistic assessment of a ship’s navigational failure was presented by Pietrzykowski
(2007); Amrozowicz et al. (1997). The operational safety features of vessels operating in
polar waters have been described in IMO (2010). The presence of various forms of ice
and harsh climatic conditions impose additional operational risk to vessels operating in
the Arctic and sub-Arctic regions. Navigational and operational failure probabilities were
presented in Afenyo et al., 2017.
Equipment functionality failure
The equipment may not be fully functional during the ER operation because of
mechanical failure, lack of maintenance or human error.
Human error: According to Senders & Moray (1991), human error is a result of
observable behaviour originating from psychological processes on different levels. It is
evaluated against some performance standards, initiated by an event in a situation where
it is possible to act in appropriate alternative ways. Human errors include three aspects:

33
- Evaluation of human behaviour against a performance standard or criterion.
- An event which results the measurable performance is not achieved; e.g. the expected
level is not met by the acting agent.
- A degree of volition such that the actor has the opportunity to act in a way that will
not be considered erroneous.
Promptness
The response time is very important for a successful operation. A complete operation
could be considered a failure if the vessel does not arrive on time.
On-board fire/emergency response failure
On-site weather conditions and humans also play important roles in this case. The on-
board operation may fail due to lack of manpower, absence of personal protective
equipment or obstruction of the hazard’s location.
Probabilistic Logistics Risk Model
A fault tree (FT) is a quantitative risk analysis tool; a system or component failure is
graphically presented as logical relationships with possible causes that can contribute to
the system or component failure (Andrews and Moss, 2002). A system failure is referred
to as a “top event” and all primary causes are defined as basic events, which are
connected by logic gates in the FT. Basic events have binary states, i.e., success/failure,
and are considered as mutually independent (Khakzad et al., 2011). There are several
logic gates; however, the AND-gate and OR-gate are mostly used in the FT. A fault tree
is adapted to its top event that includes only the most credible faults as assessed by the
analyst and may not represent all possible system failure causes (Vesely et al., 1981).

34
The emergency response process has been defined and the contributing factors are
identified in the previous sections; a simple FT model is developed and presented in parts
from Figures 2.4 to 2.7. The top event is emergency response (ER) failure, which is
connected by an OR-gate with vessel readiness, unobstructed voyage, functionality of
equipment, promptness and on-board operation, as failure of any of these events can
cause top event failure. These intermediate events are further broken down to lower
resolution events until primary causes are encountered. Promptness is considered as a
basic event that has not been developed further in this study. Some of the basic events,
e.g., human error or environmental causes, may affect different phases of the logistics
operation, which have been considered in the FT model.
After constructing a fault tree, its outcomes can be analyzed both quantitatively and
qualitatively. In quantitative analysis, the top event failure probability is calculated based
on the failure probabilities of the basic events using Boolean algebra (Crowl and Louvar,
2002). Quantitative results are used for identifying quantitative rankings of contributions
to system failure and the evaluation of model and data sensitivity (Vesely et al., 1981). In
this study, the top event probability is calculated using quantitative analysis and the
results are verified with the analysis conducted by the “Fault Tree +” software (Ferdous et
al., 2007). The sensitivity analysis is performed to identify the critical factors and is
presented in section 2.4. In qualitative analysis, minimal cut sets (MCS) are used for
identifying the critical events to guide the best possible ways of risk reduction measures

35
associated with the top event. A minimal cut set is a set of a minimum number of primary
events that produces the top event if and only if all the events of the set occur. Since all
the basic events in the primary FT model are connected by an OR-gate, failure of any
basic event can lead to the top event failure, which means the total number of MCS will
be equal to the number of basic events. Therefore, similar results can be obtained through
the MCS approach and are not presented here.
Figure 2.4: Fault Tree model for logistics support to an offshore facility in remote harsh
environment

36
Figure 2.5: Fault Tree model for unobstructed voyage failure
Figure 2.6: Fault Tree model for equipment functionality failure

37
Figure 2.7: Fault Tree model for on-site operational failure
2.2.2 Adaption of advanced probabilistic approach to develop risk model
Although fault tree analysis (FTA) is a useful risk assessment technique, it suffers from
some limitations such as the assumptions of mutually independent basic events and
exclusively binary states of events. In addition, the traditional FTA cannot incorporate
uncertainties in data. Several studies presented the fuzzy set theory (Mamood et al., 2013;
Lavasani et al., 2011; Ferdous et al., 2009, Pan and Yun, 1997; Tanaka et al., 1983), the
evidence theory (Ferdous et al., 2011; Limbourg et al., 2007), and the hybrid FTA (Lin

38
and Wang, 1997) to deal with data uncertainty in FTA. In this study, the two main
categories of uncertainty, namely, model uncertainty and data uncertainty, are considered.
The FT model is constructed based on several assumptions, which are summarized in
Table 2.1. The identified approaches that can be adapted to relax the assumptions are: (1)
use of the Inhibit gate to overcome independencies, and leaky AND/OR, noisy-OR/AND
logic to overcome the binary nature and (2) use of a Bayesian network (BN) – that
provides the flexibility of interdependence and addresses model/data uncertainty. In this
paper, a case study has been presented to show how the simplified OR-gate is replaced by
the Inhibit gate in the FT to address dependencies.
Table 2.1: Model assumptions in the traditional FT model and approaches to relax the
assumptions
Model Assumptions Approach to Relax Assumptions Reference
1
Traditional FT is static in nature and
does not handle uncertainty. It does
not offer the incorporation of newly
available probability information
into the model.
Bayesian network (BN) approach can
offer probability updating in the
analysis.
Khakzad et
al., 2011
2
It is assumed that all primary or
basic events are independent.
Dependencies among primary events
can be address by advanced logic gates
e.g. Inhibit gate, or BN approach.
Andrews
and Moss,
2002
3
Simplified OR-gates are used, which
means that failure of any primary
event will lead to a complete ER or
logistics operation failure. Under this
assumption, the failure probability
estimation would be very
conservative.
Inhibit gate or Noisy-OR gate may be
considered to relax this conservative
assumption.
Andrews
and Moss,
2002
Jensen and
Nielsen,
2007

39
Table 2.1: Model assumptions in the traditional FT model and approaches to relax the
assumptions (continued)
Model Assumptions Approach to Relax Assumptions Reference
4
All events are assumed to possess a
binary state (success/failure or
working/not working).
Probabilistic gates such as noisy gate
and gate with leak can be introduced
that give the flexibility to choose an
intermediate state of an event between
1 and 0 unlike AND/OR gates. In this
way, the estimation of top event
probability can be optimized.
Bobbio et
al., 2001
Abimbola,
M.O.,
2016
5
Environmental conditions such as
wind, wave, or ice conditions are
assumed to be independent and not
region and time specific. In reality,
these are significantly related. The
dynamics of sea ice is governed by
several driving forces such as wind,
waves, internal ice stress divergence,
Coriolis force, and sea surface tilt.
Inhibit gates may be considered in the
FT model to address dependencies or
conditional dependencies. Site specific
and seasonal probability data should be
used if available.
Coon et al.
(1974)
Sayed et
al. (2002)
6
Intermediate events (A1 – A5) are
placed in series to represent the
process. It is assumed that the failure
of any of these events will cause ER
failure.
These events could be non-sequential
and may have complex
interdependencies. For example,
dysfunctionality of marine equipment
may happen at any stage of this
operation which could affect timely
departure of the vessel, unobstructed
voyage and onboard operation. It may
need a different approach and
technique such as BN to develop the
model, which is out of scope of the
present study.
7
Promptness (A4): the response time
is a very important factor for the
success of logistics operations. A
complete operation could be
considered a failure if the vessel is
unable to arrive on time. In the FT
model, this event is considered as
two states: success or failure.
However, the model should be
developed so that it can be expressed
in time, which will determine if the
operation is either a failure or
success.
BN model with multistate variables for
response time during logistics
operation can be developed to address
this issue. Moreover, response time is
dependent on vessel specifications,
distance to the production facility,
regional weather conditions etc. These
factors are not considered in the
existing model. At this moment, it is
considered as an undeveloped event as
more detail analysis is required with
the support of relevant data and
suitable approach.
Sarshar et
al., 2013

40
Table 2.1: Model assumptions in the traditional FT model and approaches to relax the
assumptions (continued)
Model Assumptions Approach to Relax Assumptions Reference
8
Loss of hull integrity (A2.4) is
considered as an independent
primary event, which in fact depends
on many factors such as
environmental (wind, waves, current,
ice), operational failure etc.
Conditional dependencies among these
factors can be introduced using BN
approach.
9
Crew availability (A1.2) has two
states: yes/no.
It should be defined by two features:
(a) adequate numbers of crew and (b)
whether they are trained/ qualified for
the operation.
10
There are many factors that may lead
to engine issues (A1.4). However,
the details are not considered in this
study.
Engine failure may occur due to
several reasons and the corresponding
data of engine failures is not currently
available. This assumption can be
relaxed when more internal details of
design and operational characteristics
of marine engines become available.
11
The FT model has the limitation of
integrating subjective and imprecise
events such as human error in failure
logic model.
Fuzzy-based FTA or evidence-based
FTA approach can be adopted for
overcoming these limitations.
Mahmood
et al., 2013
Lin and
Wang,
1997
Ferdous et
al., 2009
12
During on-board operation, it is
assumed that all personnel are fit and
equally skilled to conduct the
operation.
Defined personnel states can be
characterised in the model using BN.
Initially, environmental conditions such as wind, wave and ice conditions are assumed to
be independent. However, incidents of sea ice and pack pressured ice occur when sea ice
fields converge due to local wind, wave, and current conditions, as well as boundary
conditions imposed by the local coastline geometry in near shore cases. These events can
have serious implications for marine transport operations in ice-prone environments, as
the ice fields impose extreme loads on vessels and structures, disrupt maneuverability and

41
endanger personnel safety. Therefore, the combined effects of wind, wave and ice
conditions should be considered in the study rather than treating those as separate
independent events. Inhibit gates have been introduced to represent their dependencies.
This study represents a scenario in which the ice conditions are dependent on the
additional conditional events, wind and wave conditions. More details about the Inhibit
gate are described by Andrews and Moss (2002). The modified FT has been presented in
Figures 2.8 to 2.10.
Figure 2.8: Modified Fault Tree model for marine logistics support in remote harsh
environment

42
Figure 2.9: Modified Fault Tree model for unobstructed voyage failure
Figure 2.10: Modified Fault Tree model for onsite operational failure

43
2.2.3 Data Uncertainty
Table 2.2 summarizes the data related assumptions that may result in uncertainty in risk
assessment. In the advance FTA, a fuzzy-based approach is adopted to the address
vagueness and subjectivity of failure probability data, and evidence theory is applied to
address incomplete and missing data as well as incorporating different experts’ opinion in
the analysis.
Table 2.2: Data assumptions in marine logistics risk analysis
Data Assumptions Approach to Relax Assumptions Reference
1
The failure probability
data used in this study is
for a specific period time.
Fuzzy theory can be employed to
address this type of data limitation.
2
For some events such as
site clearance, PPE etc.,
historical failure rate data
are not available. Hence,
failure rate is assumed
based on expert opinion.
Evidence theory can be introduced to
deal with this issue. In addition, this
approach enables the integration of
different expert opinions.
BN approach gives the flexibility to use
data elicitation from experts.
Lavasani et al., 2011
Ferdous et al., 2011

44
Vagueness and Subjectivity of Data
The theory of Fuzzy sets was first introduced by Zadeh (1965). It provides a unique way
to address vagueness and data uncertainty. In traditional FTA, system failure is evaluated
based on the exact value of failure probabilities of the basic events. However, it is
difficult to estimate a precise failure rate or the probability of components failure due to
lack of sufficient data or the vague character of the events (Mahmood et al., 2013).
Fuzzy-based approaches effectively deal with imprecision that arises due to
subjectivity/vagueness, which can be useful in risk assessment to handle these types of
uncertainties (Ferdous et al., 2009).
The fuzzy set of an event contains fuzzy numbers that have varying degrees of
membership function (μ) ranging from 0 to 1. The relationship between the event
probability and a membership function is represented by a fuzzy set. The degree of
membership of element x in the fuzzy set of an event p is mathematically represented as
(Ross, 2004):
μp(x) ∈ [0, 1]
Fuzzy numbers can be of any form; however, triangular or trapezoidal fuzzy numbers are
commonly used in reliability and risk assessments. A triangular fuzzy number (TFN) is
used in this study, where fuzzy intervals are determined by different 𝛼- cut values. Figure
45
2.11 illustrates a TFN and the fuzzy intervals are obtained using the following equation
2.1 (Ferdous et al., 2011; Pan and Yun, 1997):
pα = [pl + α(pm – pl), pu – α(pu – pm)] (2.1)
where pl, pm, and pu represent minimum, most likely, and upper values, respectively, in
the 𝛼- cut level.
Figure 2.11: Representation of triangular fuzzy number of an event
The fuzzy-based FTA involves the following steps: (1) Generation of fuzzy probabilities
of basic events TFN at various 𝛼- cut levels, (2) Estimation of fuzzified top event failure
probabilities based on Table 2.3, and (3) Defuzzification of top event failure probability
to a crisp value.

46
Table 2.3: Arithmetic expressions for fuzzy FTA
Gate type 𝛼- cut formulation
OR-gate 𝑝𝑙𝛼
= 1 − ∏ (1 − 𝑝𝑖𝑙𝛼𝑛
𝑖=1 ); 𝑝𝑢𝛼
= 1 − ∏ (1 − 𝑝𝑖𝑢𝛼𝑛
𝑖=1 )
AND-gate 𝑝𝑙𝛼
= ∏ 𝑝𝑖𝑙𝛼𝑛
𝑖=1 ; 𝑝𝑢𝛼
= ∏ 𝑝𝑖𝑢𝛼𝑛
𝑖=1
There are several methods for the defuzzification process, such as the centre of area
method, centre of maxima method, mean of maxima method, and weighted average
defuzzify method. For this problem, top event fuzzy failure probability sets are
defuzzified using the centre of maxima method (Klir and Yuan, 1995).
Incomplete Data and Conflict Between Expert Opinion
Evidence theory was first proposed by Dempster (1966) and later extended by Shafer
(1976), which is also known as the Dempster-Shafer Theory (DST). Missing data and
conflicting subjective data can be addressed by evidence theory. This helps in many
ways, such as integrating data from different sources, filling missing data sources,
resolving the issue of varying data for the same cause/event, and updating the probability
when new information becomes available.
According to DST, an event probability is defined with a set of lower and upper bound
values, which are denoted as belief and plausibility, respectively, and a mass is assigned
for the uncertainty or ignorance about that event. DST application on the FTA was

47
elaborately described by Ferdous et al. (2009 & 2011). The following steps are involved
in evidence-based FTA:
(1) Defining the frame of discernment (FOD). In this study, FOD Ω = {F, S},
where F and S indicate failure and success, respectively. The power set
includes four subsets: {Φ, {F}, {S}, {F, S}} and cardinality; |Ω| is two.
(2) Assigning basic probability and ignorance of each basic event based on
literature and expert opinions.
(3) Combining the individual beliefs of experts if there are more than one and
generating a joint belief structure.
(4) Estimating belief and bet of the basic events and the top events.
2.3 Application of the Proposed Model
In this study, the failure probabilities of each basic event are obtained either from the
literature or from expert opinions. The failure probabilities of the basic events and
corresponding data sources are provided in Table 2.4.

48
Table 2.4: Failure probabilities of basic events
Intermediate Event Basic Event Probability of
Failure Reference
Failure of departure
readiness (A1)
Fuel availability (A1.1) 3.97 × 10⁻⁴ Kum and Sahin (2015)
Crew availability (A1.2) 3.97 × 10⁻⁴ Kum and Sahin (2015)
Lifesaving appliances (A1.3.1) 1.00 × 10⁻³ Bercha et al. 2003
Firefighting equipment (A1.3.2) 3.97 × 10⁻⁴ Kum and Sahin (2015)
Navigation equipment (A1.3.3) 2.55 × 10⁻³ Antao et al. 2006
Engine issues (A1.4) 2.6 × 10⁻⁴ Kum and Sahin (2015)
Failure of
unobstructed voyage
(A2)
Wind conditions (A2.1) 6.00 × 10⁻³ Afenyo et al. 2017
Wave conditions (A2.2) 1.97 × 10⁻⁴ Kose et al. 1997
Sea ice (A2.3.1) 2.75 × 10⁻³ Kum and Sahin (2015)
Pressured ice (A2.3.2) 5.94 × 10⁻² Kum and Sahin (2015)
Iceberg (A2.3.3) 1.00 × 10⁻² Afenyo et al. 2017
Loss of hull integrity (A2.4) 1.33 × 10⁻⁴ Christou et al. 2012
Operational system failure (A2.5.1) 1.00 × 10⁻⁴ Afenyo et al. 2017
Navigational failure (A2.5.2) 2.00 × 10⁻⁶ Afenyo et al. 2017
Communication failure (A2.5.3) 5.50 × 10⁻⁴ Afenyo et al. 2017
Equipment
functionality failure
(A3)
Human error (A3.1) 3.00 × 10⁻⁴ Afenyo et al. 2017
Maintenance failure (A3.2) 1.00 × 10⁻⁴ Expert opinion
Mechanical failure (A3.3) 1.00 × 10⁻⁵ Afenyo et al. 2017
Safety equipment maintenance
(A3.4) 1.00 × 10⁻³ Expert opinion
Promptness (A4) Promptness (A4) --- Undeveloped
On-board
fire/emergency
response failure
(A5)
Wind conditions (A5.1.1) 6.00 × 10⁻³ Afenyo et al. 2017
Wave conditions (A5.1.2) 1.97 × 10⁻⁴ Kose et al. 1997
Marine icing (A5.1.3) 1.50 × 10⁻⁴ Expert opinion
Human error (miscommunication)
(A5.2.1) 1.00 × 10⁻⁴ Afenyo et al. 2017
Mechanical failure (A5.2.2.1) 5.46 × 10⁻² Bercha et al. 2003
Software/control system failure
(A5.2.2.2) 4.00 × 10⁻⁴ Afenyo et al. 2017
PPE (A5.3) 5.00 × 10⁻³ Expert opinion
Manpower (A5.4) 1.00 × 10⁻² Expert opinion
Site Clearance (A5.5) 1.00 × 10⁻³ Expert opinion
The top event failure probability is estimated for both the traditional and advanced fault
tree models and presented in Table 2.10. The failure probability calculated by traditional

49
FTA is 0.1534, which can be interpreted as indicating that the chance of emergency
response (ER) failure is about 1 in every 7 operations. This seems very conservative. In
contrast, the estimated failure probability decreases to nearly half, which means the
chance of failure becomes 1 in every 13 operations when the Inhibit gates are used. An
Inhibit gate logically represents an AND-gate with an external conditional event.
Therefore, the replacement of OR-gates with Inhibit gates considerably reduces the top
event failure probability. Probability data related to the exact type of scenarios are not
publicly available. However, based on Lloyd’s worldwide data for 1994-97, the failure
rate of cargo ships is 3.1 × 10⁻⁴ each year, which gives the probability of failure as 1 in 18
voyages, assuming two days per voyage (IAEA report, 2001).
2.3.1 Application of fuzzy theory
In this study, a triangular fuzzy approach is adopted, where failure probabilities collected
from the literature are considered as the most likely values of basic events. Reasonable
lower and upper boundaries have been set to form the fuzzy triangle for each event. The
projected failure probabilities of basic events are obtained from the corresponding fuzzy
triangles for different α - cut levels. An example is provided in Table 2.5, where the
confidence interval is chosen as 95% (α=0.95).

50
Table 2.5: Triangular Fuzzy Number at α=0.95
Triangular Fuzzy Number (TFN)
95% Confidence
(α=0.95)
Basic Event
Fuzzy
Number
"around"
Minimum
Value (Pl)
Most
Likely
Value
(Pm)
Maximum
Value (Pu)
Minimum
Value (Pl)
Maximum
Value (Pu)
Fuel availability (A1.1) 3.97E-04 1.99E-04 3.97E-04 7.94E-04 3.87E-04 4.17E-04
Crew availability (A1.2) 3.97E-04 1.99E-04 3.97E-04 7.94E-04 3.87E-04 4.17E-04
Lifesaving appliances (A1.3.1) 1.00E-03 5.00E-04 1.00E-03 2.00E-03 9.75E-04 1.05E-03
Firefighting equipment (A1.3.2) 3.97E-04 1.99E-04 3.97E-04 7.94E-04 3.87E-04 4.17E-04
Navigation equipment (A1.3.3) 2.55E-03 1.28E-03 2.55E-03 5.10E-03 2.49E-03 2.68E-03
Engine issues (A1.4) 2.60E-04 1.30E-04 2.60E-04 5.20E-04 2.54E-04 2.73E-04
Wind conditions (A2.1) 6.00E-03 3.00E-03 6.00E-03 1.20E-02 5.85E-03 6.30E-03
Wave conditions (A2.2) 1.97E-04 9.85E-05 1.97E-04 3.94E-04 1.92E-04 2.07E-04
Sea ice (A2.3.1) 2.75E-03 1.38E-03 2.75E-03 5.50E-03 2.68E-03 2.89E-03
Pressured ice (A2.3.2) 5.94E-02 2.97E-02 5.94E-02 1.19E-01 5.79E-02 6.24E-02
Iceberg (A2.3.3) 1.00E-02 5.00E-03 1.00E-02 2.00E-02 9.75E-03 1.05E-02
Loss of hull integrity (A2.4) 1.33E-04 6.65E-05 1.33E-04 2.66E-04 1.30E-04 1.40E-04
Operational system failure (A2.5.1) 1.00E-04 5.00E-05 1.00E-04 2.00E-04 9.75E-05 1.05E-04
Navigational failure (A2.5.2) 2.00E-06 1.00E-06 2.00E-06 4.00E-06 1.95E-06 2.10E-06
Communication failure (A2.5.3) 5.50E-04 2.75E-04 5.50E-04 1.10E-03 5.36E-04 5.78E-04
Human error (A3.1) 3.00E-04 1.50E-04 3.00E-04 6.00E-04 2.93E-04 3.15E-04
Maintenance failure (A3.2) 1.00E-04 5.00E-05 1.00E-04 2.00E-04 9.75E-05 1.05E-04
Mechanical failure (A3.3) 1.00E-05 5.00E-06 1.00E-05 2.00E-05 9.75E-06 1.05E-05
Safety equipment maintenance (A3.4) 1.00E-03 5.00E-04 1.00E-03 2.00E-03 9.75E-04 1.05E-03
Promptness (A4) --- --- --- --- --- ---
Wind conditions (A5.1.1) 6.00E-03 3.00E-03 6.00E-03 1.20E-02 5.85E-03 6.30E-03
Wave conditions (A5.1.2) 1.97E-04 9.85E-05 1.97E-04 3.94E-04 1.92E-04 2.07E-04
Marine icing (A5.1.3) 1.50E-04 7.50E-05 1.50E-04 3.00E-04 1.46E-04 1.58E-04
Human error (miscommunication)
(A5.2.1) 1.00E-04 5.00E-05 1.00E-04 2.00E-04 9.75E-05 1.05E-04
Mechanical failure (A5.2.2.1) 5.46E-02 2.73E-02 5.46E-02 1.09E-01 5.32E-02 5.73E-02
Software/control system failure
(A5.2.2.2) 4.00E-04 2.00E-04 4.00E-04 8.00E-04 3.90E-04 4.20E-04
PPE (A5.3) 5.00E-03 2.50E-03 5.00E-03 1.00E-02 4.88E-03 5.25E-03
Manpower (A5.4) 1.00E-02 5.00E-03 1.00E-02 2.00E-02 9.75E-03 1.05E-02
Site Clearance (A5.5) 1.00E-03 5.00E-04 1.00E-03 2.00E-03 9.75E-04 1.05E-03
Top Event Failure Probability 0.0749 0.0806

51
Fuzzified top event failure probabilities are estimated for each confidence interval and
then defuzzified to crisp probability using the centre of maxima method. A comparison of
the results is presented in Table 2.6.
Table 2.6: Error robustness of fuzzy approach
Considered Error in Data Crisp Value Deviation in Percentage
5% 0.0778 1.24
10% 0.0787 2.41
15% 0.0796 3.65
No Error 0.0768 0
2.3.2 Application of evidence theory
Evidence theory is used to consider incomplete data and integration of data from multiple
sources. To illustrate the application of the theory to the proposed model, data from two
different experts are used. Both experts have doctoral degrees, have conducted several
offshore safety related projects and have more than five years of experience in the
relevant area. The data from these two experts are provided in Table 2.7.

52
Table 2.7: Basic probability assignments
Basic Event
Expert 1 Expert 2
Failure
{F}
Success
{S} {SF}
Failure
{F} Success {S} {SF}
Fuel availability (A1.1) 3.61E-04 9.31E-01 0.069 4.37E-04 9.93E-01 0.0069
Crew availability (A1.2) 3.61E-04 9.31E-01 0.069 5.96E-04 9.93E-01 0.0069
Lifesaving appliances (A1.3.1) 9.09E-04 9.24E-01 0.075 1.50E-03 9.91E-01 0.0075
Firefighting equipment (A1.3.2) 3.61E-04 9.31E-01 0.069 5.96E-04 9.93E-01 0.0069
Navigation equipment (A1.3.3) 2.32E-03 9.28E-01 0.07 3.83E-03 9.89E-01 0.007
Engine issues (A1.4) 2.36E-04 9.30E-01 0.07 3.90E-04 9.93E-01 0.007
Wind conditions (A2.1) 5.45E-03 9.20E-01 0.075 9.00E-03 9.84E-01 0.0075
Wave conditions (A2.2) 1.79E-04 9.25E-01 0.075 2.96E-04 9.92E-01 0.0075
Sea ice (A2.3.1) 2.50E-03 9.23E-01 0.075 4.13E-03 9.88E-01 0.0075
Pressured ice (A2.3.2) 5.40E-02 8.71E-01 0.075 8.91E-02 9.03E-01 0.0075
Iceberg (A2.3.3) 9.09E-03 9.21E-01 0.07 1.50E-02 9.78E-01 0.007
Loss of hull integrity (A2.4) 1.21E-04 9.35E-01 0.065 2.00E-04 9.93E-01 0.0065
Operational system failure (A2.5.1) 9.09E-05 9.30E-01 0.07 1.50E-04 9.93E-01 0.007
Navigational failure (A2.5.2) 1.82E-06 9.32E-01 0.068 3.00E-06 9.93E-01 0.0068
Communication failure (A2.5.3) 5.00E-04 9.32E-01 0.068 8.25E-04 9.92E-01 0.0068
Human error (A3.1) 2.73E-04 9.25E-01 0.075 4.50E-04 9.92E-01 0.0075
Maintenance failure (A3.2) 9.09E-05 9.30E-01 0.07 1.50E-04 9.93E-01 0.007
Mechanical failure (A3.3) 9.09E-06 9.25E-01 0.075 1.50E-05 9.92E-01 0.0075
Safety equipment maintenance
(A3.4) 9.09E-04 9.29E-01 0.07 1.50E-03 9.92E-01 0.007
Promptness (A4) 0.00E+00 9.30E-01 0.07 0.00E+00 9.93E-01 0.007
Wind conditions (A5.1.1) 5.45E-03 9.20E-01 0.075 9.00E-03 9.84E-01 0.0075
Wave conditions (A5.1.2) 1.79E-04 9.25E-01 0.075 2.96E-04 9.92E-01 0.0075
Marine icing (A5.1.3) 1.36E-04 9.25E-01 0.075 2.25E-04 9.92E-01 0.0075
Human error (miscommunication)
(A5.2.1) 9.09E-05 9.25E-01 0.075 1.50E-04 9.92E-01 0.0075
Mechanical failure (A5.2.2.1) 4.96E-02 8.75E-01 0.075 8.19E-02 9.11E-01 0.0075
Software/control system failure
(A5.2.2.2) 3.64E-04 9.30E-01 0.07 6.00E-04 9.92E-01 0.007
PPE (A5.3) 4.55E-03 9.30E-01 0.065 7.50E-03 9.86E-01 0.0065
Manpower (A5.4) 9.09E-03 9.23E-01 0.068 1.50E-02 9.78E-01 0.0068
Site Clearance (A5.5) 9.09E-04 9.34E-01 0.065 1.50E-03 9.92E-01 0.0065

53
Two different sets of data have been used to formulate evidence theory in the FTA, which
are combined using both DST and Yager rules. The combination rules are described in
Ferdous et al., 2011; Smarandache and Dezert, 2004; Yager, 1987. A sample calculation
is presented in Table 2.8.
Table 2.8: Combination of beliefs
Fuel availability (A1.1)
F = Failure S = Success FS
3.61E-04 3.61E-04 6.90E-02
F 4.37E-04 1.58E-07 1.58E-07 3.01E-05
S 9.93E-01 3.58E-04 3.58E-04 6.85E-02
FS 6.90E-03 2.49E-06 2.49E-06 4.76E-04
k 3.58E-04
3.28E-05 6.89E-02 4.76E-04
DS
3.28E-05 6.89E-02 4.76E-04
Yager
3.28E-05 6.89E-02 8.35E-04
Bel (F) Pl (F) Bel (S) Pl (S)
DS 3.28E-05 5.09E-04 6.89E-02 6.94E-02
Yager 3.28E-05 8.67E-04 6.89E-02 6.97E-02
Three important characteristics, namely, belief, plausible value and Bet of the top event
are calculated and presented in Table 2.9.

54
Table 2.9: Belief structures and "Bet" estimation of the top event
Belief structures and "Bet"
DS rule Yager rule
Bel Pl Bet Bel Pl Bet
0.0203 0.1221 0.0712 0.0132 0.1814 0.0973
2.4 Discussion
The failure probability of logistics operations is estimated using traditional FTA,
advanced fuzzy-based FTA and evidence-theory-based FTA. The summary of results is
provided in Table 2.10.
Table 2.10: Top event failure probability based on different approach
Traditional FTA Advanced FTA
Fuzzy-based FTA Evidence-theory-based FTA
with 10% uncertainty DS rule Yager rule
0.1534 0.0768 0.0787 0.0712 0.0973
The traditional FTA gives significantly higher failure probability, as the construction of
the FT model is overly simplified with OR-gates only, where factor dependencies and
data uncertainties are not considered. In the advanced FTA, a non-traditional gate such as
the Inhibit gate is introduced, which provides a less conservative probability estimate.
The use of fuzzy theory in the advanced FTA offers a better decision-making approach
when there is imitated data. The estimated failure probability using evidence theory

55
seems relatively high. The outcome mainly depends on how the ignorance of probability
data is set by different experts, based on the expert’s knowledge. Also, evidence theory
has the advantage that multi-source data can be integrated with the analysis and the model
can be updated in the light of new information.
The analysis presented in this study demonstrated the effectiveness of the proposed
framework to assess risk in logistics operations. It is therefore important to rank the
critical factors, where preference should be given to improving the reliability of the
operations. The improvement indices are used to identify the most critical basic events
that lead to operational failure. The improvement index of an event is calculated by
eliminating this event from the fault tree, to measure the reduction of the magnitude of
top event failure probability (Ferdous et al., 2009; Tanaka et al., 1983; Misra and Weber,
1990). The following equation 2.2 is used to evaluate this index:
FIM(PT, PTi) = (Pil(T) − Pil(Ti )) + (Piu(T) − Piu(Ti )) (2.2)
where PT and PTi refer to top event failure probability without and with an eliminated
basic event, respectively. Subscripts l and u indicate the lower and upper bound of fuzzy
numbers.
The high ratio of improvement indices and ER failure probability of the basic events are
plotted in Figure 2.12. This shows that mechanical failure, lack of skilled and experienced

56
manpower, absence of suitable personal protective equipment, failure of navigation
equipment and inadequate or missing lifesaving appliances are the most contributory
factors that lead to ER failure. Mechanical failure includes a broad range of equipment
failure during an on-board operation and the failure probability is significantly influenced
by the weather conditions (Bercha, 2003). The correlations among mechanical failure,
human error and existing environmental conditions are not considered in the FTA.
Detailed investigation is required to improve the reliability assessment, which could be an
area of future work.
Figure 2.12: Ratio of Improvement Index and ER failure probability of basic events (See
Table 2.4 for legends)

57
2.5 Conclusions
This paper presents a risk model to analyze operational challenges of marine logistics
support in harsh environmental conditions. The objective of this study is to identify the
critical factors that will provide guidance to identify risk reduction measures to achieve a
safer and faster approach in responding to this type of operation. For example, one such
measure is the temporary offshore refuge, which needs to be further investigated. This
work provides a basis for developing solutions to emergency marine logistics problems in
remote and harsh regions.
Fault trees are used as a tool to develop the risk model. Application of the proposed FT
model is demonstrated by studying an emergency response scenario. Although the fault
tree is a common technique for assessing operational performance and reliability of a
system, the traditional fault tree suffers from several limitations. Addressing
interdependencies of events, adapting to new information and knowledge and handling
uncertainties are of fundamental importance for a robust risk model. This study addresses
these points through:
(1) Consideration of interdependencies of events in the fault tree model through non-
traditional gates such as the Inhibit gate.
(2) Consideration of data uncertainty in the earlier belief or data, which is important, as
often, precise data for such analysis are not available. The fuzzy-based FTA approach

58
helps to enhance robustness of the analysis in the presence of vague and subjective
data.
(3) Consideration of missing data and conflicting subjective data using evidence theory.
This consideration helps to integrate data from different sources, overcome a missing
data problem, resolve the issue when there is varying data for the same event and
update the probability.
The sensitivity analysis results reveal that the most critical phase of this process is
conducting a successful on-board operation after reaching the target location. The main
challenges include, but are not limited to, mechanical failure that comprises malfunction
of lifeboats, failure to launch, inability to reach the installation due to severe ice
conditions etc., and lack of trained and experienced personnel to conduct the operation in
such harsh environmental conditions. The study presents a generic model, which may be
used to conduct a marine logistics risk assessment and support an operation in a harsh
offshore environment. The proposed model can be modified based on region-specific
features and analysis should be performed using suitable probability data available for
that region. Feedback from two experts with similar education and experience levels are
considered in this study. More data from experts with diverse backgrounds such as
academicians, ships’ captains, and other offshore personnel can be incorporated when
available. A weighting factor can be introduced based on the profession and experience of
the experts. In addition, further investigation is required to develop “Promptness”.
Additional data and a different approach, i.e. a model that can define failure as a function

59
of response time, can be proposed as future work. The use of the advance FTA is a useful
tool to model risk for ER processes, although an alternative modelling approach, namely,
the BN, has a more flexible structure than the fault tree and offers better representation of
interdependencies and uncertainty handling capacity. Therefore, BN modelling of the ER
operation could be a promising future study.
References
Abimbola, M.O., 2016, Dynamic Safety Analysis of Managed Pressure Drilling
Operations, PhD thesis, Memorial University of Newfoundland.
Afenyo, M., Khan, F., Veitch, B., & Yang, M. (2017). Arctic shipping accident scenario
analysis using Bayesian Network approach. Ocean Engineering, 133, 224–230.
http://doi.org/10.1016/j.oceaneng. 2017.02.002.
American Bureau of Shipping (ABS), 2010, Guide for vessels operating in low
temperature environments.
Amrozowicz, M., Brown, A.J., Golay, M., 1997. Probabilistic analysis of tanker
groundings. International Offshore and Polar Engineering Conference. Honolulu,
Hawaii.
Andrews, J.D. and Moss, T.R., 2002, Reliability and Risk Assessment, Publisher: Wiley-
Blackwell.
Antao, P. and Soares, C.G., 2006. Fault-tree Models of Accident Scenarios of RoPax
Vessels. International Journal of Automation and Computing 2 (2006) 107-116.
Bercha, F.G., 2003. Escape, Evacuation, and Rescue Research Project Phase II.

60
Bercha, F.G., Brooks, C.J., and Leafloor, F., 2003. Human Performance in Arctic
Offshore Escape, Evacuation, and Rescue.
Bobbioa, A., Portinalea, L., Minichinob, M., and Ciancamerlab, E., 2001, Improving the
analysis of dependable systems by mapping fault trees into Bayesian networks,
Reliability Engineering and System Safety 71 (2001) 249–260.
Christou, M. and Konstantinidou, M., 2012. Safety of offshore oil and gas operations:
Lessons from past accident analysis, JRC Scientific and Policy reports.
Coon, M. D., G. A. Maykut, R. S. Pritchard, D. A. Rothrock, and A. S. Thorndike. 1974.
Modeling the pack ice as an elastic-plastic material. AIDJEX Bulletin, 24, H05.
Crowl, D.A., and Louvar, J.F., 2002. Chemical Process Safety: Fundamentals with
Applications, Prentice Hall Publication Inc., 601 pages.
Dempster, A.P., 1966, New Methods for Reasoning Towards Posterior Distributions
Based on Sample Data, The Annals of Mathematical Statistics, Volume 37, Number 2
(1966), 355-374.
Ercan Kose, E. Dincer, A.C., and Durukanoglu, H.F., 1997. Risk Assessment of Fishing
Vessels. Tr. J. of Engineering and Environmental Science, 22 (1998), 417 - 428
Ferdous R, Khan F, Sadiq R, Amyotte PR, Veitch B, 2011, Fault and event tree analyses
for process systems risk analysis: uncertainty handling formulations, Risk Analysis,
Vol. 31, No. 1.
Ferdous R, Khan F, Veitch B, Amyotte PR., 2009, Methodology for computer aided
fuzzy fault tree analysis. Process Safety and Environmental Protection, 87(4):217–
226.

61
Ferdous R, Khan F, Veitch B, Amyotte PR., 2007, Methodology for computer-aided fault
tree analysis, DOI: 10.1205/psep06002.
International Atomic Energy Agency (IAEA) report, July 2001, Severity, probability and
risk of accidents during maritime transport of radioactive material, Vienna, ISSN
1011–4289.
International Maritime Organization (IMO), 2010, MSC/Circ.1056–MEPC/Circ.399.
Jensen, F. V. & Nielsen, T. D., 2007. Bayesian Networks and Decision Graphs. New
York: Springer.
Khakzad, N., Khan F, and Amyotte, P., 2011, Safety analysis in process facilities:
Comparison of fault tree and Bayesian network approaches. Journal of Reliability
Engineering and System Safety 96 (2011) 925–932.
Khan, F., Ahmed, S., Yang, M., Hashemi, S. J., Caines, S., Rathnayaka, S. and Oldford,
D. (2014), Safety challenges in harsh environments: Lessons learned. Proc. Safety
Prog., 34: 191–195. doi:10.1002/prs.11704.
Khorasani, V.R., 2015. Risk assessment of diesel engine failure in a dynamic positioning
system. Masters thesis, University of Stavanger, Norway.
Klir GJ, Yuan B. Fuzzy Sets and Fuzzy Logic: Theory and Applications, 1st ed. Upper
Saddle River, NJ: Prentice Hall PTR, 1995.
Kum, S. and Sahin, B., 2015. A root cause analysis for Arctic Marine accidents from
1993 to 2011. Safety Science, Volume 74, Pages 206-220.
Limbourg, P., Savic´, R., Petersen, J. and Kochs, H-D, 2008, Modelling uncertainty in
fault tree analyses using evidence theory, Proceedings of the Institution of Mechanical

62
Engineers, Part O: Journal of Risk and Reliability, Volume: 222 issue: 3, page(s):
291-302.
Lin, Ching-Torng and Wang, Mao-Jiun J., 1997, Hybrid fault tree analysis using fuzzy
sets, Reliability Engineering and System Safety 58 (1997) 205-213.
Laskowski, R., 2015, Fault Tree Analysis as a tool for modelling the marine main engine
reliability structure, Scientific Journals of the Maritime University of Szczecin, 2015,
41 (113), 71–77.
Lavasani, M. R. Miri, Wang, J., Yang, Z., and Finlay, J., 2011, Application of Fuzzy
Fault Tree Analysis on Oil and Gas Offshore Pipelines, Int. J. Mar. Sci. Eng., 1(1),
29-42.
Misra, B.K. and Weber, G.G., 1990, Use of fuzzy set theory for level-1 studies in
probabilistic risk assessment. Fuzzy Sets and Systems, 37: 139–160.
Pan, H. and Yun, Y.W., 1997, Fault tree analysis with fuzzy gates. Computers Industrial
Engineering, 33(3–4): 569–572.
Parvaneh Sarshar, Jaziar Radianti, Ole-Christoffer Granmo, and Jose J. Gonzalez, 2013,
A Bayesian Network Model for Evacuation Time Analysis during a Ship Fire, IEEE.
Pietrzykowski, Z., 2007, Assessment of Navigational Safety in Vessel Traffic in an Open
Area, International Journal on Marine Navigation and Safety of Sea Transportation,
vol. 1, no. 1, March 2007.
Project Description Summary - Statoil Canada Ltd., 2016.
Ross T. Fuzzy Logic with Engineering Applications, 2nd ed. West Sussex, UK: John
Wiley & Sons, 2004.

63
Sayed, M., Carrieres, T., Tran, H. and Savage, S.B. (2002). “Development of an
operational ice dynamics model for the Canadian Ice Service,” Proc. Int. Offshore and
Polar Eng. Conf., ISOPE, Kitakyushu, Japan, May 26-31, pp. 841-848.
Senders J.W. and Moray N.P. (1991), “Human error: cause, prediction, and reduction”,
Hillsdale, New Jersey, Lawrence Erlbaum Associates.
Shafer, G., A Mathematical Theory of Evidence. Princeton University Press, 1976.
Smarandache F, Dezert J. Proportional conflict redistribution rules for information fusion.
P. 461 in Applications and Advances of DSmT for Information Fusion, vol. 2.
Rehoboth, MA: American Research Press, 2004.
Tanaka, H., Fan, T.L., Lai, F.S. and Toughi, K., 1983, Fault tree analysis by fuzzy
probability. IEEE Transactions on Reliability, 32(5): 455–457.
Tellier, Frédéric Beauregard, 2008, The Arctic: Hydrocarbon Resources, Parliament of
Canada publication, PRB 08-07E.
Vesely WE, Goldberg FF, Roberts NH, Haasl DF. Fault Tree Handbook. Washington,
DC: U.S. Nuclear Regulatory Commission, 1981.
Vinnem, Jan-Erik, 2014. Offshore Risk Assessment vol 1. Principles, Modelling and
Applications of QRA Studies.
https://www.statoil.com/en/news/efficient-exploration-offshore-newfoundland.html, June,
2016.
Y. A. Mahmood, A. Ahmadi, A. K. Verma, A. Srividya, and U. Kumar, 2013, Fuzzy fault
tree analysis: a review of concept and application, Int J Syst Assur Eng Manag (Jan-
Mar 2013) 4(1):19–32.

64
Yager RR. On the Dempster-Shafer framework and new combination rules. Information
Science, 1987; 41(2):93–137.
Zadeh, L. (1965). ‘‘Fuzzy sets,’’ Inf. Control, vol. 8, pp. 338–353.

65
3. A Conditional Dependence-based Marine Logistics Support Risk
Model
Md Samsur Rahman, Faisal Khan, Arifusalam Shaikh, Salim Ahmed, and Syed Imtiaz
Centre for Risk, Integrity and Safety Engineering (C-RISE)
Faculty of Engineering & Applied Science
Memorial University, St John’s, NL, Canada A1B 3X5
Co-authorship statement
A version of this manuscript has been published in the Journal of Reliability Engineering
and System Safety. The lead author Md Samsur Rahman performed the literature review,
developed the Bayesian network model for offshore logistics support failure, collected
conditional probability data and integrated this data into the model, performed the model
analysis, generated the results, and prepared the draft of the manuscript. The co-author
Faisal Khan supervised and helped in developing and testing the BN risk model, reviewed
and corrected the models and results, and contributed in preparing, reviewing and revising
the manuscript. Arifusalam Shaikh, Salim Ahmed and Syed Imtiaz reviewed and
provided feedback on the manuscript. Md Samsur Rahman revised the manuscript based
on the co-authors’ feedback and during the peer review process.
Reference: Rahman, Rahman, M.S., Khan, F., Shaikh, A., Ahmed, S., Imtiaz, S., 2020. A
conditional dependence-based marine logistics support risk model, Reliability
Engineering & System Safety, 193. https://doi.org/10.1016/j.ress.2019.106623.
66
Abstract
Industries and researchers have renewed interest in the Arctic as well as the sub-Arctic
regions due to the proven hydrocarbon reserves. The main challenges of operations in
these regions arise due to their remoteness and extreme weather conditions. These
conditions also put major challenges to plan emergency logistics support, which is
currently offered either by helicopters or marine vessels. This paper analyzes the risk-
based marine logistics support model in an offshore facility operating in the far northern
(sub-arctic) region. A Bayesian network (BN) approach is used to develop the risk model
considering interdependencies and conditional relationships among the contributing
factors. Exploration in the Flemish pass basin located offshore Newfoundland and
Labrador, Canada, is selected as a case study to demonstrate the methodology. The study
identifies the critical elements of a marine logistics operation that need attention to reduce
its associated risk. The corresponding safety measures are identified and implemented
into the risk model. Appropriate risk management strategies are proposed to support
marine logistics operations.
Keywords: Marine logistics, offshore risk management, fault tree, Bayesian network.
3.1 Methodology to Develop Logistics Risk Model
Harsh environments represent extreme weather conditions, which are not favorable for
human, infrastructure and habitat (Khan et al., 2014a). The northern frontiers have the
harshest environmental conditions with the presence of various ice features, extreme cold
temperature, freezing rain, high wind and wave, and marine fog (Walsh, 2008; Arctic
Marine Shipping Assessment, 2009). The exploration and development of natural

67
resources in these regions face significant safety and integrity challenges, which are
identified as the lack of details in construction and operation standards, restricted
operating conditions, presence of different ice features such as pack ice and icebergs,
remoteness, human factors, and knowledge and data scarcity (Khan et al., 2014b). There
are several standards and practices such as ABS 2010, ISO 19906:2010, NORSOK S-002,
Barents 2020 available for the operation in harsh environments. However, there is a lack
of design and operational guidelines for further north that must consider the additional
distance and more extreme environmental conditions (Hamilton, 2011; Meling, 2013).
The planning and procedure for logistics supply and support during emergency is an
important area of research to ensure safe operation, which is the focus of this study. There
is a need to assess the risk, improve understanding and knowledge as well as develop new
strategies and technologies prior to launching operations in these regions (Milaković et
al., 2014; Malykhanov and Chernenko, 2015; Borch, 2018; Uthaug, 2018).
Logistics for offshore operations are provided by supply vessels and helicopters. In
general, marine vessels are used for transporting materials and supplies from an onshore
supply base to support offshore exploration activities. Helicopters are used to transport
personnel and light cargo to and from offshore platforms. Besides the routine logistics for
supply, the role of emergency response (ER) is to support emergency evacuation when
the platform needs to be abandoned. In addition, the ER team needs to reach the platform
to restore its production during a disturbance or perturbation. Prompt response is required
to enhance the resilience of an offshore system and minimize the severity of an accident,

68
which can be critical due to the distance and environments. Faster response can be
provided by helicopter than support vessel, however the use of helicopter is limited when
the distance is too long, and subject to weather conditions. Also, it cannot be used if the
platform itself is sinking or any situation that is not safe for the helicopter to land or
winch. The accident rates in the offshore helicopter industry are still at least one order of
magnitude greater than those of commercial fixed-wing operations (Oil & Gas UK, 2017;
OGP, 2010). The crash of a helicopter is almost always considered as a very serious event
- often leading to fatalities and serious economic loss (Sutton, 2014; Okstad et al., 2012;
Olsen and Lindøe, 2009; Hokstad et al., 2001; Vinnem, 2011, 2010). Baker et al. (2011)
published an article about helicopter crashes related to oil and gas operations in the Gulf
of Mexico, where an average of 6.6 crashes occurred per year during 1983 – 2009 and
resulted in a total of 139 fatalities. During that period, bad weather led to a total of 29
crashes, which accounted to 40% of the 139 deaths. According to the Civil Aviation
Authority and Oil & Gas UK records, there were 73 UK Continental Shelf offshore
commercial air transport (CAT) accidents reported from 1976 to 2013 in which a total of
119 fatalities occurred. 11% of these accidents occurred due to external factors such as
icing, turbulence, wind shear, thunderstorm or bird strike. These problems are particularly
acute at night, when the accident rates are considerably higher than that in the daytime.
Knowledge of the hazards and risks associated with such accidents is very limited (Ross
and Gibb, 2008). This is aggravated by the expected increase in nighttime offshore
helicopter activities associated with, for example, the beginning of the exploration of oil
and gas in polar regions (Nascimento, 2014). Marine vessel becomes the only mode for

69
transporting logistics if these circumstances are considered. The feasibility of marine
logistics operation in the remote harsh environment is not well-understood and needs to
be further studied (Khan et al., 2014a, 2014b).
In a previous work (Rahman et al., 2019), a failure model of marine logistics operation
was developed using the fault tree where the inherent limitations of the model and
available data were identified. An attempt has been made to address the model limitations
using advanced fault tree analysis using unconventional logical gates. Researchers have
adopted the fuzzy theory and the evidence theory to address the data limitations (Zadeh,
1965; Ferdous et al., 2009, 2011; Klir and Yuan, 2001; Yager, 1987). The current work
presents a Bayesian approach to address model dependencies. Although fault tree is
useful for initial stage of model development, the Bayesian approach benefits from
several advantages over fault tree (Bobbio et al., 2001; Simon et al., 2007). BN has a
more flexible framework that can address conditional dependencies among the
contributing factors. It allows backward analysis and probability updating which means
the updated information can be incorporated to the model (Boudali, 2005; Weber, 2010).
This feature helps to make the model dynamic and more realistic (Khakzad et al., 2011,
Yuan et al., 2015). Detail discussion about this is presented in the methodology. The goal
of this work is to establish risk management strategies for marine logistics operation,
which is an extension of the previous work.

70
The rest of this paper is organized as follows. Section 3.2 broadly describes the
methodology for risk management of marine logistics operations. A case study is
presented in section 3.3. Section 3.4 discusses the possible safety measures to reduce risk
and their application to the model. Conclusions are provided in section 3.5.
3.2 Methodology
Risk assessment is a systematic approach that helps in the decision-making process for an
operation (ABS, 2010). It has two elements, frequency assessment and consequence
assessment, which can be evaluated either qualitatively or quantitatively. Various
methods and tools are available for assessing risk, however choosing the right approach is
a key for useful risk assessment (Crowl and Louvar, 2002; Andrew and Moss, 2002;
Modaress, 2006). A Bayesian approach is used for modelling marine logistics support risk
in this study. Bayesian network is a Directed Acyclic Graph (DAG) that satisfies the
Markovian condition. A DAG is a directed graph with no cycles and the Markovian
condition for a Bayesian network states that every node in a Bayesian network
is conditionally independent of its non-descendants, given its parents. A DAG consists of
two sets: the set of nodes and the set of directed edges. In a BN, nodes represent random
variables while the edges represent conditional relationships (casual relationships)
between the connected nodes (Jensen and Nielsen, 2007; Ben-Gal, 2007). If an edge
connects from node A to node B, then variable of B depends on the variable of A. Hence,
node A and node B are referred to as a parent and a child, respectively. A BN represents a
joint probability distribution (JPD) over a set of random variables. Each variable has a
finite set of mutually exclusive states i.e. binary states (success/failure). Mathematically,

71
if a BN specifies the unique joint probability distribution P(A) over a set of random
variables A = {A1, A2, …., An}, then P(A) given by the product of all conditional
probabilities specified in BN (equation 3.1):
𝑃(𝐴) = ∏ 𝑃(𝐴𝑖 |𝑝𝑎(𝐴𝑖))𝑛𝑖 , (3.1)
where 𝑝𝑎(𝐴𝑖) are the parents of Ai in the BN and P(A) reflects the properties of the BN
(Pearl, 1988).
A BN can be used to find out updated knowledge about the state of a variable given the
evidence of another variable and thus Bayes’ theorem applies. According to the Bayes’
theorem, the posterior probability of a variable A given the evidence E can be expressed
as (equation 3.2):
𝑃(𝐴|𝐸) = 𝑃(𝐴)×𝑃(𝐸|𝐴)
𝑃(𝐸), (3.2)
where P(A) is the prior probability of A, P(E|A) is the likelihood function that represents
the likelihood of the evidence E if the hypothesis A is true and P(E) is the normalizing
factor that represents the prior probability of E when the evidence itself is true. P(E) can
be calculated using the law of total probability (equation 3.3):
𝑃(𝐸) = 𝑃(𝐸|𝐴)𝑃(𝐴) + 𝑃(𝐸|��)𝑃(��), (3.3)

72
A and �� are mutually exclusive that (𝐴 , ��) = 0. An example of a simplified BN model is
presented in Figure 3.1 to illustrate the application of Bayes’ theorem and inter-
dependence among the variables. A marine operational system failure (C) may occur due
to poor visibility (A) and human failure (B). In Figure 3.1(a), A and B are marginally
independent, which means poor visibility has no influence on human error whereas
Figure 3.1(b) represents that A and B are dependent given C as the likelihood of human
error may increase if poor visibility occurred. The CPTs are presented in Figure 3.1 and
the probability of operational system failure, P(C) can be calculated using equation 3.3
for both cases such that P(C) = P(A, B)P(C|A, B) + P(A, ��)P(C|A, ��) + P(��, B)P(C|��, B)
+ P(��, ��)P(C|��, ��). The occurrence probability of operational system failure, P(C) is
calculated as 0.0168 and 0.0181 when the parent nodes, A and B are independent and
dependent, respectively. Assuming the operational system failure has already occurred,
the posterior probability of the occurrence of poor visibility can be calculated using
equation 3.2.
𝑃(𝐴|𝐶) = 𝑃(𝐴) × 𝑃(𝐶|𝐴)
𝑃(𝐶)=
0.01 × 0.19
0.0168= 0.1134
Similarly, the posterior probability of human error occurrence becomes P(B|C) = 0.9463.
Now, in Figure 3.1(b), human error is conditionally dependent on poor visibility, then the
updated probability of human error would be: P(B) = P(B|A)P(A) + P(B|��)P(��) =
0.25×0.01 + 0.1× (1 – 0.01) = 0.1015. The posterior probability of the occurrence of poor
73
visibility and human error becomes 0.1796 and 0.9586, respectively. Hence, it is evident
that the conditional relations of the nodes significantly change the outcome.
Figure 3.1: Simplified BN showing CPTs and inter dependency between nodes
This concept has been implemented to address the conditional dependence of the
contributing factors of marine logistics support risk model. Figure 3.2 illustrates the
proposed framework and explanation of the main steps are provided in the followings.

74
Figure 3.2: The proposed methodology for marine logistics risk management in harsh
environments
Step 1 - Development of marine logistics risk model using Bayesian network: The BN
model is developed based on the concept of marine logistics operation and the fault tree
model presented in the previous study. A marine logistics operation consists of the
following main phases: departure readiness of a supply vessel when an incident has been

75
reported, an uninterrupted voyage, functionality of on-board equipment, arrival at the site
within the desired time limit and on-site operation (Figure 3.3). The parameters associated
with each phase of a logistics operation are selected based on detailed discussion with the
stakeholders, which include individuals such as offshore oil and gas operators, marine
transportation consultants, subject matter experts, and academics in the related fields.
Stakeholders have reviewed these parameters and the model is developed based on the
logical relationships among these key contributing parameters. These parameters are
further confirmed through a detail literature review and the outcome of which is presented
in (Rahman et al., 2019).
Figure 3.3: Logistics operation or emergency response (ER) process (Rahman et al., 2019)
The primary FT model (Rahman et al., 2019) is mapped to a BN based on the approach
described by Khakzad et al., 2013. The failure probabilities of primary events of the FT

76
model are assigned to the corresponding root nodes of the BN model as prior
probabilities. The logical relationships of the intermediate nodes and the leaf nodes with
the root nodes are defined by the conditional probability tables (CPT). The primary BN
model is presented in Figure 3.4.
Figure 3.4: The basic BN model for marine offshore logistics operation
Step 2 - Advanced Bayesian network model: The primary BN model suffers from several
limitations which are: 1) Interdependencies among the contributing factors are not
considered, 2) Failure due to promptness is not developed and 3) Logical relationships
among the factors are developed based on simplified OR/AND-gates that do not always
reflect the real scenarios. The following approaches are considered to address these
limitations:

77
1) The following interdependencies are addressed in the model:
- Equipment functionality failure may affect onboard fire/emergency response.
- Engine issues may affect both ship departure readiness and unobstructed voyage.
- Human error may result operational system failure, communication failure,
onboard fire/emergency response and equipment functionality failure.
- Existing environmental conditions may affect response time, unobstructed transit
of vessel and onsite operation.
- Ice conditions are related to wind and wave conditions.
In this study, “human error” is considered as a single parameter. However, the human
error could be considered as a series of nodes that would represent different modes of
human related failure. A detail study can be performed as a human reliability analysis
(HRA) exercise aiming to identify the causes and sources of human errors and to provide
an estimation of the human error probabilities (HEPs). A performance shaping factor
(PSF) is often used in HRA that systematically quantifies the potential influences of a
factor on human performance. Aspects of an individual’s characteristics, environment,
organization or task specifically influence human performance, and change the likelihood
of human error (Blackman et al., 2008). In a more detailed study of human factors for
marine operational failure, the BN model can be further expanded into multiple modes
based on PSFs and their dependencies could also be considered. Some of the detail
studies of the influence of human factors in a harsh offshore operation were presented in
Musharraf (2014), and Norazahar (2017). An illustrative example is presented in Figure

78
3.5 to explain how human error probability can be estimated for different scenarios. In an
emergency response to a remote offshore installation, human error may occur due to
various mode of human failure such as wrong detection, failure to act and inconsistent
response. The corresponding PSFs and probabilities of these scenarios are presented in
Table 3.1.
Table 3.1: Performance shaping factors of different scenarios of human error
Scenarios Performance shaping factor
(PSF)
Probability of
occurrence
Wrong detection Lack of training/experience (PSF1) 0.1
wrong procedure (PSF2) 0.05
Failed to act
Distraction (PSF3) 0.06
Stress (PSF4) 0.09
Physical condition (PSF5) 0.03
Inconsistent response Lack of training/experience (PSF1) 0.1
Complexity (PSF6) 0.07
Figure 3.5: A sample BN for estimating human error during offshore onboard operation

79
2) Promptness is further developed as a function of the distance between the platform and
the onshore base. In addition, promptness failure could happen if the ship fails to depart
or disrupts during its voyage.
3) Probabilistic gates such as noisy gates are introduced that give the flexibility to choose
an intermediate state of an event between 1 and 0 unlike AND/OR gates. In this way, the
estimation of failure probability can be optimized. The CPTs are modified based on the
experts’ opinion who have managed several offshore safety related projects and have
several years of experience in the relevant area. Evidence theory can be used to integrate
multiple experts’ opinion. This also helps to deal with the uncertainties and considers the
conflict of knowledge between the experts. Evidence theory was first proposed by
Dempster (1967) and later expanded by Shafer (1976), which is also known as the
Dempster-Shafer Theory (DST). In DST, the main three functions are: the basic
probability assignment function (bpa or m), the belief function (Bel), and the plausibility
function (Pl). An event probability is defined with a set of lower and upper bound values,
which are denoted as belief (Bel) and plausibility (Pl), respectively, and a mass (bpa) is
assigned for the uncertainty or ignorance about that event. According to the Dempster
rule of combination, multiple belief functions from different sources are combined
through their basic probability assignments (m) that considers that knowledge sources are
independent and uses the conjunctive operation (AND) for aggregation. For example, if
the m1(PA) and m2(PB) are two sets of evidence for the same event collected from two

80
different experts, the combination (called m12(Pi)) is calculated from the aggregation of
two bpa’s m1(PA) and m2(PB) in the following manner (equation 3.4):
𝑚12(𝑃𝑖) = {0, 𝑃𝑖 = ∅
∑ 𝑚1(𝑃𝐴)× 𝑚2(𝑃𝐵)𝑃𝐴∩𝑃𝐵=𝑃𝑖
1−𝑘, 𝑃𝑖 ≠ ∅
(3.4)
where k represents basic probability mass associated with a conflicting opinion. The
Dempster rule of combination uses (1 – k) as normalizing factor that ignores all
conflicting evidence through normalization. Further details about DST and the
combination rules of evidence can be found in Shafer (1986), Sentz and Ferson (2002),
Ferdous et al. (2011), Rahman et al. (2019). The modified BN model is presented in
Figure 3.6: The modified BN model for marine offshore logistics operation.
Figure 3.6: The modified BN model for marine offshore logistics operation

81
Step 3 – Critical factor analysis: Sensitivity analysis is very important to identify the
most critical factors. First, backward analysis or diagnostic analysis can be performed
where the states of some nodes are instantiated, and the updated probabilities of
conditionally dependent nodes are calculated (Bobbio et al., 2001; Khakzad et al., 2013).
The ratio of posterior and prior probabilities can be used as an index for identifying the
critical factors (Abimbola, 2016). For example, the ratio of posterior and prior
probabilities of poor visibility and human error in the model presented in Figure 1.1(a)
can be calculated as: P(A|C)/P(A) = 0.1134/0.01 = 11.34 and P(B|C)/P(B) = 0.9463/0.1 =
9.46. This suggests that operational system failure is relatively more sensitive to poor
visibility than human error.
Alternatively, importance measure can be found by evaluating the risk reduction worth or
top event’s sensitivity. It is defined as the decrease in the probability of the top event,
given that a particular event does not occur. To obtain the risk reduction worth for an
event, the top event failure probability is quantified by assigning zero probability of
failure to the given primary event (Khan et al., 2001; Khakzad et al., 2011).
Step 4 – Safety measures and risk management: In the context of risk management, safety
measures are classified into three types: inherent, engineered and procedural (Khan et al.,
2003). In safety related decision making, inherent safety measures, that avoid hazards
instead of controlling them, are usually given priority when compared to the other types
of safety measures (Amyotte et al., 2009; Kletz, 2003). Aside from the inherent safety

82
measures, engineered safety measures are the addition of new safety equipment that can
be either passive or active systems depending on the nature of their functions. Passive
safety measures are preferred than active safety measures as they help to reduce the effect
of an accident and do not depend on external controlling or activating systems. Next,
procedural safety measures control hazards through personnel education, training and
management. Such measures include standard operating procedures, safety rules and
procedures, personnel training, and management systems to improve human performance
(Yuan et al., 2015).
Safety measures can be applied in two stages: prevention and mitigation. To estimate the
complete risk, a consequence model is required along with probabilistic failure model as
the risk can be calculated as (equation 3.5):
𝑅𝑖𝑠𝑘 = ∑ 𝑃𝑖 × 𝐿𝑖 𝑛𝑖=1 , (3.5)
where 𝑃𝑖 refers to the probability of the i-th consequence and 𝐿𝑖 stands for the
corresponding losses, which are usually converted into equivalent financial losses.
Once the critical factors for a system have been identified, specific safety measures can
be assigned for each factor based on experts’ suggestions. The effect of each safety
measures in overall risk reductions are estimated that helps to develop the risk

83
management strategies. The percentage of risk reduction (%RR) can be calculated using
equation 3.6 (Yuan et al., 2015).
%RR = (R – RSMi)/R × 100 (3.6)
where R is the risk of marine logistics failure before application of safety measures; RSMi
is the risk of the system after the application of the i-th safety measure. A higher %RR
value of any safety measure indicates that it can reduce risk more effectively. An
illustrated example of the proposed methodology is provided in the following sections.
3.3 Application of the Proposed Methodology
3.3.1 Description of the Case Study
A case study is presented in this section to illustrate the application of the proposed
model. The exploration in the Flemish Pass Basin is a suitable example to describe the
scenarios envisaged in this study. This drilling location is approximately 480 kilometres
east of St. John’s, Newfoundland and Labrador. The water depths in this area are ranging
from 500 to over 3,000 m (Project Description Summary – Equinor, 2016). Figure 3.7
shows the location of Flemish Pass drilling project.

84
Figure 3.7: Exploration drilling location in the Flemish Pass Basin (Source: Canadian
Environmental Assessment Agency, date retrieved: August 21, 2018)
This region exhibits harsh environmental conditions including intense storms and the
presence of ice (sea ice and icebergs). Superstructure icing can also occur between
December and March because of the temperature, wind and wave conditions. Restricted
visibility due to fog is also common, especially in the months of spring and summer,
when warm air masses overlie the cold ocean surface. The worst visibility conditions are
experienced in July. During the months of winter, restricted visibility can also be caused
by snow in addition to fog and mist (ISO 19906:2010). In addition, the distances between
the onshore supply base and the offshore drilling locations impose extra challenge for
emergency logistics support that needs special considerations.

85
3.3.2 Probability Data
The modified BN model (Figure 3.6) represents the failure model of emergency logistics
support for this case study. The failure probabilities of the contributing factors are listed
in Table 3.2, which is based on a comprehensive literature survey (Rahman et al., 2019).
Table 3.2: Failure probabilities
Basic events Probability of
failure Reference
Fuel availability 3.97 × 10⁻⁴ Kum and Sahin, 2015
Crew availability 3.97 × 10⁻⁴ Kum and Sahin, 2015
Lifesaving appliances 1.00 × 10⁻³ Bercha et al., 2003
Firefighting equipment 3.97 × 10⁻⁴ Kum and Sahin, 2015
Navigation equipment 2.55 × 10⁻³ Antao et al., 2006
Engine issues 2.6 × 10⁻⁴ Kum and Sahin, 2015
Wind conditions 6.00 × 10⁻³ Apostolos et al., 2009
Wave conditions 1.97 × 10⁻⁴ Apostolos et al., 2009
Sea ice 2.75 × 10⁻³ Kum and Sahin, 2015
Pressured ice 5.94 × 10⁻² Kum and Sahin, 2015
Iceberg 1.00 × 10⁻² Apostolos et al., 2009
Marine icing 1.50 × 10⁻⁴ Expert opinion
Loss of hull integrity 1.33 × 10⁻⁴ Christou and Konstantinidou,
2012
Poor visibility 7.00 × 10⁻⁴ Apostolos et al., 2009
Navigational failure 2.00 × 10⁻⁶ Amrozowicz et al., 1997
Human error 3.00 × 10⁻⁴ Apostolos et al., 2009
Maintenance failure 1.00 × 10⁻⁴ Expert opinion
Mechanical failure 5.46 × 10⁻² Bercha et al. 2003
Safety equipment maintenance 1.00 × 10⁻³ Expert opinion
Remoteness 3.00 × 10⁻² Expert opinion
Mechanical failure (Communication) 1.00 × 10⁻⁵ Apostolos et al., 2009
Software/control system failure 4.00 × 10⁻⁴ Apostolos et al., 2009
PPE 5.00 × 10⁻³ Expert opinion
Manpower 1.00 × 10⁻² Expert opinion
Site Clearance 1.00 × 10⁻³ Expert opinion

86
The failure probabilities of several factors are collected from Kum and Sahin (2015). The
primary sources of their marine accident/incident data are Marine Accident Investigation
Branch (MAIB)’s reports; accident data were analyzed by fuzzy fault trees to estimate
occurrence probabilities. This study considered 65 arctic marine accidents reported from
1993 – 2011. Another source of data is Apostolos et al. (2009), where traditional
probabilistic risk analysis tools such as the fault tree and the Bayesian network were used
for calculating failure probabilities. Amrozowicz et al. (1997) presented a probabilistic
assessment of a ship’s navigational failure, where an analysis of tanker grounding using
the fault tree was conducted. The probability data related to lifesaving appliances are
obtained from Bercha et al. (2003). This information was deduced from full scale lifeboat
launch data that was carried out in Canada and the United Kingdom. Navigation
equipment failure data are collected from Antao et al. (2006); this source presents fault
tree models of accident scenarios of Ro-Ro vessels for cargo and passengers. Christou
and Konstantinidou (2012) conducted an analysis of oil and gas related accidents; data
used in this study was primarily collected from the Health and Safety Executive (HSE),
MAIB, Worldwide Offshore Accident Databank (WOAD), and DNV. However, these
sources provide only an example to choose a sensible value for demonstrating the
methodology.
Expert elicitation is required when data are not available, or it is difficult to measure the
accuracy of data. It is a formal procedure for obtaining and combining knowledge. There
are various methods available for experts’ knowledge elicitation. Some of the

87
fundamental works related to expert elicitation were published in Cooke (1991) and
O’Hagan (1998). A scoring system is introduced in this process based on the scores of
experts’ judgements and the level of certainty of their beliefs. The available methods to
aggregate elicited judgements can be either behavioral, where the members of the expert
panel interact with each other to reach a single distribution, or mathematical where
individual assessments are analytically processed to obtain a combined probability
distribution (Clemen and Winkler, 1999). An example of a behavioral approach is the
Delphi method; the mathematical techniques include axiomatic and Bayesian approaches.
In this paper, the evidence-based approach or the Dempster-Shafer Theory is
implemented to aggregate the data collected from two experts. Both experts have PhD in
the relevant subject. Expert 1 has 15-20 years of experience in offshore oil and gas related
projects, whereas expert 2 has 5-10 years of experience in logistics operation. Since the
data is collected from individuals, there may be some uncertainty in the data. The
application of DST can help with this issue, which can address missing data and
conflicting subjective data. This also helps to integrating data from multiple sources,
filling missing data sources, resolving the issue of varying data for the same cause/event,
and updating the probability when new information becomes available. Besides, it should
be mentioned that a larger number of experts from heterogeneous backgrounds would
have been better to gain more reliable results in this study. The aim of this study is to
demonstrate the application of the approach, not to claim the accuracy of the outcome.
This process can be repeated and further improved with a more detailed survey. Similar

88
approach can be applied to combine probability information from more than two experts
when available.
Since expert judgements are epistemic/subjective in nature, uncertainties may exist in the
data. Several literatures suggested implementation of the evidence-based approach to
overcome this type of uncertainties (Ayyub and Klir (2006), Sentz and Ferson (2002),
Ferdous et al. (2009). An illustrated example to aggregate both experts’ conditional
probability data for operational system failure using the Dempster rule of combination is
presented in Figure 3.8. In DST, a belief mass (bpa or m) for each event is acquired from
multiple sources i.e. expert 1 and expert 2. The bpa represents the degree of experts’
belief for each subset. In Figure 3.8, expert 1 reported the conditional probability of
operational system failure is 75% true and 9% false when no human error occurred but
failure due to poor visibility happened. Mathematically, this is written as m({T}) = 0.75,
m({F)} = 0.09 and m({T,F}) = 1−m({T})−m({F}) = 0.16. Similarly, for expert 2, m({T}) =
0.60, m({F)} = 0.17 and m({T,F}) = 0.23. The data acquired from two experts are
aggregated using the DS rule presented in equation 3.4. The term (1 – k) can be
interpreted as a normalization factor for the conflict among the evidential information. In
DS rule of combination, it is assumed that the two sources of information are independent
of each other.

89
Figure 3.8: Combination of conditional probabilities from the experts using DS rule
From the bpas, the lower bound and upper bound of an interval can be determined by
equation 3.7 and equation 3.8, which are referred as belief (Bel) and plausibility (Pl),
respectively. The belief (Bel) or lower bound for a set PA is the sum of all the basic
probability assignments of the proper subsets PB of the set of interest PA, i.e., PB ⊆ PA.
The plausibility (Pl) or upper bound is the sum of all the bpas of the sets PB that intersect
the set of interest PA, i.e., PB ∩ PA ≠ ∅. Hence,
𝐵𝑒𝑙(𝑃𝐴) = ∑ 𝑚(𝑃𝐵 ⊆ 𝑃𝐴 𝑃𝐵) (3.7)
𝑃𝑙(𝑃𝐴) = ∑ 𝑚(𝑃𝐵 ∩ 𝑃𝐴 ≠ ∅
𝑃𝐵) (3.8)
The belief structure of operational system for the given condition is calculated as [0.8778,
0.9228] and [0.0772, 0.1222] for failure and success, respectively. The conditional
probabilities obtained from this example is used to estimate the belief structure of ER

90
failure from the BN model in Figure 3.6. The estimated lower bound (Bel) and upper
bound (Pl) of the occurrence of ER failure is 0.0848 and 0.0849, respectively. The failure
probability of emergency response estimated in the example reflects slight deviation,
however this an illustration to demonstrate how the uncertainty of expert knowledge can
be accounted using this approach.
3.3.3 Critical Factor Analysis
In this section, the most critical factors of marine logistics operations are identified. One
of the advantages of BN is probability updating that means the updated information
(evidence) of some events can be utilized to estimate the probabilities of other factors of a
system. Here, the occurrence of the logistics failure is set as evidence. Next, the
probability of all contributing factors can be updated accordingly that gives the
corresponding posterior probabilities. The ratio of posterior and prior probabilities can be
calculated in which the higher value indicates the most sensitive factors. Figure 3.9
illustrates the posterior probabilities of the contributing factors if the emergency logistics
support fails.

91
Figure 3.9: BN model is simulated using GeNIe as the probability of ER failure is 1.0.
The ratio of prior and posterior probabilities of the primary events are presented in Table
3.3. The most sensitive change ratio is human error. Mechanical failure, fuel availability,
crew availability, lifesaving appliances, firefighting equipment, navigation equipment,
hull integrity and navigational failure have similar sensitivity ratio. Other factors do not
reflect any significant change when compared with each other.

92
Table 3.3: The ratio of prior and posterior probabilities of critical factors
Contributing factors Prior Probability
(Pi)
Posterior Probability
(Pp)
Ratio
(Pp/Pi)
Fuel availability 0.000397 0.003386 8.5280
Crew availability 0.000397 0.003386 8.5280
Lifesaving appliances 0.001 0.008528 8.5280
Firefighting equipment 0.000397 0.003386 8.5280
Navigation equipment 0.00255 0.021747 8.5280
Engine issues 0.00026 0.002217 8.5280
Wind conditions 0.006 0.041225 6.8708
Wave conditions 0.000197 0.001357 6.8865
Sea ice 0.00275 0.017658 6.4211
Pressured ice 0.0594 0.381416 6.4211
Iceberg 0.01 0.064211 6.4211
Marine icing 0.00015 0.000963 6.4211
Loss of hull integrity 0.000133 0.001134 8.5280
Poor visibility 0.0007 0.005442 7.7748
Navigational failure 0.000002 0.000017 8.5280
Human error 0.0003 0.003510 11.6989
Maintenance failure 0.0001 0.000646 6.4551
Mechanical failure 0.0546 0.367678 6.7340
Safety equipment maintenance 0.001 0.006454 6.4539
Remoteness 0.003 0.023331 7.7769
Mechanical failure
(Communication) 0.00001 0.000087 8.6550
Software/control system failure 0.0004 0.003282 8.2041
PPE 0.005 0.037295 7.4589
Manpower 0.01 0.078700 7.8700
Site Clearance 0.001 0.007049 7.0494
In this section, the main phases of logistics operations are considered to analyze the risk
reduction worth, where evidence is set up as 100% success for each main phase and the

93
probability improvement of logistics failure is estimated as percentage (Table 3.4). It is
seen that the most critical phases of logistics operation are: (1) Promptness or vessel
reaching the site on time and (2) On-site operation. Promptness depends on the distance
of the site, vessel readiness, uninterrupted vessel transit and existing physical
environments. The focus should be given to overcome the challenges of logistics
operation associated with remoteness and onboard operations.
Table 3.4: Sensitivity of the main phases of logistics operation
ER failure after setting an
intermediate event not occurring
Prior
Probability
(Pi)
Posterior
Probability
(Pp)
Change ratio in
percentage ((Pp -
Pi)/Pi ×100)
ER Failure | Departure_Readiness
0.0848
0.0816 3.78
ER Failure | Unobstructed_Voyage 0.0631 25.53
ER Failure | Equipment_Funtionality 0.0560 33.91
ER Failure | Promptness 0.0432 49.08
ER Failure | Onboard_Operation 0.0196 76.91
3.4 Risk Management Strategies
3.4.1 Identification of Safety Measures
After analyzing the contributing factors, possible safety measures are identified that
reduce the risk of logistics failure. If there are multiple solutions for a single factor, the
safety measures are categorized first according to the risk management principles. It

94
needs an organized approach to take both the effects and costs of each safety measures
into account, and thus to achieve an optimal risk management strategy. A safety measure
has an effect either on the probabilities of the primary events or the potential
consequences. Figure 3.10 illustrates some possible measures that can be applied during
the major stages of marine logistics operation. Different types of safety measures exhibit
different characteristics, which are classified in Table 3.5. For instance, an inherent safety
measure can be such that a vessel is designed and built to withstand in harsh operating
conditions. Engineered measures i.e. innovative design, offshore refuge, additional
inventory for logistics etc., need additional equipment or installations. For a safety
measure that requires additional installation, the fixed cost might be much higher than the
operating cost. Procedural measures such as inspection, maintenance or training involve
regular operating costs.
Figure 3.10: Risk reduction measures for different phases of marine logistics operation

95
Table 3.5: Summary of safety measures in the context of ER failure
Intermediate Events Safety Measures
Inherent
Safety
Measures
Engineered Procedural
Failure of departure
readiness
Procedural arrangements
×
Inspection
×
Failure of unobstructed
voyage
Innovative design & better
operability
×
Ship structure ×
Equipment
functionality failure
Maintenance
×
Training
×
Failure due to delayed
response
Offshore refuge
×
Novel high-speed craft
×
Nearby ships
×
Standby vessel
×
Onboard operational
failure
Buffer inventory
×
Advance technologies for
logistics transfer
×
Training
×
The sensitivity analysis reveals that the most critical phases of logistics operation are
promptness and onboard operation. In this study, the emphasis is to overcome the
challenges with remoteness and onboard operations. Several alternative solutions are
identified, which are described below:

96
1. Offshore temporary refuge/hotel: The concept is to have a temporary hotel in a
nearby offshore installation which can facilitate logistics support when a plant is
at risk. It is different from the temporary refuge, which is located inside the
production plant (Section 3 of ISO 19906). Muster stations are located within a
temporary refuge where personnel assemble for evacuation. This temporary
refuge/hotel could be a floating structure with a suitable mooring system. It should
have all the necessary logistics of a supply vessel including trained personnel who
can provide support to restore plants’ production and conduct rescue operation
when the plant needs to be abandoned. An appropriate vessel suitable for this
purpose would be required for transportation between the hotel and plant. A single
offshore hotel can provide logistics to more than one offshore production plants if
these are situated in close vicinity. The feasibility of such installation, and its
conceptual design standards and performance benchmarks will be studied in a
future work.
2. High speed craft/emergency response vessel (ERV): The ERV should be capable
of performing all emergency response support duties relevant to the assessed
needs of the offshore facilities, its personnel and the environment. The ERV
location should ensure that it is able to transit and respond to the specific
emergency within the pre-determined maximum time period relating to the
emergency. It should be capable of functioning under all possible environmental
conditions and installation hazards to satisfy the facility’s requirements in relation

97
to its emergency response plan. The performance standards for the Emergency
Response Vessel in remote harsh environment is presented in Barents 2020:
RN04, Final Report, Phase 4.
3. Standby Vessel: The Canada-Nova Scotia Offshore Petroleum Board and the
Canada-Newfoundland and Labrador Offshore Petroleum Board (the Boards) have
issued guidelines to assist operators to achieve compliance with the Drilling and
Production Regulations (the Regulations) respecting the suitability and capability
of support craft as a standby vessel (SBV) to supply emergency services (Atlantic
Canada Standby Vessel (AC-SBV) Guidelines: ISBN: 978-0-994-0857-0-2).
Standby vessels are designed, constructed and maintained to operate safely and
supply the necessary emergency services in the foreseeable physical
environmental conditions prevailing within the area of operations.
4. Nearby Ships: Ships near the offshore platform i.e. patrol vessels can be a
secondary means of support if others are not available. The presence of a nearby
ship that can provide support during the plants’ emergencies is uncertain; this
should be considered in the risk analysis.
5. Buffer Inventory: An alternative approach for the solution of logistics problem
that the production facility is designed with buffer inventory. This could be an

98
additional safety barrier for the plant. A conceptual design, performance standards
and its feasibility need to be studied in detail.
3.4.2 Safety Measures Allocation to the Model
In Figure 3.11, the BN model for marine logistics operation incorporates the identified
safety features, which are marked as green nodes. There are several alternative safety
measures possible, which are presented with purple nodes.
Figure 3.11: Safety measures allocation to the BN model.
The impacts of a safety measure on the likelihood of an undesired event can be derived
using the law of total probability. For example, if appropriate training is provided to
improve human performance that can eliminate human error, then the probability of

99
human error, P(HE) can be calculated using equation 3.9 (Dianous and Fievez, 2006;
Yuan et al., 2013).
P(HE) = P(HE|SMHE) × P(SMHE) + P(HE|𝑆𝑀𝐻𝐸 ) × P(𝑆𝑀𝐻𝐸
), (3.9)
In the above equation, P(SMHE) is the failure probability of training activities;
P(HE|SMHE) refers to the conditional probability of human error given that the training
has failed. Similarly, is the conditional probability of human error given
that the training is effective. A sample calculation is shown in Figure 3.12 and a
comparison of the probabilities with and without safety measures is presented in Table
3.6.
Figure 3.12: Example of updated failure probability calculation with safety measure
100
Table 3.6: Comparison of probabilities with and without safety measures
Critical Factors Safety Measures
Alternate
Safety
Measures
Probability
without safety
measures
Probability with
safety measures
Fuel availability Procedural
arrangements
3.97E-04 9.61E-05
Crew availability Procedural
arrangements
3.97E-04 1.06E-04
Readiness of vessel
safety equipment
Procedural
arrangements 3.94E-03 9.61E-04
Inspection 3.94E-03 1.02E-03
Engine issues Inspection 2.60E-04 3.23E-05
Loss of hull integrity Ship structure 1.33E-04 2.11E-05
Unobstructed voyage
failure
Innovative and better
operability
2.69E-02 3.24E-03
Maintenance failure Inspection and
maintenance
1.00E-04 1.09E-05
Mechanical failure Inspection and
maintenance
5.46E-02 6.49E-03
Safety equipment
maintenance
Inspection and
maintenance
1.00E-03 2.08E-04
Human error Training 3.00E-04 3.27E-05
Promptness
Offshore
refuge 5.17E-02 5.17E-04
Novel high
speed craft 5.17E-02 9.67E-03
Nearby ships 5.17E-02 2.37E-02
Standby
vessel 5.17E-02 1.01E-02
Onboard
fire/emergency
response failure
Buffer
inventory 7.70E-02 3.05E-02
Advance technologies
for logistics transfer 7.70E-02 5.72E-03

101
To estimate the complete risk value of ER failure, a consequence model should be
considered. Consequence models help to calculate the potential damage resulting from the
logistics failure along with the probability of the outcomes. The study presents a scenario
where an accident has already occurred, and an emergency support has been requested.
The failure of emergency response means the onboard personnel need to evacuate the
platform if the accident cannot be controlled. Therefore, the consequences of ER failure
are categorized into the following:
i. Accident: Onboard personnel managed to escape from the accident site and
evacuated successfully.
ii. Major Accident: Onboard personnel managed to escape from the accident site but
failed to evacuate the platform.
iii. Catastrophic: Onboard personnel failed to escape from the accident site.
The crew need to assemble at the muster station to evacuate the platform. Evacuation
would not be possible if escape failed. The complete risk model is presented in Figure
3.10. The failure probabilities of escape and evacuation in offshore platform accidents are
taken as 0.08 and 0.1, respectively (Ping et al., 2017). The consequence severity matrix
for this study is presented in Table 3.7 (adapted from Kalantarnia, 2009).

102
Table 3.7: Consequence types
Consequence Dollar value
equivalent
(Million)
Asset loss Human loss Environment
loss
Reputation
Accident 0.5-50 M Loss of
major
portion of
equipment/
product
Multiple major
injuries, potential
disabilities,
potential threat to
life, or one
fatality
Minor offsite
impact
Local media
coverage or
regional media
coverage,
brief national
media note
Major accident 50-100 M Loss of all
equipment/
product
Multiple fatalities Community
advisory
National media
coverage,
brief note on
international
media
Catastrophic > 100 M Loss of all
equipment/
product
More fatalities
than type A since
personnel could
not escape from
accident site
Community
advisory
National media
coverage,
brief note on
international
media
Risk due to logistics failure before and after the application of safety measures is
calculated using equation 3.5, which is presented in Table 3.8. The method is illustrated
for five alternative safety measures. For example, the risk without any safety measures
can be calculated as: 𝑅𝑖𝑠𝑘 = ∑ 𝑃𝑖 × 𝐿𝑖 𝑛𝑖=1 = 1.46E-02 × 25 Million + 6.79E-03 × 75
Million + 6.79E-04 × 75 Million = 0.96 Million. Subsequently, the percentage of risk
reduction of each safety measure is calculated using equation 3.6 i.e. %RR of offshore
refuge can be calculated as: %RR (Offshore refuge) = (0.96 – 0.70)/0.96 × 100 = 26.99%.
The corresponding %RR values of the safety measures are plotted in Figure 3.13, which

103
shows that buffer inventory and offshore refuge have the highest %RR values among
these five measures. About 30% of risk can be reduced if a nearby offshore refuge or a
buffer inventory adjacent to the platform is used, which addresses the challenge of prompt
response. An additional advantage of offshore refuge over buffer inventory is that a single
installation can support more than one offshore platform in case these are in a close
proximity. Also, effective training of emergency crew and onboard personnel, improving
the reliability of logistics equipment, innovative technologies suitable for cold weather
conditions can significantly reduce onboard operational challenges. Hence, the
combination of these measures can be considered in the decision making process for the
offshore logistics risk management.
Table 3.8: Risk of ER failure with and without safety measures
Consequences
type
Probability
before
safety
measures
Probability after the application of alternative safety measures Potential
losses in
Millions
(M) of
dollars
Offshore
refuge
Novel
high
speed
craft
Nearby
ships
Standby
vessel
Buffer
inventory
ER failure 8.49E-02 6.53E-02 6.80E-02 7.73E-02 6.83E-02 5.98E-02 -
Accident 1.46E-02 1.07E-02 1.17E-02 1.33E-02 1.17E-02 1.03E-02 25M
Major
accident 6.79E-03 4.96E-03 5.44E-03 6.18E-03 5.46E-03 4.78E-03 75M
Catastrophic 6.79E-04 4.96E-04 5.44E-04 6.18E-04 5.46E-04 4.78E-04 120M
Overall risk 0.96M 0.70M 0.77M 0.87M 0.77M 0.67M -

104
Figure 3.13: Percentage of risk reduction after the application of safety measures
In this case study, the occurrence probability of each consequence is estimated based on
the conditional probability data from two experts which are aggregated by the DS rule of
combination. This approach may address the uncertainty due to expert knowledge
elicitation from multiple sources where a range of occurrence probability of events can be
obtained. The ignorance and belief of experts’ knowledge are defined based on the basic
event probability assignments and the DS rule of combination provides a lower bound
and an upper bound of event probabilities which are also referred as belief and
plausibility, respectively. Figure 3.14 shows the lower and the upper bounds of each
consequence in logistics operation failure, which are calculated using the model based on
the aggregated data from both experts.

105
Figure 3.14: Belief structure of consequences
The Bayesian approach is implemented in this study to describe the dependencies among
the parameters of offshore logistics operational failure and the probabilistic assessment of
possible safety measures in risk reduction. The objective of this case study is to
demonstrate the application of the approach, which could be further tested and applied for
similar scenarios. Precise outcome can be obtained through further experimentation and
validation using more data from subject matter experts. Also, an alternative approach to
perform this analysis could be the use of influence diagrams (ID). An ID is a graphical
tool that can be used for mapping probabilistic dependencies among the variables in a
decision analysis (Howard and Matheson, 1984). Since the risk analysis of logistics

106
failure involves uncertainty and decision-making steps, the applicability of ID within this
problem can be further investigated. A simple ID is presented in Figure 3.15. Two
elliptical chance variables are risk due to ER failure and cost. The rectangular decision
variable indicates the possible safety measures or actions could be taken by the decision
makers or stakeholders. These action variables may affect the belief or probability of risk
and cost. The rounded rectangle represents a deterministic function to estimate the
reduction of risk, which is the function of measured risk and action taken. The hexagonal
node represents the risk reduction worth, which is a measure of value or satisfaction with
possible outcomes with respect to various actions taken.
Figure 3.15: An influence diagram for decision making in the risk management of offshore
logistics support in a remote harsh environment

107
3.5 Conclusions
This paper presents a risk model to analyze operational challenges of marine logistics
support in harsh environments and proposes risk management strategies to reduce risk.
An advanced Bayesian approach is used to address the interdependencies and conditional
relationships among the critical factors. The main contribution of this paper is
summarized below:
1. The inherent limitations of primary BN model for marine logistics risk are
identified by analyzing the network’s outcomes. An advanced BN model
addressed the interdependencies of contributing factors and the casual
relationships are well-defined based on experts’ knowledge.
2. A case study is presented to illustrate the logistics risk model. Prior probabilities
used in the analysis are based on historical data from literature survey and domain
experts. Evidence-based theory is implemented to combine the data from two
experts.
3. Sensitivity analysis reveals that the most critical phases of this particular scenario
are promptness of response and onboard operation.
4. Safety measures to control and mitigate the marine logistics failure are identified
and integrated with the risk model to estimate the reduction of risk. Risk
management strategies are developed that emphasize the challenges associated
with promptness and onboard operation.

108
5. Several alternative solutions are considered in the analysis as an effort to find the
optimal measures. The concept of offshore temporary refuge or a buffer inventory
within the platform can be very promising solutions for the logistics problem in a
remote harsh environment.
The economic aspects of these safety measures need to be studied further. Also, discrete
probabilities are used in this study. More robust estimation can be obtained if time
sensitive data can be used i.e. seasonal probability values. In this study, human error is
considered as one parameter, which could be a combination of a series of nodes that
would represent different modes of human related failure. With a more detail literature
review and practical datasets, the accuracy of this outcome can be further improved.
Scarcity of the relevant data is a big challenge for this study. To address the data
limitation, integration of the fuzzy theory with the existing Bayesian model could be a
promising approach.
References
Abimbola, M.O., 2016, Dynamic Safety Analysis of Managed Pressure Drilling
Operations, PhD thesis, Memorial University of Newfoundland.
Apostolos, P., Carlos, G. S., Andrzej, J., Jorgen, J., Dag, M., Pierre, C. S., Rolf, S., Jeppe,
S. J., Dracos, V., Henrik, N., Bjφrn, H. 2009. Risk-based ship design. Methods, Tools
and Applications. Springer, Berlin.
American Bureau of Shipping, 2010, Guide for vessels operating in low temperature
environments.

109
Amrozowicz, M., Brown, A.J., Golay, M., 1997. Probabilistic analysis of tanker
groundings. International Offshore and Polar Engineering Conference. Honolulu,
Hawaii.
Amyotte, P.R., Pegg, J.M., Khan, I.F., 2009. Application of inherent safety principles to
dust explosion prevention and mitigation. Process Saf. Environ. Prot. 87 (1), 35–39.
Andrews, J.D. and Moss, T.R., 2002, Reliability and Risk Assessment, Publisher: Wiley-
Blackwell.
Antao, P. and Soares, C.G., 2006. Fault-tree Models of Accident Scenarios of RoPax
Vessels. International Journal of Automation and Computing 2 (2006) 107-116.
Arctic Marine Shipping Assessment 2009 Report, Arctic Council.
Atlantic Canada Standby Vessel (AC-SBV) Guidelines: ISBN: 978-0-994-0857-0-2.
Ayyub, B. and Klir, J.G., 2006. Uncertainty Modeling and Analysis in Engineering and
the Sciences. (Chapman & Hall/CRC).
Baker, S. P., Shanahan, D. F., Haaland, W., Brady, J. E., & Li, G. (2011). Helicopter
crashes related to oil and gas operations in the Gulf of Mexico. Aviation Space and
Environmental Medicine, 82(9), 885-889. DOI: 10.3357/ASEM.3050.2011
Ben-Gal, I., 2007. Bayesian Networks. In: Ruggeri, F., Faltin, F., Kenett, R. (Eds.),
Encyclopedia of Statistics in Quality and Reliability. John Wiley and Sons, New
York.
Bercha, F.G., 2003. Escape, Evacuation, and Rescue Research Project Phase II.
Blackman, H. S., Gertman, D. I., & Boring, R. L. (2008). Human Error Quantification
Using Performance Shaping Factors in the SPAR-H Method. Proceedings of the

110
Human Factors and Ergonomics Society Annual Meeting. 52, pp. 1733-1737. SAGE
Publications.
Bobbio, A., Portinalea, L., Minichinob, M., and Ciancamerlab, E., 2001, Improving the
analysis of dependable systems by mapping fault trees into Bayesian networks,
Reliability Engineering and System Safety 71 (2001) 249–260.
Borch, O.J., 2018, Offshore service vessels in high arctic oil and gas field logistics
operations, FoU-rapport nr. 22, ISBN 978-82-7456-782-5, Bodø 2018.
Boudali H., Dugan J.B. (2005). A new Bayesian network approach to solve dynamic fault
trees. IEEE Reliability and Maintainability Symposium, 451-456, January 24-27.
Christou, M. and Konstantinidou, M., 2012. Safety of offshore oil and gas operations:
Lessons from past accident analysis, JRC Scientific and Policy reports.
Clemen, R. T. and Winkler, R. L. (1999) Combining probability distributions from
experts in risk analysis. Risk Anal., 19, 187–203.
Cooke, R. M. (1991) Experts in Uncertainty: Opinion and Subjective Probability in
Science. Oxford: Oxford University Press.
Crowl, D.A., and Louvar, J.F., 2002. Chemical Process Safety: Fundamentals with
Applications, Prentice Hall Publication Inc., 601 pages.
Dempster, A. P. (1967). “Upper and Lower Probabilities Induced by a Multivalued
Mapping.” The Annals of Statistics 28: 325-339.
Dianous, V., Fievez, C., 2006. ARAMIS project: A more explicit demonstration of risk
control through the use of bow-tie diagrams and the evaluation of safety barrier
performance. J. Hazard. Mater. 130 (3), 220–233.

111
DNV, Barents 2020, 2010, Assessment of International Standards for Safe Exploration,
Production and Transportation of Oil and Gas in the Barents Sea.
F. Khan, S. Ahmed, S.J. Hashemi, M. Yang, S. Caines, and D. Oldford, Integrity
challenges in harsh environments: Lessons learned and potential development
strategies, Hazards 24, May 7-9, 2014b, Edinburgh, UK.
Ferdous R, Khan F, Sadiq R, Amyotte PR, Veitch B, 2011, Fault and event tree analyses
for process systems risk analysis: uncertainty handling formulations, Risk Analysis,
Vol. 31, No. 1.
Ferdous R, Khan F, Sadiq R, Amyotte P, Veitch B. Handling data uncertainties in event
tree analysis. Process Safety and Environmental Protection, 2009; 87(5):283–292.
Ferdous R, Khan F, Veitch B, Amyotte PR. Methodology for computer aided fuzzy fault
tree analysis. Process Safety and Environmental Protection, 2009; 87(4):217–226.
Hamilton, J.M., 2011, The Challenges of Deep Water Arctic Development, Proceedings
of the Twenty-first (2011) International Offshore and Polar Engineering Conference
Maui, Hawaii, USA, June 19-24, 2011."
Hokstad, P., Jersin, E., Sten, T., 2001, A risk influence model applied to North Sea
helicopter transport, December 2001, Reliability Engineering System Safety
74(3):311-322, DOI: 10.1016/S0951-8320(01)00083-7.
Howard, R. A., & Matheson, J.E. (1984). Influence Diagrams. In: Howard, R. A. and
Matheson, J.E. (eds.) The Principles and Applications of Decision Analysis Vol. II
Strategic Decisions Group, Menlo Park, CA, pp. 721-762.

112
https://oilandgasuk.co.uk/wp-content/uploads/2017/07/Appendix-1_Reportable
Helicopter Accidents-2017.pdf/date-retrieved: 15-09-2018.
https://www.bayesfusion.com/date-retrieved: 15-09-2018.
https://www.statoil.com/en/news/efficient-exploration-offshore-newfoundland.html, June,
2016.
ISO 19906: 2010, Petroleum and natural gas industries - Arctic offshore structures.
Jensen, F.V. and Nielsen, T.D., 2007, Bayesian Networks and Decision Graphs, 2nd
edition, Springer, ISBN-10: 0-387-68281-3.
Kalantarnia, M., 2009. Dynamic Risk Assessment using Accident Precursor Data and
Bayesian Theory. Master of Engineering Thesis, Memorial University, St. John’s,
N.L., Canada.
Khakzad, N., Khan F, and Amyotte, P., 2011, Safety analysis in process facilities:
Comparison of fault tree and Bayesian network approaches. Journal of Reliability
Engineering and System Safety 96 (2011) 925–932.
Khakzad, N., Khan, F.I., Amyotte, P.R., 2013. Dynamic safety analysis of process
systems by mapping bow-tie into Bayesian network. Process Saf. Environ. Prot. 91
(1–2), 46–53.
Khan FI, Sadiq R, and Amyotte, PR, 2003, Evaluation of available indices for inherently
safer design options, Process Safety Progress 22(2):83 - 97 DOI:
10.1002/prs.680220203.

113
Khan FI, Sadiq R, Husain T. Risk-based process safety assessment and control measures
design for offshore process facilities. Journal of Hazardous Materials 2001; A94:1–
36.
Khan, F., Ahmed, S., Yang, M., Hashemi, S. J., Caines, S., Rathnayaka, S. and Oldford,
D. (2014a), Safety challenges in harsh environments: Lessons learned. Proc. Safety
Prog., 34: 191–195. doi:10.1002/prs.11704.
Khan, F., Ahmed, S., Hashemi, J., Yang, M., Caines, S. and Oldford, D. Integrity
challenges in harsh environments: Lessons learned and potential development
strategies, Hazards 24, May 7-9, (2014b), Edinburgh, UK.
Kletz, T.A., 2003. Inherently safer design – its scope and future. Process Saf. Environ.
Prot. 81 (6), 401–405.
Klir GJ, Yuan B. Fuzzy Sets and Fuzzy Logic: Theory and Applications, 1st ed. Upper
Saddle River, NJ: Prentice Hall PTR, 1995.
Kum, S. and Sahin, B., 2015. A root cause analysis for Arctic Marine accidents from
1993 to 2011. Safety Science, Volume 74, Pages 206-220.
Marine Accident Investigation Branch, UK.
Malykhanov, A.A. and Chernenko, V.E., 2015, Strategic planning of logistics for
offshore arctic drilling platforms supported by simulation, Proceedings of the 2015
Winter Simulation Conference."
Meling, T.S., 2013, Deepwater Floating Production Systems in Harsh Environment - a
Look at a Field Development Offshore Norway and Need for Technology
Qualification, OTC Brasil, 29-31 October, Rio de Janeiro, Brazil.

114
Milaković, A.S., Ehlers, S., Westvik, M.H., Schütz, P., 2014, Offshore upstream logistics
for operations in arctic environment, DOI: 10.1201/b17517-21.
Modaress, M., 2006, Risk Analysis in Engineering: Techniques, Tools, and Trends, CRC
press, ISBN 9781574447941, 424 pages.
Musharraf, M., 2014, Bayesian Network Approach to Human Reliability Analysis (HRA)
at Offshore Operations, masters thesis, 142 pages.
Nascimento, F. A. C., 2014, Hazard identification and risk analysis of nighttime offshore
helicopter operations, Ph.D. thesis, Imperial College London, UK.
Norazahar, N., 2017, Risk Management of Human and Organizational Factors for the
Escape and Evacuation of Offshore Installations, PhD thesis, 125 pages.
NORSOK Standard, 2004, Working environment.
OGP, Safety Performance Indicators – 2011 data, 2012, International Association of Oil
& Gas Producers.
Okstad, E., Jersin, E. and Tinmannsvik, R.K. Accident investigation in the Norwegian
petroleum industry – Common features and future challenges, Safety Science, 2012,
50, (6), p 1408-1414.
O’Hagan, A. (1998) Eliciting expert beliefs in substantial practical applications.
Statistician, 47, 21–35.
Olsen, O.E. and Lindøe, P.H. Risk on the ramble: The international transfer of risk and
vulnerability, Safety Science, 2009, 47, (6), pp 743-755.
Pearl, J., 1988. Probabilistic Reasoning in Intelligent Systems: Networks of Plausible
Inference. San Francisco, CA, U.S.

115
Ping P., Wangb, K., Kongb, D., Chenb, G., 2018, Estimating probability of success of
escape, evacuation, and rescue (EER) on the offshore platform by integrating
Bayesian Network and Fuzzy AHP, Journal of Loss Prevention in the Process
Industries, Volume 54, July 2018, Pages 57-68.
Project Description Summary - Statoil Canada Ltd., 2016.
Rahman, M.S., Khan, F., Shaikh, A., Ahmed, S. and Imtiaz, S., 2018, Development of
Risk Model for Marine Logistics Support to Offshore Oil and Gas Operations in
Remote and Harsh Environments, Ocean Engineering 174 (2019) 125–134.
Ross, C. and Gibb, G. (2008). A Risk Management Approach to Helicopter Night
Offshore Operations [Online]. Available: http://asasi.
Sentz, K., and Ferson, S., 2002. Combination of evidence in Dempster–Shafer theory.
SAND 2002-0835.
Shafer, G. (1986). Probability Judgement in Artificial Intelligence. Uncertainty in
Artificial Intelligence. L. N. Kanal and J. F. Lemmer. New York, Elsevier Science. 4.
Shafer, G. (1976). A Mathematical Theory of Evidence. Princeton, NJ, Princeton
University Press.
Simon, J., 2007, Bayesian Analysis for the Social Sciences, ISBN-13: 978-0470011546.
Sutton, I., 2014, Offshore Safety Management Implementing a SEMS Program, Elsevier
Inc., ISBN: 978-0-323-26206-4.
Uthaug, E., 2018, Exploration in the remote areas of the Arctic - reflections on logistics
and SAR challenges, ARCTIC FRONTIER 2018, TROMSØ.

116
Vinnem, J.E. Evaluation of offshore emergency preparedness in view of rare accidents,
Safety Science, 2011. 49, (2), pp 178-191.
Vinnem, J.E. Risk indicators for major hazards on offshore installations, Safety Science,
2010, 48, (6), pp 770-787.
Walsh, J.E., 2008, Climate of the arctic marine environment, Ecological Applications,
18(2) Supplement, pp. S3–S22.
Weber, P., Medina-Oliva, G., Simon, C., Lung, B., 2012. Overview on Bayesian
networks applications for dependability, risk analysis and maintenance area. Eng.
Appl. Artif. Intell. 25, 671–682.
Yager RR. On the Dempster-Shafer framework and new combination rules. Information
Science, 1987; 41(2):93–137.
Yuan, Z., Khakzad, N., Khan, F., Amyotte, P., 2015. Risk-basedoptimal safety measure
allocation for dust explosions. Saf.Sci. 74, 79–92.
Yuan, Z., Khakzad, N., Khan, F., Amyotte, P., Reniers, G., 2013. Risk-based design of
safety measures to prevent and mitigate dust explosion hazards. Ind. Eng. Chem. Res.
52 (50), 18095–18108.
Zadeh, L. (1965). ‘‘Fuzzy sets,’’ Inf. Control, vol. 8, pp. 338–353.

117
4. Conceptual Development of an Offshore Resource Centre in
Support of Remote Harsh Environment Operations
Md Samsur Rahman, Bruce Colbourne and Faisal Khan
Centre for Risk, Integrity and Safety Engineering (C-RISE)
Faculty of Engineering & Applied Science
Memorial University of Newfoundland, St John’s, NL, Canada A1B 3X5
Co-authorship statement
A version of this manuscript is published in Ocean Engineering. Along with the co-
authors, Bruce Colbourne and Faisal Khan, the lead author Md Samsur Rahman
formulated the design criteria and developed the concept. Md Samsur Rahman developed
the methodology, performed analysis, investigation, prepared original draft and revised
the manuscript based on the co-authors’ feedback and also the peer review process. Bruce
Colbourne supervised and contributed in developing the methodology, formal analysis,
writing - review & editing. Faisal Khan supervised and helped in developing the
methodology, writing - review & editing, project administration, funding acquisition.
Reference: Rahman, M.S., Colbourne, B., Khan, F., 2020. Conceptual development of an
offshore resource centre in support of remote harsh environment operations, Ocean
Engineering, 203. https://doi.org/10.1016/j.oceaneng.2020.107236.
Abstract
The design and operational planning of an offshore installation must consider
environmental challenges along with additional difficulties that arise due to remoteness.

118
Among the major operational issues, logistics support during routine operations and
emergencies is critical. The logistics support from an onshore base to a remote and harsh
environment offshore production facility is not sufficiently reliable and quick. In this
study, the concept of an intermediate offshore resource centre (ORC) as a potential
solution to the logistics problem is presented. The purpose, functional requirements and
the conceptual design of an ORC with an illustrative example are discussed. A modular
volume-limited ship design concept is adopted here to determine the principal particulars
of the ORC in the concept design phase. The required functional elements of the ORC are
identified, and then the physical space required for each element is represented
graphically as a scaled block with the required volume. The principal dimensions are
determined after arranging these functional blocks within a ship-shaped envelope. Finally,
the concept design of the vessel system is tested and validated with an analysis of the
vessel stability and mooring requirements.
Keywords: Offshore resource centre; remote operation; emergency management,
offshore logistic; harsh environment; offshore risk analysis.
4.1 Introduction
Extraction of hydrocarbon in northern offshore regions poses significant challenges due
to extreme physical environmental conditions (Hamilton, 2011; Khan et al., 2014;
Meling, 2013; Necci et al., 2019). In addition to the environmental challenge, regular
logistics support and emergency response become more and more difficult for remote
platforms. Long-distance operation of helicopters is particularly risky (Nascimento et al.,
2015; Oil & Gas UK, 2013a). Also, the use of a helicopter is limited when weather is not

119
favorable. The idea of an intermediate offshore resource centre (ORC) originated when
considering these issues. In previous studies (Rahman et al., 2020, 2019) the logistical
challenges of remote offshore operations are identified. These papers present a
probabilistic risk analysis using the fault tree (Rahman et al., 2019) and the Bayesian
network (Rahman et al., 2020) that essentially estimated the risk of logistics support
operation failure in a remote harsh environment. In the main, these risks are shown to be
most significantly associated with the distance from shore-based support, particularly the
extended flying distance for helicopter based supply and crew transfer. Additional risk of
logistics failure is associated with the difficulty in providing timely emergency response
and in mobilizing shore-based equipment and assets in response to a remote offshore
incident. One practical solution to mitigate both these risks is to provide an intermediate
platform or vessel that allows aircraft an intermediate landing/refueling location and at
the same time provides a forward staging point for emergency response equipment.
In the current study, the space requirement and thus the overall dimensions of the ORC
are estimated to meet the functional requirements for logistics supply to single remote
platform. However, the concept and the approach remain the same for supporting multiple
oil field operations. The space requirement to support multiple platforms can be
determined using the same approach to that presented in this study. Thus the concept
remains the same but the size may increase. Such a platform probably becomes more and
more economically efficient as it services a greater number of offshore installations.

120
An ORC reduces the risk for daily operations in addition to providing a forward base for
emergency response. Thus, the ORC has two primary mission requirements for cases
where an offshore development is exceptionally remote from land-based support:
- Provide an intermediate point for helicopter operations that enables refueling,
alternate landing and shorter transit distance.
- Provide a forward staging or response asset for emergency response in case of
fire, spill, sinking or ice damage.
This study is part of a larger research project aimed at identifying risks and risk reduction
measures, including the economic costs and benefits of the risk reduction measures, with
a particular emphasis on remote offshore operations in harsh environments. The objective
of this component of the larger study is to develop one particular risk reduction measure
which addresses the most significant risks identified in earlier parts of the study.
The concept of an intermediate offshore base for various logistics support is not entirely
new. The US military studied the idea of a mobile offshore base (MOB) for helicopter
and fixed-wing cargo aircraft operation, maintenance and other military logistical
supports. The mission requirements for fixed wing aircraft needed a very large floating
structure of approximately 1500 m in length. The technical and financial feasibility were
both significant concerns associated with such an enormous floating structure
(McAllister, 1997; Naval Facilities Engineering Service Center, 2000; Remmers et al.,

121
1998). (Nordbø, 2013) presented mathematical models to study the feasibility of
intermediate bulk storage to support multiple remote hydrocarbon production facilities.
The concept of such a logistics hub for personnel accommodation is found in (Moyano,
2016; Vilameá et al., 2011). Accommodation vessels and semi-submersibles also referred
to as “Floatels” are often used near or together with the production facilities for
accommodating offshore workers (Floatel International Group, 2019; Prosafe, 2019;
Pérez et al., 2012).
None of the above concepts provide a suitable starting point for the proposed ORC, and
thus a concept is developed from basic requirements. The conceptual model of an
offshore resource centre starts with defining functional requirements and environmental
constraints followed by selection of the type of structure that can be suitable for these
requirements. Space requirements are estimated for each of the functional requirements to
determine the overall space requirement for the ORC. Figure 4.1 illustrates the basic
functional concept of an intermediate distance offshore resource centre (ORC) for
logistics support of one or more offshore platforms. In particular, offshore personnel are
carried on/off the ORC from the onshore base and the production platform by helicopters
(preferable and weather permitted) or marine vessels. The ORC thus needs to be equipped
with facilities to accommodate in-transit personnel during their transit hours. A more
detailed study would be required to model scheduling of such transfer operations that is
not included here. This paper aims to outline the requirements of the ORC platform and

122
provide a conceptual design outline for a moored vessel that meets the identified
requirements.
Figure 4.1: A solution for logistics support and emergency response in remote harsh
environments
4.2 ORC Performance Requirements
Performance requirements for the ORC stem from the previous risk analysis (Rahman et
al., 2020, 2019) and from the operating environment. The risk reduction objectives for the
platforms are to reduce the effective flying distance to the production platform, and to
provide more timely emergency response. These objectives are largely independent of

123
operating location and are covered in more detail in the following section. Environmental
conditions are location specific and in the present study we have chosen the North West
Atlantic as an illustrative operational scenario. This environment presents a number of
challenges. This choice is also driven by current consideration of a remote location for
offshore oil production.
4.2.1 Risk reduction objectives
The main operational function of the ORC is to serve as a helicopter intermediate landing
point. This function requires that the ORC be positioned at a fixed location to provide an
intermediate stopping point for regularly scheduled helicopter operations to and from the
remote production facility. This would incorporate the ability to land and refuel two
helicopters simultaneously and potentially provide service to one. The concept of an ORC
as a mid-way stopping point for one or more remote platforms means that it is entirely
likely that one helicopter would be inbound while another is outbound. Furthermore, in
the case of emergency it would be advantageous to be able to operate two transports and
have some redundancy in the system.
As part of the role of intermediate landing point, the ORC would also provide temporary
accommodation with required amenities for in-transit offshore personnel. This will be
used as a station for the personnel of the production platform on their way to/from the
production installation.

124
The final regular function of the ORC would be to provide local and regional
communications with the production facilities, nearby vessels and other installations in
the vicinity, rescue craft and coast stations.
The second primary function of the ORC is as an emergency response centre. In this
mode the ORC would respond to emergency incidents such as fire, explosions, leak,
spills, human or weather-induced damages, equipment failure, etc. Response equipment,
particularly for spill containment would be stored on board the ORC to speed reaction to
offshore incidents by supply and standby vessels. The ORC would also provide, in case of
platform abandonment, the capacity to accommodate evacuated personnel in emergency
conditions. This would include the ability to deal with casualties.
A possible scenario is considered to be that the ORC moves temporarily closer to the
location of a disaster while standby and other vessels deal with the actual events using
equipment and supplies drawn from that stored on the ORC. This may be augmented by
transferring an emergency logistics support team to respond to an incident, from the shore
base to the ORC. However, this mode of response may not be optimum if it limits flight
operations by increasing the flying distance to the ORC. Rather than preclude this
response possibility at this concept stage, the system is conceived to provide the ability to
move off station for emergency response. In either mode of response – on or off station –
the ORC is configured to acts as a local command centre for emergency response.
125
Hence, the performance requirements of the ORC can be summarized as:
- Maintain position at a fixed location with an ability to move.
- Provide a base for helicopter landing, refueling and service.
- Provide short term in-transit accommodation for regular passengers.
- Have the ability to move off station in the event of emergency.
- Provide short term accommodation for emergency responders.
- Provide forward storage and distribution of emergency response equipment and
supplies
- Accommodate personnel from the production platform in case of evacuation.
- Provide medical facilities for emergency treatment.
- Provide local and regional communications with the production facilities, nearby
vessels and other installations in the vicinity, rescue craft and coast stations.
- Act as an incident command centre for emergency response.
4.2.2 Environmental Conditions
The Flemish Pass Basin is chosen for a case study to illustrate the concept design
development of the ORC. Although some aspects of an ORC are site independent, other
aspects would be dependent on location. Thus the basic functions are dictated by the
distance of the supported platform from shore, but environmental conditions are site
specific and thus it is necessary to have an example location to fully develop the concept.
Other locations would maintain the basic concept and concept development process but
exhibit different characteristics based on the requirements of the specific location.

126
The Flemish Pass basin is located approximately 480 km east of St. John’s,
Newfoundland and Labrador. Equinor Canada Ltd. (Equinor) is proposing to conduct an
exploration drilling project in the Flemish Pass Basin between 2019 and 2027 (Canada
Impact Assessment Act, 2019). In this study, the proposed ORC would be located at an
intermediate location between the shore (St. John’s) base and the drilling sites. Although
the Flemish Pass is a deep water location at the edge of the continental shelf, the ORC is
likely to be located on the Grand Banks, which is part of the continental shelf, as that is
the intermediate location – see Figure 4.2.
Figure 4.2: The possible location of the ORC offshore Newfoundland

127
This example location is immediately relevant as the region is in the early stages of
consideration for development and the distance from land is likely to be the most
challenging aspect of the development. This provides a real-life example that fits the
ORC concept. In addition, this region lacks the density of existing offshore installations
that can provide mutual support such as would be available in other regions such as the
North Sea.
Information about physical environmental conditions off Newfoundland (near the Grand
Banks and Flemish Pass regions) is extracted from (ISO 19906, 2010; Nalcor Energy,
2017). These regions are considered to be harsh environments conditions due to the
likelihood of intense storms and the presence of seasonal ice (pack ice and icebergs). Ice
accretion on marine structures can also occur between December and March because of
temperature, wind and wave conditions. During the spring and summer months, poor
visibility often occurs due to fog. Restricted visibility may also occur during winter
months caused by snow in addition to fog and mist. Representative physical
environmental conditions are presented in Table 4.1.

128
Table 4.1: Physical environmental conditions of Flemish Pass and Grand Banks regions
Parameter Classification
Flemish
Pass
Grand
Banks
Water Depth 550-1200 75-125
Wind Speed (m/s)
Mean (Annual) 9.74 9.17
100 year (Annual) 33.4 32.5
Significant Wave Height
(m)
Mean (Annual) 3.23 2.97
100 year (Annual) 16.3 15.6
Current Velocity (m/s)
Average 0.22 0.18
100 year extreme value 1.38 1.3
Pack Ice
Annual mean pack ice concentration 4/10-6/10 4/10-6/10
Floe thickness (m) 0.7-1.2 0.7-1.2
Iceberg
Total Iceberg Counts (open water) between
1998-2012
22 442
Mean iceberg size (m) 66 85
Harshness Index Fleming-Drover 2.65 2.27
The harshness index suggests that the Flemish Pass region has more extreme
environmental conditions than the Grand Banks which has higher wind speed, wave
height, water depth. Although, Data shows that there are fewer icebergs in the Flemish
Pass area than Grand Banks. The physical environment of both these areas is considered
for the ORC design since it would be operated in both these regions.

129
4.3 Concept Development
4.3.1 Platform Type
Based on the requirements outlined above, several platform options were evaluated,
including a fixed platform, a semi-submersible platform, and a ship-shaped platform.
Since one of the functions of the ORC is that it should be able to respond during
emergency conditions, it must be a floating structure with a propulsion system. This
eliminates the idea of a fixed platform. Although, a semi-submersible has lower motions
than a ship-shaped vessel, a ship-shaped vessel is preferable to a semi-submersible in ice
conditions although motion stability needs to be considered for determining the principal
dimensions of a vessel to ensure crew comfort and safer helicopter operation in expected
sea conditions. Furthermore, it is expected that a ship would achieve faster response for
emergency support.
4.3.2 Positioning
The ORC is expected to be moored at an intermediate location on the Grand Banks and
thus in relatively shallow approximately 75m – 125m water. The vessel may also operate
in deep water (550-1200m) and will be subject to high wind and waves. Also, there is a
likelihood of the presence of pack ice and icebergs over the operating region. Either
dynamic positioning (DP) or anchor mooring can be used for station keeping in this water
depth range.

130
The life cycle cost of a full time DP system is relatively expensive. There are regulatory
requirements for system redundancy and equipment space that introduce significant initial
cost. In comparison, the initial cost of an anchor mooring system is lower but costs
associated with the on-site installation offset some of the lower equipment cost.
The more significant drawback is that during operation, a full time DP system requires
continuous fuel supply to keep the system active, which adds to the operating costs in
terms of both fuel costs and delivery.
The requirement to minimize vessel motions and mooring loads leads to a preference for
a weathervaning system rather than a spread mooring. This led to consideration of a
scaled-down turret mooring which would provide the weathervaning capability but did
not require the fluid transfer capability fitted in most offshore turret moorings. In a turret
mooring system, several mooring legs are attached to a turret that includes bearings to
allow the vessel to rotate 360° around the anchor legs. Turret moorings are mostly used
for weathervaning monohulled vessels. This enables the vessel to change heading into the
dominant weather thus minimizing environmental loads and vessel motions. A turret may
be mounted outside the bow or inside the forward half of the vessel hull in an internal
turret configuration. The internal configuration is preferable for more severe
environments particularly those with ice as the mooring components are protected from
ice impact.

131
A disconnectable version of a turret mooring provides for the stated requirements to move
off station in emergencies. Disconnectable versions of the internal turret consist of a
submerged spider buoy coupled to the lower portion of the rotating turret and supporting
the individual mooring lines. When the buoy is disconnected, it sinks to a predetermined
depth and supports the mooring lines above the seabed making reconnection relatively
straightforward (Chakrabarti, 2005).
A typical example of a disconnectable internal turret is the Terra Nova FPSO turret
system (Duggal et al., 2000). The Terra Nova FPSO operates in similar environmental
conditions. The basic ideas of this system can be adopted for the ORC concept. However,
the mission and size of the ORC is substantially different from the Terra Nova FPSO and
thus the details of the ORC mooring system would be relatively simpler and smaller.
In summary, considering the required functions of the ORC and the example
environmental conditions, a full time DP system was judged to be too operationally and
environmentally expensive as the positioning system and a passive weathervaning anchor
mooring was judged to be preferable.
The possible use of a DP system for mooring assist or for position maintenance when off
the mooring is incorporated into the concept but in this case the system is supplementary
to the main passive mooring system.

132
4.3.3 Vessel Development
Having established the basic requirements for a ship shaped platform on a passive
weathervaning and disconnectable mooring, the layout of the vessel itself was developed.
The ORC has elements of widely varying ship types and there is no single historical basis
ship type to start the concept design process. The mission requirements of ORC partially
match those of offshore support/standby vessels, accommodation vessels/flotels, and
military fleet support ships. The ORC needs much larger capacity than an offshore supply
vessel. Accommodation vessels or flotels are specifically designed for passenger
accommodation and not designed for emergency support. The ORC has a requirement to
accommodate in-transit platform crew, or possibly evacuees, generally for short periods
but possibly for longer periods of up to a day or two. Floatels provide longer term
accommodation and food service for a similar client group and thus some of the features
of floatels were considered in developing the ORC. Fleet replenishment vessels are larger
ships used by the military to provide logistics support to combat vessels. These vessels
are frequently based on RO-RO vessels due to a requirement to deliver land forces, which
is not a mission requirement of the ORC. Since there is exactly no basis ship for ORC,
but there are elements of ORC in a number of existing ship types, the concept design is
developed using a process where the desired particulars and design features of all these
types of ships are used.
Helicopter operation
The ORC includes two helicopter platforms to meet the functional requirements.
Helicopters are used for two purposes depending on weather conditions and the mode of

133
ORC operation: transporting crews to/from the onshore base and production platform, and
emergency support such as search and rescue operations. Since regular helicopter
operation would be conducted in two directions, there would be a significant number of
inbound and outbound flights to the ORC. In addition, in the situation when one helideck
is occupied by a helicopter, then another landing area would be required if another
helicopter needs to land. Based on this demand, the ORC would have two full sized
helidecks. In addition, there is an expectation that helicopters may need to be serviced or
wait out inclement weather so a hangar is fitted to one of the helicopter decks for storage
of one (or more) of the helicopters.
The proposed relatively high frequency of helicopter operations requires consideration of
a control tower for regional air traffic management and for landing and takeoff control.
This space would ideally have visual contact with both of the helicopter decks and so
would be located centrally in the vessel either above or just below the bridge deck. This
has been incorporated into the concept.
Current operations on the east coast of Canada are generally conducted using Sikorsky
S92 Helicopters, a relatively large aircraft with characteristics provided in Table 4.2. Data
from Sikorsky S-92 specifications are collected from (Lockheed Martin, 2019).

134
Table 4.2: General characteristics of Sikorsky S-92
Crew 2 (pilot, co-pilot)
Capacity 19 passengers
Length 20.88 m
Rotor diameter 17.17 m
Height 4.71 m
Empty weight 7,030 kg)
Loaded weight 12,020 kg
Max. takeoff weight 12,568 kg
Fuselage length 17.1 m
Fuselage width 5.26 m
Maximum speed 306 km/h
Cruise speed 280 km/h
Range 1000 km
Dimensioning of the helidecks and hangars is based on this aircraft. Consideration of
helideck arrangements are presented in the following:
Ship motion and air turbulence should be minimum for the safe landing of a helicopter. A
vessel has relatively lesser motions at the amidships, however, this competes with other
systems installed topside, for example, deckhouse, intakes and uptakes (Lamb, 2004).
Hence, forward and aft locations are more readily available and provide better approaches
for landing and taking off. An aft location is typical for naval ships but helidecks are

135
usually fitted at the fore part or above the wheelhouse in offshore supply vessels. A
helideck can be placed at the aft and another at the forepart of the ORC. An advantage of
arranging separate helidecks at the fore and aft is a safer design that isolates hazards or
accidents on one deck from the other.
Offshore vessels with helicopter refueling systems have special design and construction
requirements. Since the ORC would be equipped with a helicopter refueling system, the
concept is compliant with existing regulations indicated by the regulatory bodies such as
Civil Aviation Authority, classification societies, etc. Hence, the space for Fuel Storage
and Refueling Equipment Area, fire safety system, and electrical system is notionally
included in the concept but would be detailed during a later design phase.
Emergency Equipment
As one of the important functional requirements, the ORC would be equipped with
emergency response (ER) equipment and supplies and an arrangement for deploying them
when required. For the present concept, the ORC would operate as a kind of mothership
that would coordinate operations with other vessels during emergencies. Under this
scenario the ORC could move to the accident site for ER and work with other available
assets or remain on station. In either case the ORC would serve as the command and
control centre for the coordinated response. Significant space under the main deck is
included to store the equipment and space and crane capacity is provided on the main
deck for deployment. In addition, the ORC would have a designated space on the deck to

136
safely recover persons from the water and/or other craft. A list of stored emergency
equipment is provided below (CNLOPB, 2018; Oil and Gas, 2013b):
Oil recovery equipment. Space is allocated in the ORC to store recovered oil with a
capacity of 10,000-bbl storage.
Survivor rescue equipment. The ORC would be equipped with fast rescue craft (FRC) and
Launching Arrangements, survivor retrieval devices, climbing aids, rescue hooks, and
lifebuoys to meet the requirements of the LSA Code, Section 2.1.
Firefighting equipment. The design criteria and functional requirements would be adopted
from firefighting ships and the guidelines are available in class rules e.g. ABS FFV 1,
FFV 2, or FFV 3.
Command Centre
A specific operational space located above the bridge deck is provided with
communications capability and physical layout for the vessel to be a command and
control vessel or a primary response vessel.
4.3.4 Layout, dimensions and functional relationships
The required elements of the ship/platform are identified considering the main features
above and the more routine aspects of a vessel. The physical size of each element is
estimated, based on similar functional spaces in other vessels, offshore platforms or from

137
land based installations. These space/area/volume requirements are represented
graphically as a scaled block with the required size. Data for individual functional blocks
are drawn from existing examples with the desired functionality, and individually scaled
to fit the expected requirement of the ORC. For example, the disconnectable mooring
turret dimensions are based on turret systems fitted to Grand Banks FPSOs but scaled
down by estimated ship size and reduced by the exclusion of fluid piping and swivels. A
graphical example of estimating the dimension of a hospital block is presented in Figure
4.3. The main functional blocks considered in the concept development are illustrated in
Figure 4.4.
Figure 4.3: An example of estimation the dimension of a functional block

138
Figure 4.4: Example of functional blocks that requires space
The individual blocks are then logically arranged in terms of functional
requirements/relationships and a ship envelope created around the scaled blocks (Figure
4.5). In this way the initial size of the overall ORC vessel is estimated and, where
necessary, the size of functional blocks (such as engine, propulsion, fuel, turret) adjusted
up or down based on the overall size of the ORC vessel. This in turn lead to refinement
of the overall ship envelope, but the process converges much the same way a
conventional ship design spiral converges. This is a variation of the design spiral process
adapted to allow functional elements to be drawn from different ship types and
incorporated into a design with a novel combination of features.

139
Figure 4.5: Function space blocks arranged within ship envelope
A list of all the functional blocks are provided in Table 4.3. The development of the space
requirements for the hospital, mooring system and helicopter operation are described in
some detail in the following sections. These three functions were chosen as examples due
to their relative importance in the ORC concept. They also illustrate the methods used to
adapt functions from other vessels to the ORC concept.

140
Table 4.3: List of functional blocks
Type Name of the Block
Accommodation Transit accommodation
Crew accommodation
Service Food storage and service
Medical Hospital
Tanks and storage
Water
Sewage
General cargo
Store
Bulk space
Fuel
Ballast
Recovered oil
Mooring Turret
Buoy
Helicopter operation
Helideck 1
Helideck 2
Hangar
Aircraft service
Aircraft fuel
Machinery and engine spaces
Engine space
Propulsion
Bow thruster room
Ship control systems
Funnel
Emergency Equipment Emergency equipment storage
Emergency equipment deployment
Control rooms
Bridge
Incident command
Control tower

141
Hospital
As a functional requirement, the ORC would have provision for medical support from a
medical practitioner at any time. The medical facilities consist of the followings
(Norwegian Maritime Medical Centre, 2006):
- A medical unit with pharmacy and medical equipment.
- A treatment room for ill or injured persons.
- One to three medical practitioners who, in cooperation with doctors onshore, will
be responsible for medical first aid and medical treatment.
- A designated decontamination space for cleaning survivors upon retrieval and
prevent contamination of the ORC’s medical or living spaces.
- An enclosed area for survivor reception/triage with access to the accommodations
that are designated for registration, distribution of sundries, etc.
- A designated space for storing non-survivors, which should be cool, ventilated
and illuminated.
The following elements are considered when locating the ship hospital:
- The ability to carry an injured person on a stretcher from the most likely places of
injury to the hospital. The chance of getting an injured person from the production
facility is higher than inbound traffic from shore. The distance from the helipad to
the hospital facility should be a minimum. There should be easy access for patient
ingress/egress from the helideck and rescue zone to the hospital, preferably

142
avoiding stairs/ladders. Also, the location of and angles between corridors and
doors are considered.
- Stable enough to carry out any medical procedure if required.
- Sufficient HVAC (including space for the equipment) is provided to regulate
internal temperatures of the hospital space.
The area of each function of the hospital is estimated based on a hospital ship, LSD-48,
USS Ashland, Whidbey Island-class ship (Carey et al., 2002) and provided in Table 4.4.
However, the numbers required are scaled-down as the ORC is not specifically a hospital
ship and the capacity requirements are much lower.
Table 4.4: Space for hospital
Hospital
Category m2/pa Height
(m)
Total
Area (m2)
Total Volume
(m3)
Decontamination Area 0.51 3 40 120
Main Laboratory 0.92 3 72 216
Pharmacy 0.31 3 24 72
Intensive care ward (2 beds) 0.24 3 19 57
Survivor Reception/triage area 1.54 3 120 360
Hospital administration (staff office and nursing station) 0.38 3 30 90
General care ward (5 beds) 0.21 3 16 48
Non-Survivors 0.23 3 18 54
TOTAL SPACE FOR HOSPITAL FACILITIES 4.35 m2/pa 339 1017
Functional block length (m) 15.07
Functional block height (m)
3
No of Deck 1

143
Mooring system
The use of a disconnectable turret mooring in the ORC is a novel approach as the reduced
size, and lack of fluid transfer functions make it somewhat different from existing
examples. The space requirement is estimated based on the Terra Nova FPSO mooring
system. The Terra Nova FPSO has a disconnectable turret mooring system and this is
operated in a similar environmental condition.
The turret position influences the mooring line tensions, weathervaning capability and the
arrangement of other design blocks. It is easier to weathervane when the turret is moved
further forward from the midship, although the vertical motions will increase and that will
increase mooring line tensions. The turret location is chosen between the forward
helideck and the accommodation blocks in the midship.
Estimate space for turret. At the early stage of the ORC design, not much information is
available and initially assumptions are made. The functional space requirement can be
updated as the concept develops. At the beginning of the concept development, the
mooring system space is estimated by comparing the size (displacement) of the Terra
Nova FPSO and a Royal Canadian Navy joint support ship having a few similar
functionalities to the ORC. Table 4.5 provides the turret specification is estimated after a
few iterations for the projected ORC displacement. Further details of the Terra Nova
FPSO turret system are available in (Duggal et al., 2000).

144
Table 4.5: ORC turret specification
ORC Mooring (Turret) Value Unit
Terra Nova FPSO displacement 193000 Tonne
Estimated volume occupied by Terra Nova FPSO mooring under deck 6380.55 m3
ORC displacement (Iterations) 14994.64 Tonne
Vessel displacement ratio 0.08
Estimated volume of occupied by ORC mooring under deck 495.72 m3
Estimated ORC height (Iterations) 10.1 m
Terra Nova FPSO turret keel and deck diameter ratio 1.79
Projected ORC turret diameter (Deck) 5.59 m
Projected ORC turret diameter (Keel) 10.01 m
Buoy. Similar to the Terra Nova FPSO, a spider buoy will be connected at the lower
portion of the ORC turret. Spaces must be provided for arranging the buoy retrieval
system and load transfer mechanism at the lower turret. The displacement ratio of the
FPSO and the ORC is similarly used to estimate the buoy specifications.
Helicopter Operation
Helidecks. There are two helidecks, fore and aft on the ORC. The helidecks require large
deck areas and unobstructed approach paths. The spaces are determined based on the
type/size of the helicopter that would be landing.

145
According to (ABS, 2015), a helicopter deck containing a circle must have a minimum
diameter equal to the overall length (D or D-value) of the largest helicopter using the
helicopter deck. The approach/departure sector must be at least 210° free of obstruction.
The required minimum deck lengths for the helidecks are given in Table 4.6.
Table 4.6: Helidecks specifications
Helideck Diameter/O.L./D-value (m) Total Area (m2)
Deck (D-value) 21 346.36
Obstacle free sector (0.33D) 6.93 173.25
Total Space 519.61
Functional block length (m)
27.93
Hangar. The ORC requires a helicopter hangar to support embarked helicopters. The size
of the hangar is dictated by the dimensions of the helicopter and clearances for access.
There are three basic types of hangars: fixed or telescoping at the landing deck level, and
below decks (Lamb, 2004). A fixed hangar is placed adjacent to the aft helideck at the
same deck level. The required dimension is determined based on the specification of
example helicopter (Sikorsky S92A). The estimated hangar size is given in Table 4.7.

146
Table 4.7: Hangar specifications
Hanger Dimension
Total
Area (m2)
Helicopter D/O.L. = 21m and H = 5.47m
Allowance D/O.L. + 1m and H + 0.5m 495
Additional space for helicopter maintenance and
access to hospital
22.5
Total Space
517.50
Functional block length (m)
23
Functional block height (m) 5.97
4.3.5 Arrangement of Functional Blocks and Overall Sizing
After determining all the functional block dimensions using the methodology above, the
blocks are arranged in a ship-shaped envelope. When arranging these blocks, the
following relationships are considered:
- Accommodation and hospital spaces are located above the main deck in a
deckhouse to minimize noise and ensure habitability and safety according to the
International Labor Organization (ILO) Regulations on Crew Accommodation and
International Convention for Safety of Life (SOLAS).
- Helipad and hangar are adjacent and located at the same level.
- Hospital is located close to the helideck for easy access.

147
- Tanks and other heavier items are placed on lower decks within the hull.
- The ORC length is dictated by required functional deck lengths where the
helidecks, hangar, accommodation block, mooring, emergency response
equipment need to be placed.
- Bridge, command centre and control tower are located such that visual
obstructions are minimized.
- Helidecks are placed such that enough clearance is provided to mitigate effects
from shipped green water or wave spray.
- Emergency equipment storage is located below the emergency equipment
deployment area to ensure that these are easily accessible.
- The breadth of the ORC is dictated by the helideck specification and vessel
stability requirements.
Based on these considerations, several iterations were performed, moving from the
functional block diagram of Figure 4.5 to the concept general arrangement for the
proposed ORC presented in Figure 4.6 and Figure 4.7. The estimated dimensions
resulting from this assembly are overall length: 159.63 m, breadth: 22.50 m, design draft:
5.80 m.

148
Figure 4.6: The proposed ORC profile to illustrate the arrangement of all functional blocks
Figure 4.7: Main deck layout

149
4.4 Validation of Concept
Two preliminary analyses were conducted to validate the ORC concept. These were the
vessel stability and an analysis of the mooring loads. Stability analysis was performed to
ensure that the dimensions of the vessel, as derived from the assembly of functional
blocks, would provide a vessel concept with reasonable form and stability characteristics.
This is a practical check on the dimensions of the overall vessel. The mooring analysis
was performed to provide a check on the initial mooring dimensions derived from the
functional block estimate for the mooring system. The platform development is an
iterative process and these analyses provide the next iteration on the initial scoping
provided by the functional block process. With the completion of these two analyses, the
concept is validated as a credible platform concept that answers the requirements
developed from the originally referenced risk analysis. Further refinement would be
possible in later stages without changing the basic ideas embodied in the concept.
4.4.1 Vessel Stability
The intact stability criteria are typically evaluated early in a ship development process as
principal dimensions are strongly influenced by stability criteria. The ORC platform
should be compliant with general intact stability criteria for ships (IMO, 2008):
“
- The area under the righting lever curve (GZ curve) shall not be less than 0.055
metre-radians up to θ = 30° angle of heel and not less than 0.09 metre-radians up

150
to θ = 40° or the angle of flooding θf if this angle is less than 40°. Additionally,
the area under the righting lever curve between the angles of heel of 30° and 40°
or between 30° and θf, if this angle is less than 40°, shall not be less than 0.03
metre-radians.
- The righting lever (GZ) shall be at least 0.20 m at an angle of heel equal to or
greater than 30°.
- The maximum righting lever should occur at an angle of heel preferably
exceeding 30° but not less than 25°.
- The initial metacentric height, GM0 shall not be less than 0.15 m.”
Several additional criteria should be satisfied:
- Vessel specific rules i.e. offshore service vessel (IMO, 2008), standby vessel
(DNV GL, 2015).
- Severe wind and rolling criterion (weather criterion) considering the operating
environment of the ORC (IMO, 2008).
- Icing considerations (IMO, 2008).
Although many of the normal inputs such as the loading conditions, weights and positions
of all items, bulkhead arrangements, etc. are not firm at this stage, estimates for cg and
weight distribution are based on similar sized and function vessels. Using the particulars
developed in the concept design, a 3D hull model is generated. The initial hydrostatic
particulars are presented in Figure 4.8.

151
Figure 4.8: ORC hydrostatics particulars
Based on this analysis, the stability of the vessel is shown to be within the regulatory
requirements with the overall dimensions established for the concept ORC.
4.4.2 Mooring Analysis
A numerical analysis of the ORC mooring system is conducted using OrcaFlex. The
numerical model of the chain mooring layout consists of three groups of two mooring
lines, hence a total of 6 catenary mooring lines attached to the turret buoy. The estimated
particulars of the vessel and turret buoy in earlier sections are used to provide the vessel
model. Each group of catenary lines or anchor legs is 120o apart and each leg consists of
studless Grade R4 chain (70 mm diameter) terminating in an anchor pile. A simplified

152
schematic diagram of the ORC mooring arrangement is provided in Figure 4.9. The
model is simulated for a water depth of 150 m. A total of four simulations were
conducted for a combination of extreme and operational environmental conditions at 0
degree and 180 degree heading of environmental loads. These two headings provided
cases where the combined wind-wave-current load acted either on a single mooring line
group or was applied between two groups of mooring lines. The vessel was oriented bow
to weather for all the simulation cases. The model input parameters are provided in Table
4.8.
Figure 4.9: ORC mooring leg arrangements

153
Table 4.8: Model input parameters
Environment Parameter Value Unit
Seabed depth 150 m
Extreme (Heading: 0 and 180
degree)
Wave
Wave spectrum JONSWAP
Hs 16.00 m
Tz 20.00 s
Gamma 2.00
Current Speed 1.38 m/s
Wind Speed 33.60 m/s
Operational (Heading: 0 and 180
degree)
Wave
Wave spectrum JONSWAP
Hs 3.23 m
Tz 8.94 s
Gamma 1.00
Current Speed 0.22 m/s
Wind Speed 9.74 m/s
Mooring lines (1-
6) Parameter Value Unit
Line properties
Length 850 m
Radius from buoy
joint 815 m
Cable type Chain
Bar diameter 0.07 m
Link type Studless
The turret and buoy are connected to the ORC through a constraint object that allows the
vessel to rotate about the z-axis only. This enables the vessel to weathervane without
rotating the mooring lines with it. The effects of wave load (1st order), wave drift load
(2nd order), wave drift damping, added mass and damping, current load and wind load

154
are considered in the simulation. Three DOF static analysis is also included that solves
the vessel position to equilibrium before dynamic simulation starts. Suitable added mass
and damping coefficients are chosen based on previous similar sized vessels. For each
case, simulation is run for 1800 seconds and the time series data of leg 3 tensions for the
most extreme condition (Case 4: extreme weather and 0 degrees heading) is provided in
Figure 4.10. The graph shows several peak tensions at the mooring line crossing 150 ton-
force (tef) and the maximum value reaches 320.11 tef in 1290 sec due to a large wave
where a major portion of environmental load is transmitted to leg 3. This represents the
worst possible scenario as it is seen from Figure 4.11 that maximum tensions are
significantly lower than this value for other cases. Also, the maximum tension never
exceeds the chain proof load.
Figure 4.10: Leg 3 tensions for extreme weather and 0 degree weather heading

155
There is no doubt that the mooring concept can be further refined and considerations such
as DP assist for extreme load cases might also be considered in future iterations as a
means of reducing the chain size or length. However, this analysis establishes a
reasonable first indication of an appropriate mooring concept for the ORC platform.
Figure 4.11: Average and maximum mooring line tensions for all 4 cases
4.5 Discussion
In this study a vessel of approximately 160 m length is developed and demonstrated to be
a viable conceptual solution to reduce the risk associated with isolated or low density
offshore operations, located at extreme distances from shore bases. The main
characteristics of the ORC are summarized in Table 4.9. The proposed concept provides
an intermediate landing/refueling location for long range helicopter operations and a safe
haven in case of changing weather, mechanical or personnel emergency. In the absence of

156
any other landing or staging point between a shore base and a remote offshore platform, a
floating vessel type platform specifically developed for the intended purpose may provide
the enabling technology for distant offshore developments. In the particular case studied
here, a ship-shaped platform is selected due to favorable operating characteristics in ice
prone environments.
Since there is no previous basis ship or platform, which has the complete similarity of all
the functional requirements of the concept ORC, the functional requirements of the ORC
are identified and the space requirements for each functional block are estimated. The
blocks are logically arranged to determine the required overall size of the ORC vessel.
This method has proven to be a quick and accurate means of concept development for a
novel installation and leads to consideration of the required functionality before
consideration of vessel size or type. This method for combining capabilities from
different marine platforms is shown to be a convenient and workable tool. It offers
flexibility in concept development, which can be modified based on the relative
importance of various attributes of the ORC and the environmental conditions. The
method also allows alternative approaches to be considered for platform development.
For example, it may be possible to convert an existing vessel to an ORC as an alternative
to a new construction. The process of establishing blocks of functional space
requirements would allow alternatives such as conversion to be evaluated in comparison
to the purpose built concept presented here.

157
Table 4.9: ORC Principal Dimensions and Characteristics
Vessel LOA 159.63 m
Beam 22.50 m
Depth 10.10 m
Draft 5.80 m
Mooring Type Disconnectable
turret
Chain diameter 70 mm
Chain Length 850 m
Mooring legs 3×2, Catenary
chain
Accommodations Crew 42 persons
In-transit POB 36 persons
Temporary stay Up to 150 persons
Helicopters Helidecks 2×Large
helicopters e.g.
Sikorsky S-92
Hangar Up to 2 Large
helicopters
The two key functionalities considered in this study and concept development are
helicopter operations and the disconnectable mooring system. A disconnectable turret
mooring system is proposed for station keeping that consists of 3×2 catenary chain
mooring lines and a small spider buoy connected to an internal rotating turret. There is
158
some remaining engineering uncertainty around smaller scale turret mooring system, as
there are no similar scale vessel systems in existence, but no obvious technical obstacles
are found in this analysis. The concept of using a disconnectable turret mooring system
for station keeping is a mature technology with similar mooring systems used for the
Terra Nova and SeaRose FPSOs, operating in similar environmental conditions. The
weathervaning capability improves the ORC operability in the expected sea states and the
disconnectable buoy enables the vessel to relocate when required. Proportionally less
space is needed on the ORC vessel for the turret installation due to the lack of fluid
transfer.
Preliminary design analysis shows that the ship size and dimensions are reasonable and
that the conceptually developed mooring size is practical. A static and dynamic analysis
of the concept mooring system is conducted using the numerical analysis software,
OrcaFlex. Result show that mooring line tensions are within the chain limits although it is
recognized that there is likely still considerable room for further refinement. Seasonal ice
management may also be used to reduce mooring loads and provide access of supply
vessels for cargo handling operations or emergency response.
Helicopter operations are incorporated as two full-sized landing areas at bow and stern of
the vessel with a hangar located at the stern helicopter deck. This provides various
options for landing, multi-helicopter operations and provision for servicing if required.
The vessel size of the ORC provides a more stable landing platform than a smaller supply

159
vessel and the availability of two landing options should provide operational weather
limits comparable to the much larger FPSO vessels. Low height helideck arrangements
are expected to give better-operating capabilities compared to supply vessels or FPSOs
where helidecks are often placed above the height of the wheelhouse. The aft helideck is
likely to provide more favorable landing conditions than the forward helideck due to the
weathervaning of the vessel, providing a generally into the wind approach. The presence
of a hangar can facilitate the storage of helicopter (s) during storm conditions.
Emergency response functionality is also incorporated into the ORC concept as this is
also identified as a high risk issue for remote platform operations. The concept is
developed as a forward base for response equipment and as a command and control centre
for emergency response. Both these functions serve to improve response time which is
essentially a risk mitigation strategy more so than the prevention strategy embodied in the
idea of an intermediate helicopter base. Thus the platform provides two risk reduction
approaches for two of the major risks identified in the previous analysis of long range
offshore production operations.
The installation of an ORC with these capabilities in the presented example location
provides a single-leg journey distance that is well within the current operating experience
and operational limits for existing floating production platforms in the same region. The
ORC incorporates accommodations for in-transit personnel and reserves the required
resources to support emergencies. This addresses the major challenges for distant offshore

160
operation in harsh environmental conditions and provides a platform to meet the
previously identified risk reduction objectives.
This ORC concept, and indeed the overall idea of reducing the logistical support or
emergency incident risk factors by the installation of an auxiliary platform located at an
intermediate location, represents a conceptually simple idea to enable more remote
offshore operations. The ORC concept is shown to fit within a reasonable sized ship
envelope, bigger than a supply vessel, but, much smaller than a production platform i.e.
FPSO. Capital and operational costs for such a platform would be significant, but the
development of a viable platform concept provides the first step in a full evaluation of the
costs and benefits of such a risk reduction strategy. Further design iteration would firm up
the concept and allow more detailed analysis of the ORC as a risk reduction strategy,
including life cycle costs. As a technologically straightforward solution for supporting
remote offshore operations in the North Atlantic the ORC concept should be further
analyzed and considered.
4.6 Conclusion
As follow-on from a previous risk analysis of permanent offshore production operations
in remote and environmentally challenging locations, this study presents the conceptual
development of a moored vessel that can be used as an intermediate offshore base for
regular logistic support operations and emergency response in a remote harsh
environment. The proposed ORC concept study outlines the following unique ideas.

161
- The concept of this floating vessel may reduce many operational challenges and
risks further offshore, particularly in ice-covered regions.
- Since there is no existing vessel/platform that can meet the required missions, a
modular/block ship design concept is applied, where the space requirements of
each functional block are estimated from similar ship data.
- In the process of concept development, relevant regulations and guidelines for the
vessel design are explored that may guide in the future for the physical
development of this concept.
- The concept design of the ORC suggests some unique design features such as a
disconnectable turret mooring system and helideck configurations. The basis of
these design features is also described.
This concept development can be furthered by collecting more practical data and input
from the industry but the concept is shown to be technically viable. A cost-benefit
analysis should be conducted to study the economic implications of this proposed risk-
reduction strategy. This could lead to a framework to optimize the platform concept in
both economic and technology terms. The concept here presents a start point for further
analysis of what is thought to be one of the very few viable alternatives for the considered
operational scenario.
References
ABS, 2015. Guide for the Class Notation Helicopter Decks and Facilities ( Helidk and
Helidk ( Srf )). Available at: https://ww2.eagle.org/content/dam/eagle/rules-and-
162
guides/current/other/213_classnotation_helidk_helidksrf/Helicopter_Decks_Guide_e-
Oct15.pdf. Accessed: October 2019.
Canada Impact Assessment Act, 2019. Flemish Pass Exploration Drilling Project.
Available at: https://ceaa-acee.gc.ca/050/documents/p80129/129198E.pdf. Accessed:
October 2019.
Carey, N., Grefer, J., Trost, R., Levy, R., 2002. Future Deployable Medical Capabilities
and Platforms for Navy Medicine. Available at:
https://www.cna.org/CNA_files/PDF/D0005085.A2.pdf. Accessed: October 2019.
Chakrabarti, S., 2005. Handbook of Offshore Engineering (2-volume set).
CNLOPB and CNSOPB, 2018. Atlantic Canada Standby Vessel Guidelines. Available at:
https://www.cnsopb.ns.ca/sites/default/files/pdfs/ac-
sbv_guideline_first_edition_june_2015_0.pdf. Accessed: October 2019.
DNV GL, 2015. RULES FOR CLASSIFICATION Part 3 Hull Chapter 15 Stability.
Available at: https://rules.dnvgl.com/docs/pdf/dnvgl/ru-ship/2017-01/DNVGL-RU-
SHIP-Pt3Ch15.pdf. Accessed: October 2019.
Duggal, A.S., Heyl, C.N., Vance, G.P., 2000. Global analysis of the Terra Nova FPSO
turret mooring system. Proc. Annu. Offshore Technol. Conf. Houston, Texas.
Floatel International Group. Available at: http://www.floatel.se/offshore-floatels.
Accessed: October 2019.
Hamilton, J.M., 2011. The challenges of deep-water arctic development. Int. J. Offshore
Polar Eng. 21, 241–247.
IMO, 2008. International Code on Intact Stability. RESOLUTION MSC.267(85).

163
ISO 19906, 2010. Petroleum and natural gas industries - Arctic offshore structures,
Available at: https://www.iso.org/obp/ui/#iso:std:iso:19906:ed-1:v1:en. Accessed:
October 2019.
Khan, F., Ahmed, S., Hashemi, S.J., Yang, M., Caines, S., Oldford, D., 2014. Integrity
challenges in harsh environments: Lessons learned and potential development
strategies. Inst. Chem. Eng. Symp. Ser. 1–7.
Lamb, T., 2004. Ship Design and Construction, Volumes 1-2. Society of Naval Architects
and Marine Engineers (SNAME).
McAllister, K.R., 1997. Mobile offshore bases an overview of recent research. J Mar Sci
Technol 2173-181.
Meling, T.S., 2013. Deepwater floating production systems in harsh environment - A look
at a field development offshore Norway and need for technology qualification. Proc.
Annu. Offshore Technol. Conf. 3, 1890–1898. https://doi.org/10.4043/24511-ms.
Moyano, S.F.M., 2016. Design of a Logistic Hub Platform for Oil & Gas Production
Fields. Masters thesis. Instituto Superior Técnico. Masters thesis. Instituto Superior
Técnico. Lisbon, Portugal.
Nalcor Energy, 2017. Metocean Climate Study Offshore Newfoundland & Labrador
STUDY MAIN REPORT Volume 1 : Full Data Summary Report 2.
Nascimento, F.A.C., Majumdar, A., Ochieng, W.Y., Schuster, W., 2015. Night-time
offshore helicopter operations : a survey of risk levels per phase of flight , flying
recency requirement and visual approach technique. The Aeronautical Journal. Vol.
119 No. 1222.

164
Naval Facilities Engineering Service Center, 2000. Mobile offshore base (MOB) science
and technology program final report. Technical report TR-2125-OCN. Port Hueneme,
California.
Necci, A., Tarantola, S., Vamanu, B., Krausmann, E., Ponte, L., 2019. Lessons learned
from offshore oil and gas incidents in the Arctic and other ice-prone seas. Ocean Eng.
185, 12–26. https://doi.org/10.1016/j.oceaneng.2019.05.021.
Nordbø, H., 2013. Optimal configuration of supply logistics for remote oil and gas fields.
Masters thesis. Norwegian University of Science and Technology. Trondheim,
Norway.
Norwegian Maritime Medical Centre, 2006. Recommendations for Ship Medical
Facilities. Available at: https://helse-bergen.no/seksjon/maritim-
medisin/documents/recommendations%20for%20ship%20medical%20facilities.pdf.
Accessed: October 2019.
Pérez, R., Lamas, M., Carral, L.M., 2012. Classification and damage stability of flotel
ships. J. Marit. Res. 9, 33–38.
Prosafe. Available at: https://www.prosafe.com/. Accessed: October 2019.
Rahman, M.S., Khan, F., Shaikh, A., Ahmed, S., Imtiaz, S., 2020. A conditional
dependence-based marine logistics support risk model. Reliab. Eng. Syst. Saf. 193.
https://doi.org/10.1016/j.ress.2019.106623
Rahman, M.S., Khan, F., Shaikh, A., Ahmed, S., Imtiaz, S., 2019. Development of risk
model for marine logistics support to offshore oil and gas operations in remote and
harsh environments. Ocean Eng. 174. https://doi.org/10.1016/j.oceaneng.2019.01.037

165
Remmers, G., Zueck, R., Palo, P., Taylor, R., 1998. Mobile offshore base. Proc. Int.
Offshore Polar Eng. Conf. Montreal, Canada.
Sikorsky S-92 Helicopter (Attributes tab) Archived April 15, 2009, at the Wayback
Machine. Accessed: October 2019.
Oil & Gas UK, 2013a. Appendix 1 – Reportable Accidents 1–6. Available at:
https://oilandgasuk.co.uk/wp-content/uploads/2017/07/Appendix-1_Reportable-
Helicopter-Accidents-2017.pdf. Accessed: October 2019.
Oil & Gas UK, 2013b. Emergency Response & Rescue Vessel Management Guidelines
Issue 5 April 2013. Available at: https://lagaay.com/assets-
frontend/flags/Oil%20&%20Gas%20UK%20ERRV%20Issue%206%20April%20201
3.pdf. Accessed: 2019.
Vilameá, E.M., Moreira, M.B.A., Loureiro, R.R., 2011. Logistical Challenges for Crew
Transportation in Brazilian Pre-Salt Province. Proc. Rina 9th Symp. high speed Mar.
Veh. 2011 1–6.

166
5. Risk-Based Cost Benefit Analysis of Offshore Resource Centre to
Support Remote Offshore Operations in Harsh Environment
Md Samsur Rahman, Bruce Colbourne and Faisal Khan
Centre for Risk, Integrity and Safety Engineering (C-RISE)
Faculty of Engineering & Applied Science
Memorial University of Newfoundland, St John’s, NL, Canada A1B 3X5
Co-authorship statement
A version of this manuscript has been submitted to the Journal of Reliability Engineering
and System Safety. Minor revisions are received on this manuscript and a revised version
of this manuscript is submitted to this journal. Along with the co-authors, Bruce
Colbourne and Faisal Khan, the lead author Md Samsur Rahman formulated the problem
and developed the model. Md Samsur Rahman performed literature review, developed the
methodology, performed analysis, investigation, prepared original draft and revised the
draft based on the co-authors’ feedback. Bruce Colbourne supervised and contributed in
developing the methodology, data analysis, writing - review & editing. Faisal Khan
supervised and helped in developing the methodology, writing - review & editing, project
administration, funding acquisition.
Reference: Rahman, M.S., Colbourne, B., Khan, F., 2020. Risk-Based Cost Benefit
Analysis of Offshore Resource Centre to Support Remote Offshore Operations in Harsh
Environment, currently submitted to Reliability Engineering & System Safety for review.

167
Abstract
Marine Logistics support during regular and emergency operations in remote North
Atlantic regions is risky due to longer helicopter flying distances and extreme
environmental conditions. In this paper, the safety and economic aspects of a previously
introduced concept of an intermediate offshore resource centre (ORC) are evaluated
(Rahman et al, 2020a, b). The ORC goals are to provide an intermediate helicopter
landing station and a forward staging area for emergency response. Among many
advantages, ORC mitigates the logistical risk associated with the extended distance from
shore support by reducing the response time in the case of accidents. This paper focuses
on presenting a risk-based cost-benefit analysis of the ORC. A probabilistic loss function
model is developed based on the costs of historical offshore blowout incidents and their
corresponding response times. The cost and benefit model is simulated in a probabilistic
framework using a Monte Carlo simulation. The developed methodology and model help
to assess the financial viability of an ORC assist in informed decision-making regarding
risk reduction measures.
Keywords: Risk Analysis; Offshore Logistic Support; Loss Modelling; Offshore Support
Centre; Risk-based decision; Offshore Safety.
5.1 Methodology to Develop Logistics Risk Model
Activities in remote northern offshore regions are expected to increase, due mainly to
available hydrocarbon resources. The extended distance from shore support and the
inherent harsh environment comprising generally high winds and waves, fog, freezing
temperature, and the presence of seasonal ice all pose significant logistical challenge in

168
maintaining regular operations (Hamilton, 2011; Khan et al., 2014; Meling, 2013; Necci
et al., 2019). Also, a quick response cannot be provided in case of emergency due to the
long distance between shore and the platform(s). The risk associated with the logistical
support operations is analyzed in two previous studies (Rahman et al., 2020a,b; 2019) and
a risk mitigating Offshore Resource Centre (ORC) concept is presented in (Figure 5.1)
Rahman et al., 2020b. The ORC has two primary mission requirements for cases where
an offshore development is exceptionally remote from land-based support:
- Provide an intermediate point for helicopter operations that enables refueling,
alternate landing and shorter transit distance.
- Provide a forward staging or response asset for emergency response in case of
fire, spill, sinking or ice damage.
Figure 5.1: A solution for logistics support and emergency response in remote harsh
environments [revised after Rahman et al., 2020b]

169
As a risk reduction strategy, the cost of an ORC would be a significant fraction of the
development cost for a remote offshore development. Thus it would be beneficial to have
a rational methodology for comparing the costs and benefits of the ORC. These costs and
benefits are evaluated in this paper based on the benefit scenario of response time
reduction for a blowout accident. This evaluation considers only one of the two main
functions of the proposed ORC but provides a methodology which would allow all
functions of the intermediate platform to be evaluated by comparing costs to potential
savings in an operational or emergency scenario.
The first step is to estimate the capital cost of the ORC. There are various methods
available for cost estimation in the shipping business. Caprace and Rigo (2012) classified
the methods for estimating production cost into three categories, namely, top-down,
bottom-up, and life cycle approaches. In a top-down approach, the cost of a new ship is
estimated from the parametric relationships of similar historical ship cost data using
statistical regression analysis. This approach does not require the detailed specifications
of the new ship. It provides a high-level cost estimate under the assumptions that vessels
have similar functionalities and construction procedures remain the same. In a bottom-up
approach, the project is broken down into smaller and smaller intermediate products until
the most basic product is described. This approach is suitable when the detailed design
particulars of a new building ship are available. In this study we have used the top-down

170
method and adapted data from other ship types as there is no historical data for the new
concept ORC.
The second stage is to estimate the life cycle cost (LCC) of the ORC, which is the present
value of total cost that it may encounter over its life cycle. This includes building cost,
operational cost, maintenance cost and scrap. The LCC approach is a promising holistic
approach to estimate the cost of the overall life of a ship. Since the ORC is in the concept
design phase, the cost estimation is possible only at a very high level and this requires
rather broad assumptions about the ship design, its general functional requirements, and
its physical and operational characteristics (Lamb, 2004).
The capital and life cycle costs make up the cost side of the equation. The benefits arise
from the functions of the ORC system. One of two primary functions of the ORC is to
mitigate risk by reducing response time when a remote offshore platform is in danger. In
general, this should minimize the loss of production or the platform. This risk reduction,
particularly in the consequences of an accident can be considered as a financial benefit.
Inherent in this logic is the assumption that a faster response in the case of an accident
results in reduced loss. This is particularly true when environmental damage from a
blowout is considered.
The use of a loss function (LF) is a structured approach to estimate the loss arising from
an incident. Loss functions (LFs) express losses related to the deviation of a product from

171
its optimal value. In recent years loss functions have gained wide acceptance among
researchers and quality assurance practitioners due to Taguchi’s philosophy and quality
improvement strategies (Zadakbar et al., 2015; Spiring, 1993). Several types of loss
functions are found in the literature such as quadratic (Taguchi, 1986), inverted normal
(Spiring, 1993; Khan, et al. 2016), inverted beta (Leung & Spiring, 2002), inverted
gamma loss function (Spiring & Yeung, 1998; Leung & Spiring, 2004), etc. The loss of a
production platform leads to production downtime, loss of material assets, loss of human
lives and environmental damage. This loss is linked with the risk of an accident in a
production platform.
A main contributor to the total risk is the uncontrolled release of pressurized
hydrocarbons, i.e., gas leakages and blowouts. In this paper, costs data from previous
blowout incidents are used to develop a loss function. The details of the historical data are
described in the case study section. Adopting a deterministic approach would be
unsuitable due to the scarcity of data and the variability in previous accident
circumstances. Hence, the complete analysis is conducted in a probabilistic framework
using the Monte Carlo Simulation (MCS) technique. The methodology proposed in this
paper aims to:
- estimate the building cost and operational cost of the ORC from historical ships
data and recent offshore operational day rates and establish a net present value
(Cost model);

172
- develop a loss function model from past offshore platform blowout accidents and
project this data to present day figures (Benefit model);
- integrate the cost and benefit model in a probabilistic framework, and
- determine a break-even probability for an offshore development considering ORC
as part of risk reduction strategy.
The paper is organized as, Section 5.1 provide general basis of ship cost estimation and a
review of relevant literature on LFs. The methodology of this study is presented in
Section 5.2. A case study to demonstrate the methodology is presented in Section 5.3.
Discussions and conclusions are presented in Sections 5.4 and 5.5, respectively.
5.2 The Proposed Methodology
The methodology proposed here comprises three elements: cost model, benefit model and
integrated probabilistic cost - benefit comparison. The flow chart of the proposed
methodology is given in Figure 5.2.

173
Figure 5.2: Flow chart of the proposed methodology
5.2.1 Cost model
The total cost of the ORC includes capital cost and operational cost. Recent historical
ship cost data are used to develop a capital cost model based on principal particulars, in a
multiple linear regression. Then, the principal particulars, i.e. ship length, beam, year
built, of the ORC, are used in the regression to develop an estimated capital cost for the
ORC. Multiple linear regression (MLR) is a simple statistical technique that uses several
independent variables to predict the outcome of a dependent variable. Multiple

174
regressions are based on the assumption that there is a linear relationship between both
the dependent and independent variables. It also assumes no major correlation between
the independent variables (https://www.investopedia.com/terms/m/mlr.asp). A general
expression for a MLR model with k independent variables X1, X2, ..., Xk and a response or
dependent variable Y, can be written as (equation 5.1):
𝑦 = 𝛽0 + 𝛽1𝑥1 + 𝛽2𝑥2 + ⋯ + 𝛽𝑘𝑥𝑘 + 𝜖 (5.1)
where 𝜖 is the residual term (error) of the, model and 𝛽0, 𝛽1, 𝛽2, ..., 𝛽𝑘 are the regression
coefficients in the model.
The operational cost of the ORC is the working cost over its design life. Since the ORC
has unique functionalities, it is difficult to find an exact match with previous vessels. It is
judged that platform supply or standby vessels are the closest comparison with the ORC.
Considering the size of these vessels, the daily charter rate of two offshore supply vessels
are assumed in the present case to be approximately equal to a ORC daily operational
cost. In this way, the total operation cost of the ORC is calculated over its design life of
25 years using 2x the current day rate of a typical northern offshore supply vessel as a
proxy for all costs including crew, maintenance, fuel, provisioning and financing. The net
present value (NPV) is used to estimate the current value of future payouts over the life of
the system. NPV is the difference between the present value of cash inflows and the

175
present value of cash outflows over a period of time (https://www.investopedia.com/). In
this case we only consider cash outflows and NPV is calculated as (equation 5.2):
𝑁𝑃𝑉 = ∑𝑅𝑡
(1+𝑖)𝑡𝑛𝑡=1 (5.2)
where 𝑅𝑡 is the net cash inflow-outflows during a single period t, 𝑖 is the discount rate or
return that could be earned in alternative investments and t is the number of time periods.
The capital cost and operational cost estimated from the process described above are
summed to get the total cost of ORC.
5.2.2 Benefit model
In this study, the benefit is defined as the financial value of the reduction of loss when an
ORC is installed as a risk mitigation measure. Emergency response would take longer to a
remote offshore platform than it would for platforms that are closer to shore support. This
limitation of response time was identified as a key risk factor in the previous analysis of
remote offshore installations (Raman et al., 2019). In essence, the ORC decreases
response time as it will be closer to a hydrocarbon facility than any shore base for
support. Previous offshore accident data related to significant response time and the
distance are used to develop an empirical relationship between these factors.

176
The next step is to develop a loss model with respect to response time for offshore
blowout incidents. Previous blowout incidents are used to develop this model. The
ultimate cost of a blowout incident is difficult to estimate. The cost accrues from damage
or total loss of platform, loss of human lives, production downtime or shut down, oil
cleanup cost and other environmental cost, liabilities and lawsuits, etc. Figure 5.3 shows
the breakdown of total costs or maximum loss (Marsh Risk, 2011). There are some
hidden costs arising from the revenue lost, profit not earned or reputation damaged due to
an accident that may not be recognized under a purely financial reporting system (Lee et
al., 2018). For instance, BP reported the total costs of the Deepwater Horizon oil spill as
62.59 billion USD, which includes charges and expenses directly related to the spill, the
various fines and penalties to be paid, reimbursements and recoveries from other parties,
and securities-related charges. However Lee et al., 2018 estimated the ultimate cost of
this disaster as 144.89 billion USD including the hidden costs.
The additional cost is largely influenced by the environmental cleanup cost that depends
on the occurrence of a spill and the location of the accident. In general, cleanup cost
increases when a spill occurs and rises exponentially when an oil spill occurs near to
shore. In addition the damage to company reputation, share value etc. is also likely
increased by the increased publicity associated with spills that damage shorelines.
Examples of this type of loss include the Deepwater Horizon and the Exxon Valdez spill.
To address the hidden cost issue, an environmental cleanup factor is introduced to capture
the non-financial costs, particularly for spills that damage shore line areas. This factor for

177
spills that damage shorelines is essentially the ratio between costs as estimated by BP for
the Deepwater Horizon incident and the higher cost calculated by Lee et al., 2018 A
lower but arbitrary cleanup factor is used for cases where a spill occurs but does not
impinge on a shoreline. All historical cost data collected from the literature are converted
to present value for the year 2020 by considering inflation rates.
Figure 5.3: Breakdown of overall blowout loss
Statistical parameters are derived from the inflated accident cost data set and are used to
generate a Cumulative Density Function (CDF) for financial losses associated with an
offshore blowout. An appropriate probability distribution is selected that best fits the data.
Parameters are estimated using the least square method. The same process is applied to
generate a CDF for emergency response time based on the statistical parameters derived
from the response times from the historical incidents. A loss curve is generated by

178
comparing the CDFs of costs and response time and equating the cost values and response
time values based on equal values of cumulative probability. This provides a curve of
accident cost as a function of response time based on equal cumulative probability of
occurrence.
The final step in the setup process is to derive a curve of response time as a function of
offshore distance. This is based on the available data and, like all the data in this study, is
limited by the relatively small sample of offshore blowout accidents. Furthermore our
study considers a very remote platform and thus the distance for the unsupported platform
is well outside the range of previous accidents. In extrapolating the limited information
available we have assumed that the response time would increase exponentially as
distance offshore increases.
5.2.3 Aggregate cost and benefit model
The cost and benefit models described in section 5.2.1 and section 5.2.2 are integrated to
calculate the net, which is referred as “residual risk” (Rr). The steps are as follows:
(1) Estimate the capital and operating costs for the ORC with operating costs for 25
years reduced to a net present value
(2) For a given accident scenario, the required response time is derived from response
time vs offshore distance curve for the platform without the presence of an ORC.
(3) Calculate the cost of the accident from the loss model for the corresponding
response time.

179
(4) Use the reduced distance between the ORC and offshore platform to calculate a
reduced response time
(5) Repeat step 3 to calculate the reduced costs of accident using the response time
with the support of the ORC.
(6) Determine the difference in loss costs for the with-ORC and without-ORC cases.
(7) Compare the difference in loss costs with the expense of acquiring and operating
an ORC. Develop a break-even accident probability based on a cost vs accident
probability curve.
Hence, Rr is determined as (equation 5.3):
𝑅𝑟 = 𝑃𝑎(𝐿 − 𝐿𝑂𝑅𝐶) − (𝐶𝑝 + 𝐶𝑜) (5.3)
Where 𝑃𝑎 represents the probability of accident, 𝐿 is the cost of the accident calculated
from the loss function, 𝐿𝑂𝑅𝐶 is the cost of the accident when the ORC is installed. 𝐶𝑝 and
𝐶𝑜 represent the capital cost and operational cost of the ORC, respectively. Risk is
defined as the multiplication of probability and consequence. The consequence of an
accident is often expressed as loss.
In this study, the probability of blowout incidents is unknown but the design level for
offshore systems is frequently in the range of 10-5. Despite this, blowout accidents have
happened at approximately 10 year intervals since the 1960s. Using equation 5.3, we can

180
determine that an ORC is a positive investment if the value of Rr is positive. Thus another
way to consider the analysis is to determine what accident probability makes Rr greater
than zero.
5.2.4 Uncertainty analysis
It is recognized that the historical cost and historical accident data used in this study are
not entirely sufficient but these are the only data available as cost data is not widely
available and offshore accidents, although well studied in recent years, have been
mercifully few. The data paucity requires that, for the purposes of this analysis, several
assumptions are made. The Monte Carlo simulation technique is adopted as an additional
way to address this limitation. In this approach, a probability distribution of each cost part
is used instead of a deterministic value. It is assumed that all calculated costs and benefits
are normally distributed with mean (most likely) values calculated from the available data
and standard deviations either based on regression data (in the case of ship costs) or
assumed equal to 20% of the corresponding mean value. The Monte Carlo simulations are
run for n times and a histogram is ultimately generated for 𝑅𝑟 using equation 5.3. The
characteristics i.e. mean, 50th percentile, etc. of this distribution are further investigated to
inform the decision on the viability of an ORC.
5.3 The Application of the Proposed Methodology: Case Study
5.3.1 Example location of ORC
The Flemish Pass Basin is chosen for a case study to illustrate the cost-benefit analysis of
an ORC and a hypothetical hydrocarbon platform that may operate in this region. The

181
Flemish Pass basin is located approximately 500 nautical miles offshore St. John’s,
Newfoundland and Labrador. Equinor Canada Ltd. (Equinor) is proposing to conduct an
exploration drilling project in the Flemish Pass Basin between 2019 and 2027 (Canada
Impact Assessment Act, 2019) although this is currently uncertain due to low oil prices.
As conceptualized in the previous study, the proposed ORC would be located at an
intermediate location between the shore (St. John’s) base and the drilling sites (Rahman et
al., 2020a,b). The ORC concept includes defining functional requirements, initial
dimensions estimation and addressing some critical design features required to operate at
the selected site. Table 5.1 provides the basic characteristics of the proposed ORC. The
following sections describe the cost estimation for this ORC, loss approximation for a
hypothetical offshore blowout incident and analysis of loss cost reduction through the use
of the ORC as a risk reduction measure.
Table 5.1: ORC Principal Dimensions and Characteristics
Vessel LOA 159.63 m
Beam 22.50 m
Depth 10.10 m
Draft 5.80 m
Mooring Type Disconnectable turret
Chain diameter 70 mm
Chain Length 850 m
Mooring legs 3×2, Catenary chain
Accommodations Crew 42 persons
In-transit POB 36 persons
Temporary stay Up to 150 persons
Helicopters Helidecks 2×Large helicopters e.g. Sikorsky S-92
Hangar Up to 2 Large helicopters

182
5.3.2 Cost estimation of the ORC
As mentioned earlier, the ORC is a unique vessel type that does not match with any
existing type of ship. At the concept stage, it is not possible to estimate cost by detail
calculation of every part of the vessel system. Thus, to make a reasonable initial estimate,
building cost data from recent cruise ships are used. Cruise ships fall into a middle
category in terms of ship construction complexity as these vessels are less expensive than
military ships but generally more expensive than similar sized commercial cargo or
working ships. The construction cost of an ORC may also fall into the middle range of
construction complexity considering the machinery requirements i.e. turret mooring,
accommodation and recreational facilities and provision for aviation facilities. This shows
some justification for comparing the costs of cruise ships and the expected cost of an
ORC. Furthermore construction cost data for cruise vessels is readily available and
appears to be less variable than the data available for other ship types. The construction
costs of different cruise ships having overall length between 157m – 200m and beam
between 22m – 25.6m are shown in Figure 5.4 (https://www.cruisemapper.com/wiki/759-
how-much-does-a-cruise-ship-cost).

183
Figure 5.4: Cruise ships building costs vs year
A multiple linear regression is conducted where year, ship’s length and beam are
independent variables and ship construction cost is the dependent variable. Using the
corresponding length, beam and current year, the construction costs of the ORC is
calculated as 252 million USD. Table 5.2 provides the summary of this regression
analysis and regression equation is provided in equation 5.4.

184
Table 5.2: Regression analysis of ORC cost
ANOVA
df SS MS F Significance F
Regression 3.00 62735.68 20911.89 35.87 1.43E-07
Residual 17.00 9912.13 583.07
Total 20.00 72647.81
Coefficients Standard Error t Stat P-value Lower 95% Upper 95%
Intercept -10466.58 1128.71 -9.27 0.00 -12847.95 -8085.21
Year Built 5.24 0.58 9.09 0.00 4.02 6.46
Ship Length OA (m) 0.46 0.51 0.90 0.38 -0.62 1.54
Ship Beam (m) 2.66 5.40 0.49 0.63 -8.74 14.06
𝑂𝑅𝐶 𝐵𝑢𝑖𝑙𝑑𝑖𝑛𝑔 𝐶𝑜𝑠𝑡 (𝑀𝑖𝑙𝑙𝑖𝑜𝑛 𝑈𝑆 𝑑𝑜𝑙𝑙𝑎𝑟𝑠) = 5.24 × 𝑌𝑒𝑎𝑟 𝐵𝑢𝑖𝑙𝑡 + 0.46 ×
𝑆ℎ𝑖𝑝 𝐿𝑒𝑛𝑔𝑡ℎ 𝑂𝐴 (𝑚) + 2.66 × 𝑆ℎ𝑖𝑝 𝐵𝑒𝑎𝑚 (𝑚) (5.4)
Operational cost of the ORC is calculated from the day rates of US Gulf supply vessels
based on data available for 2017 (https://www.workboat.com/resources/reports/osv-day-
rates/ ). The cost is considered to be doubled by comparing the physical and expected
crew sizes of the ORC with typical north Atlantic supply boats. Next, the cost is
converted to net present value for an operation life of 25 years and a discount rate of 5%.
At the present time no allowance is made for inflation or cost changes over the life of the
development. Thus, the total lifetime cost of the ORC is given in Table 5.3.

185
Table 5.3: Total costs of ORC
Daily rate of a supply ship $25,000 USD
Estimated ORC daily rate (2 times of a supply ship compared
to their size) $50,000 USD
Annual ORC cost $18,250,000 USD
NPV Operating cost (5% discount rate for 25 years) $257,214,488.33 USD
Operation cost $257.21 Million USD
Building cost $252.11 Million USD
Total life cycle cost of ORC $509.32 Million USD
5.3.3 Offshore blowouts and corresponding loss function
Offshore oil production is a complex operation. To ensure safe operations all equipment
has to be functional and correct decisions have to be made. There is a significant risk
associated with undesirable events that may lead to minor or major production loss.
Minor events such as near-miss, dropped objects, or production interruptions are more
frequent than major accidents involving significant spills or major damage or platform
loss. This study focuses on the case of a catastrophic offshore accident (blowout) that
represents maximum consequence or loss. There is a relatively small number of historical
offshore blowouts. The most costly and latest blowout event is the Macondo well
explosion that occurred on April 20, 2010. The platform was located approximately 50
miles off the coast of Louisiana in the Gulf of Mexico. This accident caused 11 fatalities,
the sinking of the Deepwater Horizon, and massive marine and coastal damage from a

186
reported 4 million barrels of released hydrocarbons (CSB report, 2016). The Deepwater
Horizon oil spill is regarded as one of the largest environmental disasters in North
America. Lee et al., 2018 estimated an ultimate cost to British Petroleum (BP) of $144.89
billion, which is more than two times larger than the $62.59 billion BP reported in its
income statement.
The Montara wellhead blowout is another recent disaster that happened on August 21,
2009, and which is considered one of the largest in Australian history. The Montara field
is located 160 miles off the Kimberley coast in the Timor Sea. There were no fatalities or
injuries, however, according to the Australian Maritime Safety Authority (AMSA), the oil
slick spread over 6,000km2 and killed significant marine life in the area. Unlike the
Macondo incident, the Montara accident did not have effects on any coastline although
the Indonesian government has claimed damages (https://www.offshore-
technology.com/features/montara-oil-spill-timeline/).
The Piper Alpha explosion disaster on July 6, 1988, killed 167 people making it the
incident with the highest fatality level. This platform was operating in the North Sea
approximately 120 miles north-east of Aberdeen, Scotland (Oil & Gas UK, 2008). The
total loss from the Piper Alpha explosion was estimated to be $1.6 billion. Initial
emergency response arrived after a few hours of the accident, due significantly to the
proximity of other production platforms. The platform was completely lost, but no oil
spill occurred as the production was mainly gas.

187
The Ekofisk Bravo explosion in April 1977, was the largest blowout in the North Sea.
The platform was located about 200 miles offshore southwest of Stavanger. All crew
members on board were safely evacuated. The blowout caused a continuous discharge of
crude oil through an open pipe 20 meters above the sea surface that took 7 days to stop
completely. Approximately 80,000–126,000 barrels of oil spilled during this period
(https://incidentnews.noaa.gov/incident/6237).
The Santa Barbara oil spill occurred on January 28, 1969, due to a blowout 6 miles
offshore of Santa Barbara, California. The blowout resulted in about 100,000 barrels of
oil spilled that quickly hit the near shore (https://incidentnews.noaa.gov/incident/6206).
Cost and other data for this incident are not widely available.
The summary data pertinent to this study for each blowout incident are provided in Table
5.4. In general there is much more information available for the two recent incidents than
there is available for the three older incidents. The literature study suggests that oil
cleanup cost was typically much higher when the spill happened near to the shore. Thus,
higher arbitrary environmental cost factors are chosen for BP Mocando and Santa Barbara
blowouts. The total costs of these accidents in the year 2020 are projected considering
inflation and environmental cost factor.
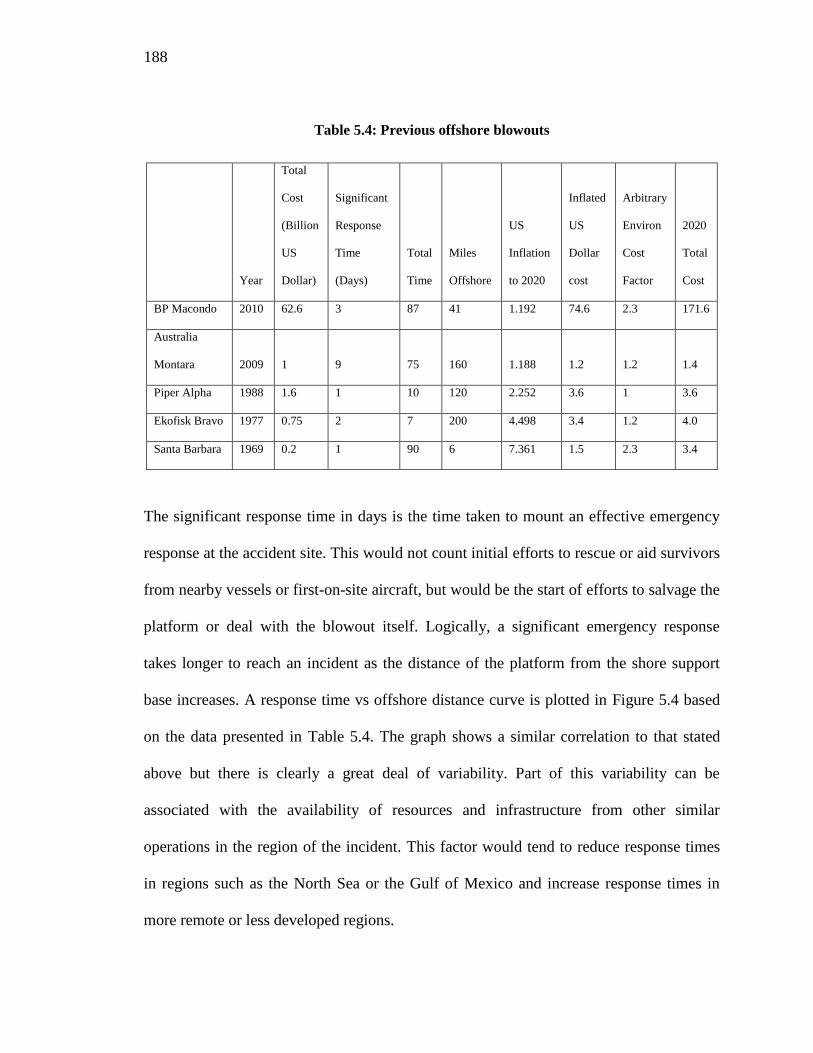
188
Table 5.4: Previous offshore blowouts
Year
Total
Cost
(Billion
US
Dollar)
Significant
Response
Time
(Days)
Total
Time
Miles
Offshore
US
Inflation
to 2020
Inflated
US
Dollar
cost
Arbitrary
Environ
Cost
Factor
2020
Total
Cost
BP Macondo 2010 62.6 3 87 41 1.192 74.6 2.3 171.6
Australia
Montara 2009 1 9 75 160 1.188 1.2 1.2 1.4
Piper Alpha 1988 1.6 1 10 120 2.252 3.6 1 3.6
Ekofisk Bravo 1977 0.75 2 7 200 4.498 3.4 1.2 4.0
Santa Barbara 1969 0.2 1 90 6 7.361 1.5 2.3 3.4
The significant response time in days is the time taken to mount an effective emergency
response at the accident site. This would not count initial efforts to rescue or aid survivors
from nearby vessels or first-on-site aircraft, but would be the start of efforts to salvage the
platform or deal with the blowout itself. Logically, a significant emergency response
takes longer to reach an incident as the distance of the platform from the shore support
base increases. A response time vs offshore distance curve is plotted in Figure 5.4 based
on the data presented in Table 5.4. The graph shows a similar correlation to that stated
above but there is clearly a great deal of variability. Part of this variability can be
associated with the availability of resources and infrastructure from other similar
operations in the region of the incident. This factor would tend to reduce response times
in regions such as the North Sea or the Gulf of Mexico and increase response times in
more remote or less developed regions.

189
It is recognized that the data is limited. Also, there are several other factors that may
affect the speed of response. More detail of other limitations is presented in the preceding
study, Rahman et al., 2019. An exponential curve is fitted in Figure 5.5 relating response
time and distance. This fit curve indicates that it would take slightly over 12 days to
respond for the example location, which is about 500 miles offshore. Placing an ORC in
an intermediate position would reduce the response time considerably, to approximately
four days. In the present case we assume the ORC is located at the mid-point between
shore and the offshore platform location within 250 miles of the production platform, but
the location of the ORC can be optimized to improve response time advantages for any
specific site.
Figure 5.5: Response time vs offshore distance curve

190
Next, the mean and standard deviation of the blowout costs and response time data are
used to generate two corresponding cumulative density functions (CDFs). The data are
tested for goodness of fit using various probability distribution and similar curves are
found. In this study, the normal distribution was found to provide a good fit and is used to
model blowout cost (Figure 5.6) and response time (Figure 5.7).
Figure 5.6: CDF of blowout cost
Figure 5.7: CDF of response time in days

191
A loss curve (Figure 5.8) is generated by comparing the CDFs of the loss costs and the
response time and equating the loss values and response time values, based on equal
levels of cumulative probability. This provides a curve of accident loss cost as a function
of response time based on equal probability of occurrence. The loss function shows that
loss increases at a lower rate if the response can be marshalled within 2 days. After that
the loss increases sharply as the response time increases and reaches a maximum at 11
days. This statistical model is consistent with the information in the available historical
literature on offshore incidents as delayed response generally resulted in a higher cleanup
and environmental costs.
Figure 5.8: Offshore blowout loss curve as a function of response time

192
5.3.4 Comparison of Cost-benefits and Monte Carlo simulations
The estimated cost of the ORC in section 5.3.2 and the difference in loss costs for the
with-ORC and without-ORC cases using the models developed in section 5.3.3 are
integrated in this section to provide the cost-benefit model. The residual risk is calculated
using equation 5.3. The probability of an accident, 𝑃𝑎 is needed to get the complete risk
profile. A positive residual risk means the value of the reduced risk due to the presence of
the ORC is greater than the cost of providing the ORC, for a given value of the
probability of a blowout incident. The residual risk is higher when the probability of an
accident is increased.
Due to the inherent uncertainty in the available accident data, the Monte Carlo simulation
technique is used to determine a distribution of outcomes. A probability distribution of
each element in equation 5.3 is used instead of a deterministic value. It is assumed that
costs are normally distributed with mean (most likely) values calculated from the loss
functions and standard deviations either based on regression data (in the case of ship
capital cost) or assumed equal to 20% of the corresponding mean value. The simulations
are run 1000 times for a given probability of accident. A sample simulation is provided in
Table 5.5. Figure 5.9 shows a histogram for residual risk (𝑅𝑟) when it is assumed that a
blowout has occurred i.e. the probability is 1. The mean, standard deviation, 5th percentile
and 95th percentile are also given. These values represent the probable highest residual
risk or the maximum net value that can be gained through the installation of an ORC for
the given scenario.

193
Table 5.5: Monte Carlo simulation of cost-benefit analysis
Scenario
Offshore distance
(Miles)
Response time
(Days)
Loss cost in Billion
USD
Probability of accident
𝑃𝑎
Without
ORC 500 12.61 200.00 1.0000
With ORC 250 4.20 58.98
Statistical
parameters
Loss without ORC
(Billion USD)
L
Loss with ORC
(Billion USD)
LORC
Capital cost of ORC
(Billion USD)
Cp
Operational cost of
ORC (Billion USD)
Co
Expected 200.00 58.98 0.25 0.26
Standard
Deviation 40.00 11.80 0.02 0.05
First
simulation 183.00 75.62 0.23 0.29
Residual
risk 106.86
Figure 5.9: Histogram of residual risk

194
Figure 5.10 shows the mean and standard deviation of residual risk for different
probabilities of blowout accident. It shows that the mean and standard deviation of the
residual risk decreases as the probability of accident decreases. The risk becomes zero
when the probability is approximately 0.00365, which is the breakeven point. Hence,
ORC is a net benefit when the probability of accident is higher than the breakeven point.
Figure 5.10: Mean and SD of residual risk vs probability of accident
5.4 Discussion
The study presents a methodology to analyze the economic costs and benefits of an ORC
as a risk reduction measure for use in a remote harsh offshore environment. The capital
cost and operational costs are determined based on comparable historic ship cost data. A
high level approximation approach is adopted rather than a detailed analysis of
construction or operating costs which is not practical at the present concept evaluation

195
phase. However, the total estimated life-cycle cost of an ORC in this study is judged to be
reasonable, comparing with similar sized and similarly complex ships.
In the second part, a loss curve is developed using the available data from previous
blowout accidents. The total blowout costs, response time, offshore distance and other
relevant details of these accidents are examined. These data are assumed to be normally
distributed. However, several other distributions were tested during the study, and all
distributions show a similar trend.
The limitation of the source data is a challenge. This includes both the ship cost data and
the accident data. Thus this methodology proposes a probabilistic approach that shows
20% uncertainty in the predicted values. The process is repeated multiple times using the
Monte Carlo simulation technique. The reduced logistical risk due to the ORC is
indicated by the positive residual risk which is an unknown. The net benefit for installing
an ORC is highly dependent on the probability of a blowout accident. Figure 5.11 shows
the breakeven probability of 0.00365 for this case study. This is a relatively low
probability but not nearly as low as the design probabilities for offshore system failures.
The x-axis represents probability of negative residual risk in percentage. It is the
percentage frequency of occurrence of the negative residual risk in the total number of
simulations. The upper bound and lower bound probabilities are 0.01 and 0.001. Any
probability value above 0.01 gives a positive return on investment from installing the

196
ORC and any value less than 0.001 would result in a negative return. This would mean
that a net increase in safety has a net cost.
Figure 5.11: Sensitivity of blowout probability and residual risk
The emphasis of this study is to demonstrate the methodology and the numerical outputs
are not absolute but based on reasonable estimates and available data. Also, the benefit of
an ORC is only evaluated for one of its two main functions, emergency response and in
this case for only one possible accident type. Another main objective of the ORC is
providing helicopter landing facilities. Long flying distance is a major logistical
challenge, which is associated with higher risk, especially in unfavorable environmental
conditions.

197
It may be possible to use a similar methodology, to that employed here, to evaluate the
additional net benefit associated with a reduction in flying distance. This is expected to be
more challenging than the current case as a loss function associated with helicopter flying
distance is expected to be more difficult to generate using historical data. This may in fact
be superseded by a more simple analysis of helicopter range. If the platform is simply
outside the safe range this would yield a simple comparison between the ORC concept
and any available alternatives such as the use of existing intermediate production
platforms or possibly an all-ship logistical support system. In either event, there are
additional benefits associated with the other functions of the ORC that would be
considered in a full analysis.
The ORC provides several additional benefits that are not risk reduction functions and
thus not subject to the methodology presented here. For example the hotel function of the
ORC provides temporary accommodation for inbound/outbound offshore personnel that
may be useful for either aircraft operations or marine operations. Though this function is
not a risk reduction objective, it offers an alternative crew transportation approach.
The study has set up a foundation for systematically analyzing the economic aspects of an
ORC or any other form of technology based risk reduction initiatives. This approach can
be expanded to include other functions or adapted for analyzing more complex scenarios
such as, cost-benefit modeling of an ORC supporting more than one platform. The
present study methodology can be applied to other types of offshore accidents such as

198
fire, explosion, etc. For any given accident case, both probability and loss/consequence
needs to be developed to get a complete risk profile. An offshore blowout was selected as
a case study due to a relatively large data set of historical accidents and because the
catastrophic nature of such accidents provides a very large potential loss that makes the
case presented here easier to demonstrate.
5.5 Conclusions
The paper presents a probabilistic cost-benefit analysis method applied to the concept of
an offshore resource centre in support of remote offshore operation. The methodology
comprises estimating the total cost of ORC, developing loss model for blowout type
accidents, determining the reduced loss as benefit, integrating cost-benefit models and
uncertainty analysis. The proposed methodology and model provides:
- A basis for risk-based cost-benefit analysis that helps to assess the net financial
cost or benefit of using a system such as an ORC as a risk reduction strategy for
remote offshore developments.
- A structured but flexible approach that can be easily modified for different
scenarios. Although this was developed for a particular system related to remote
offshore developments, the same methods would apply to any potential risk
mitigation system.
- A demonstration of the use of the Monte Carlo simulation technique, in a case
where the historical data is sparse, to provide an output that demonstrates the

199
range of possible outcomes and thus a more credible output than deterministic
modeling.
This methodology could be further improved if more data were available. However it is,
in fact, preferable that accidents not occur, despite their value for studies such as this.
Thus we sincerely hope that there are not any future additions to the available data on
blowout accidents and we accept the limitations of this study as a benefit of a safer
offshore industry. It would however be relatively easy to improve the ORC capital and
operating cost information by performing a more detailed engineering feasibility study of
the ORC concept.
References
Canada Impact Assessment Act, 2019. Flemish Pass Exploration Drilling Project.
Available at: https://ceaa-acee.gc.ca/050/documents/p80129/129198E.pdf. Accessed:
October 2019.
Caprace J and Rigo P, 2012. Towards a short time “feature-based costing” for ship
design. J Mar Sei Technol (2012) 17:216-230.
Chemical Safety and Hazard Investigation Board, 2016. Executive Summary of
Explosion and Fire at the Macondo Well. Available at:
https://www.csb.gov/macondo-blowout-and-explosion/. Accessed: April 2020.
Hamilton, J.M., 2011. The challenges of deep-water arctic development. Int. J. Offshore
Polar Eng. 21, 241–247.
https://incidentnews.noaa.gov/incident/6206, Accessed: April, 2020.

200
https://incidentnews.noaa.gov/incident/6237, Accessed: April, 2020.
https://www.cruisemapper.com/wiki/759-how-much-does-a-cruise-ship-cost, Accessed:
April, 2020.
https://www.investopedia.com/terms/n/npv.asp, Accessed: April, 2020.
https://www.offshore-technology.com/features/montara-oil-spill-timeline/, Accessed:
April 2020.
https://www.workboat.com/resources/reports/osv-day-rates/, Accessed: April, 2020.
Khan, F., Ahmed, S., Hashemi, S.J., Yang, M., Caines, S., Oldford, D., 2014. Integrity
challenges in harsh environments: lessons learned and potential development
strategies. Inst. Chem. Eng. Symp. Ser. 1–7.
Khan, F., Wang, H. & Yang, M., 2016. Application of loss functions in process economic
risk assessment. Chemical Engineering Research and Design, 111, pp.371–386.
Lamb, T., 2004. Ship Design and Construction, vols. 1–2. Society of Naval Architects
and Marine Engineers (SNAME).
Lee YG, Garza-Gomez X, Lee RM., 2018. Ultimate costs of the disaster: Seven years
after the Deepwater Horizon oil spill. Journal of Corporate Accounting and Finance
29: 69–79.
Leung, B.P.K. & Spiring, F. A., 2002. The inverted beta loss function: properties and
applications. IIE Transactions (Institute of Industrial Engineers), 34, pp.1101–1109.
Leung, B.P.K. & Spiring, F.A., 2004. Some Properties of the Family of Inverted
Probability Loss Functions. Quality Technology & Quantitative Management, 1(1),
pp.125–147.

201
Marsh Risk, C., 2011. The 100 Largest Losses. Technical Report, London.
Meling, T.S., 2013. Deepwater floating production systems in harsh environment - A look
at a field development offshore Norway and need for technology qualification. Proc.
Annu. Offshore Technol. Conf. 3, 1890–1898. https://doi.org/10.4043/24511-ms.
Necci, A., Tarantola, S., Vamanu, B., Krausmann, E., Ponte, L., 2019. Lessons learned
from offshore oil and gas incidents in the Arctic and other ice-prone seas. Ocean Eng.
185, 12–26. https://doi.org/10.1016/j.oceaneng.2019.05.021.
Oil & Gas UK, 2008. Piper Alpha: Lessons Learnt. Available at:
https://oilandgasuk.co.uk/wp-content/uploads/2015/05/HS048.pdf. Accessed: April,
2020.
Rahman, M.S., Khan, F., Shaikh, A., Ahmed, S., Imtiaz, S., 2019. Development of risk
model for marine logistics support to offshore oil and gas operations in remote and
harsh environments. Ocean Eng. 174 https://doi.org/10.1016/j.oceaneng.2019.01.037.
Rahman, M.S., Khan, F., Shaikh, A., Ahmed, S., Imtiaz, S., 2020a. A conditional
dependence-based marine logistics support risk model. Reliab. Eng. Syst. Saf. 193.
https://doi.org/10.1016/j.ress.2019.106623.
Rahman, M.S., Colbourne, B., Khan, F., 2020b. Conceptual development of an offshore
resource centre in support of remote harsh environment operations, Ocean
Engineering, 203. https://doi.org/10.1016/j.oceaneng.2020.107236
Spiring, F.A. & Yeung, A.S., 1998. A general class of loss functions with industrial
applications. Journal of Quality Technology, 30(2).

202
Spiring, F.A., 1993. The reflected normal loss function. Canadian Journal of Statistics,
21(3), pp.321–330.
Taguchi, G., 1986. Introduction to Quality Engineering: Designing Quality into products
and Processes, New York: Kraus.
Zadakbar, O., Khan, F. & Imtiaz, S., 2015. Development of Economic Consequence
Methodology for Process Risk Analysis. Risk Analysis, 35(4), pp.713–731.

203
6. Summary, Conclusions and Future works
6.1 Summary
Remote offshore logistics support operations in harsh environmental conditions are
challenging. Logistics challenges arise significantly from the two factors of extreme
weather conditions and remoteness. The literature indicates that existing means of
logistics support using helicopters or supply vessels alone may not be sufficient in far
offshore operation in extreme environmental conditions. The risk modeling developed for
this work identifies the most significant contributing factors to logistics challenges and
the most effective risk reduction measures to mitigate these challenges. An intermediate
offshore resource centre (ORC) is identified as an effective risk reduction measure and
proposed as a supplement to conventional vessel and helicopter operations in order to
mitigate the challenges, and an economic model is developed to analyze its practicability.
This study identifies the unique challenges associated with this particular type of offshore
development and proposes a solution to overcome these. Furthermore the work presents a
means of analyzing the risk reduction effectiveness in economic terms. The outcomes of
this research are summarized in the following.
Objective 1. To understand logistical risk in remote offshore operations
An advanced fault tree model is developed to perform risk analysis of offshore logistics
operations. The inherent limitations of this model are identified. The model limitations
are addressed by introducing unconventional logic gates. The data limitations are
addressed by using both fuzzy logic-based and evidence-based approaches. The model

204
provides more realistic results than the traditional fault tree model. The risk analysis
suggests that marine logistics operations cannot respond sufficiently quickly in the case of
an emergency on a distant platform. Helicopter operations are limited by the
environmental conditions and flying range and aircraft capacity. This phase of the study
identifies that new solutions are required to address this additional risk associated these
challenges.
Objective 2. To identify effective risk reduction measures
Several alternate risk reduction measures to address logistical challenges identified in the
first phase are evaluated. The BN model developed in this research is used to analyze the
feasibility of each measure. This framework is applicable for a quantitative risk analysis
for any given set of data. Two measures are found to be the highest ranked in terms of
effectiveness in reducing the risk associated with distance and environment. These are the
offshore refuge and an additional layer of safety equipment inventory.
Objective 3. To develop the concept of a viable solution
The concept developed as intermediate offshore resource centre (ORC) meets the purpose
of a temporary refuge during emergencies and provides an emergency response asset for
quicker reaction to an emergency scenario. The ORC also reduces risk associated with
helicopter operations by reducing flying distance and by providing an intermediate
landing point in case of emergency. The functional requirements of the ORC are set based
on the example geographical location and the required capacity for supporting a single
offshore platform. The methodology proposed for the concept development of the ORC

205
can be used for any other case study or to develop a vessel or platform for supporting
multiple offshore installations. Preliminary performance criteria such as ORC stability
and station keeping in North Atlantic regions are also investigated to provide a concept
level validation of the vessel.
Objective 4. To develop a framework to assess economic viability
In the final chapter this study develops a framework that can be used to determine
whether an ORC, or any other risk reduction measure, is beneficial in economic terms by
estimating risk reduction in economic terms and comparing this to the investment
required in the risk reduction measure. The results in the present case indicate that the
benefits of an ORC are significantly dependent on the assumed probability of a serious
accident over the lifetime of the structure.
6.2 Technical Challenges and Limitations
The biggest challenge faced during this research is the scarcity of data on both operations
in remote harsh regions and on the probability and consequences of major offshore
accidents. This is mainly due to the fact there is simply not much experience with either.
In the case of accidents, this is a good thing but it does make risk analysis and projections
more difficult. Most of the data are collected from open literature. Some essential data for
this study are not at all available. This is addressed either by logical assumption or expert
elicitation. The case studies presented in this study are for demonstration purpose and
provide clear indications of the logic and utility of the developed methods. However, care
should be taken before using the actual numbers.

206
Apart from the data limitation, logistics support operation in a remote and harsh offshore
environment is a complex process that involves many co-dependent factors. In general,
risk modelling of such a process is a complicated task and often requires logical
assumptions to address model-based limitations. This model can be further improved by
incorporating experts’ opinions from the offshore industry. Also, in this study, any
factor/event in the risk model is considered to have binary states (pass/fail). However,
multi-state factors can be considered in a more detailed modelling approach to represent a
more practical scenario.
A literature review is performed to provide the perception of risk related to offshore
helicopter operations. Although, detailed risk analysis of remote helicopter operations in
extreme environments is not conducted in this study. A similar approach can be employed
for helicopter risk analysis, though the required data is expected to be challenging to
obtain.
The risk reduced by the ORC by enhancing helicopter operations is not analyzed in this
study. Also, operating an ORC in remote and harsh offshore environments has its own
risk elements. Further analysis would be required to gain a better understanding where all
the risk elements of logistics support functions interlinked with shore base, ORC and
production platform are considered in an integrated framework. Also, the role of standby
vessels along with an ORC as a risk reduction measure could be evaluated.

207
Some of the technical uncertainties of the ORC such as motion analysis are also not
performed as part of this study. The limitations of helicopter landing/take-off on the ORC
imposed by weather or other technical issues should be evaluated in subsequent phases of
the design spiral. Logistics transfer issues associated with rough weather conditions (e.g.
high winds, waves, freezing rain) to/from a vessel and ORC also need to be further
considered.
6.3 Recommendations and Future Work
Based on Based on some limitation of this work and on areas that could not be covered
within the bounds of a single PhD study, the following future research work is
recommended:
- The study presents a generic fault tree and BN model for a given case study. The
proposed model can be modified based on region-specific features, and analysis should be
performed using suitable probability data available for that region. Feedback from two
experts with similar education and experience levels are considered in this study. More
data from experts with diverse backgrounds such as academicians, ships’ captains, and
other offshore personnel can be incorporated when available. A weighting factor can be
introduced based on the profession and experience of the experts.
- Only discrete probabilities are used in the risk models. More robust estimation can
be obtained if time-sensitive data can be used i.e. seasonal probability data. For example,

208
the probability of some incidents such as the presence of iceberg, fog, etc. will vary over
a year.
- Human error is considered as one parameter in this study, which could be a
combination of a series of nodes that would represent different modes of human-related
failure. With a more detailed literature review and practical datasets, the accuracy of this
human error aspect can be further improved.
- The proposed ORC is in the concept development phase, which can be furthered
by collecting more practical data and input from the industry and subsequently
developing a further iteration on the design possibly through an engineering design study.
- The ORC concept is developed to minimize some of the challenges of logistics
support operation to one oil production platform. In the case study, the space requirement
and thus the overall dimensions of the ORC are estimated to meet the functional
requirements for logistics supply to a single platform. However, the concept and the
approach would remain the same for a design supporting multiple oil field operations.
The space requirement can be determined using a similar approach presented in the case
study based on the demand for multiple platforms. For example, if there are two platforms
to support, more space will be required for in-transit personnel accommodation, service,
fuel storage due to increased helicopter operations, etc. Indeed, the ORC could be more
economical when it supports multiple platforms, although a detailed study is needed to
confirm.

209
- The case study presented in this paper selected offshore Newfoundland to
illustrate the concept development of an ORC. Some aspects of the concept are dictated
by the geographical location, bathymetry and the physical environments. However, the
basic requirements are dictated by the distance offshore for the production platform which
is not site-specific. The environment is a somewhat lesser influence on the concept. For
different environmental conditions such as the Gulf of Mexico or off Coast Brazil would
need to be considered in a concept development that includes tropical storms and
hurricanes, but no threat of dynamic ice or icebergs. Also, in deep water (> 500m),
dynamic positioning (DP) could be the better option for station keeping. When the
platform type and positioning system are defined, the modular concept development
approach presented in the study can be implemented to determine the principal particulars
of an ORC.
- In the cost-benefit analysis, the estimation of ORC capital and operating cost
information by performing a more detailed engineering feasibility study. A more detail
optimization problem can be solved considering multiple platforms and various accident
scenarios.
- Some additional benefits of an ORC are not considered in the cost-benefit analysis
presented here. The most significant additional risk reduction feature is the reduction of
risk associated with long distance helicopter operations. The risk-based economic

210
analysis may consider the reduced risk cost of long-distance helicopter operation
associated with the ORC as an additional benefit to be compared with the required
investment.
6.4 Conclusion
This study provides an analysis that identifies the major challenges of operating offshore
installations in harsh northern regions at increased distances from shore based support.
Although experience in this type of operation is currently very limited, developments that
meet these criteria are under active consideration. This study presents an approach to risk
analysis specifically adapted to the circumstances. A novel technological concept to
mitigate the most significant identified risks is presented and validated in both technical
and risk reduction terms. The method of comparing risk cost and investment provides a
rational means of evaluating this or any other risk reduction approach. It is hoped that
these ideas, methods and concepts will make a positive contribution to offshore safety as
new developments are considered and implemented.