Risk Management for Insurance Firms
254
Risk Management for Insurance Firms A Framework for Fair Value and Economic Capital
Transcript of Risk Management for Insurance Firms

RRiisskk MMaannaaggeemmeenntt ffoorr IInnssuurraannccee FFiirrmmss
AA FFrraammeewwoorrkk ffoorr FFaaiirr VVaalluuee aanndd EEccoonnoommiicc CCaappiittaall

Promotiecommissie Promotoren prof. dr. J. Bilderbeek
prof. dr. ir. A. Bruggink Universiteit Twente Universiteit Twente
Leden prof. dr. A. Bagchi prof. dr. M.W.M. Donders dr. D.Y. Dupont prof. dr. L. Koopmans prof. dr. J.H.R. van de Poel
Universiteit Twente Universiteit Maastricht Universiteit Twente Rijksuniversiteit Groningen Universiteit Maastricht
Printed: NIBE-SVV (www.nibesvv.nl) © 2006, R.R. Doff, ’s-Hertogenbosch Citing and referencing of this material for non-commercial, academic or actual use is encouraged, provided the source is mentioned. Otherwise, all rights reserved. ISBN-10: 90-5516-233-7 ISBN-13: 978-90-5516-233-8

RRIISSKK MMAANNAAGGEEMMEENNTT FFOORR IINNSSUURRAANNCCEE
FFIIRRMMSS
AA FFRRAAMMEEWWOORRKK FFOORR FFAAIIRR VVAALLUUEE AANNDD EECCOONNOOMMIICC CCAAPPIITTAALL
PROEFSCHRIFT
ter verkrijging van de graad van doctor aan de Universiteit Twente,
op gezag van de rector magnificus prof. dr. W.H.M. Zijm,
volgens besluit van het College voor Promoties in het openbaar te verdedigen
op 6 juli 2006 om 16.45 uur
door
René Roelof Doff Geboren op 26 oktober 1976
te Amsterdam

Dit proefschrift is goedgekeurd door de promotoren prof. dr. J. Bilderbeek prof. dr. ir. A. Bruggink

i
VVOOOORRWWOOOORRDD
‘All beginnings are hard’ zijn de eerste woorden van een boek van Chaim Potok. En dus nu ook van dit proefschrift. De paradox is dat ‘hard’ dus relatief meevalt door een dergelijk citaat te gebruiken. En toch: de start van een proefschrift (lees: het voorwoord) is niet eenvoudig, getuige ook de mijmeringen van mede-promovendi. Onder meer omdat niet iedereen een naamgenoot heeft in beroemde verhalen. In elk geval is het voorwoord een goed moment om te reflecteren op het proces van onderzoeken. Waarom begin je aan een onderzoek? Allereerst: omdat het leuk lijkt, leerzaam lijkt en buitengewoon interessant. En inderdaad… het is leuk, leerzaam en interessant. Niet alleen omdat je inhoudelijke kennis vergaart, leert snappen waarom een financiële instelling zich druk maakt om eigen vermogen en balansverhoudingen. Immers, daarvoor heb je het predikaat promovendus niet echt nodig. Onderzoeken is vooral leerzaam omdat het lijkt op een puzzel. Je ziet dat een stukje ontbreekt, maar je weet nog niet hoe het eruit ziet. Sterker nog, als je dacht dat je ongeveer wist hoe het eruit zou moeten zien, blijkt het een totaal andere vorm te hebben als je het eenmaal hebt gevonden. En juist die ontdekking – steeds weer – maakt het leerzaam. Het voorwoord is dus de start van een proefschrift en markeert tegelijkertijd het einde van een periode van onderzoek. En – ook dat is al eens verwoord – een dankwoord hoort daarbij. Een proefschrift schrijven doe je weliswaar zelf, maar ondersteuning van anderen is daarbij van groot belang. Inhoudelijke ondersteuning brengt je als promovendus dichterbij je oplossing. Belangrijk punt hierbij: vaak bestaan oplossingen uit een grote hoeveelheid
“In Risk Management, the expected value is not to be expected”
Bryis, de Varenne (2001)

ii
nieuwe vragen of problemen. Een eerste en belangrijk woord van dank aan Pieter Emmen. Vanaf het allereerste begin hebben we inhoudelijke discussies gehad. Hoeveel ook, altijd te weinig. Voor jou, maar ook voor mij, ook al hebben we dat het laatste halfjaar wellicht minder gezien. Elk woord van dank schiet tekort. Mijn poging in het tekort te schieten is enorm. Desondanks… dank! Een welgemeend woord van dank aan mijn promotoren Jan Bilderbeek en Bert Bruggink. Jullie ondersteuning in de laatste fase bracht ons vaak een kruisbestuiving met ‘aanpalende’ onderzoeksgebieden. Interessant en productief. Zeker ook dank voor het blijvende vertrouwen dat jullie in mij hebben gesteld om een proefschrift te schrijven, ook wanneer het tegenzat. Het schrijven van dit proefschrift ging niet over rozen. Bedankt voor het feit dat het er toch mag liggen. Dank ook aan de leden van de oppositie die in hun drukke agenda de tijd en moeite hebben genomen om dit proefschrift te lezen en hun visie met mij te delen. Het doen van onderzoek biedt kennelijk toegang tot hoogleraren en tegelijkertijd captains of industrie, een bijzonder waardevolle ervaring. Rabobank en Interpolis hebben gezorgd voor tijd en ruimte voor onderzoek naast een baan in de praktijk. Hoewel vast niet altijd eenvoudig, ik heb veel bewondering voor de flexibiliteit die jullie mij boden. Zelfs in de periode dat ik tweemaal een kort quarantaine plande. De Rabobank en Interpolis dank ik daar hartelijk voor in de personen Niek Vogelaar en Pieter Emmen en later Fred Schuurman en Jan Engelen. De morele steun van oud-collega’s bij CRG mag hier niet onvermeld blijven. Beste allemaal, dank dat jullie Erg-Leerzame, Uitermate-Leuke collega’s voor me waren. En gelukkig is er naast risicomanagement ook ander ‘werk’ geweest binnen de Rabobank. De Old Dutch biedt toch altijd weer de beste kant van de bar. Vanaf nu zal ik altijd heimwee hebben… Ook Interpolis-collega’s hebben, soms zonder het expliciet te beseffen wellicht, bijgedragen met inhoudelijke vraagstukken en morele ondersteuning. Ik kijk terug op een leuke en ook succesvolle tijd. Een speciaal woord van dank ook aan Jan Engelen en Marian Eberson. Jullie brachten me een compleet nieuw vocabulaire bij, waarvoor dank, ook al kunnen we die vocabulaire eigenlijk niet in woorden vatten. Wat dat betreft lijkt het op een mooie fles Bourgogne, toch? Hoewel: een fles wijn

iii
moet eerst rijpen voordat zij tot haar recht komt. Hopelijk valt dat bij mij een beetje mee… Gelukkig dan zijn er nog de vele vrienden die langs de zijlijn stonden. Dank voor jullie vriendschap, volleybal-gezelschap, spelletjes, de glazen (flessen) wijn, de gezelligheid en alle dingen waarvoor in dit voorwoord geen plaats is. En Mortelaren: laten we er voor zorgen dat we geen martelaren worden. De vrijdagen bieden uitkomst… en eigenlijk alle andere dagen ook. Twee vrouwen verdienen een speciale plaats in dit voorwoord. Ten eerste, lieve Frieda, zusje van me, we hebben elkaar misschien niet begrepen in de moeilijkste fasen van ons leven tot nu toe. Maar weet dat ik je voor altijd in mijn hart gesloten heb, en je altijd op me kunt rekenen als dat nodig is. En denk na vandaag alsjeblieft nog een keertje aan vroeger (‘wil je de video zien?’) en lach! Ten tweede lieve Erna, wegen kunnen zich scheiden en toch verbonden blijven, dat hebben we gezien. En ik dank jou voor die verbinding en denk nog vaak aan de rivieren… En juist daarom ben ik blij dat jullie beiden mijn paranimf willen zijn. Een goed gebruik in een voorwoord, lieve Alice, is om partner, steun en toeverlaat, te danken voor (in dit geval) haar rol. Daarvoor zijn vele manieren zoals we allebei weten, maar ze passen niet allemaal tegelijk in dit voorwoord. Laten we dan vooral samen lachen om al die keren dat de berg boeken en papieren hoger was dan Nam Tso en de sfeer bitterder dan haar wateren. En ook dan was je steeds weer mijn vuurtorenwachter… ’s-Hertogenbosch, juli 2006


v
CCOONNTTEENNTTSS
Voorwoord i Contents v Chapter 1 Introduction, Problem Definition, Research Structure and Summary 1 1.1 Introduction and Problem Definition 1 1.2 Research Questions and Research Methodology 2 1.2.1 Research Problems 3 1.2.2 Research Question(s) 3 1.2.3 Innovative Aspects 5 1.2.4 A Brief Scientific Reflection 6 1.3 The Concept of Insurance 7 1.4 Insurance Risk Taxonomy 10 1.5 Terms, Definitions and a Language Course 13 1.6 Summary and Overview of the Research 16 Chapter 2 Valuation and Economic Capital for Insurance Liabilities 27 2.1 Introduction 27 2.2 Economic Capital and Risk Management 28 2.3 Risk Management Instruments for Non-Life and Life Insurance 32 2.3.1 Instruments in Non-Life Insurance 33 2.3.2 Instruments in Life Insurance 36 2.4 Risk Management in the Dutch Accounting Regulations 38

Risk Management for Insurance Firms
vi
2.5 Fair Value of Liabilities 40 2.5.1 Asset Pricing Models and Methods 41 2.5.2 Initial Discussions: the Fair Value of Insurance Liabilities 44 2.5.3 Fair Value and Supervision 51 2.5.4 Determine the Risk Charge in Reinsurance 54 2.5.5 Determine the Risk Charge in ART Instruments 55 2.5.6 Fair Value Again 56 2.5.7 Choice for an Appropriate Fair Value Measure 57 2.5.8 Cost of Capital 60 2.6 From Fair Value to Economic Capital 61 2.6.1 Method I: EL-UL for Non-Life Insurance 63 2.6.2 Method II: Value-based for Non-Life Insurance 65 2.6.3 Method III: EL-UL for Life Insurance 67 2.6.4 Method IV: Value-based for Life Insurance 68 2.6.5 Applying Economic Capital and the link to RAROC 70 2.7 Economic Capital Models in Practice: Evidence from the Industry 72 2.8 Summary and Conclusions 75 Chapter 3 Insurance Regulation and Supervision 85 3.1 Introduction 85 3.2 Current Dutch Regulation and Supervision 86 3.3 Developments and Initiatives in Insurance Supervision 87 3.3.1 The Australian Insurance Supervisory Framework (APRA) 88 3.3.2 The Canadian Supervisory System 89 3.3.3 The Dutch Financial Assessment Framework (FTK) 90 3.3.4 The Swiss Solvency Test (SST) 92 3.3.5 Preliminary Findings 94 3.4 Solvency II: the Process 95 3.5 Solvency II: The Framework 97 3.5.1 Issues in Pillar One 99 3.5.2 Solvency Capital Requirement (SCR) 101 3.5.3 Minimum Capital Requirement (MCR) and the Relation to SCR 102 3.5.4 Internal models for the SCR 103 3.5.5 Regulation of Assets 104 3.5.6 Preliminary Findings 105

Contents
vii
3.6 Solvency II and Basel II: Some Remarkable Issues… 105 3.7 Recommendations for the Solvency II Project 111 3.8 Summary and Conclusions 112 Chapter 4 Insurance Investments and ALM 119 4.1 Introduction 119 4.2 The Concept of Management Control 120 4.3 Insurance Assets and the Matching Process 123 4.3.1 Asset- & Liability Management (ALM) 125 4.3.2 Management Control of ALM 128 4.3.3 Current problems in ALM 130 4.4 Matching and Transformation within Banking 131 4.5 Marktzinsmethode in Insurance 134 4.5.1 The Concept 134 4.5.2 The Transfer Price 136 4.5.3 The Underwriting Centre 137 4.5.4 The Investment Centre 139 4.5.5 Taking it All Together 140 4.6 Risk Measurement 140 4.6.1 Market Risk Management and ALM 141 4.6.2 Credit Risk Management 143 4.6.3 Performance Measurement through RAROC 144 4.7 Practical Example of the Marktzinsmethode 144 4.8 Summary and Conclusions 149 Chapter 5 A Case Study 155 5.1 Introduction 155 5.2 Methodology 155 5.3 Case Description 157 5.4 Underwriting Risks 161 5.4.1 Premium Risk 162 5.4.2 Reserve Risk 163 5.4.3 Catastrophe Risk 165 5.4.4 Total Non-Life Underwriting Risk 165

Risk Management for Insurance Firms
viii
5.4.5 Fair Value and the Market Value Margin 166 5.5 Investment Risks and ALM 168 5.5.1 Market Risk Calculations 169 5.5.2 Credit Risk Calculations 170 5.6 Total Economic Capital and Performance Measures 171 5.6.1 Total Economic Capital 171 5.6.1 Underwriting Centre Performance 173 5.6.2 Investment Centre Performance 174 5.6.3 The Insurance Firm as a Whole 175 5.6.4 Solvency position 176 5.7 Extensions Towards Life Insurance – Reflections 177 5.8 Summary and Conclusions 179 Appendix to Chapter 5 181 A.1 Premium Risk Economic Capital Calculation 181 A.2 Reserve Risk 183 A.3 Diversification 185 A.4 Market Risk 186 A.5 Credit Risk 187 Chapter 6 Conclusions and Recommendations 191 6.1 One coherent framework for economic capital and fair value 192 6.1.1 Conclusions and Answers to the Research Questions 192 6.1.2 Limitations of the Research 194 6.2 Solvency II 195 6.2.1 Conclusions and Answers to the Research Questions 195 6.2.2 Limitations of the Research 196 6.3 Consequences for Management control 197 6.3.1 Conclusions and Answers to the Research Questions 197 6.3.2 Limitations of the Research 198 6.4 Overall Conclusion 198 6.5 Recommendations for Further research 199 List of Figures and Tables 203 List of Figures 203

Contents
ix
List of Tables 205 Samenvatting 207 Bibliography 217


1
IINNTTRROODDUUCCTTIIOONN,, PPRROOBBLLEEMM
DDEEFFIINNIITTIIOONN,, RREESSEEAARRCCHH SSTTRRUUCCTTUURREE
AANNDD SSUUMMMMAARRYY
1.1 INTRODUCTION AND PROBLEM DEFINITION
The financial industry is undergoing phase of change. Risk management plays an important role.1 The concept of Economic Capital has become the risk management standard in banking. For banks, the Basel II proposals have been an impetus to implement economic capital in their risk management practice.2 Within insurance firms, however, the application of economic capital has been lagging behind. Convergence in the financial industry is rapidly taking place. This has consequences for Bancassurance and All-Finanz institutions.3 Such institutions will have an incentive to develop risk measurement systems that adequately and consistently take into account risk. The convergence within the financial industry also has consequences in the area of Alternative Risk Transfer (ART). ART products have characteristics of banking and insurance.4 The proper management of risks in ART products require measurement of the risks. With banks and insurers providing ART products, it is important that risk measurement techniques are consistent across banking and insurance. Given these two drivers for convergence within the financial industry (All-Finanz institutions and ART products), discrepancies between banking and insurance are undesirable. Mercer Oliver and Wyman argue that currently there are
CChhaapptteerr
11

Risk Management for Insurance Firms
2
discrepancies in capital productivity between banks and insurers that pose insurers at a competitive disadvantage.5 Therefore, we expect that insurance firms will adopt the concept of Economic Capital as the standard risk measurement system similar to banking. The insurance supervisory area is currently evolving. The European supervisory framework has remained unchanged since the 1970s6 and has consequently become outdated. The Solvency II project7 aims to review the E.U. insurance supervisory framework. In addition, insurance supervision is changing in various countries around the globe (like Australia, Canada, the Netherlands, and Switzerland). The new supervisory framework emphasises proper risk management. Because changing regulation encouraged economic capital implementation within the banking industry, we expect a wave of economic capital implementation in the insurance industry as well. The importance of risk management in the management control systems of financial institutions is growing.8 Financial institutions increasingly become aware of the risk in their business9, 10 and relate the risk to capital via the concept of Economic Capital11 as the overarching risk measurement technique. And through that, they include risk in capital allocation, performance management, and pricing. Economic capital has become the technique to allocate capital, as a buffer against risk, as a scarce resource within the financial institution. Financial conglomerates, combining banking and insurance activities, are currently unable to adequately allocate scarce resources across all of their business, because insurance risk models are only gradually being developed. Given the developments of supervision and convergence, we expect that this will be an incentive for insurance firms to develop and implement economic capital models.12
1.2 RESEARCH QUESTIONS AND RESEARCH METHODOLOGY The previous section observed that economic capital has become the main risk management technique for financial institutions. However, its adoption in the insurance industry is lagging behind. The developments of supervision and convergence will be an incentive for insurance firms to develop economic capital models.

Introduction, Problem Definition, Research Structure and Summary
3
1.2.1 Research Problems From this, we deduce two major problems: 1. Insurance firms do not have an appropriate instrument for total risk
measurement and management; 2. Insurance supervisors do not have an adequate overview of the risks of
supervised institutions. This research aims to resolve these two problems – it is our research objective. Formulating a research objective has three goals:13 (1) it defines the direction of the research; (2) it makes evaluation of the research possible; and (3) it has a motivational function. Moreover, it should be as clear and informative as possible14 as to guide the researcher towards the solution of the research problem. Our research objective is the following:
The research aims to improve the existing management control framework for insurers by designing a risk measurement and economic capital method.
The convergence in the financial industry and the insurance supervisory developments make this research objective extremely relevant and of current interest. Academic research is commonly framed by a central research question that, when answered, realises the research objective. From the central question, the researcher derives sub-questions. This allows the researcher to answer the main question in a systematic way.15 The total research is not more but also not less than systematically obtaining and analysing information with the ultimate objective of gaining knowledge or insight.16
1.2.2 Research Question(s) Our central research question is:
What is an appropriate risk measurement and economic capital framework for insurance firms? How can insurance supervisors use this framework for supervisory purposes?
We derive the following sub-questions: 1. What is the concept of Economic Capital?

Risk Management for Insurance Firms
4
Firstly, we will have to understand this new concept of Economic Capital before we can elaborate on the application in insurance. We will see that valuation rules are an important aspect of economic capital measurement. This implies the following sub-questions: 2. What is an appropriate valuation method for insurance liabilities that
adequately takes into account risks? 3. How can we use this method to determine economic capital for underwriting
risk? Chapter 2 answers these sub-questions. The first sub-question is answered through a review of banking and risk management literature. As discussed the concept of Economic Capital has emerged in the banking industry. Chapter 2 will investigate valuation methods for insurance liabilities by starting at modern corporate finance theories and distilling how they include risk in the value. Chapter 2 will show that fair value is the leading valuation concept to adequately reflect underwriting risks. It combines the insights from the concept of Economic Capital and fair value into an economic capital assessment for insurance liabilities. Section 2.7 investigates how insurance firms are currently designing their economic capital frameworks through a series of interviews with leading experts from the industry. It shows that the presented approach fits the developments in practice quite well. In order to benefit from these insights for supervisory purposes, we will pose the following sub-questions: 4. What are the developments in the area of insurance supervision? 5. What recommendations can we make to increase effectiveness of these
developments? Chapter 3 is an assessment of these sub-questions. It provides an overview of the current European insurance supervisory rules for solvency requirements and concludes that they are unsatisfactory to take into account the risk profile of a supervised insurance firm. By investigating four major supervisory frameworks, chapter 3 is able to make the connection to the proposed European Solvency II framework that is currently being developed. It draws the parallel between the banking Basel II and insurance Solvency II frameworks and then makes recommendations on the proposed Solvency II framework.

Introduction, Problem Definition, Research Structure and Summary
5
The insurance investments are conceptually similar to banking assets. However, practical aspects are likely to differ, like maturities, portfolio composition and the day-to-day management. Therefore, we expect to apply the valuation methods and risk measurement techniques that have already been developed in the banking industry. In addition, management of the mismatch position may differ from banking. However, we have seen that the insurance investments have resulted in quite some problems over the last decade. Therefore, we pose the following sub-question: 6. What is an appropriate method for the management control of an insurer’s
mismatch position? Chapter 4 describes the current methods for insurers matching the liabilities and assets. Firstly, it provides an overview of the most relevant theories of Management Control. Then, chapter 4 reviews relevant literature on the matching process of insurance assets and liabilities. It derives six problems from the literature. Finally, it solves these problems by drawing the parallel between banking and insurance. Chapter 5 investigates whether the framework developed over the preceding chapters works in practice through a case study research. The framework is applied to a non-life insurance firm. For confidentiality, the data have been anonymised. The case study determines the fair value of insurance liabilities, the economic capital for the underwriting risks and the investment risks. Also, it applies the method for managing the mismatch position developed in chapter 4. Chapter 5 concludes that the total framework for fair value and economic capital works in practice.
1.2.3 Innovative Aspects This research aims to provide an complete overview of an economic capital framework for insurance firms. To date, the insurance industry has lacked such an overview and there have been problems to translate the banking economic capital framework to the insurance industry. Moreover, chapter 2 shows that the current accounting-based information is unable to capture the concept of risk and therefore it develops a fair value measure for insurance liabilities. The

Risk Management for Insurance Firms
6
discussion on such valuation framework has, to date, remained unresolved. This thesis develops a valuation framework and argues how risk should be treated in the fair value of insurance liabilities. A fair value measure as well as an economic capital framework for insurance firms is new to the academic world. Also, we relate these concepts to the supervisory framework that is currently being reviewed through, amongst others, Solvency II. Chapter 4 develops a framework for insurance investments. Current matching practice results in management control problems that have received little attention in literature to date. Insurance firms in practice face difficulties in setting the right incentives for underwriting and investment units. Chapter 4 identifies and resolves these problems. This is the third contribution to the academic body of knowledge.
1.2.4 A Brief Scientific Reflection A Dutch PhD-research on Business Administration generally includes an academic reflection on the research structure, method and objectives.17 This especially holds for the more qualitatively oriented research18 as there is much debate on the academic level of such research.19 The research object in this research is the management control system within insurance firms. Chapter 4 defines management control as the process by which managers influence other members of the organisation to implement the organisations strategy.20 There are many ways for managers to influence other members of the organisation. Our research focuses on economic capital as an element in the management control systems of insurance firms. This concept consists of a set of mathematical models and methods that are used to support decision making and the other parts of the management control process. This research ultimately contributes to the knowledge and insights of Business Administration. The scientific area of Business Administration regards organisations as an open technological, social, economic and information processing system with, not necessarily economic, objectives.21 An important characteristic of this area is that it is multidisciplinary, because it integrally encounters organisations from multiple perspectives. Bos states that

Introduction, Problem Definition, Research Structure and Summary
7
“…researching management control systems may be interpreted as an activity of business administration. After all, a management control system addresses management issues and management issues in organisations are pre-eminently the domain of business administration.”22 The multidisciplinary aspect of our research is that it observes management control systems, and more specifically the element of economic capital in such systems. These economic capital systems consist of a set of mathematical models and methods that in turn are a number of related mathematical formulae. Despite the beauty of mathematics, we will concentrate on the relations between the models and the consequences for management control. By keeping the overview of the total set of models in a multidisciplinary manner, we aim to resolve our main research question integrally. And: in such a way that it contributes to the existing body of knowledge in the area of Business Administration.
Chapter 2
Chapter 4Chapter 3
Concept of Economic Capital• In banking: VAR & EL-UL
• EL-UL based• Fair Value based
Economic Capitalfor UnderwritingRisk
Solvency Regulation• Current EU rules• Initiatives (APRA, FTK,
SST, …)
Assets• Management Control• Investment & Matching• Management Control Problems
• Expert interviews
Evidence frompractice
Chapter 1
Chapter 5
Introduction, Problem Definitionand Research Structure
Marktzinsmethode• Two responsibility centres• Risk Measurement
Valuation of InsuranceLiabilities•Asset Pricing Models•Fair Value: best-estimate (EL), marketvalue margin (UL)
Chapter 6Conclusions & Recommendations
Solvency II• Process, Contents• Comparison with Basel II
A Case Study
Figure 1.1: Research Structure
1.3 THE CONCEPT OF INSURANCE Ancient Chinese boats men23 employed the basic principles of insurance by dividing their loads over each others boats. If one of the boats would crash, only part of the load was lost. They shared risk through pooling, a principle that is also predominantly used in insurance.24 In absence of insurance firms, market participants can find others to share risks and perform transactions directly. This
Risk Management for Insurance Firms
8
may be similar to the ancient Chinese boatsmen or by compensating each other financially for the consequences of the risk under consideration. However, that would involve significant transaction costs, including search, screening and monitoring costs. Also, it introduces adverse selection and moral hazard, two phenomena that are inextricable tied to insurance. Adverse selection relates to the effect that people that especially need protection are buying it. For example, less healthy people take out more elaborate health insurance. Moral hazard refers to the effect that people behave relatively more hazardous when they have an insurance policy and this increases the loss for those who have to compensate the loss. Search costs are necessary because market participants may not know from each others’ willingness to share the risks. Screening costs are necessary to limit the effects of adverse selection and monitoring costs are necessary to limit the effects of moral hazard. Insurance firms exist because they can economise on these costs. Insurance firms intermediate between the various market participants; they are financial intermediaries. By selling insurance policies, their services are efficient information processing, delegated monitoring, and risk reduction through pooling.25 By doing so, insurance firms mostly absorb risks themselves. This increases the need for risk management methods for the insurer. Financial intermediation theories have focused especially on banks,26 but they hold equally well for insurance firms. Whilst banks are exposed to systemic risk through bank runs,27 insurance firms face systemic risk through their investments. Firstly, insurance firms increasingly rely on equity markets for investments. Therefore, a crisis for one insurance firm liquidating its equity positions is likely to have effects on the real economy through the equity markets. This creates a systemic risk for the insurance industry.28 Secondly, it is extremely important that policyholders have confidence in the insurance firm. After all, insurance products have a longer lifetime than banking products and the client needs to rely on the insurers’ ability to honour future obligations.29 A recent theoretical perspective explaining the existence of financial intermediaries is that financial intermediaries provide risk management services: risk absorption and risk transformation for clients.30 Theoretically, insurance firms have an incentive to take excessive risk because that generates additional return for the shareholders in the short run. However,

Introduction, Problem Definition, Research Structure and Summary
9
if the risks materialise, the risks may have long term effects for policyholders, for instance because they cannot be compensated for consequences for which they have an insurance policy. To prevent such behaviour, insurance firms are supervised and regulated. Insurance supervisors, amongst others, supervise the financial health of the insurance firms.31 Chapter 3 describes the evolution that is currently taking place in insurance supervision. The insurance market is broadly separated between non-life and life insurance. Non-life insurance policies compensate policyholders against events like fire, theft and personal liability, depending on the specific policy coverage. Life insurance provides predetermined payments at death of the insured or at a predetermined age. Generally, there are life insurance policies with one single premium or a series of premium payments and with one single or a series of payments from a predetermined age. The balance sheet of a typical insurance firm consist of three components32 as depicted in Figure 1.2: (1) technical provisions and (2) equity are the two major liability categories and (3) investments are the assets. Firstly, the technical provisions are formed at the moment that an insurance policy is sold. Depending on the insurance form, the technical provision gradually increases up to the moment of claim payment. The insurance firm sets technical provisions with a level of prudence in order to be able to fulfil the claim payment even under adverse circumstances. As a result, the technical provisions are higher than what is normally expected. The level of prudence has traditionally been included implicitly in the calculation methods. New developments in the area of fair value require that the level of prudence is determined more explicitly and according to consistent rules. In the fair value context, prudence is called ‘market value margin’ or risk margin. Most of the fair value discussions concentrate on the methods to determine the market value margin. Chapter 2 discusses these issues. Secondly, the equity is subject to minimum solvency requirements. Traditionally, these have been relatively crude and therefore, they are currently being updated in multiple parts of the world. The E.U. Solvency II project is most well-known, but solvency requirements frameworks are also reviewed nationally like

Risk Management for Insurance Firms
10
in Switzerland, the Netherlands, Canada and Australia. Chapter 3 discusses current developments in the area of solvency requirements more in detail. Thirdly, the assets of insurance firms are mainly investments. Traditionally, insurers have allocated the largest part of their investments to bonds. The increasing competition and the low interest rate environment have ‘forced’ insurers to allocate an increasing part of their investments to other asset classes. This enhances the investment results of the insurer as a whole, but brings with it a management control problem: how to relate the additional investment risk and return to insurance products? Chapter 4 investigates this problem in detail.
Assets
(government)bonds and other
asset classes
Liabilities
Prudence
Equity
Assets
(government)bonds and other
asset classes
Insurance Balance Sheet
Liabilities
Prudence
Equity
Figure 1.2: A Typical Insurance Firm Balance Sheet
1.4 INSURANCE RISK TAXONOMY
Before discussing risk measurement more in detail throughout this thesis, this section develops a risk taxonomy for insurance firms for the purpose of economic capital. There is extensive literature of banking risks and risk measurement methods:33 credit risk for lending, market risk for trading and interest rate mismatch risk for the treasury. All these components can be further sub-categorised in their risk drivers.34 Rouyer et al.35 distinguish customary, cyclical and event risk on one hand and six risk exposures on the other hand: market, interest rate, funding/liquidity, credit, operational, and business risk. This provides a matrix classification of risks. Generally, we can state that most banking risk management frameworks have adopted this classification, but only

Introduction, Problem Definition, Research Structure and Summary
11
one-dimensional. An important example is the Basel II framework.36 The three natures (customary, cyclical and events) of risk are mostly not explicitly addressed for instance in capital requirements or risk measurement methods.37 A similar matrix structure for insurance is provided by the International Association of Actuaries (IAA).38 IAA proposes a risk framework that has been received extremely positively in the insurance industry, as a result of which it is the basis for Solvency II. We expect the IAA framework to become the standard risk taxonomy and will adopt it in this thesis. The IAA-definition of risk is: “… the chance of something happening that will have an impact upon objectives. It is measured in terms of consequences and likelihood.”39 IAA distinguishes five main categories that can be further classified into parts. The main categories are:40 Underwriting risk: the risk associated with perils covered by the insurance
products and with the specific processes associated with the conduct of the insurance business;
Credit risk: the risk of default and change in the credit quality of issuers of securities, counter-parties and intermediaries to whom the company has an exposure;
Market risk: the risk arising from the level or volatility of market prices of assets. It involves the exposure to movements in the level of financial variables such as stock prices, interest rates, exchange rates or commodity prices. It also includes exposure of options to movements in the underlying asset price. This definition includes ALM or mismatch risk.
Operational risk: the risk of loss resulting from inadequate or failed internal processes, people, systems or from external events;
Liquidity risk: exposure to loss in the event that insufficient liquid assets are available to meet cash flow requirements of policyholder obligations when they are due.
In addition, we would like to add the following risk category as it is also present in most economic capital frameworks.41 However, it is very hard to measure in statistical methods. Business risk: the risk of losses due to unexpected changes in the
competitive environment of the firm or in the extent that it can flexibly adapt to these changes.

Risk Management for Insurance Firms
12
Measurement methods for operational risk and business risk have been in their early stages since 1999.42, 43 This thesis will ignore these two risks because in our view the relevant issues are equal for banks and insurance firms. We expect that these issues are most likely to be resolved in the area of banking firstly, because insurance firms are concentrating on implementing economic capital models for the other risks at this moment. Liquidity risk is still an unsolved puzzle in the economic capital framework. Generally, it is measured through the use of scenarios rather than capital.44 Therefore, this thesis will ignore liquidity risk. We choose to focus on the investment risks and the underwriting risks in this thesis, because they are the most important elements in economic capital frameworks.
Risk
Non-financialRisks
Market Risk(incl. ALM) Credit Risk Non-Life Risk Life Risk Operational
Risk Business Risk
InvestmentRisk
UnderwritingRisk
Figure 1.3: Risk Taxonomy
In combination with the risk categories above, IAA defines three components of risk:45 Volatility: random fluctuations in either the frequency or severity of a
contingent event; Uncertainty: using an incorrect model (model risk), mis-estimation of
parameters (parameter risk) and inadequate treatment of changes over time (structural risk). It is sometimes also called trend risk.
Extreme events: fluctuations much greater than might be expected from regular shocks.
Although these components are valid for all risk categories, IAA considers them especially relevant for the underwriting risks.

Introduction, Problem Definition, Research Structure and Summary
13
1.5 TERMS, DEFINITIONS AND A LANGUAGE COURSE
The concept of Economic Capital is a relatively new concept and given the convergence developments, this thesis is relevant and innovative for both bankers and insurers. Nevertheless, this thesis is specifically on insurance firms. Therefore, this section provides a background on the concept of Insurance and the related terms. Culp argues bankers and insurers consists of two camps using different terms for the same aspects. “Despite the fundamental similarities between what members of the two camps are trying to do for their companies, often it is impossible to hold a conversation with both groups at the same time without a translator.”46 But even within the industry,47 various groups use the same terms for different things and vice versa. An extreme example is the term ‘reserves’ which refers to the technical provisions (and thus, debt) for actuaries and to equity for accountants. Adding to the confusion, reinsurers48 have their own specific terminology that is again different from primary insurance. Examples are priority, retention, and attachment points. Insurance firms absorb risks for policyholders in exchange for an ex ante premium. This creates an uncertain obligation – uncertain with respect to timing, frequency, and size of the future event. The Law of Large Numbers49 allows the insurance firm to diversify and limit the total risk profile. Additionally, the insurer can buy reinsurance or other ART products50 to limit the total risk exposure. The uncertain obligation creates a liability on the balance sheet. They are called technical provisions, technical reserves or simply reserves. We will use the former term or refer to insurance liabilities in general. The sum of technical provisions is by far the largest item on the balance sheet. Basically, equity and technical provisions are the only liabilities. Life insurance technical provisions are created directly after selling the insurance policy, because it is certain that an amount will be paid somewhere in the future. Only the timing is uncertain. However, this is not the case for non-life insurance, because it is uncertain whether claims will occur at all. The actuary tests the adequacy of technical provisions and does so prudently – the technical provisions need to be sufficient to meet obligations when they become due with a great amount of certainty. The principle of technical provisions is totally different from provisioning in banking. Banks provision when there are concrete signals that a loan will default. As a result, loss provisions are relatively smaller
Risk Management for Insurance Firms
14
than technical provisions. The general loss provision in banking seems a bit like the insurance technical provisions, but it has been abandoned in banking recently due to IFRS. The second liability item on the balance sheet is equity capital by accountants, surplus by actuaries and capital by risk managers. We will use the term equity or capital. More interesting are the minimum solvency requirements, or solvency margin as it is also called in insurance. They exist for banks and insurance firms. Because the solvency requirements are mostly unbinding, there is additional available capital. Confusingly, this is sometimes called free assets. We will use the term equity surplus in this thesis. The risk terminology is also an area of much confusion. For a long time, risk assessment in insurance was basically the annual adequacy test of the technical provisions by the actuary. As a result, the focus was on technical provisions. This thesis will develop another risk framework: economic capital. Non-life insurance policies (also called Property and Casualty, P&C, Property and Liability, P&L, or general insurance) compensate the policyholder for an uncertain event in the coming period in exchange for a single premium. Mostly, the period is one year. The risk of such policies is two-fold. Firstly, the total claim size is volatile. There may be more claims than expected and claims may be larger than expected, or both. This is sometimes called premium risk or current-year risk. Secondly, the run-off is volatile. This is sometimes called reserve risk or prior-year risk because it affects events from prior years and therefore affects the technical provisions. Run-off is the claim payment pattern over time. For complex claims, the run-off is an important aspect. For claims in a particular year, claim payments may occur over multiple years before the case is closed. This is called long-tail insurance and personal liability is an example. Short-tail insurance is for instance fire insurance. The short-tail/long-tail discussion is not to be confused with fat tails of probability distributions. The latter is a banking risk managers’ term to refer to probability distributions being skewed rather than normal. To add to the confusion: both short-tail and long-tail insurance are likely to have fat tails.

Introduction, Problem Definition, Research Structure and Summary
15
An overview of relevant definitions: Risk the negative consequences when reality differs from
expectations. Credit risk the risk of a decrease in value when counterparties
cannot fulfil to their obligations anymore or when bonds decrease in value due to a decrease in the counterparties credit quality.
Market risk the risk of a decrease in value due to changes in the market parameters like interest rates, foreign currency rates or stock prices.
Interest rate risk the risk of a decrease in value when interest rates change. It is an component of market risk.
Underwriting risk the risk of a decrease in value when underwriting assumptions are different from the reality. It consists of non-life and life risk.
Non-life risk the risk of a decrease in value when claims are larger than expected or the run-off is longer than expected. It consists of premium risk and reserve risk.
Premium risk the risk of a decrease in value when claims from current policies are larger than expected. This is also called current-year risk.
Reserve risk the risk of a decrease in value when the run-off of liabilities is different than expected because claims from past years turn out to be larger than expected. This is also called prior-year risk.
Life risk the risk of a decrease in value when mortality assumptions are different than expected
Economic capital the minimum amount of capital needed to absorb unexpected losses up to a certain level of confidence.
Statutory capital Solvency requirement according to the regulator/ supervisor.
RAROC Risk-adjusted Return on Capital. Central performance measure in the concept of Economic Capital, expressed as a percentage.

Risk Management for Insurance Firms
16
Fair value the price for which an asset could be exchanged or a liability be settled between knowledgeable, willing parties in an arm’s length transaction. In the context of insurance, it consists of a best-estimate plus a market value margin.
Best-estimate expected value or outcome, the mean of a probability distribution.
Prudence an additional level of safety on top of the statistically determined expectations. It is most often related to the technical provisions.
Market value marvgin an element of the fair value of insurance liabilities to reflect a compensation for bearing future risks.
Worst-case in the context of economic capital, it refers to the value of the probability distribution at a predetermined confidence level, like 99.95%. The confidence level relates to the desired rating of the (insurance) firm.
1.6 SUMMARY AND OVERVIEW OF THE RESEARCH
The subject of this thesis is risk management in insurance firms, and more specifically fair value and economic capital. The concept of Economic Capital has become the risk management standard in banking, but the insurance industry seems to be lagging behind. Moreover, little is known on economic capital models or applications in the area of insurance. This research aims to improve the existing management control framework of insurance firms by designing a framework for fair value and economic capital. The overarching research question is:
“What is an appropriate risk measurement and economic capital framework for insurance firms? How can insurance supervisors use this framework for supervisory purposes?”
To answer this question, chapter 1 formulates six sub-questions: 1. What is the concept of Economic Capital?

Introduction, Problem Definition, Research Structure and Summary
17
2. What is an appropriate valuation method for insurance liabilities that adequately takes into account risks?
3. How can we use this method to determine economic capital for insurance risk?
4. What are the developments in the area of insurance supervision? 5. What recommendations can we make to increase effectiveness of these
developments? 6. What is an appropriate method for the management control of an insurer’s
mismatch position? Chapter 2 answers sub-questions 1, 2, and 3. The concept of Economic Capital is a management control principle including risk measurement methods that relate the amount of risk to the loss of the statistically determined worst-case loss over a predetermined time horizon. In this manner, the concept of Economic Capital measures different risks consistently, which, in turn, allows apple-to-apple comparison of risks. In banking, two categories of economic capital models exist. The EL-UL (c.f. Expected Loss, Unexpected Loss) method relates risk to losses as they are presented in accounting terms. The VAR method relates risk to loss in (fair) value. The performance measure RAROC plays a central role in the application of economic capital for capital allocation and risk-based pricing. Relevant risk measurement instruments in insurance include loss distributions and the loss triangle (for non-life insurance) and mortality tables (for life insurance). Loss distributions are used to estimate the number and amount of claims that may occur in a particular period. Loss triangles estimate the run-off of existing claims over time. Mortality tables are used to determine the cash flow pattern over time. These instruments have traditionally been used to determine the technical provisions. The current accounting information inadequately takes into account the concept of Risk. Risk has been captured implicitly by prudently determining the technical provisions. Recent developments focus on the fair value of financial instruments. Because there is no liquid secondary market for insurance liabilities, the fair value cannot be derived from recent transactions, which is the preferred measure by, amongst others, the International Accounting Standards Board (IASB).

Risk Management for Insurance Firms
18
Therefore, the fair value should be estimated through the use of models. The presence of risk in insurance liabilities poses additional challenges for the valuation models. Section 2.5 investigates three fair value models: 1. NPV models in which risk is included by adjusting the discount rate (i.e. by
adjusting the numerator); 2. NPV models in which risk is included by introducing a market value margin
on top of the expected cash flows (i.e. in the denominator). The expected cash flows are discounted by the risk-free rate;
3. Arbitrage pricing models in which the fair value is derived by composing a portfolio of instruments with the same cash flow pattern. Risk is treated implicitly.
Traditionally, application of the NPV includes risk in the numerator by choosing the appropriate discount rate, for example through CAPM. However, this method is not possible for insurance liabilities for a number of reasons (see section 2.5). The same holds for arbitrage pricing models like option pricing. Therefore, section 2.5 argues that method 2 fits best to modern corporate finance theory. As a result, fair value is the best-estimate (NPV of expected cash flows, discounted by a risk-free rate) and a market value margin to reflect prudence (Figure 1.4):
Margin ValueMarket
)( timeat flow Cash Value Fair
t+
+=∑ t
frt
1 The market value margin should be addressed as a compensation for bearing the risk, but at the same time, it acts as a buffer to absorb risks. The latter function is similar to the function of economic capital. To adjust for this undesired effect, the market value margin should be considered a form of hybrid equity capital on the balance sheet. The Australian supervisor introduced a percentile approach to determine the market value margin: a 25% percentile on top of the best-estimate. The total technical provisions are determined as a 75% percentile of the probability distribution (best-estimate is 50%, market value margin is 25%). The Swiss supervisor introduced a cost-of-capital approach: the market value margin is the cost of holding future risk capital. Section 2.5 argues that the latter approach fits

Introduction, Problem Definition, Research Structure and Summary
19
the modern corporate finance approach best. And it fits in the concept of Economic Capital, in which capital, and not prudence in the technical provisions, acts as the primary buffer against risk. Because the cost of capital and the calibration of economic capital are specific to the insurance firm, this fair value definition results in an entity-specific value.
Assets
(government)bonds and other
asset classes
Liabilities
Prudence
Equity
Assets
(fair value)
Insurance Balance Sheet
Liabilities
Prudence
Equity
Discounting expected futurecashflows by risk-free rateresults in Best-estimate Value(including Expected Loss)
Market Value Margin reflects risk(Unexpected Loss)
Figure 1.4: Fair Value of Insurance Liabilities is Best-Estimate plus a Market Value Margin
The above implies that economic capital should be determined as the worst-case decrease in best-estimate fair value. Section 2.6 develops an economic capital methodology using loss triangles and mortality tables to extract the expected future cash flow pattern (Figure 1.5). From there it calculates best-estimate fair value, economic capital and the market value margin. The total fair value equals the best-estimate plus the market value margin. We propose two versions of the performance measure RAROC, both are based on fair value. The lifetime-RAROC is suitable for, amongst others, pricing, whilst the one year-RAROC can be used for performance measurement.
100%
Capital)ic NPV(EconomValue Fair lifetime ×=RAROC
100%
CapitalEconomic Value FairValue Fair
1t
0t1tyear-one ×
−=
=
==RAROC
Chapter 5 applies a case study research to test the application of the framework for fair value and economic capital in practice. The case study is a non-life

Risk Management for Insurance Firms
20
insurance firm. We have chosen to apply the fair value and economic capital methods to a non-life insurer, because there is less knowledge about a value-oriented framework than in life insurance (c.f. embedded value). The case study shows how fair value and economic capital are calculated for the underwriting risks.
Economic CapitalTotal Fair Value
Worst-case risk driver
Loss Triangles
Risk Margincost of holding economic capital
Worst-caseNPV worst-case cash flows
Economic CapitalEconomic Capital
Worst-case risk driver
Mortality Tables
Risk Margincost of holding economic capital
Market Value Margincost of holding economic capital
Risk Margincost of holding economic capital
Best-estimateNPV expected cash flows
Figure 1.5: Fair Value and Economic Capital for Underwriting Risk
Chapter 3 investigates supervisory developments and answers sub-questions 4 and 5. The existing E.U. solvency regulations are insensitive to risk and this is widely acknowledged by the industry. The fact that firms internally apply multiples like two or three to the E.U. solvency requirements illustrates their crudeness. The solvency regulations are currently being reviewed through the Solvency II project. Section 3.3 describes four national supervisory frameworks that have been reviewed recently and, as a result, serve as an example for the Solvency II project. The main findings are: There is an increasing attention for risk in the supervisory frameworks; There is a trend towards fair value for insurance liabilities in order to
adequately reflect risk. There are multiple approaches to determine the market value margin;
Internal risk models are allowed to determine the solvency requirements. However, there are relatively little compliance criteria.

Introduction, Problem Definition, Research Structure and Summary
21
The Solvency II project is designed around the three-pillar structure that is also present in Basel II, the recently redesigned banking supervision framework. However, Solvency II includes more aspects in pillar 1 and 2 than Basel II. Additional pillar 1 elements are valuation of technical provisions and asset management rules. Additional pillar 2 elements are harmonisation of supervisory powers. Pillar 1 includes two capital requirements. The Solvency Capital Requirement (SCR) is a target level of capital below which supervisors intervene with gradually more powerful measures. The Minimum Capital Requirement (MCR) is the absolute minimum level of capital. Setting explicit buffers for risk introduces interplay between prudence in the technical provisions and capital (see Figure 1.6). A higher market value margin in the technical provisions could offset solvency requirements. However, a proper definition of the market value margin in fair value as discussed above resolves this issue. The market value margin is the cost of holding an amount of risk capital rather than the buffer itself.
Assets
(government)bonds and other
asset classes
Liabilities
Prudence
Equity
Assets
(fair value)
Insurance Balance Sheet
Liabilities
(fair value)
AvailableCapital
Liabilities
(best-estimate)
Market ValueMargin
SolvencyRequirement
Figure 1.6: Total Capital Requirement Related to Prudence and Solvency Requirement
We compared the Solvency II project to Basel II, its banking counterpart. Section 3.6 concludes that Solvency II is lagging behind, but has more ambitious objectives than Basel II. The Solvency II project is managed by the Committee of European Insurance and Occupational Pensions Supervisors (CEIOPS). Section 3.7 answers sub-question 5 and makes the following recommendations to enhance effectiveness of the Solvency II project: CEIOPS should publish a concrete proposal as soon as possible;

Risk Management for Insurance Firms
22
CEIOPS should prescribe an internal model structure for the internal model approach;
CEIOPS should include long term scenario analysis in Pillar 2; CEIOPS should not limit the asset management of insurance firms; and CEIOPS should adopt a cost-of-capital approach for the market value
margin. Chapter 4 answers sub-question 6. It investigates the investment process within insurance firms from a management control perspective. Management control is the process whereby managers influence other members of the organisation to implement the organisation’s strategy. Systems theory provides a useful framework to investigate management control problems. De Leeuw defines five necessary, but not sufficient conditions for effective control. In addition, chapter 4 investigates the phenomenon of goal congruence. The investment and Asset- & Liability Management (ALM) process builds on the matching strategy. The matching strategy describes the asset mix of an insurance firm. Investment returns are transferred to the underwriting unit. Underperformance remains uncovered when underwriting results are good while investment returns are bad and vice versa. The focus of the matching strategy is ‘liability-driven investment’ but the underwriting unit has no incentive to sell products for which liabilities may be easily invested: ‘investment-driven underwriting’. The current matching process violates conditions for effective control and does not enhance goal-congruent behaviour. Chapter 4 discusses how the Marktzinsmethode can be used to resolve these problems. Two separate responsibility centres are designed (see Figure 1.7 and Table 1.8): The underwriting centre is responsible for selling insurance policies at an
actuarially fair price and manages the underwriting risks only. Its liabilities are invested internally at the investment centre.
The investment centre is responsible for investing the internal transactions and managing the mismatch risk.

Introduction, Problem Definition, Research Structure and Summary
23
Liabilities
Capital
Internal transaction
(no investmentrisk)
Assets
Internal transaction
Assets (mismatch)
Underwriting Responsibility Centre
Liabilities
Capital
Internal transaction
(no investment risk)
Assets
Investment Responsibility Centre
Internal transaction
Assets (mismatch) Internal
transferprice
Liabilities
Capital
Internal transaction
(no investmentrisk)
Assets
Internal transaction
Assets (mismatch)
Underwriting Responsibility Centre
Liabilities
Capital
Internal transaction
(no investment risk)
Assets
Investment Responsibility Centre
Internal transaction
Assets (mismatch) Internal
transferprice
Figure 1.7: Structure of the Marktzinsmethode in Insurance
The internal transactions are a central element in the concept of the Marktzinsmethode. The transfer price should enhance the right behaviour. Therefore, the transfer price should be the risk-free rate, without any reference to investment risk or actuarial risks. In the Marktzinsmethode, only the investment centre bears market risk and credit risk. Theories and measurement models have been developed in detail since the 1990s. Therefore, investment risks can be measured and managed with existing methods and models. The separation of the risks and the choice for the appropriate transfer price resolves the management control problems that chapter 4 initially observed. Underwriting centre Investment centre Objective Managing underwriting position by
selling insurance policies Managing mismatch position and capital base by investing in asset portfolio
Performance Added underwriting fair value Fair value investment returns Risks Underwriting risk, unhegdeable
embedded options Market risks (predominantly interest rate risk) and credit risk
RAROC CapitalEconomic
value fair ngunderwriti Added
CapitalEconomic value fair investment Added
Table 1.8: Objective and Performance Measures within Marktzinsmethode in Insurance
Chapter 5 tests the application of the Marktzinsmethode in practice by performing a case study. The case study shows how economic capital for the investment risks is calculated separately from the underwriting risks. By resolving the sub-questions in all subsequent chapters, chapter 6 answers the main research question. An economic capital framework for insurance firms should be built on fair value, because accounting information inadequately reflects risk. Insurance liabilities should be valued at fair value, which is defined

Risk Management for Insurance Firms
24
as a best-estimate and a market value margin. Economic capital should be related to the best-estimate fair value. A proper economic capital framework should uniquely allocate the market and credit risk to an investment centre separately from the underwriting centre. This is possible through the application of the Marktzinsmethode. The Solvency II project should build on the fair value progress that has been made in the area of economic capital. However, it should adapt its ambitions and prescribe a model structure to guide insurance firms building their internal models. In addition, the Solvency II project should publish concrete proposals as soon as possible rather than discussing the basic principles.

Introduction, Problem Definition, Research Structure and Summary
25
NNOOTTEESS TTOO CCHHAAPPTTEERR 1 Scholtens, Wensveen (2003), p. 31 2 Doff (2004), p. 114 3 Leeuw de (1996), chapter 4 and 6 4 Culp (2002-a), p. 351 5 MOW (2004), p. 31 6 EEC (1973) and EEC(1979) 7 E.U. (2002) 8 Bos (1999), p. 112, Bos, Bruggink (1996), p. 103 9 Lemmen (2003), p. 109 10 Financieele Dagblad (2002), 11 september 2002 11 Doff (2005), p. 583 12 Drzik (2005), p. 85-86 13 Pape (1999), p. 46 14 Verschuren (1999), p. 31 15 Bos (1999), p. 21 16 Bos (1999), p. 21 quoting Van der Zwaan (1995) 17 Van Triest even states “No Dutch thesis in the field of business administration and management is complete without a section on methodology” Van Triest (2003), p. 7 18 See Bos (1999),20-24, Van Triest (2000), section 1.3, Van den Tillaart (2003), chapter 2 19 Gelderman (2000), p. 83 20 Anthony (1988), p. 10 21 Bilderbeek (2005), p. A1/2 22 Bos (1999), p. 24 23 Van den Tillaart (2003), p. 65 24 Swiss Re (1996), p. 6 25 Santos (2000), p. 4 26 Gorton and Winton (2002) provide an impressive overview of the existing theories on financial intermediaries. 27 Gorton, Winton (2002), p. 21 28 Lemmen (2003), p. 107 29 Lelyveld Van, Schilder (2002), p. 10 30 Scholten, Wensveen (2003), p. 34 31 IAIS (2005-a), art. 12 32 Swiss Re (1999), p. 10 33 Bos (1999), p. 16, Raff (2000), p. 12, Schroeck (2000), chapter 5, Marison (2002), Chisholm (2002), p. 321 34 Bos, Bruggink (1996), chapter 4 35 Rouyer (2001), p. 7 36 Basel Committee (2004) 37 However, the discussion on ‘procyclicality’ within the context of Basel II highlights the cyclical nature of credit risk. Even though it is not explicitly measured in a capital charge, it is addressed through Pillar II. The same holds for stress-testing of models, in which potential effects of dramatic events are evaluated. 38 IAA (2004), chapter 5 39 IAA (2004), art. 5.5 40 IAA (2004), section 5.2 41 Risk Management Task Force (2004), p. 7-8 42 Van den Tillaart (2003), p. 79 43 Matten (2000), p. 212 44 Kok (2004), p. 17 45 IAA (2004), p. 27-28 46 Culp (2002-a), p. xii 47 Navest develops an interesting set of 150 definitions for the Solvency II project. See Navest (2005), chapter 4 and 5.

Risk Management for Insurance Firms
26
NOTES (CONTINUED) 48 Reinsurance is basically the insurance policy for insurance firms. Reinsurance is also referred to as secondary insurance contrary to primary insurance. 49 “… but the Law of Great Numbers is not at all a good name for the principle which underlies statistical induction. The ‘Stability of statistical frequencies’ would be a better name for it.” Keynes (1921), p. 368 50 See Culp (2002-a), part IV or Banks (2004), chapter 3
27
VVAALLUUAATTIIOONN AANNDD EECCOONNOOMMIICC
CCAAPPIITTAALL FFOORR IINNSSUURRAANNCCEE
LLIIAABBIILLIITTIIEESS
2.1 INTRODUCTION
This chapter develops a method to calculate the economic capital for underwriting risk. As such it ultimately answers our third research question (‘What is an appropriate method to calculate economic capital for underwriting risk?’). However, before we can do this, we need to answer the first two questions. Section 2.2 explains the method of economic capital and its application for risk management. This answers the first research question: ‘What is the concept of Economic Capital?’ Section 2.3 discusses common insurance risk techniques for both non-life and life insurance. It investigates how these techniques may help us to calculate economic capital. Section 2.4 investigates the role of accounting information in a risk management framework. It will conclude that current accounting information is of limited use due the specific long-term nature of insurance products and the implicit treatment of risk via various prudence levels. Section 2.5 will answer the second research question ‘What is an appropriate valuation method for insurance liabilities that adequately takes into account risk?’ It discusses methods to calculate the fair value of insurance liabilities. This is a very current topic as both the newly developed accounting rules and the supervisory framework will include a fair value measure of insurance
CChhaapptteerr
22

Risk Management for Insurance Firms
28
liabilities. Especially the so-called ‘market value margin’ to incorporate risk in the liabilities is a topic of intensive discussions. Section 2.5 designs a method that fits into the concept of fair value. After developing a Fair Value method in section 2.5, section 2.6 determines methods to assess the sensitivity of the fair value to the underwriting risk drivers. Section 2.7 investigates whether and how insurance firms apply economic capital methods in practice. Section 2.8 concludes and answers our third research question.
2.2 ECONOMIC CAPITAL AND RISK MANAGEMENT The economic capital method is the major risk management method within the financial industry. It has emerged in the banking industry and rapidly spread over larger banks in the 1990s. The introduction of Basel II accelerated the adoption of economic capital even more. Now, every large bank is assumed to have economic capital models in place. This section discusses the concept of economic capital in the banking context only. With its origins in Value-at-Risk (VAR) in the market risk area,1 its application now stretches over multiple risk types. The basic theme behind the concept of Economic Capital is that for a financial institution to be able to develop long term strategies, it should keep a minimum level of capital such that it covers both normal losses and improbable losses whilst still leaving the bank to operate at the same level of capacity2 or to unwind the banking business properly without putting depositors at a loss.3 Common definitions of economic capital are: Economic capital is the potential loss in value of assets (or increase in value
of liabilities) over a given period, at a given confidence level;4, 5 Economic capital is the amount of capital needed to cover unexpected
losses;6 Economic capital is the amount of capital needed to protect debtholders and
policyholders against insolvency;7 Economic capital is the minimum amount of capital that has to be invested
to buy insurance that fully protects the value of a banks net asset against a decline in value.8, 9, 10
Although these definitions differ, there are important similarities. Firstly, economic capital is needed to cover unexpected losses in value. Secondly, economic capital determines a minimum buffer to absorb risks. Consequently, it
Valuation and Economic Capital for Insurance Liabilities
29
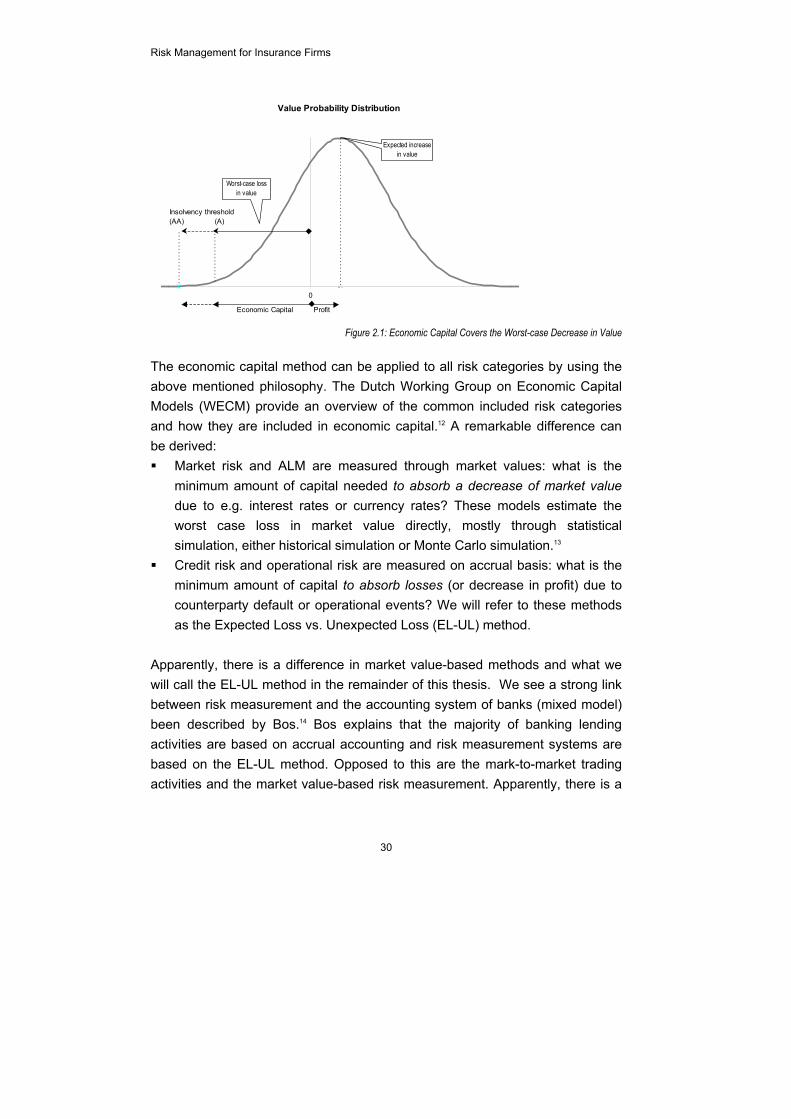
is an important tool for risk management. Thirdly, economic capital is determined through the use of statistical methods. Please note that any application of economic capital in practice is accompanied by mentioning a statistical confidence level and a time horizon. Most institutions apply a one-year time horizon, but theoretically every other time horizon may be used. The common reason for a one-year time horizon is not so much that losses will not further accumulate after that year, but that the institution is able to intervene within the period of one year: it can raise additional capital, arrange stop-loss measures, or limit other risks. As an institution is never completely certain about the maximum amount of losses within one year, it is common to apply statistical confidence levels: with e.g. 99.9% certainty the institution will remain solvent within one year. The confidence level is derived from the desired credit rating, provided by rating institutions like Moody’s or Standard & Poor’s, publishing the credit standing of most financial institutions. As an example: an AA-rated institution like ING Bank uses a statistical confidence level of 99.95% while AAA-rated Rabobank Group applies 99.99%.11 In this thesis, when referring to the worst-case losses for a certain risk category, we mean the maximum loss within the predetermined confidence level. The definition of economic capital is: the minimum amount of capital a financial institution has to hold to avoid economic insolvency within one year and with a predetermined amount of certainty? Figure 2.1 provides a graphical representation commonly used in literature.
Risk Management for Insurance Firms
30
Value Probability Distribution
Economic Capital Profit
0
Insolvency threshold(AA) (A)
Expected increasein value
Worst-case loss in value
Figure 2.1: Economic Capital Covers the Worst-case Decrease in Value
The economic capital method can be applied to all risk categories by using the above mentioned philosophy. The Dutch Working Group on Economic Capital Models (WECM) provide an overview of the common included risk categories and how they are included in economic capital.12 A remarkable difference can be derived: Market risk and ALM are measured through market values: what is the
minimum amount of capital needed to absorb a decrease of market value due to e.g. interest rates or currency rates? These models estimate the worst case loss in market value directly, mostly through statistical simulation, either historical simulation or Monte Carlo simulation.13
Credit risk and operational risk are measured on accrual basis: what is the minimum amount of capital to absorb losses (or decrease in profit) due to counterparty default or operational events? We will refer to these methods as the Expected Loss vs. Unexpected Loss (EL-UL) method.
Apparently, there is a difference in market value-based methods and what we will call the EL-UL method in the remainder of this thesis. We see a strong link between risk measurement and the accounting system of banks (mixed model) been described by Bos.14 Bos explains that the majority of banking lending activities are based on accrual accounting and risk measurement systems are based on the EL-UL method. Opposed to this are the mark-to-market trading activities and the market value-based risk measurement. Apparently, there is a

Valuation and Economic Capital for Insurance Liabilities
31
strong link between risk measurement and accounting methods in banking. Banking interest rate risk measurement is an exception, because that takes into account both the chance of a decrease of the accrual profit and the value.15 An important characteristic of the EL-UL method is that it is assumed that the Expected Loss (EL) is incorporated in the client rates. After all, the long term average losses are part of the normal business for which the bank should be compensated.16 Insurance firms often use the term best-estimate to refer to the concept of EL. The Unexpected Losses (UL) really represent risk: temporarily deviations from the expectations with the ultimate hazard that the deviation is so large that it endangers the continuity of the company. It is the UL, not the EL, that is the reason for holding an amount of economic capital. Matten remarks that the EL should be considered “… a routine cost of doing business.”17 In insurance, this principle has been actuarially adopted because premiums should cover at least expected claims.18 In itself, EL does not constitute ‘risk’, but rather UL! Economic capital is not only used for risk measurement, but it is a management control principle for multiple applications like capital and solvency management, pricing, controlling. Saita19 develops four applications of economic capital that we have frequently referred to.20 Matten develops four perspectives (viz. treasurers, supervisors, risk managers and shareholders perspectives) on capital and unifies them through the use of economic capital.21 The major benefit of the concept of Economic Capital is that it measures different risks consistently.22 This allows an apple-to-apple comparison of different risks. This in turn enables for a trade-off between risk and return. RAROC is the performance measure to do so.
%100
CapitalEconomic Loss Expected - Costs - Income ×=RAROC
Frequently, the book capital on the balance sheet does not equal economic capital. To adjust for that in a practical manner, amongst others Schroeck23 proposes to include a capital benefit in the RAROC fractions. It equals the risk-free investment returns of the economic capital less the return on actual book capital. A similar adjustment is also proposed by Doff.24

Risk Management for Insurance Firms
32
Concrete applications of RAROC vary from capital allocation on executive board level to individual loan pricing at the front office.25 Since the late 1990s a wealth of RAROC literature26 has become available on these issues. In addition, literature explains on the use of a hurdle rate, consisting of a minimum RAROC to reflect that the companies’ shareholders demand a minimum return over the risks (i.e. economic capital). The discussion27, 28 on whether such a hurdle rate needs to be identical for different businesses has to date not resulted in a satisfactory answer. We will ignore these issues here as they are identical for banking and insurance. The application of economic capital for insurance firms specifically has received relatively little attention. There have been some discussions on the method to derive an amount of economic capital for insurers like Myers and Read,29 and Cummins.30 These articles derive the total amount of economic capital for an insurance firm as a whole and lack measurement methods for individual risk categories. Applied as a management control instrument (see chapter 4 for a definition), it is desirable to link economic capital to underlying risk drivers (such as risk categories) in order to steer the outcomes. This chapter will develop an approach in section 2.6.
2.3 RISK MANAGEMENT INSTRUMENTS FOR NON-LIFE AND LIFE
INSURANCE This section discusses risk management techniques in insurance that are currently in use. These actuarial risk management methods are needed to determine the fair value as well as the economic capital. The methods have traditionally been used to determine technical provisions and premiums. Section 2.5 will discuss the application of these techniques to calculate fair value of insurance liabilities. Section 2.6 will show how these techniques are used to calculate economic capital. Non-life insurance methods in this section are the measures claim ratio, compound loss distributions, the method loss triangle, Generalised Linear Models (GLM) and Dynamic Financial Analysis (DFA). Life insurance methods are mortality tables and embedded value.

Valuation and Economic Capital for Insurance Liabilities
33
2.3.1 Instruments in Non-Life Insurance Risks in non-life insurance cause claim volatility. In itself, the occurrence of claims does not constitute risk as the insurance premium compensates for statistically expected claims (c.f. EL, or best-estimate).31 However, it is the volatility and the chance that claims may deviate significantly from expectations. Actuarial techniques to estimate claim expectations include ratio analysis, probability distributions, and loss triangles.32 Firstly, the simplest risk measure is the loss ratio or claim ratio:33 the amount of claims paid as ratio of the received premiums. This measure identifies the adequacy of the premiums. The equivalent combined ratio (total of claims and costs as percentage of premiums) measures the profitability of an insurance firm. If the combined ratio approaches or even exceeds one, the firm becomes unprofitable. However, claim ratio volatility might be a rough first estimate for the risk incurred. Therefore, this chapter will not use this measure in our economic capital framework. Secondly, a more sophisticated technique would be to estimate probability distributions34 for the frequency and severity of the claims separately. This would correspond with the concept of risk as the product of frequency/likelihood/probability and size/impact/severity, as defined in any standard insurance textbook.35 A wealth of literature has been developed for operational risk modelling in the banking area that resembles our purpose here. Examples are Anders,36 Peccia,37 and Peziér.38 For underwriting risk measurement based on actual claim experience, the derived probability distributions for claim frequency and claim severity, it is possible to determine a compound probability distribution39 for instance through the use of Monte Carlo simulation.40 Section 2.6 will use the compound probability distribution to estimate the premium risk economic capital and it may also be used in the context of the loss triangle. Thirdly, an important actuarial risk management instrument is the loss triangle.41 The loss triangle method is designed to determine the technical provisions for additional reserving/claim payments over multiple years. This is especially important for long-tail insurance like liability or bodily injury. Non-life policies typically have a one-year time horizon, and are annually renewed. Hence,

Risk Management for Insurance Firms
34
accidents under insurance policy cover occur in the year that the policy is sold. The development year is the year of claim processing, and this does not necessarily equal the accident year. The loss triangle shows how the claim pattern will develop over the years.
Ultimate Received1 2 3 4 5 Loss Premium
2000 100€ 50€ 30€ 10€ 5€ 195€ 200€ 2001 103€ 51€ 31€ 10€ 5€ 200€ 210€ 2002 106€ 53€ 32€ 11€ 5€ 207€ 230€ 2003 73€ 37€ 22€ 7€ 4€ 143€ 190€ 2004 149€ 74€ 45€ 15€ 7€ 290€ 240€ 2005 154€ 77€ 46€ 15€ 8€ 300€ 255€
Development Year
Acc
iden
t Yea
r
Figure 2.2: The Loss Triangle is used to Derive Claim Patterns42
There are various techniques to extrapolate the loss triangle varying from the so-called chainladder method to, amongst others, the Mack method.43 Although the actuarial techniques differ, they all have the objective to forecast the payment pattern of claims that have currently not been fully settled. In other words, they assess the future cash flow pattern of the current portfolio of policies. As the loss triangle is subject of an extensive body of actuarial literature, this section will not discuss it in detail. Section 5.4 applies the loss triangle in a case study to derive economic capital. Section 2.5 uses the loss triangle to derive the value of the portfolio from the expected future cash flow pattern (i.e. Expected Loss, EL). Loss triangle techniques also provide us with the volatility of the claims per development year and calendar year. This is basically the Unexpected Loss (UL). Actuarial techniques and software produce the standard deviation of the claim payments as well as desired percentiles of the (skewed) probability distribution of claim payments. Section 2.6 will use these techniques to determine the economic capital. Fourthly, Generalised Linear Modelling (GLM) is an actuarial modelling technique applicable to rate making and underwriting issues,44 especially in non-life. It is an extension of traditional linear models and multiple regression of the form Y=βX+ε with a normally distributed error-term ε. GLM is an extension45 of the simple formulae of multiple regression to better reflect the complex relations in historical claim data.46, 47

Valuation and Economic Capital for Insurance Liabilities
35
GLM48 assesses losses for various categories of policies through firstly determining a basic premium49 or pure premium that holds for all policies. Secondly GLM-techniques add risk premium50 or risk score for risk categories (for instance, if we observe motor insurance, car colour may be a category) to result in higher premiums for high-risk policies (e.g. if red cars are riskier than blue cars, red cars receive an additional risk premium). Because GLM is based on multiplication rather than summation, risk premiums are added through a factor.51 For instance, the GLM analysis produces a factor higher than 1.0 for high-risk policies. The GLM technique produces numerical factors on a pure premium for whether or not a surcharge or reduction is suitable depending on the risk of a particular policy. GLM itself does not produce size measures of the risk (like e.g. economic capital). This should be reflected in the combination of the pure premium and the risk factor. Hence, the risk factor allocates the risk over a group of policies. Therefore, we cannot use GLMs to determine the total amount of economic capital, but we may use it to allocate capital to the individual policies based on the risk premiums. Fifthly, Dynamic Financial Analysis (DFA) has emerged as a risk management technique in the insurance industry in the late 1990s. The Casualty Actuarial Society defines DFA as “… a systematic approach to financial modelling in which financial results are projected under a variety of possible scenarios, showing how outcomes might be affected by changing internal and/or external conditions.”52 DFA essentially is a large simulation based on various models of which the interest rate model is typically most important.53 Also, the outcome of the models is generally consolidated to the highest level, which can then be disaggregated towards for instance business units. Economic capital models work the other way around: simpler models are aggregated for consolidation. Mostly, the time horizon of DFA is longer than regular economic capital models. The time horizon in economic capital modelling is often fixed to one year because this is generally the period that management needs for intervention (see section 2.2). For the purpose of DFA, Kaufmann et al. rather choose a longer time horizon like five to ten years.54 The focus of DFA is on the

Risk Management for Insurance Firms
36
accounting balance sheet of the firm,55 in which regulatory solvency is considered as a constraint. Hodes et al. state that DFA should distinguish three elements of the surplus (i.e. balance sheet equity):56 surplus necessary for existing business, surplus for new business and free surplus. In principle the stochastic models included in a typical DFA could potentially be used for any risk management application57 (and hence, for economic capital as well). DFA and economic capital share many similarities, but also some important differences especially in the perception of risk. Table 2.3 highlights the similarities and differences. DFA Economic Capital Central metric Excess of required capital Economic capital Definition of Risk Inability to meet policyholder
obligations Value volatility
Solvency definition Determined by management Economic solvency Value of balance sheet Regulatory requirements Economic value (fair value) Risk cover Risks within general insurance
business All risks (including non-financial risks)
Diversification Includes diversification and netting effects
Includes diversification and netting effects
Risk aggregation Can be dis-aggregated to all levels Can be aggregated to all levels Table 2.3: The Differences between DFA and Economic Capital
We have seen five major risk measures: claim ratio, compound loss distributions, the loss triangle, GLM, and DFA. These methods are very different. The claim ratio is a simple performance measure, whilst DFA is a simulation system of inter-linked models. A compound loss distribution may be used to estimate the total loss amount in a particular year. This method will be used in section 2.6.1 to derive the economic capital for premium risk. The loss triangle will be used to estimate the claim run-off and that is especially relevant for reserve risk economic capital (see section 2.6.2). The latter methods will be used in section 2.5 to determine the fair value of insurance liabilities as well.
2.3.2 Instruments in Life Insurance Risk management for life insurance has received relatively much attention as a consequence of demographic developments and medical progress on one hand and disruptions to that like AIDS on the other hand.58 Although mortality changes from year to year will be relatively small, the effect of trends over the total lifetime of a life policy may be enormous.59 Therefore, the actuarial
Valuation and Economic Capital for Insurance Liabilities
37
profession has performed trend and scenario analyses during the 1990s.60 Basic questions have been: how will mortality change into the future? and: how will these changes impact the technical provisions?61 Compared to non-life insurance, the methods and variables used in life insurance are relatively limited. This section describes mortality tables and embedded value. Mortality tables are a central instrument for life insurance. In addition, embedded value has been designed in the 1990s as a performance measure. Firstly, mortality tables are the most important input for the trend and scenario analyses described above. Amongst others the Dutch Actuarial Association (Actuarieel Genootschap, AG) publishes mortality tables for the entire Dutch population on a five-year basis.62 Insurance firms may collect their own mortality data to take into account the specific characteristics of the insurance portfolio compared to the totality of the Netherlands. As these data are mostly very rich, they are suitable for the trend and scenarios analyses described above. Secondly, embedded value has developed in the 1990s as an instrument to overcome the problem that accounting profit in a particular year may be a bad reflection of performance. As an example, Vanderhoof describes a company planning to hold down new business in a perverse attempt to improve reported earnings.63 Accounting rules fail to adequately reflect performance due to a number of reasons. Firstly, life policies often earn premium in different years than the payment to the client. Secondly, initial acquisition costs are relatively high and should be spread over the lifetime of the policy. The principle of embedded value has been designed to overcome these issues.64 Embedded value65 is determined as the discounted net cash flows, viz. received premiums less initial acquisition costs (only in the first year) less regular annual costs less payments to the client plus investment returns. Mostly embedded value is determined on an after tax-basis. All variables are deterministic, based on expected mortality, investment returns. Also, the embedded value method takes into account solvency costs according to the current E.U. Solvency rules (see section 3.2). As the current EU-regulation is insensitive to risk, this charge is not a reflection of risk.

Risk Management for Insurance Firms
38
The embedded value is based on expectation principles and all variables are deterministic. Also, it uses a constant discount factor rather than a real yield curve. Consequently, it is not a risk measure. Rather, it is a performance measure that adjusts for the long maturity of life policies. Swiss Re discuss that it is an inappropriate measure of value, however.66 Even more, Dicke adds to this that under the traditional embedded value method “…the value of liabilities is based on discounted net book profits, rather than on discounted liability cash flows.”67 Hence, the traditional embedded value method suffers from the same drawbacks as the accounting system. Recent initiatives like the market-consistent embedded value principles68 and the European Embedded Value69,70 have improved the principle towards real value. The major difference between these new embedded value and the traditional principles is explicitly accounting for embedded derivatives in insurance products and setting risk-sensitive discount rates. Under the European Embedded Value principles, there are three levers to take into account the effect of risk:71 risk discount rate, allowance for the cost of embedded options, assessing the impact of capital requirements on value. Although the treatment of risk in the new versions of embedded value has been important progress, it is still a measure of discounted book profits rather than a measure of value. Section 2.5 will show that there are important differences in the treatment of risk in the embedded value context and in the fair value context.
2.4 RISK MANAGEMENT IN THE DUTCH ACCOUNTING REGULATIONS This section evaluates how risk is included in the current accounting framework of insurance liabilities.72 If risk is adequately captured by accounting figures, they may be used in economic capital models. This section will argue that risk has traditionally been included in an implicit manner in the current accounting framework. Rather than treating risk explicitly, it has been focussed on a sufficient level of prudence in the technical provisions. Accounting information aims for prudent determination of the insurance technical provisions/liabilities to safeguard that an insurance firm can fulfil its insurance obligations to policyholders even under adverse circumstances. Therefore, the technical provisions are determined prudently. Traditionally, prudence has been included implicitly, for instance by using conservative

Valuation and Economic Capital for Insurance Liabilities
39
estimates of claim probabilities and mortality rates and by applying a conservative discount rate. However, the guidelines are not very strict. Section 2.5 will develop a fair value approach for insurance liabilities in which risk is treated more explicitly. The current Dutch insurance accounting and regulatory framework is built around two important documents: the annual accounts and the supervisory reporting through so-called WTV-staten (“Wet Toezicht Verzekeringsbedrijf”, WTV73). Legislation on annual accounts for insurance firms is mainly title 9, book 2 BW (Dutch Civil Code). Recent revisions of accounting regulations in the area of IFRS currently focus on assets only. IFRS 474 drafts the first rough step for liabilities. IFRS phase II, expected to be finalised around 2009, will set the rules for fair value of liabilities.75 Title 9, book 2 BW (Dutch Civil Code), part 15 is accounting legislation specific for insurance firms to reflect the specificity of the insurance business.76 However, on valuation of insurance liabilities, it lacks concrete directions: “Insurance technical provisions are valued through methods that are acceptable in the insurance industry.”77 This provides little guidance on the underlying principles for insurance liability valuation. Similarly, European regulation on this issue states that “… technical reserves [provisions] shall be determined by rules fixed by the member state, or … according to the established practices in such state.”78,79 The relevant Dutch supervisory regulation is “Wet Toezicht Verzekeringsbedrijf 1993”80 (WTV). Insurance undertakings report their financial position to the Dutch supervisor to show their financial soundness for the purpose of policyholder protection. Oosenbrug highlights that strictly speaking, the purpose of the so-called WTV-staten is different from regular accounting, but in practice the differences are limited.81 On the issue of liability valuation WTV, art. 66 and 94 prescribe: “Any insurance undertaking … maintains a sufficient level of technical provisions to cover liabilities from insurance contracts it has entered into.”82 Also, WTV art. 73.3 requires that the certifying actuary tests the adequacy of the provisions and that they are determined sufficiently prudently. Furthermore PVK makes it clear that prudence does not encompass valuation based on the most likely expectations, but a valuation taking into account a

Risk Management for Insurance Firms
40
margin for negative deviations of the various factors.83 Although more precise, this provides little guidance on the exact methods for liability valuation. The Actuarial Principles for Life Insurance84 explain how the PVK interprets the WTV. PVK states that “… it is the responsibility of management, the actuary and the accountant to give meaning to the term ‘prudent’.”85 Hence, WTV is deliberately not prescribing rules but principles. In the remainder of the Actuarial Principles for Life Insurance, PVK highlights the importance of a maximum discount factor to calculate the net present value of future cash flows. For instance, cash flows invested in AA-bonds from most western countries should be discounted against the bond-rate less 25 basispoints, taking into account an adjustment factor of 0.85 for the time delay of the cash flows.86 The minimum discount rate is set at an actuarial interest rate: currently 3%, but has been 4% for quite some time. When the discount rate of the liabilities is lower than the actual investment rate, the value of the liabilities is higher than the assets, which reflects the prudence. For underwriting uncertainties like mortality, the Actuarial Principles87 prescribe using prospective estimates rather than the most recent retrospective estimates to reflect future uncertain developments like AIDS or government policy changes.88 For non-life insurance, prudence is reflected in the common practice of not discounting future claims or payments. These are included in the technical provisions on a nominal basis. Although this ignores future investment return over these liabilities, it does also not take into account inflation effects.89 Summarising, the Dutch accounting regulation is not very strict on how to take into account risk in the valuation of liabilities. This section highlights that the supervisor has provided some guidance on prudential issues for life insurance. On the issue of non-life insurance, no guidance at all has been provided. As a result, Oosenbrug recommends reviewing and sharpening the actuarial principles to reflect the risk and the safety margins in the liabilities.90 The new accounting standards of IFRS phase II will be the first important step.91
2.5 FAIR VALUE OF LIABILITIES
Valuation of liabilities has recently become an important issue. The previous section highlighted that the current Dutch accounting system is not crystal-clear

Valuation and Economic Capital for Insurance Liabilities
41
in how to treat risk in the valuation. The current section provides an overview of valuation methods for insurance liabilities in general and for fair value specifically. Section 2.5.1 discusses the most important asset pricing techniques for financial instruments commonly used in corporate finance. Section 2.5.2 opens the discussion on fair value and it shows that insurance liabilities are more difficult to value than traded assets, as a liquid market does not exist. Section 2.5.3 describes the view of Solvency II on the issue of fair value. Both in the new accounting framework IFRS and Solvency II fair valuation is the cornerstone of the framework. Discussion points are how to incorporate risk in the fair value. Multiple methods are discussed. Section 2.5.4 and 2.5.5 describe how risk is incorporated in existing insurance products traded on financial markets: reinsurance pricing and innovative instruments. The last part of this section summarises and concludes. It describes a method for the fair value of insurance liabilities. This method will be used for economic capital in section 2.6.
2.5.1 Asset Pricing Models and Methods We distinguish two groups of asset pricing methods. Simple assets like bonds and stocks are commonly priced through the Net Present Value method (NPV). More complex assets like derivatives are priced through the arbitrage pricing principle. This section will discuss both. The NPV method includes an explicit treatment of the risk involved, whilst the arbitrage pricing principle treats the risk implicitly. Please note that asset pricing models commonly determine the theoretical value, which may be different from the traded value as a result of the supply and demand situation.92 The first category of asset pricing models is the Net Present Value method (NPV). Many financial instruments are valued using this method as it is one of the simplest valuation models. This method discounts future cash flows by a certain interest rate to reflect the time value of money. This includes inflation but may also include the effect that additional returns may be generated in the future. The simplest form of the formula for the net present value is:93
∑
+=
t )( timeat flow Cash ValuePresent Net trt
1

Risk Management for Insurance Firms
42
The standard NPV formula assumes that the period over which an instrument is valued has a clear beginning and a clear end. This is suitable for bond pricing. For stocks, there the cash flows theoretically run until infinity. For such instances, it is common to evaluate the cash flows (i.e. dividends) over a limited period like ten years and assume an end value. Another solution is to apply the arithmetical array, which is a mathematical law to sum amounts that run over an infinite number of periods. There are NPV variations of the stock pricing model for constant dividends and for constantly growing dividend payments.94 To incorporate the effects of risk in the NPV formula, we, again, should distinguish between Expected Loss (EL) and Unexpected Loss (UL). The EL, or also called Best-Estimate, should be incorporated into the expected cash flow pattern through the formula above. The common financial theory assumption of risk aversion states that an investor demands a compensation for UL, i.e. the chance of a deviation from expectations. In other words, if two financial instruments A and B have the same expected pay-off, but the pay-off of A is subject to less uncertainty than the pay-off of B, then a rational well-informed investor would prefer A over B if the value of A and B would be equal. To compensate for this effect, the value of B should be higher than the value of A. Therefore, the risk is reflected in the value, because the value of B is higher than the value of A (see Figure 2.4). Please note that this is valid for liabilities. For assets, the fair value would decrease rather than increase to compensate for risk (UL).
98 99 99 100 100 101 101 102 102
B
A
A and B have similar expectations, but differ in risk profile. Therefore, the Fair Value of B should be higher than the Fair Value of A.
Figure 2.4: There is a Difference in Fair Value Due to Risk

Valuation and Economic Capital for Insurance Liabilities
43
Generally, there are two ways to include risk (i.e. UL) in the NPV calculation: Include risk in the numerator
The discount rate r is related to the risk involved. A common theory to link the discount rate to the risk is the Capital Asset Pricing Model (CAPM). This reflects that the discount rate is the opportunity cost of a particular investment.95
Include risk in the denominator Adjust the cash flows by including an additional charge on top of the expected cash flows and discount by a risk-free rate. For insurance liabilities, this charge is called a market value margin. We will discuss this method more in detail in section 2.5.3.
CAPM implies that the discount rate (or: the required return on an investment) depends on a risk-free return and a risk premium to compensate for risk. The risk premium is derived from a stock’s performance relative to total market performance. One of the assumptions of CAPM is that market participants wish to be compensated for systematic risk only, as non-systematic or firm-specific risk can be diversified away by individual investors. According to CAPM the discount rate should depend only on the non-systematic risk involved in the asset. Although traditional bond pricing includes a standard discount rate for all periods, more advanced pricing models use a yield curve.96 This better incorporates the time value of money and the reinvestment opportunities for cash flows, in this case coupon payments. The alternative to CAPM is the Arbitrage Pricing Theory (APT), which is more general in that asset prices may depend on a variety of factors rather than market prices only.97 Fama and French have developed an asset pricing model that includes more factors, similar to the APT.98 The method Internal Rate of Return (IRR) is akin to the NPV-method. The IRR method determines a constant, average rate of return (in percentages) over multiple periods even when in practice the returns in money equivalents are not stable over time. While the NPV method determines the value of an asset at a chosen discount rate (opportunity cost of capital), the IRR method determines the return based on the initial and the final value of an asset.99 The two methods are equivalent in the sense that the constant discount rate that sets the NPV at zero is exactly the IRR. Brealy and Myers explain the practical problems in the

Risk Management for Insurance Firms
44
use of the IRR method that are not present in the NPV method.100 The IRR method does not provide a unique result when cash flows switch from cash inflows to outflows or vice versa. The second category of asset pricing models is the arbitrage pricing principle, also called risk neutral valuation or replicating portfolio method. This model category treats the risk of instrument to be valued implicitly. It is based on the assumption that if the cash flow or pay-off pattern of an instrument may be identically constructed through a combination of other instruments whose value can be either calculated or observed,101 then the value should be identical. Otherwise there would be arbitrage opportunities,102 which is in contradiction with the classical corporate finance assumption of perfect markets and rational investors.103 This method is called risk neutral as the instrument to be valued is replicated by an identical portfolio of different instruments having the same risk.104 Likewise, the particular instrument is valued without having to identify investors’ preference for risk.105 Hence the term ‘risk neutral’. Examples of risk neutral valuation are forward-rates106 and option107 pricing (e.g. Black and Scholes). Risk neutral valuation applies a risk-free discount rate for net present value calculations, because investors are indifferent for the two instruments with the same risk profile.108 Babbel et al. compare the three models (NPV with risk in numerator, NPV with risk in denominator, arbitrage pricing) described above. They conclude “… each of these three approaches is theoretically correct. Practical considerations dictate the choice among the approaches.”109
2.5.2 Initial Discussions: the Fair Value of Insurance Liabilities This section opens the discussion on fair value for insurance liabilities. If insurance liabilities would not be subject to risks (i.e. UL), determining the fair value would be relatively simple. The fair value would be the NPV of all expected future cash flows using a risk-free rate. The expected future cash flow pattern is determined using the loss triangle and mortality tables for non-life and life insurance respectively (c.f. section 2.3). The loss triangle produces expected claims (c.f. EL) in the future, while the mortality tables produce the likelihood that the policyholder dies at a certain age (c.f. EL). From the latter, we

Valuation and Economic Capital for Insurance Liabilities
45
derive the expected age and hence the future expected cash flow pattern of a life insurance policy. The discount rate would simply be the risk-free rate resulting in a net present value of the insurance liabilities. However, the presence of underwriting risks (i.e. UL) makes this approach insufficient. This section opens the discussion on how risks may be incorporated in the fair value. In general, the IASB has adopted the following fair value definition: “Fair value is the amount for which an asset could be exchanged or a liability be settled between knowledgeable, willing parties in an arm’s length transaction.”110 The fair value can be determined by the following methods:111 For instruments traded in active market, use a quoted price. For instruments for which there is not an active market, use a recent market
transaction. For instruments for which there is neither an active market nor a recent
market transaction, use a valuation technique. According to the IASB, valuation techniques include discounted cash flow analysis (NPV) and option pricing models (arbitrage pricing principle).112 These techniques should incorporate all factors that market participants would consider in setting a price and should be consistent with economic methodologies for pricing financial instruments. If the value is based on quoted prices or recent transactions, the value of an instrument is equal for all market participants. The basic principle is that this would hold for valuation techniques as well. However, in an illiquid market it is difficult to calibrate the valuation techniques to the ‘real’ fair value. Cummins et al. compare two valuation paradigms:113 the ‘Market equilibrium view’ and the ‘Individual insurer view’. Peasnell calls the latter paradigm ‘Entity-specific Value.’114 The Market equilibrium view is based on the so-called Law Of One Price, or Rule Of One Price, which also underlies the arbitrage pricing principle: two insurance policies with the same coverage and risk profile should have the same price, or value. This paradigm assumes perfect market conditions such that any insurance liability can be replicated by financial instruments. Any difference in value between the insurance liability and the replicating portfolio will be cancelled out by arbitrage. However, as will be discussed below, insurance liabilities fail to satisfy the perfect market assumption because

Risk Management for Insurance Firms
46
insurance liabilities can hardly be replicated by financial instruments and because a liquid market does not exist. The paradigm of Entity-specific Value takes into account specific characteristics of the insurer to determine the price or value of an insurance policy. Fair Value and the Arbitrage Pricing Principle If we would be able to apply the arbitrage pricing principle to insurance liabilities, there would be no need to take into account the risk explicitly, because risk is treated in the replicating portfolio. Unfortunately, we cannot apply it, because the pay-off profile of insurance liabilities can hardly be replicated through traded financial instruments for which an observable market price is available. If we would be able to construct a portfolio of instruments that resembles the cash flow pattern of an insurance policy, then we would value the instruments and derive the value of the policy from that. Unfortunately, the underwriting risks like mortality cannot be replicated by traded financial instruments.115 Babbel et al. stress that using the arbitrage pricing principle (like option pricing) is subject to some important financial market assumptions.116 Valuation of insurance liabilities violates some of these assumptions, like perfect markets and continuous trading.117, 118 On top of that, option models assume a normal distribution of risks, while especially in the non-life business risks tend to be skewed.119 Therefore, we cannot apply the arbitrage methods to value the insurance liabilities (see Figure 2.5). We apply the NPV method to value insurance liabilities.
Economic CapitalFair Value
Arbitrage Pricing Principle?
Not possible, violation of perfect market assumptions
NPV
Risk in Denominator?
Risk in Numerator?
Discount rate r < rfHow to determine discount rate r ?
Risk-free discount rate: r = rfHow to adjust cashflows
through Market Value Margin?
Economic CapitalFair Value
Arbitrage Pricing Principle?
Not possible, violation of perfect market assumptions
NPV
Risk in Denominator?
Risk in Numerator?
Discount rate r < rfHow to determine discount rate r ?
Risk-free discount rate: r = rfHow to adjust cashflows
through Market Value Margin?
Figure 2.5: Methods to Determine Fair Value for Insurance Liabilities

Valuation and Economic Capital for Insurance Liabilities
47
Fair Value and NPV: Risk in the Denominator The NPV method has been applied in the area of actuarial science for a long time.120 Risk has been included in the denominator of NPV by choosing an appropriate discount rate. Especially in life insurance, the NPV is used for premium calculation as well as technical provisioning. Discount rates are commonly set at a prudent level, but remaining constant over time. This is also used in embedded value method for life insurance.121 In the Netherlands, this so-called actuarial interest rate is 3%, advised by the insurance supervisor (see section 3.2). This is in contrast with the principle of risk neutral valuation, incorporating yield curve effects and a risk-free discount rate. Even more, valuation of non-life liabilities has traditionally incorporated no time or discount effects at all. Rather, (expected) future pay-offs have been summed on a nominal basis for prudence reasons.122 Including risk in the denominator requires choosing an appropriate discount rate, lower than the risk-free rate (see Figure 2.5) in order to arrive at a higher value to reflect risk (please note that we discuss liability valuation in this chapter rather than asset valuation). As discussed in section 2.5.1, CAPM is the most appropriate method to derive the discount rate. CAPM, or alternatives like APT and Fama and French, determine a required rate or return from stock price volatility and the volatility of the market as a whole.123 The required return should be interpreted as the opportunity cost of capital and it can therefore be used to discount risky cash flows in the NPV method. CAPM assumes that the discount rate only reflect systematic risk (c.f Guo124 in the argument above). However, the insurance liabilities that we are valuing in this section also include non-systematic (diversifiable) risk!125 After all, an insurance firm diversifies part of these risks through pooling. Extending this principle, the underwriting risks could be diversified further by acquiring multiple portfolios. However for an individual insurer this approach is only partly possible. Therefore, these non-systematic risks should be reflected in value. Due to these reasons, CAPM does not provide us with a consistent method to determine the desired discount rate. Below, we investigate how we can include risk in the denominator of the NPV framework.
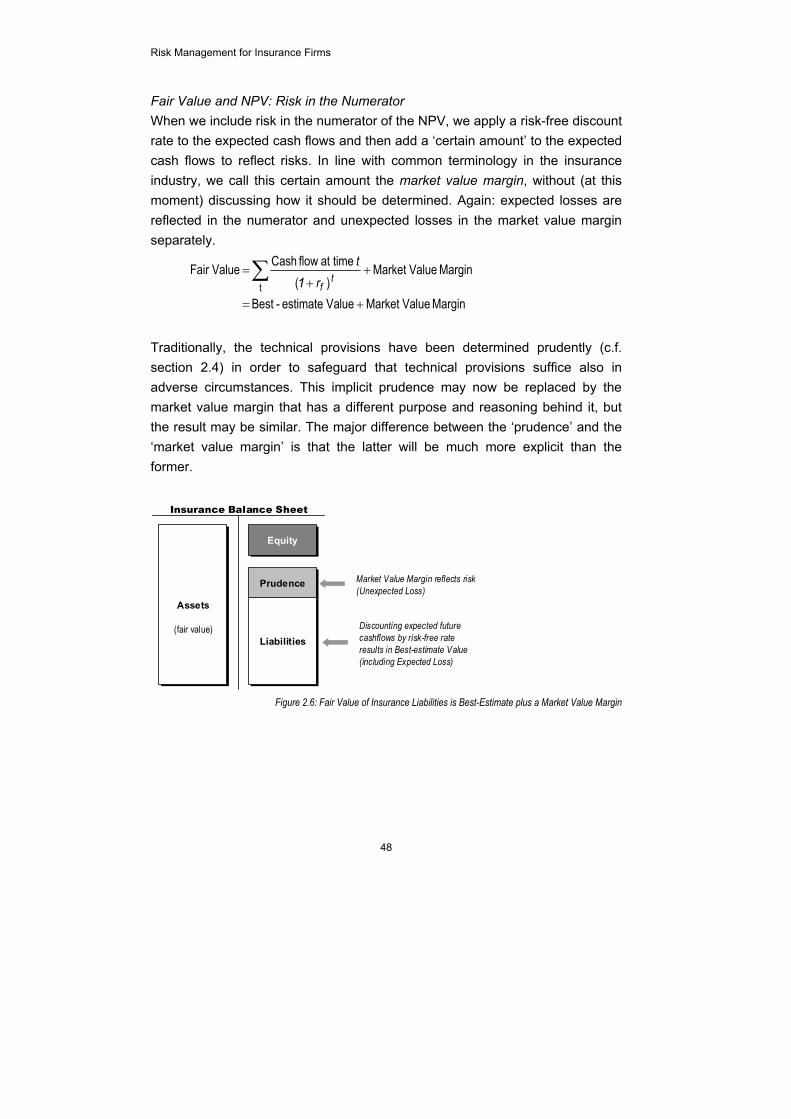
Risk Management for Insurance Firms
48
Fair Value and NPV: Risk in the Numerator When we include risk in the numerator of the NPV, we apply a risk-free discount rate to the expected cash flows and then add a ‘certain amount’ to the expected cash flows to reflect risks. In line with common terminology in the insurance industry, we call this certain amount the market value margin, without (at this moment) discussing how it should be determined. Again: expected losses are reflected in the numerator and unexpected losses in the market value margin separately.
Margin ValueMarket Value estimate-Best
Margin ValueMarket )(
timeat flow Cash Value Fairt
+=
++
=∑ tfr
t1
Traditionally, the technical provisions have been determined prudently (c.f. section 2.4) in order to safeguard that technical provisions suffice also in adverse circumstances. This implicit prudence may now be replaced by the market value margin that has a different purpose and reasoning behind it, but the result may be similar. The major difference between the ‘prudence’ and the ‘market value margin’ is that the latter will be much more explicit than the former.
Assets
(government)bonds and other
asset classes
Liabilities
Prudence
Equity
Assets
(fair value)
Insurance Balance Sheet
Liabilities
Prudence
Equity
Discounting expected futurecashflows by risk-free rateresults in Best-estimate Value(including Expected Loss)
Market Value Margin reflects risk(Unexpected Loss)
Figure 2.6: Fair Value of Insurance Liabilities is Best-Estimate plus a Market Value Margin

Valuation and Economic Capital for Insurance Liabilities
49
Bogner distinguishes two functions of the market value margin:126 The market value margin is an additional part of the value as a
consideration for bearing risk; The market value margin is a buffer to absorb unexpected changes in
assumptions. The second function of Bogner seems to relate the market value margin in technical provisions to the available capital base. Generally, the capital base has the function of risk-bearing127 which is also the major reason for solvency requirements in financial institutions.128 Moreover, it is the fundamental principle of the concept of Economic Capital. Any additional buffer on top of the capital base becomes a hidden reserve. Avoiding these has been one of the arguments to introduce fair value in the first place to promote transparency. However, in the risk-bearing function, the market value margin is a price for risk (c.f. Unexpected Loss). Bear in mind that risk-averse investors prefer to be compensated for the risks they run in their investment. This has been shown earlier in this section (see Figure 2.5). The market value margin functions as such a compensation. Whilst we are opposed to introduce hidden reserves, we are strongly in favour of reflecting risk in the fair value of the liabilities. As the arbitrage pricing principle and the NPV method with risk in the denominator cannot be applied, we see no other way to introduce risk in the fair value than adding a market value margin to the best-estimate value! Especially since insurance liabilities are no traded goods in a liquid market. The Swiss regulator binds the two functions together, by defining the market value margin as “… the hypothetical [future] cost of regulatory capital necessary to run-off all the insurance liabilities….”129 This is because it is assumed that a third party taking over the portfolio would be compensated for having to hold regulatory capital. With this, the Swiss insurance supervisor implicitly states that the higher margin is not so much a buffer for the risks involved but rather a compensation for the firm having to hold (regulatory) capital to absorb the underwriting risks. Holding an amount of capital involves costs. We see a similar approach in the pricing of loans in the banking industry. The credit rate of a loan is the sum of the funding price, various cost loadings, a compensation
Risk Management for Insurance Firms
50
for expected losses, and a charge to compensate the bank for holding capital for the loan.130 Hence, the Swiss approach is very consistent with financial market-practice. Section 2.5.7 will come back to this approach. Let us investigate literature on the issue of including risk in the fair value of insurance liabilities. Literature on fair valuation of insurance liabilities is relatively scarce and opinions and proposed methods diverge only little. Partly, this is due to the IFRS and Solvency II projects that have guided the discussion in a specific direction (see section 2.5.3). Dicke distinguishes three categories of (fair) valuation methods for insurance liabilities:131 1. Discounted cash flow surrogates for market value
This resembles the principle of embedded value and includes risk in the denominator through choosing the appropriate discount rate. Within this category, the IRR132 may be used to project the cash flow, but this imports the drawbacks of the IRR method for alternating cash flows.
2. Interest-rate-risk management techniques Assuming that liability cash flows are matched, the value of liabilities equals the cost of carrying the matching assets.133 This principle can be applied based on accrual value of assets and fair value of assets. However, it totally ignores the underwriting risk in the liabilities.
3. Adaptation of existing accounting framework. Adjusting the information from the UK accounting framework, including using market rates for discounting and amortising initial acquisition costs. However, this method only works well for products with a single premium.134

Valuation and Economic Capital for Insurance Liabilities
51
Doll et al. describe two (fair) valuation frameworks for life insurance liabilities:135 The constructive framework decomposes the liabilities into a certain series
of cash flows and several embedded options like mortality and lapse. The certain cash flows may be valued through a net present value method using a risk-free discount rate. The NPV includes a risk spread in the numerator for the risks assumed. The options may be valued through scenario generation. As a result Doll et al. treat risk in the numerator of the NPV calculation and by explicitly including embedded options.
The deductive framework defines the fair value of liabilities as the market value of assets less the appraisal value of liabilities.136 The latter basically resembles embedded value, because it is the NPV of the future distributable earnings of the firm as a whole. Hence, it derives the fair value of the liabilities indirectly. The framework builds on the existing accounting framework and includes the cost of statutory capital requirements. In the appraisal value/embedded value method, risk is treated in the denominator by choosing an appropriate discount rate that reflects risk.
The traditional actuarial valuation methods have included risk in the numerator, similar to the methods of Dicke and the deductive framework of Doll et al. described above. More recent valuation frameworks adopt the constructive framework by including risk in the numerator through a separate risk charge on top of the best-estimate value: the market value margin. This principle has also been articulated by the IASB on the issue of IFRS.137
2.5.3 Fair Value and Supervision Valuation of the technical provisions is a central component of any insurance supervisory framework and therefore for the Solvency II project as well. Sections 3.4 and 3.5 give an overview of the Solvency II context in more detail. Fair value is a leading principle in the Solvency II framework. This is in line with IFRS and many stakeholders that we will describe below have emphasised the importance of an economic or fair value principle. In the context of Solvency II, fair value is defined as the best estimate liabilities plus an additional market value margin. The determination of this margin is subject to many discussions as this section will show.

Risk Management for Insurance Firms
52
In the context of Solvency II the European Commission requests advice on the valuation of liabilities on a fair value basis, including the methods to determine the best-estimate liabilities, risk factors, discount rates and market value margins.138 The Committee of European Insurance and Occupational Pension Supervisors (CEIOPS) published its draft recommendations on these issues in Summer 2005. Fair valued insurance technical provisions should be determined as follows:139 the net present value of best-estimate liabilities on the individual policy-
level; embedded options should be quantified in the best-estimates;140 this involves (frequently updated) identification and quantification of the
various risk factors through actuarial methods, including foreseeable trends; future expected cash flows should be discounted141 at the (prescribed142)
risk-free143 rate; on top of best-estimates liabilities, a market value margin is applied on the
level of homogeneous risk groups; the market value margin can be determined by a certain percentile (e.g.
75% or 90%) of the probability distribution, but should not be less than a fraction of the standard deviation.144
Many stakeholders propose linking the market value margin to the probability distribution, i.e. by choosing an appropriate percentile. The Australian supervisor has introduced the percentile approach to calculate the market value margin. Please note that the best-estimate (or: EL) equals a 50% confidence level, so a 75% market value margin is a 25% charge on top of best-estimate (see Figure 2.7). For the normal distribution a 75% percentile refers to 0.67 times the standard deviation. For more skewed distributions, the 75% percentile may even be much smaller than the standard deviation, which is why CEIOPS introduces a floor to the market value margin that relates to the standard deviation. Various stakeholders fear that the market value margin will be too high when a 75% percentile of the probability distribution is taken. Amongst others the Association of British Insurers suggest including a 60% percentile.145 No evidence is yet available on how such an approach would work out. The major advantage of the percentile approach is its simplicity. However, choosing the appropriate percentile is relatively arbitrary. Also, the percentile approach

Valuation and Economic Capital for Insurance Liabilities
53
ignores the interplay between capital and the market value margin both acting as a buffer for risk (c.f. the functions of Bogner in section 2.5.2)
Best-Estimate Liabilities Market Value Margin
50% percentile
75% percentile
Value
Figure 2.7: The Market Value Margin Determined Through the Percentile Approach
The Swiss regulator links the market value margin to the amount of risk capital by introducing a cost-of-capital approach. In the Swiss regulatory framework, there is a solvency requirement that is linked to the amount of underwriting risks in the liabilities (see section 3.3.4). The market value margin on top of best-estimate liabilities equals the cost of holding that amount of solvency. Such a method is much more in line with the current financial market theories. The Casualty Actuarial Society tests a cost-of-capital approach, but bases this method on the relatively risk-insensitive current U.S. solvency requirement.146 As a result, the method does not properly reflect a market value margin. However, due to its sound methods for determining the market value margin, we would prefer the Swiss option. As indicated in the previous two sections, there is much debate on the market value margin. We discussed our preference for an explicit treatment of the risk in a fair value measure through the market value margin (see also section 2.5.7). Apart from primary insurance, there are also other instruments that incorporate liability risks in their prices. To compare the current initiatives, we will investigate how risk is incorporated in reinsurance and instruments like weather derivatives and catastrophe (CAT) bonds.

Risk Management for Insurance Firms
54
2.5.4 Determine the Risk Charge in Reinsurance Reinsurance has been an appropriate form for risk management for insurance undertakings. Essentially, reinsurance is an insurance firm for primary insurers. A reinsurer (partially) assumes risks of the primary insurer against a certain premium.147 Reinsurance programs are mostly designed in reinsurance layers and product structures are often more complex than primary insurance. The premium of a reinsurance contract depends on the risks assumed and the (administrative) costs of underwriting, also called cost loading. Ignoring the cost loading, we compose the risk into two parts: (1) the expected loss of the portfolio (which we have called best-estimate losses above), and (2) the risk (i.e. UL) of the portfolio. The risk is treated explicitly by adding a charge on top of best-estimate losses. Wahlin et al.148 distinguish three principles to account for the risk, or safety loading, as they call it. The expected premium principle (1) adds a certain percentage of the expected loss to the premium. The standard deviation principle (2) accounts for the safety loading through a multiple of the standard deviation. These two principles derive the safety loading from one specific point of the loss distribution. The major advantage of this method is its simple application. The third method of Wahlin et al. is the PH-transform premium principle (3), adding a risk charge on the entire loss distribution. This measure, although more complex, has some desirable mathematical properties, like additivity.149 Wang introduces the right-tail deviation, a specific form of the PH-transform method.150 This method is similar to the term tail-VAR that emerged more recently in the banking literature.151 Wang compares this method to other concepts like probability of ruin and Butsics expected policyholder deficit.152 All methods have in common that the risk preference is determined outside the risk model. In all of the principles or methods described above, the reinsurer must determine its own preference for a certain risk. In other words, the cost of risk is an input of all three of the models and methods. This implies that different reinsurers have different risk preferences and there is no uniform method for determining the actual risk preference. Within reinsurance pricing, risk is treated explicitly as an additional charge on top of the expected, or best-estimate, losses. Because the risk charge in reinsurance pricing is determined through an input parameter rather than an output, we cannot use reinsurance pricing

Valuation and Economic Capital for Insurance Liabilities
55
methods to derive the market value margin in fair valuation of insurance liabilities.
2.5.5 Determine the Risk Charge in ART Instruments This section evaluates how the market value margin is included in the pricing of ART instruments like weather derivatives and catastrophe bonds (so-called CAT bonds). As they are traded on financial markets, we could be able to determine the markets’ price for risk of these instruments, i.e. the real market value margin. This section discusses the pricing models for weather derivatives and CAT bonds specifically. These instruments have emerged in the late 1990s in the U.S.153 and are considered attractive ways154, 155 of transferring insurance risks to the capital markets. Weather derivatives are securities that promise a payment to the holder based on weather circumstances.156 There are multiple forms of weather derivatives, e.g. with payouts when average daily temperature is above or below certain thresholds (strike value of the option).157 Weather derivatives are considered to be an appropriate hedging instrument for weather dependent businesses.158 In many respects, weather derivatives are comparable with insurance (e.g. crop insurance). The major differences are the lower administrative burden159 of weather derivatives and absence of moral hazard problems with weather derivatives.160,161 However, weather derivatives leave a security holder exposed to basis risk as the derivatives evaluate a particular weather index rather than the weather characteristics at the exact location of the security holder. This risk is currently unhedgeable for practical reasons and market (il)liquidity.162 It would be convenient if the pricing methods of weather derivatives would follow the methods of regular derivatives. Regular derivative pricing methods are based on the principle of arbitrage pricing principles that we have described in section 2.5.1. According to this principle, the price of a instrument equals the price of a set of other instruments with the same pay-off profile. Unfortunately, the arbitrage pricing principle is invalid for weather derivatives, because the weather as such is not a traded good and does not have a price.163 In absence of an agreed-upon pricing mechanism164 for weather derivatives, methods to price them include stochastic weather models (for which there is a multitude of data available) and the burn-rate method.165 The burn-rate method relates to

Risk Management for Insurance Firms
56
classical actuarial pricing mechanisms because it investigates the expected payoff at maturity of the instrument.166 This implies a predictive model of the weather index.167 And these models require an exogenous risk charge in the pricing.168 Hence, we must draw the same conclusions as for reinsurance pricing methods: there is no uniform agreed-upon method to measure the risk or to charge for risk in weather derivatives. CAT bonds169 have the structure of a regular bond, but with contingent redemption or coupon payments. The payout of the bond is linked to catastrophic events like earthquakes or storms, or to a catastrophe index.170 The pricing of CAT bonds is similar to regular bonds, but it includes an in-depth analysis of related catastrophic event. Unlike weather risks, there are (fortunately) no large amounts of catastrophe data available. Hence, pricing the bonds requires statistical (or, even more precise, multidisciplinary) catastrophe models, most often based on scenarios.171 Often, stochastic processes are used to model the catastrophe index.172 And from there on, actuarial methods including a risk charge as an input for the pricing process. Muermann explicitly cast a doubt on the complete markets assumption for pricing catastrophe bonds, as he concludes that especially the large size of catastrophic losses and their low likelihood may give rise to market incompleteness.173 This implies that the market price for a certain CAT bond may not be an accurate reflection of catastrophe risk in general. And therefore the market price for CAT bonds cannot be used for a general fair valuation method for insurance liabilities.
2.5.6 Fair Value Again The previous sections discussed how the market value margin is used in reinsurance and ART instruments like weather derivatives and CAT bonds. We concluded that pricing methods for both instruments treat the risk appetite as an input rather than a parameter or output variable in the models. This does not guide us towards the real or theoretically correct market value margin nor to the (implicit) markets’ risk preference. Thus far, we have investigated which methods are available to determine the fair value of insurance liabilities. We have discussed the arbitrage pricing principle and the NPV method. Section 2.5.2 concluded that arbitrage-methods

Valuation and Economic Capital for Insurance Liabilities
57
do not suffice, because these methods assume that we can replicate insurance liabilities with traded financial instruments, which are not available in the market. As the cash flows in the NPV-calculation are contingent, we need to treat the risks explicitly. For our purpose, we have rejected to incorporate the risk in the discount rate as is common in CAPM. It is more appropriate to discount the expected cash flows by the risk-free rate and then add a separate market value margin to reflect risks. This is also a common opinion given the discussions in the IFRS and Solvency II area. On this issue, we have seen that both IFRS and Solvency II aim to determine the market value margin to a percentile like 60%, 75% or 90%. They are following the Australian supervisory framework that sets a rather arbitrary threshold level for the market value margin. The Swiss supervisory proposes an alternative approach: to relate the market value margin to the cost of holding supervisory capital. Then, we discussed traded instruments from which we hoped to derive the market value margin implicitly. We investigated the pricing processes of reinsurance as well as innovative instruments like CAT bonds and weather derivatives. However, we concluded that the pricing methods use risk as an input parameter rather than an output variable. As a result, we cannot apply such principles to fair value insurance liabilities.
2.5.7 Choice for an Appropriate Fair Value Measure We choose to adopt the fair value measure that discounts the expected cash flows by the risk-free rate and includes a market value margin. The market value margin is the cost of holding an amount of capital as a buffer to absorb risks. As substantiated in section 2.5.2, this method is congruent with existing financial theories174, 175 as opposed to the percentile approach of most supervisory frameworks.

Risk Management for Insurance Firms
58
The fair value is determined through the following steps: Calculate the best-estimate value by discounting expected future cash flows
(c.f. Expected Loss) by the risk-free rate; Determine the amount of economic capital that is needed to absorb the
risks (c.f. Unexpected Loss); Derive the market value margin as the cost of holding the economic capital; Fair value is the sum of best-estimate and market value margin.
This fair value measure has the following characteristics. The market value margin includes aspects both of the product/policyholders and the owner, i.e. the insurance firm on which balance sheet the liability is booked. Our definition of the fair value is an entity specific value that does only partly satisfy the law of one price.176 Below, we will argue that for insurance liabilities that are illiquid, it is appropriate to incorporate sufficient entity specific elements. Moreover, Peasnell argues that “… any attempt to fair value [of insurance liabilities] must involve consideration of entity-specific factors.”177 We recognise that for supervisory purposes, there may be a need for consistent parameters across multiple supervised firms. This would result in a fair value measure that satisfies the law of one price. It would however depart from the ‘fair view’ because prescribed parameters may not reflect what ‘knowledgeable, willing parties’ would want to pay and receive for settling liabilities. Firstly, the market value margin is causally related to the amount of risk in the portfolio (i.e. the policyholders). If two portfolios with the same expected cash flow pattern are subject to different risk (c.f. UL), they are subject to different economic capital requirements. Hence, the market value margin and consequently the market value differs. If the risk profile of a portfolio increases, so does the economic capital and hence the fair value. This is consistent with the operation of liability valuation: more risk should lead to higher liability values. Secondly, the market value margin is also dependent on the characteristics of the owner of the liability portfolio, (i.e. the insurance firm). This is because the cost of capital is entity-specific, but also because the economic capital calibration is entity-specific. Because the market value margin depends on the

Valuation and Economic Capital for Insurance Liabilities
59
economic capital, it can be different for different insurance firms. And that is also logical, because a specific risk may be beneficial for the diversification effect of one firm while it is not for another. It should be properly reflected in the value of an insurance portfolio. The valuation method results in an entity specific value. Thirdly, the market value margin depends, amongst other aspects, on the rating ambition of the insurance firm. This is another entity-specific effect. Let us assume a potential client that wants to take out a policy and chooses between a AA-rated firm and a A-rated firm. The AA-rated firm has a higher rating ambition, consequently higher economic capital and therefore charges a higher market value margin than the A-rated firm. Peasnell states: “The rationale for fair valuing liabilities is that credit risk and interest rate risk are not in principle fundamentally different.”178 Whilst this may seem counterintuitive, it is theoretically correct: the policyholder receives more certainty and may be paying for that through the higher market value margin.179 The latter two effects partly balance out. A higher rated insurance firm will keep a higher amount of economic capital due to its high rating ambition, but the cost of capital is lower due to the lower risk. Although the theoretical consequences may seem large, the practical differences in market value margin are likely to be small.180 And wherever that exists, it is correct and justifiable. One important aspect remains to be discussed: we concluded that an additional amount in the provisions on top of best-estimate liabilities could act as a buffer. Both equity capital and the market value margin act as a buffer to absorb risks (c.f. functions of Bogner in section 2.5.2). And that does not contribute to a ‘fair’ view. Moreover, the recent directions of IFRS aim to avoid any provisions that are not backing demonstrable future expenses. The market value margin does not consist of such expenses but it encompasses opportunity costs. Therefore, although the market value margin is part of fair value of insurance liabilities, it should be added under the supervisory capital181 with which the economic capital is compared to assess capital adequacy. This is also in line with the industry responses on the Solvency II project.182

Risk Management for Insurance Firms
60
Whenever an insurance firm adapts its rating ambition, for instance upwards, the total market value of the liabilities should increase, because policyholders are more likely to have their future obligations honoured. Higher rated companies have a lower cost of capital but also have higher capital requirements. While we believe that the total market value should increase, FOPI estimates that these effects more or less cancel out.183 The fair value of the insurance liabilities is the best estimate plus a market value margin. The best estimate liabilities are determined by discounting expected future cash flows (including embedded optionality) by a risk-free discount rate. The future cash flows are calculated by traditional actuarial techniques like the loss triangle and mortality tables. The market value margin is determined by adding the cost of holding risk capital (either economic capital or regulatory capital)184 to the best-estimate liabilities. As discussed, this results in an entity-specific value. In this fair value measure, the economic capital plays an important role. Therefore, the next section will develop a framework for economic capital measurement.
2.5.8 Cost of Capital The cost of capital is one of the fair value elements, because it is included in the market value margin. As discussed in section 2.5.2, CAPM is the most appropriate method to determine the cost of capital. Scheepers and Urff remark “… the validity of this model [CAPM] is topic of discussion. … However, a practical alternative for estimating the cost of equity capital is unavailable and CAPM is commonly accepted as best-practice.”185 Therefore, we apply CAPM as well. Despite the limitations of CAPM, we choose not to develop a separate cost of capital framework. The entire cost of capital framework is based on the weighted average cost of capital (WACC), in which the cost of debt and the cost of equity capital are weighted by the debt and equity capital respectively. For an insurance firm, determining the cost of debt (i.e. insurance liabilities) may be less obvious since insurance liabilities are not identical to the ‘loans’ of for instance a production

Valuation and Economic Capital for Insurance Liabilities
61
firm.186 In the light of the market value margin, we focus on the cost of equity capital, for which CAPM is often used. For non-quoted firms regular stock prices are unavailable, so the performance relative to the market cannot easily be observed. Additionally, insurance firms are often part of a financial conglomerate. The total stock price of the conglomerate does not separately reflect (risk of) the specific insurance activities. To resolve these issues pragmatically, estimation methods exist that compare the firm to ‘analogues’ or ‘peers’ (pure player-beta) or take into account sector information (sector-beta) to derive the appropriate cost of capital. However, this does not resolve the theoretical problems of determining a cost of capital for non-quoted firms or firms that are part of a conglomerate. Among others Exley and Smith conclude that these problems “…can be most easily remedied for financial firms…”187 because their assets and liabilities can be represented easily by replicating portfolios. However, we have argued that this is less true for insurance liabilities. Therefore, estimating the cost of capital remains to be an area with an important unsolved problem. As said in the beginning of this section, we apply CAPM even despite its limitations because a practical alternative is unavailable.
2.6 FROM FAIR VALUE TO ECONOMIC CAPITAL
The previous sections discussed the fair value of insurance liabilities and concluded that we need an economic capital measure to determine the market value margin of the fair value. This section focuses on economic capital again. Please recall that economic capital acts as a buffer to absorb unexpected losses up to an exceptional level (called ‘worst-case losses’) in order to avoid insolvency. As discussed, the application in banking broadly encompasses two methods to determine economic capital: an EL-UL and a value-based approach. This suggests four possible methods for underwriting risks in insurance (see Table 2.8). The following sections will discuss each of the methods.

Risk Management for Insurance Firms
62
EL-UL based Value-based
Non-life I II
Life III IV
Table 2.8: Four Possible Economic Capital Approaches Medina et al. stress the importance of the economic assumptions rather than accounting information: economic principles consider total investment returns rather than only realised investment gains and they take into account the underwriting value changes irrespective of changes in technical provisions.188 The authors describe the requirements of a value-based economic capital framework. The elements comprise of (1) a collection of models for all individual risk factors and dependencies; (2) a collection of models to capture how the risk factors affect the economic profit of the various loss portfolios; (3) a procedure to calculate the required capital on an overall level; and (4) a procedure to calculate the contributions of the various risk portfolios to the total risk.189 The following sections will discuss the methods to calculate the economic capital per underwriting risk category. Although risk drivers are different, we will see that the methods are similar for non-life and life insurance. The economic capital measurement methods will determine the fair value based on multiple scenarios of the underwriting risk parameters (like mortality or claim patterns). The best-estimate fair value is the fair value based on the expected risk parameters, while worst-case fair value is the fair value based on the worst-case risk parameters (i.e. relating to the chosen level of confidence level like 99.9%). Both best-estimate (including expected losses) and worst-case fair value (including unexpected losses) are calculated based on premium, underwriting parameters and run-off. The amount of economic capital is the difference between these two amounts of fair value. The fair value in the economic capital models does not include any of the market value margins we discussed in the previous sections because the concept of Economic Capital is determined on a purely economic basis (i.e. expected value and discounting by a risk-free rate) without any reference to prudence. Moreover, in the economic framework, (economic) capital serves to absorb risk, not additional prudence in the technical provisions. Lastly, capital is

Valuation and Economic Capital for Insurance Liabilities
63
the basis for a market value margin. Therefore, adding an additional margin in the economic capital calculations would result in holding capital over a prudence margin.
2.6.1 Method I: EL-UL for Non-Life Insurance As discussed in chapter 1, non-life underwriting risk can be subdivided into premium risk, reserve risk and catastrophe risk. This section discusses that method I can be applied to premium and catastrophe risk only. In this approach, the main objective is to determine the size of potential losses (i.e. amount of claims), while taking into account risk-reducing measures taken. Best estimate losses (c.f. EL) and worst-case losses (c.f. UL) would need to be determined separately. This concept is similar to measurement of credit risk and operational risk models in banking. The EL-UL equivalent for non-life insurance could be to estimate the expected and worst-case claim amounts from historical data, by estimating claim frequency and claim amount on the level of the individual policy, similar to wholesale credit risk in banking (c.f. PD, LGD, EAD).190 The equivalent of the banking PD would be the claim frequency, the equivalent of banking LGD would need to incorporate loss-reducing measures like reinsurance, and the equivalent of banking EAD would be the amount of the claim. Banks estimate these three central parameters on the level of individual products, based on historical data of the total portfolio. Retail products are mostly estimated on portfolio level due to the homogeneous nature of retail portfolios and the size of the portfolios. In non-life insurance, it is common practice to estimate claim frequency and claim size on the level of portfolios, like the WTV-branches. It is uncommon to estimate the parameters as described above on the level of individual policies.191 As a result, the economic capital is calculated at an aggregated level already incorporating diversification effects within portfolios. Also, risk reduction through reinsurance is mostly determined on an aggregated level. This is because reinsurance cover is also determined on the portfolio level rather than individual policies. As a result, there is a difference in aggregation level between banking and insurance. Nakada et al. distinguish the actuarial approach from the econometric approach.192 The actuarial approach consists of fitting theoretical

Risk Management for Insurance Firms
64
distributions to historical data without any reference to underlying risk drivers, while the econometric approach relates explaining variables to the observed losses. Apparently, the credit risk approach in banking is an econometric approach, while the non-life underwriting risk in insurance is an actuarial approach. Both claim frequency and claim amount may be statistically modelled through the use of for instance Poisson or exponential distributions.193 As smaller claims are likely to have different frequency characteristics than large or even catastrophic claims, it is useful to model the latter separately. Also, there is a practical reason to separate normal from catastrophic claims: data availability. As data on catastrophic claims are scarce (fortunately), one needs different statistical techniques to estimate probability distributions. In addition, there are commercial catastrophe models available in the market. These simulate the likelihood and the effect of a potential catastrophic event (e.g. windstorm, earthquake) based on meteorological or geophysical data. From these simulation outcomes, it is possible to derive both expected (c.f. best-estimate) and unexpected (c.f. worst-case) loss for economic capital purposes. Chapter 5 applies separate models for premium risk and catastrophe risk. The separate distributions for claim frequency and claim amount can be combined through simulation or the use of the compound distribution.194 The data to derive the two elements are similar to the data underlying the loss triangle. Hence, the economic capital is determined along the following steps: 1. Determine separate probability distributions for claim frequency and claim
size; 2. Combine the two distributions into an compound probability distribution; 3. From this distribution, derive the expected and the worst-case value (viz.
the chosen confidence level); 4. Economic capital is calculated as the difference between best-estimate and
the worst-case value (c.f. EL and UL respectively). This method will work well for short-tail insurance, like fire insurance, as there is hardly any run-off. As a result, the reserve risk is relatively insignificant. For long-tail insurance like general liability, uncertainty in the run-off (i.e. reserve risk) may well be the most important risk driver. As a consequence, there is an

Valuation and Economic Capital for Insurance Liabilities
65
ex-ante uncertainty on the timing of the future claim payment in addition to the uncertainty surrounding the frequency and amount of the claim. It is difficult to include this aspect into probability distributions described above. The probability distributions that are described above take into account the frequency and amount of the claim only (i.e. the premium risk). Please note that the uncertainty in the run-off is different to the maturity adjustment that is present in the credit risk models in banking, like Basel II. These maturity adjustments assume that the remaining maturity is fixed (i.e. deterministic) for a certain loan. The run-off in insurance liabilities is uncertain (i.e. stochastic) and that is an important difference. Summarising the above, Method I is based on probability distributions for claim frequency and amount on the level of portfolios. The probability distributions produce the best-estimate (expected) and worst-case (unexpected) loss. Whilst an equivalent could be constructed to the PD, LGD, EAD framework that is present in banking, such an approach is incomplete because it ignores the uncertainty in the run-off: reserve risk. As this is an important risk driver especially in long-tail insurance, this method is incomplete. Section 2.6.2 extends this method towards fair value.
2.6.2 Method II: Value-based for Non-Life Insurance Method II is based on fair value. In Method II, economic capital is calculated as the worst-case decrease in fair value due to the various risk parameters. The fair value includes the risk parameters like claims frequency, amount and run-off. All risk parameters can be determined on the expected level (c.f. EL) and the worst-case level (c.f. UL). Please note that it is inappropriate to speak of ‘expected loss’ here, because we are discussing the fair value, including certain loss assumptions. It has been sufficiently discussed above that the best-estimate fair value of the liabilities depends on: Frequency/likelihood of cash flows (premiums and claims); Size/amount of cash flows; Timing of cash flows (run-off).

Risk Management for Insurance Firms
66
The frequency and size of the claim pattern have been discussed above. In order to include the timing (i.e. reserve risk) into the economic capital, we will need to model a third aspect: run-off. This incorporates the time value of money into the analysis. Traditionally, the loss triangle has been the most suitable instrument to determine the run-off on the level of portfolios on nominal amounts. Most loss triangle methods calculate the expected run-off pattern as well as a worst-case run-off.195 Even more, some loss triangle methods produce estimates of claim volatility as well.196 These three elements may be used to calculate the fair value. The economic capital in this method is the difference between the best-estimate and worst-case fair value. Therefore, one first needs to calculate the best-estimate (expected) fair value, based on best-estimate parameters of the underwriting risks. Then one calculates the worst-case fair value based on the worst-case parameters of the underwriting risks.197 The economic capital as the worst-case decrease in value should be calculated through the elements depicted in Figure 2.9. Although depicted separately, modern loss triangle methods are able to produce multiple elements at once.
Worst-case risk driver
Worst-case value
Economic Capital
Worst-case risk driver
Worst-case fair valueEconomic Capital
Worst-case risk driver
Worst-case value
Best-estimaterisk driver
Best-estimatefair value
-/-=
• Premium• Claims (frequency,severity)• Run-off pattern
Figure 2.9: The Economic Capital Approach for Non-Life Underwriting Risk
This approach is exactly in line with Medina et al.198 and Nakada et al.199 because all steps are present in our method as well. Firstly, the loss triangle determines the cash flow pattern including the claim frequency and amount in the accident year. Then, the regular loss triangle methods determine the run-off of the claims. Secondly, the same models produce an output of the worst-case

Valuation and Economic Capital for Insurance Liabilities
67
losses and worst-case run-off. Thirdly, the NPV method produces the value in both instances on the level of the various sub-portfolios. Fourthly, aggregation includes the use of correlations to arrive at the total amount of economic capital for the entire portfolio. Chapter 5 illustrates this method through a case study.
2.6.3 Method III: EL-UL for Life Insurance Method III draws the parallel between the banking framework for credit risk (c.f. PD, LGD, EAD)200 and life insurance. This approach determines the size of potential losses (i.e. amount of claims). Best estimate losses (c.f. EL) and worst-case losses (c.f. UL) would need to be determined separately. The underwriting risk parameters in life insurance are claim payments and amounts. The probability of a claim payment refers to the the (non-) occurrence of death of the policyholder, comparable to the PD in credit risk. It depends on the product whether a death of the policyholder is financially favourable for the insurer or not. The ‘Life-PD’ may be easily derived from actuarial mortality tables, either from specific portfolios or on a national basis. The equivalent of the LGD-EAD (referring to an amount) would be the insured amount less premiums already paid (potentially including investment returns generated by investing premiums). Hence, the ‘Life-PD’ would increase over time (the older the insured is, the more likely that he will die soon). The ‘Life-LGD’ would be decreasing over the lifetime of the policy (over time the policyholder may pay multiple premiums and the insurer generates investment returns over time). Depending on the product, both parameters may vary over time. Economic capital could be determined by simulation, as both these variables can be modelled dynamically. The economic capital then equals the worst-case outcome of the simulation results less the best-estimate outcome. Method III ignores the time value of money and the associated dynamics, because it only looks at losses in a one-year horizon. On a portfolio-basis, the variables will be relatively stable. For instance, mortality rates are relatively stable from year to year, but the long-term effects of a mis-estimation of mortality rates and epidemics like AIDS could be enormous over the total lifetime of the policy.
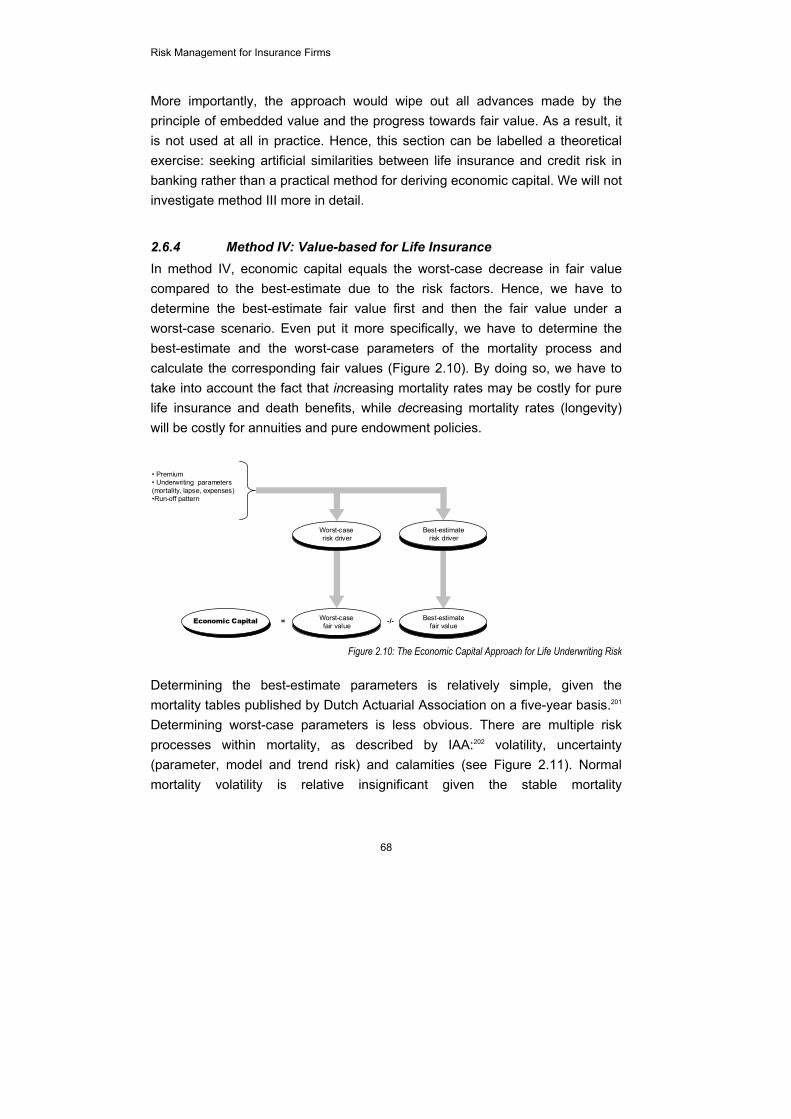
Risk Management for Insurance Firms
68
More importantly, the approach would wipe out all advances made by the principle of embedded value and the progress towards fair value. As a result, it is not used at all in practice. Hence, this section can be labelled a theoretical exercise: seeking artificial similarities between life insurance and credit risk in banking rather than a practical method for deriving economic capital. We will not investigate method III more in detail.
2.6.4 Method IV: Value-based for Life Insurance In method IV, economic capital equals the worst-case decrease in fair value compared to the best-estimate due to the risk factors. Hence, we have to determine the best-estimate fair value first and then the fair value under a worst-case scenario. Even put it more specifically, we have to determine the best-estimate and the worst-case parameters of the mortality process and calculate the corresponding fair values (Figure 2.10). By doing so, we have to take into account the fact that increasing mortality rates may be costly for pure life insurance and death benefits, while decreasing mortality rates (longevity) will be costly for annuities and pure endowment policies.
Worst-case risk driver
Worst-case value
Economic Capital
Worst-case risk driver
Worst-case fair value
Economic Capital
Worst-case risk driver
Worst-case value
Best-estimaterisk driver
Best-estimatefair value
-/-=
• Premium• Underwriting parameters(mortality, lapse, expenses)•Run-off pattern
Figure 2.10: The Economic Capital Approach for Life Underwriting Risk
Determining the best-estimate parameters is relatively simple, given the mortality tables published by Dutch Actuarial Association on a five-year basis.201 Determining worst-case parameters is less obvious. There are multiple risk processes within mortality, as described by IAA:202 volatility, uncertainty (parameter, model and trend risk) and calamities (see Figure 2.11). Normal mortality volatility is relative insignificant given the stable mortality

Valuation and Economic Capital for Insurance Liabilities
69
developments, the size of most life portfolios and the long term nature of life insurance. With small standard-deviations, a one-year shock of e.g. 99.5% is still relatively small in amounts. The uncertainty risk is more important: given the past, how will mortality rates develop in the future? It is well-known that life expectancy increases, i.e. mortality rates decrease, due to (medical, economic) progress. By looking at past developments, one can extract potential developments for the future. For determining the calamity risk, it is possible to look at the effect of past scenarios like the Spanish Flu epidemic. Currently, there are hardly any models available in the market for predicting calamities (contrary to the wealth of commercial catastrophe models).
0.0%
0.1%
0.2%
0.3%
0.4%
0.5%
0.6%
1985 1990 1995 2000 2005 2010 2015
mortality rate
Volatility risk
0.0%
0.1%
0.2%
0.3%
0.4%
0.5%
0.6%
1985 1990 1995 2000 2005 2010 2015
mortality rate
Trend risk
0.0%
0.1%
0.2%
0.3%
0.4%
0.5%
0.6%
1985 1990 1995 2000 2005 2010 2015
mortality rate
Parameter risk
0.0%
0.1%
0.2%
0.3%
0.4%
0.5%
0.6%
1985 1990 1995 2000 2005 2010 2015
mortality rate
Extreme event risk Figure 2.11: Four Components of Life Underwriting Risk Economic Capital
Thus far, this section discussed the risk on mortality assumptions. In addition, inadequate assumptions on expenses and lapse rates may have consequences as well, especially since the effects will be effective over the long term of the policy. Also, some policies include coverage for morbidity as well as mortality. It is appropriate to include these effects in an economic capital model as well. The

Risk Management for Insurance Firms
70
approach to include these effects is similar to the approach for mortality and will therefore not be discussed in detail. In method IV, these scenarios are combined either by taking the worst-case of all of the scenarios or, more appropriately, by taking into account the effect of diversification. Finally, the economic capital is the difference between the worst-case fair value under the combined scenarios and the best-estimate fair value.
2.6.5 Applying Economic Capital and the link to RAROC As explained in section 2.2 an important merit of the concept of Economic Capital is that it allows for a risk-return trade-off through RAROC. The banking version of RAROC is relatively simple as it only accounts for results in one year. Accounting information is adjusted in order to better reflect the expected outcomes of the risks (c.f. EL-adjustment in the denominator). This is sensible because interest payments are received periodically over the lifetime of banking products. Insurance products are also based on multiple years but without a constant pattern of cash flows, which makes the evaluation of returns as well as the risks more difficult. Cash flows (both inflows and outflows) are not stable over the lifetime of policies.203 We have discussed that accounting information is not equipped to handle this multiyear aspect. Also, section 2.4 discussed that risk is not properly reflected in accounting information. Consequently, accounting information cannot be used for RAROC. Therefore, RAROC should be based on fair value.204 The numerator of RAROC is the fair value generated on a policy or portfolio over the period. The denominator of RAROC is the economic capital. Erisk states that the denominator should be the NPV of all future amounts of economic capital in order to maintain consistency with the numerator.205 RAROC is defined as:
100%
Capital)ic NPV(EconomValue Fair lifetime ×=RAROC
This method is forward looking: it determines the fair value of future business. It is appropriate to determine the expected RAROC when selling a policy. For instance, it can be used to increase premium levels in order to alter the expected fair value and as a result improve RAROC. Culp206 defines this an ex-

Valuation and Economic Capital for Insurance Liabilities
71
ante RAROC measure. This RAROC formula has difficulties in evaluating performance over a certain period on an ex-post basis. For instance, when the fair value of a life policy changes after five years due to new insights in mortality processes, the total fair value cannot be attributed to that period. It does not reflect performance of the fifth year of the underwriting department. The above RAROC formula is not appropriate for ex-post performance measurement over a certain period. This can be resolved by taking the change in fair value over a certain period as the denominator of the RAROC-fraction to reflect performance over one year:
100%
CapitalEconomic Value FairValue Fair
1t
0t1tyear-one ×
−=
=
==RAROC
The concept of Fair Value has major benefits over the current accounting regime, as explained in this chapter so far. As briefly touched upon in chapter 1, economic capital and RAROC is an important management control mechanism. Section 4.2 defines management control as the process whereby managers influence other members of the organisation to implement the organisation’s strategy. Goal congruence is an important issue: does the performance measure RAROC above induce the desired behaviour? Schierenbeck207 explains that management control purely based on fair value stimulates long term transactions by refinancing existing transactions rather increasing profit margins. For example, account managers are encouraged to sell 30 year policies (because that increases fair value most) by renegotiating existing policies with a remaining term of e.g. 29 years (because they are not ‘punished’ for doing so). Therefore, the RAROC formula should also include the fair value of existing business. Whenever fair value is destroyed by cancelling an existing contract, it is reflected in RAROC. Now we have two ‘RAROC versions’ (i.e. lifetime RAROC and one-year RAROC). When should one use which of the two RAROC formulae? For pricing, it is important to take into account the total lifetime of the policy. Therefore, it is appropriate to apply the lifetime RAROC. For performance measurement, it is important to bear in mind that performance is measured over a certain period, shorter than the total lifetime of the policy. In practice, it is often one year or parts like months and quarters. Economic capital reflects the risk in

Risk Management for Insurance Firms
72
that period. The one-year RAROC provides the performance in relation to the periods in which the risk is borne. When evaluated over a single policy, the one-year RAROC is likely to change over time, because the fair value develops and because the economic capital changes over time. Performance is often measured over portfolios consisting of multiple policies with different maturities. When new and old policies are equally spread over the portfolio, the one-year RAROC will be relatively stable. Variations of the one-year RAROC for different policies will average out. As such, RAROC may be applied to similar applications as in banking. It is well equipped for capital allocation to business units. Also, it may be used for pricing of individual policies. For life insurance, the step from embedded value towards RAROC and economic capital as a pricing instrument is relatively small. A supervisory capital charge already exists in embedded value within life insurance. The next step would be to introduce the concept of fair value rather than embedded value and economic capital rather than supervisory capital. For non-life insurance, the step would be larger although GLM techniques already in use include risk premiums in pricing. The refinement is to relate these risk premiums firmly to RAROC and economic capital.
2.7 ECONOMIC CAPITAL MODELS IN PRACTICE: EVIDENCE FROM
THE INDUSTRY Section 2.6 developed a framework for economic capital measurement. It is interesting to evaluate to what extent insurance firms are indeed applying these methods in practice. Documentation on the application of economic capital in the insurance industry has been relatively scarce. To find out how insurance firms apply the concept of economic capital in practice, we consulted experts in the field. We considered multiple methods of consulting the industry, ranging from structured questionnaires to open interviews. The major advantage of questionnaires is their structured approach and ease of processing the outcomes in structured manner. The major advantage of open interviews is the richness of information that becomes available to the researcher.208 Our objective was to gain access to information on the application of economic capital models in the broadest sense. Also, we wanted to perform an initial test
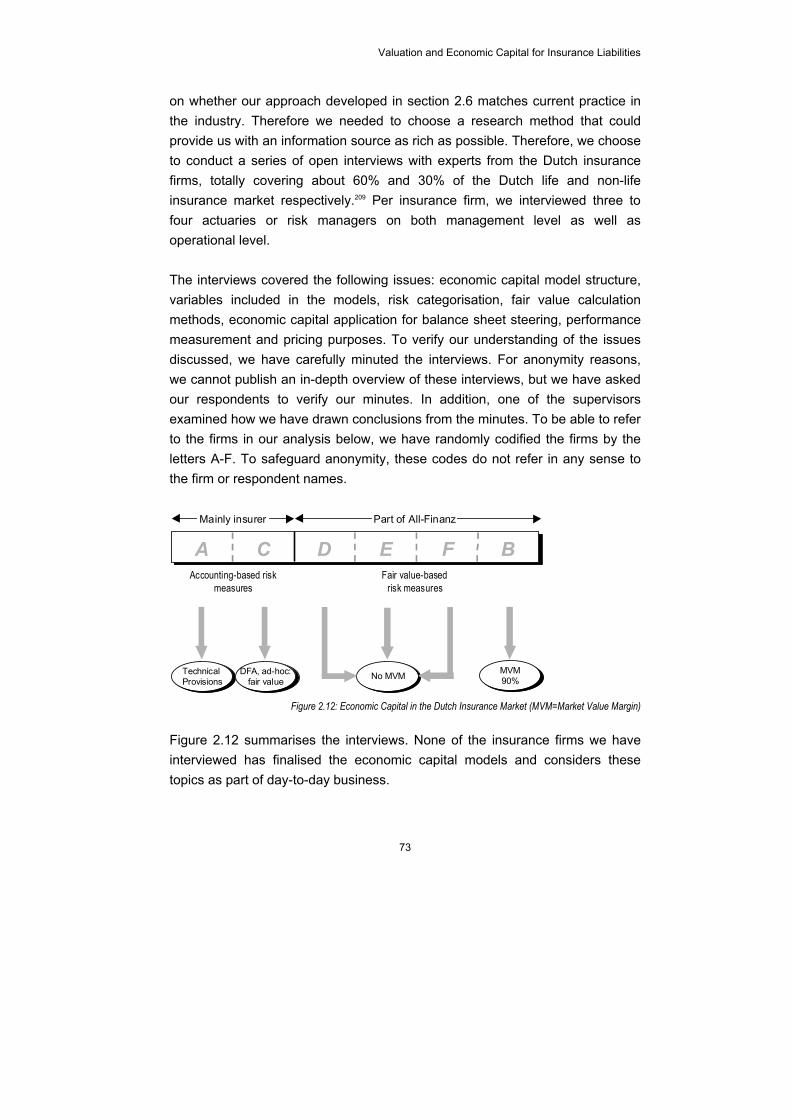
Valuation and Economic Capital for Insurance Liabilities
73
on whether our approach developed in section 2.6 matches current practice in the industry. Therefore we needed to choose a research method that could provide us with an information source as rich as possible. Therefore, we choose to conduct a series of open interviews with experts from the Dutch insurance firms, totally covering about 60% and 30% of the Dutch life and non-life insurance market respectively.209 Per insurance firm, we interviewed three to four actuaries or risk managers on both management level as well as operational level. The interviews covered the following issues: economic capital model structure, variables included in the models, risk categorisation, fair value calculation methods, economic capital application for balance sheet steering, performance measurement and pricing purposes. To verify our understanding of the issues discussed, we have carefully minuted the interviews. For anonymity reasons, we cannot publish an in-depth overview of these interviews, but we have asked our respondents to verify our minutes. In addition, one of the supervisors examined how we have drawn conclusions from the minutes. To be able to refer to the firms in our analysis below, we have randomly codified the firms by the letters A-F. To safeguard anonymity, these codes do not refer in any sense to the firm or respondent names.
No Risk Margin Risk Margin 90%
Technical Provisions
DFA, ad-hoc:fair value
BAccounting-based risk
measuresFair value-based
risk measures
Mainly insurer Part of All-Finanz
No MVM MVM90%
Technical Provisions
DCA FE
DFA, ad-hoc:fair value
Figure 2.12: Economic Capital in the Dutch Insurance Market (MVM=Market Value Margin)
Figure 2.12 summarises the interviews. None of the insurance firms we have interviewed has finalised the economic capital models and considers these topics as part of day-to-day business.

Risk Management for Insurance Firms
74
The most important observation is that insurance firms (D, E, F, B) as a part of a financial conglomerate are further developed than the institutions for which this is not the case. This is not surprising, because financial conglomerates with significant banking activities are encouraged by Basel II to implement economic capital in their control systems. However, in such firms the insurance legs are less advanced than the banking legs. The fact that institutions with mainly insurance activities (A, C) are less advanced than broad financial conglomerates is interesting. However, the size of our sample is too small to draw general conclusions. Firm C uses a Dynamic Financial Analysis (DFA) framework, based on the current E.U. accounting and Solvency I rules rather than fair value. However, firm C uses fair value side-calculations, but (1) does not include all portfolios; and (2) does not use these for economic capital purposes. However, firm C may consider applying fair value more widely in the future. For the other four firms B, D, E, and F, fair value is the leading principle for economic capital models. In the four relevant firms, fair value is determined by discounting all future cash flows through the NPV method. All these firms apply a risk-free rate for discounting. This includes non-life as well as life and includes valuation of embedded options like guarantees. Within firms B, E, and F, economic capital is calculated more frequently than the run-off pattern. On the interim calculation dates, the run-off is fixed and the amounts are scaled for growth, e.g. by premium income. Firms D, E, and F do not include a market value margin in their fair value models and they apply a risk-free discount rate. The fair value is the net present value of the expected cash flows (c.f. based on Expected Loss, EL, also called ‘best-estimate’). Firm B is the only firm that includes a market value margin in the fair value, by adding an additional amount on top of the NPV of expected cash flows (called ‘best-estimate fair value’). For firms B, D, E, and F economic capital is calculated as the difference between fair value of the liabilities based on best estimate parameters and fair value of liabilities in a worst-case scenario. With the exception of firm A, all firms plan applying stochastic risk factors, i.e. estimate an entire probability

Valuation and Economic Capital for Insurance Liabilities
75
distribution of the risk drivers and are developing the necessary models. Therefore, firms C, E, and B include some deterministic risk parameters in the calculations. In all approaches, determining economic capital is a two-step process: firstly derive the best estimate and the worst-case risk factors and secondly determine the fair value in both cases. The difference is the economic capital. From these interviews, we conclude that most interviewed firms apply risk models. Fair value of insurance liabilities has emerged as the leading principle for economic capital calculations. There is clearly no agreement in the industry on the use of a market value margin. Only one out of four firms uses such a market value margin. In the interviews however, this topic has been discussed in depth. At this point in time it is too early to draw generic conclusions from the interviews. However, the first cautious evidence from practice is that the approach developed in section 2.6 is also used in practice.
2.8 SUMMARY AND CONCLUSIONS
This chapter answered our first three research questions. Section 2.2 starts by explaining the concept of Economic Capital and its application in banking. The concept of Economic Capital is a management control principle including risk measurement methods that relate the amount of risk to the loss of the statistically determined worst-case loss over a predetermined time horizon. There are two categories of methods for economic capital: the value-based and the EL-UL method. RAROC is the relevant performance measure for the application of economic capital. The next two sections discuss the major relevant risk management instruments in insurance and the Dutch accounting regulations. Section 2.4 concludes that the current accounting regulations fail to adequately reflect risk. This is widely recognised and has led to discussions on the fair value of insurance liabilities in the scope of IFRS and Solvency II. As these discussions have failed to come to a unanimous outcome, this section contributes to that discussion by developing a fair value measure. Section 2.5 discusses the leading asset pricing models. It concludes that the arbitrage pricing principle is not very useful for valuing insurance liabilities, because they cannot be replicated by instruments available

Risk Management for Insurance Firms
76
in the market. Therefore, a fair value measure for insurance liabilities should be based on the NPV method, either reflecting risk in the numerator (by using an appropriate discount rate) or in the denominator (by using a risk-free discount rate and adding an explicit market value margin). More recent theories use the latter approach to calculate the fair value. The Australian insurance supervisor (APRA) has introduced a method in which the market value margin is calculated as a certain percentile in the probability distribution. This concept has been adopted by the major industry stakeholders. However, we prefer a cost-of-capital approach for the market value margin. Here, capital is the buffer for risk and the market value margin is the cost of holding that amount of capital. We have argued that this approach better reflects financial market theory and practice. Moreover, it is a fundamental reflection of the concept of Risk, rather than the arbitrary confidence levels. This answers our second research question. The fair value of insurance liabilities should be calculated through discounting best-estimate future cash flows with the risk-free rate. Then a separate market value margin should be added as the cost of holding an amount of risk capital, i.e. economic capital. Section 2.6 shows that the step towards economic capital models is relatively simple once a fair value approach is available. The section develops a method applicable for underwriting risk of non-life and life insurance. The economic capital is calculated as the worst-case decrease in best estimate fair value. The economic capital calculations abstract from a market value margin because it treats capital as the fundamental buffer for risk. The worst-case decrease in fair value is calculated through methods like the loss triangle and mortality tables. Both these instruments are widely present in insurance and subject to a body of actuarial theory. However, we see a difference with the banking application: banks use the econometric approach by relating explanatory variables to the loss levels, whilst insurers apply an actuarial approach by fitting distributions to observed losses.

Valuation and Economic Capital for Insurance Liabilities
77
Economic CapitalTotal Fair Value
Worst-case risk driver
Loss Triangles
Risk Margincost of holding economic capital
Worst-caseNPV worst-case cash flows
Economic CapitalEconomic Capital
Worst-case risk driver
Mortality Tables
Risk Margincost of holding economic capital
Market Value Margincost of holding economic capital
Risk Margincost of holding economic capital
Best-estimateNPV expected cash flows
Figure 2.13: Fair Value and Economic Capital for Underwriting Risk
As a result, economic capital and fair value can be determined through the following steps: Extract expected future cash flows using traditional actuarial techniques like
loss triangle and mortality tables; Calculate the NPV by discounting these cash flows by the risk-free rate.
This is the best-estimate fair value; Extract the worst-case cash flows from the loss triangle and mortality tables; Calculate the NPV by discounting these cash flows by the risk-free rate.
This is the worst-case fair value; Calculate economic capital as the difference between best-estimate210 and
worst-case fair value; Calculate the market value margin as the cost of holding the economic
capital. The total fair value is the sum of best-estimate fair value and the market value margin.
Section 2.7 investigates the status of economic capital in the Dutch insurance industry through expert interviews. Six leading Dutch insurance firms, representing ca. 60% and 30 % of the Dutch life and non-life insurance market respectively, have been interviewed in the Summer of 2005. The major

Risk Management for Insurance Firms
78
conclusion is that the majority is in the process of developing economic capital frameworks. The model structure broadly equals the framework developed in section 2.6. Sections 2.6 and 2.7 answer our third research question.

Valuation and Economic Capital for Insurance Liabilities
79
NNOOTTEESS TTOO CCHHAAPPTTEERR 1 Kevin Dowd (1998), chapter 2 2 Matten (1995), p.6 3 Schroeck (2002), p. 156 4 Matten (2000), p. 154 5 Doff (2004), p. 28 6 In use by: James (1996), p. 18, Kupper (1999), p. 24, Hallerbach (2001), p. 3 7 Medina et al. (2003), p. 29 8 Merton, Perold (1993), p. 17 9 Schroeck (2002), p. 154 10 Froot, Stein (1998), p. 55, p. 58 11 Source: ING Group Annual Report 2005 and Rabobank Group Annual Report 2004. 12 WECM (2003), p. 8-9 “Risk measurement within financial conglomerates: best practice by risk type” 13 Interested readers on these and other forms of statistical simulation, please consult Dupire (1998) 14 Bos (1999), chapter 3 15 Doff (2004), p. 60 16 Recall the remark of Matten (1996), p. 63. “… banks treat losses as something that happen way down the bottom of the P&L account: [but] they really should be deducted directly from revenue!” 17 Matten (2000), p. 151 18 see e.g. Booth et al. (1999), p. 307 19 Saita (1999), p. 96 20 Doff (2005), p. 585, Doff and Van den Tillaart (2004), p. 600, Doff (2004-a), p. 123 21 Matten (2000), p. 30 22 Despite this principle, Bos concludes that there are still descrepancies between the accrual and mark-to-market accounting worlds within the banking industry. Bos (1999), p. 15 23 Schroeck (2002), p. 243, p. 253, and p. 263 24 Doff (2004-a), p. 136 25 Scheffer (2004) provides an interesting research on the applications of economic capital applications in the management control of the credit process in banks 26 Interested readers are recommended to consult Doff (2004-a), Matten (2000), Saita (1999). 27 See e.g. Wilson (2003), p. 79 28 Smithson (2003), p. 62-63 29 Myers, Read (2001), p. 545 30 Cummins (2000), p. 7 31 Although most traditional insurance education define risk as the occurrence of claims and the volatility of claims interchangeably. However, we opt for the modern corporate finance definition of risk as the volatility of claims. 32 In addition, the insurance experts implement risk prevention measures for clients like fire alarms and detection systems. 33 e.g. Booth et al. (1999), p. 302 34 In line with the three basic forms of Value at Risk described in Doff (2004), it is equally possible to use historical distributions instead of theoretical distributions like log-normal or Poisson. That does not alter the concept and for that reason we will not go into detail on this. 35 e.g. Vaughan and Vaughan (1995) 36 Anders (2002), p. 16 37 Peccia (2001), p. 206 38 Peziér (2003), p. 49 39 Hesselager (1994), Eshita (1999), Kaas et al. (1993), p. 50 40 See Dupire (1998), chapter 10 41 Booth et al. (1999), p. 408 ff.

Risk Management for Insurance Firms
80
NOTES (CONTINUED) 42 The circled number of € 74 is determined by multiplying the average run-off percentage (i.e. the average of 100/50, 103/51, 105/53, and 73/37) to the last observed payment (here: € 149). 43 These and other methods are described in Booth et al (1999), p. 446 44 Mosley (2004), p. 292 45 Kaas (2001), p. 169 46 Anderson (2004), art. 3.32 47 Gedalla et al. (2004), p. 237 48 Mosley (2004), p. 293 49 Kaas (2001), p. 128 50 Anderson, et al. (2004), art 2.104 51 Gedalla et al. (2004), p. 244 52 Philbrick, Painter (2001), p. 2 53 see for instance Ahlgrim et al. (2002), p. 5 54 Kaufmann et al. (2001), p. 2 55 Hines (2002), p. 6 56 Hodes et al. (2000), p. 19 57 Warthen, Sommer (1996), p. 296 58 Groupe Consultative des Associations d’Actuaires (1997), p. 31 59 Daykin (1990), p. 727 ff. 60 Haberman (1992), p. 354 ff. 61 Daykin et al. (1988), p. 51 ff. 62 AG (2002) 63 Vanderhoof (1998), p. xi 64 AG (1994), part III 65 Risk Management Metrics Subgroup (2001), p. 3 66 Swiss Re (2001), p. 28 67 Dicke (1998), p. 14 68 O’Keefe, et al. (2005), chapter 5 69 CFO Forum (2004-a), CFO Forum (2004-b) 70 Tillinghast (2005), p. 1 ff. 71 Tillinghast (2005), p. 4 72 Strictly speaking from an accounting perspective, liabilities include equity as well. However, congruent with common practice in the insurance industry, we will refer to insurance technical provisions only. 73 Code of Supervision of Insurance Undertakings 74 Aarzen, Mourik (2005), p. 19 75 PriceWaterhouse Coopers (2005), p. 12 76 Oosenbrug (2002), appendix I is an overview of the relevant articles of Title 9, book 2 BW 77 Free translation of art 2: 444, 1 BW 78 EEC (1979), 79/267/EEC (5 March 1979), art. 17.1 79 EEC (1973), 73/239/EEC (24 July 1973), art. 15.1 80 Code of Supervision of Insurance Undertakings 81 Oosenbrug (2002), p. 223 82 WTV 1993, art. 93.1 (translated from Dutch) 83 PVK (1994), art. 18.1 84 PVK (2001) 85 PVK (2001), section 2.1 86 For the exact method, please consult PVK (2001), section 2.3 and Appendix I 87 The prescriptions for non-life are reflected in PVK (1994), taken as Appendix IV in the Actuariële Principes Leven (2001) 88 PVK (2001), section. 2.3.2

Valuation and Economic Capital for Insurance Liabilities
81
NOTES (CONTINUED) 89 Theoretically, interest rates on government bonds are a compensation for the inflation effect and the effect of not having the funds at ones disposal. 90 Oosenbrug (2002), p. 446 91 IASB (2003), p. 4 92 Chisholm (2002), p. 265 93 Chisholm (2002), p. 61 94 Chisholm (2002), p. 155 95 Brealy, Myers (2000), p. 17 96 Brealy, Myers (2000), p. 37 97 Montier (2002), p. 87 98 Brealy, Myers (2000), p. 209 99 Brealy, Myers (2000), p. 99 100 Brealy, Myers (2000), p. 100-108 101 Chisholm (2002), p. 237 102 Chisholm (2002), p. 182 103 Schroeck (2002), p. 58 104 Brealy, Myers (2000), p. 603 105 Brealy, Myers (2000), p. 603 106 Chisholm (2002), p. 181 107 Hull (2006), p. 245 108 Hull (2006), p. 293 109 Babbel et al. (2002), p. 13 110 IASB (2004-a), Appendix A 111 IASB (2004-b), IAS39, art BC102 112 IASB (2004-b), IAS39, art AG74 113 Cummins et al. (2000), p. 173 114 Peasnell (2005), p. 6 115 Cummins (1992), p. 151 116 Babbel et al. (2001), p. 22 117 Cummins (1992), p. 159 118 Dicke (1998), p. 7 119 Babbel et al. (2001), p. 23 120 Booth et al. (1999) 121 AG (1994), p. 15 122 Booth et al. (1999), Chapter 16 123 Chisholm (2002), p. 161 ff. 124 Guo (2000), p. 155 125 Schroeck remarks that there may be a fundamental problem between the market equilibrium oriented CAPM and the concerns of an individual firm with illiquid instruments and risks. Schroeck (2002), p. 261 126 Bogner (2005), p. 9 127 Dorsman (1996), p. 16 128 Doff (2004), p. 22 129 FOPI (2004-c), p. 14 130 Doff (2004), p. 147 131 Dicke (1998), p. 13 132 Chisholm (2002), p. 65 133 Dicke (1998), p. 15 134 Dicke (1998), p. 17 135 Doll et al. (1998), p. 21 136 Doll et al. (1998), p. 56 137 IASB (2005-c), p. 8 and IASB (2005-d), p. 15

Risk Management for Insurance Firms
82
NOTES (CONTINUED) 138 EU (2004), MARKT/2515/04, p. 7 139 CEIOPS (2005-b), art. 7.9, 7.17, 7.18, 7.20, 7.24, 7.29, 7.30, 7.34, 7.41 140 for life liabilities, the best-estimate should be at least the surrender value 141 Formally, CEIOPS has not yet “… determined a view on discounting.” (CEIOPS (2005-b), art. 8.112) But in the explanation, it expresses a preference for discounting as the benefits outweigh the disadvantages. (CEIOPS (2005-b), art. 8.51-8.55) 142 As government bond-rates are not available for all maturities, CEIOPS considers using swap rates. See CEIOPS (2005-b), art. 7.18 143 Although CEIOPS suggests that discounting at a lower than risk-free rate might also be an option. This will increase the provision and hence results in additional prudence. However, it will result in hidden prudence levels. See CEIOPS (2005-b), art. 7.20 144 Please note, that for a standard normal distribution, ½ of the standard deviation will result in a 69% percentile already. For extremely skewed distributions ½ of the standard deviation will result in an even higher level of confidence. 145 Association of British Insurers (2005), p. 1 146 CAS (2004), p. 128 147 Outreville (1998), p. 264 148 Walhin, et al. (2001), p. 1 149 Christofides (2003), p.1 150 Wang (1998), p. 89 151 Artzner et al. (1998), p. 1 ff. 152 Butsic (1994), p. 656 ff 153 This was partly due to the El Nino hurricane in 1991. 154 Loubergé et al. (1999), p. 126 155 As explained by Cummins (2004) and numerically illustrated by Schippers, Meijer (2000, p. 25) who estimate the capital markets ca. 100% the size of reinsurance markets. 156 Richards et al. (2004), p. 1006 157 Müller, Grandi (2000), p. 277 158 Estimations of weather dependence imply that more than 80% of global business activity is weather-dependent. C.f. Müller, Grandi (2000), p. 273 159 Vedenov (2004), p. 387 160 Richards et al. (2004), p. 1005 161 Campbell, Diebold (2005, p. 6) note that it is interestingly also possible to hedge against comparatively good weather in other locations with weather derivatives to neutralise competitive disadvantage of better weather in a competitor’s area. This is not possible with traditional insurance. 162 Vedenov (2004), p. 389 163 Müller, Grandi (2000), p. 282 164 Richards et al. (2004), p. 1005 165 Richards et.al. (2004), p. 1008 and Müller, Grandi (2000), p. 283 166 Vedenov et al. (2004), p. 390 167 Campell, Diebold (2005) provide an example of such a weather model. As they indicate, there is a multitude of statistical and meteorological literature for weather preditions. Interested readers are referred to consult Campell and Diebold for more information on this subject, as this is beyond the scope of this thesis. 168 Hull (2006), p. 553 169 This section discusses the CAT bond only to emphasise the principles used. Amongst others Loubergé et al. (1999) explain that the principles hold for other securities as well, such as CAT options or futures. 170 Loubergé et al. (1999), p. 130 171 Schippers, Meijer (2000), p. 26 172 c.f. Moore (1999), Muermann, (2003)

Valuation and Economic Capital for Insurance Liabilities
83
NOTES (CONTINUED) 173 Muermann (2003), p. 3 174 Doll et al. (1998), p. 26 175 Froot, Stein (1998), p. 56 176 Cummins et al. (2000), p. 172 177 Peasnell (2005), p. 9 178 Peasnell (2005), p. 8 179 In practice we feel that the current Dutch insurance retail market is less driven by credit quality than by service quality and price. The principle may however hold for wholesale. 180 FOPI (2006), p. 18 181 in Dutch: “toetsingsvermogen” 182 CEA (2005-f), p. 4, IAIS (2005-a), art. 17 183 FOPI (2006), p. 18 184 Prescribing an identical cost of capital could be preferred in a supervisory context for pragmatic and consistency reasons. Although not theoretically correct, we could understand supervisors choosing for such an option. 185 Scheepers, Urff (2001), p. 12 186 Briys and De Varenne discuss this issue. Bryis, De Varenne (2001), chapter 1 187 Exley, Smith (2006), p. 51 188 Medina et al. (2003), p. 30, footnote 7 189 Medina et al. (2003), p. 31 190 For more information on these terms in banking, please consult Doff (2004), chapter 3 191 Erisk (2001), p. 4 192 Nakada, et al. (1999), p. 5 193 Anderson (2004), art. 2.104 and Annex C 194 Kaas et al. (2001), p. 50 195 Unfortunately, most software does not include high statistical confidence levels as are common in economic capital approaches. Extrapolation methods should assist the analyses. 196 Nakada et.al (1999), p. 7 197 Gleissner, et al. (2005), p. 62 198 Medina et al. (2003), p. 29 199 Nakada et al. (1999), p. 9 200 For more information on these terms in banking, please consult Doff (2004), p. 42 201 AG (2002) 202 IAA (2004), p. 27-28 203 Nakada et al. (1999), p. 10 204 Swiss Re (2001), p. 29 205 Erisk (2001-b), p. 4 206 Culp (2000), p. 50 207 Schierenbeck (2003-a), p. 250 ff. and p. 512 ff. 208 Verschuren, Doorewaard (1999), p. 149 ff. 209 Verbond van Verzekeraars (2006), p. 71 and 92 respectively. 210 If necessary: adjusted for the fact that no economic capital has to be held for expected profits. See Figure 2.1.


85
IINNSSUURRAANNCCEE RREEGGUULLAATTIIOONN AANNDD
SSUUPPEERRVVIISSIIOONN
3.1 INTRODUCTION This chapter discusses the supervisory framework for insurers. This is a very current issue. Ultimately this chapter answers the fourth and fifth research question that we identified in chapter 1. They are respectively ‘what are the developments in the area of insurance supervision?’ and ‘what recommendations can we make to increase the effectiveness of these developments?’ Section 3.2 describes the current supervisory framework for Dutch insurers. The supervisory world has been in a state of flux around the globe. Section 3.3 describes four insurance supervisory frameworks that have been reviewed over the last years. Then, section 3.4 and 3.5 describe the Solvency II process. This process has been influenced by the reviewed frameworks that we described in section 3.3. After section 3.5 we have an overview of the current developments in the area of insurance supervision. This answers the fourth research question. A coherent overview of these developments is necessary to make new recommendations to the Solvency II project in addition to the existing comments already given by the industry. Section 3.6 compares the Solvency II framework with Basel II, its banking counterpart. More appropriately, we will come to the conclusion that they are counterparts but by no means equivalents. These
CChhaapptteerr
33

Risk Management for Insurance Firms
86
reflections enable us to make a number of recommendations on the Solvency II project that answer the fifth research question in section 3.7.
3.2 CURRENT DUTCH REGULATION AND SUPERVISION
There has been a European framework for insurance solvency since the late 1970s.1 The insurance supervisory framework contains multiple instruments including licensing, supervision of actuarial pricing principles, and solvency requirements. Due to the nature of our research, this chapter focuses solely on the latter. The solvency requirement is included in supervisory reporting through the WTV-statements (called WTV-staten) and most insurers include it in annual reporting.2 Table 3.1 shows the solvency requirements for non-life and life insurance respectively. The structure dates from the late 1970s. Because numbers and amounts had never been revised (like adjusted for inflation effects), they had become outdated. To resolve this, the European Committee started an insurance solvency review project called Solvency I.3 This project updated the numbers and thresholds. Solvency I maintained the existing structure, but urged for a revise during the Solvency II project. Solvency II was started immediately after the conclusion of the Solvency I project but accelerated in 2005 (see section 3.4). Non-Life Insurance Life Insurance The maximum of 1) 18% of premium income below € 50 mio and 16% of premium income above € 50 mio; 2) 26% of average claims below € 35 mio and 23% of average claims above € 35 mio.
The sum of 1) 4% of premium income; 2) 1% of premium income (unit linked products); 3) 0.1-0.3% of capital under risk depending on maturity.
Table 3.1: Current E.U. Insurance Solvency Requirements are Relatively Crude Table 3.1 shows that insurance solvency requirements are relatively simple and straightforward. However, they are insensitive to risk and contain some perverse incentives. For a given risk, higher premium is a sign of prudence as it is more likely that the insurer can fulfil claims. However, a higher premium leads to a higher solvency charge as well. Therefore, in order to decrease its solvency requirement, an insurance firm is stimulated to increase risk by lowering premiums. This perverse incentive holds for non-life as well as life insurance. Moreover, there are no explicit solvency requirements for investment risks.

Insurance Regulation and Supervision
87
Therefore, accepting additional investment risks does not lead to higher solvency requirements. Mercer Oliver and Wyman indicate that the current solvency requirements in most European countries are much lower than the true amount of economic capital for the particular firms.4 The fact that firms internally apply multiples like two or three to the E.U. solvency requirements illustrates their crudeness. This is a clear incentive for supervisors to revise the current framework.
3.3 DEVELOPMENTS AND INITIATIVES IN INSURANCE SUPERVISION
Describing the E.U. solvency regime is incomplete without an overview of some other solvency regimes. This section will discuss the Australian and Canadian frameworks, which are quite similar and both have similarities with the U.S. framework as well. We briefly touch upon the U.S. framework firstly. More recently, the Dutch and the Swiss supervisors have reviewed their solvency system as well. We will describe them below. In 2005, Comité Européen des Assurances (CEA) and Mercer Oliver Wyman have compared multiple solvency assessment models.5 This comparison serves as a point of reference for us in the remainder of this section. CEA and Mercer Oliver Wyman conclude that there is an eminent trend towards economic capital based solvency requirements. They came to the following conclusions:6 It is preferable to apply a total balance sheet approach, taking into account
both assets and liabilities; There is a trend towards economic or market value based measurement of
the balance sheet rather than relying on existing accounting measures; A value-at-risk-type measurement becomes the standard; A wide range of risks are included in pillar one; and Capital requirements are calibrated to a specific confidence level over one
year, generally at 99.5% or higher. The U.S. National Association of Insurance Commissioners (NAIC) has the so-called Risk-Based Capital (RBC)7 in place since 1993 and 1994. We briefly describe the RBC-system because it has served as an example for the Australian and Canadian revisions and because the U.S. market is a large insurance market. The NAIC solvency requirement is based on multiple

Risk Management for Insurance Firms
88
weighting factors on assets (varying between 10% and 30%) and a prudential factor on the technical provisions and premiums to adjust for inadequate provisioning. The risk-weighting system resembles the structure of the 1988-banking solvency rules.8 All RBC-components result in separate solvency requirements, but the total solvency requirement includes a level of diversification by applying a square root-formula. As a result, the total solvency requirement is lower than the sum of the components. This reflects diversification. Whilst exact formulae for life and non-life insurance differ, the structure is similar. Although many comments have been raised on the precise structure of the RBC-measures, Pottier and Sommer concluded that the RBC-system, despite its simplicity, is able to capture the risk in the particular firms quite well.9 The remainder of section 3.3 reviews the Australian, Canadian, Dutch and Swiss supervisory framework. Australia and Canada are interesting because these countries have been the first in a series of countries to redesign their supervisory framework. The Dutch FTK framework (see section 3.3.3) is relevant because we are located in the Netherlands. The Swiss SST framework (see section 3.3.4) is relevant because it is the most recent revision and because it introduced a new fair value method: the cost-of-capital approach (see section 2.5 as well).
3.3.1 The Australian Insurance Supervisory Framework (APRA) The Australian Prudential Regulatory Authority (APRA) has reviewed its solvency requirements10 for non-life insurers through a risk-based framework in 2003.11 The minimum solvency requirements are determined through either the Prescribed Method or an Internal Model Based (IMB) Method. The Prescribed Method includes charges for investment risk, insurance risk, and concentration risk. It applies a factor based approach for insurance risk and investment risk, similar to the U.S. RBC approach. The charges vary per product category and there are separate charges for outstanding claims risk (reserve risk) and premium liability risk (premium risk). As an example, the minimum capital requirement for Motor Insurance products is 9% and 13.5% of the liabilities for outstanding claims risk and premiums liability risk respectively.12 Within this approach, insurance liabilities must be calculated on a true value basis
Insurance Regulation and Supervision
89
including a market value margin over the central (viz. best) estimate.13 This market value margin is determined as 75% of the liabilities’ probability distribution.14 Future cash flows are to be discounted at the risk-free rate.15 As Australia has been one of the first supervised regions adopting a fair value-based liability valuation, it has become the starting point for the development of IASB and Solvency II. The APRA IMB Method is described less elaborate than the Prescribed Method. Therefore it provides us with less guidance on modelling approaches. Apart from model approval conditions16 and qualitative standards,17 APRA prescribes “…the insurers’ capital measurement model should calculate an amount of capital sufficient to reduce the insurers’ probability to default over a one year time horizon to 0.5% or below.”18 The structure is in line with the concept of Economic Capital described in section 2.2. The model is required to incorporate a minimum amount of risk factors within the categories investment and insurance risk.19
3.3.2 The Canadian Supervisory System The Canadian Office of the Superintendent of Financial Institutions (OSFI) supervises both banking and insurance firms. Regulation of capital adequacy of insurance firms is different for life and non-life firms. The life insurance supervisory framework is called the Minimum Continuing Capital and Surplus Requirement (MCCSR).20 It contains five classes of capital requirements:21 Asset default risk: risk of loss resulting from on-balance sheet asset default
and contingencies in off-balance sheet exposures; and the loss of market value of equities and related reduction of income;
Mortality/morbidity/lapse risks: risk that assumptions about underwriting parameters will be wrong;
Interest margin pricing risk: the risk of interest margin losses with respect to investment and pricing decisions on in force business other than asset default and changes in interest rate environment;
Interest rate environment risk: risk of loss resulting from changes in the interest rate environment other than asset default and interest margin pricing risk;

Risk Management for Insurance Firms
90
Segregated funds risk: risk of losses from guarantees embedded in segregated funds.
All risks are measured as a factor times the balance sheet item. For instance, within the asset default risk category there are 8 factors varying from 0% for Cash to and 16% for C-rated Bonds and 35% for certain Oil and Gas Real Estate properties.22 Similarly, there are factors for the other risks like underwriting risks in life. The MCCSR prescribes the risk exposure: mainly premiums and risk reserves.23 The non-life capital requirements are called Minimum Capital Test (MCT) and include:24 On-balance sheet assets; Policy Liabilities: for margins for unearned premiums and unpaid claims
separately;25 Catastrophe reserves and additional policy provisions; Reinsurance ceded to unregistered reinsurers; Off-balance sheet exposures;
In addition to the factor-based approach described above, OSFI has allowed supervised institutions to apply internal models since 2002. The internal model is expected to deliver the Tail Value at Risk at a 95% confidence level.26 The approval criteria are mainly directed at the internal model governance and integration in day-to-day business.27 Next to the capital charges, OSFI expects institutions to apply Dynamic Capital Adequacy Tests (DCAT),28 a series of scenario analyses to assess the sensitivity of the provisions and capital to changes in the risk factors. These tests should be future oriented, cover a three to five year period, and include deterministic scenarios.29
3.3.3 The Dutch Financial Assessment Framework (FTK) Late 2004, the Dutch insurance supervisor (PVK)30 issued a consultative framework for a new Financial Assessment Framework (Financieel ToetsingsKader, FTK)31 with explicit aim to be integrated into Solvency II once available. Central aspects of FTK are:32 Risk-based supervision; Market value (or: market-consistent valuation) for assets as well as
liabilities;

Insurance Regulation and Supervision
91
Solvency test with a one-year time horizon, including a solvency requirement based on statistical models;
Multiple approaches for the solvency test: simple, standardised and internal model-based method.
Continuity analysis with a five-year horizon. FTK has been positively received by the industry,33 although there have been comments on practical implementation and some quantitative details. However, it has not been implemented in regulation due to political reasons. Instead, it will serve as a supervisory instrument to strengthen the supervisory discussion with the supervised firms.34 Within the solvency test, the simple method is allowed to be used by small insurers only. For advanced insurance firms, the internal model-based method will be most appropriate, but they have to apply the standardised method as well as a reference point.35 Internal model guidelines are relatively limited, but approval criteria encompass mostly governance aspects and the prescribed confidence level (99.5%).36 The standardised method consists of a set of scenarios for market risk, credit risk, liquidity risk, insurance risk, concentration risk, and operational risk.37 All risk categories may be further subdivided into classes.38 For each risk component, there are standard scenarios, like a 40%-decrease of stock markets or a 60%-increase of credit spreads. The insurance risk solvency requirement is determined through factors on risk capital or fair value technical provisions39, 40 both for life and non-life. The total capital charge in the standardised approach is calculated through a square root-formula and a set of prescribed correlations.41 The fair value of insurance liabilities is defined as the sum of the best-estimate value (or: value based on Expected Loss, EL) and a market-consistent surcharge or market value margin (to incorporate part of Unexpected Loss, UL).42 The best-estimate value should include embedded options, guarantees and other conditional cash flows. The market value margin is determined as the 75% percentile,43 but may never be less than half of the standard deviation of the probability distribution. The latter is to account for extremely skewed distributions.44 For convenience, FTK includes a set of tables and standard

Risk Management for Insurance Firms
92
calculations to determine the market value margin for those institutions that are unable to fully estimate all probability distributions.45 The continuity test is new in the supervisory area. It allows a discussion on potential future developments between insurers and supervisors. Also, it serves as an early warning system. It includes stress testing and prospective scenario analyses:46 Objective, policies and policy-instruments: how well is the institution
equipped to withstand risks? Expected environmental assumptions, like demographic developments; Future expectations (basis scenario): what developments does the firm
expect to be most likely? Sensitivity analyses: how sensitive are assumptions to mis-estimations?; Stress testing: detailed emergency plans for at least the three largest risks;
and Differential analyses (ex post): how well have assumptions been over the
past year(s)?
3.3.4 The Swiss Solvency Test (SST) The Swiss Federal Office of Private Insurance (FOPI) has recently issued a new solvency framework for insurance firms, called Swiss Solvency Test (SST). It is not intended to replace the current solvency framework within Switzerland, as institutions still have to satisfy the statutory Solvency I requirements under the new regime.47 The SST promotes the discussion between supervisor and insurance firms.48, 49 The SST-target capital is determined through aggregating a set of model outcomes for multiple risk types (either standard or internal models) and the outcomes of standard and company-specific scenarios (see Figure 3.2).50 The models should deliver probability distributions from which an Tail-VAR can be derived. The probability distributions should describe the market consistent value of assets less market consistent value of the liabilities,51 the latter including embedded optionalities and including a market value margin.52
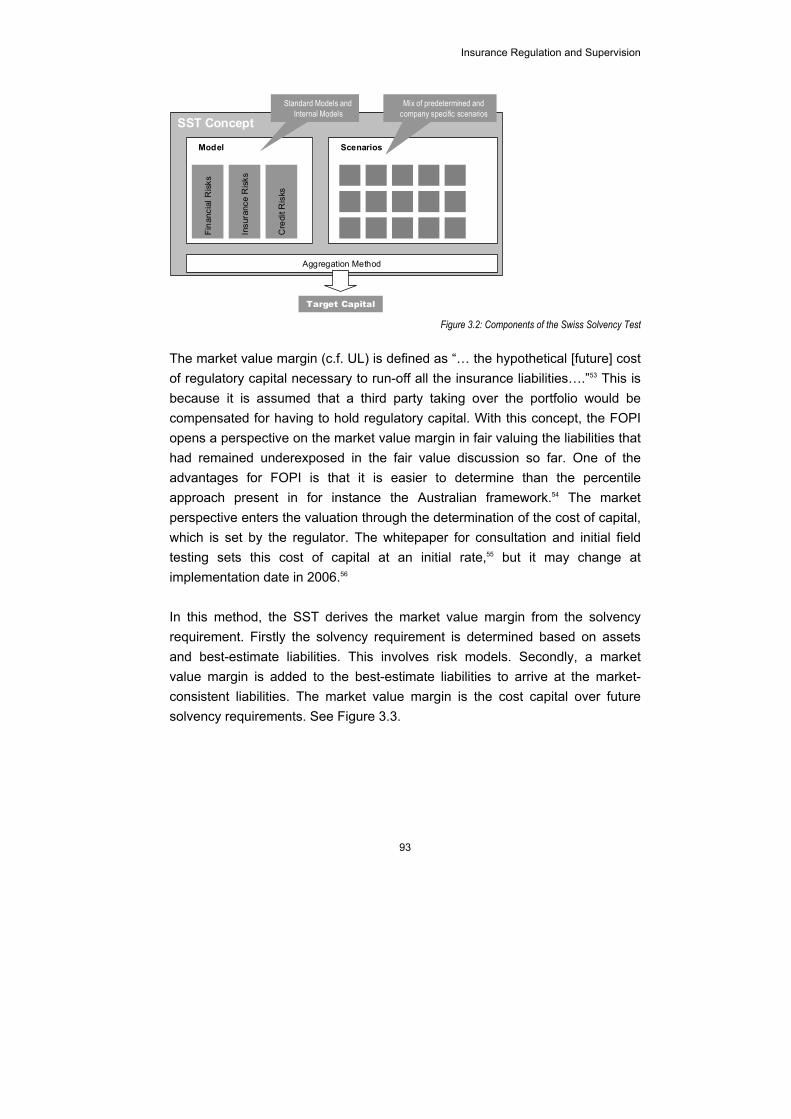
Insurance Regulation and Supervision
93
SST Concept
Aggregation Method
Fina
ncia
l Ris
ks
Insu
ranc
e R
isks
Cre
dit R
isks
Model Scenarios
Target Capital
Mix of predetermined andcompany specific scenarios
Standard Models andInternal Models
Figure 3.2: Components of the Swiss Solvency Test
The market value margin (c.f. UL) is defined as “… the hypothetical [future] cost of regulatory capital necessary to run-off all the insurance liabilities….”53 This is because it is assumed that a third party taking over the portfolio would be compensated for having to hold regulatory capital. With this concept, the FOPI opens a perspective on the market value margin in fair valuing the liabilities that had remained underexposed in the fair value discussion so far. One of the advantages for FOPI is that it is easier to determine than the percentile approach present in for instance the Australian framework.54 The market perspective enters the valuation through the determination of the cost of capital, which is set by the regulator. The whitepaper for consultation and initial field testing sets this cost of capital at an initial rate,55 but it may change at implementation date in 2006.56 In this method, the SST derives the market value margin from the solvency requirement. Firstly the solvency requirement is determined based on assets and best-estimate liabilities. This involves risk models. Secondly, a market value margin is added to the best-estimate liabilities to arrive at the market-consistent liabilities. The market value margin is the cost capital over future solvency requirements. See Figure 3.3.

Risk Management for Insurance Firms
94
Cost ofCapital
UnderwritingRisk Models
Assets
(government)bonds and other
asset classes
Liabilities
Prudence
Equity
Assets
(fair value)
Insurance Balance Sheet
Liabilities
(best-estimate)
Market ValueMargin
Equity surplusSolvency
requirement
TotalFair Value
Figure 3.3: Cost-of-Capital Approach Derives the Market Value Margin from the Solvency Requirement
3.3.5 Preliminary Findings The previous sections described the supervisory systems of the U.S. (briefly), Australia, Canada, the Netherlands, and Switzerland. This section compares these systems with the existing E.U. solvency rules. Our findings correspond to the conclusions of the report of CEA and Mercer Oliver Wyman. All of the reviewed solvency systems are risk-based. They all include multiple risks, both from the asset-and the liability-side of the balance sheet (total balance sheet approach). APRA introduced fair value based supervision and designed the percentile approach to calculate the market value margin in the liabilities. This has been adopted by the OSFI and the Dutch FTK. The Swiss SST designed a cost-of-capital approach to calculate the market value margin (see section 2.5). Of the reviewed solvency systems, the U.S. RBC system, APRA and OSFI use a factor based approach that relates the solvency requirement to certain balance sheet items and a predefined factor. FTK and SST are based on scenarios. In addition to the scenarios to calculate the solvency requirement, OSFI (DCAT) and FTK (continuity analysis) require insurance firms to assess a set of long-term scenarios with a time horizon of three to five years. Although it is not directly linked to the solvency requirement, it may be a powerful supervisory mechanism. Long-term scenarios are especially relevant because of the long term of insurance products.
Insurance Regulation and Supervision
95
All recently reviewed supervisory frameworks allow insurance firms to use internal models to determine the solvency requirement. This is a clear incentive for insurance firms to develop economic capital models. The supervisor prescribes the risk measure (VAR or Tail-VAR)57 and calibration parameters (time horizon and confidence level). However, the supervisory frameworks all lack concrete and direct guidance and qualifying criteria on model structure and risk variables. This may not be necessary for advanced insurance firms, but as the insurance industry is moving towards economic capital supervisory guidance enhances the implementation process. Section 3.7 will use the current insights to make recommendations for the Solvency II project.
3.4 SOLVENCY II: THE PROCESS
The European framework has been subject to major reform plans.58 Started in 2002, the European Committee adopted the core principles59,60 that will underlie the future Solvency II framework. These principles are borrowed from Basel II in the following issues:61 Risk-based solvency requirements; Three pillar-structure; Menu of approaches in pillar I, from simple to sophisticated; and Reliance on internal models where appropriate.
Only in late 200362 the Committee of European Insurance and Occupational Pension Supervisors (CEIOPS) has been established as the governing body for steering and guiding the process. Virtually, its work started Spring 2004. In three waves, the European Commission asked for guidance on issues to CEIOPS. These so-called Calls for Advice have been published in July 2004,63 October 2004,64 and March 200565 respectively (see Table 3.4). More importantly, the Calls for Advice accelerated the process, through discussions in the industry and between industry, supervisors and the law-making bodies. The Calls for Advice included issues present in all three pillars. Initially, there have been discussions on corporate governance guidelines and supervisory powers.66, 67 More recently, the discussion concentrated on the pillar 1-issues

Risk Management for Insurance Firms
96
with the exception of some published guidelines or principles.68 We have seen this in the Basel II process as well. First Wave (July 2004) Second Wave (October 2004) Third Wave (March 2005) 1. Internal Control and Risk
Management 2. Supervisory Review
Process (general) 3. Supervisory Review
Process (quantitative tools)
4. Transparency of Supervisory Action;
5. Investment Management Rules
6. Asset-Liability Management
7. Technical Provisions in Life Assurance
8. Technical Provisions in Non-Life Insurance
9. Safety Measures (MCR) 10. Solvency Capital
Requirement (SCR): Standard Formula (Life and Non-Life)
11. Solvency Capital Requirement (SCR): Internal Models (Life and Non-Life) and their Validation
12. Reinsurance (and other Mitigation Techniques)
13. Quantitative Impact Study and Data Related Issues
14. Powers of Supervisory Authorities
15. Solvency Control Levels 16. Fit and Proper Criteria 17. Peer Reviews 18. Group and Cross-Sectoral
Issues
19. Eligible Elements to Cover the Capital Requirements
20. Independence and Accountability of Supervisory Activities
21. Cooperation between Supervisory Authorities
22. Supervisory Reporting and Public Disclosure
23. Procyclicality 24. Small and Medium-Sized
Enterprises
Table 3.4: Calls for Advice from the E.U. in the Solvency II Project The insurance industry has been regulated mostly on a national basis and there are large differences between the various national regulations. As a result, there is a need for harmonisation. The insurance industry lacked a forum to discuss these complex matters and to provide CEIOPS with input. Multiple organisations have tried to fill this gap, but initially this lead to even more confusion. Examples of such organisations are the International Association of Actuaries (IAA), the International Association of Insurance Supervisors (IAIS), Comité Européen des Assurances (CEA) and Groupe Consultative. However, none of these organisations has taken the lead and guide the discussions. As a consequence, the industry failed to ‘speak one voice’69 to CEIOPS. At the time of writing this thesis, the insurance industry is in the middle of getting a clear view on opinions and categories of methods on capital adequacy and fair value issues. CEIOPS has drafted the answers on two waves of Calls for Advice which have been open for consultation in the industry as well. These

Insurance Regulation and Supervision
97
answers have been relatively high-level, drafting principles, fundamentals, and guidelines rather than proposing a concrete text. Such a text has yet to be published, which makes it difficult to evaluate the real meaning behind the principles and ideas that have been published. When comparing the Solvency II process to the Basel II process in banking, we observe that the banking industry and the Basel II process have benefited enormously from the step from the first towards the second Consultative Paper. While the first Basel II Consultative Paper (1999)70 drafted principles and leading thoughts, the second Basel II Consultative Paper (2001)71 basically drafted the final framework with the exception of operational risk methods for which an additional Consultative Paper has been drafted (Summer 2001).72 After 2001 the discussions had been on refinements and numerical calibration of the capital formulae. Generally the Solvency II process is well underway and has taken a good approach by first discussing principles before issuing detailed proposals. However, Solvency II has major problems in taking the next step towards issuing proposals. It seems like it has difficulties in entering a next phase of the process. Moreover, we see that the insurance industry is ready for the next phase and complains on the delays in the discussions on principles.73
3.5 SOLVENCY II: THE FRAMEWORK
The anticipated Solvency II framework consist of three mutually reinforcing pillars (see Figure 3.5). The three-pillar structure is also present in the banking supervisory framework of Basel II. Benink74 and Doff75 discuss the functioning of the three pillars in the Basel II context. Public disclosure (in pillar 3) results in investors who can evaluate the risk of the insurance firm and reward good risk management through credit spreads and stock rates. Because public disclosure cannot always work effectively, the insurance supervisor has specific powers through pillar 2. It has more expertise than investors to evaluate the risk profile and has the powers to take measures if the risk is excessive. The focus of pillar 2 is the discussion between the supervisor and management of the insurance firm. Pillar 1 acts as a floor.

Risk Management for Insurance Firms
98
For the Solvency II framework, the functioning is the same as in Basel II, but the specific elements in the three pillars differ:76 Pillar 1: rules on technical provisions, asset management and solvency
capital; Pillar 2: objectives, responsibilities, powers and co-operation of insurance
supervision authorities as well as the role and responsibilities of the insurance companies’ management in the areas of corporate governance, internal controls and risk management;
Pillar 3: disclosure, publicity and market discipline.
I II III
CapitalRequirements
SupervisoryReview
MarketDiscipline
Valuation of Technical Provisions,Solvency Requirements,
Rules on Asset Management
Powers of Supervisory Authorities,Solvency Control Levels
Disclosure
Solvency II Framework
Figure 3.5: Solvency II is Built around Three Pillars
Little discussion has been on the risk categories to be included in the framework. IAA has provided a comprehensive risk classification that has been directly copied into the Solvency II framework77 to all stakeholders’ satisfaction,78 although IAIS has proposed an alternative risk classification.79 The IAA classification encompasses:80 underwriting risks, credit risks, market risks, operational risks, and liquidity risks. A capital charge is developed for each risk category. Each of the risk categories may be further subdivided into a number of parts. Per subcategory of risk, IAA proposes three components of risk:81 volatility, uncertainty, and extreme events (see also section 1.6). IAA proposes a capital requirement framework for all risks, including capital charges for all risk components.82 This makes it extremely elaborate and complex. As Pillar 2 and 3 are less relevant for our research, we will concentrate on Pillar 1 issues. Nevertheless, we recognise the importance of additional supervision. Moreover, there is a clear need from the insurance industry to

Insurance Regulation and Supervision
99
harmonise the various supervisory regimes internationally. Insurance regulation has been very fragmented internationally while insurance groups are gradually acting on a global basis.83
3.5.1 Issues in Pillar One Pillar 1 contains rules on technical provisions, asset management and solvency requirements. This is wider than the Basel II definition of Pillar One, which contains solvency requirements only. In general economic terms solvency includes the ratio of the equity to total assets.84 Bos85 and Bos and Bruggink86 describe the importance of solvency and solvency regulation the financial industry and more specifically in banking. In the Solvency II perspective however, solvency encompasses the adequacy of technical provisions as well. Traditionally, insurance supervision has focussed on adequacy of technical provisions and asset management rules as well. With respect to this, the European Commission remarks that the term solvency has three notions:87 Firstly, it relates to solvency margin for instance referred to in the European
Directives. Secondly, it is more general in nature and relates to all aspects that
determine the soundness of an insurance firm. It includes adequacy of technical provisions, assets covering these provisions and the solvency margin requirement.
Thirdly, it is even wider, including forward-looking elements that are not purely financial.
The second notion is in line with the Insurance Core Principles of IAIS88 and its Principles on Capital Adequacy and Solvency.89 In the Solvency II framework, Pillar 1 covers the second notion. This means that the term solvency in Solvency II framework is wider than in the Basel II context in banking. Pillar 1 consists of regulations for technical provision valuation as well as minimum capital requirements. A multitude of comments from the industry have stressed the importance to fair value90 and a total balance sheet approach.91 As discussed in section 2.5, the fair value consists of the best-estimate plus a market value margin. The discount rate should be based on a risk-free yield curve.92 Most stakeholders suggest a percentile approach for the market value margin. CEA93 suggests a cost-of-capital approach as discussed in section 2.5.

Risk Management for Insurance Firms
100
Also, there is a fear that additional prudence in the technical provisions will lead to too high solvency requirements94 which is in fact double counting.95 “For solvency purposes, the focus should be on best estimate liability and the level of prudence should have no impact on the total capital requirement”96 Pillar 1 includes two forms of minimum capital requirements: Minimum Capital Requirements (MCR) and Solvency Capital Requirements (SCR). The MCR is the ‘hard’ minimum. It is defined as “ … a measure […] at which the risks to new policyholders would be unacceptable even on the short term; or the point at which it ceases to be economically rational for the undertaking to be recapitalised…”97 The SCR is a ‘target’ level of capital which “…enables an insurance undertaking to absorb significant unforeseen losses over a specified time horizon and gives reasonable assurance to policyholders that payments will be made as they fall due.”98 On a going concern basis, the SCR will probably receive most attention for individual insurance firms. Would a firms available capital base drop below the SCR the supervisor will take action according to the Supervisory Ladder of actions,99 varying from close observation to active restructuring by the supervisor. Next to this, comments from various parties (mostly CEA, IAIS, IAA) resulted in including a third parameter: Target Capital Requirement. Additional prudence in the technical provisions may off-set solvency. This is because prudence as well as solvency is intended as a buffer to absorb deviations from the expectations or: risk (c.f. Unexpected Losses). According to the various parties, it is a matter of determining the desired buffer size and then allocating this buffer to provisions and capital requirements rather than an issue of prudence and solvency levels in isolation. CEA calls the desired buffer size the Total Capital Requirement.100 Figure 3.6 highlights this issue. Despite the comments, CEIOPS did not adopt this method to date.

Insurance Regulation and Supervision
101
Assets
(government)bonds and other
asset classes
Liabilities
Prudence
Equity
Assets
(fair value)
Insurance Balance Sheet
Liabilities
(fair value)
AvailableCapital
Liabilities
(best-estimate)
Market ValueMargin
SolvencyRequirement
Figure 3.6: Total Capital Requirement Related to Prudence and Solvency Requirement
3.5.2 Solvency Capital Requirement (SCR) Calculation methods for SCR show a menu-based approach101 of simple standard formulae and more advanced internal models. There is much discussion102, 103 on the fair valuation methods for the purpose of solvency requirements, even though CEIOPS adopts these principles.104, 105 CEIOPS proposes calibrating the formulae on Tail-VAR106 with a 99.5% confidence level and a one-year time horizon.107 The discussions on the standard formulae focus108 on the calibration rather than the formulae themselves. On the formulae CEA states that factors should generally be much simpler than scenarios, in order to be applicable to the wide variety of insurance firms.109 CEIOPS combines factor-based and scenario-based methods for the Standard SCR (table 3.7). For extreme event risks, CEIOPS adopts a scenario method especially for underwriting risk.110

Risk Management for Insurance Firms
102
Risk category Risk Component Approach Volume measure Mortality Expense Factor Technical provisions
Lapse Scenario Lapse rate (e.g. 100% rise)
Underwriting Risk (Life)
Morbidity (not yet included)
Premium Factor (or: scenario)
Earned premiums (combined ratio)
Underwriting Risk (Non-Life)
Reserve Factor Technical provisions Equity Interest Rate Real Estate
Market Risk
Currency
Scenario (stress testing) Market value
Securities/Bonds Counterparties (e.g. reinsurer) Intermediaries
Credit Risk
Credit Spreads
Factor Ratings or credit spreads
Operational Risk Factor Premiums or technical provisions
Table 3.7: Risk Measures in the Solvency II Standard Formulae
3.5.3 Minimum Capital Requirement (MCR) and the Relation to SCR The relation between SCR and MCR is still unclear. There are various viewpoints on this. Firstly, CEIOPS considers relating the MCR to the current solvency requirements.111 Advantages are the simplicity in use and the little amount of workload for insurance firms.112 Also, the level of MCR can be determined objectively. As some intervention measures will be related to breaching the MCR, objectivity is very important. Disadvantages are its insensitivity to risk,113 which “… imports all the disadvantages of the old system into the new one.”114 Secondly, it is proposed to define MCR as a certain percentage of the SCR calculated via the standard formula.115, 116 Its major advantage is its risk-sensitivity. Also, once the SCR has been calculated, it is simple to derive the MCR from that. This decreases the administrative burden for insurance firms.117 Disadvantages include the subjectivity and assumptions used in the models. After all, the MCR may trigger supervisory intervention, so there is much at stake for arbitrage here. Thirdly, as a variant of the method above, it is possible to determine the MCR with the same model (probability distribution) as the SCR but with a lower level of confidence. CEA118 mentions this approach only in a footnote. Hence, it is not very developed. Advantage of this method is its ease in use for insurance firms

Insurance Regulation and Supervision
103
calculating two variables with the same model, especially once probability distributions are available.
3.5.4 Internal models for the SCR In line with requirements of the European Committee,119 CEIOPS allows the use of internal models for all risk categories,120 as well as partial use of internal models.121 According to IAIS, the main advantage of internal models is its sensitivity to risk.122 Guidance on the model structure of internal models is limited, both in the EU’s Calls for Advice123 and CEIOPS’s answers.124 The focus is on compliance and approval criteria, apart from supervisory prescribed calibration parameters (at least 99.5% confidence level and a one-year time horizon). The conceptual idea behind the inclusion of internal models for the purpose of solvency requirement is already present in the banking area with Basel II125 and the market risk Amendment in 1996.126 Generally, we highly agree with the benefits of such a system for Solvency II. Generally, the insurance industry encourages the admissibility of internal models in Solvency II. However, comments have been made to for instance back-testing procedures, supervisory prescriptions and the approval criteria.127 The CRO Forum states that the “…approach to internal models is overly prescriptive, creating a variant of the standard formula.”128 We do highly disagree with this statement.129 Van den Tillaart130 designed a framework for the development of risk models. One of her conclusions is that it is necessary to have a temporary model before refinements can be implemented. When considering the Basel II process in banking, we conclude that despite limitations, Basel II has provided an enormous impetus for the development of credit and operational risk models. Most stakeholders in the banking industry have benefited from Basel II prescribing an internal model structure. Given the current state of economic capital models in insurance firms (see previous chapter), we would argue that more guidance (on what risk models might look like) has great potential to speed up the model development process for individual insurance firms. Hence, we would say that the current CEIOPS proposals are too limited rather than too elaborate in their prescriptions for model structure.

Risk Management for Insurance Firms
104
3.5.5 Regulation of Assets Traditionally, insurance supervision has included rules on assets to limit the risk in the assets in order to protect the policyholders’ future cash flows. The current E.U. regulations contain only rough rules on asset management.131 New proposals require that “…an insurance undertaking shall have an appropriate investment plan…”132 In the Calls for Advice, the European Commission aims to set rules for asset management and ALM, for instance by drafting solvency requirements for asset risks and qualitative requirements to an insurers investment plan.133 Also, the European Commission encourages the use of ALM mismatch models and models for investment planning.134 Although these issues may sound like Pillar 2 issues, the European Commission explicitly aims to set qualitative requirements in Pillar 1 as well. In their answers to the first wave of Calls for Advice, CEIOPS drafted requirements on:135 Limits for assets, asset-liability mismatch, and concentrations in Pillar 1; Risk sensitive capital requirements under Pillar 1; Detailed analysis of market, credit and liquidity risk under Pillar 1; Requirements for the investment plan on issues like asset allocation, asset
mix, and sensitivity to risk under Pillar 2. CEIOPS expects that the risk-sensitive capital requirements will be most effective. Next, it states that there should be no difference between rules on the assets covering MCR and SCR.136 In addition to the answers above, CEIOPS suggests a list of eligible assets or asset classes.137 This proposal has been heavily criticised by the insurance industry. For instance, the CRO Forum states that “… a prescriptive approach for assets duplicates the role of the SCR.”138 It would see a role for disclosure rather than a list of eligible assets or limits on concentration, assets or asset liability mismatches. Still, consensus on this issue as well has yet to be reached. We strongly disagree with a prescriptive approach for the assets. For a particular insurance firm, the total available capital is limited and, through the existence of solvency requirements, so is the maximum total amount of risk of its activities. Theoretically, there should be no difference whether these risks are underwriting risks or asset risks. For both risk categories, there should be

Insurance Regulation and Supervision
105
sufficient available capital to absorb the risks. Let us assume two insurance firms A and B. Firm A has reinsured all underwriting risks, but there is a mismatch position. Firm B bears all underwriting risks itself, but there is no mismatch position. A policyholder should be indifferent towards these risk and therefore, should have no preference in taking out an insurance policy. As a result, we strongly disagree with a separate approach for assets because the solvency requirement serves to absorb the asset risks.
3.5.6 Preliminary Findings Sections 3.4 and 3.5 so far discussed the status and the structure of the Solvency II project. The project started in 2002, but really gathered pace in 2004 and 2005 through three waves of Calls for Advice. Initially the insurance industry lacked an appropriate forum to discuss the Solvency II issues, but in the end various bodies provided comments and input to CEIOPS. Solvency II is built upon a three-pillar framework, similar to Basel II. We discussed the following Pillar 1 issues: Technical provisions are based on fair value. It should be avoided that the
market value margin interferes with the operation of the solvency requirements. The market value margin should be based on a cost-of-capital approach (see section 2.5);
There are two solvency requirements (MCR and SCR). The relation between these two is still unclear;
The standard formulae for SCR are still to be determined. It will be a combination of scenario- and factor-based approaches;
For internal models, there is too little guidance on model structure; Rules on assets interfere with the correct operation of the solvency
requirements.
3.6 SOLVENCY II AND BASEL II: SOME REMARKABLE ISSUES…
Given the convergence between insurance and banking and the major supervisory reforms in both industries, it is inevitable as well as extremely interesting to compare Solvency II and Basel II. The previous sections describe the Solvency II process and the important issues. Issues on Basel II have been described by Bos,139 DNB,140 Van den Tillaart,141 Doff,142 and Benink.143 This

Risk Management for Insurance Firms
106
section looks at the contents and the process of the two supervisory frameworks. This section will discuss the following issues: 1. The interplay between technical provisions and capital requirements make
Solvency II more complex than Basel II; 2. Solvency II has one more objective than Basel II: harmonisation of national
regulation; 3. The insurance industry has lacked a discussion forum to facilitate the
process; 4. Basel II was to increase risk-sensitivity, whilst Solvency II is to design risk-
sensitivity in the first place; 5. Solvency II aims for the ultimate right solution whilst Basel II includes
pragmatic solutions; 6. Solvency II includes all risks whilst Basel II excludes for instance interest
rate risks; 7. Basel II prescribes a structure of internal models, whilst Solvency II
provides little guidance on such a structure. Ad 1: The interplay between technical provisions and capital requirements make Solvency II more complex than Basel II There is an important difference between banking and insurance. While banks have asset- and mismatch-related risks, insurers have liability-related risks as well. Therefore, they have to set technical provisions when an insurance policy is issued. This is different from banking provisions,144 set only at the moment when there are signals that a credits cannot be repaid by the client. Traditionally, insurers have provisioned prudently in order to absorb risks in the liabilities. Including risk in capital requirements as well, raises the issue where to allocate risk: technical provisions or capital requirements. This makes Solvency II more complex than Basel II. Ad 2: Solvency II has more objectives than Basel II: harmonisation of national regulation Basel II (and Basel I) explicitly state that the objective of the supervisory framework is twofold: a level playing field and a sound financial system.145 The latter includes avoiding spill-over effects from one bank to another, i.e. avoiding

Insurance Regulation and Supervision
107
bank runs.146 The Basel framework does not aim at avoiding losses for individual debtholders. The insurance framework, on the contrary, aims to avoid losses even for individual policyholders.147 Insurance firms being less intertwined148 than banks and are less exposed to the risk of runs, may imply that the insurance industry bears less systematic risk. However, because insurance firms are large investors as well, spill-over effects may occur. Therefore, the insurance industry does bear systematic risk and Solvency II is to manage this risk. In addition, Solvency II aims at harmonising national insurance regulations. Perlet draws a parallel between the current insurance industry and the fragmented banking industry prior to Basel I.149 Solvency II explicitly aims to harmonise national supervisory systems.150 Apparently Solvency II has to catch up a disadvantage of insurance supervision compared banking. Ad 3: The insurance industry has lacked a discussion forum to facilitate the process In banking, the Basel Committee was the most logical platform for the Basel II reforms from the start. Moreover, the Basel Committee – a group of central bankers from 12 countries – has been an inspirator for supervisory issues for a long time. For the major task to reform the banking framework, the Basel Committee was the most logical platform. Moreover, the Basel Committee has been able to have an efficient discussion, with only 12 member countries while taking into account all comments from stakeholders. Comments that came in an overwhelming sense from the banking industry. Apparently stakeholders have been able to find the Basel Committee to submit their response to. The insurance industry, has to date, lacked such a forum. Section 3.4 describes that the Solvency II discussion is steered from the European Committee and guided by CEIOPS. Hence, the discussion takes place immediately in the centre of the political interplay of a multitude of countries. Generally politicians are likely to have a less clear view on the insurance industry than the Basel Committee has on banking. Also, it has been unclear for quite some time which institution was the best equipped to guide the discussion. CEIOPS practically started its work Spring 2004 whilst Solvency II had been announced in 2002. Industry participants have had difficulties in finding the appropriate place to submit their comments to. As an example, CEIOPS had over ten times less responses to their consultations than the Basel Committee. Given the controversial issues and the nature of the

Risk Management for Insurance Firms
108
responses, we cannot convince ourselves to believe that this is due to industry-wide agreement on the issues. Apparently, the Solvency II project is at a disadvantage without an appropriate and powerful discussion platform. This may result in less industry influence on the outcomes of the total Solvency II project. Ad 4: Basel II was to increase risk-sensitivity, whilst Solvency II is to design risk-sensitivity in the first place Whilst the 1988-banking rules were relatively crude, they were at least risk-sensitive. Nevertheless they included some perverse incentives, like increasing credit lending to more risky sectors. The current (Solvency I) supervisory insurance framework is totally insensitive to risk. This creates an additional challenge for the Solvency II process. However, a multitude of comparison material is available, varying from simple (e.g. NAICS) to sophisticated (e.g. FTK, SST). Ad 5: Solvency II aims for the ultimate right solution whilst Basel II includes pragmatic solutions This includes two aspects: the target level of capital and the reliance on accounting information. Solvency II aims for an absolutely true level of capital by linking the capital to insolvency (confidence) levels, whilst Basel II sticks to the average existing 8%.151 However, we believe that the Basel II calibrations include a link between the level of capital in the industry and statistical confidence levels. A hidden calibration to insolvency levels does not promote transparency, but we are convinced that linking the existing 8% to the new regime has accelerated acceptance of Basel II. Solvency II – without an existing reference point – is at a disadvantage. Basel II sticks to accounting information more than Solvency II does.152 In this thesis we have observed as well that insurers’ economic capital models are fully based on economic value rather than accounting information. This may be because an in-depth revision of the solvency regime runs in parallel with the IASBs revision of the insurance accounting system. Moreover, we have the feeling that the banking risk framework has been designed pragmatically from the perspective of products and then looking at risks rather than the other way around. The insurance accounting system fails to reflect risks appropriately153

Insurance Regulation and Supervision
109
and therefore, Solvency II designs an entire new valuation framework via a “more economic approach”154 Also the Basel Committee included some pragmatic solutions, like prescribing correlation and diversification parameters or thresholds. Solvency II states to aim for real economic values for such parameters.155 The step towards full fair value and real parameters makes the Solvency II framework theoretically more correct. At the same time, it makes the framework more complex. Ad 6: Solvency II includes all risks whilst Basel II excludes for instance interest rate risks Solvency II includes more risk categories than Basel II. In Basel II, interest rate is included in Pillar 2, despite its importance as a risk category. It is excluded from Pillar 1 because it has been considered too difficult to measure objectively. Solvency II aims to include capital requirements for all risk categories, including interest rate (mismatch) risk, or ALM as it is called more often. This being a complex risk category will make the solvency requirement (and consequently the overarching framework) complex. Moreover, also complex long-term liability risks will be included.156 This is logical, as these risks are inherent in the insurance business. However, the long term nature of these risks is generally more complex than credit risk in banking.157 Both issues will make (the development of) Solvency II more complex than Basel II. Ad 7: Basel II prescribes a structure of internal models, whilst Solvency II provides little guidance on such a structure The Basel II internal model approach has a relative predefined format. For individual banks, complying with the advanced internal model approach (viz. IRB, AMA) may be challenging, but at least there is guidance. The Solvency II framework aims at a free format for the internal models for insurance firms, without any quantitative prescriptions.158 For the most advanced firms, this is unnecessary as they are likely to have an internal economic capital model in place. For slightly less advanced, but still large firms, such guidance will provide an incentive159 rather than a barrier for development. This issue is also touched upon by a group of countries commenting on the Solvency II project.160 We agree on their proposal that prescribing an internal model structure will enhance the Solvency II project and firms’ economic capital implementation processes. Nevertheless, we believe that full internal model recognition without any

Risk Management for Insurance Firms
110
prescriptions should be the ultimate aim of the supervisor. For banking, this may be achieved in a second revision of the supervisory framework, i.e. Basel III. However, we consider it too early for the insurance industry to aim for this, given the current status of economic capital models. Hence a free format for the internal models approach will be too ambitious. Summarising, Solvency is at a disadvantage position compared to banking on issues like its (harmonisation) objectives, the absence of an appropriate discussion platform and the risk insensitivity of the current framework. The latter is even increased as the liability-related risk are subject to an interplay between prudence-levels and capital requirements. Despite lagging behind, Solvency II is more ambitious than Basel II with respect to the aforementioned interplay, the full economic framework and by including more and more complex risk categories. This is depicted in Figure 3.8. This figure also makes clear that the banking Basel II is by no means the holy grail for us. Rather, we have considered Basel II ambitious as well, but nevertheless it remains a necessary transition phase on the way to Basel III, in which internal economic capital models are expected to play an even more important role.161
Solvency I(2003)
Basel I(1988)
NAIC(1993)
FTK, SST(2005)
Solvency II(2006?)
Implementedas of 2009?
Basel II(2004)
Implementedas of 2008
Solvency II Project
Basel II Project
Full risk sensitivityNo risk sensitivity
Economic Capital Models
Figure 3.8: The Solvency II Project has Extremely High Ambitions
We believe that the Solvency II project is subject to the Law of Stimulating Disadvantage having learned from the Basel II process. However, we fear that the insurance industry has been too much occupied by opposing themselves to

Insurance Regulation and Supervision
111
bankers162 and stressing the differences rather than the similarities. We fear that Solvency II is far too ambitious and is likely to fail reaching its objectives within the given timeframe. Also, we are afraid that the Solvency II project omits a necessary step in the evolution of using risk models in practice.
3.7 RECOMMENDATIONS FOR THE SOLVENCY II PROJECT
After having reviewed various national supervisory frameworks in section 3.3 and the Solvency II project in section 3.4 and 3.5, this section makes recommendations that will enhance the effectiveness of the Solvency II project. This answers our fifth research question. We agree with most of the principles that are presented in the Solvency II project, such as fair valuation of technical provision, a VAR-like solvency requirement and the allowance of internal models. These principles are all present in the frameworks discussed in section 3.3. This section will not repeat all these aspects. Therefore, all recommendations below are new insights for the Solvency II project. To increase the effectiveness of the Solvency II project, we make the following recommendations to CEIOPS: CEIOPS should publish a concrete proposal as soon as possible
This will increase speed in the process and take the industry towards a next phase in the implementation of the requirements. We have seen a similar phase in the Basel II process in banking (c.f section 3.6).
CEIOPS should prescribe an internal model structure for the internal model approach Although this may be seen as adjusting ambitions, it will enhance the implementation of internal models in the insurance industry (c.f section 3.6). This will be an intermediate stage163 towards the holy grail of full economic capital based supervision.
CEIOPS should include long term scenario analysis in Pillar 2 This is similar to the approaches in the Canadian and Dutch FTK frameworks (see section 3.3). This fits the long term characteristics of the insurance business.
CEIOPS should not limit the asset management of insurance firms

Risk Management for Insurance Firms
112
If capital requirements are risk-based, such regulation is not necessary (see section 3.5.5) and will result in regulatory burden. CEIOPS should set adequate capital requirements for ALM and market risk in Pillar 1.
CEIOPS should adopt a cost-of-capital approach for the market value margin A cost-of-capital approach for the market value margin fits best to the principle of fair value (see section 2.5). Also such an approach links into the operation of the solvency requirements (SCR, MCR).
3.8 SUMMARY AND CONCLUSIONS
This chapter answered the fourth and fifth research question. Section 3.2 started explaining the current Dutch framework for insurance supervision and showed that a revision of that framework is needed. The current solvency requirements include some perverse incentives. Section 3.3 discussed that insurance supervisors around the globe are currently in the process of reviewing their supervisory frameworks. We reviewed the Australian, Canadian, Dutch, and Swiss supervisory frameworks. These will be taken into account by the major European project of Solvency II. There is a trend towards risk-based supervision and allowance of internal models linked to economic capital for the calculation of the solvency requirements. The valuation of the technical provisions for supervisory is generally on a fair value basis, but the application of the market value margin differs. In general, the importance of supervision increases in the new frameworks through the inclusion of additional supervisory instruments like long term scenario analyses in addition to solvency requirements. Section 3.4 and 3.5 discuss the European Solvency II project. Although the project has been a slow starter, it is currently increasing pace. Section 3.6 compares Solvency II with its banking equivalent Basel II. We have argued that the Solvency II project lags behind Basel II but is far more ambitious. Although we think that Solvency II is subject to the law of Stimulating Disadvantage, we fear that delays in the process will occur.

Insurance Regulation and Supervision
113
The answer to the fourth research question is that supervisory systems are currently being redesigned in various countries and also on an European level through the Solvency II project. New frameworks are increasingly risk-based and include internal models to determine the solvency requirement. In addition they are mostly based on fair value principles. Section 3.7 answers the fifth research question by making new recommendations to the Solvency II project that have not been topic of discussion so far in the Solvency II project.

Risk Management for Insurance Firms
114
NNOOTTEESS TTOO CCHHAAPPTTEERR 1 EEC/79/267, art. 19 and EEC/73/239, art. 16 for Life Insurance and Non-Life Insurance respectively. 2 Supervisory reporting distinguishes public statements as well as non-public statements of which the former are publicly available at DNB. (see WTV 1993, art. 72). 3 EU (2002), IP/02/252 4 MOW (2004), p. 15 5 CEA, MOW (2005), p. 2 6 CEA, MOW (2005), p. 2 7 AAA (2002), p. 3 8 Basel Committee on Banking Supervision (1988) 9 Pottier, Sommer (1997), p. 194 10 APRA (2003) 11 APRA (2005-b), GPS 110 12 APRA (2005-b), GPS 110.3, p. 3 13 APRA (2005-d), GPS 210, art. 9 14 APRA (2005-d), GPS 210, art. 10 15 APRA (2005-d), GPS 210, art. 30 16 APRA (2005-b), GPS 110.2, art. 1 17 APRA (2005-b), GPS 110.2, art. 3-5 18 APRA (2005-b), GPS 110.2, art. 7 19 APRA (2005-b), GPS 110.2, art. 10 and art. 11 respectively 20 OSFI (2004), p. 1-1-1 21 OSFI (2004), p. 1-1-1 22 OSFI (2004), p. 3-1-2, 3-1-3, and 3-1-7 respectively. 23 OSFI (2004), p. 4-1-1 24 OSFI (2003-a), p. 3 25 OSFI (2003-a), p. 18 26 OSFI (2002), p. 11 27 OSFI (2002), p. 1 28 OSFI (2005), p. 5 29 OSFI (2003-b), p. 28 30 At the time of issuing the consultative paper, the Dutch insurance supervisor ‘Pensioen- & VerzekeringsKamer’ (PVK) was about to merge with the banking supervisor ‘De Nederlandsche Bank’ (DNB). We will use these names interchangeably, depending on the period we refer to. 31 PVK (2004), art. 2.12 32 PVK (2004), p. 1 33 See e.g. Verbond van Verzekeraars (2005) 34 DNB (2005-b) 35 PVK (2004), art. 4.113 36 PVK (2004), p. 48-50 37 PVK (2004), art. 4.18 38 PVK (2004), Annex 2 39 PVK (2004), art. B4.46 40 PVK (2004), art. B4.54 41 PVK (2004), art. 4.92 42 PVK (2004), art. 3.13 43 PVK (2004), art. 3.40 44 PVK (2004), art. 3.41 45 PVK (2004), art. 3.46 and 3.47 46 PVK (2004), art. 5.16 47 FOPI (2004-c), p. 8 48 FOPI (2004-c), p. 7 49 FOPI (2004-b), p. 10

Insurance Regulation and Supervision
115
NOTES (CONTINUED) 50 FOPI (2004-d), p. 20 51 FOPI (2004-c), p. 12 52 FOPI (2004-c), p. 15 53 FOPI (2004-c), p. 14 54 FOPI (2004-d), p. 26 55 FOPI (2004-c), p. 17 56 FOPI (2005), p. 2 57 This thesis does not research the conceptual differences of the two measures. Neither does it aim to investigate the consequences of choosing either of the two measures. For more details, please consult Artzner et al. (1999) 58 EU (2002), IP/02/252 59 EU (2002), MARKT/2535/02-EN 60 EU (2002), MARKT/2539/03-EN 61 See Doff (2004) chapter 4 for an overview of Basel II. 62 Decision 2004/6/EC of the European Commission of 5 November 2003 63 EU (2004) MARKT/2506/04-EN 64 EU (2004) MARKT/2515/04-EN 65 EU (2005) MARKT/2501/05-EN 66 For instance, the 1st Wave of Calls for Advice was mostly on these issues. 67 IAIS (2003-a), most of the Insurance Core Principles are on different issues than solvency and prudential supervision. 68 IAIS (2002), Principle no. 5 69 Stevens (2005), p. 7 70 Basel Committee on Banking Supervision (1999) 71 Basel Committee on Banking Supervision (2001-a) 72 See Van den Tillaart (2003) for an elaborate analysis of the Basel II processes on the issue of operational risk. 73 A comment made at an Solvency II conference received a thunderous applause from industry participants. (CEA conference, Brussels, 14 November 2005) 74 Benink (2005), p. 34 75 Doff (2004), p. 104 76 EU (2003) MARKT/2509/03-EN, part 3, p. 17 77 CEIOPS (2005-b), art. 10.34 78 EU (2004), MARKT/2515/04-EN, p. 22 79 IAIS (2000), p. 9-11 80 IAA (2004), section 5.2 81 IAA (2004), section 5.1.3 82 IAA (2004), chapter 6, 7 83 Perlet (2005), p. 2 84 Dorsman (1997), p. 77 85 Bos (1999), p. 134 86 Bos, Bruggink (1996), p. 91 87 EU (2002), MARKT/2535/02, p. 11-12 88 IAIS (2003-a), ICP 18-23 89 IAIS (2002), p. 4 90 CEA (2005-a), p. 3 and CRO Forum (2005-a), p. 2 91 IAA (2004), p. 20 92 This contradicts common actuarial valuation methods: actuarial pricing includes discounting by a higher rate as to reflect expected future investment income (prudentially determined). See e.g. Booth (1999), p. 11 93 CEA (2005-a), p. 19 94 CEA (2005-a), p. 19

Risk Management for Insurance Firms
116
NOTES (CONTINUED) 95 CEA (2005-a), p. 3 96 CEA (2005-f), p. 3 97 CEIOPS, (2005-b), art. 9.2 98 CEIOPS, (2005-b), art. 10.1 99 CEIOPS, (2005-b), art. 15.29 100 CEA (2005-a), p. 19 101 EU (2003), MARKT/2539-03, section 3.4.3 102 CEA (2005-a), p. 7 103 CRO Forum (2005-a), p. 6 104 CEIOPS (2005-b), art. 10.17 105 CEIOPS (2005-b), chapters on CfA7 and CfA8 106 CEIOPS (2005-b), art. 10.25 107 CEIOPS (2005-b), art. 10.28 and 10.29 respectively. 108 As an example, CEA spends over one page on the calibration principles and five lines on the formulae. See CEA (2005-a), p. 7 109 CEA (2005-a), p. 8 110 CEIOPS (2005-b), art. 10.76 111 Current E.U. regulations, see section 3.2 112 CEIOPS (2005-b), art. 9.18 113 Current E.U. regulations, see section 3.2 114 CEA (2005-a), p. 5 115 CEIOPS (2005-b), art. 9.60 116 CEA (2005-a), p. 5 117 In insurance supervision, administrative burden has always been an important issue. 118 CEA (2005-a), p. 5 119 EU (2002), MARKT/2535/02, art. 210 120 CEIOPS (2005-b), art. 11.6 121 CEIOPS (2005-b), art. 11.76 122 IAIS (2002), art. 29 123 EU (2004), MARKT/2515/04 124 CEIOPS (2005-b), chapter 11 125 Basel Committee on Banking Supervision (2004) 126 Basel Committee on Banking Supervision (1996) 127 CEA (2005-a), p. 9 and CRO Forum (2005-a), p. 7 respectively 128 CRO Forum (2005-a), p. 8 129 …although we recognise the political importance of the statement and the concerns for overly supervisory interference. 130 Van den Tillaart (2003), Chapter 3 131 WTV (1993), art.66.5 132 EU (2005), MAKRT/2507/05-EN, art. 22 133 EU (2004), MARKT/2506/04-EN, p. 16 134 EU (2004), MARKT/2506/04-EN, p. 18 135 CEIOPS (2005-a), p. 20-22 136 CEIOPS (2005-b), art. 19.2 137 CEIOPS (2005-b), art. 9.100 and 9.101 138 CRO Forum (2005-a), p. 5 139 Bos (1999), p. 191 140 De Nederlandsche Bank (2003), p. 53 ff. 141 Van den Tillaart (2003), chapter 4 142 Doff (2004), chapter 4 143 Benink (2005), p. 34

Insurance Regulation and Supervision
117
NOTES (CONTINUED) 144 Moreover, banks’ general provisions count as tier 2 capital. Basel Committee on Banking Supervision (1988), art. 19 145 Basel Committee on Banking Supervision (1988), art. 3 146 Doff (2004), p. 24, p. 99 147 Guhe, Kesting (2004), p. 4 148 New York Federal Reserve Bank (2003), p. 8 149 Perlet (2005), p. 2 150 EU (2005), July 2005, art. 8. 151 Creedon et al. (2003), p. 13 152 Creedon et al. (2003), p. 13 153 Creedon et al. (2003), p. 21 154 CEA (2005-e), p. 2 155 CEA (2005-b), p. 3 156 Creedon et al. (2003), p. 21 157 IAIS (2005-b), p. 8 158 Creedon et al. (2003), p. 46 159 Creedon et al. (2003), p. 48 160 EU (2005), MARKT/2503/05-EN, p. 10 161 Vogelaar (2002), p. 26 162 CEA (2005-e), p. 1 ff 163 Vogelaar (2002) considers Basel II as the necessary intermediary stage towards Basel III, a fully economic capital-based supervisory framework. We opt for a similar perspective for Solvency II. See Vogelaar (2002), p. 26


119
IINNSSUURRAANNCCEE IINNVVEESSTTMMEENNTTSS AANNDD
AALLMM
4.1 INTRODUCTION
The previous chapters have practically ignored the assets of an insurance firm. This chapter will discuss the risk measurements issues regarding the assets and the ALM process. Generally, performance evaluation for assets is relatively straight-forward. Both return and risk measures have been developed, undergone an evolution over time1 and are now ‘completed’. The same holds for the measurement of the mismatch position. However, this chapter will show that the controllability of the insurance mismatch position is less developed. Insurance assets are matched to liabilities through a process called Asset- & Liability Management (ALM). The current ALM framework has some serious shortcomings. This chapter answers our sixth research question ‘what is an appropriate method for the management control of an insurer’s mismatch position?’ It starts with the theoretical background on the concept of Management Control necessary to develop our framework. Then, section 4.3 discusses the current status quo for insurance firms and develops the problems in the current situation. Section 4.4 draws a parallel with banking, in which a similar problem exists – and is solved! Section 4.5 investigates how we can use this solution in the area of insurance. Whilst this principle may seem obvious for bankers, it is a totally new concept for insurance firms. Section 4.6 describes more in detail what risk measures are
CChhaapptteerr
44

Risk Management for Insurance Firms
120
used in the framework and section 4.7 provides an example. Section 4.8 concludes.
4.2 THE CONCEPT OF MANAGEMENT CONTROL
This section provides an overview of relevant issues of management control2,3,4 in general and more specifically in financial institutions. Management control is defined as the process by which managers influence other members of the organisation to implement the organisations strategy.5 It is necessary to implement such a process in organisations because of decentralisation and delegation of tasks and authorities. These are delegated in almost all organisations because they have grown too large to keep them in one hand. This holds for large organisations, but also for smaller organisations in which control is often less formal but still existent. Delegation and control are inextricably bound up. The basis for this lies in the agency theory, which describes the relation between a principal and an agent that will act in self-interest rather than in the interest of the principal. In this relation, the principal desires to evaluate the performance of the agent in order to ensure that his own objectives are achieved. On goal congruence, Anthony and Govindarajan state: “The central purpose of a management control system is to ensure ... goal congruence. In a goal congruent process the actions people are led to take in accordance with their perceived self-interest are also in the best interest of the organisation.”6 One way to achieve goal congruence is to link (not necessarily financial) rewards to the performance of the agent. Performance measures have been a central component of management control. Other theories introduced aspects like Merchant’s soft controls and personnel/cultural controls7 and Simons’ belief systems and interactive controls.8 Bruggink introduced two domains in the management control of banking:9 Banking-Financial Domain (BFD): market oriented, focussing on
effectiveness of products and positions; Technical Organisational Domain (TOD): internally oriented, focussing on
processes and efficiency. The two domains are equally well applied to insurance, although the term banking-financial domain might cause some confusion. Bruggink points out that

Insurance Investments and ALM
121
the BFD relates to positions and “output in value”.10 The insurance equivalent of this domain includes positions in underwriting risks and/or asset-related risks driven by the insurance products and the investments (c.f. the risk taxonomy of chapter 1). In order to maintain consistency with prior theoretical work, we prefer to use the term BFD here to refer to the insurance application of the same concept. Van den Tillaart11 links these two domains to the Simons’ levers of control (see Figure 4.1).12 According to the author, the concepts of economic capital and RAROC are present in all Simons’ levers of control. However, when focussing on the methods of economic capital and RAROC, she states: “The allocation of economic capital is a new method of setting boundaries on the risk taking activities … [while the] … performance measure RAROC will be integrated in the diagnostic control system.”13 Additionally, Speklé14 notices a development the management control emphasis moves from encouraging desired behaviour towards preventing undesired behaviour. We believe that including RAROC into the diagnostic control domain is a sign of the opposite, because it encourages goal congruent behaviour.
Interactive Controlsstrategic uncertainties
Belief Systemscore values
Boundary Systemsrisks to be avoided
Diagnostic Controlscritical perf. variables
Financial ControlRisk Control
TODBFD
Management Control
Business Strategy
Interactive Controlsstrategic uncertainties
Belief Systemscore values
Boundary Systemsrisks to be avoided
Diagnostic Controlscritical perf. variables
Financial ControlRisk Control
TODBFD
Management Control
Business Strategy
Figure 4.1: Management Control Components and the Relation to Risk Management
Clearly the role of economic capital and RAROC in the management control framework will be substantial. Saita describes four major applications: 15 1. Risk Measurement: uniform risk measures across all business units; 2. Risk Control: maximum limits for all units; within the limit the business unit
can determine for which risks it uses the limit;

Risk Management for Insurance Firms
122
3. Risk-adjusted Performance Measurement: evaluate performance on a risk-adjusted basis in order to compare high risk-high return activities with low risk-low return ones;
4. Capital at Risk Allocation: forward looking assignment of capital to activities with the objective to effectively and efficiently use shareholders’ capital.
Saita’s uses of Economic Capital are hierarchical in kind: each application is a precondition for the following application. For example, risk adjusted performance measurement (RAPM) is only possible if risk control is organised along the lines of Economic Capital. The emphasis of the former two applications is on the models and the calculation methods, while the emphasis of the latter two is more on the steering aspects of the business. Santomero observes “…there has been much discussion of the RAROC … methodologies as an approach to capturing total risk management. Yet, frequently, the risk decision is separated from risk analysis. If aggregate risk is to be controlled, these or similar methodologies need to be integrated into actual decision making.”16 Apparently, it is essential to link risk management into the management control process. Systems theory is an important element of management control,17 because it describes the relation between the controlling entity, the entity being controlled and the environment. While systems theory is often related to the context of cybernetics, it is very useful in explaining management control as well. Let us recall our definition of management control being the process by which managers (controlling entity) influence other members of the organisation (the controlled entity) to implement the organisations strategy (being designed in relation to the environment).
Environment
Controlling Entity
Controlled Unit
Environment
Controlling Entity
Controlled Entity
Figure 4.2: System Theory Components related to Management Control

Insurance Investments and ALM
123
De Leeuw defines the criteria for effective control in a particular system. These criteria are necessary but not sufficient conditions for effective control. De Leeuw describes:18 1. There must be an objective/goal, otherwise goal-directed influence is not
possible. 2. A model of the controlled unit must be available, such that the controlling
entity can predict the effect of its control. 3. Information on the state of controlled unit and the environment must be
available, such that the controlling entity knows what controlling measure to choose.
4. Sufficient measures should be available to react to disruptions. The variety of controlling measures should be at least as large as the variety of disruptions (law of requisite variety).
5. The controlling entity should have sufficient information capacity to transform new information into an effective control measure/action.
4.3 INSURANCE ASSETS AND THE MATCHING PROCESS
Insurance assets generally are bonds, stocks and real estate as well as off-balance derivatives. All are subject to the risk of price changes, viz. market risk. Over the 1990s an enormous amount of literature has developed on the issue of market risk measurement and management.19 However, insurance investments do not exist on a stand-alone basis, they are (mis)matched to liabilities which are also subject to market risks. Moreover, the assets are invested in such manner that they neutralise most of the liabilities’ market risk. The insurance firm as a whole runs market risks only over the mismatch position and over the free assets20 that are not covered by insurance liabilities. Once we have the two components,21 we will be able to use measures like Value-at-Risk and economic capital to determine the market risk position. This section will focus on the mismatch position firstly. Section 4.5 combines the mismatch position and the free assets. Please note that this chapter will ignore Unit Linked products and the corresponding assets. These products do not bear market risk for the insurance firm, as all investment risks are passed through to the policyholders.22 Insurance products with embedded options however, may bear additional risk. These risks

Risk Management for Insurance Firms
124
can be hedged by options or other derivatives in the market, but the exposure will have to be determined firstly.23
Assets(risk for insurer)
Unit Linked
Equity surplus
Non-UnitLinked
SolvencyRequirement
Assets(risk for client)
Assets(risk for insurer)
Assets(risk for insurer)
Insurance Balance Sheet
Unit Linked
Equity surplus
Non-UnitLinked
SolvencyRequirement
Assets(risk for client)
Assets(risk for insurer)
‘Asset-only’ risk management techniques
‘Asset-only’ risk management techniques
Matching (ALM) risk management
techniques
Figure 4.3: A Typical Insurance Balance Sheet and Relevant Components for ALM
In addition to interest rate risk, insurance firms are subject to credit risk as investments are generally not risk-free. In practice, the investment portfolio includes a well-diversified but risk-bearing bond portfolio24 (next to other investment categories). In addition, receivables from reinsurers and ART counterparties are subject to credit risk as well. Next to that, the current situation of low interest rates have induced insurers to invest a gradually increasing part in corporate bonds rather than government bonds to generate sufficiently investment returns. This increases the importance of credit risk as well. Credit risk is an aspect of asset risk that has been operational in banking and subject to an extensive amount of literature. Hence, it needs less elaboration here. We will come back to the issue in section 4.6.2. Firstly, the focus will be on interest rate risk measures. Interest rate measurement methods are classified static versus dynamic and income-based versus value-based.25 This results in four classes of interest rate measures: (1) static income-based approaches; (2) dynamic income-based approaches; (3) static value-based approaches; and (4) dynamic value-based approaches. The income-based approaches include maturity gap balance sheets and earnings-at-risk. Both methods look at the interest income and assess the sensitivity to interest rate changes. They are used in banking rather than in insurance and will therefore be ignored here. Value-based methods include duration and value-at-risk. These methods take the fair value of equity

Insurance Investments and ALM
125
as a starting point and determine the sensitivity of the value to interest rate changes. The duration method is static as it includes the evaluation of an ex ante scenario only, while value-at-risk is dynamic. Because it based on models, it includes multiple and dynamically determined scenarios to evaluate the interest rate sensitivity. The duration is a central measure in interest rate management. The duration is the average maturity of an instrument, weighted by the period in which the cash flows are received. Products with a small duration are less sensitive to interest rate changes than products with a long duration because it takes less time before cash flows are settled. Closely linked is the modified duration, which is the duration divided by one plus the interest rate. The modified duration26 measures the relative change in value when the interest rate yield curve increases one basispoint parallel. This means that if the modified duration is five and interest rates increase with one basispoint in a parallel manner, the value of that product will decrease with 0.05%. The modified duration is a relatively simple measure. Therefore, it is widely used in interest rate management. A major advantage is that durations of multiple products can be simply added to determine the total duration of a portfolio. Unfortunately, the duration is suitable for small and parallel interest rate changes only. Most often, interest rates change differently over parts of the interest rate curve.27 In an extreme case, the interest rate curve may become inverse. The duration is incapable to assess sensitivities of products to such changes. Value-at-Risk, or simply economic capital through dynamical and model-based scenarios is better able to cope with such situations.
4.3.1 Asset- & Liability Management (ALM) This section describes the ALM process for insurers. Siegelaer defines ALM as process of finding an investment policy that is tailored to the liabilities.28 Oosenbrug refers to ALM as allocation of investments to liabilities.29 Ben-Saud and Van Bergen define ALM, or liability-driven investment, as “... an investment strategy that has at its core a transparent linkage between assets and liabilities.”30 With regard to investment strategies and ALM much research31 has been done in the area of pension funds and (life) insurance firms. These
Risk Management for Insurance Firms
126
contributions focus on what we would like to call ALM studies, a periodic but infrequent re-calibration of the assets such that they would match the liabilities. It is not a permanent controlling mechanism for the total of assets and liabilities which we would like ALM to be. Smink distinguishes two forms of ALM.32 Firstly, macro-ALM consists of the strategic choices regarding the product portfolio, capital structure and the risk profile/appetite of the total firm. Secondly, micro-ALM consists of the choice for a investment strategy particularly designed to hedge the financial risks of a given liability structure. The latter is the matching process. Let us consider the matching process. It is common to distinguish two matching principles:33 Cash flow matching Duration matching.
Cash flow matching is generally considered the most prudent investment strategy. According to this principle, assets are chosen in such a manner that their cash flows resemble the liability cash flows as closest as possible. When the cash flow matching principle is applied, interest rate changes are irrelevant because the cash flow pattern of the assets will per definition suffice to satisfy the liabilities when they become due. Smink explains that this matching principle is basically “… an optimised GAP analysis.”34 The GAP analysis is a decomposition of a financial firms balance sheet in interest rate terms.35 As such it was widely applied in banking as well.36 In banking, there is a difference between liquidity technical maturity and interest rate technical repricing terms. Most of the insurance products do not have this difference: the interest rate (or: promised return) is set for the entire lifetime of the policy. Cash flow matching is especially appropriate for simple life insurance products in which the expected cash flows can be estimated relatively simple and the lifetime of policies is not too long. Extremely long-term products like pensions do not have similar classes of assets available in the market. Moreover, it may be impossible to find exactly matching products with similar risks.37 For such products, duration matching is more appropriate. Oosenbrug argues that “… duration matching provides only a next-best solution for situations in which cash flow matching is not feasible.”38

Insurance Investments and ALM
127
Duration matching consists of choosing an asset portfolio of which the duration (rather than the entire cash flow pattern) matches the duration of the liabilities.39 Van der Vliet provides a nice and compact overview of the principle of duration matching.40 The principle of duration matching is also called immunisation.41 When this principle is applied, the effect of changing interest rates on the assets equals the effect on the liabilities, so the effect to the insurance firm as a whole is zero. Due to the limitations of the duration measure, the immunisation principle has some problems in identifying the results of non-parallel or large interest rate changes. Hence, Smink proposes using scenarios for interest rate modelling and matching.42 Despite matching strategies, the accounting regulation (IFRS 4)43 requires that the valuation of the insurance liabilities should be independent of the investments, being either matched or unmatched. Under IAS 39,44 the majority of assets should be fair valued.45 Aarzen and Mourik explain that this result in an accounting mismatch because volatility of either profit and loss or equity will arise even when interest rate effects have no economic effect. The IASB recognises this issue and emphasises that an accounting mismatch should be distinguished from an economic mismatch.46 “Ideally, a measurement model would report all the economic mismatch that exists and would not report any accounting mismatch.”47 However, the IASB decided to maintain a temporary solution in anticipation of phase II of IFRS for insurance contracts.48 Aarzen and Mourik emphasise that also in a full fair value world, “…volatility of the firms equity due to interest rate fluctuations is not illogical in itself. … insurers do bear a significant interest rate risk.”49 Hence, the accounting results are an ineffective performance measure, both for the return and for the risks. The announced phase II of IFRS might resolve the problem of the accounting mismatch but in this stage it is too early to reflect on outcomes of that process.50 However, “… as long as insurers do not value their investments and liabilities at market value,51 there is no point in applying duration matching…”52… or at least, an accounting mismatch will remain to exist. With all negative side-effects of (non-) transparency and inconsistency attached to it.
Risk Management for Insurance Firms
128
The wealth of econometric and actuarial literature includes models for asset allocation based on the liabilities. The modern line of theories53 started with Wise54 and Wilkie55 in the 1980s and from there has been extended.56 The models are generally of the form that they either maximise return on conditions of limited volatility of equity value or minimise the volatility of equity on a conditional minimum return. We will not go into detail on the econometric models here.57 We conclude that the area of ALM is focused on what Ben-Saud and van Bergen call ‘liability-driven investment,’58 rather than what we would describe here simultaneous ‘investment-oriented underwriting.’ Apparently, the product related part of what Smink calls the macro-ALM59 has received little attention.
4.3.2 Management Control of ALM Kleynen describes the following elements of ALM:60 Investment policy: composition of asset portfolio, including (interest rate)
risk management. Such policies exist at a strategic, tactical and operational level.
Indexing policy – especially relevant for pension funds. We will ignore this component here.
Actuarial policy: the evaluation of underwriting risks and actuarial assumptions.
Premium policy: relates to the risk appetite. In traditional actuarial terms, investing more in stocks means higher investment return and lower premiums, while investing more in bonds means lower investment returns and higher premiums. We expect that the cost of risk through economic capital will compensate for this effect, once adequately priced in the policies.
Extending the elements of Kleynen, the price of an insurance policy is based on actuarial assumptions of the underwriting risks (viz. claims, mortality) as well as the expected investment income involved, i.e. expected interest rates. In line with our previous insights (c.f. section 2.2) in risk management and performance evaluation, the concerns should not be ‘what are claim amounts?’ but rather ‘what are claim amounts compared to expectation?’ Hence, the actual performance of the insurance policy depends on:
Insurance Investments and ALM
129
Underwriting results: did underwriting variables (e.g. mortality) develop according to expectation? Underwriting results relate to bearing underwriting risks.
Investment results: did investment variables (e.g. interest income) develop according to expectation? Investment results are driven by bearing investment risks.
At this moment, these two components are evaluated integrally and over the entire term of the policy. From a conceptual point of view, these elements are separable. Firstly, this is because instruments to alter the position/exposure are different. Instruments to alter the underwriting position are for example reinsurance, whilst the interest rate exposure may be altered through derivatives or portfolio changes. Secondly, the integral representation of the result fails to have a steering function. The underwriting department lacks an incentive to improve underwriting results as long as investment returns are good but underwriting results are bad. The reverse holds for the investment department when investment returns are bad while underwriting results are good. Goal congruence implies that both departments aim to perform well independently from the other, in order to maximise performance for the organisation as a whole. As a result, the current situation is not goal congruent. Thirdly, there is no two-way relation between the investment policy and actuarial policy (c.f. the four elements of Kleynen). The investment policy is likely to be adjusted to fit the product pattern better when changes in the product portfolio (actuarial policy) occur. However, there is no feed-back loop that encourages the underwriting department to sell insurance policies that can properly be hedged. This holds especially for embedded options. Moreover, when management of an insurance firm desires to improve performance, these two should be viewed separately. Investment income is reported separately in the current accounting framework. 61 However, it shows the total investment income, including income on assets backed by equity. Hence, this representation does not provide us with the desired insight: how did investments perform compared to expectations? In former times, insurers mostly invested in government bonds. In modern times however, a significant part of the bond portfolio is invested in corporate bonds
Risk Management for Insurance Firms
130
(called ‘credits’) to generate additional returns (and potentially decrease policy rates).62, 63 This leaves the insurer exposed to default and credit migration risk as well as credit spread risk. Volatile credit spreads may result in value changes in the bond portfolio. At this moment, these value changes are allocated to the insurance unit and this influences the performance of an insurance unit directly. However, the insurance unit has no instruments to influence/mitigate the effects of credit spread volatility. The same holds for credit default risk. Embedded options play a significant role in insurance policies, especially guarantees in life insurance. There have been some famous examples of freely provided guarantees that caused significant losses to insurers when the embedded options got in the money.64 Whilst such guarantees are easier to value than some other retail options (e.g. mortgage prepayment65), they should be explicitly managed. This may include pricing/charging to the client but due to marketing reasons this is not necessarily so. Hedging regular embedded options is an entirely different decision (from providing), depending on the risk appetite of the insurer, the market expectations and potential natural hedges. In addition, lapse is a special option, but it cannot be hedged at the financial markets. In addition, actuarial guarantees like the so-called U-return guarantees cannot simply be hedged by options available in the market. The so-called U-return is the return on a selected set of government bonds with maturities from 2 up to 15 years.66 U-return guarantees can only be hedged by constantly adapting the hedge to the market circumstances. For both regular guarantees and unhedgeable options (like lapse) problems may arise: which unit is responsible for the option? The investment unit for not hedging the options or the underwriting unit for providing the option to the client without any charge? We are of the opinion that underwriting units should be made aware of the implicit options in their products; and that these may be costly.
4.3.3 Current problems in ALM There are two major problems in the current situation. Firstly, not all conditions for effective control (c.f. section 4.2) are satisfied. Secondly, there is not necessarily goal congruence for the organisation as a whole and the segments.
Insurance Investments and ALM
131
The current situation violates the second, third and fourth condition for effective control: Management has an inadequate model and inadequate information of the
state of an insurance policy as performance is measured integrally (violation of condition 2 and 3);
The same holds for risks (violation of condition 2 and 3); The insurance unit lacks the appropriate instruments to influence effects of
all value changes of investments. This includes value changes due to credit spread and default as well as embedded optionalities (violation of condition 4);
The current situation does not enhance goal congruent behaviour because: The insurance unit has no incentives to design products that can be easily
matched on the financial markets. There is no feedback from the investment units to the insurance units.
The insurance unit has no incentives that limit them from granting free embedded options, which are costly for the investment unit and as a result for the organisation as a whole.
The investment centre is incentivised by the underwriting centre (rather than management) to invest in more risky securities when the latter wants to set a lower premium.
The next section evaluates the method with which banks resolved similar problems. Section 4.5 tests whether this method can be used in insurance.
4.4 MATCHING AND TRANSFORMATION WITHIN BANKING
A similar matching issue exists in banking. A banks business model is built upon the typical form of interest rate curves (higher rates for longer maturities). As a consequence, banks can borrow short (and cheap) and lend long. This transformation67 of maturities incurs interest rate risks, which has been extensively described in literature.68 The transformation function of banks raises the issue on how to allocate the interest rate margin and consequently interest rate risk.69 Let us consider a bank issuing a 10-year mortgage of € 100,000 at 6% funded with a € 100,000 savings deposit at 3%. Combined, these two transactions are quite profitable: the interest rate margin is 3%, i.e. € 3,000.

Risk Management for Insurance Firms
132
Now, should we allocate the profit to the savings deposit or to the mortgage loan? As neither is uniquely responsible for the profit, this issue has been topic of extensive studies. Schierenbeck develops the Marktzinsmethode70 (market-rate method) in which the contract-rate of a transaction is compared with a transaction with equivalent maturity characteristics (both interest rate specific and liquidity specific characterstics) on the interbank market. Bos and Bruggink relate the Marktzinsmethode to the economic principle of opportunity costs.71 The performance of the above-mentioned mortgage would then be determined by the difference between the contract-rate (here 6%) and the rate of a 10-year interbank loan. Figure 4.472 is a graphical representation of our example above and the application of the Marktzinsmethode. The total result (of € 3,000) is separated into three components: a commercial margin on the mortgage (€ 1,000), a commercial margin on the savings deposit (€ 500), and a transformation result (€ 1,500). Mortgage 6,000€ 3,000€ Savings Deposit(6%, 10 yr fixed) (3%, variable)Interbank Loan 5,000€ 3,500€ Interbank Loan(5%, 10 yr fixed) (3.5%, variable)Commercial Result 1,000€ 500€ Transformation Result 1,500€ = (5%-3.5%) x 100,000Total Result 3,000€ = 1,000 + 500 + 1,500
Figure 4.4: Marktzinsmethode Splits Banking Result Components A central aspect in the Marktzinsmethode is the transfer price. In the opportunity cost perspective, the performance of an unit must reflect the additional return over other opportunities.73 As interbank opportunities are widely available for the bank, it is common to take the interbank rates as transfer prices.74 In banking there is a typology of transactions along the lines of fixed/variable interest rates and repayment schedules.75 A transfer price is set per transaction category that reflects the best opportunity.76 This transfer price schedule safeguards goal congruent behaviour of commercial units. The concept of the Marktzinsmethode is quite appealing, as it resolves the allocation of the mismatch results. However, the major advantage of the Marktzinsmethode is its controllability because it allows the “…sauberen

Insurance Investments and ALM
133
Trennung von Konditions- und Strukturergebnis.”77 Schierenbeck states “Das besondere an der Marktzinsmethode liegt nun vor allem in der Identifizierung und Abgrenzung völlig unabhängig voneinander steurerbare Erfolgsbereiche.”78 Schierenbeck states that from the controlling perspective, the Marktzinsmethode is fair on the aspect of causality as well as performance because business units can influence their contribution only through means of setting better rates than the market equivalent (i.e. transfer price). The market equivalent is “… for the bank as a whole as well as for individual business units a non-influenceable variable”79 Nevertheless, finding the appropriate alternative equivalent of particular transaction is by no means a simple task80 within the banking area because liquidity specific and interest rate-repricing specific characteristics are combined into one transfer price. Next from allocating the result components to the respective units, the Marktzinsmethode also isolates the risk components. The risk of our two original transactions (mortgage and savings deposit) included credit and interest rate risk. The Marktzinsmethode has transferred the interest rate risk to the central treasury and the credit risk stays with the commercial mortgage unit. In the principle of the Marktzinsmethode, the treasury plays a central role in the bank. In its basic form, transactions are indeed closed with the treasury, both on the assets’ and the liabilities’ side.81 Therefore, our example above consists of four transactions. However, practical extensions may include transactions on the level of portfolios rather than individual instruments. The mismatch position and consequently the transformation result is entirely run from the book of the treasury.82 The major advantage is that it is easily steered in this way. The mismatch position can be increased or decreased with simple transactions like swaps. From a risk management perspective this is an enormous advantage. Moreover, in absence of the treasury neither of the commercial units would have an incentive to limit the interest rate risk. This urges for the application of a treasury even more. In addition to managing the mismatch, the treasury has a communication function to the commercial entities. By communicating the transfer prices to them, it provides important pricing information.83 Summarising, this section showed that banks have a mismatch position between their assets and liabilities. This involves interest rate risk that

Risk Management for Insurance Firms
134
materialises when interest rates increase. The latter causes more frequent repricing of the liabilities than the assets. When observed integrally, management cannot effectively control the business because result components are interfering. In absence of the Marktzinsmethode management would have inadequate information on performance and risk. Consequently it would be unable to control the business because it would violate condition 2 and 3 for effective control. Moreover, individual commercial units would have no incentive to manage the mismatch because neither of the units uniquely creates the mismatch position. This violates the principle of goal congruence. The Marktzinsmethode separates the mismatch results from the commercial results which, in turn, improves controllability of the respective units. Because the interest rate position is isolated at the treasury, it is managed more effectively. This holds for the interest rate result as well as the interest rate risk. Setting appropriate transfer prices encourages goal congruent behaviour for the commercial units because it will result in client rates more profitable for the bank than market opportunities (i.e. higher rates for loans, lower rates for deposits). This is beneficial for the commercial units, but also for the bank as a whole.
4.5 MARKTZINSMETHODE IN INSURANCE
The last part of section 4.4 showed that the Marktzinsmethode in banking resolves most of the problems that we have observed in insurance in section 4.3.3. The current section investigates whether we could implement the Marktzinsmethode in the context of insurance. Such an solution should satisfy the following criteria: 1. Performance (risk and return) should be measured uniquely, i.e. any
interference between different risks should be avoided; 2. Performance (risk and return) should be allocated to the unit that
drives/causes the risk; 3. The unit that the risk is allocated to should have instruments available to
manage the risk.
4.5.1 The Concept Section 3.3.2 identified two result components: underwriting results and investment results. In line, we identify two responsibility centres: the

Insurance Investments and ALM
135
underwriting centre and the investment centre. The underwriting centre is responsible for selling insurance policies for a fair actuarial price. Such a fair price takes into account underwriting risks only. The underwriting centre invests its liabilities internally at the investment centre. As a result, the underwriting centre is perfectly matched. The internal transfer price excludes investment risks. Investment risks are transferred through internal transactions to the investment centre, responsible for investments and the actual mismatch. Investment returns are generated from taking investment risks and managing the mismatch only. For the insurance liabilities, this process resembles the replicating portfolio principle,84 in which the value of the liabilities is derived from virtual asset-equivalents with the same maturities. The major difference with the Marktzinsmethode is that transactions are not closed in practice and as a result, it does promote less goal congruent behaviour. In addition to managing the mismatch position, the investment centre manages the (equity) capital base of the total insurance firm as this is close to its activities as an investor. The investment strategy of the matching position may well be different to the investment strategy of the capital base. After all, capital can be invested relatively more risky than the (mis)matched liabilities that is actually policyholders money. Figure 4.5 depicts this situation.
Liabilities
Capital
Internal transaction
(no investmentrisk)
Assets
Internal transaction
Assets (mismatch)
Underwriting Responsibility Centre
Liabilities
Capital
Internal transaction
(no investment risk)
Assets
Investment Responsibility Centre
Internal transaction
Assets (mismatch) Internal
transferprice
Liabilities
Capital
Internal transaction
(no investmentrisk)
Assets
Internal transaction
Assets (mismatch)
Underwriting Responsibility Centre
Liabilities
Capital
Internal transaction
(no investment risk)
Assets
Investment Responsibility Centre
Internal transaction
Assets (mismatch) Internal
transferprice
Figure 4.5: Structure of the Marktzinsmethode in Insurance
Whilst the banking version of the Marktzinsmethode identifies three responsibility centres (lending, deposit-taking and treasury), the insurance version would identify two separate responsibility centres. This is because the mismatch of banking in itself is profitable (borrow short, lend long). Hence, there are three separately identifiable return drivers. Clearly, that is not the case for

Risk Management for Insurance Firms
136
insurance. The mismatch an insurance firm arises because some assets are non-existent and because it is profitable to invest part of the assets in non-riskfree securities as an asset manager. Hence, there are only two return drivers, which have been identified above. Underwriting centre Investment centre Objective Managing underwriting position by
selling insurance policies Managing mismatch position and capital base by investing in asset portfolio
Performance Added underwriting fair value Fair value investment returns Risks Underwriting risk, unhegdeable
embedded options Market risks (predominantly interest rate risk) and credit risk
RAROC CapitalEconomic
value fair ngunderwriti Added
CapitalEconomic value fair investment Added
Table 4.6: Objective and Performance Measures within Marktzinsmethode in Insurance
4.5.2 The Transfer Price An important element in this concept is the internal transfer price. The transfer price should create a clear separation between the underwriting and the investment centre. It should stimulate goal congruent behaviour. As chapter 2 has described, this encompasses a fair value perspective of running the business, both for the underwriting and for the investment centre. Also, the transfer price should avoid sub-optimal behaviour of both centres. Anthony et al. argue that “… transfer pricing is not primarily an accounting tool. Rather it is a behavioural tool that motivates managers to take the right decisions.”85 In this manner, transfer pricing is used from an opportunity cost perspective. The opportunity cost principle is also the basis of the Marktzinsmethode. Because we have separated two decisions (viz. investment and risk taking), a risk-free transfer price is the opportunity cost of a risk-free investment. Kimball shows that one single transfer price for all maturities may create goal incongruent behaviour. Therefore, he proposes a transfer pricing system based on a yield curve.86 As it is important that the underwriting centre bears no investment risk, the internal transfer price should be risk-free. The most preferred transfer price with such a characteristic is the government rate, but as government bonds are not available for all maturities, the interbank swap rate could be an alternative. Again, there is a parallel with the Marktzinsmethod. By taking the risk-free rate

Insurance Investments and ALM
137
as the internal transfer price, we decompose the total risk into two mutually exclusive parts: the investment risk and the underwriting risk. See Figure 4.7. Furthermore, the transfer price based on risk-free rates for internal transactions fulfils the goal congruence criterion. This is because it clearly demarcates the difference between risk-free and risky investment of the liabilities. Hence, such a transfer pricing system satisfies Anthony’s criteria87 for effective use of transfer pricing.
Total Risk
Investment Risk Underwriting Risk
Total Risk
Investment Risk Underwriting Risk
Interest rate risk:difference between risk-free and marketrateUnderwriting risk:no risk, actuarial assumptions fixed
Interest rate risk:no risk, risk free rate fixed
Underwriting risk:difference between actuarialassumptions and reality
Figure 4.7: Transfer Price Structure
4.5.3 The Underwriting Centre The objective of the underwriting centre is to manage the underwriting position of the total insurance firm by selling policies on a fair value basis. As discussed in chapter 2, the fair value of an insurance policy is the net present value of the expected cash flows discounted by the risk-free rate and based on best-estimate expectations of the underwriting variables. When selling an insurance policy, the underwriting centre must assess all actuarial expectations to derive the expected cash flow pattern. It invests this expected pattern internally in risk-free bonds. This encourages the fair pricing of insurance policies and adequately capture the time effect of the liabilities. In addition, embedded derivatives such as guarantees must be hedged internally as well. This forces the underwriting centre to identify and quantify embedded derivatives. This avoids the writing of free guarantees or other embedded options without the sellers of the policies being charged for it.88 Because liabilities are invested internally at the product level, performance may be assessed at product level as well.
Risk Management for Insurance Firms
138
However, some embedded options like lapse are not hedgeable with financial instruments like options. Therefore, they cannot be hedged via internal transactions. These embedded options remain in the book of the underwriting centre. By explicitly identifying them, the underwriting centre is encouraged to adequately price and manage these embedded options as well. The performance of the underwriting centre is the added fair underwriting value. This is the fair value at the end of the period minus the fair value at the start of the period (see section 2.6). For new business, the performance is the created fair value by selling the policies. For existing business, the created fair value may change due to changing expectations in the underwriting variables. When underwriting variables’ expectations are stable, the performance of existing business equals exactly the risk-free rate. This value is created because the underwriting centre has gone through an additional period and the discounted future cash flows are discounted by one period less. The risk of the underwriting centre is due to outcomes of the underwriting variables compared to actuarial expectations. As discussed, economic capital is the most appropriate measure to assess this risk. The major risk for a non-life underwriting centre is volatility in claim pattern causing a direct volatility in the fair value. The major risk for the life underwriting centre is that small volatility in a particular year will magnify due to the long time horizon. Both effects are adequately captured in the economic capital on a fair value basis. As a consequence, the relative performance measure is RAROC as the ratio of added underwriting fair value and the economic capital. To manage (next to measure) the underwriting risk position, it is likely that there are underwriting limits with respect to underwriting parameters to safeguard sufficient diversification. These are limits like geographical regions, coverage, insured objects, categories of policyholders and so forth. However, the total underwriting centre is evaluated on the economic capital only. If little or no diversification exists because of specialisation, economic capital is high and consequently RAROC is low. Clearly, this creates an incentive for a non-life underwriting centre to sell life policies even though little knowledge exists within this unit. Therefore, management should limit the activities an underwriting

Insurance Investments and ALM
139
centre can perform. This is not an urgent side effect, because it is currently present in the insurance world as well. A license is needed to act in multiple lines of business, so we do not consider this a serious shortcoming at this stage. Please note that the underwriting centre is evaluated on its economic capital only. The book capital (i.e. equity) on the balance sheet of that particular legal entity does not play a role in performance evaluation. In this manner it is possible for the insurance firm as a whole to manage the available book capital base in an optimal manner, irrespective of where it is located exactly.
4.5.4 The Investment Centre The investment centre has two objectives. Firstly, it manages the mismatch position in line with the mismatch policy. Secondly, it manages the free assets that are backed by the capital position of the total insurance firm. It is likely that two separate investment plans are available for these two objectives, because they are inherently different. The mismatch policy is based on cash flow matching whenever possible, because it is the safest matching strategy. Contrary to banking, a mismatch in maturities may be unprofitable, so it should be minimised. However, the objective of the mismatch strategy is to maximise investment fair value conditional to the maturity mismatches and conditional to the risk limits for the credit and market risks. The objective for the free assets strategy is to maximise investment fair value conditional to risk limits. Risk is evaluated along the lines of economic capital and as such it is also the overarching risk limit. To operationalise this further, it is likely that there are additional risk limits for the investment centre for credit grades, geographical regions, currencies, and industries. Economic capital is determined as the change in fair value due to the various market factors and further developed in section 4.6. In addition, there may also be other risk measures like volatility of investment returns for external communication purposes.89 The performance of the investment centre is the added investment fair value. This is due to regular long-term investing and to managing credit spreads. The fair value of most asset classes are easily determined, as they are mostly

Risk Management for Insurance Firms
140
publicly traded securities. The non-traded securities like real estate and mortgages are generally valued relatively simple as valuation models exist.90 Consequently, the relative performance measure of the investment centre is RAROC.
4.5.5 Taking it All Together Let us now evaluate whether we have solve the problems we identified in section 4.3. The first problem is that an integral performance measure provides management with inadequate information to control the insurance firm as a whole. In the Marktzinsmethode, the central performance measure is fair value. Fair value is evaluated for the underwriting and investment centre respectively and then aggregated to arrive at total fair value for the entire firm. The same holds for the risk measure. In the Marktzinsmethode, the two risks are clearly separated. Therefore, the first two problems have been solved. The third problem is that the insurance unit has inappropriate measures to influence all value changes. Separating the two value components resolved this issue as well. The fourth up to the sixth problems of section 4.3.3 are related to goal-congruence. These problems have all been resolved by choosing the appropriate transfer price. Alternatives to choose different transfer prices have not been evaluated above, because the risk-free rate already satisfied our most important problem. This leads to a situation of liability-driven investments combined with investment-driven underwriting. This means that we have also satisfied the criteria in section 4.5, because performance and risk are measured uniquely and allocated to the responsibility centre that has the instrument to manage the risk.
4.6 RISK MEASUREMENT
In the concept that we have just developed, the asset risks are totally transferred to a specialised investment unit. The underwriting unit bears no market, mismatch or interest rate risk anymore. This section explains how these risks are measured and managed within the investment centre.

Insurance Investments and ALM
141
4.6.1 Market Risk Management and ALM The investment centre bears only interest rate risks and other market risks. Market risk measurement and management has been topics of an enormous wealth of literature developed over the past decade.91 Valuation of both assets and the liabilities have been extensively described.92 Interest rate models play an important role in these valuation frameworks. In line with section 4.3.1, duration is an appropriate measure for small interest rate shocks. However, in the context of economic capital we are looking for larger shocks as well. Therefore, Smink explains that scenario techniques93 are the best instruments for capturing market risks. Next to managing the (mis)match position, the investment centre is also responsible for managing the capital base. It is likely that this investment portfolio will contain more risky assets, like stocks or real estate. Risk drivers here are equity prices, interest rates, credit spreads94 and real estate values. For economic capital, an aggregate model will include models for the fair value changes for each of these risk drivers and their interactions. In the area of equity prices and interest rate risks, a wealth of literature is available on how to model these risk drivers in terms of economic capital.95 Monte Carlo simulation96 plays an important role in these methods. Commonly, each risk driver is modelled separately and then they are combined through the use of correlation factors. The interest rate risk model starts with generating interest rates from a scenario generator. The most famous interest rate models97 are the models from Vasicek98, Cox, Ingersoll, Ross,99 and Hull and White100 Per generated interest rate scenario, it is possible to determine the fair value of the assets and the liabilities and consequently the value of equity. These values are the value over an one year time horizon, consistent with the economic capital principle. When generating a sufficient amount of scenarios, one determines the total probability distribution of the value of equity. From this economic capital is the difference between the worst-case value and the expected value. Please note that, if the expected value over an one year time horizon is higher than the current value (and hence a value-profit is expected), economic capital equals the difference between the worst-case and the current value. This is because it is not sensible to hold capital against the expected profit.

Risk Management for Insurance Firms
142
In principle, the same method is used for the other market risk drivers as well: stock prices, real estate value, currency rates, and credit spreads. An important difference is that interest rates have a direct effect on the fair value of assets as well as the fair value of the liabilities. The other market risk drivers have effect on the fair value of assets only, except for embedded derivatives in the liabilities. Without embedded derivatives, there would be no need to evaluate the fair value of liabilities due to changes in these market risk drivers. One should calculate an amount of economic capital per market risk driver. Finally, these are combined through the use of correlation in order to determine the effect of diversification. In theory, there would be one model per risk driver. However, in practice we see that there are separate models for geographical regions. For instance, for Dutch insurers it is common to model European interest rates separately from U.S. interest rates. The same holds for investments in emerging markets. Because that is practical implementation of the concept we have developed, we will not discuss this more in detail here.
Worst-case risk driver
Worst-case value
Economic Capital
Value of the Assets
Worst-case value of Equity
Economic Capitalper risk driver
Worst-case risk driver
Worst-case value
Value of the Liabilities
Best-estimatevalue of Equity-/-=
• Interest rate model• Equity model• Real estate model• Credit spread model• … other models …
Worst-case value
Economic Capital
Correlations
Best-estimate risk driver
Value of Equity-/- =
Generating scenarios
Figure 4.8: Market Risk Economic Capital

Insurance Investments and ALM
143
4.6.2 Credit Risk Management In addition to market risk, the investment centre bears the credit risk of non-risk-free securities. This includes bonds and mortgages, but may as well include the credit risk on derivatives. In the area of banking, the amount of literature101 on these topics has virtually exploded due to the availability of modern credit scoring models and due to the importance of Basel II. Furthermore, some commercial credit risk models have been developed like Credit Risk, KMV and CreditMetrics.102 All of these models have been developed for the banking area but are equally well suitable for insurance firms because they are all value-based taking into account credit migration risk as well. We will not go into detail on these models here but discuss how they are used in our framework of economic capital for insurance firms. However, let us discuss a difference between banking and insurance firstly. Traditionally banks issue loans with the objective to keep the loan to maturity. When credit problems with the counterpart occur, default is the most important variable. Naturally, banks limit the loss at default by collateral. The Basel II proposals focus on default situations mostly. We see the same emphasis in the simpler credit models,103 while more advanced credit models104 look at the value of a loan (which also includes credit migration). Insurers traditionally have the objective of investing in high credit quality securities105 in order to fulfil liabilities when they become due. Here, credit standing is an important factor.106 Trading occurs when securities violate certain credit rating thresholds. For insurers, it is the credit migration rather than the credit default that is most important. Concluding, we are likely to see a difference between the simpler banking models and the insurance models. This problem is resolved by using more advanced credit models. The structure of credit models include four risk parameters:107 credit rating, credit amount, recovery rate, and credit migration. The probability of default is derived from the credit rating. The credit amount of bonds is generally fixed over the lifetime, as it is uncommon to include additional credit lines in traded securities. The other parameters are stochastic. Therefore, it is relatively simple to derive a best-estimate value and a worst-case value of a credit portfolio through simulation.108 This holds for all securities, including bonds as well as mortgages.

Risk Management for Insurance Firms
144
Worst-case risk driver
Worst-case value
Economic Capital
Value of the Assets
Worst-case value of Assets
Economic Capital Worst-case value
Best-estimatevalue of Assets-/-=
• Credit Rating• Credit Amount• Recovery rate• Credit Migration
Generating scenarios
Figure 4.9: Credit Risk Economic Capital
4.6.3 Performance Measurement through RAROC The RAROC of the investment centre focuses on the investment risks and mismatch risks only. We have explained that the investment centre is entirely run on a fair value basis. Because market prices can be observed for most securities, the fair value is not difficult to determine. However, for non-traded securities like mortgages fair values can be derived from the available valuation models that we have described in the previous sections. This includes fair valuation of embedded options like prepayment.109 Hence, the RAROC is relatively simple to determine as it is the added fair value divided by economic capital.
4.7 PRACTICAL EXAMPLE OF THE MARKTZINSMETHODE
Now, let us investigate the functioning of the Marktzinsmethode in an example. This section assumes a simple life insurance policy, bought by a 50-year old client at a premium of € 65,000 at t=0. The policy pays a lump sum of € 100,000 at age of 65 or 90% of that amount at death if earlier. For simplicity, we assume a simplified mortality rate structure: the probability that the policyholder dies at age 64 is 0.25 and the probability that he survives age 65 is 0.75. The net present value of these expected cash flows is € 1,985 for the insurer (=65,000-(14,875+48,140)) at a risk-free discount rate for a 14 and 15 year maturity as depicted in Table 4.11. For simplicity we assume a flat yield curve for two periods in the distant future. In practice, we will see a small slope. Table 4.10 shows the interest rate assumptions of this example.

Insurance Investments and ALM
145
Risk-free interest rate
Credit interest rate
8-11 year 2.9 % 3.9 % 12-15 year 3.0 % 4.0 %
Table 4.10: Example Interest Rates If mortality expectations remain stable over the period considered, the underwriting centre creates € 60 of value over the year considered. In this section, we assume a certain amount of economic capital. The next chapter will illustrate how economic capital is calculated with the models developed in chapter 2. With economic capital assumed to be € 3,000, RAROC is 2.0 %. Here, we assume that the policy is sold in a previous period (t=0). If the policy is sold at t=1, the added value of the first year would include the total value of the cash flows (€ 1,985) on top of the € 60 presented in Table 4.11. Consequently, RAROC (one year) in the first year would be 68.2% (i.e. (1985+60)/3000). Additionally, RAROC (lifetime) is 7.9% (i.e. 1985/25000, the latter being the assumed NPV of economic capital over the total lifetime of the policy). Time t=1 Time t=2 Age of client 50 51Dead at age 64 Probability 0.25 0.25Payment € 90,000 € 90,000 Expected € 22,500 € 22,500 NPV € 14,875 € 15,321 Alive at age 65 Probability 0.75 0.75Payment € 100,000 € 100,000 Expected € 75,000 € 75,000 NPV € 48,140 € 49,584 NPV total policy € 1,985 € 2,045 Value added: € 60 Economic Capital: € 3,000 RAROC (one year): 2.0 % NPV (Economic Capital): € 25,000 RAROC (lifetime): 7.9 %
Table 4.11: Performance of the Underwriting Centre Liabilities of the underwriting centre are perfectly matched with risk-free assets, i.e. internal transactions with the investment centre. The NPV of the liabilities are € 14,875 and € 48,140 for the 14 and 15 years bucket respectively as these are the expected cash flows of the policy. These cash flows are cash flow-
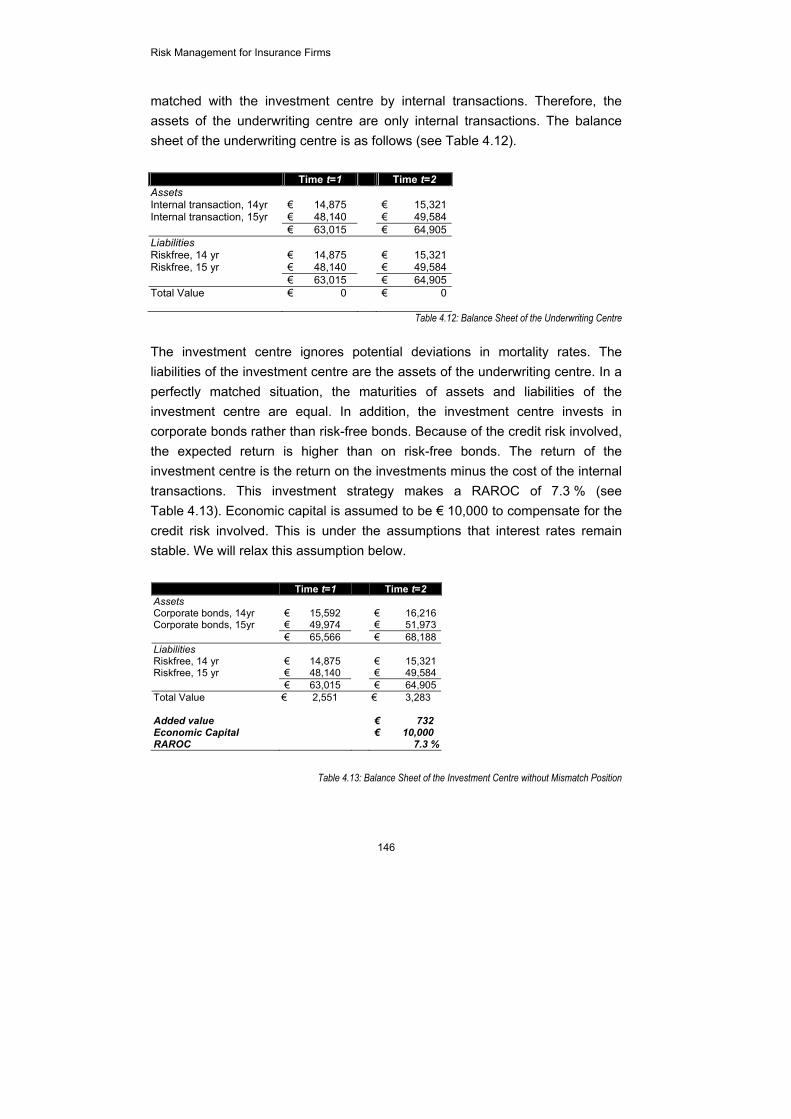
Risk Management for Insurance Firms
146
matched with the investment centre by internal transactions. Therefore, the assets of the underwriting centre are only internal transactions. The balance sheet of the underwriting centre is as follows (see Table 4.12). Time t=1 Time t=2 Assets Internal transaction, 14yr € 14,875 € 15,321 Internal transaction, 15yr € 48,140 € 49,584 € 63,015 € 64,905 Liabilities Riskfree, 14 yr € 14,875 € 15,321 Riskfree, 15 yr € 48,140 € 49,584 € 63,015 € 64,905 Total Value € 0 € 0
Table 4.12: Balance Sheet of the Underwriting Centre The investment centre ignores potential deviations in mortality rates. The liabilities of the investment centre are the assets of the underwriting centre. In a perfectly matched situation, the maturities of assets and liabilities of the investment centre are equal. In addition, the investment centre invests in corporate bonds rather than risk-free bonds. Because of the credit risk involved, the expected return is higher than on risk-free bonds. The return of the investment centre is the return on the investments minus the cost of the internal transactions. This investment strategy makes a RAROC of 7.3 % (see Table 4.13). Economic capital is assumed to be € 10,000 to compensate for the credit risk involved. This is under the assumptions that interest rates remain stable. We will relax this assumption below. Time t=1 Time t=2 Assets Corporate bonds, 14yr € 15,592 € 16,216 Corporate bonds, 15yr € 49,974 € 51,973 € 65,566 € 68,188 Liabilities Riskfree, 14 yr € 14,875 € 15,321 Riskfree, 15 yr € 48,140 € 49,584 € 63,015 € 64,905 Total Value € 2,551 € 3,283 Added value € 732 Economic Capital € 10,000 RAROC 7.3 %
Table 4.13: Balance Sheet of the Investment Centre without Mismatch Position

Insurance Investments and ALM
147
In practice, it is likely that the investment centre will have a mismatch position. Rather than investing in credits with exactly the 14 and 15 year horizon, they might as well have a credit portfolio with a shorter maturity and consequently bear reinvestment and mismatch risk with an amount of economic capital associated with it. The total economic capital equals € 20,000 because the mismatch and the credit risk. Bearing this mismatch adds less value than in the perfectly matched situation above. As economic capital has increased as well, RAROC decreases to 3.3 %. Time t=1 Time t=2 Assets Corporate bonds, 10yr € 15,592 € 16,200 Corporate bonds, 9yr € 49,974 € 51,923 € 65,566 € 68,123 Liabilities Riskfree, 14 yr € 14,875 € 15,321 Riskfree, 15 yr € 48,140 € 49,584 € 63,015 € 64,905 Total Value € 2,551 € 3,217 Added value € 666 Economic Capital € 20,000 RAROC 3.3 %
Table 4.14: Balance Sheet of the Investment Centre with Mismatch Position Thus far, we assumed that no interest rate changes have occurred over the period. Relaxing this assumption means that the value of both portfolios will change over time when interest rates rise. Here, we investigate the effect of a 100 basispoint parallel increase in interest rates (see Table 4.15). Although our example ignores the convexity of interest rate curves, the conclusions will hold as well. Hence, we keep it simple here. Time t=1 Time t=2 Risk-free
interest rate Credit interest
rate Risk-free
interest rate Credit interest
rate 8-11 year 2.9 % 3.9 % 3.9 % 4.9 % 12-15 year 3.0 % 4.0 % 4.0 % 5.0 %
Table 4.15: Example Interest Rates – Parallel Interest Rate Change

Risk Management for Insurance Firms
148
Time t=1 Time t=2 Assets Corporate bonds, 10yr € 15,592 € 15,005 Corporate bonds, 9yr € 49,974 € 47,634 € 65,566 € 62,639 Liabilities Riskfree, 14 yr € 14,875 € 13,513 Riskfree, 15 yr € 48,140 € 43,311 € 63,015 € 56,824 Total Value € 2,551 € 5,816 Added value € 3,265 Economic Capital € 20,000 RAROC 16.3 %
Table 4.16: Balance Sheet of the Investment Centre after Interest Rate Change Due to the increase in interest rates, both assets and liabilities decrease in value. As liabilities decrease further than assets, an interest rate increase creates € 3,265 value for the investment centre as a whole. In this scenario RAROC is 16.3 %. (see Table 4.16) Please recall that the underwriting centre is perfectly matched and consequently interest rate changes have no effect. Now, let us consider the effects of mortality rate changes. These will have no effect on the investment centre, but may cause a mortality-mismatch position at the underwriting centre. In the period observed, the underwriting centre achieves new insights: the probability of early death appears to be 0.30 rather than the 0.25 initially assumed. As a result, the expected cash flows change and the NPV of the total insurance policy becomes € 2,286. The underwriting centre has added positive value in the observed period and materialised a positive 10.0 % RAROC (see Table 4.17).

Insurance Investments and ALM
149
Time t=1 Time t=2 Age of client 50 51Dead at age 64 Probability 0.25 0.30Payment € 90,000 € 90,000 Expected € 22,500 € 27,000 NPV € 14,875 € 18,386 Alive at age 65 Probability 0.75 0.70Payment € 100,000 € 100,000 Expected € 75,000 € 70,000 NPV € 48,140 € 46,278 NPV total policy € 1,985 € 2,286 Value added: € 301 Economic Capital: € 3,000 RAROC: 10.0 %
Table 4.17: Performance of the Underwriting Centre after Changing Mortality Assumptions The balance sheet of the underwriting centre has changed due to the changing mortality rates. There is a mismatch between initially expected and currently expected mortality rates, creating € 241 of value. The total amount of added value of € 301 consists of two components. Firstly, € 241 is due to favourable developments of mortality rates (see Table 4.18). Secondly, € 60 is due to bearing the mortality risk and this amount is equal to the prior situation when mortality rates would remain stable. Time t=1 Time t=2 Assets Internal transaction, 14yr € 14,875 € 15,321 Internal transaction, 15yr € 48,140 € 49,584 € 63,015 € 64,905 Liabilities Riskfree, 14 yr € 14,875 € 18,386 Riskfree, 15 yr € 48,140 € 46,278 € 63,015 € 64,664 Total Value € 0 € 241
Table 4.18: Balance Sheet of the Underwriting Centre after Changing Mortality Assumptions
4.8 SUMMARY AND CONCLUSIONS
This chapter discussed the assets and the mismatch position of insurance firms. It answers our sixth research question on the management control aspects of the mismatch position. To be able to answer it, section 4.2 developed the concept of Management Control and the leading theories in this area. Section 4.3 described the matching process of insurers and uncovered the

Risk Management for Insurance Firms
150
following six major problems relating to conditions for effective control and goal congruence: Management has an inadequate model and inadequate information of the
state of an insurance policy as performance is measured integrally; The same holds for risks; The insurance unit lacks the appropriate instruments to influence effects of
all value changes of investments. This includes value changes due to credit spread and default as well as embedded optionalities;
The insurance unit has no incentives to design products that can be easily matched on the financial markets. There is no feedback from the investment units to the insurance units.
The insurance unit has no incentives that limit them from granting free embedded options, which are costly for the investment unit and as a result for the organisation as a whole.
The investment centre is incentivised by the underwriting centre (rather than management) to invest in more risky securities when the latter wants to set a lower premium.
Section 4.4 explained that banks basically have similar problems and argued that the Marktzinsmethode solves these problems. Virtually all banks have implemented this method for management control purposes. Whilst the concept is well-known in banking, it is totally new for insurance firms. Yet, investigating this principle in insurance promotes the convergence (see chapter 1) in management control methods. Section 4.5 developed the concept of the Marktzinsmethode for insurance firms by establishing two responsibility centres: the underwriting centre and the investment centre. The transfer price for the internal transactions is an important aspect. Section 4.5.2 argued that it should be set at the risk-free rate, like swap rates. The remainder of section 4.5 discussed the objectives of the two responsibility centres and the performance and risk measures. It concluded that implementing the Marktzinsmethode resolves the six problems summarised above. That answers our sixth research question (‘What is an appropriate method for the management control of an insurer’s mismatch position?’) from a theoretical perspective.

Insurance Investments and ALM
151
Section 4.6 discussed that isolating the ALM and investment risks from the underwriting risks makes market and credit risk measurement relatively simple. It provides an overview of model structures such that economic capital can be calculated. Scenario modelling plays an important role. Section 4.7 is an example of the Marktzinsmethode on the level of an individual policy. It shows how performance and risk are measured and how it results in RAROC. Ultimately, this answers our sixth research question.

Risk Management for Insurance Firms
152
NNOOTTEESS TTOO CCHHAAPPTTEERR 1 Crouhy et al. (2006), p. 19 ff 2 Anthony et al. (1992), p. 7 3 Simons (1995), p. 5 4 Merchant (1998), p. 5 5 Anthony (1988), p. 10 6 Anthony, Govindarajan (2003), p. 93 7 Merchant (1998), p. 121 8 Simons (1995), p. 7 9 Bruggink (1989), p. 110 10 Bruggink (1989), p. 111 11 Van den Tillaart (2003), p. 151 12 Simons (1995), p. 7 13 Van den Tillaart (2003), p. 158 14 Speklé (2002), p. 416 15 Saita (1999), p. 97 16 Santomero (1995), p. 33 17 Pape (1999), p. 100 18 De Leeuw (1990), p. 112 19 E.g. Hull (2006), Stulz (2003) 20 Booth et al. (1999), p. 68 21 Booth et al. (1999), p. 101 22 Booth et al. (1999), p. 66 23 Booth et al. (1999), p. 67 24 In addition to equity, real estate and other asset classes. 25 Van Mullem (2004), p. 25 26 Schierenbeck (2003-b), p. 300 27 This is called convexity. 28 Siegelaer (1996), p. 23 29 Oosenbrug (1998), p. 56 30 Ben-Saud, Van Bergen (2005), p. 38 31 See e.g. Van der Aalst (1995), Siegelaer (1996) 32 Smink (1995), p. 232 33 KPMG (2002), p. 163 34 Smink (1995), p. 238 35 Hopman (2000), chapter 3 36 Bos, Bruggink (1996), p. 60 37 Van der Vliet (1996), p. 59 38 Oosenbrug (1998), p. 57 39 Smink (1995), p. 241 40 Van der Vliet (1996), p. 60-66 41 Booth et al. (1999), p. 86 42 Smink (1995), p. 246 43 IASB (2004-a), art. BC166 44 IASB (2004-b), IAS 39 45 … although ‘held to maturity’ assets and ‘loans and receivables’ are allowed to be valued on an amortised cost basis. See IASB (2004-b), IAS39 46 IASB (2004-a), art. BC172 47 IASB (2004-a), art. BC173 48 IASB (2002), p. 1 49 Aarzen, Mourik (2005), p. 22 50 IASB (2004-a), art. BC6 51 Van der Vliet defines market value as discounted cash flows without an explicit risk margin. 52 Van der Vliet (1996), p. 25

Insurance Investments and ALM
153
NOTES (CONTINUED) 53 Van der Aalst provides an overview of the discussion between Wise and Wilkie and the line of theories that followed. See Van der Aalst (1995), p. 107 54 Wise (1984), p. 445, Wise (1987-a), p. 113, and Wise (1987-b), p. 551 55 Wilkie (1985), p. 229 56 e.g. Tzeng et al. (2000), Devolder et al. (2003) for pension funds 57 Interested readers consult Van der Aalst (1995), p. 107 ff. for an overview. 58 Ben-Saud, Van Bergen (2005), p. 38 59 Smink (1995), p. 232 60 Kleynen (1996), p. 62 61 IASB (2004-a), art. BC166 62 This effect is even more significant for pension funds investing a significant amount in stocks as well. 63 Financieele Dagblad (2001) 64 See Erisk (2001-c) 65 Alink (2002), p. 80 66 See www.pensioenbegrippen.nl 67 See Doff (2004), p. 17 68 For instance Schierenbeck (2003-a), Doff (2004), Allen, Santomero (1999) 69 Kimball (1997), p. 25 70 Schierenbeck (2003-a), p. 71 71 Bos and Bruggink (1996), p. 32 72 In this example we ignore results on equity for reasons of simplification. For a more elaborate, but still simple example, please consult Doff (2004), p. 126 73 Schierenbeck (2003-a), p. 46 74 Schierenbeck (2003-a), p. 84 75 Bos, Bruggink (1996), p. 33 76 Schierenbeck develops the Zinsbindungskriterium and the Kapitalsbindungskriterium. See Schierenbeck (2003-a), Chapter 2 77 Schierenbeck (2003-a), p. 293 78 Schierenbeck (2003-a), p. 83 79 Schierenbeck (2003-a), p. 84 80 Bos, Bruggink (1996), p. 33 81 Although we can imagine that in some situations (like retail banking) it is more practical to arrange transactions with the treasury on a portfolio basis rather than on an individual basis. 82 Schierenbeck (2003-b), p. 615 83 Schierenbeck (2003-b), p. 616 84 Swiss Re (2001), p. 10 85 Anthony et al. (1992), p. 228 86 Kimball (1997), p. 26 87 Anthony et al. (1992), p. 229 88 Of course, the underwriting centre can sell embedded options for free as marketing instrument. However, it will bear the cost of such embedded options. 89 Most insurance firms will prefer not to report too much fluctuations in the investment returns even though they may believe their internal economic capital models are right. 90 Alink (2002), p. 133 91 See e.g. Crouhy et al. (2006), Hull (2006), Chisholm (2002), Bessis (1998) 92 See e.g. Hull (2006), Stulz (2002) 93 Smink (1995), p. 122 94 Please note that we consider credit spread a market risk variable rather than a credit risk variable. The reason is that credit spreads are related to market sentiment as a whole. Therefore, credit spreads do not depend on the credit quality of an individual security. 95 See Crouhy et al. (2006), p. 149

Risk Management for Insurance Firms
154
NOTES (CONTINUED) 96 Artikis (1999), p. 3 97 Van Mullem (2004), p. 37 ff., Van Bussel (1998), p. 30 98 Vasicek (1977), p. 177 ff. 99 Cox, et al. (1985), p. 385 ff. 100 Hull, White (1990), p. 573 ff. 101 See Scheffer (2004), chapter 2 for an overview 102 See Credit Metrics (1997), part I 103 Doff (2004), p. 41 104 Credit Metrics (1997), part I 105 Oosenbrug (1999), p. 130 106 Booth et al. (1999), p. 8 107 CreditMetrics (1997), chapter 1 108 See CreditMetrics (1997), chapter 10 109 Alink (2002), p. 146
155
AA CCAASSEE SSTTUUDDYY
5.1 INTRODUCTION
This chapter is a practical illustration of our risk management and economic capital framework. It demonstrates the operation of the framework for fair value and economic capital that has been developed in the preceding chapters. And it supplements the conclusions from the interviews described in section 2.7. Section 5.2 discusses methodological aspects of performing case study research. Section 5.3 provides an introduction on our case: a practical non-life insurance firm. Sections 5.4 and 5.5 discuss the underwriting and investment risks respectively. Section 5.6 aggregates the results. Section 5.7 provides some reflections on the outcomes of our research, extending the conclusions towards life insurance. Section 5.8 concludes.
5.2 METHODOLOGY A case study is one of multiple research designs in the area of social science. Yin defines a case study as “… an empirical enquiry that investigates a contemporary phenomenon within its real-life context, especially when the boundaries between phenomenon and context are not clearly evident.”1 Yin explains that a case study is especially relevant for research questions of the form ‘how’ and ‘why’ in which the researcher has little control over the behavioural events.2 Case study research is often exploratory, i.e. it investigates how or why a certain phenomenon occurs. Other research methods like experiments and surveys aim to answer questions like ‘who’, ‘what’, ‘where’, or
CChhaapptteerr
55

Risk Management for Insurance Firms
156
‘how much/many’.3 These methods can be descriptive, explanatory or predictive.4 Remenyi et al. describe two forms of case studies:5 (1) case study as evidence-collection device to support a hypothesis or theory, and (2) case study as narrative to provide understanding of phenomena. This chapter applies the first form of case study research. This chapter poses the question: “Can the framework for fair value and economic capital be applied to an insurance firm?” The unit of analysis is economic capital methods, i.e. multiple methods because there are measurement models for each risk category defined in chapter 1. This chapter investigates how these models can be applied in an insurance firm, its real-life context. In case study research, as in any academic research, reliability and validity are important aspects. Yin discusses tactics to deal with each of these aspects.6 A research is valid if the operational measures relate to the phenomena being studied (construct validity), if causal relations are established (internal validity), and if the results can be generalised to other cases (external validity). To cover validity of the research and its conclusions, the case study is extensively reviewed by our supervisors. Due to time limitations and data availability, we have not been able to do multiple case research. This would have strengthened the validity. A case study is reliable if it can be repeated, with the same results. Yin notes that the emphasis is on doing the same case study again rather than doing another case study. Therefore, we carefully documented the procedures we have taken and this documentation has been reviewed by our supervisors. The case in this study is a non-life insurer. Some of the data sources in this case study are confidential. Therefore we have anonymised the data by investigating only a part of the insurer’s portfolio so that total amounts and size of the insurer’s risk exposure in any of the risk categories cannot be derived from the data in our research.7 The process of anonymising the data has also carefully been supervised. Data sources in this case study are annual reports, (confidential) supervisory reports, internal memos, data from internal management accounts, internal investment portfolio databases, and data from actuarial tests.

A Case Study
157
The case focuses on a non-life insurance firm. It derives the fair value and the economic capital through the methods developed in chapter 2 and 4. The concepts used in this case study are similar for life and non-life insurance. We have chosen to focus on non-life insurance for two reasons. Firstly, valuation measures for life insurance are further developed than for non-life insurance. Chapter 2 explains that for instance the embedded value method has been operational in life insurance for quite some years. The fair value measures of our risk management framework are extensions of the principles underlying embedded value. However, such valuation methods for non-life insurance are less obvious. Little alternatives to accounting measures are described in literature. However, the principles are identical to life insurance. Therefore, this case study focuses on non-life insurance to illustrate the fair value and economic capital principles in a no-too-obvious area. Secondly, we have chosen for a non-life case study because the data used in non-life insurance are better accessible than life insurance data. The latter are often ‘locked’ in embedded value software. Specific training is necessary to use this software. Alternatively, unlocking the data required scarce actuarial staff capacity of the specific insurance firm that has been unavailable at the time of our research. Non-life insurance data however has been available in the common tools. Therefore, this case study concentrates on non-life insurance.
5.3 CASE DESCRIPTION This case study discusses a multi-line insurance firm operating predominantly in the Netherlands. Its customer base is private individuals only. It operates three product lines: Motor, protecting against vehicle damage and accident liability; Property, protecting the home and the home content against multiple
hazards like fire and theft; Liability insurance, protecting against any (non-motor) liability against third
parties. Figure 5.1 and 5.2 depict the insurer’s respective balance sheet and its profit and loss statement. The technical provisions on the balance sheet consist of three components. The calamity provision is to absorb any extreme events. Under the recent accounting rules of IFRS, it is no longer allowed. The technical

Risk Management for Insurance Firms
158
provision for claims is to cover claim payments. Claim provisions include short tail and long tail claims. Events underlying the claims may be from the year under consideration (short tail) or from prior years (long tail). The claim provision consists of estimates of observed claims already occurred and of estimates of so-called IBNR-claims (Incurred-But-Not-Reported). The unearned premium provision is to cover for premiums that have been received in the period under consideration, but include insurance coverage for a different period than accounted for in the annual accounts. The investments of this insurance firm consist of real estate, stocks, bonds (both corporate and government bonds), mortgages and liquid assets. Assets LiabilitiesReal Estate 69.4€ Shares 1.0€ Stocks 58.5€ Reserves 143.7€ Bonds 509.8€ 144.7€ Mortgages 105.3€ Technical provisionsLiquid Assets 62.0€ Unearned Premium 194.6€
Claims Provision 460.5€ Calamity Provision 5.2€
660.3€ 805.0€ 805.0€
Balance Sheet
Table 5.1: Balance Sheet
Table 5.2 shows the profit and loss statement. Part of the premiums received (also called: gross premiums) are directly transferred to reinsurers. Additionally, the technical provision for Unearned Premiums influences the premium income. Investment income is partly a return due to unrealised value changes and partly due to realised returns (like coupon payments and dividends). The costs of the insurer roughly consist of claim-related expenses and operational costs (€ 177.2 mio). Claim-related expenses are incurred claims less amounts recovered from reinsurance plus the changes in the technical provisions for claims.

A Case Study
159
Profit and Loss StatementPremiums Received 458.7€ Reinsurance Premium 30.4-€ Change Techn. Prov. 2.3€
430.6€ Investment Returns 54.6€ Realised Returns 7.9€
62.5€ Claims 256.9€ Reinsurance Cover 16.4-€ Change Techn. Prov. 36.6€
277.1€ Operational Costs 177.2€
177.2€ Net Profit Before Tax 38.8€
Table 5.2: Profit and Loss Statement The investment portfolio is an important risk driver. As the investment portfolio is measured on fair value basis, the focus of risk management is to avoid decreases in value. The day-to-day asset management is outsourced to a professional asset manager, with customised investment mandates including risk limits. However, the strategic asset allocation is approved by the Board of Directors of the insurer through an annually updated investment plan. It includes the principles underlying the mandates, the risk appetite, and the target asset allocation to asset classes. Periodic ALM studies are input for the investment plan. The investment portfolio consists of five major components (see also Figure 5.3): Real estate, both commercial and private real estate; Stocks, a well-diversified portfolio of industries and geographies; Bonds, including government and corporate bonds; Mortgages, only private mortgages; and Liquid assets.

Risk Management for Insurance Firms
160
Total Investment Portfolio(€ 805.0 mio)
Real Estate8.6%
Stocks7.3%
Fix ed Income63.3%
Mortgage13.1%
Liquid Assets
8%
Fixed Income Portfolio(€ 509.8 mio)
Gov ern't bonds72%
AAA6.1%
AA5.4%
A 12.4%
Other5.2%
Figure 5.3: Composition of Total Investment and Fixed Income Portfolio
Insurance underwriting is performed through multiple distribution channels like banks, insurance intermediaries and direct writing (like internet). To manage the underwriting risk position, the insurance firm transfers parts of its exposure to reinsurers, as is common in the industry. The reinsurance program consists mostly of excess-of-loss contracts to limit the total loss in the event of a catastrophe. A reinsurance program exists to limit credit risk exposure to reinsurance firms, including limits per reinsurance firm, per geographical regions, and per credit rating category. In this case study, economic capital is calibrated to an A-rating. This means that the confidence level that relates to the unexpected loss (c.f. UL or worst-case) is set at 99.95%. Next to the risk categories described in this chapter, the insurance firm also applies simple measurement approaches for operational risk and business risk. However, as we have not discussed these risks in our thesis, we will ignore them here as well. The discount rate used in this case study is the risk-free interest rate curve. It is the interest rate on Dutch government bonds.8 Additionally, the cost of (equity) capital used throughout this case is 15%. It is determined by applying CAPM.9 This chapter applies the cost of (equity) capital used by the insurance firm. Please note that amounts are expressed in € 1,000 unless explicitly otherwise noted.

A Case Study
161
Interest rate curve
0.0%
1.0%
2.0%
3.0%
4.0%
5.0%
0 2 4 6 8 10 12
Figure 5.4: Risk-free Interest Rate Curve (Used as Discount Rate)
5.4 UNDERWRITING RISKS The underwriting risk is reflected in observed claim volatility and the volatility in the run-off of claims. Claim volatility is commonly measured by the claim ratio: the sum of claims in a particular year divided by the premiums received. When claim ratio is over 100% in a particular year, it indicates that claims are higher than premiums received in that year and premiums have been insufficient to cover claims. It is appropriate here to measure the claim ratio net of reinsurance coverage. Figure 5.5 shows the claim ratios over time of the three products. Whilst Motor and Liability insurance are relatively stable over time, the claim ratio of Property insurance is more volatile.
Historical Claim Pattern
Mot or
Liabilit y
Propert y
0%
20%
40%
60%
80%
100%
1995 1997 1999 2001 2003 2005
Cl a i m Ra t i o
Figure 5.5 Historical Claim Pattern

Risk Management for Insurance Firms
162
Chapter 2 explains that underwriting risk for non-life insurance is classified into three components: Premium risk: volatility of claim frequency and amount in a particular year; Reserve risk: volatility of claims run-off over time; and Catastrophe risk: risk of large, catastrophic events. These are modelled
separately from premium risk.
5.4.1 Premium Risk Premium risk is calculated through estimating two probability distributions for the claim frequency and claim amount separately. Then, these probability distributions are combined into one compound distribution. Figure 5.6 shows the probability for claim frequency and claim amount for the product Liability. The appendix to this chapter discusses the derivation of the parameters and the compound distribution more in detail (see Appendix A.1). The parameters for the other products are different, but the structure is similar.
Probability DistributionClaim Frequency
0 1 2 3Annual number of c l a i ms
P r obabi l i t y Probability DistributionClaim Amount
0 100 200 300 400 500 600 700 800C l a i m a mount
P r oba bi l i t y
Figure 5.6: Probability Distributions for Premium Risk
The combination of the two probability distributions provides the compound probability distribution (see Appendix A.1). From the compound probability distributions per product, we can derive the annual expected loss (c.f. EL or best-estimate) and the unexpected loss (c.f. UL or worst-case loss), calibrated at 99.95%. As the 99.95th percentile includes EL, economic capital is the difference between EL and UL (see Table 5.7). Total premium risk economic capital is € 213.2 mio.

A Case Study
163
Premium Risk Economic Capital EL UL
Motor 115,526€ 49,032€ 164,558€ Property 54,145€ 46,907€ 101,052€ Liability 43,481€ 8,512€ 51,993€
213,152€ 104,451€ 317,603€ Table 5.7: Premium Risk Economic Capital per Product
5.4.2 Reserve Risk Reserve risk relates to volatility of claim run-off. It is determined using the loss triangle method as discussed in section 2.3. The loss triangle distinguishes per claim payment the accident year (the year in which the accident happened, i.e. the policy is sold) and the development year (the year in which new information concerning the claim becomes available resulting in additional technical provisioning). Especially long tail insurance like liability insurance is exposed to reserve risk, because it can take a number of years before the final amount of a claim can be determined. Whilst the impact of reserve risk is more prominent in Liability insurance, the principle does also hold in Property insurance. The major difference is that the run-off period is shorter. Because that makes it easier to explain, this section will discuss the reserve risk calculation of Property. i k 1 2 3 4 5 6
4,919 5,924 5,936 5,940 5,944 5,9469,297 12,402 12,530 12,551 12,550
11,499 15,113 15,307 15,35912,542 16,521 16,80512,642 16,65111,676
200020012002200320042005
Figure 5.8: Initial Loss Triangle for Property Insurance The loss triangle of Figure 5.8 shows that the run-off of the Property insurance is 6 years. Please note that the amounts in the loss triangles of this section are cumulative amounts. For policies sold in 2003, total claim amount is € 16.8 mio of which only € 12.5 mio had been estimated in 2003. Over the course of 2004 and 2005, € 4.3 mio has been provisioned additionally. The insurance firm of our case study applies the Mack method to determine the missing part of the loss triangle. Figure 5.9 shows the completed loss triangle.
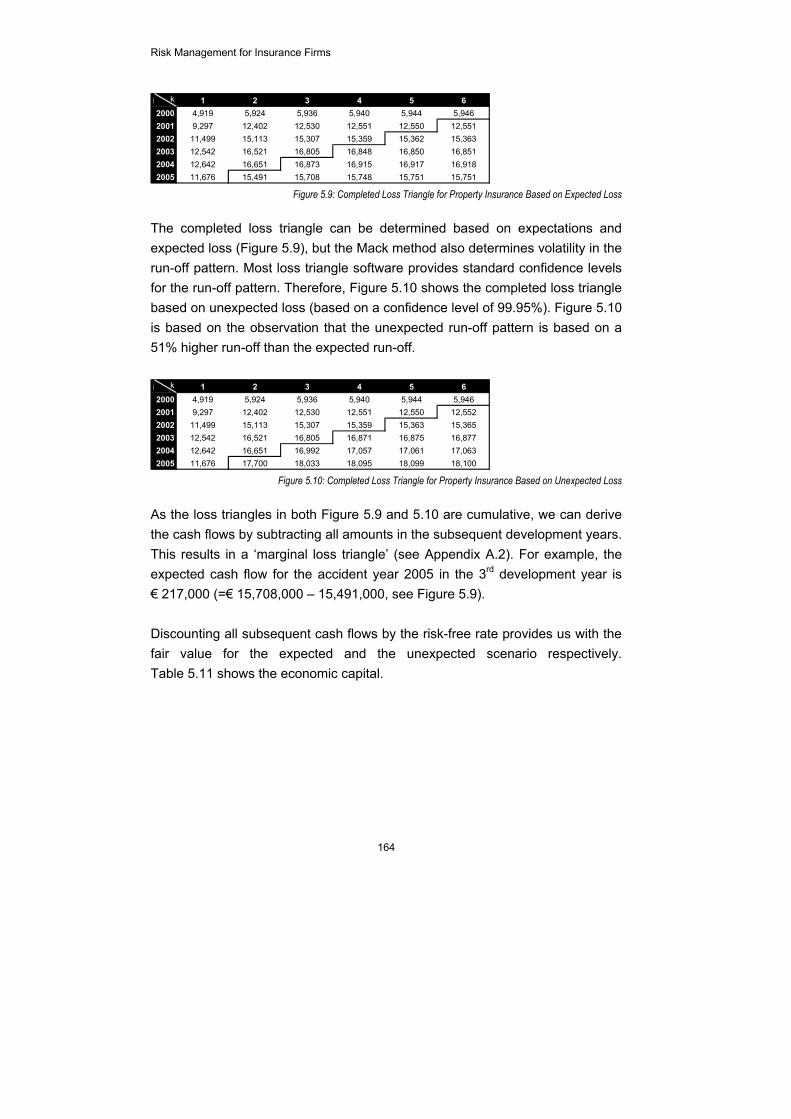
Risk Management for Insurance Firms
164
i k 1 2 3 4 5 64,919 5,924 5,936 5,940 5,944 5,9469,297 12,402 12,530 12,551 12,550 12,551
11,499 15,113 15,307 15,359 15,362 15,36312,542 16,521 16,805 16,848 16,850 16,85112,642 16,651 16,873 16,915 16,917 16,91811,676 15,491 15,708 15,748 15,751 15,751
20042005
2000200120022003
Figure 5.9: Completed Loss Triangle for Property Insurance Based on Expected Loss
The completed loss triangle can be determined based on expectations and expected loss (Figure 5.9), but the Mack method also determines volatility in the run-off pattern. Most loss triangle software provides standard confidence levels for the run-off pattern. Therefore, Figure 5.10 shows the completed loss triangle based on unexpected loss (based on a confidence level of 99.95%). Figure 5.10 is based on the observation that the unexpected run-off pattern is based on a 51% higher run-off than the expected run-off. i k 1 2 3 4 5 6
4,919 5,924 5,936 5,940 5,944 5,9469,297 12,402 12,530 12,551 12,550 12,552
11,499 15,113 15,307 15,359 15,363 15,36512,542 16,521 16,805 16,871 16,875 16,87712,642 16,651 16,992 17,057 17,061 17,06311,676 17,700 18,033 18,095 18,099 18,100
20042005
2000200120022003
Figure 5.10: Completed Loss Triangle for Property Insurance Based on Unexpected Loss
As the loss triangles in both Figure 5.9 and 5.10 are cumulative, we can derive the cash flows by subtracting all amounts in the subsequent development years. This results in a ‘marginal loss triangle’ (see Appendix A.2). For example, the expected cash flow for the accident year 2005 in the 3rd development year is € 217,000 (=€ 15,708,000 – 15,491,000, see Figure 5.9). Discounting all subsequent cash flows by the risk-free rate provides us with the fair value for the expected and the unexpected scenario respectively. Table 5.11 shows the economic capital.

A Case Study
165
Reserve Risk Economic Capital Fair Value based on EL
Fair Value based on UL
Motor 18,980€ 190,753€ 209,733€ Property 2,374€ 80,943€ 83,317€ Liability 5,452€ 9,111€ 14,564€
26,806€ 280,808€ 307,614€ Table 5.11: Reserve Risk Economic Capital per Product
5.4.3 Catastrophe Risk The insurance firm has operated for a number of years a commercial model to measure catastrophe risk10 for objectives like reinsurance purchase and general risk assessments of the insurance portfolio. More recently, this model has been used to determine economic capital as well. The catastrophe model estimates a total loss amount for a particular year, given the portfolio composition, based on seismological and meteorological information. The outcomes are allocated to the products using expert opinion correlation factors. Because there is little relation between catastrophic events and liability insurance, the catastrophe risk economic capital is only allocated to Motor and Property (see Table 5.12). Catastrophe Risk Economic Capital
Motor 35,205€ Property 34,908€ Liability -€
70,113€ Table 5.12: Catastrophe Risk Economic Capital per Product
5.4.4 Total Non-Life Underwriting Risk The insurance firm in our case study calculates the total amount of economic capital using correlations and matrix multiplication. It takes into account two levels of diversification. Firstly, there is diversification between the products within the various risk sub-categories (i.e. premium, reserve, catastrophe risk) Secondly, there is diversification between the various risk sub-categories within the total underwriting risk category. This last step determines the total diversified underwriting risk economic capital. The appendix discusses the diversification matrices and the calculation (see Appendix A.3). Whilst the sum of the undiversified numbers is € 310.1 mio, total diversified economic capital is € 164.8 mio (Table 5.13). Total diversification benefit is 53.1%(=71.9%x 73.9%).

Risk Management for Insurance Firms
166
Economic Capital Premium Risk Reserve Risk Catastrophe Risk Total
Motor 115,526€ 18,980€ 35,205€ 169,711€ Property 54,145€ 2,374€ 34,908€ 91,427€ Liability 43,481€ 5,452€ -€ 48,933€ Undiversified 213,152€ 26,806€ 70,113€ 310,071€ Diversification Between Products 29.8% 20.1% 25.8% 28.1%
63,479€ 5,383€ 18,115€ 86,977€ 149,673€ 21,423€ 51,997€ 223,094€
Diversification Between Underwriting Risks 26.1%58,267€
164,827€ Diversified Economic Capital Table 5.13: Economic Capital per Product and Total Diversified Underwriting Risk Economic Capital
To manage its total underwriting risk exposure, the insurance firm purchases reinsurance cover through a program containing multiple layers and multiple counterparties. This involves credit risk because there is a risk that reinsurers cannot fulfil their obligations when they become due. Section 5.5 discusses the credit risk of reinsurance involved.
5.4.5 Fair Value and the Market Value Margin The amount of economic capital can be used to derive the total amount of fair value as defined in chapter 2. Please recall that the fair value is the sum of the expected value and a market value margin to reflect the underwriting risks in the portfolio. The cost of capital is 15% (section 5.3). Table 5.14 shows how the total fair value of € 431.8 mio is calculated. Fair value based on EL only is € 385.3 mio (=104.4+280.8), and then the MVM is added as the cost of holding economic capital.
Economic Capital Fair Value (Premium Risk)
Fair Value (Reserve Risk) MVM
Motor 169,711€ 49,032€ 190,753€ 25,457€ Property 91,427€ 46,907€ 80,943€ 13,714€ Liability 48,933€ 8,512€ 9,111€ 7,340€
104,451€ 280,808€ 46,511€ Total Fair Value 431,769€
Table 5.14: Undiversified Economic Capital per Product It is interesting to investigate the relation between value of the technical provisions as represented in the accounting balance sheet (c.f. Table 5.1) and

A Case Study
167
the fair value calculated in Table 5.14. Only the liability side of the balance sheet changes, because assets are already fair valued. The technical provisions for unearned premiums remain unchanged. The calamity provision disappears under a fair value regime, because no directly observable obligations underlie this provision. Its value is transferred to equity as a reserve. The major change is the claims provision. Traditionally, the claims provision is an undiscounted amount, while the fair value principle takes into account the time value of money. Additionally, the traditional claim provision includes a number of prudence levels, at the discretion of the actuary. The fair value measure does not include any of these ‘hidden’ prudence buffers. As a consequence, there is a release of € 75.2 mio (=460.5 – 385.3) from the claims provisions. On top of the fair value claims provision based on expected loss, there is a market value margin to reflect for risk (i.e. unexpected loss) in the claims provision. This market value margin (€ 46.5 mio) can be considered as cost of bearing the risk as discussed in section 2.5. Moreover, it should be considered a part of equity capital as a hybrid form. On top of this, there is a reserve release of € 34.0 mio (= 177.7 - 143.7). This number can also be determined the sum of the reserve release of € 75.2 mio plus the calamity provision of € 5.2 mio less the market value margin of € 46.5 mio. The total of the release is added to the equity capital (see Table 5.15). Balance Sheet Liabilities (Book Value) Liabilities (Fair Value)Shares 1.0€ 1.0€ Reserves 143.7€ 177.7€ MVM (hybrid capital) -€ 46.5€
144.7€ 225.2€ Technical provisionsUnearned Premium 194.6€ 194.6€ Claims Provision 460.5€ 385.3€ Calamity Provision 5.2€ -€
660.3€ 579.8€ 805.0€ 805.0€
Table 5.15: Balance Sheet – Accounting and Fair Value Representation Section 5.6 discusses the capital adequacy of the fair value balance sheet.

Risk Management for Insurance Firms
168
5.5 INVESTMENT RISKS AND ALM
The mismatch is an important risk management or ALM instrument through which risks can be increased and decreased. Chapter 4 discusses the use of the Marktzinsmethode to manage the mismatch position and to avoid interference between underwriting and market risks. Central aspect of the Marktzinsmethode is cash flow patterns of both assets and liabilities. Section 5.4 has derived the expected cash flow pattern of the liabilities from the loss triangle (see Table 5.8). The cash flow pattern of the investments can be determined from the portfolio. The investment database provides us with principal and coupon payments of the fixed income portfolio. This includes the embedded prepayment option of the mortgage portfolio. The investment centre provides internal investments to the underwriting centre so that the latter is perfectly matched from a market risk perspective. This implies that the investment centre bears all the market and ALM risks. Figure 5.16 shows the cash flow pattern of the investment centre.
Cash flow pattern
€ -
€ 20
€ 40
€ 60
€ 80
€ 100
€ 120
€ 140
€ 160
€ 180
€ 200
1 2 3 4 5 6 7 8 9 10 11 12
Y ear s
Cash Fl ow ( mi o)
Asset s
Liabilit ies
Figure 5.16: Cash Flow Pattern of Investment Centre
Given the nature of the non-life business, there is large short term peak in the liabilities. However, the investment centre considers this a ‘fixed kernel’ of liabilities that can consequently be invested with a longer time horizon in order to achieve higher investment returns. However, the duration of the assets (ca. 5 years) is significantly longer than the duration of the liabilities (ca. 2 years). The investment centre pays a transfer price that relates to risk-free interest rates to the underwriting centre. Consequently, if the realisation of the underwriting

A Case Study
169
variables equal the initial assumptions (like claim estimates), the underwriting centre makes a fair value return on the existing business that equals discounting the liabilities one year less.
5.5.1 Market Risk Calculations Our case study firm distinguishes the following market risk variables: volatility of real estate prices, volatility of stock prices, interest rate volatility, and credit spread volatility. Currency risk is entirely hegded in its investment plan, so there is no economic capital charge in the calculation for currency risk. The market risk calculation consists of the following components. 1. Develop a separate simulation model for each of the market risk variables; 2. Per model output, determine the value of the investment portfolio and the
liability portfolio (consequently, the fair value of the insurance firm as a whole).
3. Determine the total probability distribution of the total firm fair value per risk variable;
4. Finally, from the probability distribution, take the expected value and the value that corresponds with the 99.95th percentile.
The most important risk driver is interest rate risk. Changing interest rates have effect on both assets and liabilities. For the other parameters, it is not necessary to evaluate the liability value in each step of the simulation process. This is specifically true for the non-life business as there are little embedded options that relate to investment returns. In life insurance, the value of liabilities relates to the market risk parameters for instance due to minimum guarantees and profit sharing. Therefore, the market risk simulations may be more elaborate for life products than in our case study insurance firm. Table 5.17 presents the outcomes of the simulations (see Appendix A.4). The diversification factor of 72% is derived from the similar matrix multiplication process described in Appendix A.3.

Risk Management for Insurance Firms
170
Market Risk Drivers Economic Capital
Equity Price Risk 17,657€ Interest Rate Risk 39,527€ Real Estate Risk 10,791€ Credit Spread Risk 1,605€ Undiversified 69,580€ Diversification 28.3%
19,707€ Diversified Economic Capital 49,873€
Table 5.17: Diversified Market Risk Economic Capital
5.5.2 Credit Risk Calculations Credit risk stems from the corporate bond and mortgage portfolio and from the exposure on reinsurers. Figure 5.3 shows that the rating classes in the bond portfolio are relatively high quality. Also the reinsurance counterparties are of high credit standing (Figure 5.18).
Reinsurance Counterparties
A18.2%
AA12.1%
AAA3.0%
BBB+3.0%
A-39.4%
A+12.1%
AA-12.1%
Figure 5.18: Credit Risk of Reinsurance Counterparties
Credit risk calculations for economic capital are performed in credit risk model based on counterparty ratings, loss given defaults, exposure (nominal bond value) and migration matrices for the bond portfolio. The reinsurance credit risk calculation is based on the credit rating of the particular reinsurer and the maximum reinsured amount for the various reinsurance contracts, programs and layers. Expected loss is determined based on the standard credit risk multiplication.11 Unexpected loss is assumed a multiple of the expected loss.12
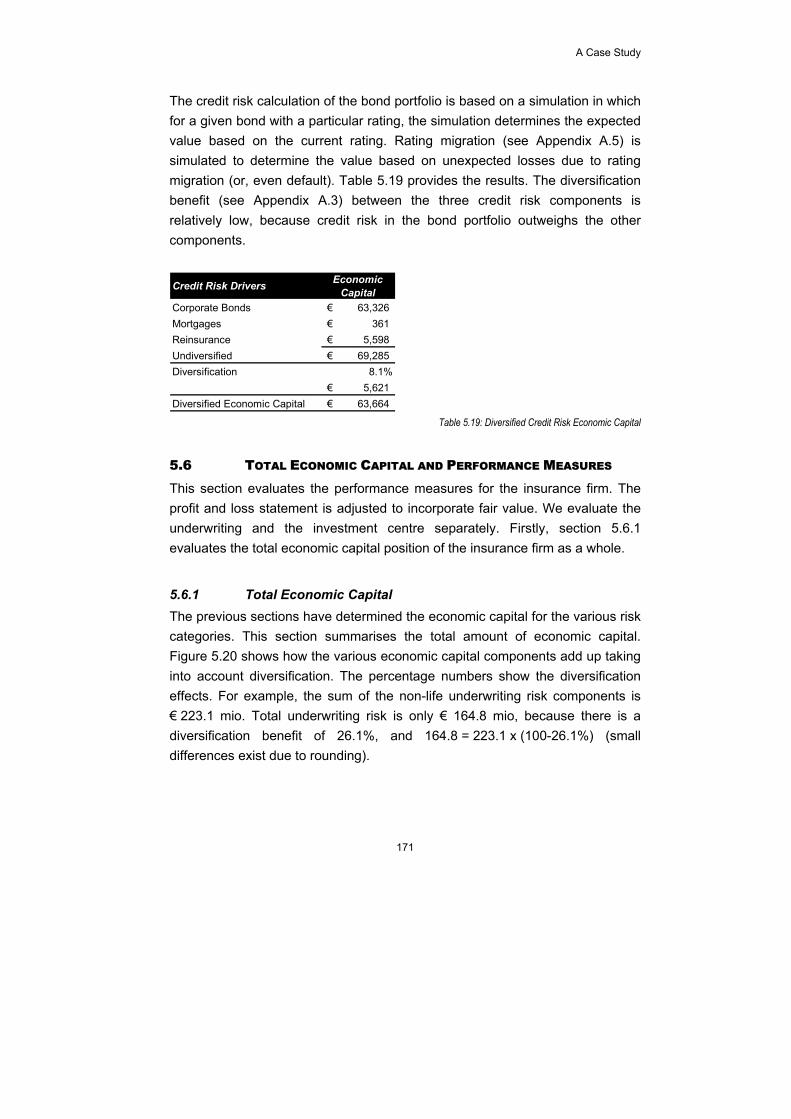
A Case Study
171
The credit risk calculation of the bond portfolio is based on a simulation in which for a given bond with a particular rating, the simulation determines the expected value based on the current rating. Rating migration (see Appendix A.5) is simulated to determine the value based on unexpected losses due to rating migration (or, even default). Table 5.19 provides the results. The diversification benefit (see Appendix A.3) between the three credit risk components is relatively low, because credit risk in the bond portfolio outweighs the other components.
Credit Risk Drivers Economic Capital
Corporate Bonds 63,326€ Mortgages 361€ Reinsurance 5,598€ Undiversified 69,285€ Diversification 8.1%
5,621€ Diversified Economic Capital 63,664€
Table 5.19: Diversified Credit Risk Economic Capital
5.6 TOTAL ECONOMIC CAPITAL AND PERFORMANCE MEASURES
This section evaluates the performance measures for the insurance firm. The profit and loss statement is adjusted to incorporate fair value. We evaluate the underwriting and the investment centre separately. Firstly, section 5.6.1 evaluates the total economic capital position of the insurance firm as a whole.
5.6.1 Total Economic Capital The previous sections have determined the economic capital for the various risk categories. This section summarises the total amount of economic capital. Figure 5.20 shows how the various economic capital components add up taking into account diversification. The percentage numbers show the diversification effects. For example, the sum of the non-life underwriting risk components is € 223.1 mio. Total underwriting risk is only € 164.8 mio, because there is a diversification benefit of 26.1%, and 164.8 = 223.1 x (100-26.1%) (small differences exist due to rounding).

Risk Management for Insurance Firms
172
Total Risk209.2
Non-financialRisks
Market Risk49.9
Credit Risk63.7
Non-Life Risk164.8 Life Risk Operational
Risk Business Risk
InvestmentRisk
UnderwritingRisk
Equity Risk17.7
Bonds63.3
Premium Risk149.7
Interest RateRisk 39.5
Mortgage0.4
Reserve Risk21.4
Real EstateRisk 10.8
Reinsurance 5.6
CatastropheRisk 52.0
Credit Spread Risk 1.6
28.3% 8.1% 26.1%
24.8%
--
Total Risk209.2
Total Risk209.2
Non-financialRisks
Non-financialRisks
Market Risk49.9
Market Risk49.9
Credit Risk63.7
Credit Risk63.7
Non-Life Risk164.8
Non-Life Risk164.8 Life RiskLife Risk Operational
RiskOperational
Risk Business RiskBusiness Risk
InvestmentRisk
InvestmentRisk
UnderwritingRisk
UnderwritingRisk
Equity Risk17.7
Equity Risk17.7
Bonds63.3
Bonds63.3
Premium Risk149.7
Premium Risk149.7
Interest RateRisk 39.5
Interest RateRisk 39.5
Mortgage0.4
Mortgage0.4
Reserve Risk21.4
Reserve Risk21.4
Real EstateRisk 10.8
Real EstateRisk 10.8
Reinsurance 5.6
Reinsurance 5.6
CatastropheRisk 52.0
CatastropheRisk 52.0
Credit Spread Risk 1.6
Credit Spread Risk 1.6
28.3% 8.1% 26.1%
24.8%
--
Figure 5.20: Total Economic Capital, including Diversification Effects
When comparing the fair value balance sheet (Table 5.15) with the outcomes of the economic capital calculation (Figure 5.20), it shows that the firm is overcapitalised. Required capital (economic capital) is € 209.2 mio, whilst available fair value capital is € 225.2 mio. There is € 16.0 excess capital. For the firm as a whole, this excess capital needs to be taken into account when calculating a total firm Return on Equity (ROE). Total economic capital is allocated to the various products as depicted in Table 5.21 and Figure 5.22. The investments consume most economic capital, the sum of market and credit risk excluding reinsurance credit risk (108.4 = 49.9 + (63.7 - 5.6)). Performance of the underwriting and investment centre is further discussed below.
Underwriting Risk Reinsurance Credit Risk Investment Risk Total Risk
Motor 90.2€ 2.6€ -€ 92.8€ Property 48.6€ 2.6€ -€ 51.2€ Liability 26.0€ -€ -€ 26.0€ Investement Centre -€ -€ 108.4€ 108.4€
164.8€ 5.1€ 108.4€ 278.4€ Diversification 25%
69.1€ Total Economic Capital 209.2€
Table 5.21: Diversified Economic Capital per Risk Category

A Case Study
173
Total Economic Capital
€ 92.8
€ 51.2€ 26.0
€ 108.4 € 278.4
€ 209.2
0
50
100
150
200
250
300
Motor Property Liability Inv estments Total EC Div ersifiedEC
€ mio
Figure 5.22: Allocation of Total Economic Capital
5.6.1 Underwriting Centre Performance The underwriting centre is evaluated based on the changes in fair value on the underwriting risks. Table 5.14 shows the fair value at the end of the year. Similar to the methods described in section 5.4, one can derive the fair value at the beginning of the year. The difference is that no premiums have yet been received for that year, no new claims have arisen, and a shorter run-off period for the existing claims from prior (accident) years (see Appendix A.2). If claims occur and develop according to expectation, the fair value change is exactly according to the risk-free return. In practice the fair value change reflects new insights in claim expectations and deviations from the expectation. Table 5.23 indicates that the total fair value change over the year 2005 is € 265.9 mio.
Fair Value of Claims 2005
Fair Value 2005 (Reserve Risk)
Fair Value 2004 (Reserve Risk) Fair Value Change
Motor 132,295€ 190,753€ 148,079€ 174,969€ Property 62,303€ 80,943€ 65,659€ 77,587€ Liability 11,698€ 9,111€ 7,475€ 13,334€
206,296€ 280,808€ 221,213€ 265,890€ Table 5.23: Fair Value Changes in 2005
This plays an important role in the RAROC calculation. Table 5.24 calculates RAROC by subtracting the fair value change from the premium. Then, operational costs are subtracted from that. This can be called the fair value profit of the underwriting centre for the various products. Within RAROC, the underwriting unit receives an additional economic capital benefit on top of the fair value profit to reflect that economic capital can be invested at the one-year

Risk Management for Insurance Firms
174
risk-free rate of 2.30%. RAROC is the quotient of the fair value profit plus the economic capital benefit and the economic capital for the products. It is appropriate to allocate the reinsurance credit risk capital to the underwriting centre13 because the underwriting centre has the responsibility for reinsurance purchase. Reinsurance is an important mitigation technique for underwriting risk, in exchange for a reinsurance credit risk exposure.
TotalPremium € 277.4 € 132.2 € 21.0 430.6€ Fair value 2005 € 323.0 € 143.2 € 20.8 Fair value 2004 € 148.1 € 65.7 € 7.5
€ 175.0 € 77.6 € 13.3 € 265.9 Operational Costs € 78.2 € 35.9 € 13.2 € 127.2 Fair Value Profit € 24.2 € 18.7 € 5.5- € 37.5 Economic Capital Benefit € 4.0 € 2.2 € 1.1 € 3.9
€ 28.2 € 20.9 € 4.4- € 41.4 Economic Capital € 172.3 € 94.0 € 48.9 € 170.0 RAROC 16.4% 22.2% -8.9% 24.3%
Motor LiabilityProperty
Table 5.24: RAROC Profit and Loss Statement for the Underwriting Centre
The underwriting centre as a whole performs well: the RAROC is 24.3%, which can be calculated by dividing the summed amounts of fair value profit by the sum of diversified economic capital (see Table 5.24). Please note that the economic capital benefit of the underwriting centre (€ 3.9 mio) is less than the sum of the products (4.0 + 2.2 + 1.1=€ 7.3 mio) due to diversification. It may seem that the underwriting centre does not benefit from the investment income. That is incorrect: the underwriting centre receives only risk-free returns on its investments (internal transactions with the investment centre). These returns are reflected in the calculation by the NPV-method of the fair value of the claims. Discounting with one year less (than at the beginning of the year) implies receiving the risk-free return on investments.
5.6.2 Investment Centre Performance The investments are fair valued under the IFRS regulation, also in our case study insurance firm. This means that the reported investment income is the sum of fair value changes and cash investment income from dividends and coupon payments. In 2005, this amounts to € 62.5 mio with total investment risk

A Case Study
175
economic capital of € 108.4 mio (i.e. market risk and non-reinsurance credit risk). According to the Marktzinsmethode, the investment centre transfers part of its investment income to the underwriting centre, i.e. the risk-free return on the liabilities and the economic capital benefit of the underwriting centre as a whole. The investment return on economic capital of the investment centre itself is already included in the investment returns. Because this should not be considered as regular investment income, it is first subtracted and then reflected as the economic capital benefit. This also avoids double counting. The investment centre produces a RAROC of 10.1% (see Table 5.25).
Investment Returns € 54.6 Realised Returns € 7.9
€ 62.5 Internal Transfer to Underwriting Centre € 51.6 Investment Return on Economic Capital € 2.5
€ 54.1 Fair Value Profit € 8.4 Economic Capital benefit € 2.5
€ 10.9 Economic Capital € 108.4 RAROC 10.1%
Investment
Table 5.25: RAROC Profit and Loss Statement for the Investment Centre
5.6.3 The Insurance Firm as a Whole Table 5.26 produces the RAROC per product, the two responsibility centres and for the firm as a whole. Please note that the diversification benefit of the underwriting unit as a whole has not been allocated to the individual products. The same holds for the diversification benefit for the insurance firm as a whole. As a result, the capital benefit for the firm as a whole is lower than the capital benefit of the sum of the two responsibility centres. Total firm RAROC is 24.2%. Total firm ROE, taking into account excess capital, is 20.4% (= 45.9/225.2, i.e. the latter being total available fair value equity capital (c.f. Table 5.15)). Figure 5.27 highlights the RAROC per product and over the EC consumption.

Risk Management for Insurance Firms
176
Fair Value Profit Capital Benefit Performance Economic Capital RAROC
Motor 24.2€ 4.0€ 28.2€ 172.3€ 16.4%Property 18.7€ 2.2€ 20.9€ 94.0€ 22.2%Liability 5.5-€ 1.1€ 4.4-€ 48.9€ -8.9%
37.5€ 7.2€ 44.7€ 315.2€ 14.2%Underwriting Centre 37.5€ 3.9€ 41.4€ 170.0€ 24.3%Investment Centre 8.4€ 2.5€ 10.9€ 108.4€ 10.1%
45.9€ 6.4€ 52.3€ 278.4€ 18.8%Total Firm 45.9€ 4.8€ 50.7€ 209.2€ 24.2%
Table 5.26: Performance Measurement of the Insurance Firm as a Whole
RAROC per product
PropertyMotor
Inv estment
Liability
Hurdle Rate
-10%
-5%
0%
5%
10%
15%
20%
25%
0 50 100 150 200 250 300
EC ( € mio)
RAROC (%)
Figure 5.27: RAROC per product
5.6.4 Solvency position Recall the balance sheet (Figure 5.1) showing total equity of the insurance firm (shares plus reserves) of € 144.7 mio on a total balance sheet of € 805.0. The total equity capital base is 18% (i.e. =144.7/805.0). The minimum solvency requirement under the Solvency I regulations is the maximum of two calculation methods14 (see Table 5.28). Total required solvency margin is € 71.3 mio. The discrepancies between the required solvency margin (€ 71.3) and the amount of economic capital (€ 209.2) illustrates the crudeness of the Solvency I requirements.

A Case Study
177
Method 1: Premium based Method 2: Claims basedTotal Premium 483,252€ Total claims 2005 264,768€
Total claims 2004 256,194€ Amount above € 50 mio 433,252€ Total claims 2003 243,957€
Plus: provisions end 2005 300,575€ Less: provisions start 2003 229,323€
836,172€ 16% of Premiums> € 50 mio 69,320€ Average claims over 3 yrs 278,724€ 18% of € 50 mio 9,000€ Amount over € 35 mio 243,724€
78,320€ 23% of Claims> € 35 mio 56,056€ 26% of € 35 mio 9,100€
65,156€ Reduction (factor 91%) 7,049€ Reduction (factor 91%) 5,864€ Total Solvency Margin 71,271€ Total Solvency Margin 59,292€ Total Solvency Margin 71,271€ (highest of both)
Table 5.28: Solvency Requirements Based on Current Solvency I Regulations As total available equity capital is € 144.7, there is a buffer of about 100% above the minimum requirement. Such a high buffer above the minimum is relatively common in the insurance industry. It may reflect the crudeness of the Solvency I regulations. However, total diversified economic capital is € 209.2 mio. This implies a capital deficit of € 64.5 mio (=209.2-144.7) compared to the internal capital requirement. However, please note the concept of Economic Capital is based on fair value and therefore, economic capital should be compared with fair value equity capital. Figure 5.15 showed that available equity capital on a fair value basis is € 225.2 mio. Therefore there is 8% buffer (225.2/209.2=7.6%) above the internal minimum capital requirement.
5.7 EXTENSIONS TOWARDS LIFE INSURANCE – REFLECTIONS
Thus far, this chapter investigated the implementation of the fair value and economic capital framework in the insurance firm that is present in our case study. Life insurance remained out of scope of the discussions. As indicated on page 155, we have deliberately chosen to investigate a non-life case study. This section makes some general reflections on how to extent the case study results towards life insurance without actually performing a second case study. Life insurance is more cash flow-oriented than non-life insurance. This is due to the long maturity of life products and the relatively high initial costs: an

Risk Management for Insurance Firms
178
accounting profit does not reflect performance well at all. Therefore, the embedded value method has been developed to overcome these problems. And because embedded value (and its alternatives like European and market-consistent embedded value) exists in practice, cash flow patterns are available for the management control of the life business. The embedded value philosophy has resulted in ‘cash flow awareness’ in the life business. The embedded value method has shortcomings that are resolved by fair value. Implementing the concept of fair value and economic capital seems to be less difficult than in non-life insurance because the philosophy is already existent. There is a difference in emphasis between the underwriting risks of life and non-life insurance. For the majority of the non-life products, the premium risk referring to the current year is most important. Reserve risk is less dominant. That is precisely opposite for life insurance: mortality experience over a one year horizon is relatively stable. Hence the ‘premium risk’ (or volatility risk in the IAA definition) is relatively unimportant. When extrapolated over the entire lifetime of the product, volatility of mortality can have large consequences: ‘reserve risk’ (or trend risk/parameter risk) is dominant. The long term of life insurance also requires proper investment of the insurance liabilities. There has been an increasing focus on ALM and ‘liability-driven investment’. Therefore, we believe that implementing the Marktzinsmethode in life insurance is simpler than in non-life insurance. Embedded options and profit sharing are predominantly present in life rather than non-life insurance. Again, this relates to the importance of investments and the long time horizon of the products. This has important consequences for the practical implementation of the Marktzinsmethode in life insurance that are not present in our case study. However, the differences are on the practical implementation, not in the concept. Summarising, there are some differences between life and non-life insurance. Consequently, the numbers and emphasis of the various risks are different. However, the concepts are similar. Therefore, we believe our results could be generalised towards the area of life insurance.

A Case Study
179
5.8 SUMMARY AND CONCLUSIONS
The previous chapters have developed a risk management framework of fair value and economic capital. This chapter describes a case study to investigate whether the framework will ‘work’ in practice. Section 5.2 poses the question “Can the framework for fair value and economic capital be applied to an insurance firm?” This chapter has shown how economic capital methods are applied by illustrating the underlying risk models of an insurance firm in practice. For confidentiality, the results have been anonymised. Reliability and validity are important aspects to generalise the results. To achieve reliability and validity we carefully logged calculations and analyses. This chapter has shown that the framework can indeed be applied to a practical non-life insurance firm. Additionally, section 5.7 expressed a belief that the framework is also valid for life insurance because the concepts are equal. Only numbers and emphases differ between life and non-life insurance.

Risk Management for Insurance Firms
180
NNOOTTEESS TTOO CCHHAAPPTTEERR 1 Yin (1994), p. 13 2 Yin (1994), p. 6 3 Yin (1994), p. 6 4 Remenyi et al. (1998), p. 108 5 Remenyi et al. (1998), p. 164 6 Yin (1994), p. 33 7 Additionally, not all models that we apply in this case study are applied by the insurance firm in its day to day operations. 8 Source: Robeco 9 As discussed in section 2.5.8, estimating the cost of capital can be problematic and this holds for this case as well. For practical reasons, we apply the cost of capital approach used by the firm. It is based upon the following parameters: risk-free rate: 10-yr Dutch government bond 4%, equity risk premium 5%, beta 1.0. This yield a post-tax cost of capital of 9%, which equals 14% pre-tax. It is rounded to 15%. Source: Cost of Capital Analysis (2002), internal document 10 As discussed in section 2.6, catastrophe risk is a specific part of premium risk. Here, it is modelled separately because the case study firm already uses a catastrophe-model. 11 Expected Loss = Probability of Default times Loss Given Default times Exposure at Default. Exposure at Default is maximum reinsured amount, Loss Given Default is assumed fixed at 45%. See for instance Basel II (2005), art. 211 12 i.e. 6, based on rating ambition of 99.95% and a probability distribution. 13 The credit risk of reinsurers is equally allocated to Motor and Property Insurance. 14 Please note that for the calculation of the solvency margin for the product liability insurance the premiums and claims have to be increased by 50%.

181
AAPPPPEENNDDIIXX TTOO CCHHAAPPTTEERR 55
This Appendix supplements chapter 5.
A.1 PREMIUM RISK ECONOMIC CAPITAL CALCULATION Premium risk is calculated by estimating two separate probability distributions that are finally combined into one compound probability distribution. The claim frequency is modelled by a Poisson distribution as suggested by Kaas et al..1 This section discusses the premium risk economic capital calculation for the product Liability. The parameter and outcomes for the other products are different, but the structures of the calculations and the methods used are similar. The parameter of the Poisson distribution equals the mean and also the variance. For the product Liability we estimate a Poisson distribution with parameter 0.344.
Probability DistributionClaim Frequency
0 1 2 3Annual number of cl a i ms
P r obabi l i t y
Figure A.1: Probability Distribution for Claim Frequency
AAppppeennddiixx
AA

Risk Management for Insurance Firms
182
Figure A.2 provides a histogram and probability distribution of the claim amounts. The claim amount distribution for Liability is modelled by a Gamma distribution as proposed by Kaas et al..2 The Gamma distribution has parameters 1.35 and 0.00714 respectively. Both the claim frequency and claim amount distributions are provided by Figure 5.6.
Histogram Claim Amount
-
0.1
0.1
0.2
0.2
0.3
0 200 400 600 800 1000 1200 1400 1600 1800 >2000Cl ai ms Amount
% Probability DistributionClaim Amount
0 100 200 300 400 500 600 700 800C l a i m a mount
P r oba bi l i t y
Figure A.2: Histogram of and Probability Distribution of Claim Amount
Once the parameters for the separate distributions are known, they can be combined into one compound Poisson distribution3 described by mean (α/β) and variance (α/β2) which we can derive from the data. Γ(α) is the so-called Gamma-function.
αλ
α
β1αλβαλ
λP +)+)((Γ!)+(Γ
=)(
Figure A.3 plots this function and derives the mean value and the 99.95%-quantile. The numbers are € 8.5 mio and € 52.0 mio respectively, and these are also provided by Table 5.7. Therefore, economic capital for Liability insurance is € 43.5 mio.

Appendix to Chapter 5
183
Compound Probability Distribution
0 5 10 15 20 25 30 35 40Cl a i m a mount ( € mi o)
P r oba bi l i t y
Expected Loss€ 8.5 mio
99.95th percentile € 52.0 mio
Figure A.3: Compound Probability Distribution
A.2 RESERVE RISK
Section 5.4.2 explains the concept of the loss triangle to calculate reserve risk economic capital. The calculation uses a loss triangle based on expected loss (Figure 5.9) and a loss triangle based on unexpected loss (Figure 5.10). Here, we explain how we derive the cash flows from a completed loss triangle. Fair value is calculated by discounting the cash flows using risk-free rate. Figure A.4 equals Figure 5.9 and is the completed loss triangle based on expected loss. i k 1 2 3 4 5 6
4,919 5,924 5,936 5,940 5,944 5,9469,297 12,402 12,530 12,551 12,550 12,551
11,499 15,113 15,307 15,359 15,362 15,36312,542 16,521 16,805 16,848 16,850 16,85112,642 16,651 16,873 16,915 16,917 16,91811,676 15,491 15,708 15,748 15,751 15,751
20042005
2000200120022003
Figure A.4: Completed Loss Triangle for Property Insurance Based on Expected Loss (See Figure 5.9)
From this we derive the cash flows per development year by subtracting the amounts from subsequent years. For example, the additional cash flow needed in the 3rd development year of 2005 is 15,708,000 – 15,491,000 = 217,000. Performing this calculation for all accident and development years provides the ‘marginal loss triangle’ (Figure A.5).

Risk Management for Insurance Firms
184
i k 1 2 3 4 5 64,919 1,005 13 3 5 29,297 3,105 128 20 -1 1
11,499 3,614 194 52 3 112,542 3,979 283 43 2 112,642 4,009 223 41 3 111,676 3,815 217 40 2 162,575 19,527 1,058 200 14 6Total
2002200320042005
20002001
Figure A.5: Loss Triangle Cash Flow Pattern based on EL
A similar analysis on the completed loss triangle based on unexpected loss results in the two figures below. Figure A.6 equals Figure 5.10 and is the completed loss triangle based on unexpected loss. It results in the marginal loss triangle based on unexpected loss by subtracting the amounts from subsequent development years. For example the cash flow in the 3rd development year of 2005 is 18,033,000 – 17,700,000 = 333,000. Figure A.7 provides the cash flows per accident and development year. i k 1 2 3 4 5 6
4,919 5,924 5,936 5,940 5,944 5,9469,297 12,402 12,530 12,551 12,550 12,552
11,499 15,113 15,307 15,359 15,363 15,36512,542 16,521 16,805 16,871 16,875 16,87712,642 16,651 16,992 17,057 17,061 17,06311,676 17,700 18,033 18,095 18,099 18,100
20042005
2000200120022003
Figure A.6: Completed Loss Triangle for Property Insurance Based on Unexpected Loss (See Figure 5.10)
i k 1 2 3 4 5 6
4,919 1,005 13 3 5 29,297 3,105 128 20 -1 1
11,499 3,614 194 52 4 212,542 3,979 283 66 4 212,642 4,009 342 64 4 211,676 6,024 333 62 4 162,575 21,736 1,293 268 21 9
2002200320042005
20012000
Total Figure A.7: Loss Triangle Cash Flow Pattern based on UL
Having the cash flow pattern available for the expected loss and unexpected loss situation, we can calculate the fair value difference between the two. The NPV of the cash flows under expected loss assumptions is 80,927 and the NPV of cash flows under unexpected loss assumptions is 83,044 (see Figure A.8). Economic capital of 2,117 is the difference between these two numbers. This corresponds to Table 5.11.

Appendix to Chapter 5
185
1 2 3 4 5 662,575 19,527 1,058 200 14 6
80,927 62,575 21,736 1,293 268 21 983,3172,390
NPVCash flow (EL)
NPVEconomic Capital
Cash flow (UL)
year
Figure A.8: NPV based on EL and UL, Resulting in Economic Capital
To calculate the fair value at the beginning of the year, Figure A.9 and A.10 perform the same calculation, but discount with one year less than Figure A.8. Figure A.10 equals Figure A.5, but also shows the expected cash flows in the start of the year. For example, in the row of the second development year, the difference between 19,527 and 15,712 is 3,815. Figure A.10 calculates the value by discounting the cash flows by the risk-free rate. i k 1 2 3 4 5 6
4,919 1,005 13 3 5 29,297 3,105 128 20 -1 111,499 3,614 194 52 3 112,542 3,979 283 43 2 112,642 4,009 223 41 3 111,676 3,815 217 40 2 162,575 19,527 1,058 200 14 650,899 15,712 841 160 11 5
EndStart
2002200320042005
20002001
Figure A.9: Completed Loss Triangle for Property Insurance Based on Expected Loss
1 2 3 4 5 662,575 19,527 1,058 200 14 6
80,927 50,899 15,712 841 160 11 565,643
15,284 Added Fair Value
Cash flow (end of year)NPVCash flow (start of year)NPV
year
Figure A.10: NPV based on ‘end-of-year’ and ‘start-of-year’ Cash Flows
A.3 DIVERSIFICATION
Diversification effects are calculated by correlation matrix multiplication. Correlation matrices are provided for the three insurance products. Additionally, there are correlation matrices for diversification within one risk category and for diversification between risk categories. The correlation matrices are based on expert opinion. Figure A.11 shows the correlation matrices.

Risk Management for Insurance Firms
186
Intra-risk Motor Property Liability
Motor 100% 10% 25%Property 10% 100% 10%Liability 25% 10% 100%
Inter-risk Premium risk Reserve risk Catastrophe Risk
Premium risk 100% 25% 0%Reserve risk 25% 100% 0%Catastrophe Risk 0% 0% 100%
Credit Risk Bonds Mortgages Reinsurance
Bonds 100% 25% 0%Mortgages 25% 100% 0%Reinsurance 0% 0% 100%
Total Risk Underwriting Risk Market Risk Credit Risk
Underwriting Risk 100% 10% 25%Market Risk 10% 100% 50%Credit Risk 25% 50% 100%
Total Risk Equity Risk Interest Rate Risk
Real Estate Risk Credit Spread
Equity Risk 100% 10% 25% 10%Interest Rate Risk 10% 100% 25% 25%Real Estate Risk 25% 25% 100% 25%Credit Spread 10% 25% 25% 100%
Figure A.11: Diversification Matrices Matrix multiplication is the standard calculation method to take into account diversification. The formula below shows the calculation of the diversification effect for premium risk economic capital (see Table 5.13). Because undiversified premium risk economic capital is € 213.2 mio and diversified premium risk economic capital is € 149.8 mio, the diversification effect is 29.8%.
[ ] [ ] [ ]
673149
100102510100102510100
, 43,48154,145115,526
%%%%%%%%%
43,48154,145115,526
ECcorr.ECEC undiv.undivdiv.
=
⎥⎥⎥
⎦
⎤
⎢⎢⎢
⎣
⎡×⎥⎥⎥
⎦
⎤
⎢⎢⎢
⎣
⎡×⎥⎥⎥
⎦
⎤
⎢⎢⎢
⎣
⎡=
××=
This results in the diversification effects as depicted in Table 5.13, Table 5.17, Table 5.19, Figure 5.20, and Table 5.21.
A.4 MARKET RISK The market risk calculation consists of the components described in section 5.5.1. The market risk variables are estimated by a Nelson-Siegel autocorrelation model including mean-reversion.4 Therefore the expected interest rate equals the current interest rate curve. The interest rate curve is used to value the cash flows of assets and liabilities, resulting in total value. In

Appendix to Chapter 5
187
2005 the total value is € 178.7 mio, which corresponds with Figure 5.15 (i.e. shares plus fair value reserves equals 1.0 + 177.7 = 178.7 mio). When applied in the simulation process, the model produces a value of the insurance firm per interest rate path. Figure A.12 provides the interest rate developments over time and shows next year’s expected value in the expected interest rate scenario (i.e. € 185.6 mio) and the 99.95th percentile scenario (€ 146.3 mio). Economic capital is the difference between these two values.
Interest Rate Paths
0%
2%
4%
6%
8%
2005 2007 2009 2011 2013 2015 2017 2019
Interest Rate Value based on UL € 146.3 mio
Expected Value (2006) € 185.6 mio
Current Value (2005) € 178.7 mio
Figure A.12: Interest Rate Paths and Resulting Values
A.5 CREDIT RISK
The credit risk calculation is based on simulation in which for a given bond with a given credit rating the value development within one year is calculated. Given the current credit rating, the model determines next year’s rating and consequently next year’s value per simulation path. The rating migration matrix is provided in Table A.13.

Risk Management for Insurance Firms
188
AAA AA A BBB BB B CCC-CAAA 97.03 2.96AA 0.48 88.02 11.48A 2.11 88.71 7.72 1.23 0.18
BBB 4.68 88.6 5.26 0.88BB 0.4 7.18 74.1 10.75 3.59B 0.32 0.64 3.57 78.57 5.85
CCC-C 2.38 4.76 59.52 Table A.13: Credit Risk Migration Matrix

Appendix to Chapter 5
189
NNOOTTEESS TTOO CCHHAAPPTTEERR 1 Kaas et al. (2001), p. 50 2 Kaas et al. (2001), p. 50 3 Bogdanov et al. (2003), p. 3 4 Filipovic (1999), p. 1


191
CCOONNCCLLUUSSIIOONNSS AANNDD
RREECCOOMMMMEENNDDAATTIIOONNSS
This chapter concludes our total research. The first chapter started by describing the developments in the area of insurance supervision and by observing convergence in the financial industry. This convergence takes place both through the phenomenon of Bancassurance and All-Finanz and through Alternative Risk Transfer (ART) techniques. This urges for identical risk measurement methods in the banking and the insurance industry. Also, the first chapter observed that while the concept of Economic Capital arises as best practice risk management method in banking, its application in insurance has remained relatively underexposed. Therefore, we wondered if we could design a risk management framework for insurance firms. We posed ourselves the following research question: ‘What is an appropriate risk measurement and economic capital framework for insurance firms. How can insurance supervisors use this framework for supervisory purposes?’ To be able to answer this main research question, we unravelled it into six sub-questions. The chapters 2, 3, and 4 answer these. Chapter 5 tests the models and methods in a case study. This last chapter brings these answers together for answering our main question. The following sections summarise the answers to the sub-questions and concluding in an overall answer on our main research question. Also, this chapter describes the limitations to our research and the recommendations for further research.
CChhaapptteerr
66

Risk Management for Insurance Firms
192
6.1 ONE COHERENT FRAMEWORK FOR ECONOMIC CAPITAL AND FAIR
VALUE This section will discuss the economic capital framework and the concept of fair value within insurance firms.
6.1.1 Conclusions and Answers to the Research Questions The first research question is ‘What is the concept of Economic Capital?’ Section 2.2 describes economic capital as an overarching umbrella that brings different risks under a same denominator. Economic capital is being used in banking for allocation of scarce resources, at the senior management level (performance measurement and capital allocation) up to the level of individual products (risk-based pricing). Economic capital is determined via the statistically determined worst-case unexpected loss within a one-year time horizon. The performance measure RAROC plays a central role in the economic capital framework. The second research question is ‘What is an appropriate valuation method for insurance liabilities that adequately takes into account risks?’ Chapter 2 argues that the current accounting system fails to reflect risks adequately and that fair value is better capable to take risk into account. The problem is that insurance liabilities are not actively traded in a liquid secondary market and therefore frequent trading (fair) values are unavailable. Traditional valuation methods determine the value by discounting the expected cash flows by a discount rate higher than the risk-free rate. Methods like CAPM are commonly used to determine the discount rate. Section 2.5 argues that these methods cannot be applied to insurance liabilities. Therefore, section 2.5 developed a valuation method to determine the fair value of insurance liabilities.
Margin ValueMarket
)( timeat flow Cash Value Fair
t+
+=∑ t
frt
1 The fair value of insurance liabilities consists of two components: the best-estimate and a market value margin. The best-estimate is determined by discounting expected future cash flows with a risk-free discount rate. Expected future cash flows are determined by the loss triangle method and mortality

Conclusions and Recommendations
193
tables for non-life and life insurance respectively. The market value margin is calculated as the cost of holding risk capital, i.e. economic capital. Section 2.5 argues that a market value margin related to a cost-of-capital approach should be preferred over a percentile approach. The latter is frequently proposed in reviews of accounting and solvency systems (like IFRS, Solvency II). Therefore, the approach of section 2.5 is relatively new in the area of insurance. The total fair value can only be determined after the economic capital is known. As it includes elements that are specific to the individual firm, this fair value measure is an entity-specific fair value. One of the specific elements is the cost of capital. Section 2.5 discusses that applying CAPM can be problematic for a number of reasons. Unfortunately, these problems have not been resolved to date. The third research question is: ‘How can we use this method to determine economic capital for underwriting risk?’ Section 2.6 develops a method that is consistent for life and non-life insurance. It is based on the loss triangle method and mortality tables. Section 2.6 develops this method for non-life and life underwriting risk specifically.
Economic CapitalTotal Fair Value
Worst-case risk driver
Loss Triangles
Risk Margincost of holding economic capital
Worst-caseNPV worst-case cash flows
Economic CapitalEconomic Capital
Worst-case risk driver
Mortality Tables
Risk Margincost of holding economic capital
Market Value Margincost of holding economic capital
Risk Margincost of holding economic capital
Best-estimateNPV expected cash flows
Figure 6.1: Fair Value and Economic Capital for Insurance Firms

Risk Management for Insurance Firms
194
Chapter 5 tests the framework for fair value and economic capital in a case study. It illustrates the applications of the economic capital models and consequently the calculation of the market value margin. The case study applies the models to a non-life insurance firm. The numbers and outcomes have been anonymised. The developments of fair value and economic capital emphasise the importance of a cash flow perspective for insurance firms. Cash flows are derived from the loss triangles and mortality tables for non-life and life insurance respectively. The concept of economic capital and fair value bring non-life and life insurance closer together because the methods are basically identical. We propose two versions of the performance measure RAROC for insurance firms based on fair value. The lifetime-RAROC is suitable for, amongst others, pricing whilst the one year-RAROC can be used for performance measurement.
100%
Capital)ic NPV(EconomValue Fair lifetime ×=RAROC
100%
CapitalEconomic Value FairValue Fair
1t
0t1tyear-one ×
−=
=
==RAROC
6.1.2 Limitations of the Research The fair value based framework for economic capital for insurance firms is not completely consistent with the economic capital framework that is present within banking. This research has not been able to investigate all aspects of both frameworks. Only first steps have been set to improve further convergence of the risk models within banking and insurance.1 This limitation is especially relevant when All-Finanz institutions wish to implement the economic capital method. When inconsistencies persist, these may have far-reaching consequences for pricing of products. Unfortunately, this research has not been able to take the model consistency between insurance and banking as a design criterion. This is a limitation of our research and more research is needed to resolve this issue. This thesis has briefly discussed the problems concerning the cost of (equity) capital. Unfortunately, it has not resolved them. Although an impressive body of
Conclusions and Recommendations
195
literature is available on the issue of the cost of capital in relation to the CAPM and related theories, the essential problems have remained unsolved.2 However, we have chosen not to aim to resolve them, but applied CAPM despite its important limitations. Section 2.6 touches only briefly upon the categories of risk models. It seems that insurers are starting to use actuarial models that fit probability distributions to losses. This is contrary to econometric models that relate explanatory variables to the losses. We have not been able to research to what extent models can be improved by applying the econometric modelling approach. At first glance it may be the case that a better understanding of the risk drivers will improve the steering (management control) of the risks. Therefore, it may be worthwhile to investigate to what extent risk models can be related to the explanatory variables.
6.2 SOLVENCY II This section discusses the fourth and fifth research question on the topic of insurance supervision. Its final focus is the European Solvency II project.
6.2.1 Conclusions and Answers to the Research Questions Our fourth research question is ‘What are the developments in the area of insurance supervision?’ Chapter 3 discusses that the current E.U. insurance supervisory framework has become outdated. A number of countries around the globe have been reviewing their insurance supervisory frameworks, like Australia, Canada, the Netherlands and Switzerland. Most reviews include an increasing reliance on fair value of insurance liabilities. This includes a market value margin as we discussed in the previous section. Chapter 2 proposes a market value margin based on the cost-of-capital approach rather than a percentile approach. Additionally, most Solvency review projects include approaches in which internal models from the insurance firm may be used to calculate the solvency requirement. The Solvency II project reviews the total European supervisory framework. It adopts the three pillar structure that is also present in Basel II. At this stage in the process of Solvency II, there is much uncertainty on the exact outcomes

Risk Management for Insurance Firms
196
because discussions on various issues are still too high-level. It is clear that fair value will be the valuation principle for the insurance liabilities, but it is unclear how the market value margin will be determined. Also, economic capital-based approaches will be used for the solvency requirement. However, there is no clarity on qualification criteria or exact formulae. Our fifth research question is ‘What recommendations can we make to increase effectiveness of these developments?’ Section 3.6 argues that the Solvency II project is far too ambitious. It compared the Solvency II project to its banking equivalent of Basel II. While Solvency II is further behind, it has more ambitious objectives. Section 3.7 makes five recommendations to the Committee of European Insurance and Occupational Pensions Supervisors (CEIOPS), by which the Solvency II project is run on behalf of the European Commission. The recommendations answer the fifth research question. They are: CEIOPS should publish a concrete proposal as soon as possible; CEIOPS should prescribe an internal model structure for the internal model
approach; CEIOPS should include long term scenario analysis in Pillar 2; CEIOPS should not limit the asset management of insurance firms; and CEIOPS should adopt a cost-of-capital approach for the market value
margin;
6.2.2 Limitations of the Research We have not been able to design a total set of formulae and internal model criteria for the Solvency II project. With such a set we could have given our interpretation to our own recommendations above and partially resolved the problem. Initially, our research focussed on the Dutch insurance market and there are still quite some discrepancies between the various European countries. As a result, such an investigation would be a too large task in the timeframe of our research. Additionally, this would have been quite optimistic for one person given the total amount of staff that is currently allocated to the Solvency II project in various insurance firms and other organisations.

Conclusions and Recommendations
197
6.3 CONSEQUENCES FOR MANAGEMENT CONTROL
This section summarises chapter 4. It presents the management control consequences for the matching process of insurers.
6.3.1 Conclusions and Answers to the Research Questions This thesis presents an economic capital model for underwriting risks in insurance firms. In addition, chapters 2 and 4 discuss the importance of economic capital as a management control instrument. This includes capital allocation and performance measurement. The sixth research question is ‘What is an appropriate method for the management control of an insurers mismatch position?’ Chapter 4 describes the current methods for matching assets and liabilities. They result in three violations of the conditions for effective control and three aspects of goal incongruence. Therefore, chapter 4 develops the Marktzinsmethode separating the total insurance firm into two responsibility centres: an underwriting and investment centre. The demarcation between underwriting and investment is an innovative view in the insurance industry, even though it is well-known in banking. The underwriting risk is allocated to the underwriting centre and the investment risk and mismatch position are allocated to the investment centre. The underwriting centre invests its insurance liabilities at a risk-free rate of return in the investment centre (see Figure 6.2).
Liabilities
Capital
Internal transaction
(no investmentrisk)
Assets
Internal transaction
Assets (mismatch)
Underwriting Responsibility Centre
Liabilities
Capital
Internal transaction
(no investment risk)
Assets
Investment Responsibility Centre
Internal transaction
Assets (mismatch) Internal
transferprice
Liabilities
Capital
Internal transaction
(no investmentrisk)
Assets
Internal transaction
Assets (mismatch)
Underwriting Responsibility Centre
Liabilities
Capital
Internal transaction
(no investment risk)
Assets
Investment Responsibility Centre
Internal transaction
Assets (mismatch) Internal
transferprice
Figure 6.2: Marktzinsmethode in Insurance
Both responsibility centres are evaluated based on their fair value and economic capital performance. Choosing the risk-free rate as the appropriate

Risk Management for Insurance Firms
198
transfer price is very important because it resolves the problems of goal congruence. Section 4.5.5 shows that this resolved the identified problems. Chapter 5 tests the Marktzinsmethode in a non-life insurance firm through a case study. The case study confirms our initial conclusions. As a result, the management control framework for the insurance firm as a whole has improved.
6.3.2 Limitations of the Research The concept of the Marktzinsmethode has been widely applied in banking. However, its application in insurance is relatively limited. As a result there is little practical experience with it. The concept of replicating portfolios described by Pelsser3 only partially resembles the Marktzinsmethode, so there may be some practical experience. An in-depth case study or a laboratory experiment would provide much knowledge about its applicability. Also, it might provide the necessary practical insight for insurance firms that consider practical implementation. Unfortunately, we did not have an appropriate insurance firm available with sufficient time and resources to test the Marktzinsmethode in practice in the period of our research. It will be a valuable recommendation for further research.
6.4 OVERALL CONCLUSION
Having answered our sub-questions, we return to our main research question ‘What is an appropriate risk management and economic capital framework for insurance firms? How can insurance supervisors use this framework for supervisory purposes?’ An appropriate risk management framework is based upon the fair value and potential deviations of the fair value. We argued that fair value of insurance liabilities consists of two parts: the best-estimate and the market value margin. The best-estimate is determined by discounting expected future cash flows at the risk-free rate. Economic capital is the difference between the worst-case and best-estimate fair value. The market value margin equals the cost of holding the economic capital. Insurance supervisors, and especially those assembled in the Solvency II project, should build upon the knowledge gathered by the industry. However, to

Conclusions and Recommendations
199
provide an impetus to the implementation of economic capital models and the knowledge in the industry, supervisors should present clear and relatively simple formulae as soon as possible. Although it may seem paradoxical, it is a necessary and intermediate step towards the holy grail of fully internal model based supervision. We have not researched the application the concept of Economic Capital in itself. Nevertheless, there are still some interesting issues, like the calculation of diversification effects, allocation of diversification benefits to business units, and the application of a hurdle rate. We have not discussed these issues because they are identical for insurance firms and banking. Before we can resolve them in insurance firms, we first needed the economic capital models. And, it is likely that part of the issues will be resolved in the banking industry firstly because they are further ahead implementing of the concept of Economic Capital. Speaking of diversification benefits. One of the reasons for the Bancassurance and All-Finanz institutions has been the effect of diversification.4 As diversification is treated explicitly in the concept of Economic Capital, we expect this will be a driver for financial institutions to actively seek diversification. This may be the first step towards further convergence in the financial industry.
6.5 RECOMMENDATIONS FOR FURTHER RESEARCH The availability of proper risk measurement methods for underwriting risk opens the door towards further securitisation of insurance liabilities.5 There is enormous experience with asset securitisation and there have been some insurance securitisations. However, more research is needed on how to structure and value such transactions. Having risk models in place to value insurance liabilities will open the door towards repackaging and trading them.6 The availability of a deep and liquid secondary market is likely to resolve the fair value issue for insurance liabilities as well. Paradoxally, the discussions on the fair value market value margin will appear to have been necessary in order to make it irrelevant. As soon as a market value can be observed, insurance firms will depart the model based valuation method. Lowe concludes that it is the industry’s challenge to improve information so that entity-specific values converge into market values7 satisfying the Law of One Price (see

Risk Management for Insurance Firms
200
section 2.5.2). Before, we arrive at that stage, it is necessary to better investigate the potential basic structures for insurance liability securitisations and the size and importance of the inherent risks. The second recommendation for further research is on embedded options in insurance products. The Marktzinsmethode requires that such options are quantified and that the underwriting centre hedges the financial embedded options at the investment centre. Plain guarantees can be valued relatively simple using standard option theory. Other embedded options like U-return guarantees may be more difficult to value because they cannot be fully hedged in the financial markets and therefore they should remain in the underwriting centre. Other options are partly related to client behaviour. Actuaries or financial specialists may value these options as pure financial options. However, research on mortgage prepayments has shown that financial option theory is unable to predict mortgage prepayment accurately.8 The same may hold for embedded options in insurance products. This thesis has researched the application of economic capital for insurance firms. Whilst pension funds are basically similar to life insurance firms, their practical operation differs. For instance, pension funds are much more dependent on public policy choices and political developments. Also, pension funds have possibilities to limit indexing when developments turn out badly. This is an important steering parameter. These aspects make pension funds just different from insurance firms. However, Siegelaer is convinced that the concepts of economic capital and RAROC will play an important role for pension funds in the near future.9 Summarising, we arrive at the following recommendations for further research: How can we limit potential inconsistencies between the risk models present
in banking and insurance firms? How should we determine a cost of (equity) capital for an insurance firm,
given the present limitations of the existing theories? How can we build an econometric model for underwriting risk that relates
the risk to the underlying explanatory variables? What are the practical consequences of implementing the Marktzins-
methode in practice?

Conclusions and Recommendations
201
What are available structures for securitising underwriting risks? What are the embedded options in insurance products and how should their
risks be measured? How can we apply the framework for fair value and economic capital in
pension funds?

Risk Management for Insurance Firms
202
NNOOTTEESS TTOO CCHHAAPPTTEERR 1 Porteous et al. (2003), p. 28 2 For instance: Kielholz (2000), note 7 and section 6 3 Pelsser (2003), p. 290 4 Bikker, van Lelyveld (2002-a), p. 741 5 Cowley, Cummins (2005), p. 194 6 Cowley, Cummins (2005), p. 205 7 Lowe (2005), p. 12 8 Alink (2002), p. 80 9 Siegelaer (2003), p. 13

203
LLIISSTT OOFF FFIIGGUURREESS AANNDD TTAABBLLEESS
LIST OF FIGURES
Figure 1.1: Research Structure ------------------------------------------------------------- 7 Figure 1.2: A Typical Insurance Firm Balance Sheet --------------------------------10 Figure 1.3: Risk Taxonomy------------------------------------------------------------------12 Figure 1.4: Fair Value of Insurance Liabilities is Best-Estimate plus a Market
Value Margin ----------------------------------------------------------------------------19 Figure 1.5: Fair Value and Economic Capital for Underwriting Risk --------------20 Figure 1.6: Total Capital Requirement Related to Prudence and Solvency
Requirement -----------------------------------------------------------------------------21 Figure 1.7: Structure of the Marktzinsmethode in Insurance -----------------------23 Figure 2.1: Economic Capital Covers the Worst-case Decrease in Value ------30 Figure 2.2: The Loss Triangle is used to Derive Claim Patterns ------------------34 Figure 2.4: There is a Difference in Fair Value Due to Risk ------------------------42 Figure 2.5: Methods to Determine Fair Value for Insurance Liabilities -----------46 Figure 2.6: Fair Value of Insurance Liabilities is Best-Estimate plus a Market
Value Margin ----------------------------------------------------------------------------48 Figure 2.7: The Market Value Margin Determined Through the Percentile
Approach ---------------------------------------------------------------------------------53 Figure 2.9: The Economic Capital Approach for Non-Life Underwriting Risk --66 Figure 2.10: The Economic Capital Approach for Life Underwriting Risk -------68 Figure 2.11: Four Components of Life Underwriting Risk Economic Capital ---69 Figure 2.12: Economic Capital in the Dutch Insurance Market (MVM=Market
Value Margin) ---------------------------------------------------------------------------73

Risk Management for Insurance Firms
204
Figure 2.13: Fair Value and Economic Capital for Underwriting Risk ------------77 Figure 3.2: Components of the Swiss Solvency Test --------------------------------93 Figure 3.3: Cost-of-Capital Approach Derives the Market Value Margin from the
Solvency Requirement ----------------------------------------------------------------94 Figure 3.5: Solvency II is Built around Three Pillars ----------------------------------98 Figure 3.6: Total Capital Requirement Related to Prudence and Solvency
Requirement ---------------------------------------------------------------------------101 Figure 3.8: The Solvency II Project has Extremely High Ambitions -------------110 Figure 4.1: Management Control Components and the Relation to Risk
Management ---------------------------------------------------------------------------121 Figure 4.2: System Theory Components related to Management Control ----122 Figure 4.3: A Typical Insurance Balance Sheet and Relevant Components for
ALM -----------------------------------------------------------------------------------124 Figure 4.4: Marktzinsmethode Splits Banking Result Components -------------132 Figure 4.5: Structure of the Marktzinsmethode in Insurance ---------------------135 Figure 4.7: Transfer Price Structure ----------------------------------------------------137 Figure 4.8: Market Risk Economic Capital --------------------------------------------142 Figure 4.9: Credit Risk Economic Capital ---------------------------------------------144 Figure 5.3: Composition of Total Investment and Fixed Income Portfolio -----160 Figure 5.4: Risk-free Interest Rate Curve (Used as Discount Rate) ------------161 Figure 5.5 Historical Claim Pattern -----------------------------------------------------161 Figure 5.6: Probability Distributions for Premium Risk -----------------------------162 Figure 5.8: Initial Loss Triangle for Property Insurance ----------------------------163 Figure 5.9: Completed Loss Triangle for Property Insurance Based on Expected
Loss -----------------------------------------------------------------------------------164 Figure 5.10: Completed Loss Triangle for Property Insurance Based on
Unexpected Loss ---------------------------------------------------------------------164 Figure 5.16: Cash Flow Pattern of Investment Centre -----------------------------168 Figure 5.18: Credit Risk of Reinsurance Counterparties --------------------------170 Figure 5.20: Total Economic Capital, including Diversification Effects ---------172 Figure 5.22: Allocation of Total Economic Capital ----------------------------------173 Figure 5.27: RAROC per product -------------------------------------------------------176 Figure A.1: Probability Distribution for Claim Frequency --------------------------181 Figure A.2: Histogram of and Probability Distribution of Claim Amount --------182 Figure A.3: Compound Probability Distribution --------------------------------------183

List of Figures and Tables
205
Figure A.4: Completed Loss Triangle for Property Insurance Based on Expected Loss ----------------------------------------------------------------------------------- 183
Figure A.5: Loss Triangle Cash Flow Pattern based on EL ---------------------- 184 Figure A.6: Completed Loss Triangle for Property Insurance Based on
Unexpected Loss (See Figure 5.10) --------------------------------------------- 184 Figure A.7: Loss Triangle Cash Flow Pattern based on UL ---------------------- 184 Figure A.8: NPV based on EL and UL, Resulting in Economic Capital -------- 185 Figure A.9: Completed Loss Triangle for Property Insurance Based on Expected
Loss ----------------------------------------------------------------------------------- 185 Figure A.10: NPV based on ‘end-of-year’ and ‘start-of-year’ Cash Flows ----- 185 Figure A.11: Diversification Matrices --------------------------------------------------- 186 Figure A.12: Interest Rate Paths and Resulting Values --------------------------- 187 Figure 6.1: Fair Value and Economic Capital for Insurance Firms -------------- 193 Figure 6.2: Marktzinsmethode in Insurance ------------------------------------------ 197 Figuur S.1: Actuele waarde van verzekeringsverplichtingen is best-estimate en
een risicomarge ----------------------------------------------------------------------- 210 Figuur S.2: Actuele waarde en economic capital voor verzekeringsrisico ---- 211 Figuur S.3: De totale vermogenseis gerelateerd aan prudentie en
solvabiliteitsvereiste ------------------------------------------------------------------ 212 Figuur S.4: Scheiding van Verzekerings- en Beleggingsrisico’s via Marktzins-
methode -------------------------------------------------------------------------------- 214
LIST OF TABLES
Table 1.8: Objective and Performance Measures within Marktzinsmethode in Insurance ---------------------------------------------------------------------------------23
Table 2.3: The Differences between DFA and Economic Capital -----------------36 Table 2.8: Four Possible Economic Capital Approaches ----------------------------62 Table 3.1: Current E.U. Insurance Solvency Requirements are Relatively Crude
-------------------------------------------------------------------------------------86 Table 3.4: Calls for Advice from the E.U. in the Solvency II Project --------------96 Table 3.7: Risk Measures in the Solvency II Standard Formulae --------------- 102 Table 4.6: Objective and Performance Measures within Marktzinsmethode in
Insurance ------------------------------------------------------------------------------- 136 Table 4.10: Example Interest Rates ---------------------------------------------------- 145

Risk Management for Insurance Firms
206
Table 4.11: Performance of the Underwriting Centre ------------------------------145 Table 4.12: Balance Sheet of the Underwriting Centre ----------------------------146 Table 4.13: Balance Sheet of the Investment Centre without Mismatch Position
-----------------------------------------------------------------------------------146 Table 4.14: Balance Sheet of the Investment Centre with Mismatch Position 147 Table 4.15: Example Interest Rates – Parallel Interest Rate Change ----------147 Table 4.16: Balance Sheet of the Investment Centre after Interest Rate Change
-----------------------------------------------------------------------------------148 Table 4.17: Performance of the Underwriting Centre after Changing Mortality
Assumptions ---------------------------------------------------------------------------149 Table 4.18: Balance Sheet of the Underwriting Centre after Changing Mortality
Assumptions ---------------------------------------------------------------------------149 Table 5.1: Balance Sheet -----------------------------------------------------------------158 Table 5.2: Profit and Loss Statement ---------------------------------------------------159 Table 5.7: Premium Risk Economic Capital per Product --------------------------163 Table 5.11: Reserve Risk Economic Capital per Product -------------------------165 Table 5.12: Catastrophe Risk Economic Capital per Product --------------------165 Table 5.13: Economic Capital per Product and Total Diversified Underwriting
Risk Economic Capital --------------------------------------------------------------166 Table 5.14: Undiversified Economic Capital per Product --------------------------166 Table 5.15: Balance Sheet – Accounting and Fair Value Representation -----167 Table 5.17: Diversified Market Risk Economic Capital -----------------------------170 Table 5.19: Diversified Credit Risk Economic Capital ------------------------------171 Table 5.21: Diversified Economic Capital per Risk Category ---------------------172 Table 5.23: Fair Value Changes in 2005 ----------------------------------------------173 Table 5.24: RAROC Profit and Loss Statement for the Underwriting Centre--174 Table 5.25: RAROC Profit and Loss Statement for the Investment Centre ---175 Table 5.26: Performance Measurement of the Insurance Firm as a Whole --176 Table 5.28: Solvency Requirements Based on Current Solvency I Regulations
-----------------------------------------------------------------------------------177 Table A.13: Credit Risk Migration Matrix ----------------------------------------------188 Tabel S.5: Doelstelling en prestatiemaatstaven binnen de Marktzinsmethode
voor verzekeraars --------------------------------------------------------------------214

207
SSAAMMEENNVVAATTTTIINNGG
Dit proefschrift gaat over risico management bij verzekeraars, in het bijzonder over fair value en economic capital. Het economic capital concept is de standaardmethode voor risicomanagement geworden bij banken, maar de verzekeringssector lijkt achter te blijven. Er is echter weinig bekend over economic capital modellen of toepassingen in het verzekeringswezen. De doelstelling van dit onderzoek is om het bestaande management control raamwerk van verzekeraars te verbeteren door een methode te ontwerpen om risico’s en economic capital te meten. De overkoepelende onderzoeksvraag is:
“Wat is geschikt risico- en economic capital raamwerk voor verzekeringsinstellingen? Hoe kunnen toezichthouders dit raamwerk gebruiken voor het toezichtkader?”
Om deze vraag te beantwoorden, formuleert hoofdstuk 1 zes onderzoeks-vragen: 1. Wat is het economic capital concept? 2. Wat is een geschikte waarderingsmethode voor verzekeringsverplichtingen
die rekening houdt met risico? 3. Hoe kunnen we deze methode gebruiken om het economic capital voor
verzekeringsrisico te bepalen? 4. Wat zijn de ontwikkelingen in het toezicht op verzekeraars?

Risk Management for Insurance Firms
208
5. Welke aanbevelingen kunnen we doen om de effectiviteit van deze ontwikkelingen te vergroten?
6. Wat is een passend raamwerk voor de management control van de mismatch positie van een verzekeraar?
Hoofdstuk 2 beantwoordt de onderzoeksvragen 1, 2 en 3. Het economic capital concept is een management control principe inclusief methoden om risico’s te meten, waarbij het risico wordt gerelateerd aan verlies in het statistisch bepaalde ‘slechtste scenario’ binnen een gekozen tijdsperiode. Op deze wijze meet het economic capital concept verschillende risico’s op een consistente wijze wat het vervolgens weer mogelijk maakt om risico’s als appels met appels te vergelijken. Bij banken zijn er twee vormen economic capital modellen. De EL-UL (Expected Loss, Unexpected Loss) methode kijkt naar verliezen in boekhoudkundig resultaat. De VAR methode kijkt naar verlies in (actuele) waarde. De prestatiemaatstaf RAROC speelt een centrale rol binnen het economic capital concept vanwege vermogensallocatie en risk-based pricing. Relevante risicomeetmethoden voor verzekeraars zijn kansverdelingen voor schade en de schadedriehoek (schadeverzekeringen) en sterftetabellen (levensverzekeringen). Kansverdelingen worden gebruikt om het aantal claims en de omvang van de claims te bepalen. Schadedriehoeken worden gebruikt om het uitlooppatroon van bestaande schademeldingen over de tijd te schatten. Steftetafels worden gebruikt om het kasstroompatroon door de tijd vast te stellen. Van oudsher worden deze instrumenten gebruikt om de technische voorzieningen te bepalen. De huidige boekhoudregels houden echter onvol-doende rekening met risico. Het risico wordt impliciet meegenomen door de voorzieningen prudent vast te stellen. Recente ontwikkelingen spitsen zich toe op de actuele waarde (fair value) van financiële instrumenten. Omdat er geen liquide tweedehands markt is voor verzekeringsverplichtingen, kunnen we de actuele waarde niet afleiden van recente transacties, de meest gewenste meetmethode die wordt voorgesteld door onder meer de International Accounting Standards Board. Daarom wordt de actuele waarde bepaald via waarderingsmodellen. De aanwezigheid van risico stelt de modellen voor extra uitdagingen. Paragraaf 2.5 onderzoekt drie actuele waarde modellen.

Samenvatting
209
1. Netto contante waarde-modellen waarbij risico wordt meegenomen door de discontovoet aan te passen (in de noemer);
2. Netto contante waarde-modellen waarbij risico wordt meegenomen via een risico-opslag bovenop de verwachte kasstromen (in de teller). De verwachte kasstromen worden verdisconteerd met de risicovrije rente.
3. Arbitragemodellen waarbij de actuele waarde wordt afgeleid van een portefeuille instrumenten met hetzelfde kasstroompatroon. Risico wordt hier impliciet behandeld.
Van oudsher betekent het toepassen van de netto contante waarde methode dat we een discontovoet kiezen die past bij het risicoprofiel, bijvoorbeeld via CAPM. Echter, deze methodiek is niet mogelijk voor verzekeringsverplichtingen om een aantal redenen (zie paragraaf 2.5). Datzelfde geldt voor arbitragemodellen als optiewaardering. Daarom beargumenteert paragraaf 2.5 dat methode 2 het beste past binnen de moderne financieringstheorieën. Het resultaat is een fair value maatstaf die bestaat uit een ‘best-estimate’ (netto contante waarde van verwachte kasstromen, disconteren met een risicovrije rente) en een ‘market value margin’ als prudentie maatstaf (Figuur S.1).
Margin ValueMarket
)( tijdstip op Kasstroom Value Fair
t+
+=∑ t
frt
1 De market value margin moet men zien als vergoeding voor het te dragen risico, maar tegelijkertijd fungeert het ook als buffer om risico’s op te vangen. En dat laatste is identiek aan de functie van het economic capital. Om dit ongewenste effect op te vangen, moet de market value margin fungeren als een vorm van hybride eigen vermogen op de balans. De Australische toezichthouder brengt een percentiel-benadering naar voren voor de market value margin: een 25% percentiel bovenop de best-estimate. De totale technische voorzieningen worden dus bepaald als het 75%-percentiel van de kansverdeling (best-estimate is 50%, market value margin is 25%). De Zwitserse toezichthouder introduceert een cost-of-capital benadering: de market value margin bestaat uit de kosten om in de toekomst risico-vermogen aan te moeten houden. Paragraaf 2.5 stelt dat de laatste methode het beste past in de moderne financieringstheorieën. En het past bij het economic capital concept,

Risk Management for Insurance Firms
210
waarbij vermogen, en niet prudentie in de technische voorzieningen, als buffer dient voor risico. Aangezien de kosten van het eigen vermogen en de kalibratie van het economic capital specifiek zijn voor een bepaalde verzekeraar, mondt deze fair value definitie dus uit in een ‘entity-specific value’.
Assets
(government) bonds and other
asset classes
Liabilities
Prudence
Equity
Beleggingen
(actuele value)
Verzekeringsbalans
Verzekeringsverplich-
tingen
Prudentie
Eigen Vermogen
Verwachte toekomstige kas-stromen disconteren met risicovrije rentevoet levert de ‘Best-estimate’ waarde op (inclusief Expected Loss)
Market Value Margin weerspiegelt risico (Unexpected Loss)
Figuur S.1: Actuele waarde van verzekeringsverplichtingen is best-estimate en een risicomarge
Het bovenstaande impliceert dat economic capital wordt afgeleid als het verschil tussen de ‘worst case’ en de ‘best estimate’ actuele waarde. Paragraaf 2.6 ontwikkelt een economic capital methodiek die gebruik maakt van de schadedriehoek en sterftetafels om het verwachte kasstroompatroon af te leiden (zie figuur S.2). Vanaf daar berekenen we de best-estimate waarde, het economic capital en vervolgens de market value margin. De totale actuele waarde is de som van best-estimate en de market value margin. We stellen twee versies van de RAROC voor, beiden gebaseerd op de actuele waarde. De life-time RAROC is geschikt voor onder meer pricing, terwijl de eenjaars RAROC kan worden gebruikt voor performance meting.
100%
Capital)ic NPV(EconomValue Fair lifetime ×=RAROC
100%
CapitalEconomic Value FairValue Fair
1t
0t1tyear-one ×
−=
=
==RAROC
Hoofdstuk 5 past gevalstudie onderzoek toe om de toepassing van het fair value en economic capital raamwerk te toetsen in de praktijk. De gevalstudie

Samenvatting
211
bestaat uit een schadeverzekeraar, omdat daar minder kennis is over een waardegedreven raamwerk dan in het levensverzekeringenbedrijf (vergelijk embedded value). De gevalstudie laat zien hoe fair value en economic capital worden berekend voor verzekeringstechnische risico’s.
Economic CapitalTotale Fair Value
Worst-case risk driver
Schadedriehoeken
Risk Margincost of holding economic capital
Worst-caseNCW worst-case kasstromen
Economic CapitalEconomic Capital
Worst-case risk driver
Sterftetafels
Risk Margincost of holding economic capital
Market Value Marginkosten van het economic capital
Risk Margincost of holding economic capital
Best-estimateNCW verwachte kasstromen
Figuur S.2: Actuele waarde en economic capital voor verzekeringsrisico
Hoofdstuk 3 onderzoekt de ontwikkelingen in het toezicht en beantwoordt onderzoeksvragen 4 en 5. De bestaande E.U. solvabiliteitsregels zijn ongevoelig voor het risicoprofiel en dat wordt ook onderstreept door de verzekeringssector. Het feit dat verzekeraars intern met twee- tot driemaal de E.U. solvabiliteit rekenen, illustreert de grofmazigheid van de solvabiliteitsre-gels. Daarom worden de regels op dit moment herzien via het Solvency II project. Paragraaf 3.3 beschrijft vier nationale toezichtkaders die recent zijn herzien en als voorbeeld dienen voor het Solvency II project.

Risk Management for Insurance Firms
212
De belangrijkste bevindingen zijn: Er is steeds meer aandacht voor risco in de toezichtkaders; Er is een trend richting actuele waarde voor de verzekeringsverplichtingen
om risico in voldoende mate te kunnen weergeven. Er zijn meerdere bena-deringen voor de market value margin;
Het wordt toegestaan om interne modellen te gebruiken voor het bepalen van de solvabiliteitseis. Echter, er zijn relatief weinig compliance criteria.
Het Solvency II project wordt ontworpen rondom de drie-pijler structuur, zoals die ook bestaat in Bazel II, het recent herziene toezichtraamwerk voor banken. Echter, Solvency II omvat meer elementen in pijler 1 en 2 dan Bazel II. Aanvullende pijler 1 elementen zijn waardering van de technische voorzieningen en beleggingsregels. Extra pijler 2 elementen omvatten een harmonisatie van de macht van de toezichthouder. Pijler 1 bevat twee vermogensvereisten. De Solvency Capital Requirement (SCR) is het doelniveau waaronder toezichthouders ingrijpen met geleidelijk steeds krachtiger middelen. De Minimum Capital Requirement (MCR) is het absolute minimum vermogen. Door expliciete buffers in te richten voor risico’s ontstaat een wisselwerking tussen de prudentie in de technische voorzieningen en het vereiste vermogen (zie figuur S.3). Meer ruimte in de prudentie van de technische voorzieningen kan worden gecompenseerd met lagere solvabiliteitseisen. Echter een duidelijke definitie voor de market value margin in de actuele waarde lost dit probleem op. De market value margin bestaat uit de kosten om vermogen voor het risico aan te houden en is dus niet zelf de buffer tegen risico.
Assets
(government)bonds and other
asset classes
Liabilities
Prudence
Equity
Beleggingen
(actuele waarde)
Verzekeringsbalans
Verzekeringsverplich-
tingen(actuele waarde)
EigenVermogen
Verzekeringsverplich-
tingen(best-estimate)
Market ValueMargin
Solvabiliteitsvereiste
Figuur S.3: De totale vermogenseis gerelateerd aan prudentie en solvabiliteitsvereiste

Samenvatting
213
We hebben Solvency II vergeleken met Bazel II, het bancaire equivalent. Paragraaf 3.6 concludeert dat Solvency II achterloopt, maar ambitieuzere doelstellingen heeft dan Bazel II. Het Solvency II project wordt bestuurd door het Committee of European Insurance and Occupational Pension Supervisors (CEIOPS). Paragraaf 3.7 beantwoordt onderzoeksvraag 5 en doet de volgende aanbevelingen om de effectiviteit van het Solvency II project te vergroten: CEIOPS zou zo snel mogelijk concrete tekstvoorstellen moeten publiceren; CEOIPS zou een structuur voor een interne modellen benadering moeten
voorschrijven; CEIOPS zou lange termijn-scenarioanalyses moeten opnemen in Pijler 2; CEIOPS zou niet het vermogensbeheer van verzekeraars moeten
beperken; CEIOPS zou een cost-of-capital methode moeten toepassen voor de
market value margin. Hoofdstuk 4 beantwoordt onderzoeksvraag 6. Het onderzoekt het beleggingsproces binnen verzekeraars vanuit een management control perspectief. Management control is het proces waarmee managers andere leden van de organisatie beïnvloeden om de organisatiedoelstelling te verwezenlijken. De systeemtheorie is een nuttig raamwerk om management control problemen te onderzoeken. De Leeuw definieert vijf noodzakelijke maar niet voldoende voorwaarden voor effectieve besturing. Daarnaast onderzoekt hoofdstuk 4 het fenomeen goal congruence (doelcongruentie). Het beleggings- en Asset- & Liability Management (ALM) proces is gebaseerd op de matchingstrategie. De matchingstrategie beschrijft de beleggingsmix van een verzekeraar. De beleggingsrendementen worden overgedragen aan de verzekeringseenheid. Slechte prestaties komen niet tot uitdrukking wanneer verzekeringstechnische resultaten goed en beleggingsresultaten slecht zijn en andersom. De nadruk van de matchingstrategie is ‘liability-driven investment’ maar de verzekeringseenheid heeft geen stimulans om producten te verkopen waarvan de verzekeringsverplichtingen eenvoudig kunnen worden belegd: ‘investment-driven underwriting’. Het huidige matchingproces schendt de voor-waarden voor effectieve besturing en stimuleert geen ‘goal congruent’ gedrag.

Risk Management for Insurance Firms
214
Hoofdstuk 4 bespreekt hoe de Marktzinsmethode kan worden gebruikt om deze problemen op te lossen. Er worden twee verantwoordingscentra ingesteld (zie figuur S.4 en tabel S.5): Het verzekeringscentrum is verantwoordelijk om producten te verkopen
tegen een actuarieel goede prijs en beheert alleen verzekeringsrisico’s. De verplichtingen worden intern belegd bij het beleggingscentrum.
Het beleggingscentrum is verantwoordelijk om de interne transacties te beleggen en het mismatchrisico te beheren.
Liabilities
Capital
Internaltransaction
(no investmentrisk)
Assets
Internaltransaction
Assets(mismatch)
Verzekeringscentrum
Verzekering verplichtignen
Eigen Vermogen
Interne transactie
(geen beleggings-risico)
Beleggingen
Beleggingscentrum
Interne transactie
Beleggingen (mismatch) Interne
transferprice
Figuur S.4: Scheiding van Verzekerings- en Beleggingsrisico’s via Marktzinsmethode
De interne transacties zijn een centraal element in het Marktzinsmethode concept. De interne verrekenprijs moet het juiste gedrag stimuleren. Daarom moet de interne verrekenprijs gelijk zijn aan de risicovrije rente, zonder enig be-leggings- of verzekeringsrisico. In de Marktzinsmethode heeft alleen het beleg-gingscentrum markt- en kredietrisico. Hiervoor zijn veel gedetailleerde theorieën en meetmethoden ontwikkeld vanaf 1990. Beleggingsrisico’s kunnen dus wor-den gemeten en beheerd met bestaande methoden en modellen. Het scheiden van de risico’s en de keuze voor een correcte interne verrekenprijs lost de ma-nagement control problemen op die hoofdstuk 4 in eerste instantie vaststelde. Verzekeringscentrum Beleggingscentrum Doelstelling Verzekeringsrisico’s beheersen door ver-
zekeringspolissen te verkopen Mismatchpositie en eigen vermogen beheren door te beleggen
Prestatie Toegevoegde actuele waarde Actuele waarde beleggingsrendementen Risico’s Verzekeringsrisico, niet-afdekbare
embedded opties Marktrisico (hoofdzakelijk renterisico) en kredietrisico
RAROC CapitalEconomic
value fair ngunderwriti Added
CapitalEconomic value fair investment Added
Tabel S.5: Doelstelling en prestatiemaatstaven binnen de Marktzinsmethode voor verzekeraars

Samenvatting
215
Hoofdstuk 5 toetst de toepassing van de Marktzinsmethode in de praktijk door een gevalstudie uit te voeren. De studie laat zien hoe het economic capital voor de beleggingsrisico’s apart van de verzekeringstechnische risico’s wordt berekend. Door de deelvragen te beantwoorden in de voorgaande hoofdstukken kan hoofdstuk 6 de hoofdonderzoeksvraag beantwoorden. Een economic capital raamwerk voor verzekeraars moet zich baseren op actuele waarde, omdat de huidige boekhoudkundige informatie het risicoprofiel niet toereikend weer-spiegelt. Verzekeringsverplichtingen moeten worden gewaardeerd op actuele waarde, welke is gedefinieerd als een best-estimate en een market value margin. Dit is een zogenaamde ‘entity-specific value.’ Economic capital is gere-lateerd aan de best-estimate actuele waarde. Een raamwerk voor economic capital moet het markt- en beleggingsrisico uniek toewijzen aan een specifieke beleggingseenheid. Dit is mogelijk door de Marktzinsmethode toe te passen. Het Solvency II project zou voort moeten bouwen op de vooruitgang rondom de actuele waarde die is gemaakt in het kader van economic capital. Tegelijkertijd zou het haar ambities moeten aanpassen en een modelstructuur moeten voorschrijven om verzekeringsmaatschappijen een leidraad te bieden bij het bouwen van interne risico modellen. Daarnaast zou het Solvency II project zo snel mogelijk concrete tekstvoorstellen moeten uitbrengen in plaats van de basisprincipes te blijven bespreken.


217
BBIIBBLLIIOOGGRRAAPPHHYY
Aalst van der, P.C. (1995) “Risico-analyse en Matching bij Pensioenfondsen” proefschrift Erasmus Universiteit Rotterdam
Aarzen, A., T. Mourik (2005) “IFRS 4 Insurance Contracts” Maandblad voor Accountancy & Bedrijfseconomie, januari/februari 2005, p. 19-24
Actuarieel Genootschap (AG) (1994) “Embedded Value” Actuarieel Genootschap
Actuarieel Genootschap (AG) (2002) “Overlevingstafels 1995-2000” Actuarieel Genootschap
Ahlgrim, K.C. et al. (2002) “Asset-Liability Modelling for Insurers: Incorporating a Regime-Switching Process for Equity Returns into a DFA Model” available at www.casact.org
Alink, B.J. (2002) “Mortgage Prepayments in the Netherlands” Thesis Twente University
Allen, F., A.M. Santomero (1996) “The Theory of Financial Intermediation” Wharton, Working Paper no. 96-32
Allen, F., A.M. Santomero (1999) “What Do Financial Intermediaries Do?” Journal of Banking and Finance, vol. 25, p. 271-294
Allen, F. (2001) “Do Financial Institutions Matter?” Wharton, Working Paper no. 01-04
Allen, L. et al. (2004) “Understanding Market, Credit, and Operational Risk: The Value at Risk Approach” Blackwell Publishing
American Academy of Actuaries (AAA) (2002) “Comparison of the NAIC Life, P&C and Health RBC Formulas” February 2002
Amit, R. B. Wernerfelt (1990) “Why Do Firms Reduce Business Risk?” Academy of Management Journal, vol. 33, no. 3, 1990, p. 520-533

Risk Management for Insurance Firms
218
Anders, U. (2003) “The Path to Operational Risk Economic Capital” in: Alexander, C.(ed) (2003), “Operational risk: regulation, analysis and management” Prentice Hall
Anders, U. (2002) “Operational Risk” presentation Dresdner Bank 15 January 2002
Anderson, D., et al. (2004) “A Practitioner’s Guide to Generalized Linear Models: A Foundation for Theory, Interpretation and Application” Watson Wyatt
Anthony, R.N. (1988) “The Management Control Function” Harvard Business School Press
Anthony, R.N., V.Govindarajan (2003) “Management Control Systems” McGraw-Hill, eleventh edition
Anthony, R.N., J. Dearden, V. Govindarajan (1992) “Management Control Systems” 7th edition, Irwin
Artikis, P. G. (1999) “A Capital Budgeting Stochastic Simulation Model Applied in the Banking Industry” Managerial Finance, vol. 25 no. 8, p. 1-11
Artzner, P. et al. (1998) “Coherent Measures of Risk” available at www.math.ethz.ch
Artzner, P. et al. (1999) “Coherent Measures of Risk” Mathematical Finance, July 1999, p. 203-228
As van, J. (2005) “Matching, Panacee of Hype?” VBA Journaal, voorjaar 2005, p. 10-12
Association of British Insurers (2005) “CEIOPS Consultation Paper 7: Draft Answers to the Second Wave of Calls for Advice” available at www.ceiops.org
Australian Prudential Regulation Authority (APRA) (2005-a) “Accounting for Insurance in Australia” presentation held at IASB meeting April 2005, agenda item 3a
Australian Prudential Regulation Authority (APRA) (2005-b) “Prudential Standard GPS 110: Capital Adequacy for General Insurers” January 2005
Australian Prudential Regulation Authority (APRA) (2005-c) “Prudential Standard GPS 120: Assets in Australia for General Insurers” January 2005
Australian Prudential Regulation Authority (APRA) (2005-d) “Prudential Standard GPS 210: Liability Valuation for General Insurers” January 2005

Bibliography
219
Australian Prudential Regulation Authority (2003) “Insurance Act 1973” December 2003
Babbel, D.F. et al. (2002) “Fair Value of Liabilities: The Financial Economics Perspective” North American Actuarial Journal, vol. 6 no 1, p. 12-27
Babbel, D.F., C. Merill (1997) “Economic Valuation Models for Insurers” Wharton, working paper, no. 97-44
Babbel, D.F., A.M. Santomero (1996) “Risk Management by Insurers: An Analysis of the Process” Wharton working paper, no. 96-16
Backhuijs, J. (2004) “Welke Waarde is Actueel?” Spotlight, nr. 3, p. 29-34 Pricewaterhouse-Coopers
Banks, E. (2004) “Alternative Risk Transfer: Integrated Risk Management through Insurance, Reinsurance and the Capital Markets” Wiley
Basel Committee on Banking Supervision (2005) “International Convergence of Capital Measurement and Capital Standards: A Revised Framework, updated November 2005” available at www.bis.org
Basel Committee on Banking Supervision (2004) “International Convergence of Capital Measurement and Capital Standards: A Revised Framework” available at www.bis.org
Basel Committee on Banking Supervision (2001-a) “Consultative Document: Overview of the New Basel Capital Accord” available at www.bis.org
Basel Committee on Banking Supervision (2001-b) “Sound Practices for the Management and Supervision of Operational Risk” available at www.bis.org
Basel Committee on Banking Supervision (1999) “Consultative Paper” available at www.bis.org
Basel Committee on Banking Supervision (1996) “Amendment to the Capital Accord to Incorporate Market Risks” available at www.bis.org
Basel Committee on Banking Supervision (1988) “International Convergence of Capital Measurement and Capital Standards” available at www.bis.org
Ben-Saud, T., M. van Bergen (2005) “Liability driven investment: a four step process” VBA Journaal, voorjaar 2005, p. 38-43
Benink, H. (2005) “Issues inzake Bazel II” Maandblad voor Accountancy en Bedrijfseconomie, januari/februari 2005, p. 33-40
Berghe van den, L. (1995) “Financial Conglomerates: New Rules for New Players?” Kluwer Academic Publishers
Bernstein, P.L. (1998) “Against the Gods: the Remarkable Story of Risk” Wiley

Risk Management for Insurance Firms
220
Bessis, J. (1998) “Risk Management in Banking” Wiley Bikker, J.A., I.P.P. van Lelyveld (2002-a) “De Stabiliteit van Financiële
Conglomeraten” Economische & Statistische Berichten, 18-10-2002, p. 740-743
Bikker, J.A., I.P.P. van Lelyveld (2002-b) “Economic versus Regulatory Capital for Financial Conglomerates” 2002, Research Series Supervision, no. 45
Bilderbeek, J. et al. (2005) “Polybedrijfskundig Zakboekje” 4e druk, PBNA Blunden, T. (2003) “Scorecard Approaches” in: Alexander, C. “Operational Risk:
Regulation, Analysis, and Management” Prentice Hall Bogdanov, Y.I. et al. (2003) “Multilevel Clustering Fault Model for IC
Manufacture” paper for International Conference “Micro- and Nanoelectronics 2003” available at arvix.org
Bogner, H. (2005) “From Local to International Accounting Standards” Presentation held at the IAIS Annual Conference at October 20, 2005
Boller, H.P. (2003) “Solvabilität im Wandel: Internationale Überlegungen und Umsetzung in der Schweiz” Converium 3 November 2003
Booth, P. et al. (1999) “Modern Actuarial Theory and Practice” Chapman & Hall Bos, J.J. (1999) “Prestatiebeoordeling bij Banken” Thesis Twente University Bos, J.J., A. Bruggink (1996) “Management Control bij Banken” NIBE Bowman, E.H. (1980) “A Risk Return Paradox for Strategic Management” Sloan
Management Review, Spring, 1980 p. 17-31 Brealy, R.A., S.C. Myers (2000) “Principles of Corporate Finance” sixth edition,
McGraw-Hill Briys, E., F. de Varenne (2001) “Insurance, From Underwriting to Derivatives:
Asset Liability Management in Insurance Companies” Wiley Bussel, van A.P.J.M. (1998) “Valuation and Interest Rate Risk of Mortgages in
the Netherlands” Thesis Maastricht University Butsic, R.P. (1994) “Solvency Measurement for Property Liability Risk Based
Capital Applications” Journal of Risk Insurance, December 1994, p. 656-690
Campbell, S.D., F.X. Diebold (2005) “Weather Forecasting for Weather Derivatives” Journal of American Statistical Association, March 2005, p. 6-16
Casualty Actuarial Society (CAS) (2004) “Fair Value of P&C Liabilities: Practical Implications” available at www.casact.org

Bibliography
221
CFO Forum (2005-a) “European Embedded Value Disclosures and Sensitivities” 31 October 2005
CFO Forum (2005-b) “Principles for an IFRS Phase II Insurance Model” 21 July 2005
CFO Forum (2004-a) “European Embedded Value Principles” 5 May 2004 CFO Forum (2004-b) “European Embedded Value Basis for Conclusions” 5
May 2004 Chevalier (2000) “De voors en tegens bij markttoetreding” p. 10-11 in: Het
Financieele Dagblad “Serie Strategie, deel 6” 23 mei 2000 Chew, D.H. (2001) “The New Coporate Finance: Where Theory Meets Practice”
McGraw-Hill Chew, L. (1996) “Managing Derivative Risks: The Use and Abuse of Leverage”
Wiley Chisholm, A.M. (2002) “An Introduction to Capital Markets: Products,
Strategies, Participants” Wiley Christofides, S. (2003) “Pricing of Catastrophe Linked Securities” available at
www.casact.org CreditMetrics (1997) “CreditMetrics – Technical Document: The Benchmark for
Understanding Credit Risk” CRO Forum (2005-a) “Chief Risk Officer Forum Feedback on CEIOPS-CP-
04/05” 30 September 2005 CRO Forum (2005-b) “Chief Risk Officer Forum Studies” 10 June 2005 CRO Forum (2005-c) “Principles for Regulatory Admissibility of Internal Models”
10 June 2005 CRO Forum (2005-d) “A Framework for Incorporating Diversification in the
Solvency Assessment of Insurers” 10 June 2005 Comité Européen des Assurances (CEA), Mercer Oliver Wyman (MOW) (2005)
“Solvency Assessment Models Compared: Essential Groundwork for the Solvency II Project”
Comité Européen des Assurances (CEA) (2005-a) “CEA’s Comments on the CEIOPS’ Draft Answers to the ‘Second Wave’ of Calls for Advice” 30-09-2005
Comité Européen des Assurances (CEA) (2005-b) “IAIS Paper – Towards a Common Structure and Common Standards for the Assessment of Insurer Solvency” 14-04-2005
Risk Management for Insurance Firms
222
Comité Européen des Assurances (CEA) (2005-c) “Solvency II – Building Blocks for the Solvency II Project” 18-03-2005
Comité Européen des Assurances (CEA) (2005-d) “Solvency II – Structural Issues” 01-03-2005
Comité Européen des Assurances (CEA) (2005-e) “Solvency II – Why Care Should be Taken when Using Basel II as a Starting Point for Solvency II” 01-03-2005
Comité Européen des Assurances (CEA) (2005-f) “CEA Discussion Document on CEIOPS’ Answers to the ‘Second Wave’ of Calls for Advice – Draft 2” draft of 18 August 2005
Committee of European Insurance and Occupational Pension Fund Supervisors (CEIOPS) (2005-a) “Third Progress Report to the European Commission” June 2005, CEIOPS-SEC-53/05
Committee of European Insurance and Occupational Pension Fund Supervisors (CEIOPS) (2005-b) “Consultation Paper No. 7: Draft Answers to the European Commission on the ‘Second Wave’ of Calls of Advice in the Framework of the Solvency II Project” July 2005, CEIOPS-CP-04/05
Cowley, A., J.D. Cummins (2005) “Securitisation of Life Insurance Liabilities” Journal of Risk and Insurance, June 2005, p. 193-226
Cox, J.C. et al. (1985) “A Theory of the Term Structure of Interest Rates” Econometrica, 1985, p. 385-407
CreditMetrics (1997) “Technical Document” New York Creedon, S. et al. (2003) “Risk and Capital Assessment and Supervision in
Financial Firms” Finance and Investment Conference 2003 available at rmt.soa.org
Crouhy, M. et al. (2006) “The Essentials of Risk Management” McGraw-Hill Culp, C.L. (2002-a) “The ART of Risk Management: Alternative Risk Transfer,
Capital Structure, and the Convergence of Insurance and Capital Markets” Wiley
Culp, C.L. (2002-b) “The Revolution in Corporate Risk Management: a Decade of Innovations in Process and Products” Journal of Applied Corporate Finance, Winter 2002, p. 8-26
Culp, C.L. (2000) “RAROC Revisited: Ex Ante vs. Ex Post RAROC” Journal of Lending & Credit Risk Management, March 2000, p. 50-57

Bibliography
223
Cumming, C.M., B.J. Hirtle (2001) “The Challenge of Risk Management in Diversified Financial Companies” FRBNY Economic Policy Review, March 2001
Cummins, J.D. (2004) “Securitization of Life Insurance Assets and Liabilities” Wharton, working paper no. 04-03
Cummins, J.D. (2000) “Allocation of Capital in the Insurance Industry” Risk Management and Insurance Review, 2000, no. 3, p. 7-28
Cummins, J.D. et al. (2000) “The Risk Premium Project: Phase I and II Report” Casual Actuarial Society
Cummins, J.D., S. Harrington, G. Niehaus (1993) “An Economic Overview of Risk-based Capital Requirements for the Property-Liability Insurance Industry” Journal of Insurance Regulation, Summer 1993, p. 427-447
Cummins, J.D. (1992) “Financial Pricing of Property and Liability Insurance” in: G. Dionne “Contributions to Insurance Economics” Kluwer Academic Publishers, 1992, p. 141-168
Daykin, C.D. (1990) “The Epidemiology of HIV Infection and AIDS” Journal of the Institute of Actuaries, December 1990, p. 51-94
Daykin, C.F. et al. (1988) “The Impact of HIV Infection and AIDS on Insurance in the United Kingdom” Journal of the Institute of Actuaries, December 1988, p. 727-837
Derman, E. (2003) “What Quants Don’t Learn at College” Risk, July 2003, p. 55-56
Devolder, P. et al. (2003) “Stochastic Optimal Control of Annuity Contracts” Insurance Mathematics and Economics, 2003, p. 227-238
De Nederlandsche Bank (2005-a) “Solvabiliteitstoezicht op Verzekeraars: Be-ginselen en Risico-Oriëntatie” DNB Kwartaalbericht september 2005, p. 81-88
De Nederlandsche Bank (2005-b) “Invoering FTK voor gehele verzekerings-sector niet per 2006” persbericht 24 maart 2005
De Nederlandsche Bank (2003) “Bazel II: Implicaties voor Nederland” DNB Kwartaalbericht September 2003, p. 53-61
Diamond, D.W, R.G. Rajan (2000) “A Theory of Bank Capital” Journal of Finance, Dec. 2000, p. 2431-2465
Dicke, A.A. (1998) “Comparison of Methods for Fair-Value Life Insurance Liabilities” in: Vanderhoof, I.T., A.I. Altman (ed.) (1998) “The Fair Value of Insurance Liabilities” Kluwer, p. 7-20
Risk Management for Insurance Firms
224
Diebold, F.Z eta l(2004) “Modelling Bond Yields In Finance and Macroeconomics” available at www.aeaweb.org
Doff, R.R. (2005) “Economic Capital voor Verzekeraars” Maandblad voor Accountancy & Bedrijfseconomie, november 2005, p. 582-589
Doff, R.R. (2004-a) “Economic Capital en Risicomanagement bij Banken” NIBE-SVV
Doff, R.R. (2004-b) “Toepassing van RAROC” Bank- & Effectenbedrijf, december 2004, p. 12-15
Doff, R.R., A.H.A.J. van den Tillaart (2004) “Banken Combineren Rendement en Risico in RAROC” Maandblad voor Accountancy & Bedrijfseconomie, December 2004, p. 597-604
Doherty, N.A. (2005) “Risk Management, Risk Capital, and the Cost of Capital” Journal of Applied Corporate Finance, Summer 2005, p. 119-123
Doll D.C. et al. (1998) “Fair Valuation of Life Insurance Company Liabilities” in: Vanderhoof, I.T., A.I. Altman (ed.) (1998) “The Fair Value of Insurance Liabilities” Kluwer, p. 21-114
Dorsman, A.B. (1997) “Vermogensstructuur en Vermogensmarkt: van Winst naar Waarde” Kluwer
Dorsman, A.B. (1996) “Vlottend Financieel Management: Analyse en Planning” Kluwer
Dowd, K. (1999) “Does Asymmetric Information Justify Bank Capital Adequacy Regulation?” Cato Journal, Spring 1999, p. 39-47
Dowd, K. (1998) “Beyond Value at Risk: the New Science of Risk Management” Wiley
Drury, C. (1995) “Management Accounting” Chapman Hall, third edition Drzik, J. (2005) “At the Crossroads of Change: Risk and Capital Management in
the Insurance Industry” Geneva Papers, vol. 30 2005, p. 72-87 Drzik, J. et.al. (1998-a) “Risk, Capital, and Value Measurement in Financial
Institutions: Part One the Debtholder’s Perspective” Journal of Lending and Credit Risk Management, September 1998, p. 22-27
Drzik, J. et.al. (1998-b) “Risk, Capital, and Value Measurement in Financial Institutions: Part Two the Shareholder’s Perspective” Journal of Lending and Credit Risk Management, November 1998, p. 64-69
Duffhues, P. (2002) “Recente Ontwikkelingen in Financieel Risico-Management” Maandblad voor Accountancy en Bedrijfskunde, april 2002, p. 138-149

Bibliography
225
Dupire, B. (ed) (1998) “Monte Carlo: Methodologies and Applications for Pricing and Risk Management” Risk Books
Dus, I., R. Maurer (2001) “Integrated Asset Liability Modelling for Property Casualty Insurance: a Portfolio Theoretical Approach” Working paper no. 83, Goethe University 2001
Edwards, H. (1985) “Credit Management Handbook” second edition, Gower Publishing Company
Ellis, B. (1966) “Basic Concepts of Measurement” Cambridge University Press Emmanuel, C., D. Otley, K. Merchant (1990) “Accounting for Management
Control” second edition, Chapman & Hall Erisk (2002) “Applied RAROC: Vignettes on Annual Reports as of 1 March,
2002” Erisk Research 2002 Erisk (2001-a) “RAROC Casestudy at St Paul” i-conference 7 June 2001,
available at www.erisk.com Erisk (2001-b) “P&C RAROC” 2001, available at www.erisk.com Erisk (2001-c) “Business Risk” 2001, available at www.erisk.com Eshita, N. (1999) “An Estimation of Claims Distribution” 1999, available at
www.casact.org Estrella, A. (2000) “Regulatory Capital and the Supervision of Financial
Institutions: Some Basic Distinctions and Policy Choices” working paper, Stockholm, 2000
European Commission (EU) (2005) “Amended Framework for Consultation on Solvency II” July 2005
European Commission (EU) (2005) “Draft Outline of a Solvency II Framework Directive”,15-04-2005, MARKT/2507/05-EN
European Commission (EU) (2005) “Solvency II Roadmap – towards a Framework Directive” 23-03-2005, MARKT/2502/05-rev. 1-EN
European Commission (EU) (2005) “Draft Specific Calls for Advice from CEIOPS (third wave)” 23-03-2005, MARKT/2501/05-EN
European Commission (EU) (2005) “Insurance Solvency 2: Paper on Political Issues from France, Germany, the Netherlands and the United Kingdom” 17-02-2005, MARKT/2503/05-EN
European Commission (EU) (2004) “The Draft Second Wave for Calls of Advice from CEIOPS and Stakeholder Consultation on Solvency II” 11-10-2004, MARKT/2515/04-EN

Risk Management for Insurance Firms
226
European Commission (EU) (2004) “Framework for Consultation on Solvency II” 14-07-2004, MARKT/2506/04-EN
European Commission (EU) (2003) “Solvency II – Reflections on the General Outline of a Framework Directive and Mandates for Further Technical Work” 19-09-2003, MARKT/2539/03-EN
European Commission (EU) (2003) “Design of a Future Prudential Supervisory System in the EU – Recommendations by the Commission Services” 03-03-2003, MARKT/2509/03-EN
European Commission (EU) (2002) “Considerations on the Design of a Future Prudential Supervisory System” 28-11-2002, MARKT/25535/02-EN
European Commission (EU) (2002) “Insurance Commission welcomes Rapid Adoption of Directives to Strengthen Protection of Policyholders” Press Release 14-02-2002, IP/02/252
European Economic Community (EEC) (1978) “First Council Directive on the Coordination of Laws, Regulations and Administrative Provisions Relating to the Taking-up and Pursuit of the Business of Direct Life Assurance” EEC/78/267
European Economic Community (EEC) (1973) “First Council Directive on the Coordination of Laws, Regulations and Administrative Provisions Relating to the Taking-up and Pursuit of the Business of Direct Insurance other than Life Assurance” EEC/73/239
Exley, C.J., A.D. Smith (2006) “The Cost of Capital for Financial Firms” working paper, Institute of Actuaries
Falkenstein, E. (1997) “Accounting for Economic and Regulatory Capital in RAROC Analysis” Bank Accounting and Finance, Fall 1997
Federal Office of Private Insurance (FOPI) (2006) “The Swiss Experience with Market Consistent Technical Provisions – the Cost of Capital Approach” 24 February 2006
Federal Office of Private Isurance (FOPI) (2005) “Reinforcing Risk-based Supervision” Speech by Herbert Lüthy, held at 19 May 2005
Federal Office of Private Isurance (FOPI) (2004-a) “Der Schweizer Solvenztest” 12 Oktober 2004
Federal Office of Private Isurance (FOPI) (2004-b) “Zukünftige Umsetzung des SST” 12 Oktober 2004
Federal Office of Private Isurance (FOPI) (2004-c) “White Paper of the Swiss Solvency Test” November 2004

Bibliography
227
Federal Office of Private Isurance (FOPI) (2004-d) “Swiss Solvency Test” 25 August 2004
Filipovic, D. (1999) “A Note on the Nelson-Siegel Family” available at www.math.ethz.ch
Financieele Dagblad, Het (2002-a) “Allianz: reus op lemen voeten” 15 November 2002
Financieele Dagblad, Het (2002-b) “Verzekeraars voelen de pijn 11 september nu pas” 11 September 2002
Financieele Dagblad, Het (2002-c) “Verzekeraar lijdt minder onder beursmalaise dan polishouder” 18 Juli 2002
Financieele Dagblad, Het (2002-d) “Pensioen- en Verzekeringskamer verkeerd bezig” 16 juli 2002
Financieele Dagblad, Het (2001) “Verzekeringspremies voor bedrijven gaan fors omhoog” 4 September 2001
Frankfurter, G.M. McGoun, E.G. (1996) “Towards Finance With a Meaning. The Methodology of Finance: What It Is and What It Can Be” Jai Press, London, 1996
Froot (2001) “Bank Capital and Risk Management: Issues for Banks and Regulators” IFCI Geneva Paper, no. 8, 2001
Froot, K.A, J.C. Stein (1998) “Risk Management, Capital Budgetting and Capital Structure Policy for Financial Institutions: An Integrated Approach” Journal of Financial Economics, vol. 47, p. 55-82
Froot, K.A., O’Connell, P.G.J. (1997) “On the Pricing of Intermediate Risks: Theory and Application to Catastrophe Reinsurance” Wharton, working paper, no. 97-24
Gedalla, B. et al. (2004) “A Practitioner’s Approach to Marine Liability Pricing Using Generalised Linear Models” p. 231-244, in: Casualty Actuarial Society “2004 Discussion Paper Program: Applying and Evaluating Generalised Linear Models” available at: www.casact.org
Gelderman, M. (2000) “Bedrijfskunde als Nutteloze Wetenschap” Maandblad voor Accountancy & Bedrijfskunde, maart 2000, p. 83-89
Gleissner, W. et al. (2005-a) “Risikoaggregation im Versicherungsunternehmen basierend auf einem eifachen Simulationsmodell – erstes teil” Zeitschrift für Versicherungswesen, nr 2, 15. Januar 2005, p. 59-64

Risk Management for Insurance Firms
228
Gleissner, W. et al. (2005-b) “Risikoaggregation im Versicherungsunternehmen basierend auf einem eifachen Simulationsmodell – zweites teil” Zeitschrift für Versicherungswesen, nr 2, 1. Februar 2005, p. 88-93
Gorton, G., A. Winton (2002) “Financial Intermediation” Wharton, working paper, 02-28
Groeneveld, J. (2004) “Waarde en Economie in Accounting” Maandblad voor Accountancy & Bedrijfseconomie, juni 2004, p. 253-260
Groupe Consultative des Associations d’Actuaires (1997) “The Second Actuarial Study of Mortality in Europe”
Gründl, H. H. Schmeiser (2002) “Risk-adjusted Performance Measurement and Capital Allocation in Insurance Firms” working paper, Humbold Universität Berlin
Guhe, J., H. Kesting (2004) “Paradigm Change in Insurance Supervision” Working paper, Economic Research Department Allianz Group
Guo, L. (2000) “A Dynamic Method for the Valuation of Fair Value Insurance Liabilities” working paper, Casual Actuarial Society, 2000
Haberman, S. (1992) “HIV, AIDS and the approximate calculation of life insurance functions, annutities and net premiums” Journal of the Institute of Actuaries, Dec 1992, p. 345-364
Hall, C. (2002) “Economic Capital: Towards an Integrated Risk Framework” Risk, October 2002, p. 33-38
Hallerbach, W.G. (2001) “Capital Allocation, Portfolio Enhancement and Performance Measurement: a Unified Approach” 2001, working paper, available at www.few.eur.nl
Hendrickx, L. (1991) “How versus How Often: The Role of Scenario Information and Frequency Information in Risk Judgement and Risky Decision Making” Thesis, University of Groningen, 1991
Herring, R., T. Schuermann (2005), “Capital Regulation for Position Risk in Banks, Securities Firms and Insurance Companies” in: H. Scott (2005) “Capital Adequacy: Law, Regulation and Implementation” Oxford University Press
Herrings, P.J.J. (2003) “Toekomst voor de Economische Theorie” Economische en Statistische Berichten, 19-12-2003, p. 618-620
Hesselager, O. (1994) “A Recursive Procudure for Calculation of Some Compound Distributions” Astin Bulletin, vol. 24, no. 1, 1994, p. 19-32

Bibliography
229
Hewitt, C.C., B. Lefkowitz (1979) “Methods for Fitting Distributions to Insurance Loss Data” CAS Proceedings, 1979, nr. 125, p. 139-160
Heijden van der, K. (2005) “Scenarios: the Art of Strategic Conversation” second edition, Wiley
Hines, K.D. (2002) “Risk Considerations for the All Finanz Organisation” Casualty Actuary Society
Hodes, D.M. et al. (2002) “The Financial Modelling of Property-Casualty Insurance Companies” 2002 working paper, available at www.casact.org
Hoogendoorn, M. (2003-a) “Reële Waarde, Jaarrekening en Ondernemingsbeleid” Maandblad voor Accountancy & Bedrijfseconomie, September 2003, p. 387-396
Hoogendoorn, M. (2003-b) “Thema: Reële Waarden en Financiële Verslaggeving” Maandblad voor Accountancy & Bedrijfseconomie, September 2003, p. 370
Hopman, M.J. (2000) “Renterisico bij Banken” NIBE-SVV Hull, J.C. (2006) “ Options, Futures and Other Derivatives” sixth edition,
Prentice Hall Hull, J.C., A. White (1990) “Pricing Interest Rate Derivative Securities” Review
of Financial Studies, 1990, p. 573-592 International Accounting Standards Board (IASB) (2006) “Insurance Working
Group: Credit Characteristics of Insurance Liabilities” available at www.iasb.org
International Accounting Standards Board (IASB) (2005-a) “IASB Update: Board Decisions on International Financial Reporting Standards. July 2005” available at www.iasb.org
International Accounting Standards Board (IASB) (2005-b) “IASB Update: Board Decisions on International Financial Reporting Standards. June 2005” available at www.iasb.org
International Accounting Standards Board (IASB) (2005-c) “IASB Insight: October/November 2005” available at www.iasb.org
International Accounting Standards Board (IASB) (2005-d) “IASB Insight: July 2005” available at www.iasb.org
International Accounting Standards Board (IASB) (2004-a) “IFRS 2004” International Accounting Standards Board (IASB) (2004-b) “International
Financial Reporting Standards (IFRSs)” published at 31 March 2004

Risk Management for Insurance Firms
230
International Accounting Standards Board (IASB) (2003) “IASB Update: Board Decisions on International Financial Reporting Standards. January 2003” available at www.iasb.org
International Accounting Standards Board (IASB) (2002) “IASB Update: Board Decisions on International Financial Reporting Standards. May 2002” available at www.iasb.org
International Actuarial Association (IAA) (2004) “A Global Framework for Insurer Solvency Assessment” 2004
International Association of Insurance Supervision (IAIS) (2005-a) “A New Framework for Insurance Supervision: Towards a Common Structure and Common Standards for the Assessments of Insurer Solvency” 21 October 2005
International Association of Insurance Supervision (IAIS) (2005-b) “A New Framework for Insurance Supervision: Cornerstones for the Formulation of Regulatory Financial Requirements” 21 October 2005
International Association of Insurance Supervision (IAIS) (2003-a) “Insurance Core Principles and Methodology” 3 October 2003
International Association of Insurance Supervision (IAIS) (2003-b) “Quantifying and Assessing Insurance Liabilities: Discussion Paper” 3 October 2003
International Association of Insurance Supervision (IAIS) (2002) “Principles on Capital Adequacy and Solvency” 9 January 2002
International Association of Insurance Supervision (IAIS) (2000) “On Solvency, Solvency Assessments and Actuarial Issues” 15 March 2000
Jacoby, G. et al. (2000) “The Capital Asset Pricing Model and the Liquidity Effect: A Theoretical Approach” Journal of Financial Markets, 2000, no. 3, p. 69-81
James (1996) “RAROC Based Capital Budgetting and Performance Evaluation: A Case Study of Bank Capital Allocation” Wharton Institution Centre no.96-40, 1996
Kaas, R. et al. (2001) “Modern Actuarial Risk Theory” Kluwer Academic Publishers
Kaufman, R. et al. (2001) “Introduction to Dynamic Financial Analysis” 2001, available at www.casact.org
Kaye, P. (2005) “Risk Measurement in Insurance: A Guide To Risk Measurement, Capital Allocation and Related Decision Support Issues” CASACT Discussion Paper, 2005

Bibliography
231
Keynes, J.M. (1921) “A Treatise on Probability” Royal Economic Society, London, 1973 (first edition 1921)
Keynes, J.M. (1936) “The General Theory of Employment, Interest and Money” Royal Economic Society, London, 1973 (first edition: 1936)
Kielholz, W. (2000) “The Cost of Capital for Insurance Companies” The Geneva Papers on Risk and Insurance, January 2000, p. 4-24
Kimball R.C., (1998) “Economic Profit and Performance Measurement in Banking” New England Economic Review, July/August 1998, p.35-53
Kimball, R.C. (1997) “Innovations in Performance Measurement in Banking” New England Economic Review, May/June 1997, p. 23-38
Kleynen, R. (1996) “Asset Liability Management binnen Pensioenfondsen” Proefschrift Katholieke Universiteit Brabant, 1996
Knight, F.H. (1921) “Risk, Uncertainty, and Profit” University of London Koedijk, K.G., M.A. van Dijk (2004) “Global Risk Factors and the Cost of
Capital” Financial Analysts Journal, March/April 2004, p. 32-38 Kok, F.W. (2005) “Liquidity Crisis Management” graduation report Twente
University Kölschbach, J. “Risk Margins: An Area of Conflict between Accounting and
Supervision” Presentation held at the IAIS Annual Conference held at October 20, 2005
KPMG (2002) “Study into the Methodologies to Assess the Overall Financial Position of an Insurance Undertaking from the Perspective of the Prudential Supervisor” May 2002
Kramer, N.J.T.A., J. de Smit (1996) “Systeemdenken” 5e druk, Stenfert Kroese Krens, F. (2003) “Het Begrip Reële Waarde” Maandblad voor Accountancy &
Bedrijfseconomie, September 2003, p. 371-378 Kuijper, J. (2002) “IAS 39: Belangrijkste Consequenties voor Banken” Bank- en
Effectenbedrijf, November 2002, p. 26-27 Kukler, A. (2004) “Bazel II: Data of Wijsheid?” Bank- & EffectenBedrijf, april
2004, p. 16-19 Kupper, E.F. (1999) “Risk Management in Banking” Risk and Capital
Proceedings, November 1999, available at www.apra.gov.au Kuritzkes, A. T. Schuerman, S.M. Weiner (2002) “Risk Measurement, Risk
Management and Capital Adequacy in Financial Conglomerates” Wharton Paper no 03-02, 2002

Risk Management for Insurance Firms
232
Kuritzkes, Scott (2002)“Sizing Operational Risk and the Effect of Insurance: Implications for the Basel II Capital Accord” 2002
Lambert, Ph. (2003) “Pensioenfondsen beleven Roerige Tijden” Tijdschrift voor Pensioenvraagstukken, augustus 2003), p. 102-105
Leenaars, H. (2003) “Risicomanagement van Banken” Maandblad voor Accountancy en Bedrijfseconomie, juli/augustus 2003, p. 340-347
Leeuw, de A.C.J. (1990) “Organisaties: Management, Analyse, Ontwerp en Verandering: een Systeemvisie” 4e druk, Van Gorcum
Leeuw, de J. (1996) “ Financiële Conglomeraten in Nederland” NIBE Lelyveld Van, I., A. Schilder (2002) “Risk in Financial Conglomerates:
Management and Supervision” DNB Research Series Supervision no. 49 Lemmen, J.J.G. (2003) “Systeemrisico’s van Nederlandse Pensioenfondsen”
Tijdschrift voor Pensioenvraagstukken, augustus 2003, p. 106-111 Lewis, R.E. (1998) “Capital from an Insuranc Company Perspective” FRBNY
Economic Policy Review, October 1998, p. 183-185 Loubergé, H. et al. (1999) “Using Catastrophe-Linked Securities to Diversify
Insurance Risk: A Financial Analysis of CAT Bonds” Journal of Insurance Issues, Fall 1999, p. 125-146
Lowe, P. (2005) “Comments on: Institution-specific Value by Ken Peasnell” available at www.bis.org
Luk, P. (2004) “Measuring True Profits Using Embedded Value” 2004, available at www.peterluk.com
Marrison, C. (2002) “The Fundamentals of Risk Measurement” McGraw-Hill, New York
Matten, (2000) “Managing Bank Capital” Wiley, second edition Matten, (1996) “Managing Bank Capital” Wiley Matten, C. (1995) “Earnings Volatility as an Alternative Risk Capital Measure”
Prospects, December/January 1995, p. 2-5 McGoun, E.G. (1995) “The History of Risk ‘Measurement’ ” Critical Perspectives
on Accounting, 1995, vol. 6, p. 511-532 Medina, P.K. et al. (2003) “Tailoring Internal Models” Risk, March 2003, p. 29-
32 Megginson, W.L., S.B.Smart (2006) “Introduction to Corporate Finance”
Thompson Press Mercer, Oliver, Wyman (MOW) (2004) “Life at the End of the Tunnel: the Capital
Crisis in the European Life Sector”

Bibliography
233
Merchant, K.A. (1998) “Modern Management Control Systems” Prentice Hall Merton, R.C. A.F. Perold (1993) “Theory of Risk Capital in Financial Firms”
Journal of Applied Corporate Finance, 1993 no. 3, p. 16-32 Ministerie van Financiën (2005) “Annex to Document MARKT/2507/05-EN:
Draft Outline of a Solvency II Framework Directive” Montier, J. (2002) “Behavioural Finance: Insights into Irrational Minds and
Markets” Wiley Moore (1999) “Tail Estimation and Catastrophe Security Pricing: Can We Tell
What We Hit if We Are Shooting in the Dark?” Wharton working paper, no. 99-14
Mosley, R.C.M. (2004) “Estimating Claim Settlement Values Using GLM” in: Casual Actuary Society “Applying and Evaluating Generalized Linear Models” 2004, p. 291-314
Muermann, A. (2003) “Actuarially Consistent Valuation of Catastrophe Derivatives” Working Paper no. 03-18 Wharton School, University of Pennsylvania
Mullem van, T.P.G. (2004) “Economic Capital for Dutch Retail Banking Books” Thesis Twente University 2004
Müller, A., M. Grandi (2000) “Weather Derivatives: A Risk Management Tool for Weather-sensitive Industries” The Geneva Papers on Risk and Insurance, April 2000, p. 273-287
Myers, S.C., Read, J.A. (2001) “Capital Allocation for Insurance Companies” Journal of Risk and Insurance, December 2001, p. 545-580
Nakada, P. et al. (1999) “P&C RAROC: A Catalyst for Improved Capital Management in the Property and Casualty Insurance Industry” Journal of Risk Finance, Fall 1999, p. 1-18
Navest, D. (2005) “Defining Insurance Terminology: A Glossary Project in the Light of Solvency II” Master Thesis, Twente University
New York Federal Reserve Bank (2003) “Risk And Capital Assessment and Supervision in Financial Firms” Working paper for the Finance and Investment Conference 2003
NIBE-SVV (2005) “Schade- en Levensverzekeringen: Verzekeringsvormen, Premieopbouw en Risicobeheer” NIBE-SVV, Amsterdam
Office of the Superintendent of Financial Institutions Canada (OSFI) (2005) “Capital Regime for Regulated Insurance Holding Companies and Non-Operating Life Companies” July 2005

Risk Management for Insurance Firms
234
Office of the Superintendent of Financial Institutions Canada (OSFI) (2004) “Minimum Continuing Capital and Surplus Requirements (MCCSR) for Life Insurance Companies” October 2004
Office of the Superintendent of Financial Institutions Canada (OSFI) (2003-a) “Minimum Capital Test (MCT) for Federally Regulated Property and Casualty Insurance Companies” July 2003
Office of the Superintendent of Financial Institutions Canada (OSFI) (2003-b) “Risk-based Supervision of Insurers” Presentation held in Zurich, December 15, 2003
Office of the Superintendent of Financial Institutions Canada (OSFI) (2003-c) “MCT and BAAT Supervisory Targets” December 2003
Office of the Superintendent of Financial Institutions Canada (OSFI) (2002) “Use of Internal Models for Determining Required Capital for Seggregated Fund Risks (MCCSR)” March 2002
O’Keefe, P.J.L., et al. (2005) “Current Developments in Embedded Value Reporting” Institute of Actuaries and Faculty of Actuaries, 28 February 2005
Oliver, Wyman & Company (OWC) (2001) “Study on the Risk Profile and Capital Adequacy of Financial Conglomerates” 2001, available at www.dnb.nl
Oosenbrug, A. Swinkels (2005) “IFRS dwingt tot beter afgestemd beleggingsbeleid door ondernemingspensioenfondsen” VBA Journaal, voorjaar 2005, p. 13-20
Oosenbrug A. (2002) “Financiële Verslaggeving Verzekeringsmaatschappijen: Reguliere verslaggevingstechnieken en -voorschriften” Erasmus Finance & Insurance Centre, 2002
Oosenbrug, A. (1999) “Levensverzekering in Nederland” Erasmus Finance & Insurance Centre
Oosenbrug, A. (1998) “Beleggingsmismatches en de Bepaling van de Voorziening Verzekeringsverplichtingen” Verzekeringsarchief, no. 2, p. 56-58
Oosenbrug, A. (1995) “Studierapport Embedded Value” NIVRA Outreville, J.F. (1998) “Theory and Practice of Insurance” Kluwer Academic
Publishers, 1998 Pape, J.C. (1999) “Commercial Lending in Different Governance Sytems”
Thesis Twente University
Bibliography
235
Peasnell, K. (2005) “Insititution-Specific Value” Paper prepared for presentation and discussion at the Workshop on Accounting Risk Management and Prudential Regulation, November 11-12, 2005, available at www.bis.org
Peccia, T. (2001) “Designing an Operational Risk Framework from a Bottom-up Perspective” in: Financial Times “Mastering Risk Volume 2: Applications” Prentice Hall, p. 2000-218
Pensioen- & Verzekeringskamer (PVK) (2004) “Consultatiedocument Financieel Toetsingskader” available at www.dnb.nl
Pensioen- & Verzekeringskamer (PVK) (2001) “Actuariële Principes Leven” available at www.dnb.nl
Pensioen- & Verzekeringskamer (PVK) (1994) “Besluit Technische Voorzieningen Verzekeringsbedrijf” available at www.dnb.nl
Pelsser, A. (2003) “Pricing and Hedging Guaranteed Annuity Options via Static Option Replication” Insurance: Mathematics and Economics, 2003, p. 283-296
Perlet, H. (2005) “Challenges for the Industry” Presentation held at the IAIS Annual Conference at October 19, 2005
Peziér, J. (2003) “A Constructive Review of the Basel Proposals on Operational Risk” in: Alexander, C “Operational Risk: Regulation, Analysis and Management” Prentice Hall, 2003, p. 49-73
Phillbrick, S.W, R.A. Painter (2001) “Dynamic Financial Analysis: DFA Insurance Company Case Study” 2001, DFA conference paper, available at www.casact.org.
Porteous, B. et.al. (2003) “An Approach to Economic Capital for Financial Services Firms” Risk, April 2003, p. 28-31
Pottier, S.W., D.W. Sommer (1997) “Life Insurer Risk-based Capital Measures” Journal of Insurance Regulation, Winter 1997, 179-196
Pratt, S.P., et al. (2000) “Valuing a Business: The Analysis and Appraisal of Closely Held Companies” 2000, McGraw Hill, fourth edition
PriceWaterhouse Coopers (2005) “IFRS: A Step Towards Basel II and Solvency II Implementation” November 2005
Raff, D.M.G. (2000) “Risk Management in an Age of Change” Wharton, working paper 01-18
Remenyi, D. (1998) “Doing Research in Business and Management: an Introduction to Process and Method” Sage

Risk Management for Insurance Firms
236
Richards, T.J. et al. (2004) “Pricing Weather Derivatives” American Journal of Agricultural Economics, November 2004, p. 1005-1017
Risk Management Association (1999) “Operational Risk the Next Frontier” Risk Management Metrics Subgroup (2001) “Embedded Value Definition”
available at www.rmtf.soa.org Risk Management Task Force (2004) “Specialty Guide on Economic Capital”
march 2004, available at www.rmft.soa.org Rouyer, S. (2002) “Enterprise Risk Management for Financial Institutions” Erisk
January 2002, available at www.erisk.com Rouyer, S. et al. (2001) “Financial Institutions’ Enterprise Risk Management”
Moody’s Investor Services, December 2001 Sabatini, J. (2001) “Capital Allocation for Operational Risk” presentation held at
November 15, 2001 Santomero, A, D. Babbel (2001) “Financial Markets, Instruments and
Institutions” second edition, McGraw-Hill Santomero, A.M., D.F. Babbel (1997) “Financial Risk Management by Insurers:
An Analysis of the Process” Journal of Risk and Insurance, June 1997, p. 231-270
Santomero (1995) “Commercial Bank Risk Management: An Analysis of the Process” Wharton, working paper no 95-11-B
Santos, J.A. (2002) “Bank Capital Regulation in Contemporary Banking Theory: A Review of the Literature” BIS Working Papers, No. 90 – September 2000
Saita, F. (1999) “Allocation of Risk Capital in Financial Institutions” Financial Management, Autumn 1999, p. 95-11
Scenario based Working AMA Group (2003) “Scenario-based AMA” May 2003 available at www.newyorkfed.org/newsevents consulted at January 2004
Schaaf-Visser van der, Y. (2002) “IFRS voor Verzekeraars: een Stap te Ver?” Bank- & Effectenbedrijf, November 2002, p. 38-41
Scheepers, K.W.M., E. Urff (2001) “Het Bepalen van de Cost of Capital” Tijdschrift Financieel Management, maart/april 2001 p. 11-26
Scheffer, S. B. (2004) “Management Control of Credit Risk in the Bank Lending Process” Thesis Twente University
Schierenbeck, H. (2003-a) “Ertragsorientiertes Bankmanagement. Band 1: Grundlagen, Marktzinsmethode und Rentabilitäts-Controlling” eighth edition, Gabler

Bibliography
237
Schierenbeck, H. (2003-b) “Ertragsorientiertes Bankmanagement. Band 2: Risiko-Controlling, und integrierte Rendite-/Risikosteuerung” eighth edition, Gabler
Schilder, A. (2005) “Financial Conglomerates from a Prudential Supervisors’ Perspective” speech held at 24 November 2005, Brussels
Schilder, A. (2002) “IFRS en het Toezicht op Banken” Bank- & Effectenbedrijf, November 2002, p. 45-49
Schippers, Meijer (2000) “Catastrophe Bonds and Weather Derivatives” Bank- & Effectenbedrijf, September 2000, p. 24-27
Scholtens, B., D. van Wensveen (2003) “The Theory of Financial Intermediation: an Essay on What It Does (Not) Explain” SUERF-studies Vienna, 2003
Schroeck, G. (2000) “Risk Management and Value Creation in Financial Institutions” Wiley
Sharpe, W.F. (1964) “Capital Asset Prices: A Theory of Market Equilibrium Under Conditions of Risk” Journal of Finance, September 1964, p. 425-442
Siegelaer G.C.M. (2003) “ Met risicobeheer meer zicht op prestaties van pensioenfondsen” VBA Journaal, zomer 2003, p. 12-18
Siegelaer, G. (1996) “Pensioenbeleggingen in Balans: strategisch beleggings- en financieringsbeleid voor pensioenfondsen” Proefschrift Erasmum
Sijben, J.J. (2002-a) “Regulation and Market Discipline in Banking Supervision: an Overview – Part 1” Journal of International Banking Regulation, vol. 3, no. 4, 2002, p. 363-380
Sijben, J.J. (2002-b) “Regulation and Market Discipline in Banking Supervision: an Overview – Part 2” Journal of International Banking Regulation, vol. 4, no. 1, 2002, p. 55-71
Simons, R. (1995) “Levers of Control: How Managers Use Innovative Control Systems to Drive Strategic Renewal” Harvard Business School
Simons, R. (2000) “Performance Measurement and Control Systems for Implementing Strategy” Prentice Hall
Smink, M. (1995) “Asset-Liability Management in Life Insurance: Towards a Theory of Liability Driven Investment Management” Thesis Groningen University
Smid, C.L., H. Wolthuis (2001) “Bedrijfsanalyse en Embedded Value” Universiteit van Amsterdam

Risk Management for Insurance Firms
238
Universiteit Rotterdam, 1996 Smithson, C, and G. Hayt (2001) “A Guide to Capital Allocation: Attribution and
Optimization” Risk, June 2001 Smithson, C. (2003) “Economic Capital – How Much Do you Really Need?”
Risk, November 2003, p. 60-63 Speklé, R. (2002) “Variëteit in Management Control Structuren: Een
Transactiekostenperspectief” Maandblad voor Accountancy & Bedrijfs-kunde, September 2002, p. 409-417
Stevens, A. (2005) “Creating a Global Solvency Regime for Insurance Companies” Presentation held at the IAIS Annual Conference at October 19, 2005
Stevens, A. et al. (1999) “Integrated Balance Sheet Management” Balance Sheet, May 1999, p. 19-23
Stulz, R.M. (2003) “ Risk Management and Derivatives” Thomson Press Swiss Re (2005) “Risk and Capital: Some Thoughts on Risk Modelling in
Insurance Companies” available at www.swissre.com Swiss Re (2001) “The Economics of Insurance: How Insurance Create Value for
Shareholders” available at www.swissre.com Swiss Re (1999) “From Risk to Capital: An Insurance Perspective” available at
www.swissre.com Swiss Re (1996) “Insurance Risk Capital” available at www.swissre.com Thomas, L.C. et al. (2002) “Credit Scoring and Its Applications” SIAM Tillaart, A.H.A.J. van den (2003) “Controlling Operational Risk: Concepts and
Practices” Thesis Twente University Tillaart, A.H.A.J. van den, R.R. Doff (2003) “Beoordelen Operationele Risico’s in
RAROC” Bank- & Effectenbedrijf, Juni 2003, p. 12-15 Tillinghast (2005) “European Embedded Value: The Story So Far” June 2005 Triest, S. van (2000) “The Cost Structure of Firms: Managing Fixed versus
Variable Costs” Thesis Twente University Tschoegl, A.E. (2005) “The Key to Risk Management: Management” in: Frenkel,
M. et al. (2005) “Risk Management” 2nd edition, Springer Verlag, p. 721-764
Tulfer, P. (1993) “Wet Toezicht Verzekeringsbedrijf 1993” Editie Schuurman & Jordens, Nederlandse Staatswetten, 1995
Tzeng, L.Y., et al. (2000) “Surplus Management Under a Stochastical Process” Journal of Risk and Insurance, September 2000, p. 451-462

Bibliography
239
Vanderhoof, I.T., A.I. Altman (ed.) (1998) “The Fair Value of Insurance Liabilities” Kluwer Academic Publishers
Vasicek, O.A. (1977) “An Equilibrium Characterisation of the Term Structure” Journal of Financial Economics, 1997, p. 177-188
Vaughan, E., T. Vaughan (1995) “Essentials of Insurance: A Risk Management Perspective” Wiley
Vedenov, D. V., B.J. Barrett (2004) “Efficiency of Weather Derivatives as Primary Crop Insurance Instruments” Journal of Agricultural and Resource Economics, December 2004, p. 387-204
Verbond van Verzekeraars (2006) “Verzekerd van Cijfers 2005” available at www.verzekeraars.nl
Verbond van Verzekeraars (2005) “Financieel Toetsingskader voor Pensioen-fondsen en Verzekeraars: brief aan De Nederlandsche Bank” 12 Januari 2005, referentienr: 2005/br/1555/Chiel
Vermaat, A.J., A. Oosenbrug (1994) “Bedrijfseconomisch Toezicht op Verzekeraars en Pensioenfondsen” DellWell
Verschuren, P., H. Doorewaard (1999) “Designing a Research Project” Lemma Vlek, C.A.J. (2002) “Risicologica en Risicopsychologie” Bedrijfskunde,
jaargang 74, 2002, nr. 3, p. 21-27 Vliet van der, J.P.A. (1996) “Asset Liability Matching for Insurers” Delft
University Vogelaar, N. (2002) “Bazel II als Opmaat voor Bazel III” Bank- & Effectenbedrijf,
Maart 2002, p. 24-26 Wang, S. (1998) “An Actuarial Index of the Right-Tail Risk” North American
Actuarial Journal, vol. 2 no. 2, p. 88-101 Wang, S. (1997) “Implementation of PH-Transform in Ratemaking” Discussion
Paper for the Casualty Actuarial Society Ratemaking Seminar Walhin, J.F., et al. (2000) “The Practical Pricing of Excess of Loss Treaties:
Actuarial, Financial, Economic and Commercial Aspects” Belgian Actuarial Bulletin, vol. 1. No. 1 2000, p. 1-17
Ward, L. S., D.H. Lee (2002) “Practical Application of the Risk-Adjusted Return on Capital Framework” available at www.casact.org
Wedel, M, et al. (2003) “Factor Models for Multivariate Count Data” Journal of Multivariate Analysis, vol. 87, p. 356-369
Weston, J.F. et al. (1996) “Essentials of Managerial Finance” eleventh edition, Dryden Press

Risk Management for Insurance Firms
240
Wharten, T.V., D.B. Sommer (1996) “Dynamic Financial Modelling: Issues and Approaches” Casualty Actuarial Society Forum, Spring 1996, p. 291-330
Wilkie, A.D. (1985) “Portfolio Selection in the Presence of Fixed Liabilities: A Comment on The Matching of Assets to Liabilities” Journal of the Institute of Actuaries, vol. 112, 1985, p.229-277
Williams, C.A., et al. (1998) “Risk Management and Insurance” eighth edition McGrawHill
Wilson, T. (2003) “Overcoming the Hurdle” Risk, July 2003, p. 79-83 Witteveen, D.E. (2003) “Toezicht en Toekomst” Tijdschrift voor Pensioenvraag-
stukken, Augustus 2003, p. 98-101 Wise, A.J. (1984) “Matching of Assets to Liabilities” Journal of the Institute of
Actuaries, vol. 111, 1984, p.445-501 Wise, A.J. (1987-a) “Matching and Portfolio Selection: Part 1” Journal of the
Institute of Actuaries, vol. 114, 1987, p.113-133 Wise, A.J. (1987-b) “Matching and Portfolio Selection: Part 2” Journal of the
Institute of Actuaries, vol. 114, 1987, p.551-569 Working Group of Economic Capital Models (WECM) (2005-a) “Diversification
and Aggregation of Risks in Financial Conglomerates” 12 May 2005 Working Group of Economic Capital Models (WECM) (2005-b) “Appropriate
Risk Measures, Time Horizon and Valuation Principles in Economic Capital Models” 12 May 2005
Working Group of Economic Capital Models (WECM) (2005-c) “A Survey into the Practical Implementation of Economic Capital Models” 12 May 2005
Working Group of Economic Capital Models (WECM) (2005-d) “A Supervisory View on Economic Capital Models” 12 May 2005
Working Group of Economic Capital Models (WECM) (2003) “Risk Management within Financial Conglomerates: Best Practices by Risk Type” February 2003
WTV (1993) “Wet Toezicht Verzekeringsbedrijf 1993: versie geldig vanaf 15-02-2005” available at www.dnb.nl
Yin, R.K. (1994) “Case Study Research: Design and Methods” second edition, Sage Publications
Zaik, E., et al. (1996) “RAROC at Bank of America: From Theory to Practice” Journal of Applied Corporate Finance, Summer 1996, p. 83-92