Risk During the Financial Crisis: The Role of the ... · RISK DURING THE FINANCIAL CRISIS 183...
34
181 Journal of Insurance Issues, 2017, 40 (2): 181–214. Copyright © 2017 by the Western Risk and Insurance Association. All rights reserved. Risk During the Financial Crisis: The Role of the Insurance Industry Pamela Peterson Drake, 1 Faith Roberts Neale, 2 Patrick J. Schorno, 3 and Elias Semaan 4 Abstract: The risk of financial institutions has become one of the primary areas of focus in both regulation and research in the post‐mortem of the recent financial crisis. We analyze the security risk of financial services firms, focusing on the different sub‐ industries of insurance companies. We find that the returns and risk associated with the different types of insurance companies respond differently to this major disruption, which has implications for the regulation of risk. We also find that the relationship between financial services industries has changed following the financial crisis. [Key words: interconnectedness; idiosyncratic risk; financial crisis] INTRODUCTION he subprime crisis that ushered in the recession of 2008 and 2009 resulted from the convergence of many different forces. The Financial Crisis Inquiry Report conveyed that the causes included the housing bubble; specifically, the risky mortgages that helped inflate the bubble. 5 The U.S. housing market grew at unsustainable rates, sweeping in borrowers, mort‐ gage originators, dealers, government sponsored entities, insurers, and investors. Another factor that may have contributed to the crisis is the 1 Chandler/Universal Eminent Professor of Finance and Department Head, James Madison University, Harrisonburg, VA 22807, 540‐568‐3072, [email protected] 2 Contact Author: Associate Professor of Risk Management and Insurance, Belk College of Business, University of North Carolina at Charlotte, Charlotte, NC 28223, 704‐687‐7636, 704‐ 687‐6987 fax, [email protected] 3 Executive, Model Validation, Ally Financial, 845‐527‐8977, [email protected], The views expressed within this paper are those of the authors and do not necessarily reflect those of Ally Financial. 4 Associate Professor, James Madison University, Harrisonburg, VA 22807,[email protected] 5 Financial Crisis Inquiry Commission (2011). T
Transcript of Risk During the Financial Crisis: The Role of the ... · RISK DURING THE FINANCIAL CRISIS 183...
Risk During the Financial Crisis:The Role of the Insurance Industry
Pamela Peterson Drake,1 Faith Roberts Neale,2
Patrick J. Schorno,3 and Elias Semaan4
Abstract: The risk of financial institutions has become one of the primary areas of focusin both regulation and research in the post‐mortem of the recent financial crisis. Weanalyze the security risk of financial services firms, focusing on the different sub‐industries of insurance companies. We find that the returns and risk associated withthe different types of insurance companies respond differently to this major disruption,which has implications for the regulation of risk. We also find that the relationshipbetween financial services industries has changed following the financial crisis. [Keywords: interconnectedness; idiosyncratic risk; financial crisis]
INTRODUCTION
he subprime crisis that ushered in the recession of 2008 and 2009resulted from the convergence of many different forces. The Financial
Crisis Inquiry Report conveyed that the causes included the housing bubble;specifically, the risky mortgages that helped inflate the bubble.5 The U.S.housing market grew at unsustainable rates, sweeping in borrowers, mort‐gage originators, dealers, government sponsored entities, insurers, andinvestors. Another factor that may have contributed to the crisis is the
1Chandler/Universal Eminent Professor of Finance and Department Head, James MadisonUniversity, Harrisonburg, VA 22807, 540‐568‐3072, [email protected] Author: Associate Professor of Risk Management and Insurance, Belk College ofBusiness, University of North Carolina at Charlotte, Charlotte, NC 28223, 704‐687‐7636, 704‐687‐6987 fax, [email protected], Model Validation, Ally Financial, 845‐527‐8977, [email protected], Theviews expressed within this paper are those of the authors and do not necessarily reflectthose of Ally Financial.4Associate Professor, James Madison University, Harrisonburg, VA 22807,[email protected] Financial Crisis Inquiry Commission (2011).
T
181Journal of Insurance Issues, 2017, 40 (2): 181–214.Copyright © 2017 by the Western Risk and Insurance Association.All rights reserved.
182 DRAKE, NEALE, SCHORNO, AND SEMAAN
passage of the Financial Services Modernization (FSM) Act, more com‐monly referred to as the Gramm‐Leach‐Bliley Act, which ushered in a newcompetitive landscape for the financial sector.6 The FSM Act, signed intolaw in 1999, was the culmination of continual loosening of the Glass‐Steagall Act of 1933. The purpose of the FSM Act was to deregulate thefinancial industry, allowing firms to enter into other industries within thefinancial sector. Many financial firms took advantage of the FSM Act,expanding into previously restricted financial services. During the periodbetween the enactment of the FSM Act and the financial crisis, there werea number of mergers and acquisitions among firms in different financialindustries, as well as mergers among banks that eliminated the less‐efficient banks.7
Regardless of the causes and the degree of contribution by diverseparticipants, the outcome is clear; the rapid deterioration of the subprimemortgage market led to a severe financial crisis in the U.S. beginning in2007. The primary regulatory concern going forward is to dampen orprevent financial industry contagion that could spread to the generaleconomy. This led the regulators to focus on monitoring systemic risk, therisk that an event may result in adverse effects on the general economythrough a loss of value and confidence as noted by Mayer, Pence andSherlund (2009).8 The financial sector’s exposure to systemic risk is throughasset correlation across financial firms leading to a “domino” or contagioneffect, and exposure to a common shock that simultaneously and signifi‐cantly affects many financial firms.9
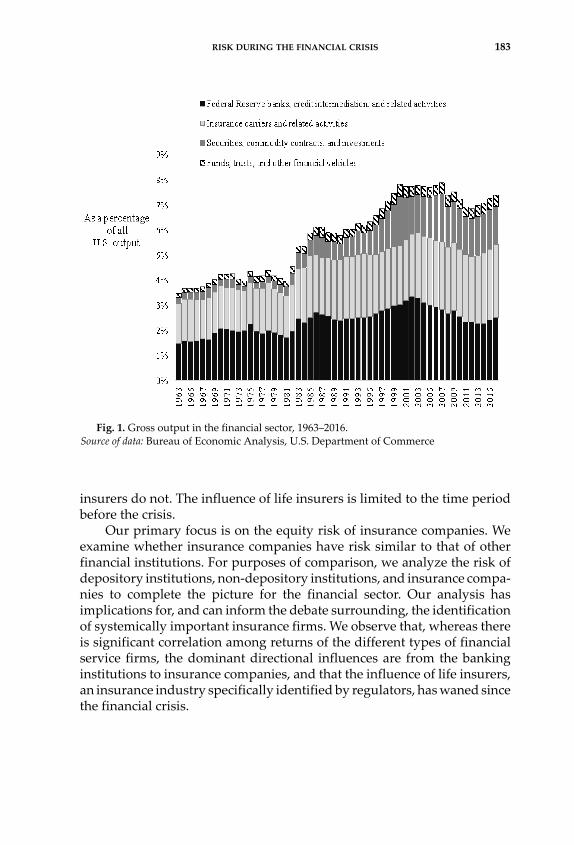
The purpose of this paper is to examine the insurance industry’scontribution to financial sector risk during the financial crisis. As you cansee in Figure 1, the insurance component of the financial industry issignificant. We posit that insurers have diverse underwriting and invest‐ment portfolios and interact differently with other financial firms, such asdepository institutions. We also suggest that not all types of insurancecompanies are interconnected with other financial services providers. Weconfirm that insurers specializing in financial guarantee, property andcasualty (P&C) insurance, and reinsurance have some degree of intercon‐nectedness with the financial system, whereas accident and health (A&H)
6 U. S. Public Law No. 106‐102.7 See, for example, Strahan (2003).8 Cummins and Weiss (2014) note this definition of risk is very similar to that in the GenevaAssociation’s Group of Ten (2001, p. 126) report, as well as others such as the Financial Sta‐bility Board (2009), S. L. Schwarcz (2008), Thomson (2009), and Helwege (2010). 9 Helwege (2010) provides a summary of the financial crisis and its causes, but leaves thedegree of contribution of systemic risk by these participants to future research.
RISK DURING THE FINANCIAL CRISIS 183
insurers do not. The influence of life insurers is limited to the time periodbefore the crisis.
Our primary focus is on the equity risk of insurance companies. Weexamine whether insurance companies have risk similar to that of otherfinancial institutions. For purposes of comparison, we analyze the risk ofdepository institutions, non‐depository institutions, and insurance compa‐nies to complete the picture for the financial sector. Our analysis hasimplications for, and can inform the debate surrounding, the identificationof systemically important insurance firms. We observe that, whereas thereis significant correlation among returns of the different types of financialservice firms, the dominant directional influences are from the bankinginstitutions to insurance companies, and that the influence of life insurers,an insurance industry specifically identified by regulators, has waned sincethe financial crisis.
Fig. 1. Gross output in the financial sector, 1963–2016.Source of data: Bureau of Economic Analysis, U.S. Department of Commerce
184 DRAKE, NEALE, SCHORNO, AND SEMAAN
SYSTEMICALLY IMPORTANT
FINANCIAL INSTITUTIONS
Section 112(b)(2) of the Dodd‐Frank Wall Street Reform and ConsumerProtection Act created the Financial Stability Oversight Council (FSOC).The FSOC uses six factors to identify companies in need of FSOC supervi‐sion; three factors relate to the company’s ability to affect the economy andthree factors relate to the company’s likelihood of financial distress. TheFSOC laid out a three‐stage process to manage this determination. In thisprocess, the FSOC first filters the large number of nonbank companies onsize and at least one quantitative factor, producing a smaller number ofnonbank firms.10 Then, using publicly available and supervisory data, theFSOC narrows this set of nonbank firms further using quantitative factorsand risk profiles. In the third stage, the FSOC produces a much smallernumber of nonbank entities that are subject to further scrutiny by the FSOC.
In its determination of whether a firm is a systemically importantfinancial institution (SIFI), the FSOC uses one of two determination stan‐dards to analyze a company’s threat to the stability of the national economydue to either (1) material financial distress, or (2) the “nature, scope, size,scale, concentration, interconnectedness, or mix of activities.”11 Once iden‐tified as systemically important, these companies must subsequentlydevelop “recovery and resolution” plans. The FSOC used the materialfinancial distress threshold in its 2014 designation of MetLife as a SIFI dueto their interconnectedness with other firms arising from their productsand activities including securities lending, guaranteed investment con‐tracts, captive reinsurance, and variable annuities.
The Financial Stability Board (FSB), an international body similar tothe U.S.’s FSOC, identifies institutions as Global Systemically Importantentities. These institutions include banks (Global Systemically ImportantBanks, GSIBs) and, starting in 2013, insurance companies (Global System‐ically Important Insurers, G‐SIIs). In development of the G‐SII list, the FSBworks with the International Association of Insurance Supervisors (IAIS).In November 2014, the FSB identified thirty banking institutions and nine
10The size criterion is $50 billion in assets, which would capture half of the publicly tradedlife insurance companies in 2011 but few accident and health and property and casualtyfirms. These size criteria would have only identified one or two of the financial guaranteeinsurers, depending on the year. 11There are ten additional statutory factors the FSOC must consider by law. They are foundon page 4 of the final determination of MetLife located at https://www.treasury.gov/initia‐tives/fsoc/designations/Documents/MetLife%20Public%20Basis.pdf.
RISK DURING THE FINANCIAL CRISIS 185
insurers as systemically important; three of the G‐SIIs are U.S. insurers:American International Group, MetLife, and Prudential Financial.
The FSOC and Met Life
MetLife became the first nonbank company to challenge the SIFIdesignation, arguing that the FSOC’s decision is “arbitrary and capri‐cious.”12 The Court agreed with MetLife, ruling the SIFI designation shouldbe rescinded. Specifically, the Court found the FSOC had “violated its ownGuidance by failing to assess MetLife’s vulnerability to financial distress.”The Court found there was no basis to conclude that MetLife’s distresswould “materially impair” its counterparties as defined by the FSOC’sGuidance because the FSOC did not actually estimate losses. The Courtalso took issue with the fact that the FSOC did not consider the costs of theSIFI designation. The FSOC admitted it did not consider the costs of thedesignation, but argued that it is not required by Dodd‐Frank.
In its appeal, the FSOC contended that its guidance does not requirenumerical assessment of the likelihood of failure or estimation of counter‐party losses. It concluded that the estimation of the costs of the designationor resulting effects is not required because it does not consider those coststo be a risk‐related factor. A panel of academic experts filed a brief insupport of the FSOC stating that the quantification of risk and a subsequentanalysis of the costs of SIFI designation is an “unachievable burden” and,if required, could end the FSOC’s ability to designate any firm a SIFI.13
There is concern that if MetLife succeeds in the revocation of its SIFIstatus, which is currently under appeal by the FSOC, then AIG and Pru‐dential will come under more pressure to dispute their designations. BothMetLife and AIG expressed concerns, noting that regulatory requirementsfor SIFIs have not yet been specified.14 Both firms are concerned that thecosts of the SIFI designation are unknown; AIG reports the costs of thedesignation could significantly affect business operations, including capi‐tal and liability management, and stakeholder perceptions regardingfinancial strength.15 This uncertainty could also affect financing costs. Inits Schedule 14A, filed on February 1, 2016 with the SEC, AIG notes it has
12MetLife, Inc. vs. Financial Stability Oversight Council, filed in the U.S. District Court of theDistrict of Columbia, civil action no. 15‐14, Introduction, paragraph 3.13Brief of Amici Curiae scholars of insurance and financial regulation in support of appellantand reversal filed in the U.S. Court of Appeals for the District of Columbia Circuit, No. 16‐5086. 14More detail is found in MetLife’s 2015 10‐K, in the Insurance Regulation section, pages 44–45. 15AIG’s 2015 10‐K, Item 1A—Risk Factors—Regulation, page 41.
186 DRAKE, NEALE, SCHORNO, AND SEMAAN
come under pressure to separate AIG into “separate insurers focusing onlife, property‐casualty, and mortgage coverage.” Although the SIFI desig‐nation is not specifically referenced as the reason to separate, it is reason‐able to assume it has some influence on decision‐making. MetLife has sincedecided to separate part of their business regardless of the outcome of theircase.16
The outcome of this dispute has consequences for all stakeholders,systemic risk regulators, and the implementation of the systemic regula‐tory section of the Dodd‐Frank law. It has consequences for all potentiallySIFI nonbank firms, including life and property‐casualty insurers. At theheart of the issue is the SIFI designation process, with an even morefundamental question of risk measurement. Should the FSOC be requiredto quantify systemic risk, and, if so, how? Regardless, both the FSOC andindustry struggle with the identification and measurement of firms thatmay pose systemic risk to the financial industry. In this study, we provideadditional information regarding not only the general interconnectednessof financial firms, but also the conditions under which each insurancesegment is more likely to influence banking firms.
Measures of Systemic Risk
Several researchers have developed firm‐specific measures of systemicrisk. One measure, based on value‐at‐risk, is proposed by Adrian andBrunnermeier (2014). These authors develop the CoVAR measure, whichis based on market data of leverage and size as well as maturity mismatch.Another measure of systemic influence is the Systemic Risk Index (SRISK)measure. SRISK, developed by Brownlees and Engle (2016), is a measureof an individual company’s influence on the economy. SRISK is an estimateof the marginal expected shortfall (MES) for an individual firm. Based oncredit‐scoring methods, SRISK is an estimate of the capital shortage in theevent of severe economic distress. In both cases, CoVar and SRISK, anestimate that is large relative to other financial firms suggests that thefinancial institution is a potential source of systemic risk. As Kupiec andGüntay (2016) point out, however, neither CoVar nor SRISK measures areassociated with statistical tests that allow the user to test whether a firm issystemically important.
We use the SRISK measures estimated by the V‐Lab at New YorkUniversity’s Volatility Institute to provide some descriptive information onpotential capital shortfall of the insurance firms identified by the FSOC asSIFI. We graph the SRISK measure in both dollars of shortfall and percent
162015 Chairman’s Letter. MetLife Annual Report.
RISK DURING THE FINANCIAL CRISIS 187
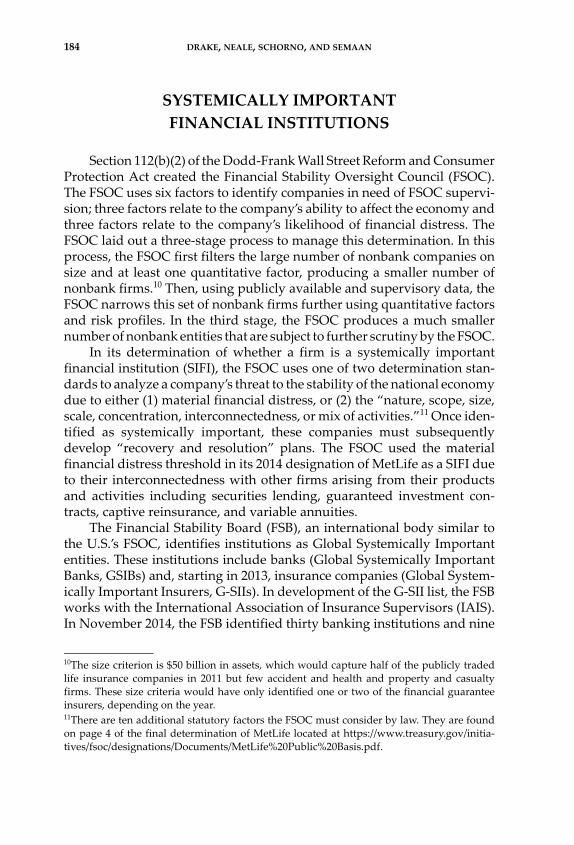
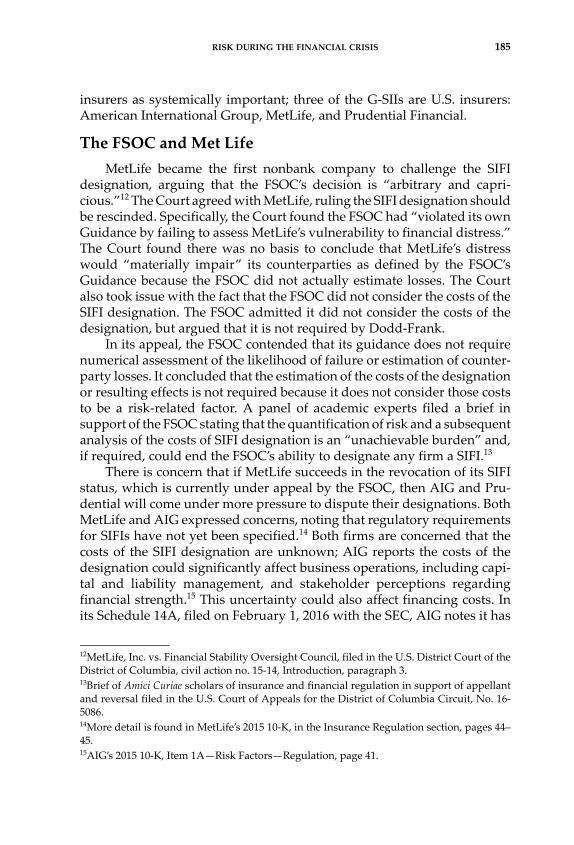
of the economy’s shortfall in the U.S. for MetLife, AIG, and PrudentialFinancial, and present this in Figure 2 and Figure 3, respectively. In termsof potential capital shortfall, both MetLife and Prudential Financial are inthe top ten contributors based on SRISK of financial institutions in the post‐crisis period.
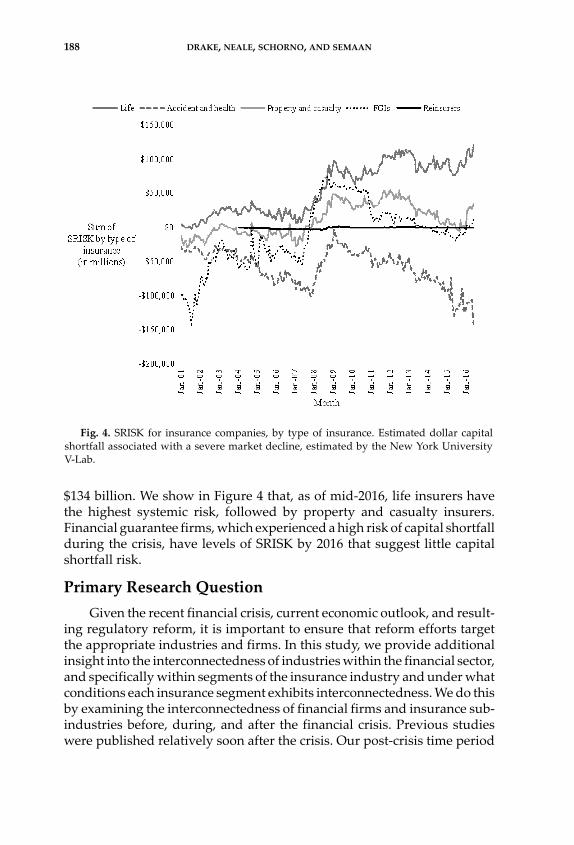
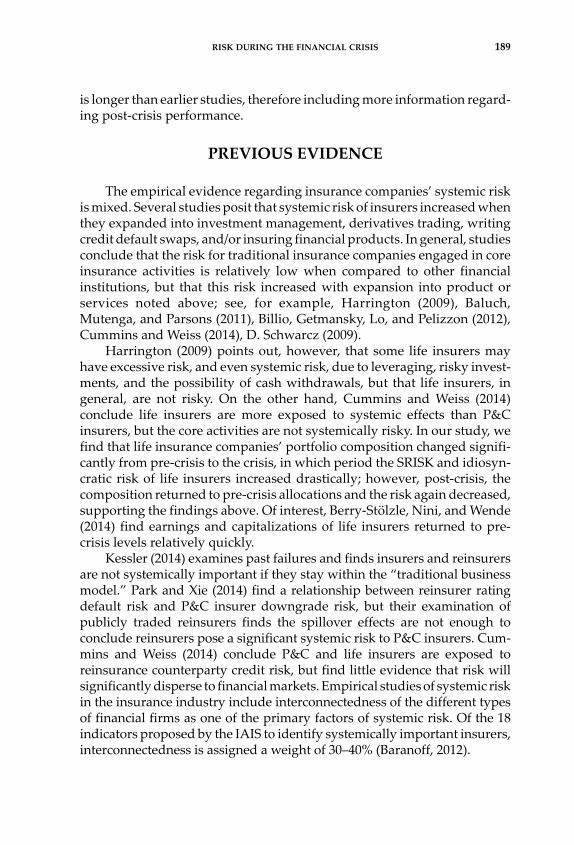
When we examine the SRISK by type of insurance, we see that lifeinsurers, as a group, have SRISK of approximately $120 billion by mid‐2016. Putting this in perspective, the top three depository institutions (Bankof America, JPMorgan Chase & Co., and Citigroup) together had SRISK of
Fig. 2. SRISK measure for SIFI nonbank companies, in millions of dollars.
Fig. 3. SRISK measure for SIFI nonbank companies: percent of economic impact.
188 DRAKE, NEALE, SCHORNO, AND SEMAAN
$134 billion. We show in Figure 4 that, as of mid‐2016, life insurers havethe highest systemic risk, followed by property and casualty insurers.Financial guarantee firms, which experienced a high risk of capital shortfallduring the crisis, have levels of SRISK by 2016 that suggest little capitalshortfall risk.
Primary Research Question
Given the recent financial crisis, current economic outlook, and result‐ing regulatory reform, it is important to ensure that reform efforts targetthe appropriate industries and firms. In this study, we provide additionalinsight into the interconnectedness of industries within the financial sector,and specifically within segments of the insurance industry and under whatconditions each insurance segment exhibits interconnectedness. We do thisby examining the interconnectedness of financial firms and insurance sub‐industries before, during, and after the financial crisis. Previous studieswere published relatively soon after the crisis. Our post‐crisis time period
Fig. 4. SRISK for insurance companies, by type of insurance. Estimated dollar capitalshortfall associated with a severe market decline, estimated by the New York UniversityV‐Lab.
RISK DURING THE FINANCIAL CRISIS 189
is longer than earlier studies, therefore including more information regard‐ing post‐crisis performance.
PREVIOUS EVIDENCE
The empirical evidence regarding insurance companies’ systemic riskis mixed. Several studies posit that systemic risk of insurers increased whenthey expanded into investment management, derivatives trading, writingcredit default swaps, and/or insuring financial products. In general, studiesconclude that the risk for traditional insurance companies engaged in coreinsurance activities is relatively low when compared to other financialinstitutions, but that this risk increased with expansion into product orservices noted above; see, for example, Harrington (2009), Baluch,Mutenga, and Parsons (2011), Billio, Getmansky, Lo, and Pelizzon (2012),Cummins and Weiss (2014), D. Schwarcz (2009).
Harrington (2009) points out, however, that some life insurers mayhave excessive risk, and even systemic risk, due to leveraging, risky invest‐ments, and the possibility of cash withdrawals, but that life insurers, ingeneral, are not risky. On the other hand, Cummins and Weiss (2014)conclude life insurers are more exposed to systemic effects than P&Cinsurers, but the core activities are not systemically risky. In our study, wefind that life insurance companies’ portfolio composition changed signifi‐cantly from pre‐crisis to the crisis, in which period the SRISK and idiosyn‐cratic risk of life insurers increased drastically; however, post‐crisis, thecomposition returned to pre‐crisis allocations and the risk again decreased,supporting the findings above. Of interest, Berry‐Stölzle, Nini, and Wende(2014) find earnings and capitalizations of life insurers returned to pre‐crisis levels relatively quickly.
Kessler (2014) examines past failures and finds insurers and reinsurersare not systemically important if they stay within the “traditional businessmodel.” Park and Xie (2014) find a relationship between reinsurer ratingdefault risk and P&C insurer downgrade risk, but their examination ofpublicly traded reinsurers finds the spillover effects are not enough toconclude reinsurers pose a significant systemic risk to P&C insurers. Cum‐mins and Weiss (2014) conclude P&C and life insurers are exposed toreinsurance counterparty credit risk, but find little evidence that risk willsignificantly disperse to financial markets. Empirical studies of systemic riskin the insurance industry include interconnectedness of the different typesof financial firms as one of the primary factors of systemic risk. Of the 18indicators proposed by the IAIS to identify systemically important insurers,interconnectedness is assigned a weight of 30–40% (Baranoff, 2012).
190 DRAKE, NEALE, SCHORNO, AND SEMAAN
Baluch et al. (2011) examine global insurance sector returns and find,in general, that insurers have lower systemic risk than banks, but that riskincreased in later years due to the strategic expansion previously dis‐cussed.17 Bernal, Grabo, and Guilman (2014) examine three industrieswithin the financial services sector and find that other financial servicesfirms contribute the most systemic risk in the Eurozone, while the insur‐ance sector is the riskiest in the United States. They conclude that bankingposes the least systemic risk of the three U.S. industries analyzed.
Billio et al. (2012) focus on the connectedness of the different industrieswithin the U.S. financial sector and find that banks and insurers are moreimportant to the interconnectedness of the financial sector and have anasymmetric effect on the monthly returns of brokers and hedge funds.Chen, Cummins, Viswanathan, and Weiss (2014) use credit default swapspreads and linear and nonlinear Granger‐causality tests to examine inter‐connectedness of insurers and banks. They conclude that the dominatinginfluence is that of banks affecting insurance companies.18 Similarly,Elyasiani, Staikouras, and Dontis‐Charitos (2016) find evidence of conta‐gion when banks acquire insurers but no significant effects when insurersacquire banks. Lastly, Billio et al. (2012) and Acharya, Pedersen, Philippon,and Richardson (2010) find firms in the financial industry interconnectedwith insurers being one possible origin of systemic risk. Schwarcz andSchwarcz (2014) strongly argue that insurer operations, in general, posesystemic risk.
The bottom line of this evidence is that there appears to be some degreeof interconnectedness among financial firms, and that some insurancecompanies may be systemically important. However, the interconnected‐ness by the type of insurer has not been fully examined, which is what weexplore in more detail. We expand the analysis of interconnectedness bysegmenting insurance companies by product focus and segmenting andexpanding the sample period to account for relationship heterogeneitybefore, during, and after the financial crisis.
17Baluch et al. (2011) find that United Kingdom, Asia‐Pacific, and United States property‐casualty insurers were the least affected by the crisis. Life insurers, global composite insur‐ers, global reinsurers, and other European insurers were the most affected and had theworst performance during the crisis. They also find that the crisis affected certain lines ofinsurance more, including financial guarantee, credit, and liability insurers as well as thosethat deviated from their core insurance business, such as AIG and Swiss Re.18Notably, liquidity and leverage played a significant role in the crisis beginning in 2007; seethe Republican Commissioners on the Financial Crisis Inquiry Commission in the FinancialCrisis Primer: Questions and Answers on the Causes of the Financial Crisis, December 15, 2010.
RISK DURING THE FINANCIAL CRISIS 191
INSURANCE, RISK, AND INTERCONNECTIONS
Understanding the equity risks associated with insurance companiesand the interconnectedness with others in the financial sector requiresunderstanding the nature of each type of business. The bulk of insuranceoperations fall in three main industries: life, property‐casualty (P&C), andaccident‐health (A&H). We can also break out some firms typically classi‐fied as P&C insurers into their own groupings: financial guarantee insurers(FGIs) and reinsurers. Financial guarantee insurers are technically withinthe property‐casualty industry, and these firms were some of the firstfinancial firms affected significantly by the unfolding crisis.19 In the SICsystem, reinsurers are classified as property and casualty insurers; how‐ever, these firms are distinct in terms of their risks.20 A further group toconsider is the surety insurance industry, which has characteristics ofbanking and insurance. We consider the insurance industry as a whole andthe characteristics of each insurer group, including their underwriting andinvestment operations, to evaluate interaction between insurance andfinancial services. Based on previous research, we expect to find thatinsurance industry equity returns, in general, are interconnected with andinfluence other financial industries; see, e.g. Baluch et al. (2011), Billio et al.(2012), Cummins and Weiss (2014), Schwarcz and Schwarcz (2014). Specif‐ically, insurers’ expansion into non‐insurance financial products eitherprecipitated or enhanced any pre‐existing interconnection.
Insurance Segments
Life Insurers
The premiums received for mortality and longevity protection pro‐vided by life insureres result in large reserves invested and held over manyyears. As a result, life insurers are exposed to runs similar to those of banksthat typically occur during periods of financial distress, when policyhold‐ers decide to cancel their policies or otherwise access any existing cash
19On January 18, 2008, AMBAC became the first FGI downgraded from AAA because of thesubprime mortgage market decline, followed by Moody’s downgrade of both AMBAC andMBIA in June 2008. The Federal Reserve Bank of New York agreed to lend AIG, a property‐casualty insurer, $85 billion on September 16, 2008. On November 17, 2008, three life insur‐ance companies requested TARP funding; these insurers were Genworth Financial, Hart‐ford Financial Services Group, and Lincoln National. 20In the SIC system, reinsurers were classified within property and casualty insurers, withinthe 633 3‐digit SIC code grouping. Under the NAICS system, reinsurers are separate fromP&C insurance (NAICS of 524130 for reinsurers compared with 524126 for property andcasualty insurers.
192 DRAKE, NEALE, SCHORNO, AND SEMAAN
value (Russell, Fier, Carson, and Dumm, 2013). Life insurers also producedeposit‐type contracts, including annuities and guaranteed investmentcontracts (GICs).21 In addition to the sheer volume of life insurer assetsexposed to capital market fluctuations, other areas of sensitivity includesecurities lending and Funding Agreement Backed Securities (FABS) andNotes (FASN).22,23 While insurers of other lines of business participate inthese transactions, life insurers dominate the securities lending participa‐tion; hence, life insurers are significantly exposed to market or interest raterisk (Klein, Ma, Ulm, Wang, Wei, and Zanjani, 2009).24
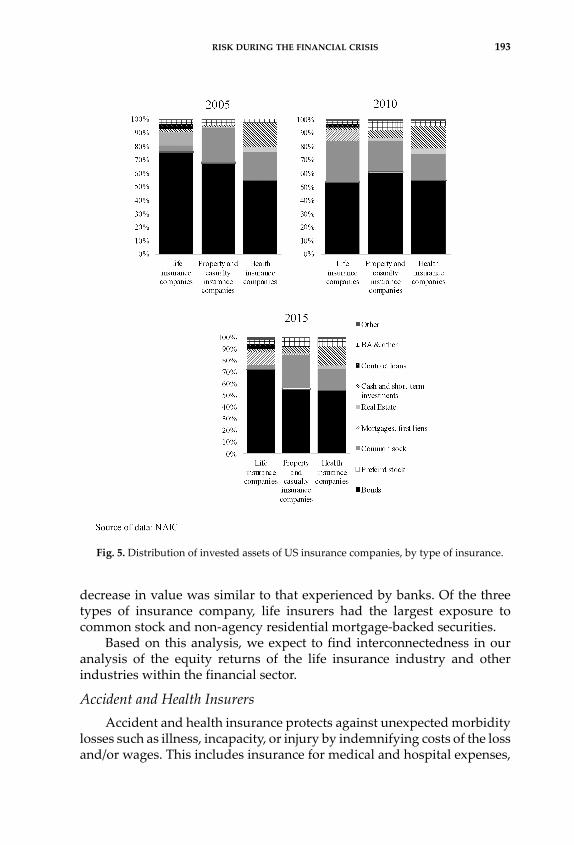
Using data from the NAIC’s Center for Insurance Policy and Research(2011, 2016) we compare allocations in invested assets by insurer type inFigure 5. In the years preceding the financial crisis, life insurers shifted theirinvestments towards fixed income securities, including securitized assetsof mortgage‐backed securities, while decreasing allocation in government‐sponsored entities and U.S. Government risk‐free investments.25 Life insur‐ers also invest in assets such as bonds that are insured by financial guar‐antee insurers. FGIs were some of the first and hardest hit firms impactedby the recession, incurring significant credit downgrades as a result. Thus,life insurers experienced deterioration in asset values from the generaldecline in the market and from the reduction in credit rating of FGIs. Baluchet al. (2011) observe that life insurers experienced a greater loss of valuationof assets during the financial crisis than non‐life insurers, and that the
21Deposit‐type services offered by life insurers also include dividend and coupon accumula‐tions, lottery payouts, structured settlements, and premium funds (Graham and Xie, 2007).22Securities lending is, effectively, a loan for investors’ short sale activity. The insurer bene‐fits from a fee charged to the investor as well as any return on the lent investments in theform of dividends, interest, and capital appreciation. Securities lending loans are generallyshort‐term, less than twelve months in duration. 23A contributing factor is life insurers’ use of structured securities, first introduced in 2003;life insurance companies buy low‐quality securities and then issue notes profiting on thespread between these securities. Essentially, insurers would borrow using their investment‐grade rating and then lend at A or BBB rates, with a spread of 75 to 100 basis points. Thepractice of issuing these notes diminished significantly in 2009, as investors lost their appe‐tite for structured securities.24If it is a product where the assets are part of the general fund, the insurer guarantees aminimum interest rate and assumes all risk from fluctuations; as a result, the cash surrendervalue varies. If the product places the assets in a separate account, the policy owner assumesinterest rate risk, yet the assets are not available to general creditors in the event ofinsolvency. 25In addition, according to the NAIC, the predominant type of bond is the corporate bond.Some of the shrinkage of the bond category in 2010 may be attributed to the loss of value ofsome bonds during the period of economic stress, and this stress also resulted in someinsurance companies holding downgraded, below‐investment‐grade bonds.
RISK DURING THE FINANCIAL CRISIS 193
decrease in value was similar to that experienced by banks. Of the threetypes of insurance company, life insurers had the largest exposure tocommon stock and non‐agency residential mortgage‐backed securities.
Based on this analysis, we expect to find interconnectedness in ouranalysis of the equity returns of the life insurance industry and otherindustries within the financial sector.
Accident and Health Insurers
Accident and health insurance protects against unexpected morbiditylosses such as illness, incapacity, or injury by indemnifying costs of the lossand/or wages. This includes insurance for medical and hospital expenses,
Fig. 5. Distribution of invested assets of US insurance companies, by type of insurance.
194 DRAKE, NEALE, SCHORNO, AND SEMAAN
long‐term care, and disability. In contrast to life insurance, most policy‐holders renew health insurance annually, except for long‐term care insur‐ance. Generally, claimants file very close to the time of services; therefore,there is a relatively short time between premiums and claims payouts.Therefore, accident and health insurance is primarily a short‐tail line ofinsurance, a relatively small part of the insurance market and not likely tohave interconnectedness with other financial services providers. Our studyis the first to examine A&H insurers as a segment. Based on these charac‐teristics of A&H firms, we do not expect to find interconnectedness amongthe equity returns of A&H insurers and other industries within the finan‐cial sector.
Property and Casualty Insurance
We find no support in the literature that P&C insurers are intercon‐nected with other financial services firms, though Cummins and Weiss(2014) and Park and Xie (2014) find some effects of reinsurers’ risk on P&Cinsurers. Harrington (2009) notes that large loss events, such as catastro‐phes, may affect P&C insurers and reinsurers, possibly disrupting thatmarket; but based on past evidence, there is little chance of significantcontagion to other markets. In summary, P&C insurance is a diverse set ofinsurance products. The property side of the business consists of first‐party,short‐tail property coverage, while liability claims for significant injuriesto a third party resulting from an insured’s negligence usually take longer,sometimes several years, to resolve.
In addition to traditional insurance, large commercial and financialservices firms have a diverse set of insurance risks that may be geograph‐ically dispersed, requiring a customized policy, specialized underwriting,and layered limits. Noninsurance financial firms of interest to systemic riskregulators obtain much of their coverage from the global insurance mar‐kets. Typical lines of insurance purchased by these financial institutionsare coverage for property, network security and cyber risks, Directors andOfficers (D&O) liability, political risk, political violence and terrorism, andcomprehensive nonpayment insurance to cover against insolvency or “pro‐tracted insolvency” of customers and other counterparties. Apart from theinvestment portfolio, P&C insurers have exposure to the general economy,as claims in some lines, such as Directors and Officers insurance, maycorrelate to general economic conditions.
Similar to life insurers, P&C insurers’ investment portfolios are sensi‐tive to general market conditions. However, the relatively shorter tailnature of P&C products mitigates some of the interest rate risk, so we donot expect to find interconnectedness among the equity returns of the P&Cindustry and those of other financial sector industries.
RISK DURING THE FINANCIAL CRISIS 195
Financial Guarantee Insurers
Financial guarantee insurers (FGIs) provide credit enhancement for avariety of financial products. These credit enhancements are in the form ofinsurance on public finance, guaranteed investment contracts, structuredfinance, and credit default swaps; however, after the 2008–2009 financialcrisis, FGIs are no longer permitted to participate in the credit default swapmarket. Many investments in securitized assets were “wrapped” by finan‐cial guarantor firms, thus effectively transferring the FGIs’ investment‐grade rating to these assets. When rating agencies downgraded the FGIs,the downgrading of associated “wrapped” assets led to a weakening ininsurers’ capital positions. For example, many municipal bonds are“wrapped” by FGIs, which increases the credit rating of the bond andreduces the cost of capital to the municipal.
FGIs operate over a long horizon. For example, they may receive a one‐time premium payment to insure a municipal bond with duration of 20,30, or even 40 years. FGIs may also manage the proceeds from the bondsale for the municipality, providing a guarantee of a set amount of interest(that is, a guaranteed investment contract). The majority of FGIs alsoinsured structured finance, primarily the higher‐rated tranches of collater‐alized debt obligations (CDOs), and some financial guarantee insurersissued credit default swaps (CDS).26
An FGI derives its value from its investment‐grade rating. The busi‐ness model of FGIs leverages this rating by “lending” this rating to thestructurer or owner of an insured financial product in exchange for aprotection payment or premium. The FGI promises to make payments inthe event of default of the underlying assets of the protected financialproduct, and FGIs employ no‐loss or remote‐loss underwriting guidelinesto preserve the investment‐grade rating required for their businessmodel.27 Prior to the crisis these guidelines resulted in extremely low lossesand very high surplus amounts relative to other insurers. The crisis causedFGIs to enter financial distress, with negative effects spreading to entitiesand markets that relied on this insurance. As stated previously, largerinsurers invested significantly in bonds and other structured assets insuredby FGIs that lost value when FGIs’ credit ratings were downgraded. Hence,FGIs are interconnected with other financial services entities.28
26For a comprehensive analysis of FGIs, see Drake and Neale (2011).27The no‐loss or remote loss underwriting assumes that there will be zero loss on a transaction.28Researchers often exclude monoline insurers such as FGIs from their sample due to theirunique exposures (for example, Cummins and Weiss, 2014).
196 DRAKE, NEALE, SCHORNO, AND SEMAAN
Surety Insurers
Surety insurance is a guarantee that the insured (the principal) willfulfill its obligations to the beneficiary (the obligee); if the insured fails tofulfill its obligation, the surety insurer takes the place of the insured. Aswith any insurance, there is an underwriting process required before thesurety grants the insurance. Surety insurance shares some features ofbanking; for example, surety insurers require customers to qualify forcredit. Companies and individuals use surety insurance for a variety ofobligations, including court‐ordered bonds for lawsuits, developers’ bondswith local townships, construction for state and federal governments,bonds covering lease payments, and security for licenses and permits.29
In contrast to traditional insurance and similar to FGIs, the suretyemploys no‐loss or remote‐loss underwriting with the expectation theinsured will fulfill obligations. Unlike FGIs, under the surety agreementsurety insurers have the right to recover from the insured money paid outfor claims. Hence, we believe surety insurers are interconnected to otherfinancial services, but potentially less so than FGIs.
Reinsurers
Reinsurers provide insurance, referred to as reinsurance, for insurancecompanies to off‐load risk and free up underwriting capacity. Reinsurersdevelop a diversified insurance pool by combining risks from differentinsurers from around the world. One concern is that the reinsurance marketis heavily concentrated. Park and Xie (2014) note that a few internationallydomiciled firms dominate the market, with uneven regulation.30
The Group of Thirty (2006) performed a “stress test” and found nowidespread insolvencies of P&C insurers in the event 20 percent of globalreinsurers failed. In addition, in the event of a reinsurer failure, P&Cinsurers remain fully liable to policyholders. Therefore, this study suggestsreinsurers are not significantly interconnected with noninsurance financialsegments.
On the other hand, there is evidence that reinsurance companies’failures can lead to instability in the P&C insurance sector, with possible
29Like other forms of insurance, there are underwriting risks, especially in terms of model‐ing or predicting risks. Trade credit and surety insurers’ profits are sensitive to the economy,as business insolvencies result in losses for the insurers. Surety insurers are also tied to otherfinancial service industries through their competition with banks in the guarantee businessoutside the U.S. Further, because many businesses view surety bonds as an alternative to abank letter of credit, surety firms compete directly with domestic banks.30In the 1980s, there were a number of small reinsurers, but there were also a large numberof failures among these small reinsurers.
RISK DURING THE FINANCIAL CRISIS 197
ramifications for the general economy (Baluch et al., 2011, and Park andXie, 2014), though Harrington (2009) concludes that the chance of signifi‐cant contagion is small. According to the Group of Thirty (2006), about 50percent of reinsurance premiums generated annually are from NorthAmerica. The 2014 Federal Insurance Office (FIO) report discusses theimportance of the global reinsurance market to U.S. insurers, noting thatseven of the ten costliest catastrophes in the world, as measured by insuredlosses, occurred in the U.S. In 2005, non‐U.S. reinsurers paid over 60 percentof insured losses from Hurricanes Katrina, Rita, and Wilma. Similarly,reinsurers paid around 40 percent of total insured losses from SuperstormSandy in 2012.31 Even though U.S. primary insurers spread their risksacross several reinsurers, failures of the largest global reinsurers can affectthe reinsurance market’s capacity to underwrite insurance by tighteningunderwriting guidelines and charging higher premiums. Scordis andSteinorth (2012) find that reinsurance increases the value of smaller insur‐ers, allowing them to write more insurance and increasing overall marketcapacity. Therefore, we expect the equity returns of reinsurers to exhibitinterconnectedness with those of other financial service industries.
Summary
Previous research documents some systemic risk originating from theinsurance sector but the evidence is not clear on the origin within the sector.Based on our analysis of the characteristics of the different types of insur‐ance firms as well as prior evidence, we expect to find that life insurers,FGIs, surety insurers, and reinsurers exhibit interconnectedness with otherindustries within the financial sector. We also expect no interconnectednessof A&H and P&C insurers with other industries within this sector.
DATA
Our analysis has two layers. First, we examine the interconnectednessof insurance companies with other financial industries. Second, we exam‐
31Using 2011 data, the IAIS reports that the property sector purchases 44 percent of globalreinsurance premiums, the largest amount of all sectors. Life reinsurance makes up 31 per‐cent of global premiums, while premiums for liability lines account for 22 percent ofpurchases. Three percent of global reinsurance premiums are for financial lines. Europeanreinsurers assumed most of the risk, $47 billion more than they ceded out to other reinsur‐ers. North American insurers ceded out $16 billion more than they assumed. Asia andAustralia ceded $23 billion while assuming only $2 billion (IAIS Global Insurance MarketReport, 2012 Edition, pp. 20–21).
198 DRAKE, NEALE, SCHORNO, AND SEMAAN
ine whether interconnectedness is specific to certain lines or firms withinthe insurance sector.
We draw daily returns from the Center for Research in Security Prices(CRSP) Daily Stock File for the entire financial sector from January 1, 2001,through December 2015.32 We classify the sample based on SIC codes intothe following financial services industry portfolios:
We perform this classification based on the SIC code corresponding to thedaily return; hence, a firm may shift from one portfolio to another over timeif their lines of business change significantly.
We also break down the insurance firms by type of insurance. How‐ever, we specifically identify financial guarantee insurers (XL CapitalAssurance, MBIA, Radian, and Assured Guaranty) and separate thesefirms and AIG from the P&C category. We also break out the reinsurersfrom the property and casualty firms. We use the following insuranceportfolios:
We construct portfolios using market capitalization weighted averagesof the individual components for the portfolios, and use the CRSP value‐weighted market return with dividends to represent the market return. Weallow firms to enter and leave a portfolio based on SIC code changes,entrance to the financial industry, exit from the financial industry, ordelisting.
32We begin our analysis after passage of the Financial Services Modernization Act. The onlyinsurance companies excluded from the insurance carriers’ industry were title insurancecompanies and “other” insurance companies, which, based on SIC codes, we could not oth‐erwise classify. We ran all analyses with and without the few title insurance companies anddid not find different results; the returns to the stocks of title insurers tend to be driven byfactors outside the scope of this analysis.
1 Depository institutions
2 Non‐depository credit institutions
3 Insurance carriers
3.1 Life insurers
3.2 Accident and health insurance and medical insurers (A&H)
3.3 Property and casualty insurers (P&C)
3.4 Surety insurers
3.5 Financial guarantee insurers (FGI)
3.6 Reinsurers
RISK DURING THE FINANCIAL CRISIS 199
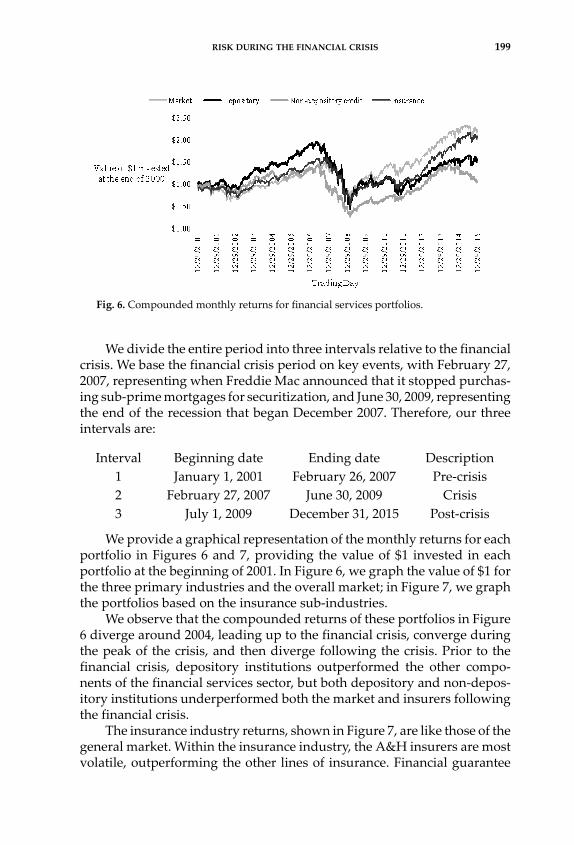
We divide the entire period into three intervals relative to the financialcrisis. We base the financial crisis period on key events, with February 27,2007, representing when Freddie Mac announced that it stopped purchas‐ing sub‐prime mortgages for securitization, and June 30, 2009, representingthe end of the recession that began December 2007. Therefore, our threeintervals are:
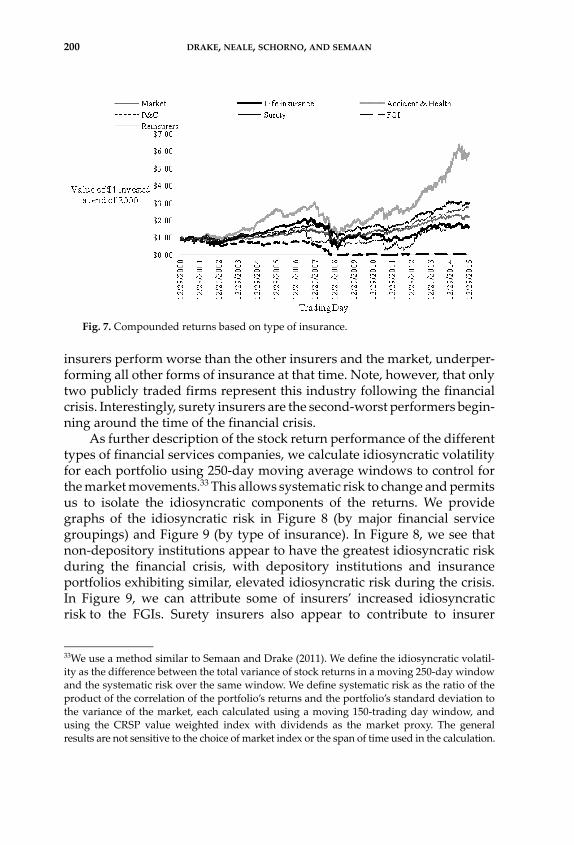
We provide a graphical representation of the monthly returns for eachportfolio in Figures 6 and 7, providing the value of $1 invested in eachportfolio at the beginning of 2001. In Figure 6, we graph the value of $1 forthe three primary industries and the overall market; in Figure 7, we graphthe portfolios based on the insurance sub‐industries.
We observe that the compounded returns of these portfolios in Figure6 diverge around 2004, leading up to the financial crisis, converge duringthe peak of the crisis, and then diverge following the crisis. Prior to thefinancial crisis, depository institutions outperformed the other compo‐nents of the financial services sector, but both depository and non‐depos‐itory institutions underperformed both the market and insurers followingthe financial crisis.
The insurance industry returns, shown in Figure 7, are like those of thegeneral market. Within the insurance industry, the A&H insurers are mostvolatile, outperforming the other lines of insurance. Financial guarantee
Interval Beginning date Ending date Description
1 January 1, 2001 February 26, 2007 Pre‐crisis
2 February 27, 2007 June 30, 2009 Crisis
3 July 1, 2009 December 31, 2015 Post‐crisis
Fig. 6. Compounded monthly returns for financial services portfolios.
200 DRAKE, NEALE, SCHORNO, AND SEMAAN
insurers perform worse than the other insurers and the market, underper‐forming all other forms of insurance at that time. Note, however, that onlytwo publicly traded firms represent this industry following the financialcrisis. Interestingly, surety insurers are the second‐worst performers begin‐ning around the time of the financial crisis.
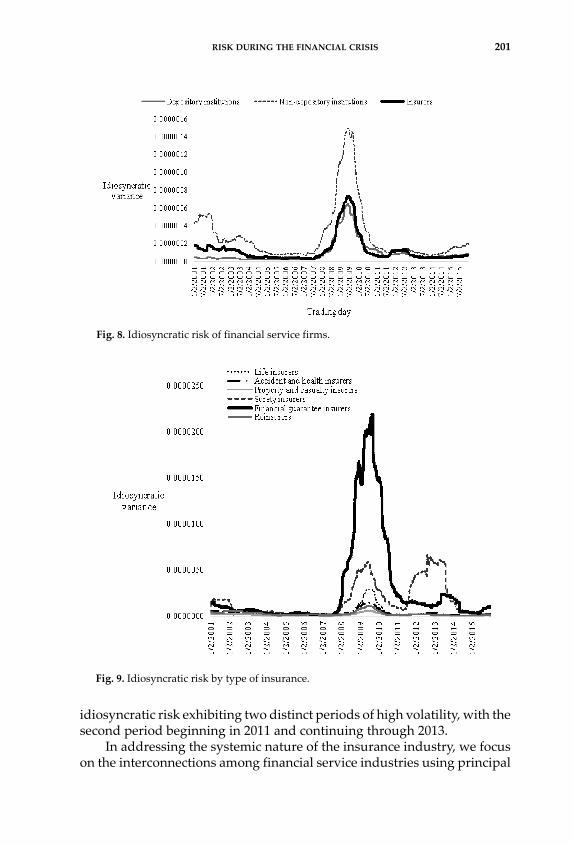
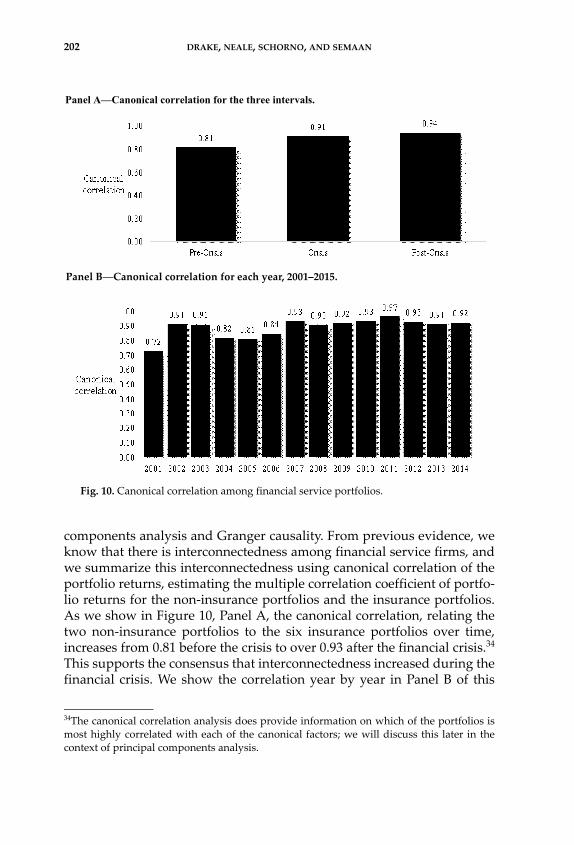
As further description of the stock return performance of the differenttypes of financial services companies, we calculate idiosyncratic volatilityfor each portfolio using 250‐day moving average windows to control forthe market movements.33 This allows systematic risk to change and permitsus to isolate the idiosyncratic components of the returns. We providegraphs of the idiosyncratic risk in Figure 8 (by major financial servicegroupings) and Figure 9 (by type of insurance). In Figure 8, we see thatnon‐depository institutions appear to have the greatest idiosyncratic riskduring the financial crisis, with depository institutions and insuranceportfolios exhibiting similar, elevated idiosyncratic risk during the crisis.In Figure 9, we can attribute some of insurers’ increased idiosyncraticrisk to the FGIs. Surety insurers also appear to contribute to insurer
33We use a method similar to Semaan and Drake (2011). We define the idiosyncratic volatil‐ity as the difference between the total variance of stock returns in a moving 250‐day windowand the systematic risk over the same window. We define systematic risk as the ratio of theproduct of the correlation of the portfolio’s returns and the portfolio’s standard deviation tothe variance of the market, each calculated using a moving 150‐trading day window, andusing the CRSP value weighted index with dividends as the market proxy. The generalresults are not sensitive to the choice of market index or the span of time used in the calculation.
Fig. 7. Compounded returns based on type of insurance.
RISK DURING THE FINANCIAL CRISIS 201
idiosyncratic risk exhibiting two distinct periods of high volatility, with thesecond period beginning in 2011 and continuing through 2013.
In addressing the systemic nature of the insurance industry, we focuson the interconnections among financial service industries using principal
Fig. 8. Idiosyncratic risk of financial service firms.
Fig. 9. Idiosyncratic risk by type of insurance.
202 DRAKE, NEALE, SCHORNO, AND SEMAAN
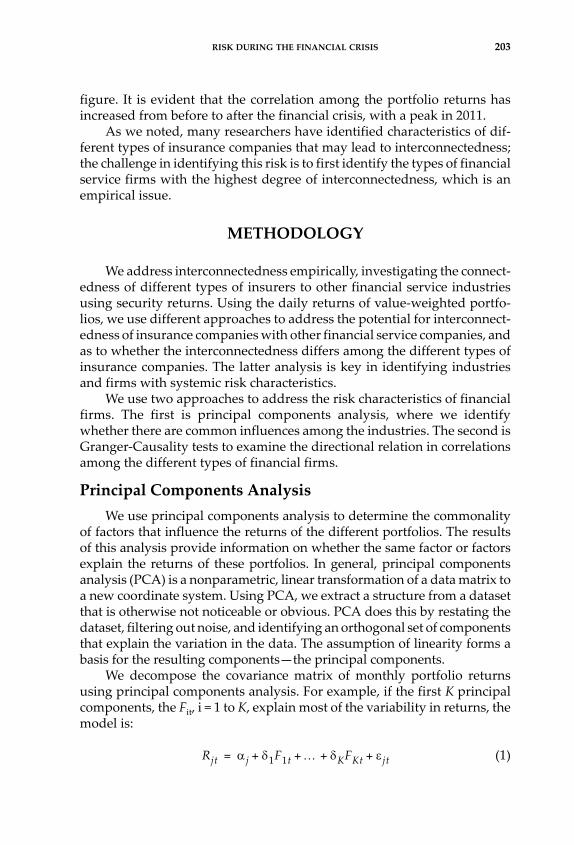
components analysis and Granger causality. From previous evidence, weknow that there is interconnectedness among financial service firms, andwe summarize this interconnectedness using canonical correlation of theportfolio returns, estimating the multiple correlation coefficient of portfo‐lio returns for the non‐insurance portfolios and the insurance portfolios.As we show in Figure 10, Panel A, the canonical correlation, relating thetwo non‐insurance portfolios to the six insurance portfolios over time,increases from 0.81 before the crisis to over 0.93 after the financial crisis.34
This supports the consensus that interconnectedness increased during thefinancial crisis. We show the correlation year by year in Panel B of this
34The canonical correlation analysis does provide information on which of the portfolios ismost highly correlated with each of the canonical factors; we will discuss this later in thecontext of principal components analysis.
Panel A—Canonical correlation for the three intervals.
Panel B—Canonical correlation for each year, 2001–2015.
Fig. 10. Canonical correlation among financial service portfolios.
RISK DURING THE FINANCIAL CRISIS 203
figure. It is evident that the correlation among the portfolio returns hasincreased from before to after the financial crisis, with a peak in 2011.
As we noted, many researchers have identified characteristics of dif‐ferent types of insurance companies that may lead to interconnectedness;the challenge in identifying this risk is to first identify the types of financialservice firms with the highest degree of interconnectedness, which is anempirical issue.
METHODOLOGY
We address interconnectedness empirically, investigating the connect‐edness of different types of insurers to other financial service industriesusing security returns. Using the daily returns of value‐weighted portfo‐lios, we use different approaches to address the potential for interconnect‐edness of insurance companies with other financial service companies, andas to whether the interconnectedness differs among the different types ofinsurance companies. The latter analysis is key in identifying industriesand firms with systemic risk characteristics.
We use two approaches to address the risk characteristics of financialfirms. The first is principal components analysis, where we identifywhether there are common influences among the industries. The second isGranger‐Causality tests to examine the directional relation in correlationsamong the different types of financial firms.
Principal Components Analysis
We use principal components analysis to determine the commonalityof factors that influence the returns of the different portfolios. The resultsof this analysis provide information on whether the same factor or factorsexplain the returns of these portfolios. In general, principal componentsanalysis (PCA) is a nonparametric, linear transformation of a data matrix toa new coordinate system. Using PCA, we extract a structure from a datasetthat is otherwise not noticeable or obvious. PCA does this by restating thedataset, filtering out noise, and identifying an orthogonal set of componentsthat explain the variation in the data. The assumption of linearity forms abasis for the resulting components—the principal components.
We decompose the covariance matrix of monthly portfolio returnsusing principal components analysis. For example, if the first K principalcomponents, the Fit, i = 1 to K, explain most of the variability in returns, themodel is:
(1)Rjt j 1F1t KFKt jt+ + + +=
204 DRAKE, NEALE, SCHORNO, AND SEMAAN
where for any . Using matrices, the covariance matrix Σof the vector of returns is:
, (2)
where the diagonal elements of , through , are the eigenvalues,and Q is the matrix of eigenvectors.35 An eigenvector is a vector thatsatisfies equation (2), and there may be any number of eigenvectors, thougheach will explain a different proportion of the variation in returns.
The first principal component (PCA1) is the direction in which thegreatest variance lies. The second component (PCA2) is the direction inwhich the next largest variance lies, and so on. The number of componentsdepends on the data, but, theoretically, there are as many components asthere are input variables. However, there are stopping rules that we mayapply based on the percentage of total variation explained by components.
From the principal components analysis, we determine:(1) How the returns of each type of financial service firm relate to the
unspecified, yet orthogonal, principal components; and(2) The proportion of the variation in returns explained by each
successively important principal component.
Granger‐Causality Tests
We apply linear and non‐linear Granger causality tests to investigatethe possibility of a lead‐lag relationship interpreted as contributing tosystemic risk. We test for causality using six lags.36 Representing the seriesof daily portfolio returns as X and Y, the linear inter‐relationships are:
(3)
(4)
where and are uncorrelated white noise processes, arecoefficients in the model, and m and n are the number of lags which
35If the return equation holds, it can be shown that as the size of the cross section, N,increases without bound, exactly K normalized eigenvalues of the covariance matrixapproach positive finite values in the limit (it is the case that the remaining eigenvaluesapproach 0). 36The results are not sensitive to the number of lags beyond two.
E jtjt 0= j j
Var Rt QQ= 1 0
0 N
=..
.
..
.
1 N
Xt j 1=m ajXt j– j 1=
n bjYt j– t+ +=
Yt j 1=m cjXt j– j 1=
n dYt j– t+ +=
t t aj bj cj dj,,,
RISK DURING THE FINANCIAL CRISIS 205
minimize the Bayesian Information Criterion (BIC). If Y does not cause X,then b1 = b2 = … = bn= 0; if X does not Granger‐cause Y, the cj will be zero.
The test of causality is based on the Chi‐square test of the null hypoth‐esis that the coefficients bj or cj are equal to zero. We estimate equations (3)and (4) and calculate the Chi‐square test statistic with X as the set offinancial institution portfolios and Y for the set of insurance portfolios, andthen repeat this using only a specific insurance type portfolio for Y. If wereject the null hypothesis of the bj = 0, we are concluding that X is betterpredicted by both Y and X than by X alone. For example, when testingbanks’ returns as the Y and insurance companies’ returns as the X, arejection of the null hypothesis indicates that banks’ returns are betterpredicted with both bank and insurance companies’ returns, compared tobanks’ returns alone. On the other hand, if we fail to reject the nullhypothesis, we are concluding that the returns of the type of institutionthat we designate as X do not explain the returns of the institution that wedesignate as Y.
RESULTS
Principal Component Analysis
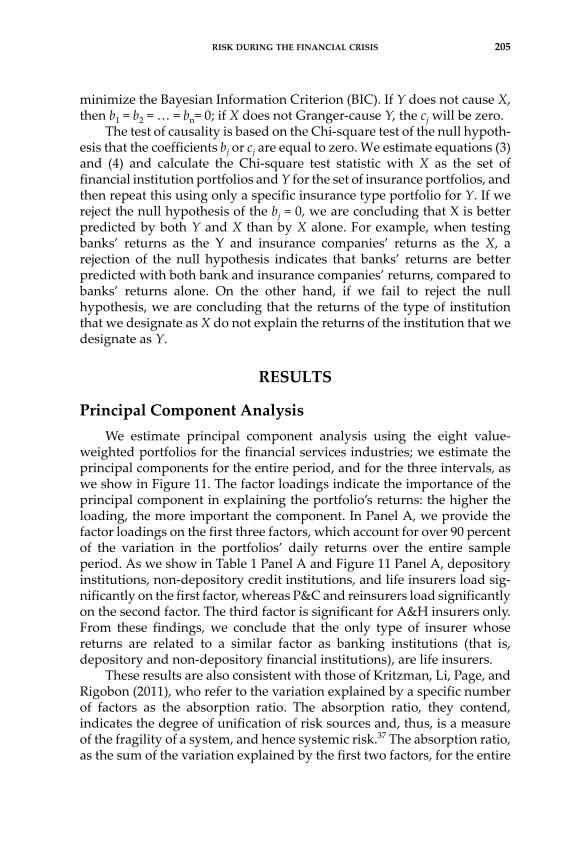
We estimate principal component analysis using the eight value‐weighted portfolios for the financial services industries; we estimate theprincipal components for the entire period, and for the three intervals, aswe show in Figure 11. The factor loadings indicate the importance of theprincipal component in explaining the portfolio’s returns: the higher theloading, the more important the component. In Panel A, we provide thefactor loadings on the first three factors, which account for over 90 percentof the variation in the portfolios’ daily returns over the entire sampleperiod. As we show in Table 1 Panel A and Figure 11 Panel A, depositoryinstitutions, non‐depository credit institutions, and life insurers load sig‐nificantly on the first factor, whereas P&C and reinsurers load significantlyon the second factor. The third factor is significant for A&H insurers only.From these findings, we conclude that the only type of insurer whosereturns are related to a similar factor as banking institutions (that is,depository and non‐depository financial institutions), are life insurers.
These results are also consistent with those of Kritzman, Li, Page, andRigobon (2011), who refer to the variation explained by a specific numberof factors as the absorption ratio. The absorption ratio, they contend,indicates the degree of unification of risk sources and, thus, is a measureof the fragility of a system, and hence systemic risk.37 The absorption ratio,as the sum of the variation explained by the first two factors, for the entire
206 DRAKE, NEALE, SCHORNO, AND SEMAAN
37Specifically, Kritzman et al. (2011) define the absorption ratio as “the fraction of the totalvariance of a set of assets explained or absorbed by a finite set of eigenvectors.” Theyexplain that a high absorption ratio indicates more unified risks and, therefore, a higherdegree of systemic risk because shocks can quickly spread.
Panel A—Factor loadings for the financial services industries for first three principalcomponents: entire period
Panel B—Factor loadings for the financial services by industry for first principal compo‐nent: by interval
Fig. 11. Factor loadings for the financial services sector.
RISK DURING THE FINANCIAL CRISIS 207
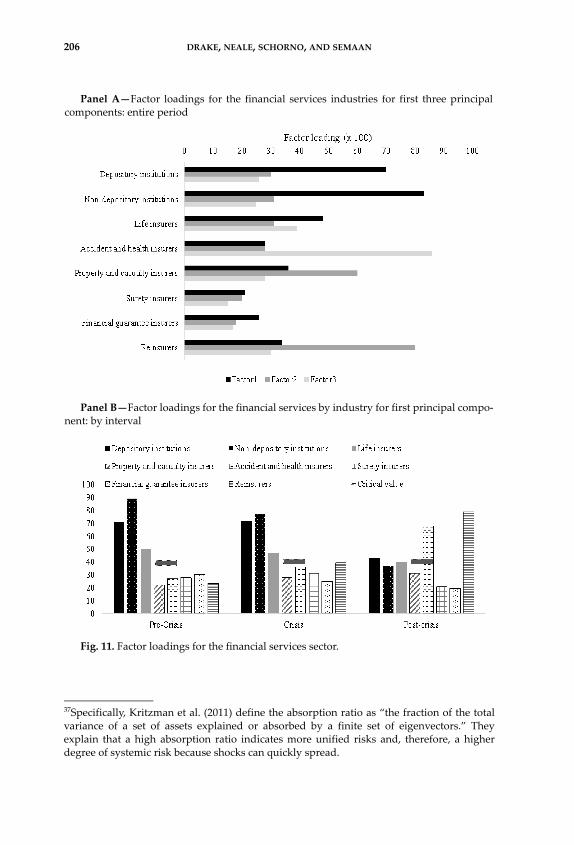
sample period for the financial services industries for our study is 79percent, but as we show in Table 1, Panel B, this ranges from 74 percentPre‐crisis to 84 percent during the crisis. Similarly Billio et al. (2012) observecorrelations among returns of securities increase in periods of market stress.
We show the factor loadings for the first factor broken down by periodin Panel B of Figure 11. The significant loading on the first factor that isapparent in the pre‐crisis and crisis periods is not significant during the
Table 1. Factor Loadings for Financial Services Portfolios
PANEL A—FACTOR LOADINGS BY PORTFOLIO AND FACTOR: ENTIRE PERIODRotated factor loadings for the first three factors estimated using the daily returns of the eight portfolios
Factor loadings (x 100)
Financial service industry Factor 1 Factor 2 Factor 3
Depository institutions 70* 30 26
Non‐depository institutions 83* 31 25
Life insurers 48* 31 39
Accident and health insurers 28 28 86*
Property and casualty insurers 36 60* 28
Surety insurers 21 20 15
Financial guarantee insurers 26 18 17
Reinsurers 34 80* 30
*Indicates statistically significant at the 5 percent level.
PANEL B—ABSORPTION RATIOS BY PERIODThe one‐factor and two‐factor absorption ratios for the principal components analysis using the daily returns of eight portfolios.
Time frameAbsorption ratio:
First component
Absorption ratio: First two
components
Entire period 71% 79%
Pre‐crisis 67% 74%
Crisis 77% 84%
Post‐crisis 72% 80%
Note: We decompose the covariance martrix of monthly portfolio returns using principalcomponents analysis and estimate the factor loadings on each of the financial serviceindustries. We show the factor loadings over the entire period of study, and then focuson the explanatory power of the components by time frame. The absorption ratio isthe percentage of the total variance of the returns explained by the component orcomponents.
208 DRAKE, NEALE, SCHORNO, AND SEMAAN
post‐crisis period. Over the entire period of study, the returns of depositoryand non‐depository institutions and life insurers are driven by the samefactor; however, with closer inspection, this single‐factor driver is notapparent post‐crisis. We conclude that viewing the entire time periodprovides a different picture of interconnectedness than for periods withinthat span. Similarly, examining the insurance industry as a whole, notaccounting for differences in risk exposures arising from diverse under‐writing portfolios by insurance industry, also provides incompleteinformation.
Granger‐Causality
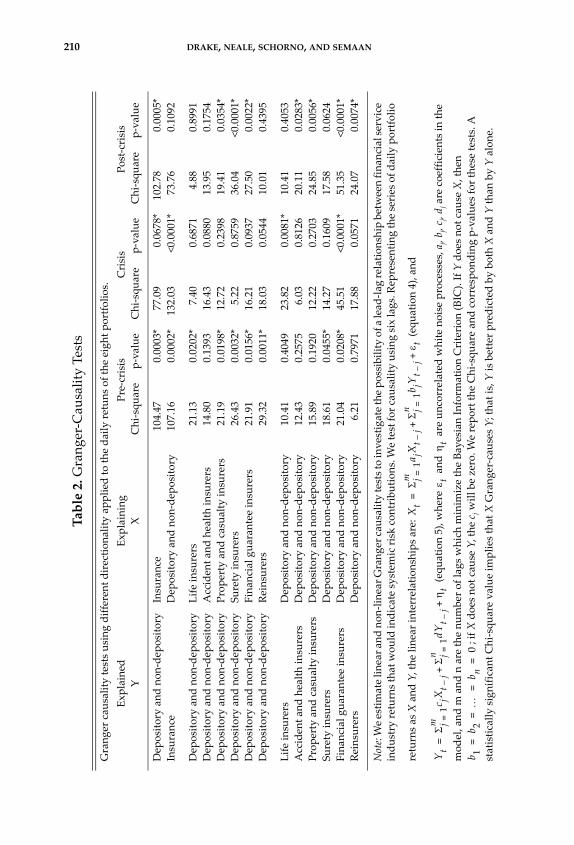
We test for the explanation of portfolio returns using other portfolioreturns and six lagged returns for each set of portfolios. We estimate therelations for each of the three intervals. We test the following two sets ofvariables, labeled Set 1 (banking) and Set 2 (insurance):
In the first round of tests, we examine if banking portfolios explain orGranger‐cause insurer portfolio returns, and if insurer portfolio returnsexplain bank portfolio returns. In the second round of tests, we studyspecific insurer portfolio returns’ effect on the variation of banking portfo‐lio returns. For example, we test whether the returns of the life insuranceportfolio Granger‐cause or explain the returns of the banking portfolio. Werepeat this second round for each insurance portfolio individually. Ourgoal is to examine and test whether the returns on specific types ofinsurance companies influence banking returns.
In the third round of tests, we look at whether banking portfolioreturns explain the individual insurer portfolio returns. For example, wetest whether the returns on the portfolios of financial institutions, deposi‐tory institutions, and non‐depository institutions affect returns on theportfolio of life insurance companies, and vice versa. Our goal is to examineand test whether the returns on banking securities explain the returns onindividual insurance portfolios.
Banking portfolios Insurer portfolios
Depository institutionNon‐depository credit institutions
Life insurersAccident and health insurersProperty and casualty insurersSurety insurersFinancial guarantee insurersReinsurers
RISK DURING THE FINANCIAL CRISIS 209
We present the results of our tests in Table 2. In the first round of tests,the returns on insurer and banking portfolios appear interconnected, withsignificant interconnectedness in both directions before and during thecrisis. Post‐crisis, however, the directionality is significant only in the caseof insurance returns influencing banking returns. These results providesupport for Billio et al. (2012) and Acharya et al. (2010), who find firms inthe financial industry are interconnected with insurers being one possibleorigin of systemic risk.
When we analyze the relationships in the second and third rounds, wesee a different picture. Regarding insurer returns influencing bankingreturns, we see significant influence before the crisis, except for A&Hinsurers. During the crisis, no evidence is found of insurer returns influ‐encing banking returns, and post‐crisis this influence is limited to P&Cinsurers, surety insurers, and FGIs. The findings with respect to the P&Cinsurers may be due to feedback influence from their connection to rein‐surers. The factors behind FGIs’ influence over banking returns remainsthe same. FGIs write long‐term products and assets “wrapped” years agothat are still maturing. The remaining FGIs continue to underwrite busi‐ness. Banks and surety insurers are highly correlated. Banks will not makeloans for certain projects unless the project provided is bonded by a suretyinsurer; therefore, it is reasonable that surety insurers influence bankingreturns in times other than a recession. Both banks and surety insurers aresignificantly correlated with the economy. If the economy does well, lend‐ing and building projects requiring surety bonds increase. P&C insurersalso depend on a healthy economy. The better the economy, the moreinsurance is needed. For example, in personal lines such as automobile andhomeowners’, coverage is mandated by the states or banks when makingloans.
Examining the results of the influence of banking returns on insurerreturns, we see some influence before, during, and after the crisis. Before,during, and after the crisis, we see that banking returns influence FGIreturns. This finding is in line with intuition, given the minimal number ofcompanies that drove the returns of the entire FGI industry and theirinterrelation with the financial services industry. In addition, we find thatbanking returns influence surety insurers pre‐crisis and life insurers dur‐ing the crisis. The influence on surety insurers pre‐crisis aligns with theincrease in idiosyncratic risk for these insurers during the technologybubble of the early 2000s. The influence on life insurers during the crisismay be due to the increased market risk and interest rate risk in theeconomic downturn. Post‐crisis, we see that the returns for A&H, P&C, FGIinsurers, and reinsurers are affected by banking returns, but there is nolonger an influence on life insurers. The bottom line of this analysis is that
210 DRAKE, NEALE, SCHORNO, AND SEMAAN
Table 2. G
ranger‐Cau
sality Tests
Granger cau
sality tests using different directionality applied to the daily retuns of the eight portfolios.
Explained
Explaining
Pre‐crisis
Crisis
Post‐crisis
YX
Chi‐square
p‐value
Chi‐square
p‐value
Chi‐square
p‐value
Dep
ository and non‐dep
ository
Insurance
104.47
0.0003*
77.09
0.0678*
102.78
0.0005*
Insurance
Dep
ository and non‐dep
ository
107.16
0.0002*
132.03
<0.0001*
73.76
0.1092
Dep
ository and non‐dep
ository
Life insurers
21.13
0.0202*
7.40
0.6871
4.88
0.8991
Dep
ository and non‐dep
ository
Accident an
d health insurers
14.80
0.1393
16.43
0.0880
13.95
0.1754
Dep
ository and non‐dep
ository
Property and casualty insurers
21.19
0.0198*
12.72
0.2398
19.41
0.0354*
Dep
ository and non‐dep
ository
Surety insurers
26.43
0.0032*
5.22
0.8759
36.04
<0.0001*
Dep
ository and non‐dep
ository
Finan
cial guaran
tee insurers
21.91
0.0156*
16.21
0.0937
27.50
0.0022*
Dep
ository and non‐dep
ository
Reinsurers
29.32
0.0011*
18.03
0.0544
10.01
0.4395
Life insurers
Dep
ository and non‐dep
ository
10.41
0.4049
23.82
0.0081*
10.41
0.4053
Accident an
d health insurers
Dep
ository and non‐dep
ository
12.43
0.2575
6.03
0.8126
20.11
0.0283*
Property and casualty insurers
Dep
ository and non‐dep
ository
15.89
0.1920
12.22
0.2703
24.85
0.0056*
Surety insurers
Dep
ository and non‐dep
ository
18.61
0.0455*
14.27
0.1609
17.58
0.0624
Finan
cial guaran
tee insurers
Dep
ository and non‐dep
ository
21.04
0.0208*
45.51
<0.0001*
51.35
<0.0001*
Reinsurers
Dep
ository and non‐dep
ository
6.21
0.7971
17.88
0.0571
24.07
0.0074*
Note: W
e estimate linear an
d non‐linear Granger cau
sality tests to investigate the possibility of a lead‐lag relationship between finan
cial service
industry returns that would indicate system
ic risk contributions. W
e test for causality using six lags. Rep
resenting the series of daily portfolio
returns as X and Y, the linear interrelationships are:
(equation 4), and
(equation 5), w
here
and
are uncorrelated w
hite noise processes, aj, b j, cj, d j are coefficients in the
model, and m and n are the number of lags which m
inim
ize the Bayesian Inform
ation Criterion (BIC). If Y does not cause X, then
; if X does not cause Y, the c j w
ill be zero. W
e report the Chi‐square an
d corresponding p‐values for these tests. A
statistically significan
t Chi‐square value im
plies that X Granger‐cau
ses Y; that is, Y is better predicted by both X and Y than by Y alone.
Xt
j
1=m
a jXt
j–
j
1=n
b jYt
j–
t+
+=
Yt
j
1=m
c jXt
j–
j
1=n
dYt
j–
t
++
= t
t
b 1b 2
b n
0=
==
=
RISK DURING THE FINANCIAL CRISIS 211
while insurer returns influence bank returns, the type of insurer influenc‐ing bank returns has changed over time.
CONCLUDING REMARKS
Consistent with other studies, we find that there is connectedness ofequity returns between and among industries within the financial sector.We support the idea that there is substantial feedback from banking firmsto insurance firms, and substantial feedback from insurance firms to bank‐ing. The results for life insurers are mixed with life insurers explaining bankreturns only in the pre‐crisis time period. We do find consistent supportacross all time periods that A&H insurers are not significantly intercon‐nected with other financial segments.
However, we find that the primary drivers of the feedback betweeninsurance firms to banking post‐crisis appear to be from property andcasualty, financial guarantee, and surety insurers. Using SRISK we findfinancial guarantee firms, which experienced a high risk of capital shortfallduring the crisis, have levels of SRISK suggesting little capital shortfall riskby 2016.
It is important to note that the primary insurance industries affectingbanking appear to change over time. The finding that P&C insurersGranger‐cause bank returns before and after the crisis, but not during thecrisis, is unexpected. However, this result is understandable consideringthat P&C insurers provide coverage for catastrophic events—several of theworst catastrophic losses in the U.S. occurred during the study period—and the related wealth effects of these events.38 It is likely these results aredriven, at least in part, by these unpredictable, catastrophic events uniqueto the P&C industry. On the other hand, we show life insurers’ underwrit‐ing portfolios consist of highly predictable exposures of long duration,resulting in investment portfolios and allocations similar to commercialbanks. We conclude that life insurers are exposed to similar risks as banksthrough investments and some of their securities products, such as securi‐ties lending, as well as asset management services. P&C insurers and
38The period of November 1999 to late February 2007 included five of the top‐ten costliestcatastrophes (CAT) in the U.S.: the 9/11 terrorist attack and Hurricanes Charley, Ivan,Katrina, and Wilma. Hurricane Rita also occurred during the same time as Katrina andWilma, aggravating conditions. The subsequent relatively short crisis period included Hur‐ricane Ike, the 6th mostly costly CAT. The post‐crisis period includes two of the ten costliestCATs: Hurricane Sandy and the storms of April 2011 that included flooding, hail, wind, andtornadoes that devastated Tuscaloosa, AL. Statistics obtained from URL: www.iii.org/fact‐statistic/hurricanes.
212 DRAKE, NEALE, SCHORNO, AND SEMAAN
reinsurers’ underwriting profiles and investment allocations are differentfrom those of life insurers and commercial banks.
Our results provide insight into the conditions under which eachinsurance segment may affect commercial banks. Interestingly, the rela‐tively new measure, SRISK, does appear to adequately reflect most of ourfindings during our study period. For example, the FGIs’ increased riskand influence on capital markets during the crisis is illuminated, whileA&H insurers are never a concern. Similarly, AIG’s operations are signifi‐cantly different post‐crisis and that structural change is reflected as well.39
SRISK may be a useful tool when identifying firms to evaluate or re‐evaluate the SIFI designation.
A primary contribution of this study is that we show that interconnect‐edness varies by type of insurance company, with one type, A&H insurers,showing no interconnectedness and others showing substantial intercon‐nectedness at times. Another contribution is our finding that time periodswith different market conditions have a significant impact, providingimportant implications for regulators. Specifically, three industries—P&C,Surety, and FGI—Granger‐caused bank returns pre‐ and post‐crisis. Ourexpanded time period adds important information on interconnectednesspost‐crisis not available from earlier studies published relatively soon afterthe financial crisis. Using principal components and Granger‐causalitytests we show that insurers specializing in different types of risks experi‐ence diverse reactions to risk and return in each market period, while non‐insurance, risk‐bearing financial firms’ reactions are similar to each other.Further, we find that post‐crisis, P&C and FGI stock returns have bi‐directional feedback with banks’ returns post‐crisis, whereas the returnsof life insurers and banks no longer Granger‐cause each other. However,SRISK indicates that, as of mid‐2016, life insurers have the highest systemicrisk, followed by property and casualty insurers.
REFERENCES
Acharya, V. V., L. H. Pedersen, T. Philippon, and M. Richardson (2010) “MeasuringSystemic Risk,” Federal Reserve Bank of Cleveland, Working Paper 10‐02.
Adrian, T. and M. K. Brunnermeier (2014) “CoVaR,” National Bureau of EconomicResearch, Working Paper 17454.
Baluch, F., S. Mutenga, and C. Parsons (2011) “Insurance, Systemic Risk and theFinancial Crisis,” The Geneva Papers on Risk and Insurance—Issues and Prac‐tice 36(1): 126–163.
39We recognize that in the case of AIG, SRISK would not have raised concern prior to thefinancial crisis with the exception of the spike in 2004.
RISK DURING THE FINANCIAL CRISIS 213
Baranoff, E. (2012) “Streams of Thoughts on the IAIS Proposed Methodologyfor Designating Systemically Important Insurers,” Insurance and FinanceNewsletter, The Geneva Association, Issue 10, accessed on August 26, 2012 fromwww.genevaassociation.org/PDF/Insurance_And_Finance/GA2012‐I&F10.pdf.
Bernal, O., J. Grabo, and G. Guilman (2014) “Assessing the Contributions of Banks,Insurers and Other Financial Services to Systemic Risk,” Journal of Banking &Finance 47: 270–287.
Berry‐Stölzle, T. R., G. P. Nini, and S. Wende (2014) “External Financing in the LifeInsurance Industry: Evidence from the Financial Crisis,” Journal of Risk andInsurance 81(3): 529–562.
Billio, M., M. Getmansky, A. W. Lo, and L. Pelizzon (2012) “Econometric Measuresof Connectedness and Systemic Risk in the Finance and Insurance Sectors,” Jour‐nal of Financial Economics 104(3): 535–559.
Brownlees, C. and R. F. Engle (2016) “SRISK: A Conditional Capital ShortfallMeasure of Systemic Risk,” The Review of Financial Studies 30(1): 48–79.
Chen, H., J. D. Cummins, K. S. Viswanathan, and M. A. Weiss (2014) “Systemic Riskand the Interconnectedness Between Banks and Insurers: An Econometric Anal‐ysis,” Journal of Risk and Insurance 81(3): 623–652.
Cummins, J. D. and M. A. Weiss (2014) “Systemic Risk and the US InsuranceSector,” Journal of Risk and Insurance 81(3): 489–528.
Drake, P. P. and F. R. Neale (2011) “Financial Guarantee Insurance and the Failuresof Risk Management,” Journal of Insurance Regulation 30: 29–76.
Elyasiani, E., S. K. Staikouras, and P. Dontis‐Charitos (2016) “Cross‐Industry Prod‐uct Diversification and Contagion in Risk and Return: The Case of Bank‐Insurance and Insurance‐Bank Takeovers,” Journal of Risk and Insurance 83(3):681–718.
Financial Crisis Inquiry Commission (2011) The Financial Crisis Inquiry Report,accessed on August 3, 2017 from https://www.gpo.gov/fdsys/pkg/GPO‐FCIC/pdf/GPO‐FCIC.pdf.
Financial Stability Board (2009) “Guidance to Assess the Systemic Importance ofFinancial Institutions, Markets and Instruments, Initial Considerations,” reportto the G‐20 Finance Ministers and Central Bank Governors (Basel, Switzerland),October, accessed on August 4, 2017 from http://www.fsb.org/wp‐content/uploads/r_091107c.pdf.
Geneva Association, Group of Ten (2001) Report on Consolidation of the FinancialSector, Basel, Switzerland, Bank for International Settlements, accessed onAugust 6, 2017 from https://www.federalreserve.gov/boarddocs/speeches/2001/20010125/attachment2.pdf.
Graham, L. and X. Xie (2007) “The United States Insurance Market: Characteristicsand Trends,” in J. D. Cummins and B. Vernard, eds., Handbook of InternationalInsurance: Between Global Trends and Local Contingencies, Springer, pp. 25–145.
Group of Thirty (2006) “Reinsurance and International Financial Markets,”accessed August 5, 2017 from http://group30.org/images/uploads/publications/G30_ReinsuranceInternationalFinancialMarkets.pdf.
214 DRAKE, NEALE, SCHORNO, AND SEMAAN
Harrington, S. E. (2009) “The Financial Crisis, Systemic Risk and the Future ofInsurance Regulation,” Journal of Risk and Insurance 76(4), 785–819.
Helwege, J. (2010) “Financial Firm Bankruptcy and Systemic Risk,” Journal ofInternational Financial Markets, Institutions and Money 20(1), 1–12.
Kessler, D. (2014) “Why (Re)insurance is not Systemic,” The Journal of Risk andInsurance 81(3), 477–488.
Klein, R. W., G. Ma, E. R. Ulm, S. Wang, X. Wei, and G. Zanjani (2009) “The FinancialCrisis and Lessons for Insurers,” report for the Society of Actuaries.
Kritzman, M., Y. Li, S. Page, and R. Rigobon (2011) “Principal Components as aMeasure of Systemic Risk,” Journal of Portfolio Management 37(4), 112–126.
Kupiec, P. and L. Güntay (2016) “Testing for Systemic Risk Using StockReturns,” Journal of Financial Services Research 49(2–3), 203–227.
Mayer C., K. Pence, and S. M. Sherlund (2009) “The Rise in Mortgage Defaults,”Journal of Economic Perspectives 23(1), 27–50.
Park, S. C. and X. Xie (2014) “Reinsurance and Systemic Risk: The Impact ofReinsurer Downgrading on Property‐Casualty Insurers,” Journal of Risk andInsurance 81(3), 587–621.
Russell, D. T., S. G. Fier, J. M. Carson, and R. E. Dumm (2013) “An EmpiricalAnalysis of Life Insurance Policy Surrender Activity,” Journal of Insurance Issues36(1), 35–37.
Schwarcz, D. (2009) “Regulating Insurance Sales or Selling Insurance Regulation:Against Regulatory Competition in Insurance,” Minnesota Law Review, 94, 1707.
Schwarcz, D. and S. L. Schwarcz (2014) “Regulating Systemic Risk in Insurance,”University of Chicago Law Review 81, 1569–1640.
Schwarcz, S. L. (2008) “Systemic Risk,” Duke Law School Legal Studies Paper No.163, Georgetown Law Journal 97(1).
Scordis, N. A. and P. Steinorth (2012) “Value from Hedging Risk with Reinsurance,”Journal of Insurance Issues 35(2), 210–231.
Semaan, E. J. and P. P. Drake (2011) “Deregulation and Risk,” Financial Management40(2), 295–329.
Strahan, P. (2003) “The Real Effects of U.S. Banking Deregulation,” Review—FederalReserve Bank of Saint Louis 85(4), 111–128.
Thomson, J. B. (2009) “On Systemically Important Financial Institutions and Pro‐gressive Systemic Mitigation,” Federal Reserve Bank of Cleveland, Policy Dis‐cussion Paper Number 27 (August).