Risk Dashboards with R Shiny: a C-ROSS case study · Risk Dashboards with R Shiny: a C-ROSS case...
30
Risk Dashboards with R Shiny: a C-ROSS case study Phil Joubert, Oliver Wyman [email protected] 06 May 2015
Transcript of Risk Dashboards with R Shiny: a C-ROSS case study · Risk Dashboards with R Shiny: a C-ROSS case...

Risk Dashboards with R Shiny: a
C-ROSS case study
Phil Joubert, Oliver Wyman
06 May 2015
Colour palette for PowerPoint
presentations
Dark blue
R17 G52 B88
Gold
R217 G171 B22
Mid blue
R64 G150 B184
Secondary colour palette
Primary colour palette
Light grey
R220 G221 B217
Pea green
R121 G163 B42
Forest green
R0 G132 B82
Bottle green
R17 G179 B162
Cyan
R0 G156 B200
Light blue
R124 G179 B225
Violet
R128 G118 B207
Purple
R143 G70 B147
Fuscia
R233 G69 B140
Red
R200 G30 B69
Orange
R238 G116 29
Dark grey
R63 G69 B72
Agenda
• Setting the scene:
– What is C-ROSS?
– What is a risk dashboard?
– What is R Shiny?
• Putting it together:
– Designing the system
– Designing the dashboard
– Developing code in RStudio
• The payoff:
– What’s wrong with our current set up?
– Delivering insights (or, what’s the point of all this?)
– Summary and conclusions
• Q&A
06 May 2015 2
Setting the scene
06 May 2015
Colour palette for PowerPoint
presentations
Dark blue
R17 G52 B88
Gold
R217 G171 B22
Mid blue
R64 G150 B184
Secondary colour palette
Primary colour palette
Light grey
R220 G221 B217
Pea green
R121 G163 B42
Forest green
R0 G132 B82
Bottle green
R17 G179 B162
Cyan
R0 G156 B200
Light blue
R124 G179 B225
Violet
R128 G118 B207
Purple
R143 G70 B147
Fuscia
R233 G69 B140
Red
R200 G30 B69
Orange
R238 G116 29
Dark grey
R63 G69 B72
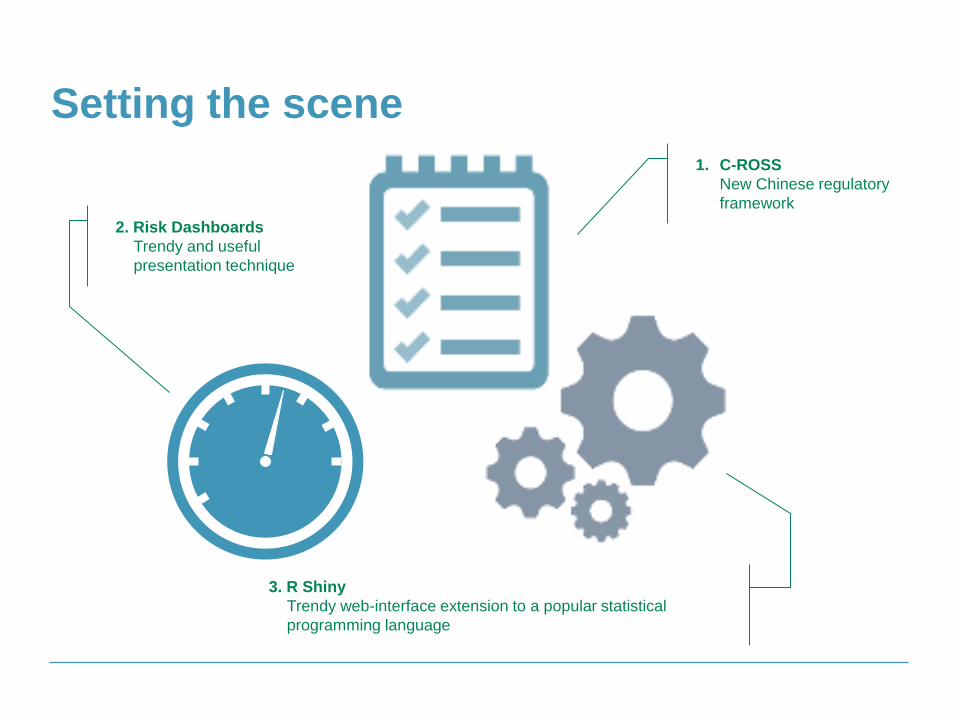
Setting the scene
2. Risk Dashboards
Trendy and useful
presentation technique
1. C-ROSS
New Chinese regulatory
framework
3. R Shiny
Trendy web-interface extension to a popular statistical
programming language
Colour palette for PowerPoint
presentations
Dark blue
R17 G52 B88
Gold
R217 G171 B22
Mid blue
R64 G150 B184
Secondary colour palette
Primary colour palette
Light grey
R220 G221 B217
Pea green
R121 G163 B42
Forest green
R0 G132 B82
Bottle green
R17 G179 B162
Cyan
R0 G156 B200
Light blue
R124 G179 B225
Violet
R128 G118 B207
Purple
R143 G70 B147
Fuscia
R233 G69 B140
Red
R200 G30 B69
Orange
R238 G116 29
Dark grey
R63 G69 B72
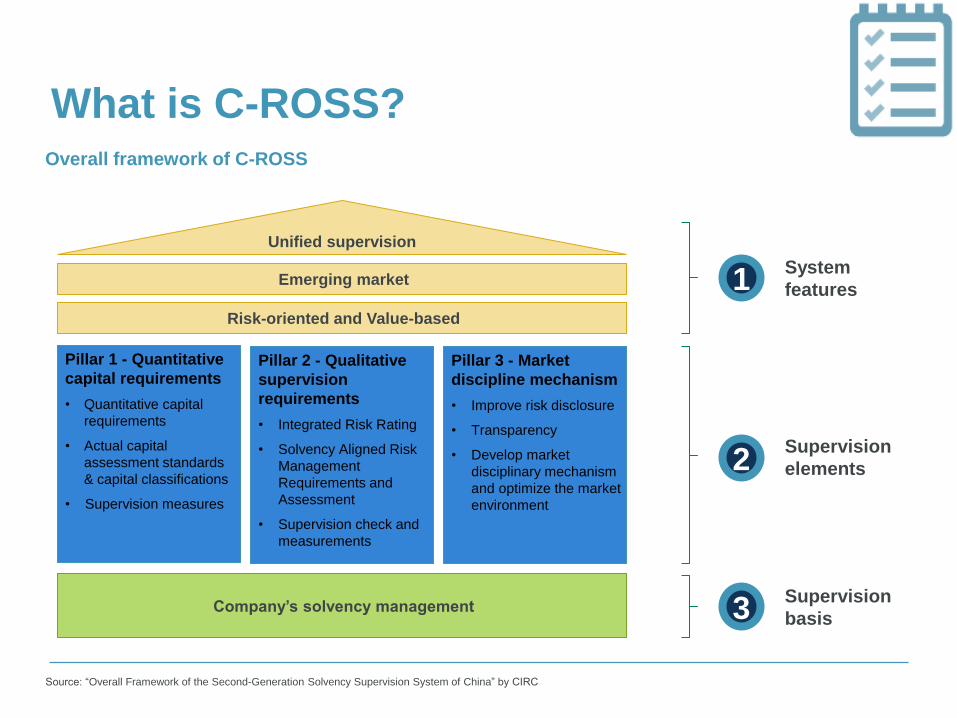
What is C-ROSS? Overall framework of C-ROSS
Source: “Overall Framework of the Second-Generation Solvency Supervision System of China” by CIRC
Emerging market
Pillar 1 - Quantitative
capital requirements
• Quantitative capital
requirements
• Actual capital
assessment standards
& capital classifications
• Supervision measures
Pillar 3 - Market
discipline mechanism
• Improve risk disclosure
• Transparency
• Develop market
disciplinary mechanism
and optimize the market
environment
Unified supervision
Pillar 2 - Qualitative
supervision
requirements
• Integrated Risk Rating
• Solvency Aligned Risk
Management
Requirements and
Assessment
• Supervision check and
measurements
Risk-oriented and Value-based
Company’s solvency management
1
2
3
System
features
Supervision
elements
Supervision
basis
Colour palette for PowerPoint
presentations
Dark blue
R17 G52 B88
Gold
R217 G171 B22
Mid blue
R64 G150 B184
Secondary colour palette
Primary colour palette
Light grey
R220 G221 B217
Pea green
R121 G163 B42
Forest green
R0 G132 B82
Bottle green
R17 G179 B162
Cyan
R0 G156 B200
Light blue
R124 G179 B225
Violet
R128 G118 B207
Purple
R143 G70 B147
Fuscia
R233 G69 B140
Red
R200 G30 B69
Orange
R238 G116 29
Dark grey
R63 G69 B72
C-ROSS: Pillar One
06 May 2015 6
Total Required
Capital
Life Non-Life
Premium &
Reserve Catastrophe
Typhoon
Earthquake
Property
Auto
…
Agricultural
Mortality &
Morbidity Surrenders Expense
Projected
Mortality
Pandemic
Mortality
…
Morbidity
Projected
Surrender
Mass
Surrender
Market Credit
Interest
Rates
Equity
…
Real Estate
Spreads
Defaults
Premium
Reserve
Premium
Reserve
Premium
Reserve
Colour palette for PowerPoint
presentations
Dark blue
R17 G52 B88
Gold
R217 G171 B22
Mid blue
R64 G150 B184
Secondary colour palette
Primary colour palette
Light grey
R220 G221 B217
Pea green
R121 G163 B42
Forest green
R0 G132 B82
Bottle green
R17 G179 B162
Cyan
R0 G156 B200
Light blue
R124 G179 B225
Violet
R128 G118 B207
Purple
R143 G70 B147
Fuscia
R233 G69 B140
Red
R200 G30 B69
Orange
R238 G116 29
Dark grey
R63 G69 B72
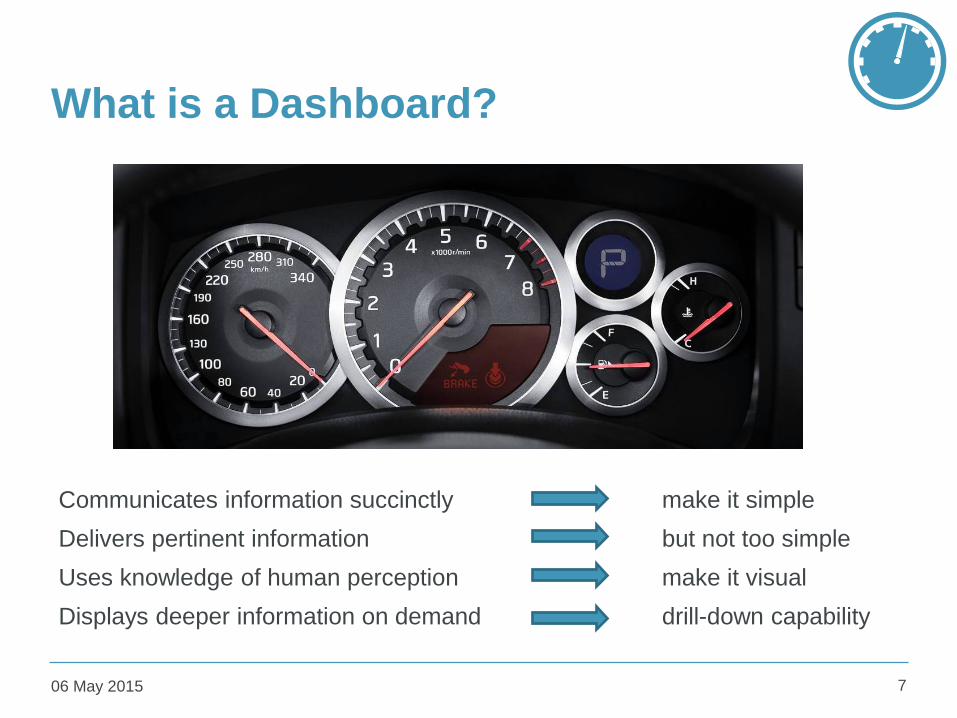
What is a Dashboard?
06 May 2015 7
Communicates information succinctly make it simple
Delivers pertinent information but not too simple
Uses knowledge of human perception make it visual
Displays deeper information on demand drill-down capability
Colour palette for PowerPoint
presentations
Dark blue
R17 G52 B88
Gold
R217 G171 B22
Mid blue
R64 G150 B184
Secondary colour palette
Primary colour palette
Light grey
R220 G221 B217
Pea green
R121 G163 B42
Forest green
R0 G132 B82
Bottle green
R17 G179 B162
Cyan
R0 G156 B200
Light blue
R124 G179 B225
Violet
R128 G118 B207
Purple
R143 G70 B147
Fuscia
R233 G69 B140
Red
R200 G30 B69
Orange
R238 G116 29
Dark grey
R63 G69 B72
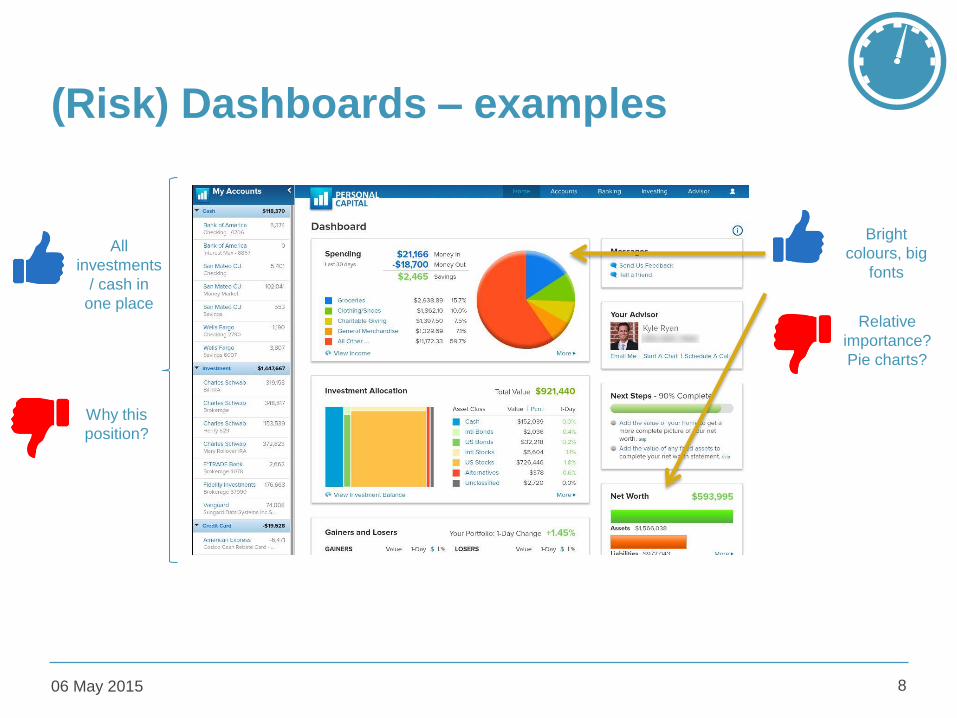
(Risk) Dashboards – examples
06 May 2015 8
All
investments
/ cash in
one place
Why this
position?
Bright
colours, big
fonts
Relative
importance?
Pie charts?
Colour palette for PowerPoint
presentations
Dark blue
R17 G52 B88
Gold
R217 G171 B22
Mid blue
R64 G150 B184
Secondary colour palette
Primary colour palette
Light grey
R220 G221 B217
Pea green
R121 G163 B42
Forest green
R0 G132 B82
Bottle green
R17 G179 B162
Cyan
R0 G156 B200
Light blue
R124 G179 B225
Violet
R128 G118 B207
Purple
R143 G70 B147
Fuscia
R233 G69 B140
Red
R200 G30 B69
Orange
R238 G116 29
Dark grey
R63 G69 B72
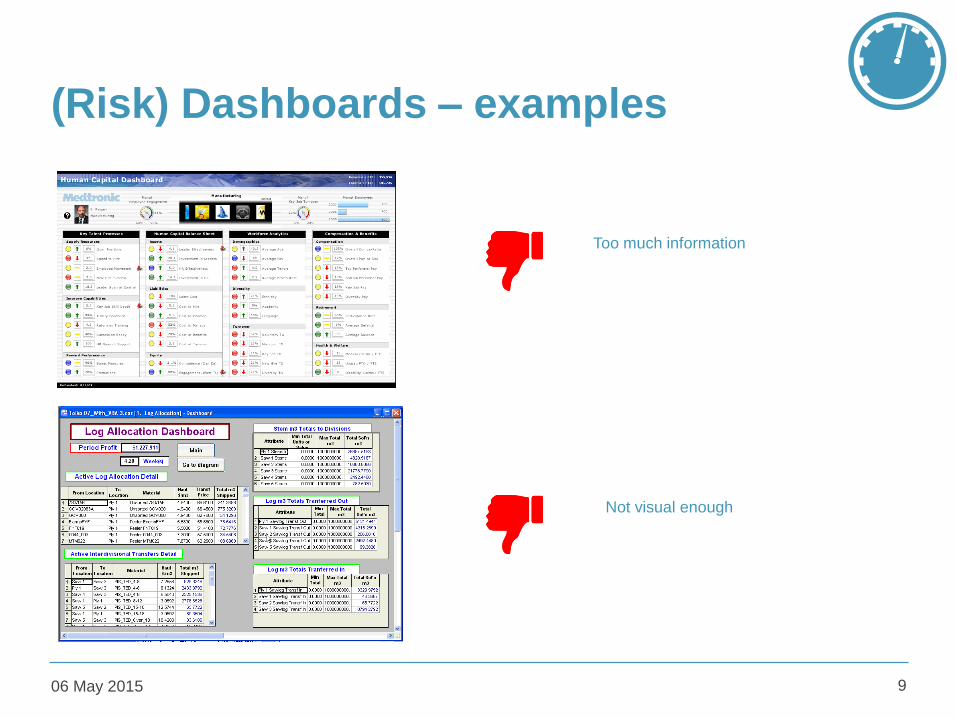
(Risk) Dashboards – examples
06 May 2015 9
Too much information
Not visual enough
Colour palette for PowerPoint
presentations
Dark blue
R17 G52 B88
Gold
R217 G171 B22
Mid blue
R64 G150 B184
Secondary colour palette
Primary colour palette
Light grey
R220 G221 B217
Pea green
R121 G163 B42
Forest green
R0 G132 B82
Bottle green
R17 G179 B162
Cyan
R0 G156 B200
Light blue
R124 G179 B225
Violet
R128 G118 B207
Purple
R143 G70 B147
Fuscia
R233 G69 B140
Red
R200 G30 B69
Orange
R238 G116 29
Dark grey
R63 G69 B72
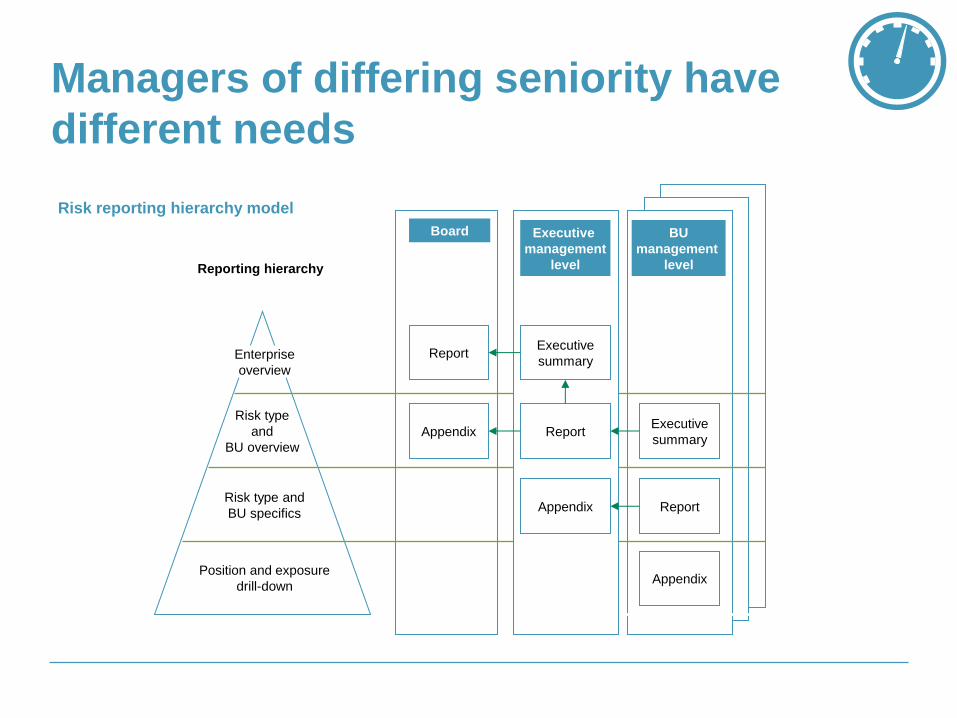
Risk type and
BU specifics
Risk type
and
BU overview
Position and exposure
drill-down
Board BU
management
level Reporting hierarchy
Report
Appendix
Executive
summary
Report
Appendix
Executive
summary
Report
Appendix
Enterprise
overview
Executive
management
level
Risk reporting hierarchy model
Managers of differing seniority have
different needs
Colour palette for PowerPoint
presentations
Dark blue
R17 G52 B88
Gold
R217 G171 B22
Mid blue
R64 G150 B184
Secondary colour palette
Primary colour palette
Light grey
R220 G221 B217
Pea green
R121 G163 B42
Forest green
R0 G132 B82
Bottle green
R17 G179 B162
Cyan
R0 G156 B200
Light blue
R124 G179 B225
Violet
R128 G118 B207
Purple
R143 G70 B147
Fuscia
R233 G69 B140
Red
R200 G30 B69
Orange
R238 G116 29
Dark grey
R63 G69 B72
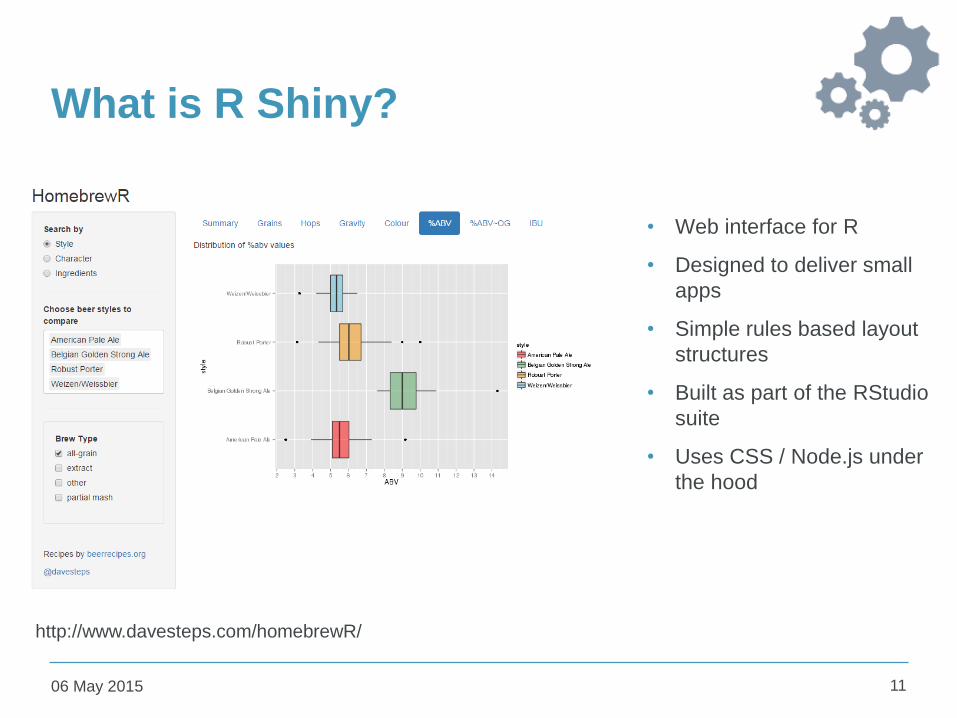
What is R Shiny?
• Web interface for R
• Designed to deliver small
apps
• Simple rules based layout
structures
• Built as part of the RStudio
suite
• Uses CSS / Node.js under
the hood
06 May 2015 11
http://www.davesteps.com/homebrewR/
Putting it together
06 May 2015
Colour palette for PowerPoint
presentations
Dark blue
R17 G52 B88
Gold
R217 G171 B22
Mid blue
R64 G150 B184
Secondary colour palette
Primary colour palette
Light grey
R220 G221 B217
Pea green
R121 G163 B42
Forest green
R0 G132 B82
Bottle green
R17 G179 B162
Cyan
R0 G156 B200
Light blue
R124 G179 B225
Violet
R128 G118 B207
Purple
R143 G70 B147
Fuscia
R233 G69 B140
Red
R200 G30 B69
Orange
R238 G116 29
Dark grey
R63 G69 B72
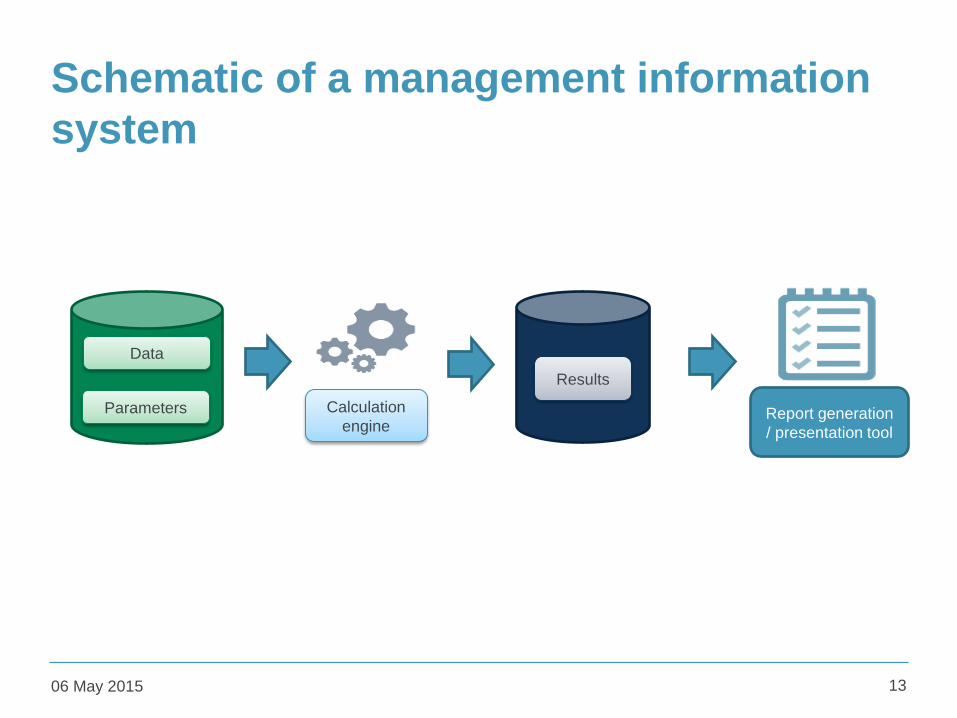
Schematic of a management information
system
06 May 2015 13
Data
Parameters
Results
Report generation
/ presentation tool
Calculation
engine
Colour palette for PowerPoint
presentations
Dark blue
R17 G52 B88
Gold
R217 G171 B22
Mid blue
R64 G150 B184
Secondary colour palette
Primary colour palette
Light grey
R220 G221 B217
Pea green
R121 G163 B42
Forest green
R0 G132 B82
Bottle green
R17 G179 B162
Cyan
R0 G156 B200
Light blue
R124 G179 B225
Violet
R128 G118 B207
Purple
R143 G70 B147
Fuscia
R233 G69 B140
Red
R200 G30 B69
Orange
R238 G116 29
Dark grey
R63 G69 B72
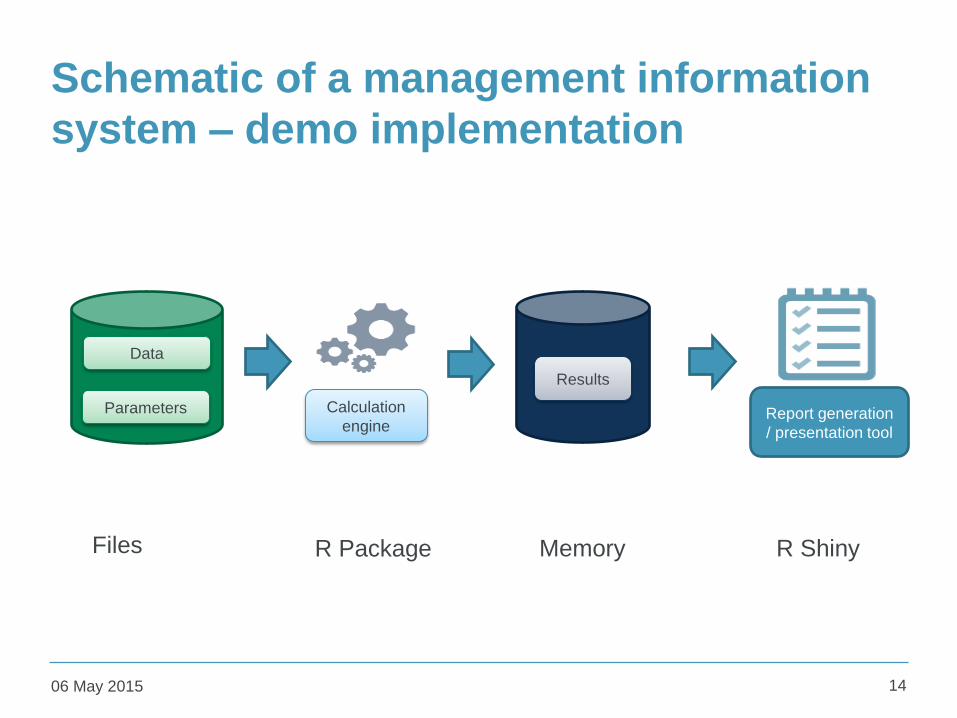
Schematic of a management information
system – demo implementation
06 May 2015 14
Data
Parameters
Results
Calculation
engine
Files R Package Memory R Shiny
Report generation
/ presentation tool

Colour palette for PowerPoint
presentations
Dark blue
R17 G52 B88
Gold
R217 G171 B22
Mid blue
R64 G150 B184
Secondary colour palette
Primary colour palette
Light grey
R220 G221 B217
Pea green
R121 G163 B42
Forest green
R0 G132 B82
Bottle green
R17 G179 B162
Cyan
R0 G156 B200
Light blue
R124 G179 B225
Violet
R128 G118 B207
Purple
R143 G70 B147
Fuscia
R233 G69 B140
Red
R200 G30 B69
Orange
R238 G116 29
Dark grey
R63 G69 B72
Designing your C-ROSS calculations
06 May 2015 15
1 ρAB ρAC ρAD
1 ρBC ρBD
1 ρCD
1
Risk A Risk B Risk C Risk D
1 … … …
1 … …
Risk X = E x RF
= E x RF0( 1 + k1 … kn)
Table lookups
Aggregation = VCV
Matrix Multiplication
• Hierarchy data structure
• Node walking
• I / O
Other required features
Colour palette for PowerPoint
presentations
Dark blue
R17 G52 B88
Gold
R217 G171 B22
Mid blue
R64 G150 B184
Secondary colour palette
Primary colour palette
Light grey
R220 G221 B217
Pea green
R121 G163 B42
Forest green
R0 G132 B82
Bottle green
R17 G179 B162
Cyan
R0 G156 B200
Light blue
R124 G179 B225
Violet
R128 G118 B207
Purple
R143 G70 B147
Fuscia
R233 G69 B140
Red
R200 G30 B69
Orange
R238 G116 29
Dark grey
R63 G69 B72
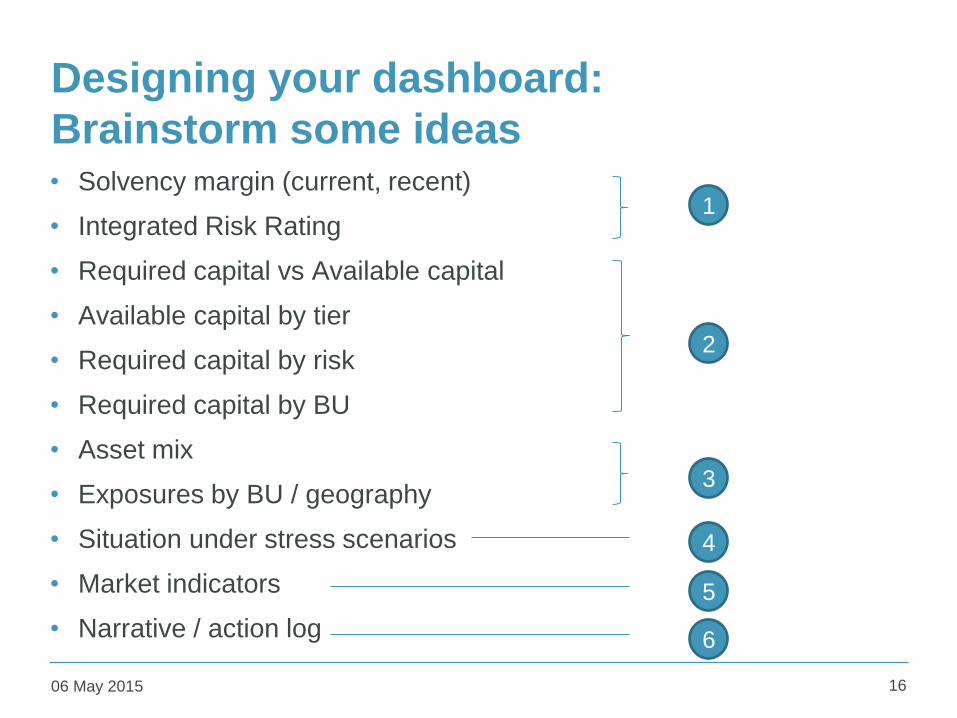
Designing your dashboard:
Brainstorm some ideas • Solvency margin (current, recent)
• Integrated Risk Rating
• Required capital vs Available capital
• Available capital by tier
• Required capital by risk
• Required capital by BU
• Asset mix
• Exposures by BU / geography
• Situation under stress scenarios
• Market indicators
• Narrative / action log
06 May 2015 16
1
2
3
4
5
6
Colour palette for PowerPoint
presentations
Dark blue
R17 G52 B88
Gold
R217 G171 B22
Mid blue
R64 G150 B184
Secondary colour palette
Primary colour palette
Light grey
R220 G221 B217
Pea green
R121 G163 B42
Forest green
R0 G132 B82
Bottle green
R17 G179 B162
Cyan
R0 G156 B200
Light blue
R124 G179 B225
Violet
R128 G118 B207
Purple
R143 G70 B147
Fuscia
R233 G69 B140
Red
R200 G30 B69
Orange
R238 G116 29
Dark grey
R63 G69 B72
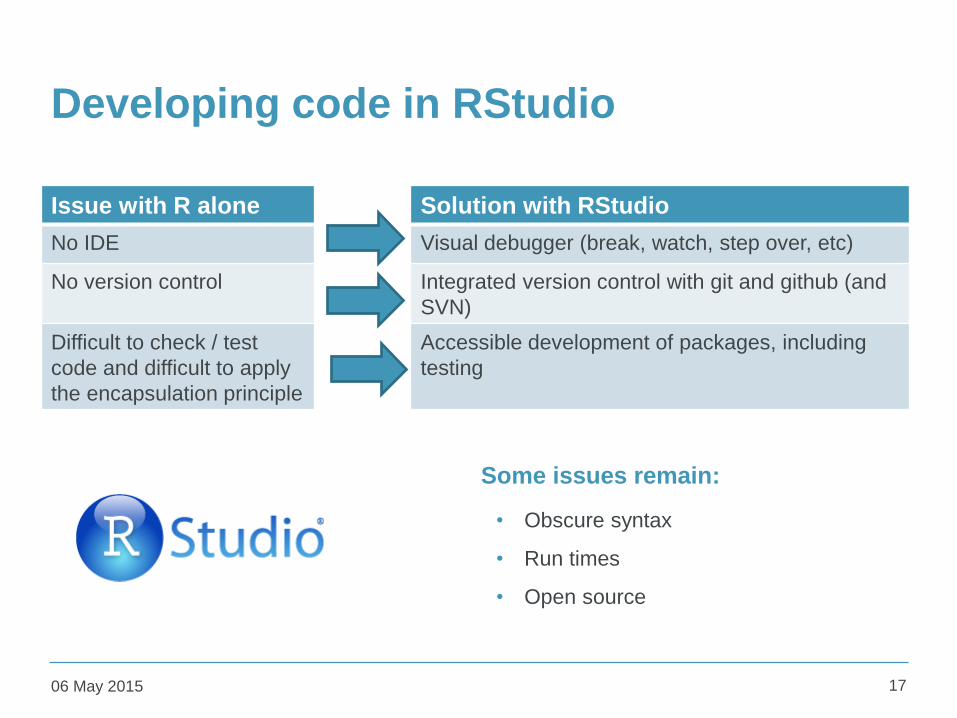
Developing code in RStudio
Issue with R alone Solution with RStudio
No IDE Visual debugger (break, watch, step over, etc)
No version control Integrated version control with git and github (and
SVN)
Difficult to check / test
code and difficult to apply
the encapsulation principle
Accessible development of packages, including
testing
06 May 2015 17
Some issues remain:
• Obscure syntax
• Run times
• Open source
Colour palette for PowerPoint
presentations
Dark blue
R17 G52 B88
Gold
R217 G171 B22
Mid blue
R64 G150 B184
Secondary colour palette
Primary colour palette
Light grey
R220 G221 B217
Pea green
R121 G163 B42
Forest green
R0 G132 B82
Bottle green
R17 G179 B162
Cyan
R0 G156 B200
Light blue
R124 G179 B225
Violet
R128 G118 B207
Purple
R143 G70 B147
Fuscia
R233 G69 B140
Red
R200 G30 B69
Orange
R238 G116 29
Dark grey
R63 G69 B72
X
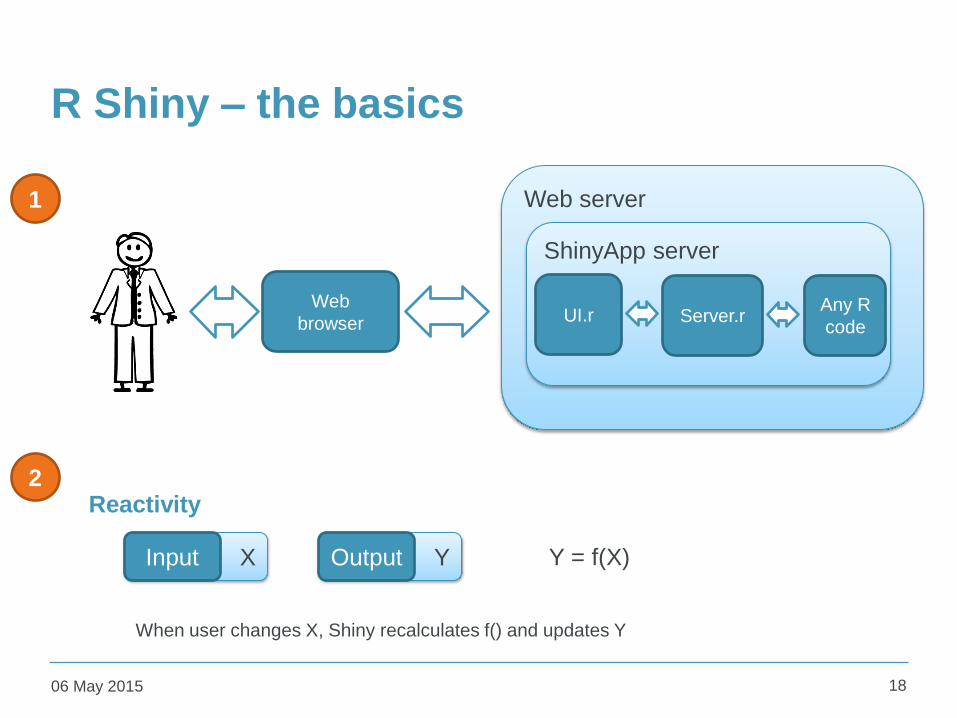
R Shiny – the basics
06 May 2015 18
Web
browser
Web server
ShinyApp server
UI.r Server.r Any R
code
1
2
Input
Reactivity
Y Output Y = f(X)
When user changes X, Shiny recalculates f() and updates Y
Colour palette for PowerPoint
presentations
Dark blue
R17 G52 B88
Gold
R217 G171 B22
Mid blue
R64 G150 B184
Secondary colour palette
Primary colour palette
Light grey
R220 G221 B217
Pea green
R121 G163 B42
Forest green
R0 G132 B82
Bottle green
R17 G179 B162
Cyan
R0 G156 B200
Light blue
R124 G179 B225
Violet
R128 G118 B207
Purple
R143 G70 B147
Fuscia
R233 G69 B140
Red
R200 G30 B69
Orange
R238 G116 29
Dark grey
R63 G69 B72
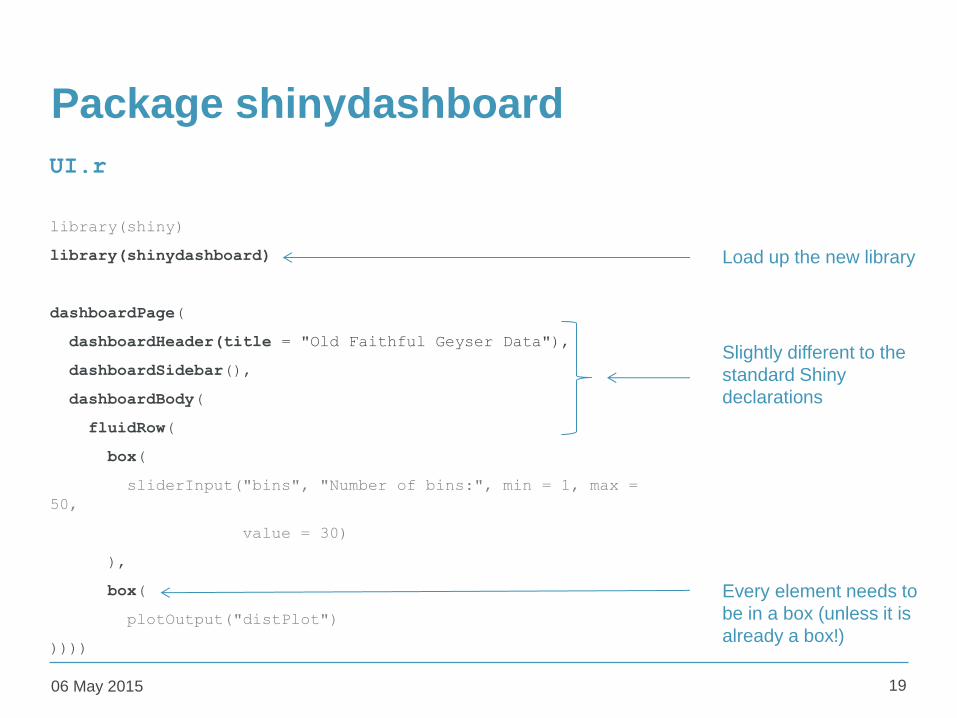
Package shinydashboard
library(shiny)
library(shinydashboard)
dashboardPage(
dashboardHeader(title = "Old Faithful Geyser Data"),
dashboardSidebar(),
dashboardBody(
fluidRow(
box(
sliderInput("bins", "Number of bins:", min = 1, max =
50,
value = 30)
),
box(
plotOutput("distPlot")
))))
06 May 2015 19
UI.r
Load up the new library
Slightly different to the
standard Shiny
declarations
Every element needs to
be in a box (unless it is
already a box!)
Colour palette for PowerPoint
presentations
Dark blue
R17 G52 B88
Gold
R217 G171 B22
Mid blue
R64 G150 B184
Secondary colour palette
Primary colour palette
Light grey
R220 G221 B217
Pea green
R121 G163 B42
Forest green
R0 G132 B82
Bottle green
R17 G179 B162
Cyan
R0 G156 B200
Light blue
R124 G179 B225
Violet
R128 G118 B207
Purple
R143 G70 B147
Fuscia
R233 G69 B140
Red
R200 G30 B69
Orange
R238 G116 29
Dark grey
R63 G69 B72
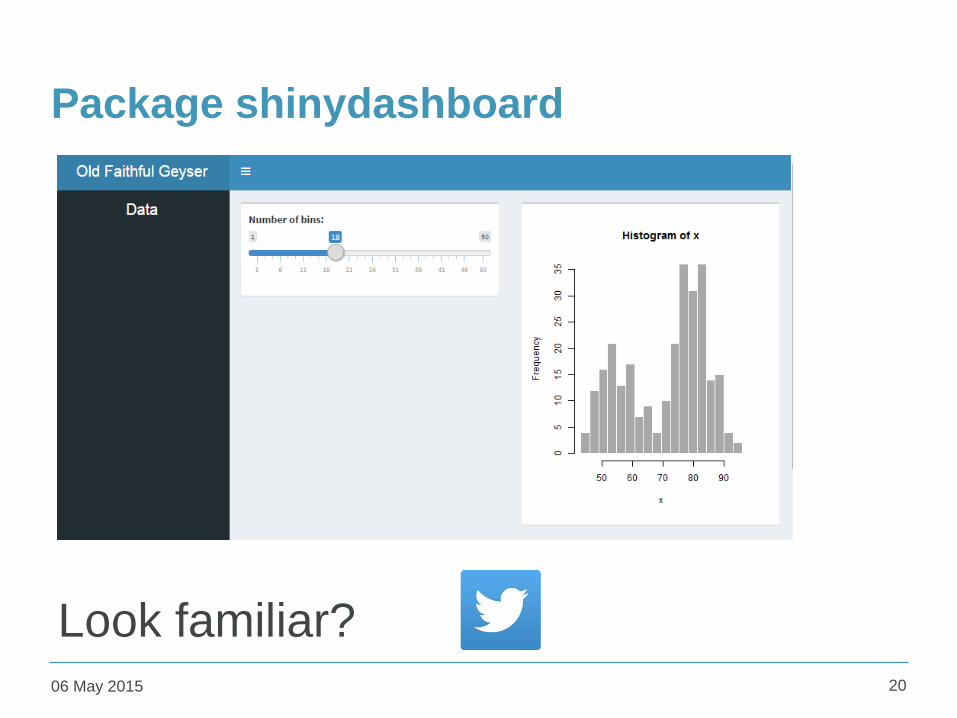
Package shinydashboard
06 May 2015 20
Look familiar?
Colour palette for PowerPoint
presentations
Dark blue
R17 G52 B88
Gold
R217 G171 B22
Mid blue
R64 G150 B184
Secondary colour palette
Primary colour palette
Light grey
R220 G221 B217
Pea green
R121 G163 B42
Forest green
R0 G132 B82
Bottle green
R17 G179 B162
Cyan
R0 G156 B200
Light blue
R124 G179 B225
Violet
R128 G118 B207
Purple
R143 G70 B147
Fuscia
R233 G69 B140
Red
R200 G30 B69
Orange
R238 G116 29
Dark grey
R63 G69 B72
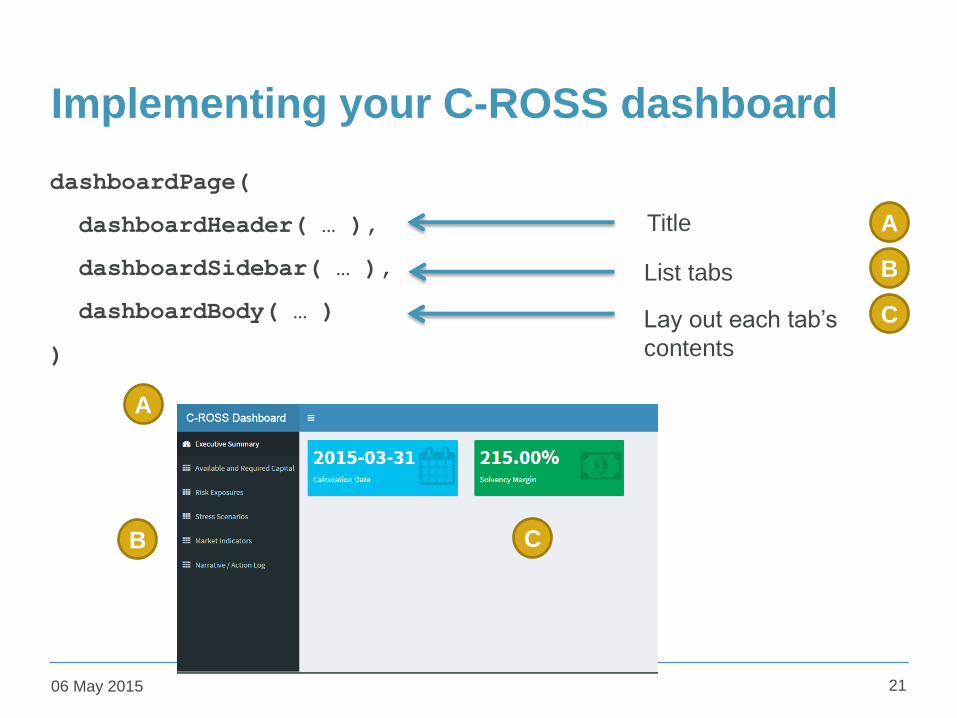
Implementing your C-ROSS dashboard
dashboardPage(
dashboardHeader( … ),
dashboardSidebar( … ),
dashboardBody( … )
)
06 May 2015 21
Title
List tabs
Lay out each tab’s
contents
A
B
C
A
B C
Colour palette for PowerPoint
presentations
Dark blue
R17 G52 B88
Gold
R217 G171 B22
Mid blue
R64 G150 B184
Secondary colour palette
Primary colour palette
Light grey
R220 G221 B217
Pea green
R121 G163 B42
Forest green
R0 G132 B82
Bottle green
R17 G179 B162
Cyan
R0 G156 B200
Light blue
R124 G179 B225
Violet
R128 G118 B207
Purple
R143 G70 B147
Fuscia
R233 G69 B140
Red
R200 G30 B69
Orange
R238 G116 29
Dark grey
R63 G69 B72
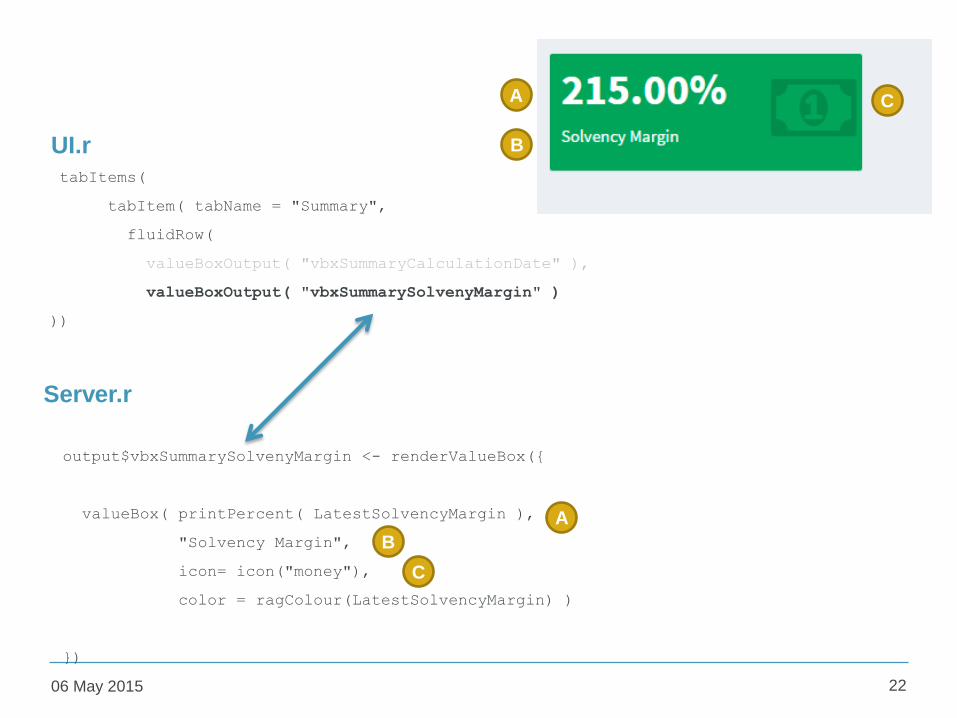
tabItems(
tabItem( tabName = "Summary",
fluidRow(
valueBoxOutput( "vbxSummaryCalculationDate" ),
valueBoxOutput( "vbxSummarySolvenyMargin" )
))
06 May 2015 22
output$vbxSummarySolvenyMargin <- renderValueBox({
valueBox( printPercent( LatestSolvencyMargin ),
"Solvency Margin",
icon= icon("money"),
color = ragColour(LatestSolvencyMargin) )
})
UI.r
Server.r
A
A
B
B
C
C
Colour palette for PowerPoint
presentations
Dark blue
R17 G52 B88
Gold
R217 G171 B22
Mid blue
R64 G150 B184
Secondary colour palette
Primary colour palette
Light grey
R220 G221 B217
Pea green
R121 G163 B42
Forest green
R0 G132 B82
Bottle green
R17 G179 B162
Cyan
R0 G156 B200
Light blue
R124 G179 B225
Violet
R128 G118 B207
Purple
R143 G70 B147
Fuscia
R233 G69 B140
Red
R200 G30 B69
Orange
R238 G116 29
Dark grey
R63 G69 B72
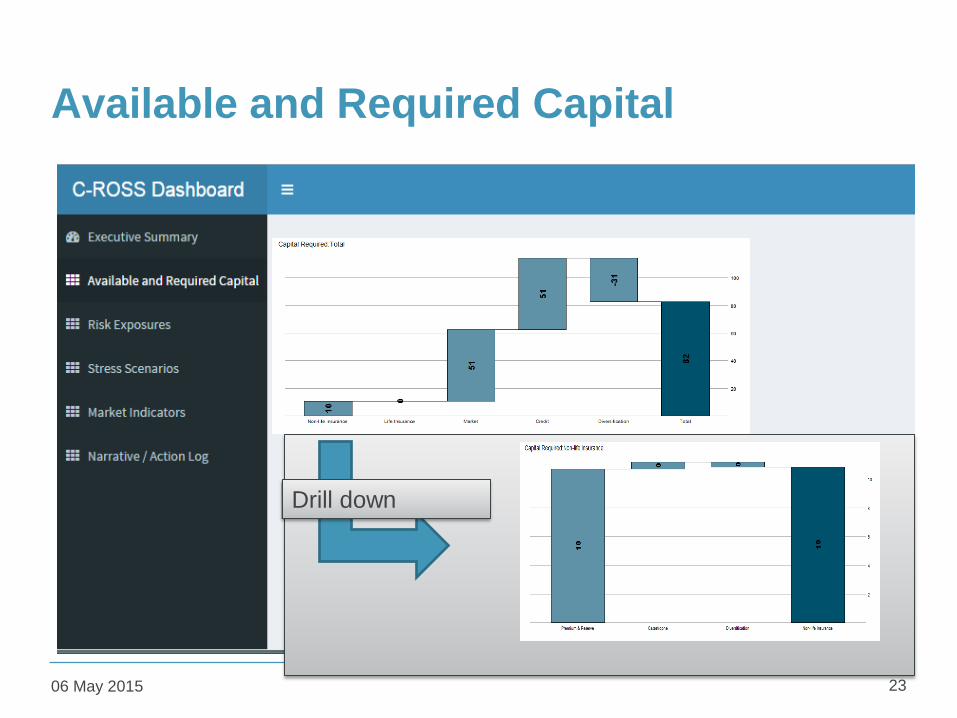
Available and Required Capital
06 May 2015 23
Drill down
Colour palette for PowerPoint
presentations
Dark blue
R17 G52 B88
Gold
R217 G171 B22
Mid blue
R64 G150 B184
Secondary colour palette
Primary colour palette
Light grey
R220 G221 B217
Pea green
R121 G163 B42
Forest green
R0 G132 B82
Bottle green
R17 G179 B162
Cyan
R0 G156 B200
Light blue
R124 G179 B225
Violet
R128 G118 B207
Purple
R143 G70 B147
Fuscia
R233 G69 B140
Red
R200 G30 B69
Orange
R238 G116 29
Dark grey
R63 G69 B72
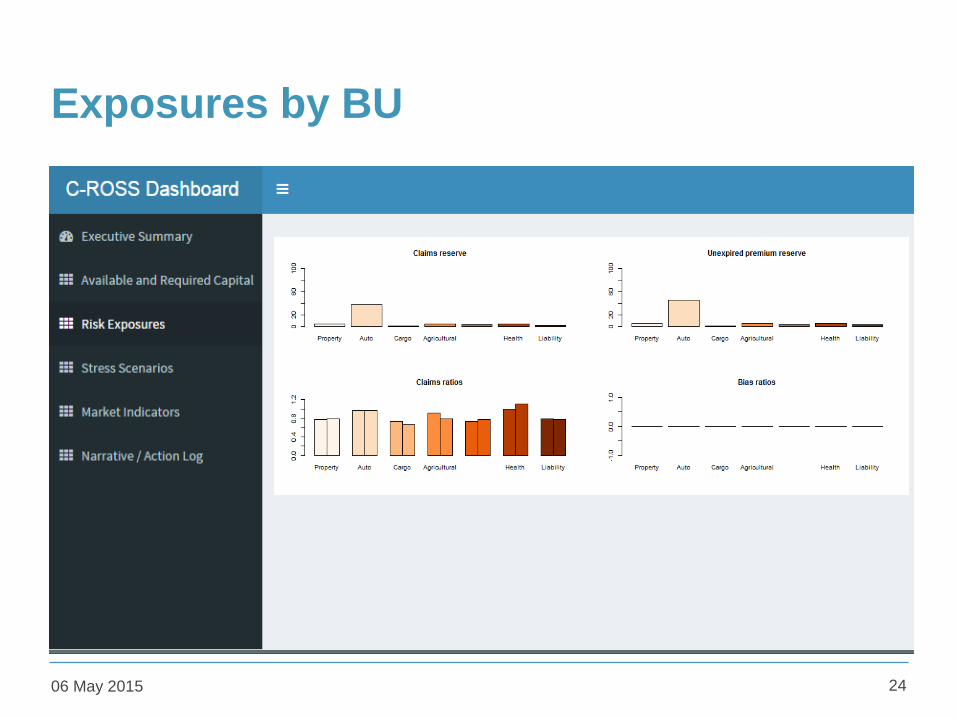
Exposures by BU
06 May 2015 24
The payoff
06 May 2015

Colour palette for PowerPoint
presentations
Dark blue
R17 G52 B88
Gold
R217 G171 B22
Mid blue
R64 G150 B184
Secondary colour palette
Primary colour palette
Light grey
R220 G221 B217
Pea green
R121 G163 B42
Forest green
R0 G132 B82
Bottle green
R17 G179 B162
Cyan
R0 G156 B200
Light blue
R124 G179 B225
Violet
R128 G118 B207
Purple
R143 G70 B147
Fuscia
R233 G69 B140
Red
R200 G30 B69
Orange
R238 G116 29
Dark grey
R63 G69 B72
What’s wrong with our current set-up?
1. Out-dated techniques
2. Bad engineering: failing to minimise operational risks
and optimise rewarded risks
3. Poor use of resources
06 May 2015 26
Colour palette for PowerPoint
presentations
Dark blue
R17 G52 B88
Gold
R217 G171 B22
Mid blue
R64 G150 B184
Secondary colour palette
Primary colour palette
Light grey
R220 G221 B217
Pea green
R121 G163 B42
Forest green
R0 G132 B82
Bottle green
R17 G179 B162
Cyan
R0 G156 B200
Light blue
R124 G179 B225
Violet
R128 G118 B207
Purple
R143 G70 B147
Fuscia
R233 G69 B140
Red
R200 G30 B69
Orange
R238 G116 29
Dark grey
R63 G69 B72
Delivering insights (or, what’s the point?)
To make good business decisions managers need information which is:
• presented clearly
• accurate
• timely
• A well designed dashboard will address the presentational issue
• Accuracy is improved by using code which is tested and version controlled
• Timeliness is a function of people and process – the people issue is often
easier to optimise than process (e.g. data delivery times may be outside of
your control)
06 May 2015 27
Colour palette for PowerPoint
presentations
Dark blue
R17 G52 B88
Gold
R217 G171 B22
Mid blue
R64 G150 B184
Secondary colour palette
Primary colour palette
Light grey
R220 G221 B217
Pea green
R121 G163 B42
Forest green
R0 G132 B82
Bottle green
R17 G179 B162
Cyan
R0 G156 B200
Light blue
R124 G179 B225
Violet
R128 G118 B207
Purple
R143 G70 B147
Fuscia
R233 G69 B140
Red
R200 G30 B69
Orange
R238 G116 29
Dark grey
R63 G69 B72
Summary and conclusions
C-ROSS A quantum leap for the Chinese insurance industry,
which should improve management and customer
outcomes, but which presents short-term
operational, systems and education challenges
Dashboards A neat way of presenting pertinent information
visually, and an opportunity for actuaries and
insurance risk people to take advantage of insights
developed in the software industry
R Shiny A quick, powerful way of creating and delivering
management information, and a welcome user
interface to R
06 May 2015 28
Colour palette for PowerPoint
presentations
Dark blue
R17 G52 B88
Gold
R217 G171 B22
Mid blue
R64 G150 B184
Secondary colour palette
Primary colour palette
Light grey
R220 G221 B217
Pea green
R121 G163 B42
Forest green
R0 G132 B82
Bottle green
R17 G179 B162
Cyan
R0 G156 B200
Light blue
R124 G179 B225
Violet
R128 G118 B207
Purple
R143 G70 B147
Fuscia
R233 G69 B140
Red
R200 G30 B69
Orange
R238 G116 29
Dark grey
R63 G69 B72
06 May 2015 29
Expressions of individual views by members of the Institute and
Faculty of Actuaries and its staff are encouraged.
The views expressed in this presentation are those of the
presenter.
Questions
?
Comments
?

Colour palette for PowerPoint
presentations
Dark blue
R17 G52 B88
Gold
R217 G171 B22
Mid blue
R64 G150 B184
Secondary colour palette
Primary colour palette
Light grey
R220 G221 B217
Pea green
R121 G163 B42
Forest green
R0 G132 B82
Bottle green
R17 G179 B162
Cyan
R0 G156 B200
Light blue
R124 G179 B225
Violet
R128 G118 B207
Purple
R143 G70 B147
Fuscia
R233 G69 B140
Red
R200 G30 B69
Orange
R238 G116 29
Dark grey
R63 G69 B72
Speaker Bio
06 May 2015 30
Phil Joubert is a principal in the Financial Services practice of Oliver Wyman, based in Hong
Kong Office. Phil has fifteen years of experience in the financial services industry, having worked
in areas as diverse as actuarial consulting and derivatives trading. He has worked in both Europe
and Asia-Pac for a variety of insurers, banks and software houses, and specialises in risk and
capital modelling and systems design
Recent experience
• Regulatory capital model design and implementation for several insurers in Europe
• Economic capital implementation for leading pan-Asian insurance group
• Derivatives trading and market risk management
• Capital aggregation systems design for leading ESG provider
• Actuarial automation implementation project for specialist life insurer
Phil holds an MSc in Finance & Mathematics from Imperial College and is a Fellow of the Faculty
of Actuaries. He joined Oliver Wyman in 2014, having spent several years as an independent
actuarial consultant. Previously he worked at Deutsche Bank and Natixis as a trader and he
started his career with Deloitte Actuarial.