Risk: BUY (-) HIGH - Sanochemia€¦ · Risk: Close Brothers ... PT Graha (Indonesia, Malaysia),...
36
Internet: www.sanochemia. Sector: Biotechnology WKN: 919963 ISIN: AT0000776307 Reuters: SCPH.DE Bloomberg: sac GY Short company profile Share data: Share price (last closing price, EUR): Shares outstanding (m): Market capitalisation (EURm): Enterprise value (EURm): Ø daily trading volume (3 m., no. of shares): Performance data: High 52 weeks (EUR): Low 52 weeks (EUR): Absolute performance (12 months) Relative performance: (vs. TecDAX) 1 month 3 months 6 months 12 months Shareholders: Sanochemia Ltd. Free float Financial calendar: 2010/11 results Author Igor Kim (Analyst) Close Brothers Seydler Research AG Phone: +49 (0) 69-977 84 56 0 Email: [email protected] -27.3% -11.4% 4.4% 4.72 EPS - 0.06 11,055 1.68 0.24 www.cbseydlerresearch.ag -7.9% -17.0% 60.2% 39.8% 26 January 2012 22.29 30.45 0.29 - SANOCHEMIA Pharmazeutika AG is a fully-fledged specialty pharmaceutical company spanning the entire length of the value added chain. 1.93 11.56 - - 4.1 EBIT - 1.6 - 3.4 Revenue - 33.2 - 39.0 - 43.4 new old new old new old Change 2010/11E 2011/12E 2012/13E Share price (dark) vs. TecDAX Source: CBS Research AG, Bloomberg SANOCHEMIA Pharmazeutika AG Recommendation: BUY (-) Risk: HIGH (-) Price Target: EUR 3.20 (-) Heading for emerging markets ▪ SANOCHEMIA Pharmazeutika AG is a fully-fledged specialty pharmaceutical company spanning the entire length of the value added chain. SANOCHEMIA‟s activity is subdivided by four business segments: 1) HUMAN PHARMACEUTCIALS segment which involves Radiology and Therapeutics and generates the bulk of the company‟s sales 2) PRODUCTION segment comprising Synthesis and Pharmaceutical production. 3) RESEARCH AND DEVELOPMENT segment represents SANOCHEMIA‟s R&D activities and 4) New segment Veterinary Pharmaceuticals arose from acquisition of Alvetra & Werfft GmbH. Alvetra annual sales total EUR ~7m and have a positive operating income. ▪ Following an intensive internationalisation of its radiological business in the so-called pharmerging markets either by direct sales or distribution partnerships SANOCHEMIA signed a number of contracts with Iberoinvesa (Spain, Portugal, Latin America), Gammamed Farm (Russia), Kish N.B.S. (Iran). PT Graha (Indonesia, Malaysia), Sankem Pharma and Halley (Italy). The company already generates 40% of its radiological revenues from exports. We assume that aggressive expansion into emerging markets should be the main driver of segment growth. We forecast the export of radiology products to continue its growth at rapid pace reaching above 50% of Human Pharmaceuticals segment in the mid-term. We estimate CAGR of 27% and 15% of sales growth for the period over 2010/11E-13/14E for radiology export and Human Pharmaceuticals respectively. ▪ While we expect Human Pharmaceuticals to be driven by the expansion of radiology export share, we anticipate the development of Production segment to remain relatively flat with estimated CAGR of ~4% over 2010/11E-13/14E. Also the recently established Veterinary Pharmaceuticals segment should demonstrate a robust growth in the medium term with forecasted CAGR of ~17% over 2010/11E-13/14E. For 2011/12E we expect EBIT margin in tune of 9%, which should gradually increase to at least 13% in the long term (in best case scenario we expect long-term operating margin to grow up to 15%). ▪ On the basis of our DCF valuation model, we derived the fair value of EUR 3.27/share, and set the price target at EUR 3.20 with BUY recommendation. 17 November 2011 Source: SANOCHEMIA Pharmazeutika AG, CBS Research AG Please notice the information on the preparation of this document, the disclaimer, the advice regarding possible conflicts of interests, and the mandatory information required by § 34b WpHG (Securities Trading Law) at the end of this document. This financial analysis in accordance with § 34b WpHG is exclusively intended for distribution to individuals that buy or sell financial instruments at their own account or at the account of others in connection with their trading activities, occupation, or employment. Expanding export of radiology business drives top-line Y/E 30.09., EUR m 2007/08 2008/09 2009/10 2010/11E 2011/12E 2012/13E Revenue 29.5 29.5 27.1 33.2 39.0 43.4 Operating result -1.2 -4.6 -1.3 1.6 3.4 4.1 EBT -4.0 -10.8 -2.0 0.8 3.1 3.7 Net result -3.7 -10.8 -1.4 0.7 2.8 3.5 EPS -0.34 -1.04 -0.12 0.06 0.24 0.29 CPS 0.83 -0.50 -0.31 0.29 0.42 0.60 EBIT margin n/m n/m n/m 4.9% 8.8% 9.5% EBT margin n/m n/m n/m 2.4% 7.8% 8.5% Net margin n/m n/m n/m 2.2% 7.3% 7.9%
-
Upload
doankhuong -
Category
Documents
-
view
214 -
download
0
Transcript of Risk: BUY (-) HIGH - Sanochemia€¦ · Risk: Close Brothers ... PT Graha (Indonesia, Malaysia),...

Internet: www.sanochemia.atSector: Biotechnology
WKN: 919963 ISIN: AT0000776307
Reuters: SCPH.DE Bloomberg: sac GY
Short company profile
Share data:
Share price (last closing price, EUR):
Shares outstanding (m):
Market capitalisation (EURm):
Enterprise value (EURm):
Ø daily trading volume (3 m., no. of shares):
Performance data:
High 52 weeks (EUR):
Low 52 weeks (EUR):
Absolute performance (12 months):
Relative performance: (vs. TecDAX)
1 month
3 months
6 months
12 months
Shareholders:
Sanochemia Ltd.
Free float
Financial calendar:
2010/11 results
Author Igor Kim (Analyst)
Close Brothers Seydler Research AG
Phone: +49 (0) 69-977 84 56 0
Email: [email protected]
-27.3%
-11.4%
4.4%
4.72
EPS - 0.06
11,055
1.68
0.24
www.cbseydlerresearch.ag
-7.9%
-17.0%
60.2%
39.8%
26 January 2012
22.29
30.45
0.29-
SANOCHEMIA Pharmazeutika AG is a fully-fledged
specialty pharmaceutical company spanning the entire
length of the value added chain.
1.93
11.56
-
- 4.1EBIT - 1.6 - 3.4
Revenue - 33.2 - 39.0 - 43.4
new old new old new old
Change 2010/11E 2011/12E 2012/13E
Share price (dark) vs. TecDAX
Source: CBS Research AG, Bloomberg
SANOCHEMIA Pharmazeutika AG
Recommendation:
BUY (-) Risk:
HIGH (-) Price Target:
EUR 3.20 (-)
Heading for emerging markets
▪ SANOCHEMIA Pharmazeutika AG is a fully-fledged specialty
pharmaceutical company spanning the entire length of the value added
chain. SANOCHEMIA‟s activity is subdivided by four business segments: 1)
HUMAN PHARMACEUTCIALS segment which involves Radiology and
Therapeutics and generates the bulk of the company‟s sales 2)
PRODUCTION segment comprising Synthesis and Pharmaceutical
production. 3) RESEARCH AND DEVELOPMENT segment represents
SANOCHEMIA‟s R&D activities and 4) New segment Veterinary
Pharmaceuticals arose from acquisition of Alvetra & Werfft GmbH. Alvetra
annual sales total EUR ~7m and have a positive operating income.
▪ Following an intensive internationalisation of its radiological business in the
so-called pharmerging markets either by direct sales or distribution
partnerships SANOCHEMIA signed a number of contracts with Iberoinvesa
(Spain, Portugal, Latin America), Gammamed Farm (Russia), Kish N.B.S.
(Iran). PT Graha (Indonesia, Malaysia), Sankem Pharma and Halley (Italy).
The company already generates 40% of its radiological revenues from
exports. We assume that aggressive expansion into emerging markets
should be the main driver of segment growth. We forecast the export of
radiology products to continue its growth at rapid pace reaching above 50%
of Human Pharmaceuticals segment in the mid-term. We estimate CAGR of
27% and 15% of sales growth for the period over 2010/11E-13/14E for
radiology export and Human Pharmaceuticals respectively.
▪ While we expect Human Pharmaceuticals to be driven by the expansion of
radiology export share, we anticipate the development of Production
segment to remain relatively flat with estimated CAGR of ~4% over
2010/11E-13/14E. Also the recently established Veterinary Pharmaceuticals
segment should demonstrate a robust growth in the medium term with
forecasted CAGR of ~17% over 2010/11E-13/14E. For 2011/12E we expect
EBIT margin in tune of 9%, which should gradually increase to at least 13%
in the long term (in best case scenario we expect long-term operating
margin to grow up to 15%).
▪ On the basis of our DCF valuation model, we derived the fair value of EUR
3.27/share, and set the price target at EUR 3.20 with BUY recommendation.
▪
▪
17 November 2011
Source: SANOCHEMIA Pharmazeutika AG, CBS Research AG
Please notice the information on the preparation of this document, the disclaimer, the advice regarding possible conflicts of interests, and the mandatory information required by § 34b WpHG (Securities Trading Law) at the end of this document. This financial analysis in accordance with § 34b WpHG is exclusively intended for distribution to individuals that buy or sell financial instruments at their own account or at the account of others in connection with their trading activities, occupation, or employment.
Expanding export of radiology business drives top-line
Y/E 30.09., EUR m 2007/08 2008/09 2009/10 2010/11E 2011/12E 2012/13E
Revenue 29.5 29.5 27.1 33.2 39.0 43.4
Operating result -1.2 -4.6 -1.3 1.6 3.4 4.1
EBT -4.0 -10.8 -2.0 0.8 3.1 3.7
Net result -3.7 -10.8 -1.4 0.7 2.8 3.5
EPS -0.34 -1.04 -0.12 0.06 0.24 0.29
CPS 0.83 -0.50 -0.31 0.29 0.42 0.60
EBIT margin n/m n/m n/m 4.9% 8.8% 9.5%
EBT margin n/m n/m n/m 2.4% 7.8% 8.5%
Net margin n/m n/m n/m 2.2% 7.3% 7.9%

Sanochemia Pharmazeutika AG
www.cbseydlerresearch.ag
Close Brothers Seydler Research AG | 2
Table of content:
Investment thesis ...................................................... 3
SWOT analysis ........................................................... 5
Valuation ................................................................... 7
Discounted Cash Flow ............................................................................... 7
Further upside potential not captured in valuation ..................................... 8
Company .................................................................... 9
Short profile ................................................................................................ 9
Company structure ..................................................................................... 9
Shareholder structure ............................................................................... 10
Management board .................................................................................. 10
Supervisory Board.................................................................................... 10
Business model ....................................................... 11
SANOCHEMIA market access ................................................................. 11
Segment overview ................................................... 12
PRODUCTION segment ............................................................................. 12
HUMAN PHARMACEUTICALS segment .................................................... 13
Radiology – Diagnostics ........................................................................... 13
Therapeutics: tolperisone ......................................................................... 13
VETERINARY PHARMACEUTICALS segment .......................................... 14
RESEARCH & DEVELOPMENT segment .................................................. 14
Strategy ................................................................... 16
Internationalisation of radiology business ................................................ 16
Partnerships ............................................................ 18
Partnerships: Radiology ........................................................................... 18
Partnerships: tolperisone ......................................................................... 19
Market environment ................................................ 21
Imaging agents– Contrast Media ................................................................ 21
Market drivers .......................................................................................... 22
Competition .............................................................................................. 22
Alzheimer‟s disease (Galantamine) ............................................................ 22
Financials ................................................................ 24
9M/2010/11 figures. ................................................................................. 24
Financial forecast ........................................................................................ 25
Export of radiology products should be the main growth driver ................ 25
Sales projection: segment breakdown ..................................................... 26
Earnings projection .................................................................................. 27
Appendix .................................................................. 29

Sanochemia Pharmazeutika AG
www.cbseydlerresearch.ag
Close Brothers Seydler Research AG | 3
Investment thesis
Founded in 1990 and located in Vienna (Austria), SANOCHEMIA Pharmazeutika
AG (SANOCHEMIA) is a fully-fledged specialty pharmaceutical company spanning
the entire length of the value added chain. SANOCHEMIA‟s business model is
based on three pillars: 1) Development and production of innovative specialty
pharmaceuticals, which covers such indications as CNS/ Neurodegeneration, Pain,
Oncology as well as diagnostics based on imaging agents and veterinary. The
company is particularly well positioned in the diagnostics segment 2) APIs (Active
Pharmaceutical Ingredients) synthesis for pharmaceutical products. APIs syntheses
comprises both APIs synthesis for SANOCHEMIA products and contract
manufacturing for third parties 3) Manufacture and global distribution of imaging
agents (contrast media – used in all imaging-based medical investigations) and
diagnostics.
SANOCHEMIA‟s activity is subdivided by four business segments: 1) HUMAN
PHAMRACEUTCIALS segment involves Radiology and Therapeutics and
generates the bulk of the company‟s sales 2) PRODUCTION segment comprises
Synthesis and Pharmaceutical production 3) RESEARCH AND DEVELOPMENT
segment represents SANOCHEMIA‟s R&D activities. 4) New segment Veterinary
Pharmaceuticals arose from acquisition of Alvetra & Werfft GmbH. Alvetra annual
sales total ~EUR 7m and have a positive operating income.
The main component of SANOCHEMIA‟s strategy is an intensive
internationalisation of its radiological business in the so-called pharmerging
markets. In terms of geographical focus, the company targets growth markets in
Latin America, Middle East as well as selected markets of Africa and Asia. Also
Russia and US are likewise important markets for SANOCHEMIA. The entrance
into these markets will be executed either by direct sales or distribution
partnerships.
The rapid expansion into the above mentioned regions should relieve the
company‟s dependence on European markets, which are characterised by a
complicated regulatory environment, particularly in Germany.
SANOCHEMIA already generates 40% of its radiological revenues from exports.
The aim is to boost the current level of exports, currently at ~EUR 4.5m, by more
than 50%. This estimate is based on existing marketing authorisations, a steadily
growing product range and the continuous expansion of a network of strong, local
sales partnerships.
The signing of contracts with Iberoinvesa (Spain, Portugal, Latin America),
Gammamed Farm (Russia), Kish N.B.S. (Iran) and Halley (Italy) represents a major
step for the Company in these large, growing markets which should yield top and
bottom-line growth in the short- and mid-term.
A further boost to sales revenues could come in the form of the launch of Scanlux
(iopamidol) in the US. Following the approval of the FDA for production in Neufeld,
SANOCHEMIA plans to launch this product in business year 2012/13. Efforts are
also continuing to expand further in South American and Middle East markets.
Through the submission of a so-called GCC-DR (Gulf Cooperation Council – Drug
Registration) covering multiple Arabian markets, SANOCHEMIA aims to make rapid
progress in the Gulf States.
Four business
segments
The export share
should significantly
increase in the mid
term
US provides an
additional significant
potential in the mid-
and long-term

Sanochemia Pharmazeutika AG
www.cbseydlerresearch.ag
Close Brothers Seydler Research AG | 4
In Germany and Switzerland, SANOCHEMIA's tolperisone formulation has already
been launched and is being successfully marketed, under the trademarks Viveo®
(Germany) and Tolcare® (Switzerland) by Orion Pharma. In Turkey, tolperisone
(Agileo®) is already at an advanced regulatory stage, and the approval is expected
in 2012, after which SANOCHEMIA‟s partner, EIP Eczacibasi Ilac Pazarlama will
launch the sale of the product. Furthermore, the company has recently sealed the
deal with Remedica, which will be responsible for the distribution of tolperisone
(Agileo®) in Egypt and so-called MENA countries (For further detail see section
“Partnerships”).
For 2010/11 we expect that the company will further increase its export share of
radiology products, which should boost sales in HUMAN PHARMACEUTICALS
segment. We anticipate the export share of this segment to increase by 53% to
EUR 6.9m (PY: EUR 4.5m), which will represent ~38% of the segment (PY: 29%).
Furthermore, we forecast the export of radiology products to continue its growth at
rapid pace reaching above 50% of HUMAN PHARMACEUTICALS segment in the
mid-term. We estimate CAGR of 27% and 15% of sales growth for the period over
2010/11E-13/14E for radiology export and HUMAN PHARMACEUTICALS
respectively.
While we expect HUMAN PHARMACEUTICALS to be driven by the expansion of
radiology export share, we anticipate the development of Production segment to
remain relatively flat with estimated CAGR of ~4% over 2010/11E-13/14E. The
recently established Veterinary Pharmaceuticals segment should demonstrate a
robust growth in the medium term with forecasted CAGR of ~17% over 2010/11E-
13/14E (It should be noted that in 2010/11E the sales in this segment are not
consolidated for the entire year).
Considering that price pressure in European countries particularly in Germany
significantly affect company margins, we believe that rapid expansion into
pharmerging will notably contribute to margin growth. For 2011/12E we expect
EBIT margin in tune of 9%, which should gradually increase to at least 13% in the
long term (in best case scenario we expect long-term operating margin to grow up
to 15%).
On the basis of our DCF valuation model we derived the fair value of EUR 3.27/
share, and set the price target at EUR 3.20 with BUY recommendation.
Tolperisone: Rapid
access to target
markets
Export business is the
main growth driver
Expansion into
international markets
should improve
margins
BUY recommendation
PT: EUR 3.20
Sanochemia Pharmazeutika AG
www.cbseydlerresearch.ag
Close Brothers Seydler Research AG | 5
SWOT analysis
Strengths
SANOCHEMIA‟s business model covers all key steps in the value-added
chain in house: development, production, marketing and sales
Diversified business model
SANOCHEMIA already has a footprint in attractive fast growing markets and
well positioned in its core segments radiology and oncology diagnostics
Experienced management
The discontinuation of low-margin products as well as restructuring
measures optimised operating expenses and improved margins
Given its long and proven track record in the area of API research,
SANOCHEMIA was among the first to recognise the potential of
galantamine.
Weaknesses
Over the last three years the company has generated negative losses
In some European markets, particularly Germany, the regulatory
intervention of healthcare authorities significantly affects the prices of
SANOCHEMIA‟s products and company‟s margins

Sanochemia Pharmazeutika AG
www.cbseydlerresearch.ag
Close Brothers Seydler Research AG | 6
Opportunities
The continual demand for new patient tailored therapeutic options and
especially improved diagnostics underpins long-term growth prospects
The development of own synthesis processes for the necessary
(radiological) APIs should reduce company‟s dependence on suppliers
and boost margins in the API synthesis business
R&D pipeline offers a mid- and long term upside potential
The development of a new process for the manufacture of highly pure
forms of synthetic galantamine and its derivatives should provide the basis
for the extension of SANOCHEMIA‟s worldwide synthesis patent from
2014 until 2027. This new, high-purity form of the product could potentially
become the industry standard for this substance.
Turnaround is expected in 2010/11
While US and EU are the largest markets, emerging markets offer notably
higher growth rates
Ageing populations are a strong demand driver for imaging agents, as
they are implemented in the diagnosis of such age-related diseases
including cancer, cardiovascular disease, and neurological disease.
The increasing installation of CT and MRT equipment all over the world
should support the contrast media market.
The need for non-invasive approaches in early diagnostic procedure
particularly in oncology is becoming important.
Threats
Risks related to the failure of clinical trials
Development of market entrance might be slower than expected due to
prolonged approval processes and other regulatory affairs
Internationalisation strategy implies a greater exposure to country risk
associated with emerging markets
Further capital increases might dilute EPS and decrease the share price

Sanochemia Pharmazeutika AG
www.cbseydlerresearch.ag
Close Brothers Seydler Research AG | 7
Valuation
Discounted Cash Flow
Our Discounted Cash Flow (DCF) model is based on the following assumptions:
Weighted average cost of capital (WACC): We set the risk-free rate at 3.5%
which is rather conservative in view of the current long-term yields of German
federal bonds. We assumed an equity risk premium of 6.0% and a debt risk
premium of 2.6%. We set the beta factor at 1.5. We assumed a long-term target
equity ratio at market values of 70%. These premises lead to a WACC of 10.14%.
Phase 1 (2010/11E-13E): We estimated the free cash flows (FCF) of phase 1
according to our detailed financial forecasts for this period described in the
financials section of this document.
Phase 2 (2013/14-20E): For Phase 2, we made more general assumptions,
considering company‟s strategy to increase its presence in international markets.
Overall, we allowed annual revenue growth to decrease successively to 3.5%,
resulting in a CAGR 2013/14WE-19/20E of ~5.4%. We assume that the company
can achieve in the long-run an EBIT margin of ~13.8%.
Terminal value: For the calculation of the terminal value, we applied a long-term
FCF growth rate of 2.0%, which should be a rather conservative assumption in
regards to the long-term inflation rate to be expected. Based on these assumptions,
we calculated a fair value of equity of EUR 37.8m, corresponding to a fair value per
share of EUR 3.27. We set the price target of EUR 3.20.
Source: CBS Research
Discounted Cash Flow Model
PHASE 1 PHASE 2 PHASE 3
EUR m 2010/11E 2011/12E 2012/13E 2013/14E 2014/15E 2015/16E 2016/17E 2017/18E 2018/19E 2019/20E
8
Sales 33.2 39.0 43.4 47.3 50.9 54.4 58.0 60.7 63.2 65.4Sales grow th 22.7% 17.4% 11.3% 9.0% 7.6% 7.0% 6.5% 4.7% 4.1% 3.5%
EBIT 1.6 3.4 4.1 4.8 5.5 6.1 6.9 7.6 8.2 9.0
EBIT margin 4.9% 8.8% 9.5% 10.1% 10.8% 11.2% 11.9% 12.6% 12.9% 13.8%
Income tax on EBIT -0.1 -0.2 -0.3 -0.5 -0.8 -1.4 -1.6 -1.7 -1.8 -2.0
Depreciation and amortisation 3.8 4.5 4.7 4.8 4.9 5.0 5.1 5.2 5.6 5.7
Change in net working capital -0.3 -0.2 -2.6 -1.1 -1.6 -1.3 -0.8 -0.5 -0.4 -0.3
Net capital expenditure -3.6 -3.4 -3.9 -4.2 -4.9 -5.0 -5.1 -5.2 -5.6 -5.7
Free cash flow 1.4 4.1 1.9 3.8 3.0 3.3 4.4 5.4 6.0 6.7
Present values 1.4 3.6 1.6 2.7 2.0 2.0 2.4 2.6 2.6 2.4 30.1
Present value Phase 1 6.6 Risk free rate 3.5% Target equity ratio 70.0%
Present value Phase 2 16.8 Equity risk premium 6.0% Beta (fundamental) 1.50
Present value Phase 3 30.1 Debt risk premium 2.6% WACC 10.14%
Total present value 53.5 Tax shield 23.0% Terminal growth 2.0%
Excess cash 1.4
Financial debt -17.1
1.0% 1.5% 2.0% 2.5% 3.0%
9.1% 3.92 4.14 4.39 4.68 5.02
Fair value of equity 37.8 9.6% 3.55 3.74 3.95 4.19 4.47
10.1% 3.23 3.39 3.27 3.77 4.01
Number of shares (m) 11.6 10.6% 2.94 3.08 3.23 3.41 3.60
11.1% 2.68 2.80 2.93 3.08 3.25
Fair value per share (EUR) 3.27
Sensitivity analysis
Terminal growth (Phase 3)
WACC
Sanochemia Pharmazeutika AG
www.cbseydlerresearch.ag
Close Brothers Seydler Research AG | 8
Further upside potential not captured in valuation
Estimating the fair value of SANOCHEMIA, we have confined ourselves by the DCF
model valuation and have not taken into consideration, the further upside from
SANOCHEMIA‟s programs, which are presently in clinical trial stage.
We also see a significant upside potential from the possible approval of Secrelux as
well as Tolperison in US market. However, adhering to a conservative approach we
did not take into consideration the potential in US market neither in our valuation
nor in our estimates, leaving it for further upside.

Sanochemia Pharmazeutika AG
www.cbseydlerresearch.ag
Close Brothers Seydler Research AG | 9
Company
Short profile
Founded in 1990 and located in Vienna (Austria), SANOCHEMIA Pharmazeutika
AG (SANOCHEMIA) is a fully-fledged specialty pharmaceutical company spanning
the entire length of the value added chain. The Company focuses on the
development and manufacture of novel drugs and diagnostics in selected indication
areas including; neurodegeneration, pain and oncology, as well as in vivo
diagnostics contrast media. SANOCHEMIA and its subsidiaries are engaged in the
production and sale of pharmaceuticals and diagnostics for human medicine and
the synthetic production of active pharmaceutical ingredient (API) such as
galantamine, which is used in a drug to treat Alzheimer‟s disease. Having acquired
Alvetra u. Werfft GmbH, SANOCHEMIA entered into a new operating segment
“Veterinary Pharmaceuticals”.
Strategic positioning: In contrast to Classical Pharma and Biotech
Source: SANOCHEMIA Pharmazeutika AG; CBS Research AG;
Company structure
SANOCHEMIA has subsidiaries across Europe that manufacture and distribute
radiological products in selected markets. Currently, sales offices operate in
Germany, Switzerland, the UK and the US. The following chart illustrates
SANOCHEMIA Pharmazeutika AG‟s structure.
Company structure
Source: SANOCHEMIA Pharmazeutika AG; CBS Research AG;
R&D
Pharmaceuticals
PreclinicClinic/
RegistrationProduction
Sales & Marketing
Biotech
Specialty Pharmaceuticals
SANOCHEMIA
Sanochemia
Pharmazeutika AG
Board of Management:
CEO Dr. Werner Frantsits
CTO Anton Dallos
CMO Maria Popova
Sanochemia
Diagnostics UK Ltd.100%
Sanochemia
Diagnostics
International Ltd.
100%
Sanochemia
Corporation U.S.A
Sanochemia
Diagnostics
Deutschland GmbH
100% 100% 100%
Alvetra Werf f t
Sanochemia
Beijing Representative
Off ice
Specialty
pharmaceutical
company spanning the
entire length of the
value added chain
Sanochemia Pharmazeutika AG
www.cbseydlerresearch.ag
Close Brothers Seydler Research AG | 10
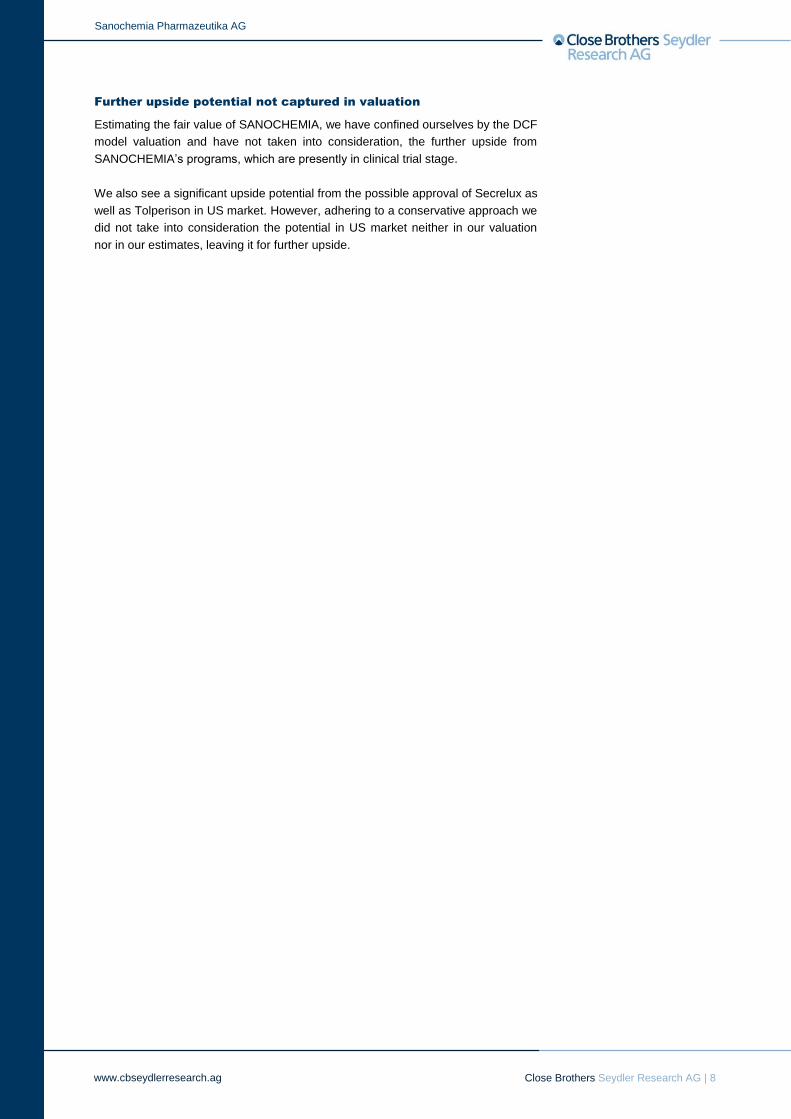
Shareholder structure
SANOCHMEIA has a plain shareholder structure. 60.2% are held by
SANOCHEMIA Ltd., while 39.8% are in the free floating.
Shareholders structure
Source: SANOCHEMIA Pharmazeutika AG; CBS Research AG;
Management board
Werner Frantsits, Chief Executive Officer / Chief Financial Officer
Mr. Frantsits, founder and for many years CEO of SANOCHEMIA Pharmazeutika
AG, again took up the position of Chief Executive Officer in September 2009, a role
in which saw him also responsible for the Group's financial affairs.
Anton Dallos, Chief Technical Officer
Having worked for the SANOCHEMIA Group for over 40 years, Anton Dallos is
currently Facility Manager in Neufeld. He has been a board member since 1998.
Maria Popova, Chief Marketing Officer
Maria Popova has worked at SANOCHEMIA since late 2007, having a long and
well-proven track record following her activities at a research institute and positions
at several major pharmaceutical companies.
Supervisory Board
Günter Kahler, Chairman of the Supervisory Board
Other Supervisory Board members:
Eveline Frantsits (Deputy Chair of the Supervisory Board)
Johannes M. Respondek
Heinrich Unger-Krayer
Richard Bock
39.8%
60.2%
Free Float
SANOCHEMIA Ltd.
39.8% free float

Sanochemia Pharmazeutika AG
www.cbseydlerresearch.ag
Close Brothers Seydler Research AG | 11
Business model
The striking difference between SANOCHEMIA and other conventional
biotechnology companies is that the bulk of sales are generated by current product
sales and contract manufacturing.
SANOCHEMIA‟s business model is based on three pillars: 1) Development and
production of innovative specialty pharmaceuticals, which covers such indications
as CNS/ Neurodegeneration; Pain and Oncology as well as diagnostics based on
imaging agents. The company is particularly well positioned in the diagnostics
segment; 2) APIs (Active Pharmaceutical Ingredients) synthesis for pharmaceutical
products. APIs syntheses comprises both APIs synthesis for SANOCHEMIA
products and contract manufacturing for third parties; 3) Manufacture and global
distribution of imaging agents (contrast media – used in all imaging-based medical
investigations) and diagnostics.
As a full-service provider of specialty pharmaceuticals SANOCHEMIA covers the
entire value chain including development, production, marketing and sales of
specialty pharmaceuticals. The company performs all stages of product
manufacture at its Neufeld plant. The existing product portfolio is backed by the
R&D pipeline which provides next generation products to broaden the portfolio.
Thus, the company‟s value potential comprises not only of currently ongoing
business, but also the mid- and long-term potential, provided by the company‟s
R&D pipeline.
SANOCHEMIA‟s activity is subdivided by four business segments: 1) HUMAN
PHAMRACEUTCIALS segment involves Radiology and Therapeutics and
generates the bulk of the company‟s sales 2) PRODUCTION segment comprises
Synthesis and Pharmaceutical production. 3) RESEARCH AND DEVELOPMENT
segment represents SANOCHEMIA‟s R&D activities. 4) New segment
VETERINARY PHARMACEUTICALS arose from acquisition of Alvetra & Werfft
GmbH. Alvetra annual sales total ~EUR 7m and have a positive operating income.
SANOCHEMIA market access
SANOCHEMIA has its own sales teams that deal with direct sales to hospitals and
doctors in Germany, UK and Austria. The Company also cooperates with
specialised distributors targeting radiologists, urologists, cardiologists and hospital
markets. At the same time, it also takes part in international tenders.
SANOCHEMIA‟s Austrian facilities function as a CMO (contract manufacturer) and
sell products to subsidiaries based on transfer prices.
Distribution channels
Source: SANOCHEMIA Pharmazeutika AG; CBS Research AG;
Sanochemia AG - CMO
*Company subsidiaries – SDD (Germany), SUK (UK), SDI (Switzerland), SanoCorp (USA)
Doctors, Hospitals
SDD, SUK, SDI,
SanoCorp USA*
Doctors, Hospitals.
International TenderDistributor
Diversified business
model
Full service provider of
specialty
pharmaceuticals
Four business
segments
Diversified distribution
channels provides
rapid market
penetration

Sanochemia Pharmazeutika AG
www.cbseydlerresearch.ag
Close Brothers Seydler Research AG | 12
Segment overview
Business segments
Source: SANOCHEMIA Pharmazeutika AG; CBS Research AG;
PRODUCTION segment
The PRODUCTION Division is engaged in the synthesis of active pharmaceutical
substances (APIs), drug formulation and pharmaceutical production. These
activities are performed either on behalf of the HUMAN PHARMACEUTICALS
Division or on a contract manufacturing basis for third parties. The range of
services provided by this division spans the chemical synthesis of innovative APIs
to the manufacture of drugs and clinical diagnostics. This division also includes
research and development expenditure and income relevant to production.
Synthesis: Operations related to API Synthesis (synthetic galantamine, contract,
synthesis, internal requirements) involve the development and production of APIs
ranging from establishing laboratory processes through up-scaling to industrial-
scale production.
Galantamine
The synthetic galantamine manufactured by SANOCHEMIA is used in a drug
marketed by Janssen and Shire as Reminyl® and Razadyne® in the treatment of
mild to moderate Alzheimer‟ disease. SANOCHEMIA holds exclusive production
contract with Janssen extending for the duration of the patent protection of API
synthesis process until 2014. galantamine generates the bulk of sales in
PRODUCTION segment.
The development of a new process for the manufacture of highly pure forms of
synthetic galantamine and its derivatives should provide the basis for the extension
of SANOCHEMIA‟s worldwide synthesis patent from 2014 until 2027. This new,
high-purity form of the product could potentially become the industry standard for
this substance. With this status the company would significantly strengthen its
competitive position, as it would require that any competitors would have to
demonstrate the same qualitative standards as those of SANOCHEMIA‟s high-
purity form. The awaited global patent protection on this process will make it difficult
for third parties to attain the new standard of quality.
The potential of galantamine as an API is, far greater than originally assumed. As a
result, this substance is being investigated around the world in a range of other
therapeutic options. Given its long and proven track record in the area of API
HUMAN PHARMACEUTICALS
Manufacture and global sales
of:
-Diagnostics
Radiology: Imaging agents,
-Therapeutics
Viveo® (Tolperison)
PRODUCTION
Manufacture of premium quality APIs and ready formulations:
-Synthesis
Production of premium APIs e.g. Galantamin
-Pharmaceutical production
-Contract manufacturing
VETERINARY PHARMACEUTICALS
Manufacture and global sales
of:
-Therapeutics
Alvegesic ®
Carofertin®Menbuton (Injectable
solution)
RESEARCH & DEVELOPMENT
-Pharmaceuticals
Tolperisone
PVP Hypericin
-DiagnosticsMR Lux/ MagnetoluxCyclo-Lux
SecreluxPVP Hypericin
PRODUCTION spans
the chemical synthesis
of innovative APIs to
the manufacture of
drugs and clinical
diagnostics
galantamine is the
main sales driver in
PRODUCTION segment
The awaited synthesis
patent extension for
galantamine should
extend the protection
until 2027

Sanochemia Pharmazeutika AG
www.cbseydlerresearch.ag
Close Brothers Seydler Research AG | 13
research, SANOCHEMIA was among the first to recognise the potential of
galantamine.
Pharmaceutical production: Production division also involves the
manufacture of sterile and semi-sterile injectables, suspensions and solutions.
Contract manufacturing
SANOCHEMIA has a long track record established through the manufacture of
around 200 products with the main focus on:
• Parenterals (injection and infusion solutions)
• Liquids (oral and rectal)
• A wide range of OTC products (gargles, ointments, creams and gels)
• Sterile eye ointments
• Topical ointments for human and veterinary medicine
HUMAN PHARMACEUTICALS segment
The manufacture and sale of HUMAN PHARMACEUTICALS has long been the
company‟s core business. The HUMAN PHARMACEUTICALS division is primarily
responsible for the Group's diagnostic activities. SANOCHEMIA‟s most important
radiological products include a range of x-ray/CT imaging agents and the MRT
imaging agent. The extension of SANOCHEMIA's product portfolio through the
inclusion of the therapeutic, tolperisone, has added to this segment's revenue-
generating potential. These products are marketed partly through subsidiaries
(SANOCHEMIA Diagnostics) and through agreements with selected marketing
partners.
Radiology – Diagnostics
The extensive portfolio of imaging agents for CT (Computer tomography) and MR
(Magnetic Resonance) includes ionic imaging agents, non-ionic imaging agents,
barium sulphates, MR imaging agents.
Range of radiological products
Source: SANOCHEMIA Pharmazeutika AG; CBS Research AG;
Therapeutics: tolperisone
Tolperisone is a centrally-acting muscle relaxant with an excellent efficacy and
safety profile. It mediates muscle relaxation without concomitant sedation.
Preparation/ Application X-ray CT MRT
Entire
body
Head
spine
Gastro-
intestinal
Kidney, heart,
vessels
Kidney,
urinary Pancreas
Barilux ® (barium sulphate) x x x
Colognost® (radio opaque
market) x x
Gastrolux ® (inonic contrast
medium) x x x
MR-Lux ® (paramagnetic contrast
medium) x x x x x x x
Secrelux ®(pancreas function
diagnostic) x x
Scanlux ®/Unilux ® (non-ionic
contrast medium) x x x x x x
Urolux Retro ® (ionic contrast
medium) x x
HUMAN
PHARMACEUTICALS -
core business
Broad range of
radiology products
Tolperisone adds to
the revenue-generating
potential of HUMAN
PHARMACEUTICALS
segment

Sanochemia Pharmazeutika AG
www.cbseydlerresearch.ag
Close Brothers Seydler Research AG | 14
According to company, tolperisone neither causes impairment of coordination,
weakness, mental confusion or withdrawal phenomena in contrast to other muscle
relaxants. Primary indications for tolperisone the treatment of muscle spasms
associated with neurological conditions such as stroke and multiple sclerosis.
VETERINARY PHARMACEUTICALS segment
This division encompasses all veterinary pharmaceuticals with main markets being
in Austria, Central and Eastern Europe, Middle East, and South Eastern Asia.
The main products of the veterinary pharmaceutical range of Alvetra are
Alvegesic®, a special painkiller for use after operations, and Carofertin®, a
biological product used to increase fertility in cattle and pigs. Both products are
approved in numerous markets.
RESEARCH & DEVELOPMENT segment
RESEARCH & DEVELOPMENT (R&D) Division focuses on identifying and
advancing substances for the treatment of CNS disorders and on the innovative
further development of tried-and tested substances. SANOCHEMIA‟s competitive
advantage lies in a combination of assessing the clinical potential of drug
candidates and in the speedy performance of pre-clinical and clinical trials.
This segment is mostly responsible for the company‟s own R&D activities. Only
minor externally-generated revenues have as yet been obtained through contract
R&D activities.
R&D pipeline
Source: SANOCHEMIA Pharmazeutika AG; CBS Research AG
Vidon (PVP Hypericin): (bladder cancer diagnostic): The efficient and early
diagnosis of bladder cancer is an important factor in the treatment of these
malignant tumours.
SANOCHEMIA has successfully completed a Phase IIa clinical trial with PVP
Hypericin in bladder cancer diagnostics. The final report confirmed the excellent
staining properties and the significantly improved parameters of Vidon® compared
RegistrationPhase IIIIndication Phase IIPhase IPre-clinic
Neurological indication
Neurological indication
+ acute muscle spasms
Phototherapy Bladder cancer
StatusProduct/
Project
Tolperisone
PVP hypericine
Pharmaceuticals
MR-Lux/ Magnetolux
Cyclo-Lux
Secrelux
PVP hypericine
MRT contrast medium
MRT contrast medium
Pancreas
Bladder cancer
Diagnostics
Registered & marketed in DE & CH, TR licensed
High purity quality- active substance & pill- indication
expansion
Development as a therapeutic
Marketed in DE & CH, EU DCP Phase completed in 15 countries
Galenic Development of macrocyclic MRT contrast agent
Line extension MRCP Indication:
S-MRCP study planned (start 2011)
Successful Phase IIa, Phase IIbstarted in 2011 .
New business
segment: Veterinary
Pharmaceuticals
R&D segment
represents long term
potential for the
company
PVP Hypericin in
bladder cancer
diagnostic

Sanochemia Pharmazeutika AG
www.cbseydlerresearch.ag
Close Brothers Seydler Research AG | 15
to the product already on the market. The study also did not reveal any side effects
worthy of mention.
The company recently launched a patient recruitment for a clinical Phase IIb trial for
the investigation of efficacy and safety profile of Vidon® (PVP-Hyperizin) for the
diagnostics of non-muscle invasive bladder carcinoma. Overall, 200 patient will be
enrolled in new centres in Austria and Germany. The trial endpoints is the
investigation of sensitivity and false positive rate of fluorescent supporting bladder
endoscopy with Vidon® in comparison to bladder endoscopy with white light. The
first patient was enrolled in the study at the end of October. The results are
expected to be published in spring 2013.
The recently started Phase IIb-Study and already completed monocentric clinical
trials provide the basis for further Phase III trial with VIdon. SANOCHEMIA intends
to launch the final market approval trial in 2013. With the advancing development in
Europe the company also plans to apply for market approval in US and other
markets.
Given that considerable demand exists for new and more efficient diagnostic
methods and taking into account that Vidon offers marked competitive advantages
over the product already on the market, a development success here would mean
enormous market potential for SANOCHEMIA in the mid-term. The progress made
to date is accelerating the search for licensing and marketing partners both in
Europe and the USA.
Secrelux: – already marketed in Germany and, as a result of its uniqueness,
available in many other countries on a named-patient basis – is currently the focus
of efforts to secure marketing authorisation in other important European markets,
including an extension to cover the area of magnetic resonance (SMRCP). The
rising demand for this product from radiologists and gastroenterologists is a clear
indication of the degree to which it is widely accepted and needed.
Cyclolux: Cyclolux is a galenic development project in the area of MRT contrast
media. With this program SANOCHEMIA is positioned in a particular area of
marcrocyclical MRT contrast media with low side effects. This novel product is a
good addition to SANOCHEMIA‟s product portfolio, given that currently in EU the
side effects profile of gadolinium-based MRT contrast media is of particular
significance for radiologist and cardiologist.
Phase IIb trial results
are expected in early
2013
Secrelux in pancreas
diagnostic: Searching
partner for further
development

Sanochemia Pharmazeutika AG
www.cbseydlerresearch.ag
Close Brothers Seydler Research AG | 16
Strategy
Internationalisation of radiology business
The main component of SANOCHEMIA‟s strategy is an intensive
internationalisation of its radiological business in the so-called pharmerging
markets. In terms of geographical focus the company targets growth markets in
Latin America, Middle East as well as selected markets of Africa and Asia. Also
Russia and US are likewise important markets for SANOCHEMIA. The entrance
into these markets will be executed either by direct sales or distribution
partnerships.
The rapid expansion into the above mentioned regions should relieve the
company‟s dependence on European markets, which are characterised by a
complicated regulatory environment, particularly Germany.
As mentioned above, distribution partnerships play an important role in
SANOCHEMIA‟s strategy. The company has already seen some success in
utilizing this strategy and established a number of partnerships that should drive the
Company‟s HUMAN PHARMACEUTICALS business (for more details see section
“Partnerships”).
SANOCHEMIA already generates 40% of its radiological revenues from exports.
The aim is to boost the current level of exports, currently at ~EUR 4.5m, by more
than 50%. This estimate is based on existing marketing authorisations, a steadily
growing product range and the continuous expansion of a network of strong, local
sales partnerships.
The signing of contracts with Iberoinvesa (Spain, Portugal, Latin America),
Gammamed Farm (Russia), Kish N.B.S. (Iran) and Halley (Italy) represents a major
step for the Company in these large, growing markets which will yield top and
bottom-line growth in the short- and mid-term. (For more details see section
“Partnerships”)
A further boost to sales revenues could come in the form of the launch of Scanlux
(iopamidol) in the US. Following the approval of the FDA for production in Neufeld,
SANOCHEMIA plans to launch this product in business year 2012/13 and generate
revenues of USD 3-5m in the first two years post-launch. Efforts are also continuing
to expand further in South American and Middle East markets. Through the
submission of a so-called GCC-DR (Gulf Cooperation Council – Drug Registration)
covering multiple Arabian markets, SANOCHEMIA aims to make rapid progress in
the Gulf States.
In addition to Scanlux, MR-lux represents another attractive product available for
global marketing. The next x-ray imaging agents, Gastrolux and Barilux, are also
set to follow.
MR-lux: SANOCHEMIA‟s imaging agent for MRT is also set to be marketed
globally. Following the successful conclusion of the regulatory procedure (DCP)
and the rapid preparation of European markets, other countries are already in the
pipeline – including important markets such as Iran, Latin America and, in the near
future, Russia.
SANOCHEMIA is also focusing on the development of follow-up products for the
diagnostics range. On the one hand, the company is specialising intensively in the
Internationalisation of
radiological business
is the key strategic
direction
The export share
should significantly
increase in the mid
term
US provides an
additional significant
potential in the mid-
and long-term
Sanochemia Pharmazeutika AG
www.cbseydlerresearch.ag
Close Brothers Seydler Research AG | 17
development of cancer diagnostics. With the products Secrelux and Vidon (PVP
Hypericin), SANOCHEMIA possessed two innovative product candidates with
enormous market potential. On the other, the company is working on an improved
MRT diagnostic – Cyclolux (For more details see section “R&D segment”).
Tolperisone marketing strategy: The company strategy with tolperisone implies
rapid access to target markets via national marketing authorisations. In Germany
and Switzerland, SANOCHEMIA's tolperisone formulation has already been
launched and is being successfully marketed, under the trademarks Viveo®
(Germany) and Tolcare® (Switzerland) by Orion Pharma.
In Turkey, tolperisone (Agileo®) is already at an advanced regulatory stage, and
the approval is expected in 2012, after which SANOCHEMIA‟s partner, EIP
Eczacibasi Ilac Pazarlama will launch the sale of the product.
Furthermore, the company has recently sealed the deal with Remedica, which will
be responsible for the distribution of tolperisone (Agileo®) in Egypt and so-called
MENA countries (For further detail see section “Partnerships”).
An additional focus lies on forging ahead with the US development with a strong
local partner. In the US market, tolperisone represents a so-called new chemical
entity (NCE) which would mean an enormous marketing advantage in a key sales
market. Furthermore, the company aims to expand its geographical footprint of this
product with an extensive network of partnerships outside EU (For further details
see section “Partnerships”).
Tolperisone: Rapid
access to target
markets
Sanochemia Pharmazeutika AG
www.cbseydlerresearch.ag
Close Brothers Seydler Research AG | 18
Partnerships
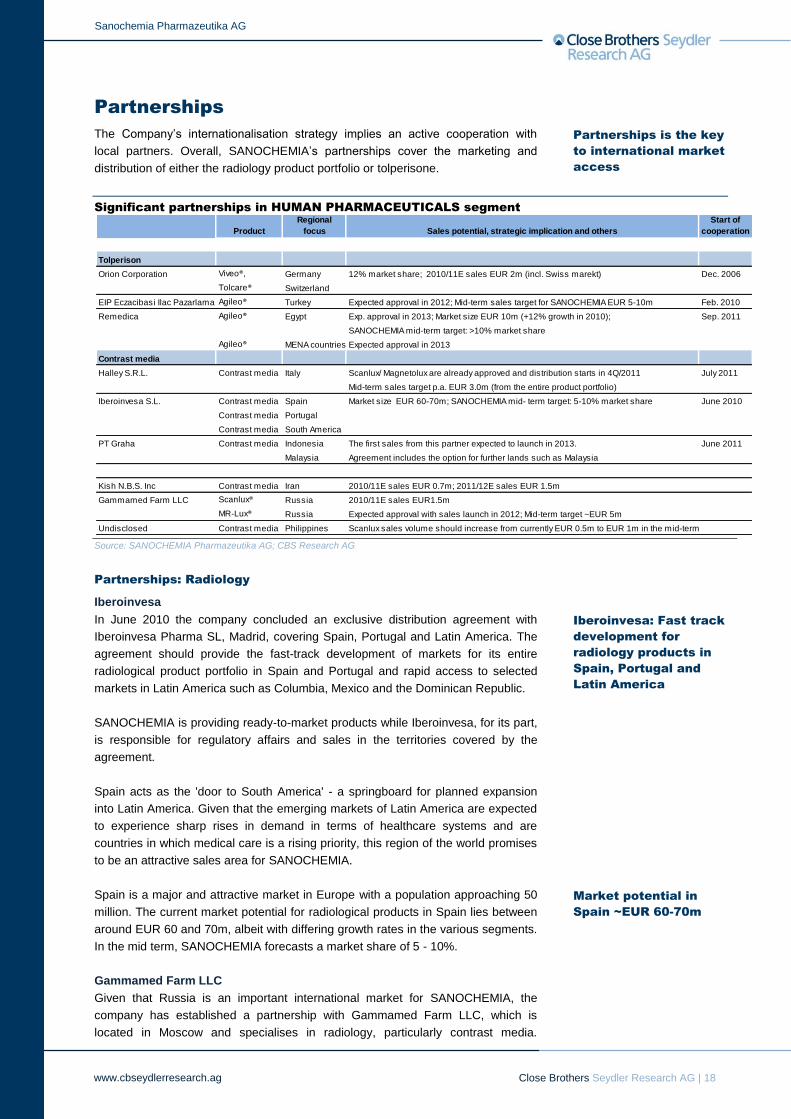
The Company‟s internationalisation strategy implies an active cooperation with
local partners. Overall, SANOCHEMIA‟s partnerships cover the marketing and
distribution of either the radiology product portfolio or tolperisone.
Significant partnerships in HUMAN PHARMACEUTICALS segment
Source: SANOCHEMIA Pharmazeutika AG; CBS Research AG Partnerships: Radiology
Iberoinvesa
In June 2010 the company concluded an exclusive distribution agreement with
Iberoinvesa Pharma SL, Madrid, covering Spain, Portugal and Latin America. The
agreement should provide the fast-track development of markets for its entire
radiological product portfolio in Spain and Portugal and rapid access to selected
markets in Latin America such as Columbia, Mexico and the Dominican Republic.
SANOCHEMIA is providing ready-to-market products while Iberoinvesa, for its part,
is responsible for regulatory affairs and sales in the territories covered by the
agreement.
Spain acts as the 'door to South America' - a springboard for planned expansion
into Latin America. Given that the emerging markets of Latin America are expected
to experience sharp rises in demand in terms of healthcare systems and are
countries in which medical care is a rising priority, this region of the world promises
to be an attractive sales area for SANOCHEMIA.
Spain is a major and attractive market in Europe with a population approaching 50
million. The current market potential for radiological products in Spain lies between
around EUR 60 and 70m, albeit with differing growth rates in the various segments.
In the mid term, SANOCHEMIA forecasts a market share of 5 - 10%.
Gammamed Farm LLC
Given that Russia is an important international market for SANOCHEMIA, the
company has established a partnership with Gammamed Farm LLC, which is
located in Moscow and specialises in radiology, particularly contrast media.
Product
Regional
focus Sales potential, strategic implication and others
Start of
cooperation
Tolperison
Orion Corporation , Tolcer in SwitzerlandViveo®, Germany 12% market share; 2010/11E sales EUR 2m (incl. Swiss marekt) Dec. 2006
Tolcare® Switzerland
EIP Eczacibasi Ilac Pazarlama Agileo® Turkey Expected approval in 2012; Mid-term sales target for SANOCHEMIA EUR 5-10m Feb. 2010
Remedica Agileo® Egypt Exp. approval in 2013; Market size EUR 10m (+12% growth in 2010); Sep. 2011
SANOCHEMIA mid-term target: >10% market share
Agileo® MENA countries Expected approval in 2013
Contrast media
Halley S.R.L. Contrast media Italy Scanlux/ Magnetolux are already approved and distribution starts in 4Q/2011 July 2011
Mid-term sales target p.a. EUR 3.0m (from the entire product portfolio)
Iberoinvesa S.L. Contrast media Spain Market size EUR 60-70m; SANOCHEMIA mid- term target: 5-10% market share June 2010
Contrast media Portugal
Contrast media South America
PT Graha Contrast media Indonesia The first sales from this partner expected to launch in 2013. June 2011
Malaysia Agreement includes the option for further lands such as Malaysia
Kish N.B.S. Inc Contrast media Iran 2010/11E sales EUR 0.7m; 2011/12E sales EUR 1.5m
Gammamed Farm LLC Scanlux® Russia 2010/11E sales EUR1.5m
MR-Lux® Russia Expected approval with sales launch in 2012; Mid-term target ~EUR 5m
Undisclosed Contrast media Philippines Scanlux sales volume should increase from currently EUR 0.5m to EUR 1m in the mid-term
Partnerships is the key
to international market
access
Iberoinvesa: Fast track
development for
radiology products in
Spain, Portugal and
Latin America
Market potential in
Spain ~EUR 60-70m

Sanochemia Pharmazeutika AG
www.cbseydlerresearch.ag
Close Brothers Seydler Research AG | 19
Recently SANOCHEMIA announced a large order from Russia to the amount of
EUR 3m for SANOCHEMIA‟s Scanlux of which EUR 1.5m will be generated in
2011. Furthermore, SANOCHEMIA expects the approval of its innovative contrast
media MR-lux®, with subsequent market launch in 2012. According to the
company, the mid-term sales target generated from this product is expected to
increase up to EUR 5m.
Halley S.R.L
In July 2011, SANOCHEMIA signed an agreement with an Italian company Halley
S.R.L. for distribution of SANOCHEMIA‟s portfolio for CT (computerised
tomography) and MRT (magnetic resonance). Moreover, SANOCHEMIA will also
distribute its Secrelux for diagnosis of pancreas lesions and tumours in the Italian
market.
SANOCHEMIA‟s leading contrast media Scanlux® and Magnetolux® are already
approved in Italy. The sales of these products will start in the near future, which will
be followed by the successive launches of further products from SANOCHEMIA‟s
radiology product portfolio. The company‟s mid-term sales target to be generated in
Italy is ~EUR 3m p.a.
Kish N.B.S.Inc,
SANOCHEMIA also has long-term contracts with its Iranian partner Kish N.B.S.Inc,
Tehran, which will market SANOCHEMIA‟s contrast medium in Iran. According to
SANOCHMEIA, a strong sales increase up to EUR 0.7m is expected for 2010/11
(PY: EUR 0.1m). For 2011/12, the company expects revenues from this partner to
total to EUR 1.5m.
PT Graha
In June 2011, SANOCHEMIA announced that it has signed an exclusive
distribution partnership with Indonesian PT Graha. The concluded cooperation,
which covers Indonesian and includes the option for further lands such as
Malaysia, represents an important step into one of the fastest growing markets in
Asia. The first sales from this partner expected to launch in 2013. The agreement
will include the approval and distribution of radiology products Scanlux, Magnetolux
and Secrelux.
Sankem Pharma
At the end of June 2011, the company announced a launch of contrast media sales
in Philippines. According to SANOCHEMIA, the sales volume for Scanlux in this
region should increase from currently EUR 0.5m to EUR 1m in the mid-term. The
company also asserts that the introduction of other products should further
contribute to the sales growth in this region.
Partnerships: tolperisone
Orion Corporation
In December 2006, SANOCHEMIA and Finnish pharmaceuticals company Orion
Corporation have concluded an exclusive agreement for the marketing and sale of
tolperisone in Germany and Switzerland. The agreement relates to a formulation of
tolperisone for use in the treatment of muscle spasm associated with neurological
conditions such as stroke and Multiple Sclerosis (MS).
Aside of the already received milestone payments SANOCHEMIA manufactures
and supplies Orion Corporation with the product for the duration of the agreement.
Halley: distribution
partner in Italy
Gammamed Farm:
Partner in Russian
market
Kish N.B.S.: First sales
from this partner are
expected in 2010/11
PT Graha: Distribution
partner in Indonesia
Sankem Pharma:
Partner in Philippines
Agreement with Orion:
First step in the
internationalisation of
Tolperisone

Sanochemia Pharmazeutika AG
www.cbseydlerresearch.ag
Close Brothers Seydler Research AG | 20
In Germany, tolperisone is marketed under the mark Viveo®, while in Switzerland
under the mark Tolcare®. The company expects to reach ~EUR 2m in both of
these markets in the ongoing year. Overall, SANOCHEMIA aims to achieve ~20%
of market share in EU countries where the product has marketing authorisation.
EIP Eczacibasi Ilac Pazarlama A.S.
SANOCHEMIA and the Turkish pharmaceuticals company EIP Eczacibasi Ilac
Pazarlama A.S. ("EIP") have signed an exclusive agreement relating to the
marketing and sale of Agileo® (tolperisone) in Turkey.
With a population about 73m inhabitants, Turkey is a so-called emerging market
with above-average growth. According to SANOCHEMIA, the sales potential in the
entire Turkish muscle relaxant market is ~EUR 90m (2008) and has increased by
more than 30% in recent years. The estimated sales volume for SANOCHEMIA‟s
dosage form can therefore be expected to range within EUR 5-10m in the mid-term.
Remedica
On 9 September 2011 SANOCHEMIA signed an exclusive agreement with
Remedica to market and distribute its drug Agileo® in Egypt and the countries in
the Middle East and North Africa (MENA). By 2013 Remedica expects to obtain
approval to offer Agileo in Egypt and MENA.
According to SANOCHEMIA, the Egyptian market for muscle relaxants amounts to
EUR 10m and in 2010 it grew by 12%. Given that the market is mostly dominated
by obsolete preparations while tolperisone represents a novel therapy,
SANOCHEMIA expects to rapidly gain market share of ~10% in the mid-term.
EPI Eczacibasi Ilac
Pazarlama: Partner for
distribution of
Tolperisone in Turkey
Remedica: Tolperisone
partner in Egypt and
MENA countries
Sanochemia Pharmazeutika AG
www.cbseydlerresearch.ag
Close Brothers Seydler Research AG | 21
Market environment
Imaging agents– Contrast Media
Contrast agents are used with many types of imaging examinations, including X-
ray/CT and MRT. They use different mechanisms depending on the underlying
imaging technique. Contrast agents implemented for CT based on X-ray allow the
creation of an artificial contrast between the organ or tissue under focus and
surrounding anatomic structures. Today, most of CT procedures require the use of
contrast agents.
The mode of action of MRT contrast media comprises of the electromagnetic
behaviour of tissues. Most MRT contrast agents are based on gadolinium.
While CT/ X-rays represents the standard procedure in modern diagnostics, MRT
contrast media represent modern technology, with a strong growth rate of >7% p.a.
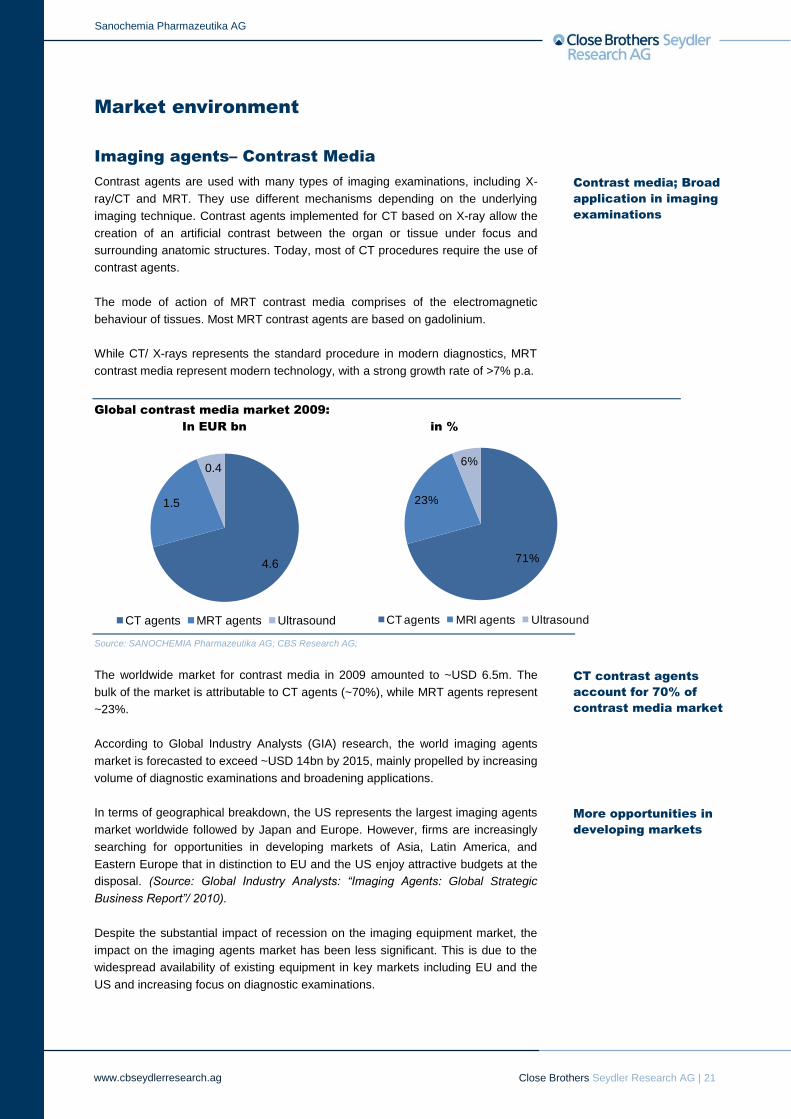
Global contrast media market 2009:
In EUR bn in %
Source: SANOCHEMIA Pharmazeutika AG; CBS Research AG;
The worldwide market for contrast media in 2009 amounted to ~USD 6.5m. The
bulk of the market is attributable to CT agents (~70%), while MRT agents represent
~23%.
According to Global Industry Analysts (GIA) research, the world imaging agents
market is forecasted to exceed ~USD 14bn by 2015, mainly propelled by increasing
volume of diagnostic examinations and broadening applications.
In terms of geographical breakdown, the US represents the largest imaging agents
market worldwide followed by Japan and Europe. However, firms are increasingly
searching for opportunities in developing markets of Asia, Latin America, and
Eastern Europe that in distinction to EU and the US enjoy attractive budgets at the
disposal. (Source: Global Industry Analysts: “Imaging Agents: Global Strategic
Business Report”/ 2010).
Despite the substantial impact of recession on the imaging equipment market, the
impact on the imaging agents market has been less significant. This is due to the
widespread availability of existing equipment in key markets including EU and the
US and increasing focus on diagnostic examinations.
4.6
1.5
0.4
CT agents MRT agents Ultrasound
71%
23%
6%
CT agents MRI agents Ultrasound
Contrast media; Broad
application in imaging
examinations
CT contrast agents
account for 70% of
contrast media market
More opportunities in
developing markets

Sanochemia Pharmazeutika AG
www.cbseydlerresearch.ag
Close Brothers Seydler Research AG | 22
Market drivers
Ageing populations are a strong demand driver for imaging agents, as
they are implemented in the diagnosis of such age-related diseases
including cancer, cardiovascular disease, and neurological disease.
The increasing installation of CT and MRT equipment all over the world
should support the contrast media market.
The need for non-invasive approaches in early diagnostic procedure
particularly in oncology is becoming important.
Competition among hospitals will force them to expand their services
including diagonsitics based on CT and MRT contrast media.
Competition
The market leader for contrast media is Bayer Schering Pharma (Germany), which
was a pioneering developer of contrast agents. There are also a number of several
well-established players in different market segments. Given the broad spectrum of
contrast media and agents, there are different companies that take leading
positions in different categories. To mention some of the market players: AMAG
Pharmaceuticals, Inc. (USA), Bayer Schering Pharma AG (Germany), Bracco
Group (Italy), Covidien (USA), GE Healthcare (UK), Guerbet Group (France) and
Lantheus Medical Imaging (USA).
Alzheimer’s disease (Galantamine)
Alzheimer‟s disease (AD) is the fastest growing CNS segment. Presently only two
classes of drugs are approved for Alzheimer‟s disease: Acetylcholin esterase
inhibitors (AChE-I) (for mild to moderate AD) and NMDA receptor anatagonists
(NMDA-I) (for moderate to severe AD). In the table below, the approved AD drugs
in both classes are briefly summarised.
Market for Alzheimer’s disease drugs
Source: SANOCHEMIA Pharmazeutika AG; CBS Research AG;
Among AChE-I AD drugs, AriceptTM
(API: donepezil) produced by Pfizer/Eisai
enjoys a US market share of ~50%. Novartis produces ExelonTM
(API: rivastigmine)
with a market share of ~10%. Finally J&J, Janssen, Shire produces RazadyneTM
/
ReminylTM
(API: galantamine) for a market share of ~10%.
Drug Marketed by API US market share
Aricept Pfizer/Eisai Donepezil Approx. 50%
Exelon Novartis Rivastigmine Approx. 10%
Razadyne/Reminyl J&J, Janssen, Shire Galantamine Approx. 10%
Drug Marketed by API US market share
Namenda/Axura/ Ebixa Forest, Lundbeck, Merz memantine Approx. 30%
Acetylcholine esterase inhibitors
NMDA receptor antagonist (NMDA-I)
Alzheimer’s disease -
the fastest growing
CNS segment
Aricept (Pfizer/Eisai)
takes the dominant
position in AD market

Sanochemia Pharmazeutika AG
www.cbseydlerresearch.ag
Close Brothers Seydler Research AG | 23
The rest of AD market is dominated by NMDA-I antagonist Namenda/Ebixa (Forest,
Lundbeck) with ~30% market share in the US. The table above outlines the drugs,
active pharmaceutical content, manufacturers and market share.
Sanochemia Pharmazeutika AG
www.cbseydlerresearch.ag
Close Brothers Seydler Research AG | 24
Financials
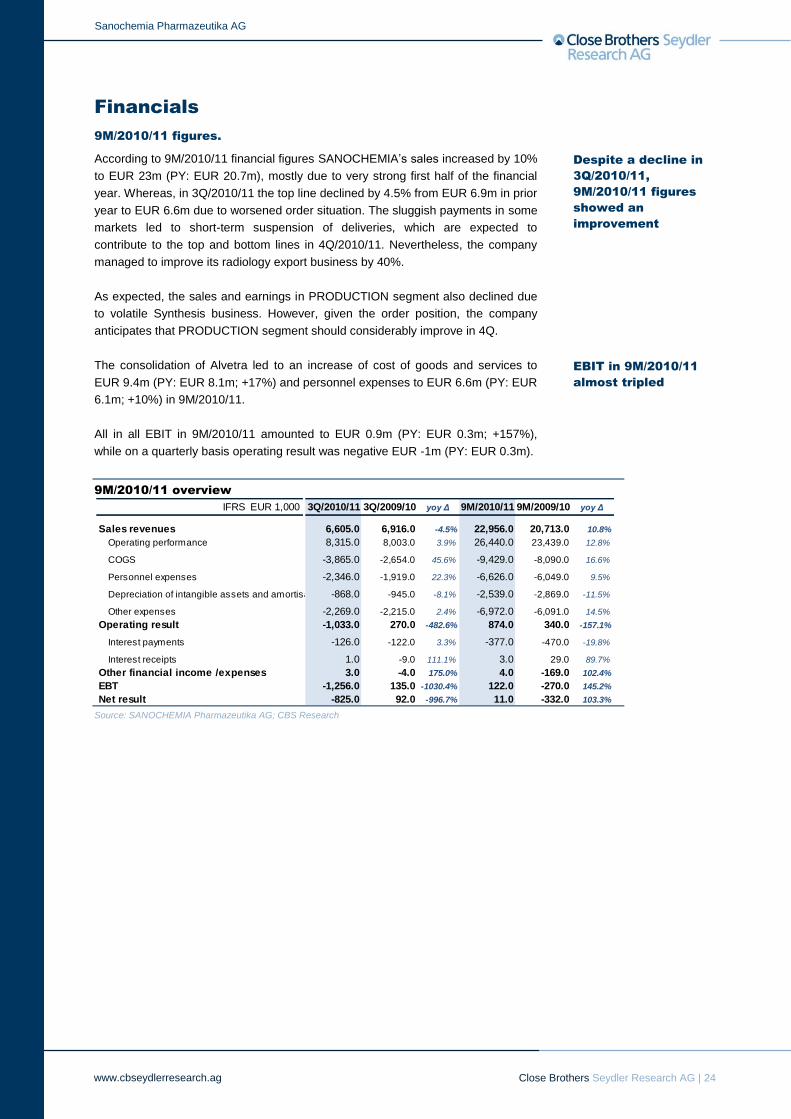
9M/2010/11 figures.
According to 9M/2010/11 financial figures SANOCHEMIA‟s sales increased by 10%
to EUR 23m (PY: EUR 20.7m), mostly due to very strong first half of the financial
year. Whereas, in 3Q/2010/11 the top line declined by 4.5% from EUR 6.9m in prior
year to EUR 6.6m due to worsened order situation. The sluggish payments in some
markets led to short-term suspension of deliveries, which are expected to
contribute to the top and bottom lines in 4Q/2010/11. Nevertheless, the company
managed to improve its radiology export business by 40%.
As expected, the sales and earnings in PRODUCTION segment also declined due
to volatile Synthesis business. However, given the order position, the company
anticipates that PRODUCTION segment should considerably improve in 4Q.
The consolidation of Alvetra led to an increase of cost of goods and services to
EUR 9.4m (PY: EUR 8.1m; +17%) and personnel expenses to EUR 6.6m (PY: EUR
6.1m; +10%) in 9M/2010/11.
All in all EBIT in 9M/2010/11 amounted to EUR 0.9m (PY: EUR 0.3m; +157%),
while on a quarterly basis operating result was negative EUR -1m (PY: EUR 0.3m).
9M/2010/11 overview
Source: SANOCHEMIA Pharmazeutika AG; CBS Research
IFRS EUR 1,000 3Q/2010/11 3Q/2009/10 yoy Δ 9M/2010/11 9M/2009/10 yoy Δ
Sales revenues 6,605.0 6,916.0 -4.5% 22,956.0 20,713.0 10.8%
Operating performance 8,315.0 8,003.0 3.9% 26,440.0 23,439.0 12.8%
COGS -3,865.0 -2,654.0 45.6% -9,429.0 -8,090.0 16.6%
Personnel expenses -2,346.0 -1,919.0 22.3% -6,626.0 -6,049.0 9.5%
Depreciation of intangible assets and amortisation of intangible assets-868.0 -945.0 -8.1% -2,539.0 -2,869.0 -11.5%
Other expenses -2,269.0 -2,215.0 2.4% -6,972.0 -6,091.0 14.5%
Operating result -1,033.0 270.0 -482.6% 874.0 340.0 -157.1%
Interest payments -126.0 -122.0 3.3% -377.0 -470.0 -19.8%
Interest receipts 1.0 -9.0 111.1% 3.0 29.0 89.7%
Other financial income /expenses 3.0 -4.0 175.0% 4.0 -169.0 102.4%
EBT -1,256.0 135.0 -1030.4% 122.0 -270.0 145.2%
Net result -825.0 92.0 -996.7% 11.0 -332.0 103.3%
Despite a decline in
3Q/2010/11,
9M/2010/11 figures
showed an
improvement
EBIT in 9M/2010/11
almost tripled

Sanochemia Pharmazeutika AG
www.cbseydlerresearch.ag
Close Brothers Seydler Research AG | 25
Financial forecast
Following the strategy to focus more on profitability rather than sales growth, the
SANOCHEMIA‟s sales in 2009/10 decreased by 8% to EUR 27.1m (PY: EUR
29.5m), while operating result improved by 73% from EUR -4.6m to EUR -1.3m.
While sales revenues in the entire HUMAN PHARMACEUTICALS segment
decreased by 12% to EUR 16.1m in 2009/10 (PY: EUR 18.3m), the export share
have considerably increased by 26% to EUR 4.5m (PY: EUR 3.6m), which
represented 28% of HUMAN PHARMACEUTICALS segment (PY: 20%). The
PRODUCTION segment in the mentioned period indicated a slight decline.
Export of radiology products should be the main growth driver
It is challenging to project SANOCHEMIA‟s sales, given that the development of
radiology export business largely depends on its partners. Despite concluded
agreements with numerous partners in international markets, there is a risk that
approval as well as sales launches in relevant markets might be delayed.
For 2010/11 we expect that the company will further increase its export share of
radiology products, which should boost sales in HUMAN PHARMACEUTICALS
segment. We anticipate the export share of this segment to increase by 53% to
EUR 6.6m (PY: EUR 4.5m), which will represent ~39% of the segment (PY: 29%).
Projected development of export sales in EUR m
Source: SANOCHEMIA Pharmazeutika AG; CBS Research AG; * Bulgaria, Greece, Italy, Malta, Slovakia,Slovenia, Spain and Cyprus; **
Oman, Syrien, United Arab Emirates, Iran; *** Georgia
0
3
6
9
12
15
2007/08 2008/09 2009/10 2010/11E 2011/12E 2012/13E 2013/14E
US
Central and South AmericaWestern Asia***
Russia
Middle East**
Europe (CEE and South Europe)*Asia
Africa
Σ 2.7Σ 3.6
Σ 4.5
Σ 6.9
Σ 9.9
Σ 12.2
Σ 14.1
Radiology export projection
2007/08 2008/09 2009/10 2010/11E 2011/12E 2012/13E 2013/14E CAGR 11E-14E
Africa 1.2 1.3 1.3 1.6 2.2 2.5 2.8 20%
as % of total export 44% 37% 30% 24% 22% 20% 20%
yoy change n.a. 9% 1% 23% 33% 15% 13%
Asia 0.0 0.0 0.1 0.1 0.5 0.8 1.1 130%
as % of total export 0% 0% 2% 1% 5% 7% 8%
yoy change n.a. 10% 549% 9% 456% 60% 38%
Europe (CEE and South Europe)* 1.2 1.6 1.8 2.8 3.8 4.7 5.4 25%
as % of total export 44% 44% 40% 41% 39% 38% 38%
yoy change n.a. 31% 14% 55% 36% 23% 16%
Middle East** 0.1 0.1 0.5 0.5 1.3 1.5 1.5 43%
as % of total export 2% 4% 10% 7% 13% 12% 10%
yoy change n.a. 144% 220% 9% 164% 10% 1%
Russia 0.0 0.1 0.1 1.0 1.0 1.3 1.6 18%
as % of total export 0% 4% 3% 14% 10% 10% 11%
yoy change n.a. n.a. 2% 565% 6% 28% 21%
Western Asia*** 0.1 0.2 0.0 0.1 0.2 0.2 0.2 22%
as % of total export 3% 5% 1% 2% 2% 2% 1%
yoy change n.a. 152% -74% 130% 79% 0% 1%
Central and South America 0.2 0.2 0.6 0.8 0.9 0.9 1.1 11%
as % of total export 6% 6% 14% 12% 9% 8% 8%
yoy change n.a. 18% 208% 27% 10% 5% 20%
US 0.0 0.0 0.0 0.0 0.0 0.4 0.5 n.a.
as % of total export 0% 0% 0% 0% 0% 3% 3%
yoy change n.a. n.a. n.a. n.a. n.a. n.a. 18%
Total Export 2.7 3.6 4.5 6.9 9.9 12.2 14.1 27%
Improved operating
result despite sales
decline in 2009/10
Sanochemia Pharmazeutika AG
www.cbseydlerresearch.ag
Close Brothers Seydler Research AG | 26
The signs for such an aggressive assumption of export growth were already visible
in 9M/2010/11 results. Particularly, sales in Russia, Europe (CEE and South
Europe) and Africa should considerably propel the export share of radiology
products.
Furthermore, aside of above mentioned regions, Middle East as well as Central and
South America are expected to significantly contribute to the SANOCHEMIA‟s
export business in the medium term. In terms of growth Asia and Middle East are
forecast to be the most intensive regions with estimated CAGR of 130% and 43%
over 2010/11E-13/14E respectively.
Thus, we assume that aggressive expansion into emerging markets should be the
main driver of segment growth. Furthermore, we forecast the export of radiology
products to continue its growth at rapid pace reaching above 50% of HUMAN
PHARMACEUTICALS segment in the mid-term. We estimate CAGR of 27% and
15% of sales growth for the period over 2010/11E-13/14E for export and HUMAN
PHARMACEUTICALS respectively.
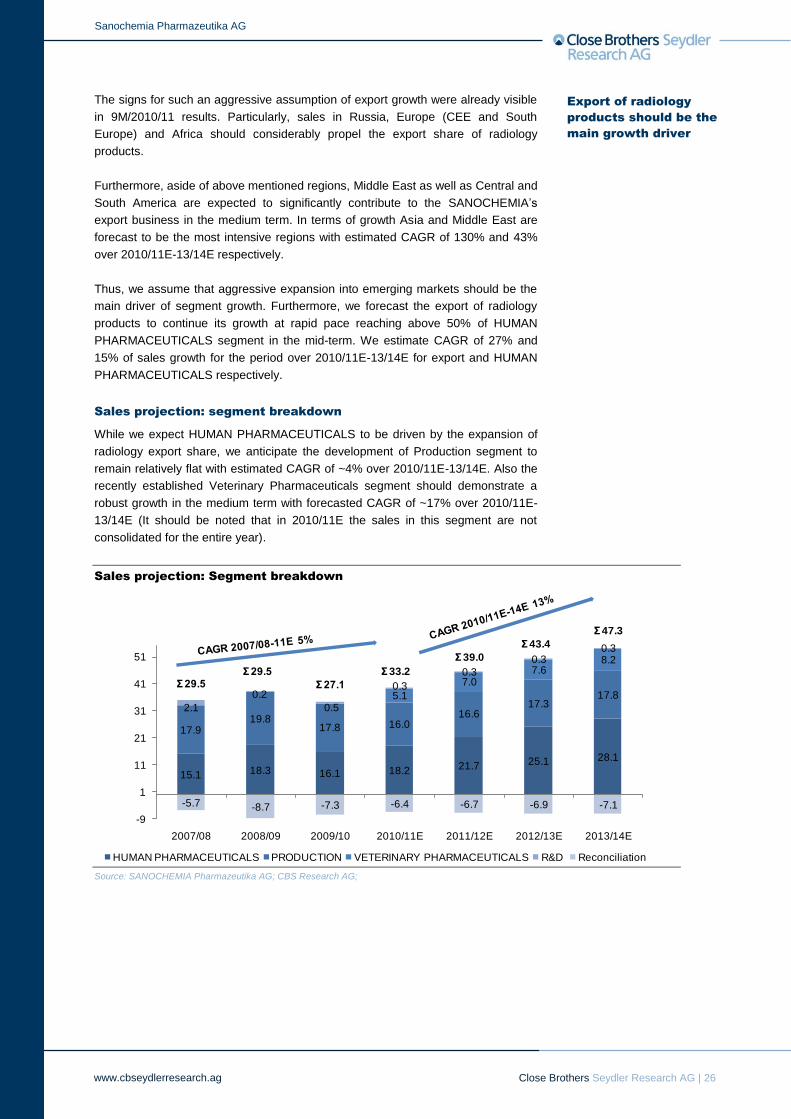
Sales projection: segment breakdown
While we expect HUMAN PHARMACEUTICALS to be driven by the expansion of
radiology export share, we anticipate the development of Production segment to
remain relatively flat with estimated CAGR of ~4% over 2010/11E-13/14E. Also the
recently established Veterinary Pharmaceuticals segment should demonstrate a
robust growth in the medium term with forecasted CAGR of ~17% over 2010/11E-
13/14E (It should be noted that in 2010/11E the sales in this segment are not
consolidated for the entire year).
Sales projection: Segment breakdown
Source: SANOCHEMIA Pharmazeutika AG; CBS Research AG;
15.1 18.3 16.1 18.2 21.7 25.1 28.1
17.919.8
17.8 16.016.6
17.317.85.1
7.07.6
8.2
2.1
0.2
0.5
0.3
0.3
0.30.3
-5.7 -8.7 -7.3 -6.4 -6.7 -6.9 -7.1
-9
1
11
21
31
41
51
2007/08 2008/09 2009/10 2010/11E 2011/12E 2012/13E 2013/14E
HUMAN PHARMACEUTICALS PRODUCTION VETERINARY PHARMACEUTICALS R&D Reconciliation
Σ 29.5Σ 29.5
Σ 27.1
Σ 33.2
Σ 39.0
Σ 43.4
Σ 47.3
Export of radiology
products should be the
main growth driver
Sanochemia Pharmazeutika AG
www.cbseydlerresearch.ag
Close Brothers Seydler Research AG | 27
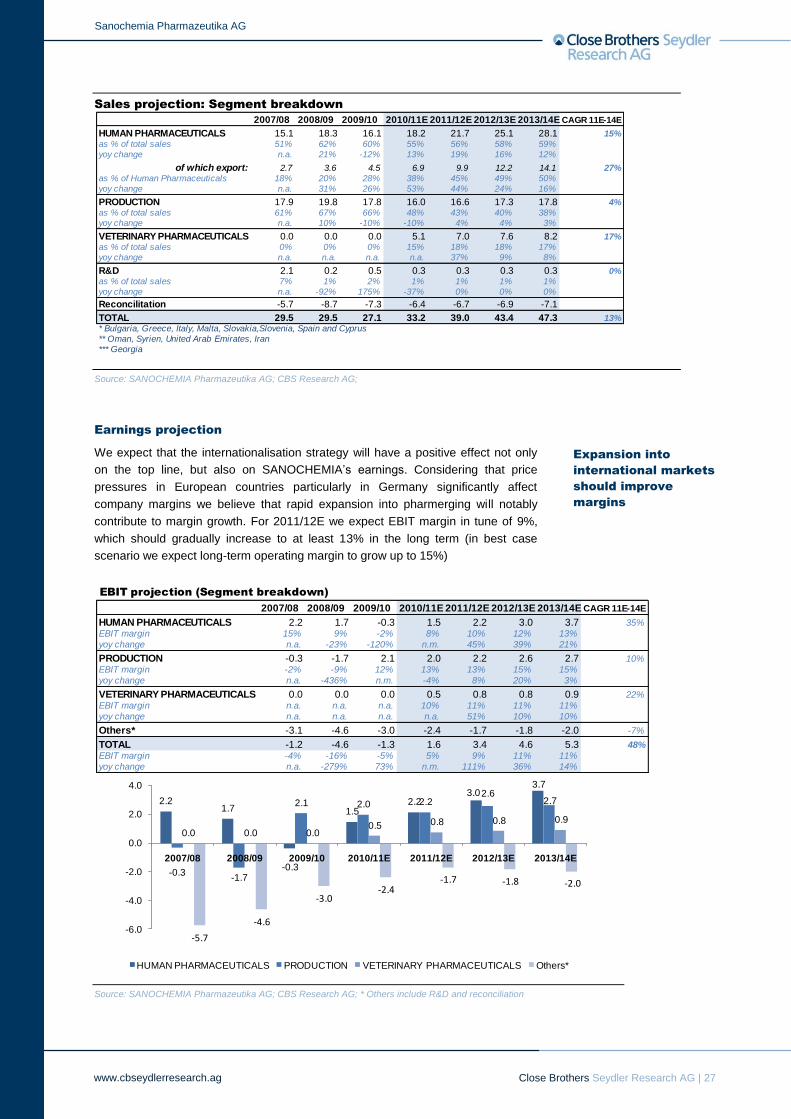
Sales projection: Segment breakdown
Source: SANOCHEMIA Pharmazeutika AG; CBS Research AG;
Earnings projection
We expect that the internationalisation strategy will have a positive effect not only
on the top line, but also on SANOCHEMIA‟s earnings. Considering that price
pressures in European countries particularly in Germany significantly affect
company margins we believe that rapid expansion into pharmerging will notably
contribute to margin growth. For 2011/12E we expect EBIT margin in tune of 9%,
which should gradually increase to at least 13% in the long term (in best case
scenario we expect long-term operating margin to grow up to 15%)
Source: SANOCHEMIA Pharmazeutika AG; CBS Research AG; * Others include R&D and reconciliation
2007/08 2008/09 2009/10 2010/11E 2011/12E 2012/13E 2013/14E CAGR 11E-14E
HUMAN PHARMACEUTICALS 15.1 18.3 16.1 18.2 21.7 25.1 28.1 15%
as % of total sales 51% 62% 60% 55% 56% 58% 59%
yoy change n.a. 21% -12% 13% 19% 16% 12%
of which export: 2.7 3.6 4.5 6.9 9.9 12.2 14.1 27%
as % of Human Pharmaceuticals 18% 20% 28% 38% 45% 49% 50%
yoy change n.a. 31% 26% 53% 44% 24% 16%
PRODUCTION 17.9 19.8 17.8 16.0 16.6 17.3 17.8 4%
as % of total sales 61% 67% 66% 48% 43% 40% 38%
yoy change n.a. 10% -10% -10% 4% 4% 3%
VETERINARY PHARMACEUTICALS 0.0 0.0 0.0 5.1 7.0 7.6 8.2 17%
as % of total sales 0% 0% 0% 15% 18% 18% 17%
yoy change n.a. n.a. n.a. n.a. 37% 9% 8%
R&D 2.1 0.2 0.5 0.3 0.3 0.3 0.3 0%
as % of total sales 7% 1% 2% 1% 1% 1% 1%
yoy change n.a. -92% 175% -37% 0% 0% 0%
Reconcilitation -5.7 -8.7 -7.3 -6.4 -6.7 -6.9 -7.1
TOTAL 29.5 29.5 27.1 33.2 39.0 43.4 47.3 13%
* Bulgaria, Greece, Italy, Malta, Slovakia,Slovenia, Spain and Cyprus
** Oman, Syrien, United Arab Emirates, Iran
*** Georgia
EBIT projection (Segment breakdown)
2007/08 2008/09 2009/10 2010/11E 2011/12E 2012/13E 2013/14E CAGR 11E-14E
HUMAN PHARMACEUTICALS 2.2 1.7 -0.3 1.5 2.2 3.0 3.7 35%
EBIT margin 15% 9% -2% 8% 10% 12% 13%
yoy change n.a. -23% -120% n.m. 45% 39% 21%
PRODUCTION -0.3 -1.7 2.1 2.0 2.2 2.6 2.7 10%
EBIT margin -2% -9% 12% 13% 13% 15% 15%
yoy change n.a. -436% n.m. -4% 8% 20% 3%
VETERINARY PHARMACEUTICALS 0.0 0.0 0.0 0.5 0.8 0.8 0.9 22%
EBIT margin n.a. n.a. n.a. 10% 11% 11% 11%
yoy change n.a. n.a. n.a. n.a. 51% 10% 10%
Others* -3.1 -4.6 -3.0 -2.4 -1.7 -1.8 -2.0 -7%
TOTAL -1.2 -4.6 -1.3 1.6 3.4 4.6 5.3 48%
EBIT margin -4% -16% -5% 5% 9% 11% 11%
yoy change n.a. -279% 73% n.m. 111% 36% 14%
2.21.7
-0.3
1.52.2
3.03.7
-0.3-1.7
2.1 2.0 2.22.6
2.7
0.0 0.0 0.00.5 0.8 0.8 0.9
-5.7
-4.6
-3.0-2.4
-1.7 -1.8 -2.0
-6.0
-4.0
-2.0
0.0
2.0
4.0
2007/08 2008/09 2009/10 2010/11E 2011/12E 2012/13E 2013/14E
HUMAN PHARMACEUTICALS PRODUCTION VETERINARY PHARMACEUTICALS Others*
Expansion into
international markets
should improve
margins

Sanochemia Pharmazeutika AG
www.cbseydlerresearch.ag
Close Brothers Seydler Research AG | 28
Cash, free cash flow and operating result
Source: SANOCHEMIA Pharmazeutika AG; CBS Research AG;
14.3
6.3
0.9
4.6 4.86.2
9.5
0.0
3.0
6.0
9.0
12.0
15.0
2007/08 2008/09 2009/10 2010/11E 2011/12E 2012/13E 2013/14E
Cash position
-1.2
-4.6
-1.3
1.63.4 4.1 4.8
-8.4
-13.0
4.2
1.2
3.61.5
3.3
-14.0
-11.0
-8.0
-5.0
-2.0
1.0
4.0
2007/08 2008/09 2009/10 2010/11E 2011/12E 2012/13E 2013/14E
Operating result Free cash flow
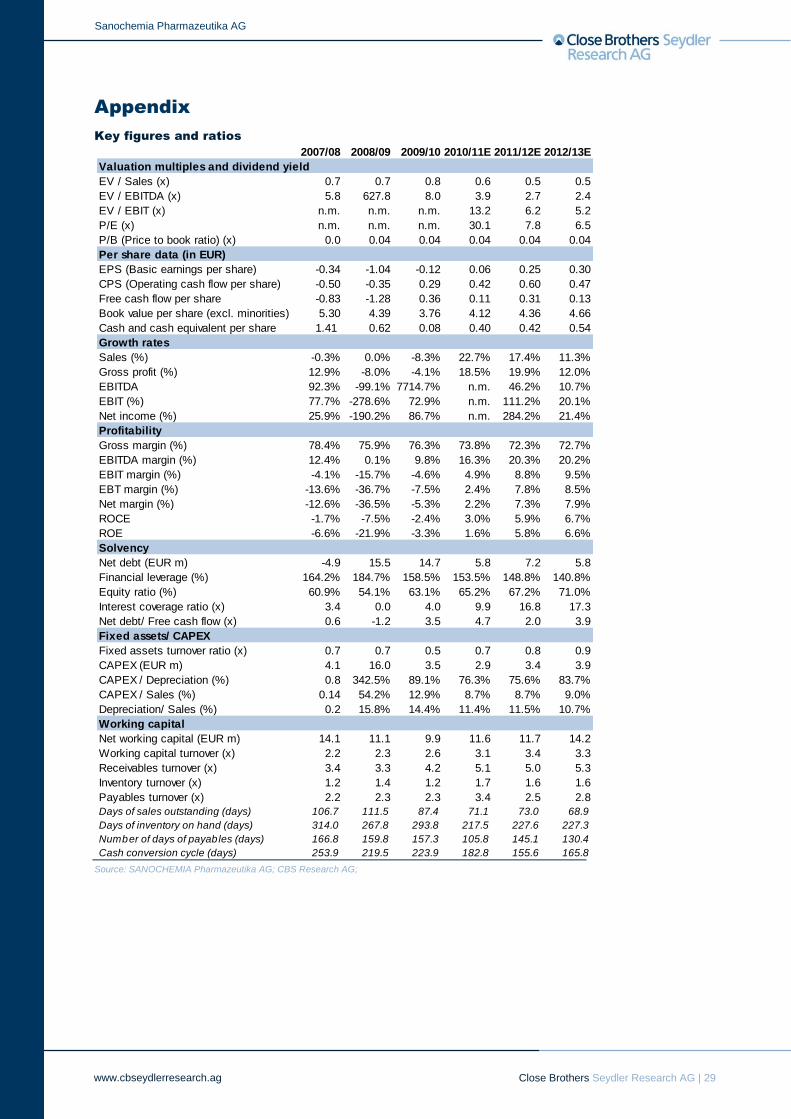
Sanochemia Pharmazeutika AG
www.cbseydlerresearch.ag
Close Brothers Seydler Research AG | 29
Appendix
Key figures and ratios
Source: SANOCHEMIA Pharmazeutika AG; CBS Research AG;
2007/08 2008/09 2009/10 2010/11E 2011/12E 2012/13E
Valuation multiples and dividend yield
EV / Sales (x) 0.7 0.7 0.8 0.6 0.5 0.5
EV / EBITDA (x) 5.8 627.8 8.0 3.9 2.7 2.4
EV / EBIT (x) n.m. n.m. n.m. 13.2 6.2 5.2
P/E (x) n.m. n.m. n.m. 30.1 7.8 6.5
P/B (Price to book ratio) (x) 0.0 0.04 0.04 0.04 0.04 0.04
Per share data (in EUR)
EPS (Basic earnings per share) -0.34 -1.04 -0.12 0.06 0.25 0.30
CPS (Operating cash flow per share) -0.50 -0.35 0.29 0.42 0.60 0.47
Free cash flow per share -0.83 -1.28 0.36 0.11 0.31 0.13
Book value per share (excl. minorities) 5.30 4.39 3.76 4.12 4.36 4.66
Cash and cash equivalent per share 1.41 0.62 0.08 0.40 0.42 0.54
Growth rates
Sales (%) -0.3% 0.0% -8.3% 22.7% 17.4% 11.3%
Gross profit (%) 12.9% -8.0% -4.1% 18.5% 19.9% 12.0%
EBITDA 92.3% -99.1% 7714.7% n.m. 46.2% 10.7%
EBIT (%) 77.7% -278.6% 72.9% n.m. 111.2% 20.1%
Net income (%) 25.9% -190.2% 86.7% n.m. 284.2% 21.4%
Profitability
Gross margin (%) 78.4% 75.9% 76.3% 73.8% 72.3% 72.7%
EBITDA margin (%) 12.4% 0.1% 9.8% 16.3% 20.3% 20.2%
EBIT margin (%) -4.1% -15.7% -4.6% 4.9% 8.8% 9.5%
EBT margin (%) -13.6% -36.7% -7.5% 2.4% 7.8% 8.5%
Net margin (%) -12.6% -36.5% -5.3% 2.2% 7.3% 7.9%
ROCE -1.7% -7.5% -2.4% 3.0% 5.9% 6.7%
ROE -6.6% -21.9% -3.3% 1.6% 5.8% 6.6%
Solvency
Net debt (EUR m) -4.9 15.5 14.7 5.8 7.2 5.8
Financial leverage (%) 164.2% 184.7% 158.5% 153.5% 148.8% 140.8%
Equity ratio (%) 60.9% 54.1% 63.1% 65.2% 67.2% 71.0%
Interest coverage ratio (x) 3.4 0.0 4.0 9.9 16.8 17.3
Net debt/ Free cash flow (x) 0.6 -1.2 3.5 4.7 2.0 3.9
Fixed assets/ CAPEX
Fixed assets turnover ratio (x) 0.7 0.7 0.5 0.7 0.8 0.9
CAPEX (EUR m) 4.1 16.0 3.5 2.9 3.4 3.9
CAPEX / Depreciation (%) 0.8 342.5% 89.1% 76.3% 75.6% 83.7%
CAPEX / Sales (%) 0.14 54.2% 12.9% 8.7% 8.7% 9.0%
Depreciation/ Sales (%) 0.2 15.8% 14.4% 11.4% 11.5% 10.7%
Working capital
Net working capital (EUR m) 14.1 11.1 9.9 11.6 11.7 14.2
Working capital turnover (x) 2.2 2.3 2.6 3.1 3.4 3.3
Receivables turnover (x) 3.4 3.3 4.2 5.1 5.0 5.3
Inventory turnover (x) 1.2 1.4 1.2 1.7 1.6 1.6
Payables turnover (x) 2.2 2.3 2.3 3.4 2.5 2.8
Days of sales outstanding (days) 106.7 111.5 87.4 71.1 73.0 68.9
Days of inventory on hand (days) 314.0 267.8 293.8 217.5 227.6 227.3
Number of days of payables (days) 166.8 159.8 157.3 105.8 145.1 130.4
Cash conversion cycle (days) 253.9 219.5 223.9 182.8 155.6 165.8

Sanochemia Pharmazeutika AG
www.cbseydlerresearch.ag
Close Brothers Seydler Research AG | 30
Source: SANOCHEMIA Pharmazeutika AG; CBS Research AG;
Profit and loss account
IFRS EUR 1,000 2007/08 2008/09 2009/10 2010/11E 2011/12E 2012/13E
Sales revenues 29,531.0 29,527.0 27,090.0 33,236.9 39,029.7 43,441.2
YoY growth 0% 0% -8% 23% 17% 11%
Other income 3,547.0 3,091.0 2,728.0 3,000.0 3,000.0 3,300.0
Reversal of investment grants 177.0 180.0 207.0 212.0 220.0 230.0
Change in inventory -704.0 146.0 49.0 700.0 400.0 500.0
Own work capitalised 1,389.0 1,725.0 1,144.0 1,000.0 1,100.0 1,210.0
Operating performance 33,940.0 34,669.0 31,218.0 38,148.9 43,749.7 48,681.2
COGS -10,775.0 -12,268.0 -10,547.0 -13,627.1 -15,522.1 -17,103.8
Personnel expenses -9,052.0 -9,590.0 -7,960.0 -9,600.0 -10,935.0 -12,171.0
Depreciation and amortisation -4,892.0 -4,672.0 -3,914.0 -3,800.0 -4,500.0 -4,657.0
Other expenses -10,446.0 -12,777.0 -10,054.0 -9,500.0 -9,367.1 -10,634.4
Operating result -1,225.0 -4,638.0 -1,257.0 1,621.7 3,425.5 4,115.0
Interest payments -1,079.0 -1,815.0 -663.0 -550.0 -473.1 -506.9
Interest receipts 1,366.0 980.0 577.0 100.0 105.1 105.1
Other financial income /expenses -3,086.0 -5,361.0 -681.0 -376.0 0.0 0.0
Financial result -2,799.0 -6,196.0 -767.0 -826.0 -368.0 -401.7
EBT -4,024.0 -10,834.0 -2,024.0 795.7 3,057.5 3,713.3
Income tax expense 315.0 69.0 593.0 -55.7 -214.0 -259.9
Net result -3,709.0 -10,765.3 -1,431.0 740.0 2,843.5 3,453.4
Shareholders of the parent company -3,449.0 -10,587.3 -1,366.0 690.0 2,793.5 3,403.4
0.0 0.0 0.0 0.0 0.0 0.0
Minority interests -260.0 -178.0 -65.0 50.0 50.0 50.0
Weighted average number of shares
outstanding (in thousands) 10,156 10,156 11,556 11,556 11,556 11,556
EPS (diluted and basic) -0.34 -1.04 -0.12 0.06 0.24 0.29

Sanochemia Pharmazeutika AG
www.cbseydlerresearch.ag
Close Brothers Seydler Research AG | 31
Source: SANOCHEMIA Pharmazeutika AG; CBS Research AG;
Balance Sheets
IFRSEUR 1,000 2007/08 2008/09 2009/10 2010/11E 2011/12E 2012/13E
Assets
Noncurrent assets 42,777 51,677 52,245 51,745 50,745 50,108
as % of total assets 48.1% 63.3% 76.7% 70.9% 67.6% 66.1%
Property, Plant and Equipment 17,799 29,043 28,954 28,454 28,154 28,054
Total Intangible Assets 21,956 21,991 21,726 21,891 21,091 20,434
Other financial assets 2,346 0 0 0 0 0
Deferred tax assets 676 643 1,565 1,400 1,500 1,620
Total Current Assets 46,091 30,023 15,884 21,258 24,277 25,751
as % of total assets 51.9% 36.7% 23.3% 29.1% 32.4% 33.9%
Inventory 8,783 9,221 7,759 8,484 10,873 10,429
Accounts receivable trade 5,519 5,724 3,634 6,034 6,383 6,808
Accounts receivable-affiliated companies 4,849 1,941 1,673 1,600 1,600 1,600
Other financial receivables 284 1,094 500 0 0 0
Other receivables and assets 1,092 1,707 1,230 500 600 700
Income tax receivables 296 13 6 0 0 0
Receivables from research grants 250 613 123 0 0 0
Available for sale securities 10,722 3,381 21 0 0 0
Cash and cash equivalents 14,296 6,329 938 4,639 4,821 6,213
Total assets 88,868 81,700 68,129 73,003 75,022 75,859
Shareholders´ equity and liabilities
Shareholders equity 54,109 44,233 42,987 47,570 50,414 53,867
as % of total equity and liabilities 60.9% 54.1% 63.1% 65.2% 67.2% 71.0%
Issued capital 10,156 10,156 10,156 11,556 11,556 11,556
Share premium 24,768 14,443 14,443 17,023 17,023 17,023
Net gain/loss on available for sale securities -440 -118 1 0 0 0
Currency translation differences 463 1,030 1,096 910 860 810
Profit and loss account 18,863 19,122 17,756 18,496 21,340 24,793
Minority interests 299 -400 -465 -415 -365 -315
Current liabilities 18,094 29,386 16,070 16,532 15,258 12,692as % of total equity and liabilities 20.4% 36.0% 23.6% 22.6% 20.3% 16.7%
Financial liabilities 8,433 21,088 10,266 5,000 6,000 6,000
Accounts payable trade 5,034 5,739 3,126 4,543 7,158 4,592
Other financial liabilities 2,521 0 835 4,782 0 0
Other liabilities and accruals 1,061 1,644 1,289 1,500 1,400 1,400
Deferred income 721 626 330 400 400 400
Investment grants 144 149 207 207 200 200
Income tax liabilities 180 140 16 100 100 100
Noncurrent liabilities 16,665 8,081 9,072 8,900 9,350 9,300as % of total equity and liabilities 18.8% 9.9% 13.3% 12.2% 12.5% 12.3%
Financial liabilities 11,720 4,080 5,375 5,400 6,000 6,000
Employee benefit provisions 1,308 1,097 1,209 1,400 1,450 1,500
Deferred income 2,442 1,459 1,282 1,100 1,100 1,100
Investment grants 1,195 1,445 1,206 1,000 800 700
Total equity and liabilities 88,868 81,700 68,129 73,003 75,022 75,859

Sanochemia Pharmazeutika AG
www.cbseydlerresearch.ag
Close Brothers Seydler Research AG | 32
Source: SANOCHEMIA Pharmazeutika AG; CBS Research AG;
SANOCHEMIA Pharmazeutika
Cash flow statement
IFRS EUR 1,000 2007/08 2008/09 2009/10 2010/11E 2011/12E 2012/13E
Net income before taxes -4,024 -10,834 -2,024 796 3,058 3,713
Depreciation, amortisation and write down of
tangible and intagible assets 4,892 4,672 3,914 3,800 4,500 4,657
0 0 0 0 0 0
Proceeds from the disposal of tangible and 15 2 -10 0 0 0
Income from the disposal of securities -104 1,170 189 0 0 0
Interest payments 1,079 1,815 663 550 473 507
Interest receipts -1,366 -980 -577 -100 -105 -105
Purchase of securities -105 -107 -20 0 0 0
Net gain/ loss through foreign currency
translation 452 603 -5 0 0 0
Reversal of investment grants -263 254 -181 0 0 0
Change in inventories 970 -438 1,462 -725 -2,389 444
Change in receivables and other assets -3,752 2,810 2,997 -1,097 -449 -525
Change in receivables from research grants 292 -363 489 123 0 0
Change in accounts payable incl. those due
to affiliated companies 1,202 703 -1,778 1,417 2,615 -2,566
Change in other liabilities and accruals -4,435 -2,996 -805 99 -100 0
Change in provisions for employee benefits 141 -211 112 191 50 50
Cash outflow from operating activities -5,006 -3,900 4,426 5,054 7,653 6,174
Interest payments -1,049 -900 -683 -550 -473 -507
Interest receipts 1,283 819 83 100 105 105
Receipts from the sale of securities 137 152 71 0 0 0
Income tax paid -404 236 -502 199 -314 -380
Net cash used in/from operating activites -5,039 -3,593 3,395 4,803 6,971 5,393
Purchase of intangible assets -1,380 -2,322 -967 -1,465 -1,100 -1,300
Purchase of tangible assets -2,511 -13,669 -1,648 -2,000 -2,300 -2,600
Purchase of securities -4,164 -6 0 21 0 0
Receipts from the disposal of tangible assets 85 1 46 0 0 0
Receipts from the disposal of available for sale securities 4,595 6,606 3,329 0 0 0
Cash inflow from the acquisition of subsidiaries 0 0 0 670 0 0
Cash outflow associated with the deconsolidation of subsidiary 0 0 0 -808 0 0
Net cash outflow from investing activities -3,375 -9,390 760 -3,582 -3,400 -3,900
Change in current borrowings 288 6,195 -5,994 -1,319 -3,782 0
Change in non-current borrowings. -222 -671 -3,533 25 600 0
Change in research grants -1,684 -508 0 -206 -207 -100
Capital increase 0 0 0 3,980 0 0
Cash inflow from financing activities -1,618 5,016 -9,527 2,480 -3,389 -100
Effects from currency exchange 0 0 -19 0 0 0
Decrease/ Increase in cash and cash equivalents -10,032 -7,967 -5,391 3,701 182 1,393
Cash and cash equivalents at the beginning
of the year 24,328 14,296 6,329 938 4,639 4,821
Cash and cash equivalents at the end of the year 14,296 6,329 938 4,639 4,821 6,213
Income from the disposal of subsidiaries

Sanochemia Pharmazeutika AG
www.cbseydlerresearch.ag
Close Brothers Seydler Research AG | 33
Research
Schillerstrasse 27 - 29 60313 Frankfurt am Main Phone: +49 (0)69 – 977 8456-0
Roger Peeters +49 (0)69 -977 8456- 12 Member of the Board [email protected]
Martin Decot +49 (0)69 -977 8456- 13 Kristina Kardum +49 (0)69 -977 8456- 21
[email protected] [email protected]
Igor Kim +49 (0)69 -977 8456- 15 Anna von Klopmann +49 (0)69 -977 8456- 10 [email protected] [email protected]
Gennadij Kremer +49 (0)69 – 977 8456- 23 Ralf Marinoni +49 (0)69 -977 8456- 17
[email protected] [email protected]
Manuel Martin +49 (0)69 -977 8456- 16 Felix Parmantier +49 (0)69 -977 8456- 22 [email protected] [email protected]
Marcus Silbe +49 (0)69 -977 8456- 14 Veysel Taze +49 (0)69 -977 8456- 18 [email protected] [email protected]
Ivo Višić +49 (0)69 -977 8456- 19 [email protected]
Institutional Sales
Schillerstrasse 27 – 29 60313 Frankfurt am Main Phone: +49 (0)69 – 9 20 54-400
Raimar Bock +49 (0)69 -9 20 54-115 Head of Sales [email protected]
Rüdiger Eich +49 (0)69 -9 20 54-119 Sule Erkan +49 (0)69 -9 20 54-107 (Germany, Switzerland) [email protected] (Sales-Support) [email protected]
Ulf Homeyer +49 (0)69 -9 20 54-111 Klaus Korzilius +49 (0)69 -9 20 54-114 (Germany, Switzerland) [email protected] (Benelux, Germany) [email protected] Stefan Krewinkel +49 (0)69 -9 20 54-118 Markus Laifle +49 (0)69 -9 20 54-120 (Execution, UK) [email protected] (Execution) [email protected] Bruno de Lencquesaing +49 (0)69 -9 20 54-116 Thomas Rosen +49 (0)69 -9 20 54-112 (Benelux, France) [email protected] (Germany, Switzerland) [email protected] Christopher Seedorf +49 (0)69 -9 20 54-110 Janine Theobald +49 (0)69 -9 20 54-106 (Sales-Support) [email protected] (Austria, Germany) [email protected] Bas-Jan Walhof +49 (0)69 -9 20 54-105 (Benelux) [email protected]
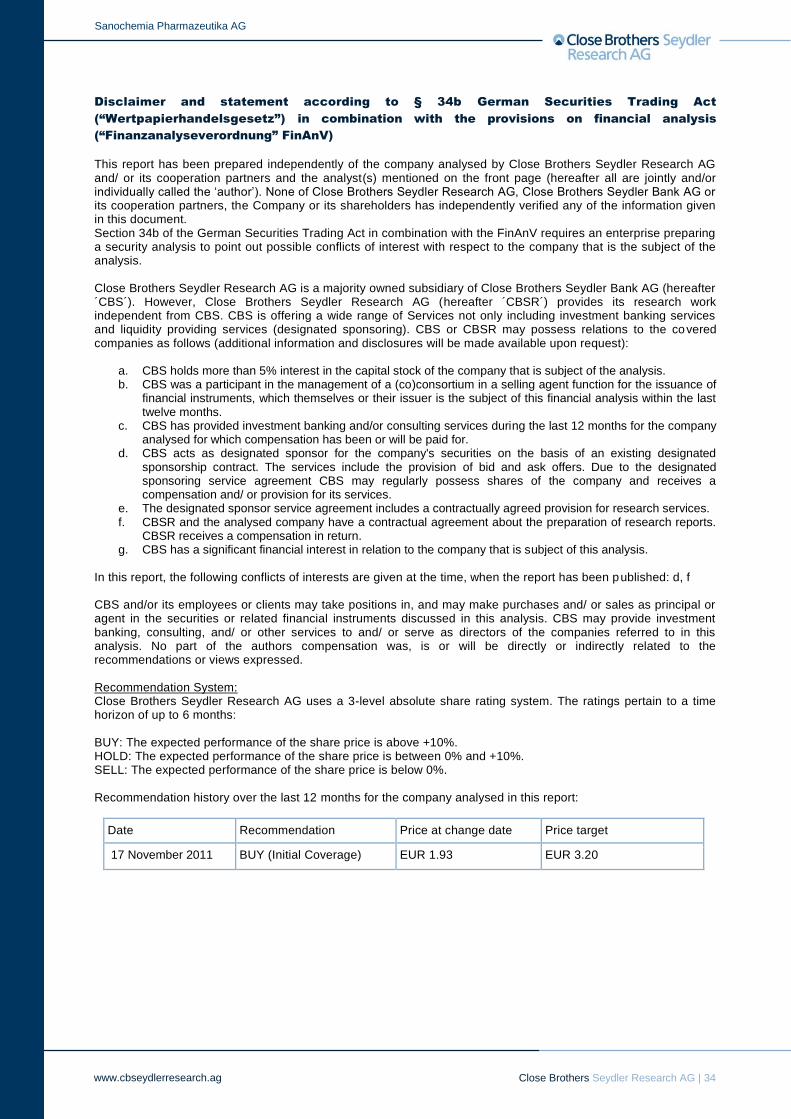
Sanochemia Pharmazeutika AG
www.cbseydlerresearch.ag
Close Brothers Seydler Research AG | 34
Disclaimer and statement according to § 34b German Securities Trading Act
(“Wertpapierhandelsgesetz”) in combination with the provisions on financial analysis
(“Finanzanalyseverordnung” FinAnV)
This report has been prepared independently of the company analysed by Close Brothers Seydler Research AG and/ or its cooperation partners and the analyst(s) mentioned on the front page (hereafter all are jointly and/or individually called the „author‟). None of Close Brothers Seydler Research AG, Close Brothers Seydler Bank AG or its cooperation partners, the Company or its shareholders has independently verified any of the information given in this document. Section 34b of the German Securities Trading Act in combination with the FinAnV requires an enterprise preparing a security analysis to point out possible conflicts of interest with respect to the company that is the subject of the analysis. Close Brothers Seydler Research AG is a majority owned subsidiary of Close Brothers Seydler Bank AG (hereafter ´CBS´). However, Close Brothers Seydler Research AG (hereafter ´CBSR´) provides its research work independent from CBS. CBS is offering a wide range of Services not only including investment banking services and liquidity providing services (designated sponsoring). CBS or CBSR may possess relations to the covered companies as follows (additional information and disclosures will be made available upon request):
a. CBS holds more than 5% interest in the capital stock of the company that is subject of the analysis. b. CBS was a participant in the management of a (co)consortium in a selling agent function for the issuance of
financial instruments, which themselves or their issuer is the subject of this financial analysis within the last twelve months.
c. CBS has provided investment banking and/or consulting services during the last 12 months for the company analysed for which compensation has been or will be paid for.
d. CBS acts as designated sponsor for the company's securities on the basis of an existing designated sponsorship contract. The services include the provision of bid and ask offers. Due to the designated sponsoring service agreement CBS may regularly possess shares of the company and receives a compensation and/ or provision for its services.
e. The designated sponsor service agreement includes a contractually agreed provision for research services. f. CBSR and the analysed company have a contractual agreement about the preparation of research reports.
CBSR receives a compensation in return. g. CBS has a significant financial interest in relation to the company that is subject of this analysis.
In this report, the following conflicts of interests are given at the time, when the report has been published: d, f CBS and/or its employees or clients may take positions in, and may make purchases and/ or sales as principal or agent in the securities or related financial instruments discussed in this analysis. CBS may provide investment banking, consulting, and/ or other services to and/ or serve as directors of the companies referred to in this analysis. No part of the authors compensation was, is or will be directly or indirectly related to the recommendations or views expressed. Recommendation System: Close Brothers Seydler Research AG uses a 3-level absolute share rating system. The ratings pertain to a time horizon of up to 6 months: BUY: The expected performance of the share price is above +10%. HOLD: The expected performance of the share price is between 0% and +10%. SELL: The expected performance of the share price is below 0%. Recommendation history over the last 12 months for the company analysed in this report:
Date Recommendation Price at change date Price target
17 November 2011 BUY (Initial Coverage) EUR 1.93 EUR 3.20

Sanochemia Pharmazeutika AG
www.cbseydlerresearch.ag
Close Brothers Seydler Research AG | 35
Risk-scaling System: Close Brothers Seydler Research AG uses a 3-level risk-scaling system. The ratings pertain to a time horizon of up to 6 months: LOW: The volatility is expected to be lower than the volatility of the benchmark MEDIUM: The volatility is expected to be equal to the volatility of the benchmark HIGH: The volatility is expected to be higher than the volatility of the benchmark The following valuation methods are used when valuing companies: Multiplier models (price/earnings, price/cash flow, price/book value, EV/Sales, EV/EBIT, EV/EBITA, EV/EBITDA), peer group comparisons, historical valuation approaches, discounting models (DCF, DDM), break-up value approaches or asset valuation approaches. The valuation models are dependent upon macroeconomic measures such as interest, currencies, raw materials and assumptions concerning the economy. In addition, market moods influence the valuation of companies. The figures taken from the income statement, the cash flow statement and the balance sheet upon which the evaluation of companies is based are estimates referring to given dates and therefore subject to risks. These may change at any time without prior notice. The opinions and forecasts contained in this report are those of the author alone. Material sources of information for preparing this report are publications in domestic and foreign media such as information services (including but not limited to Reuters, VWD, Bloomberg, DPA-AFX), business press (including but not limited to Börsenzeitung, Handelsblatt, Frankfurter Allgemeine Zeitung, Financial Times), professional publications, published statistics, rating agencies as well as publications of the analysed issuers. Furthermore, discussions were held with the management for the purpose of preparing the analysis. Potentially parts of the analysis have been provided to the issuer prior to going to press; no significant changes were made afterwards, however. Any information in this report is based on data considered to be reliable, but no representations or guarantees are made by the author with regard to the accuracy or completeness of the data. The opinions and estimates contained herein constitute our best judgment at this date and time, and are subject to change without notice. Possible errors or incompleteness of the information do not constitute grounds for liability, neither with regard to indirect nor to direct or consequential damages. The views presented on the covered company accurately reflect the personal views of the author. All employees of the author's company who are involved with the preparation and/or the offering of financial analyzes are subject to internal compliance regulations. The report is for information purposes, it is not intended to be and should not be construed as a recommendation, offer or solicitation to acquire, or dispose of, any of the securities mentioned in this report. Any reference to past performance should not be taken as indication of future performance. The author does not accept any liability whatsoever for any direct or consequential loss arising from any use of material contained in this report. The report is confidential and it is submitted to selected recipients only. The report is prepared for professional investors only and it is not intended for private investors. Consequently, it should not be distributed to any such persons. Also, the report may be communicated electronically before physical copies are available. It may not be reproduced (in whole or in part) to any other investment firm or any other individual person without the prior written approval from the author. The author is not registered in the United Kingdom nor with any U.S. regulatory body. It has not been determined in advance whether and in what intervals this report will be updated. Unless otherwise stated current prices refer to the closing price of the previous trading day. Any reference to past performance should not be taken as indication of future performance. The author maintains the right to change his opinions without notice, i.e. the opinions given reflect the author‟s judgment on the date of this report. This analysis is intended to provide information to assist institutional investors in making their own investment decisions, not to provide investment advice to any specific investor. By accepting this report the recipient accepts that the above restrictions are binding. German law shall be applicable and court of jurisdiction for all disputes shall be Frankfurt am Main (Germany). This report should be made available in the United States solely to investors that are (i) "major US institutional investors" (within the meaning of SEC Rule 15a-6 and applicable interpretations relating thereto) that are also "qualified institutional buyers" (QIBs) within the meaning of SEC Rule 144A promulgated by the United States Securities and Exchange Commission pursuant to the Securities Act of 1933, as amended (the "Securities Act") or (ii) investors that are not "US Persons" within the meaning of Regulation S under the Securities Act and applicable interpretations relating thereto. The offer or sale of certain securities in the United States may be made to QIBs in reliance on Rule 144A. Such securities may include those offered and sold outside the United States in transactions intended to be exempt from registration pursuant to Regulation S. This report does not constitute in any way an offer or a solicitation of interest in any securities to be offered or sold pursuant to Regulation S. Any such securities may not be offered or sold to US Persons at this time and may be resold to US Persons only if such securities are registered under the Securities Act of 1933, as amended, and applicable state securities laws, or pursuant to an exemption from registration. This publication is for distribution in or from the United Kingdom only to persons who are authorised persons or exempted persons within the meaning of the Financial Services and Markets Act 2000 of the United Kingdom or any order made there under or to investment professionals as defined in Section 19 of the Financial Services and Markets Act 2000 (Financial Promotion) Order 2005 and is not intended to be distributed or passed on, directly or indirectly, to any other class of persons. This publication is for distribution in Canada only to pension funds, mutual funds, banks, asset managers and

Sanochemia Pharmazeutika AG
www.cbseydlerresearch.ag
Close Brothers Seydler Research AG | 36
insurance companies. The distribution of this publication in other jurisdictions may be restricted by law, and persons into whose possession this publication comes should inform themselves about, and observe, any such restrictions. In particular this publication may not be sent into or distributed, directly or indirectly, in Japan or to any resident thereof. Responsible Supervisory Authority: Bundesanstalt für Finanzdienstleistungsaufsicht (BaFin, Federal Financial Supervisory Authority) Graurheindorferstraße 108 53117 Bonn
and
Lurgiallee 12 60439 Frankfurt
Schillerstrasse 27 - 29 60313 Frankfurt am Main www.cbseydlerresearch.ag Tel.: 0049 - (0)69 - 97 78 45 60