Risk Assessment on Trace Metals in Groundwater and Springs ...
11
International Journal of Environmental Monitoring and Analysis 2016; 4(2): 45-55 http://www.sciencepublishinggroup.com/j/ijema doi: 10.11648/j.ijema.20160402.12 ISSN: 2328-7659 (Print); ISSN: 2328-7667 (Online) Risk Assessment on Trace Metals in Groundwater and Springs in Urban Environment of Zanzibar Island Abdul Ali Juma Mohamed * , Sara Abdalla Khamis, Haji Mwevura, Miza Ali Kombo, Said Suleiman Bakari Department of Natural Sciences, State University of Zanzibar (SUZA), Zanzibar, Tanzania Email address: [email protected] (A. A. J. Mohamed) * Corresponding author To cite this article: Abdul Ali Juma Mohamed, Sara Abdalla Khamis, Haji Mwevura, Miza Ali Kombo, Said Suleiman Bakari. Risk Assessment on Trace Metals in Groundwater and Springs in Urban Environment of Zanzibar Island. International Journal of Environmental Monitoring and Analysis. Vol. 4, No. 2, 2016, pp. 45-55. doi: 10.11648/j.ijema.20160402.12 Received: March 13, 2016; Accepted: March 22, 2016; Published: April 1, 2016 Abstract: Urban-west region is the most highly populated region of Zanzibar. More than half of the Zanzibar populations reside at this region. Groundwater is the main resource of drinking water in this area, and currently there is no drinking water treatment plant; hence, the suitability and appropriateness of groundwater resources for drinking and other domestic uses is of public and scientific concern. In this study, groundwater samples were collected from 30 sites in urban areas of Zanzibar Island in December 2012. Measurements, and investigation of the levels of trace metals in water including Cd, Co, Cr(III), Cu, Fe, Li, Mn, Mo, Sb, Se, Ti, and Zn were measured in thirty locations in Zanzibar urban west region using Inductively Coupled Plasma Emission Spectroscopy (ICP-OES). The paper also highlights and depicts the estimate of the degree of metal contamination (C d ), hazard quotient which yields hazard index (HI), heavy metal evaluation index (HEI), and heavy metal pollution index (HPI). Using the four heavy metals (Cd, Zn, Cu, and Fe), the degree of contamination (C d ) in all water sources were less than 1, thus they fall in to the category of low degree of contamination. The general trend of the average daily dose (ADD) of Zn, Cu, Fe, and Cd in water sources was Zn ˃ Cu ˃ Fe ˃ Cd. As the severity of metal toxicity is governed by several factors, such as dose, nutrition, age, and even life style. Therefore, this trend might not guarantee the absence of human health risk. Generally, from risk assessment on trace metals using risk indices (C d , HPI, HI and HEI), the analyzed water sources might not be at the alarming health risk. However, due to an increasing level of environmental pollution, water sources might be potential sink of contaminants; this is significant reason that makes the treatment of drinking water and monitoring implementation inevitable. Keywords: Zanzibar, Degree of Contamination, Risk Assessment, Health Risk, Environmental Pollution 1. Introduction Water is an essential compound for all forms of life in the Earth planet. Springs and groundwater are the two main sources of water used for domestic and other social purposes in Zanzibar. The exploitation of water from groundwater aquifers has become a common practice in different areas of Zanzibar Island. Moreover, during rainy seasons, rainwater is also a potential source of fresh water for domestic and other social purposes and activities. The issue of water quality is very poignant in many countries, but the vulnerability of water to contaminants due to natural and anthropogenic sources has become a common problem worldwide [1].Water is an inevitable need to man and his environment; it has existed throughout the history of the earth crust even before the existence of man. However, the water qualityis persistently pollutedin many countries of the world [2]. The importance of water quality for the health of human being and welfare is of a great interest and attention in the world. Access to sufficient, clean, and safe water is essential for human survival, and is one among the fundamental human rights. Regarding public health, limited access to safe water obviously undermines other public sectors such as public health, which can lead to communicable diseases. The
Transcript of Risk Assessment on Trace Metals in Groundwater and Springs ...

International Journal of Environmental Monitoring and Analysis 2016; 4(2): 45-55
http://www.sciencepublishinggroup.com/j/ijema
doi: 10.11648/j.ijema.20160402.12
ISSN: 2328-7659 (Print); ISSN: 2328-7667 (Online)
Risk Assessment on Trace Metals in Groundwater and Springs in Urban Environment of Zanzibar Island
Abdul Ali Juma Mohamed*, Sara Abdalla Khamis, Haji Mwevura, Miza Ali Kombo,
Said Suleiman Bakari
Department of Natural Sciences, State University of Zanzibar (SUZA), Zanzibar, Tanzania
Email address: [email protected] (A. A. J. Mohamed) *Corresponding author
To cite this article: Abdul Ali Juma Mohamed, Sara Abdalla Khamis, Haji Mwevura, Miza Ali Kombo, Said Suleiman Bakari. Risk Assessment on Trace Metals
in Groundwater and Springs in Urban Environment of Zanzibar Island. International Journal of Environmental Monitoring and Analysis.
Vol. 4, No. 2, 2016, pp. 45-55. doi: 10.11648/j.ijema.20160402.12
Received: March 13, 2016; Accepted: March 22, 2016; Published: April 1, 2016
Abstract: Urban-west region is the most highly populated region of Zanzibar. More than half of the Zanzibar populations
reside at this region. Groundwater is the main resource of drinking water in this area, and currently there is no drinking water
treatment plant; hence, the suitability and appropriateness of groundwater resources for drinking and other domestic uses is of
public and scientific concern. In this study, groundwater samples were collected from 30 sites in urban areas of Zanzibar Island
in December 2012. Measurements, and investigation of the levels of trace metals in water including Cd, Co, Cr(III), Cu, Fe,
Li, Mn, Mo, Sb, Se, Ti, and Zn were measured in thirty locations in Zanzibar urban west region using Inductively Coupled
Plasma Emission Spectroscopy (ICP-OES). The paper also highlights and depicts the estimate of the degree of metal
contamination (Cd), hazard quotient which yields hazard index (HI), heavy metal evaluation index (HEI), and heavy metal
pollution index (HPI). Using the four heavy metals (Cd, Zn, Cu, and Fe), the degree of contamination (Cd) in all water sources
were less than 1, thus they fall in to the category of low degree of contamination. The general trend of the average daily dose
(ADD) of Zn, Cu, Fe, and Cd in water sources was Zn ˃ Cu ˃ Fe ˃ Cd. As the severity of metal toxicity is governed by several
factors, such as dose, nutrition, age, and even life style. Therefore, this trend might not guarantee the absence of human health
risk. Generally, from risk assessment on trace metals using risk indices (Cd, HPI, HI and HEI), the analyzed water sources
might not be at the alarming health risk. However, due to an increasing level of environmental pollution, water sources might
be potential sink of contaminants; this is significant reason that makes the treatment of drinking water and monitoring
implementation inevitable.
Keywords: Zanzibar, Degree of Contamination, Risk Assessment, Health Risk, Environmental Pollution
1. Introduction
Water is an essential compound for all forms of life in the
Earth planet. Springs and groundwater are the two main
sources of water used for domestic and other social purposes
in Zanzibar. The exploitation of water from groundwater
aquifers has become a common practice in different areas of
Zanzibar Island. Moreover, during rainy seasons, rainwater is
also a potential source of fresh water for domestic and other
social purposes and activities.
The issue of water quality is very poignant in many
countries, but the vulnerability of water to contaminants due
to natural and anthropogenic sources has become a common
problem worldwide [1].Water is an inevitable need to man
and his environment; it has existed throughout the history of
the earth crust even before the existence of man. However,
the water qualityis persistently pollutedin many countries of
the world [2].
The importance of water quality for the health of human
being and welfare is of a great interest and attention in the
world. Access to sufficient, clean, and safe water is essential
for human survival, and is one among the fundamental
human rights. Regarding public health, limited access to safe
water obviously undermines other public sectors such as
public health, which can lead to communicable diseases. The

46 Abdul Ali Juma Mohamed et al.: Risk Assessment on Trace Metals in Groundwater and
Springs in Urban Environment of Zanzibar Island
provision of potable drinking water has been highly
assembled in national and international documents [3].
The issue of water quality is one of the poignant agenda in
many countries. The exploitation and utilization of water
from groundwater aquifers has become a common practice in
different areas of Zanzibar Island. Nevertheless, the
vulnerability of water to contaminants due to natural and
anthropogenic sources seems to be a common phenomenon
[1]. Moreover, both the qualitative and quantitative aspects of
water resources might be vulnerable to deterioration due to
environmental degradation. Very recently, about 2.7 million
liters of water are anticipitated to be lost at Chunga water
supplies located at west region of Zanzibar owing poor
utilization of the environment.
Fresh water supply is an important concern worldwide,
about 90% of fresh water in the world originated from
groundwater aquifers [4]. An aquifer is an underground
component of saturated earth materials that can provide
usable quantities of ground water to a well [5].
In Zanzibar, rapid rate of urbanization has increased
demand of water, which necessitated the usage of
groundwater to supplement the existing water supply
systems, in most areas of the Island. Accordingly, the trend of
developing privately owned water wells has increased to an
amount that has outnumbered the public and community
water source [1].
Water resources evaluation typifies a major concern of the
present world due to the importance of water for human
being and society in general [6]. Good water quality
management is fundamental for the production of clean water
for the human consumption and safety. Qualitative as well as
quantitative determination of the contaminants, along with
the predictions of their possible source(s) are vital in an
attempt of tackling contamination problems in groundwater
and surface water [1]. Therefore, an evaluation of drinking
water quality is a crucial concern for implementing
sustainable water-use strategies, plan, and policy.
Moreover, information about water quality analysis is
always used as a basis to discuss utilizing groundwater in
order to avoid associated water illnesses and health
problems. [7] Groundwater quality depends, to some extents,
on its chemical composition. Monitory of the levels of
cations and anions play important and indicative role in
assessing degree of groundwater contamination [8].
Nevertheless, an access to good water quality supply and
sanitation services has become a hot issue in most of
developing countries, and still these services do not reach a
significant proportion of the world’s population. It has
become a more challenging agenda due to factors such as
rapid rate of urbanization and environmental pollution.
Harmful impurities from various sources such as,
agricultural and domestic effluents, municipal sewerage are
among the key factors, which deteriorate the quality portable
water [9]. Trace metals are among a wide range of
contaminants, which receive health concernsdue to their
potential toxicities even at very low concentrations. Trace
metals gain entrance into human systems via contaminated
drinking water, air, and food. In the body, the metals can
compete with, and displace essential minerals such as zinc,
copper, magnesium, and calcium; and interfere with body
biological organs, systems and functions [10] Over a certain
period, metals have tendency to bio-accumulate in tissues of
living organisms [11]. However, some trace metals (such as
zinc, copper, iron, and manganese) are the micronutrients;
the body in small amounts for metabolic activities requires
them. At higher concentrations, these same elements, can
cause adverse health effects or illness [12].
Toxic metals such as cadmium (Cd), lead (Pb), arsenic
(As), chromium (Cr), and thallium (Tl) do not have
beneficial effects in humans. Long-term exposures to these
metals may cause severe disruptions in the normal
dysfunctioning of the organs and systems where the metals
are accumulated. Pb, for example, is linked with a broad
range of negative pregnancy outcomes, including
cardiovascular diseases, early membrane rupture and
spontaneous abortion, and erectile dysfunction [13].
Cadmium is very toxic and is linked to several cases of
poisoning through food. Small quantities of cadmium cause
adverse changes in the arteries of human kidney causing
kidney damage. Moreover, cadmium replaces zinc
biochemically and causes high blood pressures [14].
Metals such as Cd, Cr, V, As, Mn, Ti, Co, Cu, Fe, Pb, Ni,
Zn, and their compounds have been suggested to be initiators
or promoters of carcinogenic activity in animals.
Furthermore, Be, Sb, Al, Hg, Ni, Cd and Co can cause
undesirable reproductive/fertility problems [15].
Zinc toxicity can leads to diarrhea [16], manganese may
slow down the intellectual development of the child [17].
Iron has been associated with repeated blood transfusions,
genetic and metabolic diseases [18], and copper toxicity is
related to several health concerns, including kidney disease,
stomach cramps, nausea, vomiting, diarrhea, cancer, and
liver damage [19].
The presence of chemical species in fresh water sources,
such as groundwater aquifers and springs can be of natural or
anthropogenic origins. The constituents present in water may
pose many health risks to human, and other life when exceed
the maximum contamination level. Because of the absence of
drinking water treatment plants in Zanzibar, it is mandatory
to assess, and to keep regular drinking water monitoring
programs. Thus the objective of this study is to examine and
highlighting the levels of twelve metals in groundwater and
spring sources in urban west region of Zanzibar. The paper
also reveals the correlation coefficients between the analyzed
parameters, the estimate of the degree of metal contamination
(Cd). Other hazard and pollution indices were also studied.
2. Materials and Methods
December 2012, samples of water were collected from
twenty-eight ground water sources and two springs located at
Urban-west region and its territoriesof Zanzibar Island.
Geographic coordinates of all sampling points were recorded
using the Global Positioning System (GPS). Sampling sites

International Journal of Environmental Monitoring and Analysis 2016; 4(2): 45-55 47
are shown in Figure 1). Water samples from 30 locations
were collected in sterile bottles (1000 mL) preserved, and
analyzed by using standard methods for the examination of
water and wastewater [20]. These water sources were closed
hand dug well (CHDW), open hand dug well (OHDW),
public bore well (PBW), spring water (SW), and bore well
owned by private individual or community owned well
(BWP). Prior to sampling process, all the bottles were
cleaned and rinsed thoroughly with water to be analyzed. All
reagents used were of analytical grade. The water samples
were stored at 4°C prior to laboratory chemical analysis.
Metal analyzed are Cd, Co, Cr (III), Cu, Fe, Li, Mn, Mo, Sb,
Se, Ti, and Zn. The concentrations of these metals were
determined using ICP-OES (Thermo Scientific iCAP 6000).
The ICP-OES is robust and can undergo multi elemental
analysis [1, 3].
Figure 1. Map of sampling sites in Zanzibar Urban-West Region and territories.

48 Abdul Ali Juma Mohamed et al.: Risk Assessment on Trace Metals in Groundwater and
Springs in Urban Environment of Zanzibar Island
2.1. Data Analysis
IBM Statistical Package for the Social Sciences (SPSS)
version 16 was used to give descriptive statistics from the
data analysis. Concentrations of the analyzed trace metal
within and between the water sources were not significant
different (Table-1).
Table 1. Summary of the descriptive statistics of the analyzed parameters.
Parameters df F Sig. Mean Std. Deviation Minimum Maximum N
Cd 4 0.946 0.454 0.0006 0.00031 0.0001 0.0014 30
Co 4 1.912 0.140 0.0002 0.00026 BDL 0.0009 30
Cr(III) 4 1.262 0.311 0.0124 0.01809 BDL 0.0465 30
Cu 4 0.419 0.794 0.0069 0.02028 BDL 0.111 30
Fe 4 0.543 0.706 0.0031 0.00794 BDL 0.035 30
Li 4 1.196 0.337 0.0075 0.01758 0.0002 0.0985 30
Mn 4 0.329 0.856 0.0009 0.00233 BDL 0.0089 30
Mo 4 0.582 0.678 0.0002 0.00055 BDL 0.0028 30
Sb 4 0.710 0.593 0.0021 0.00173 BDL 0.0074 30
Se 4 0.867 0.497 0.0027 0.00413 BDL 0.0135 30
Ti 4 1.531 0.224 0.0038 0.00183 0.00031 0.0071 30
Zn 4 0.413 0.798 0.0158 0.04358 0.00013 0.2339 30
2.2. The Estimate of the Pollution Indices and Degree of
Metal Contamination
The present study evaluated heavy metal pollution index
(HPI) proposed by [21], the degree of contamination (Cd)
developed by [22]. Cd is also gives an indication for the
extent of metal pollution [23]. Degree of contamination in
water resources can fall in to one of three categories, namely,
low (Cd ˂ 1), medium (Cd =1-3), and high (Cd ˃ 3) [23].
Another pollution index is “Heavy metal evaluation index”
(HEI), it gives an overall quality of the water with respect to
heavy metals [24]. Figure A2 shows the value of the
calculated indices. Toxicity response due to Fe, Cu, Cd, and
Zn exposures are shown in Table-2.
Table 2. Toxicity response due to Fe, Cu, Cd, and Zn exposures.
Toxicity Response [25] Exposure Parameters
Parameter Oral RfD (mg/Kg/day) IR 2.2 L/day
Fe 0.7 EF 365 Days/year
Cu 0.04 ED 70 years
Cd 0.0005 BW 70 Kg
Zn 0.3 AT 25550 days
The pollution indices and other hazard indices were
calculate using the follow shown below:
2.2.1. Degree of Contamination (Cd)
1
n
d f iiC C
==∑ (1)
Cfi is a sub-index showing contamination factor, and is
calculated according to Eq. (2)
i
fi
i
CMC
CS= -1 (2)
Cfi, CMi, and CSi, are the contamination factor, analytical
value, and upper permissible concentration for ith
component
respectively, while n denotes the ‘normative value’.
2.2.2. Heavy Metal Pollution Index (HPI)
1 1/
n n
i iHPI WiQi Wi
= ==∑ ∑ (3)
Where: Wi and Qi are unit weight and the sub-index of
the ith
parameter, respectively, and n is the number of
parameters considered. The sub-index (Qi) is calculated
according to Eq. (4).
1100
n
i
Mi IiQi
Si Ii=
−= ×
−∑ (4)
2.2.3. Heavy Metal Evaluation Index (HEI)
1
n c
imac
HHEI
H==∑ (5)
Where:
Hc = Analyzed concentration of the respective parameter.
Hmac = Maximum admissible concentration of the
respective parameter.
2.2.4. Hazard Quotient (HQ)
ADDHQ
RfD= (6)

International Journal of Environmental Monitoring and Analysis 2016; 4(2): 45-55 49
Where ADD is the average daily dose, which is calculated
using equation 7.
i
Ci IR EF EDADD
BW AT
× × ×=×
(7)
Where:
Ci = Concentration of the monitored parameter
IR = Ingestion rate
EF = Exposure frequency
ED = Exposure Duration
BW = Body weight
AT = Average time
2.2.5. Hazard Index (HI)
iHI HQ=∑ (8)
2.2.6. Chronic Daily Intake CDI
Chronic daily intake is calculated using modified equation
9 [26].
DICDI Ci
BW= × (9)
3. Results and Discussion
3.1. Correlation of Trace Metals in the Water Samples
As shown in Table 3, the correlation among the analyzed
trace metals in water samples are expressed by Pearson
coefficient. Copper, selenium, and manganese had strong
correlation with zinc (r = 0.933), chromium III (r = 0.827),
and manganese (r = 0.63), respectively. Negative correlations
were also observed, for instance, iron had negative
correlations with cadmium, cobalt, and chromium (III). The
correlation between same parameters is not necessarily
uniform, and it can remarkably differ from one study area to
another. In the context of analytical chemistry, the correlation
matrix is both fundamental and pervasive concept, and it
does not necessarily mean the presence of causality among
the analyzed parameters.
Table 3. The Correlation between Trace metals in the water samples.
Correlations
Cd Co Cr(III) Cu Fe Li Mn Mo Sb Se Ti Zn
Cd 1 -0.13 0.292 0.172 -0.16 0.55 0.068 0.227 -0.17 0.274 0.191 0.199
Co
1 -0.43 -0.219 -0.18 -0.22 -0.25 -0.209 0.115 -0.47 -0.374 -0.231
Cr(III)
1 0.06 -0.24 0.398 -0.17 0.396 -0.24 0.827 0.705 0.007
Cu
1 0.553 0.023 0.63 0.032 0.043 0.137 0.175 0.933
Fe
1 -0.07 0.406 -0.106 -0.04 -0.15 0.26 0.616
Li
1 0.138 0.339 -0.25 0.325 0.353 0.091
Mn
1 -0.035 -0.04 0.089 -0.094 0.65
Mo
1 -0.34 0.382 0.31 0.046
Sb
1 0.019 -0.247 -0.088
Se
1 0.628 0.011
Ti
1 0.153
Zn
1
3.2. Cadmium, Cobalt, Cr(III) and Copper in Different
Water Sources
The concentrations of cadmium, cobalt, chromium III, and
copper were in the ranges of 0.0001 – 0.0014, BDL – 0.0009,
BDL – 0.0465, BDL – 0.111 mgL-1
respectively (Table-1 and
Figure A1). In decreasing order of the concentrations, the
general trend of the analyzed trace metals in different water
sources were: chromium (III) ˃ copper ˃ cadmium ˃ cobalt
(Figure 2). Cadmium was detected in all 30 sampling areas
followed by copper, chromium (III), and cobalt, which were
detected in 18, 14, and 14 of the sampling sites respectively
(Figure A1). While the natural sources of cadmium in the
analyzed water samples cannot be directly excluded, the
detected concentration of cadmium are associated with
activities in which cadmium is used as important component
in different application, such as pigments, plastics, and
battery.
Figure 2. Cadmium, Cobalt, Cr(III) and Copper in Different Water Sources.
50 Abdul Ali Juma Mohamed et al.: Risk Assessment on Trace Metals in Groundwater and
Springs in Urban Environment of Zanzibar Island
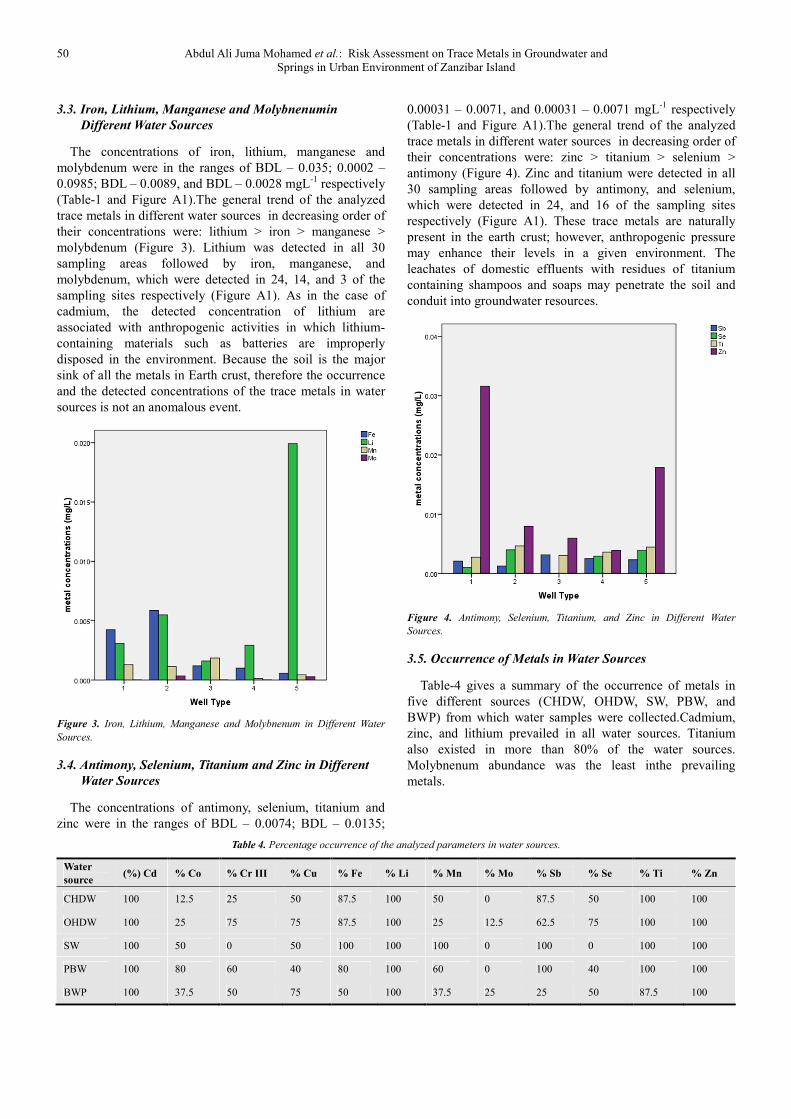
3.3. Iron, Lithium, Manganese and Molybnenumin
Different Water Sources
The concentrations of iron, lithium, manganese and
molybdenum were in the ranges of BDL – 0.035; 0.0002 –
0.0985; BDL – 0.0089, and BDL – 0.0028 mgL-1
respectively
(Table-1 and Figure A1).The general trend of the analyzed
trace metals in different water sources in decreasing order of
their concentrations were: lithium ˃ iron ˃ manganese ˃
molybdenum (Figure 3). Lithium was detected in all 30
sampling areas followed by iron, manganese, and
molybdenum, which were detected in 24, 14, and 3 of the
sampling sites respectively (Figure A1). As in the case of
cadmium, the detected concentration of lithium are
associated with anthropogenic activities in which lithium-
containing materials such as batteries are improperly
disposed in the environment. Because the soil is the major
sink of all the metals in Earth crust, therefore the occurrence
and the detected concentrations of the trace metals in water
sources is not an anomalous event.
Figure 3. Iron, Lithium, Manganese and Molybnenum in Different Water
Sources.
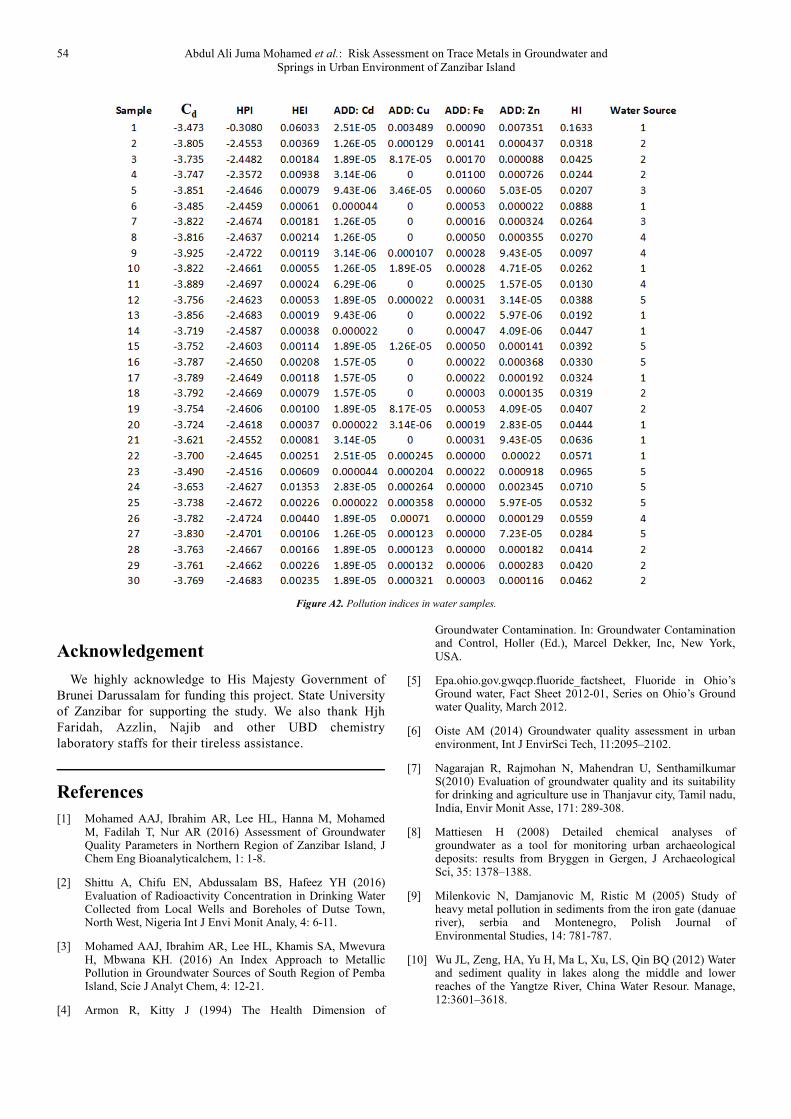
3.4. Antimony, Selenium, Titanium and Zinc in Different
Water Sources
The concentrations of antimony, selenium, titanium and
zinc were in the ranges of BDL – 0.0074; BDL – 0.0135;
0.00031 – 0.0071, and 0.00031 – 0.0071 mgL-1
respectively
(Table-1 and Figure A1).The general trend of the analyzed
trace metals in different water sources in decreasing order of
their concentrations were: zinc ˃ titanium ˃ selenium ˃
antimony (Figure 4). Zinc and titanium were detected in all
30 sampling areas followed by antimony, and selenium,
which were detected in 24, and 16 of the sampling sites
respectively (Figure A1). These trace metals are naturally
present in the earth crust; however, anthropogenic pressure
may enhance their levels in a given environment. The
leachates of domestic effluents with residues of titanium
containing shampoos and soaps may penetrate the soil and
conduit into groundwater resources.
Figure 4. Antimony, Selenium, Titanium, and Zinc in Different Water
Sources.
3.5. Occurrence of Metals in Water Sources
Table-4 gives a summary of the occurrence of metals in
five different sources (CHDW, OHDW, SW, PBW, and
BWP) from which water samples were collected.Cadmium,
zinc, and lithium prevailed in all water sources. Titanium
also existed in more than 80% of the water sources.
Molybnenum abundance was the least inthe prevailing
metals.
Table 4. Percentage occurrence of the analyzed parameters in water sources.
Water
source (%) Cd % Co % Cr III % Cu % Fe % Li % Mn % Mo % Sb % Se % Ti % Zn
CHDW 100 12.5 25 50 87.5 100 50 0 87.5 50 100 100
OHDW 100 25 75 75 87.5 100 25 12.5 62.5 75 100 100
SW 100 50 0 50 100 100 100 0 100 0 100 100
PBW 100 80 60 40 80 100 60 0 100 40 100 100
BWP 100 37.5 50 75 50 100 37.5 25 25 50 87.5 100

International Journal of Environmental Monitoring and Analysis 2016; 4(2): 45-55 51
3.6. Human Health Risk Assessment Due to Toxic Metal
Heavy metals are toxic elements, and they are in the list of
the noxious pollutants in the context of environmental and
health sciences. Ingestion of considerable amount of heavy
metals via different exposure pathways may result into
several detrimental ill effects. Using the four heavy metals
(Cd, Zn, Cu, and Fe), the degree of contamination (Cd) in all
water sources were less than 1, thus they all fall in to the
category of low degree of contamination. Similar trend was
found in the study conducted in Tehran water sources [27].
The general trend of the average daily dose (ADD) of Zn,
Cu, Fe, and Cd in water sources is:
Zn ˃ Cu ˃Fe ˃ Cd.
With regard to severity of the toxicity, cadmium is highly
toxic, so this trend likely does not show alarming situation
in the context of cadmium risk in the water sources. As the
severity of toxicity is governed by several factors such as
dose, nutrition, age and even life style. Therefore, this trend
might not guarantee the absence of human health risk
(Figure 5).
For the case of Cd, there is a remarkable spatial variation
in different water sources. While for HPI the spatial
variations is less remarkable. HPI for all water samples were
well below the critical value (Figure 6).
All water samples (100%) to some extent showed some
levels of HEI. Moreover, all water samples showed some
ADD levels with respect to Cd, Zn, and copper metal, while
iron metal was over 60%. Nevertheless, the spatial variations
of HI are more apparent as compared to HEI (Figure 7 &
Figure A2).
Figure 5. ADD of Cd. Cu, Fe and Zn.

52 Abdul Ali Juma Mohamed et al.: Risk Assessment on Trace Metals in Groundwater and
Springs in Urban Environment of Zanzibar Island
Figure 6. HPI and Cd in water samples.
Figure 7. Hazard index in water samples.

International Journal of Environmental Monitoring and Analysis 2016; 4(2): 45-55 53
4. Conclusion
From the twelve analyzed metals, cadmium, zinc, and
lithium existed at varying concentrations in all water sources.
Other metals were also detected though at relatively low
abundances. Generally, from risk assessment on trace metals
using risk indices (Cd, HPI, HI and HEI), the analyzed water
sources are not at the alarming health risk, however, the
increasing level of environmental pollution, water sources
might be potential sink of contaminants, this is significant
reason that make the treatment of drinking water and
monitoring implementation inevitable.
Appendix
Figure A1. Analyzed parameters all in µgL-1; nd: not detected; 1 = CHDW; 2 = OHDW; 3 = SW; 4 = PBW; 5 = BWP.
54 Abdul Ali Juma Mohamed et al.: Risk Assessment on Trace Metals in Groundwater and
Springs in Urban Environment of Zanzibar Island
Figure A2. Pollution indices in water samples.
Acknowledgement
We highly acknowledge to His Majesty Government of
Brunei Darussalam for funding this project. State University
of Zanzibar for supporting the study. We also thank Hjh
Faridah, Azzlin, Najib and other UBD chemistry
laboratory staffs for their tireless assistance.
References
[1] Mohamed AAJ, Ibrahim AR, Lee HL, Hanna M, Mohamed M, Fadilah T, Nur AR (2016) Assessment of Groundwater Quality Parameters in Northern Region of Zanzibar Island, J Chem Eng Bioanalyticalchem, 1: 1-8.
[2] Shittu A, Chifu EN, Abdussalam BS, Hafeez YH (2016) Evaluation of Radioactivity Concentration in Drinking Water Collected from Local Wells and Boreholes of Dutse Town, North West, Nigeria Int J Envi Monit Analy, 4: 6-11.
[3] Mohamed AAJ, Ibrahim AR, Lee HL, Khamis SA, Mwevura H, Mbwana KH. (2016) An Index Approach to Metallic Pollution in Groundwater Sources of South Region of Pemba Island, Scie J Analyt Chem, 4: 12-21.
[4] Armon R, Kitty J (1994) The Health Dimension of
Groundwater Contamination. In: Groundwater Contamination and Control, Holler (Ed.), Marcel Dekker, Inc, New York, USA.
[5] Epa.ohio.gov.gwqcp.fluoride_factsheet, Fluoride in Ohio’s Ground water, Fact Sheet 2012-01, Series on Ohio’s Ground water Quality, March 2012.
[6] Oiste AM (2014) Groundwater quality assessment in urban environment, Int J EnvirSci Tech, 11:2095–2102.
[7] Nagarajan R, Rajmohan N, Mahendran U, Senthamilkumar S(2010) Evaluation of groundwater quality and its suitability for drinking and agriculture use in Thanjavur city, Tamil nadu, India, Envir Monit Asse, 171: 289-308.
[8] Mattiesen H (2008) Detailed chemical analyses of groundwater as a tool for monitoring urban archaeological deposits: results from Bryggen in Gergen, J Archaeological Sci, 35: 1378–1388.
[9] Milenkovic N, Damjanovic M, Ristic M (2005) Study of heavy metal pollution in sediments from the iron gate (danuae river), serbia and Montenegro, Polish Journal of Environmental Studies, 14: 781-787.
[10] Wu JL, Zeng, HA, Yu H, Ma L, Xu, LS, Qin BQ (2012) Water and sediment quality in lakes along the middle and lower reaches of the Yangtze River, China Water Resour. Manage, 12:3601–3618.

International Journal of Environmental Monitoring and Analysis 2016; 4(2): 45-55 55
[11] Ikejimba CC, Sakpa S (2014) Comparative study of some heavy metals’ concentrations in water and Tympanotonusfuscatusvar radula samples of Egbokodo River, Warri, Nigeria, Int J Modern Biol Re, 2: 7-15.
[12] Valavanidis A, Vlachogianni T (2010) Metal pollution in ecosystem, ecotoxicology studies & risk assessment in the marine environment. Dept. of Chemistry, University of Athens University Campus Zografou, 15784 Athens, Greece.
[13] EPA (1986) Air quality criteria document for lead. Environmental Criteria and Assessment Office, US Environmental Protection Agency, Research Triangle Park, North Carolina.
[14] Rajappa B, Manjappa S, Puttaiah ET (2010) Monitoring of heavy metal concentration in groundwater of Hakinaka Taluk, India, Contemporary Eng Sci, 3: 183-190.
[15] Nriagu JO (1988) A silent epidemic of environmental metal poisoning? Environmental Pollution, 50: 139-161.
[16] Osibanjo O, Majolagbe AO (2012) Physicochemical quality assessment of groundwater based on land use in Lagos city, Southwest, Nigeria, Chem J, 2: 79-86.
[17] Buschmann J, Berg M, Stengel C, Winkel L, Sampson, ML, Trang, PTK, Viet PH (2008) Contamination of drinking water resources in the Mekong Delta floodplains: Arsenic and other trace metals pose serious health risks to population, EnvirInt, 34, 756–764.
[18] Fraga CG, Oteiza PI (2002) Iron toxicity and antioxidant nutrients, Toxicology, 180: 23-32.
[19] EPA (2013) Consumer Factsheet on: COPPER. Retrieved on February 26, 2016 from http://water.epa.gov/drink/contaminants/index.cfm
[20] APHA (2005) Standard methods for the examination of water and waste water, 21st edition, American Public Health Association, Washington, DC, USA.
[21] Prasad B, Bose JM (2001) Evaluation of heavy metal pollution index for surface and spring water near a limestone mining area of the lower Himalayas, Envir Geology, 41: 183–188.
[22] Backman B, Bodis D, Lahermo P, Rapant S (1997) Application of a groundwater contamination index in Finland and Slovakia, Envir Geology, 36: 55–64.
[23] Rubio B, Nombela MA, Vilas F ( 2000) Geochemistry of Major and Trace Elements in Sediments of the Ria de Vigo (NW Spain): an Assessment of Metal Pollution, Marine Pollution Bulletin, 40: 968-980.
[24] Edet AE, Offiong OE (2002) Evaluation of water quality pollution indices for heavy metal contamination monitoring. A study case from Akpabuyo - Odukpani area, Lower Cross River Basin, (southeastern Nigeria), Geo J, 57: 295–304.
[25] Wongsasuluk P, Chotpantarat S, Siriwong W, Robson M (2014) Heavy metal contamination and human health risk assessment in drinking water from shallow groundwater wells in an agricultural area in Ubon Ratchathani province, Thailand, Environ Geochem Health, 36: 169–182.
[26] Muhammed S, Shari MT, Khan S (2011) Health Risk Assessment of Heavy metals and their source apportionment in drinking water of Kohitan region, northern Pakistan. Microchem J, 98: 334-343.
[27] Nasrabadi T (2015) An Index Approach to Metallic Pollution in River Waters Int. J. Environ. Res., 9(1): 385-394.