Risk assessment of soil compaction in Walloon Region …
1
Risk assessment of soil compaction in Walloon Region (Belgium) C. Rosière* ; S. Delvoie**; R. Charlier**; X. Legrain*; P. Demarcin*; M.-F. Destain* ; J.-C. Verbrugge* *Gembloux Agro-Bio Tech (ULg), Passage des Déportés, 2 B-5030 Gembloux (Belgium) ** Département ArGEnCo (ULg), Sart Tilman B52, 4000 Liège, Belgique Objective To identify zones sensitive to compaction in the Walloon Region (RW) (Belgium) and to map them. Context Soil compaction depends on interaction between soil characteristics (permanent and variable) and agricultural or sylvicultural practices. In RW, beetharvest could generate high compaction because it happens during a wet season and machines (loader or self propelled complete machines) have axle load that may exceed 10 tons. Fig.1. Self propelled complete machine Method Two stages of mapping I. Map of soil compaction sensitivity - Precompression stresses (Pc) are calculated at two pF values (1.8 and 2.5) and two depths by Pedotransfer Functions (PTFs) of Lebert & Horn (1991). - These PTFs require soil characteristics (texture, organic carbon content, bulk density, …) - These parameters are available in Aardewerk database (granulometry, organic matter content) and in literature: saturated hydraulic conductivity (Mualem-Van Genuchten, 1992), bulk density (Manrique & Jones, 1991), cohesion and angle of internal friction (Van den Akker, 2004), …. Table 1. Classification of the precompression stress Pc (kPa) Soil sensitivity Colour on map High (up to 400) very low low medium high Low (until to 10) very high Map of soil compaction sensitivity II. Potentially compacted soils Calculation of vertical stress (σ z ) distribution induced by the passage of a machine is performed by the software Soilflex (Keller, 2005). Hypotheses - A 'superellipse' shape (Keller,2005) is used to represent vertical constraints distribution of tire-soil contact - In-depth distribution of σ z and contact area depend on a stress concentration factor (ξ) which characterizes their spatial distribution. - The self propelled Holmer TerraDos is considered as an example (Table 1). Table 2. Comparison of Pc and σ z If Pc > σ z Elastic behaviour of soil If Pc < σ z Plastic behaviour of soil Vertical stress σz (kPa) Fig.3. Vertical stress distribution. Passage of a beetharvester Holmer TerraDos on a loamy soil (Hannut, Belgium). III. Experimental measurement of Pc on sites To analyse the machine influence, oedometric tests are performed before and after machine passages on agricultural and forest sites in RW. Fig.2. Fig.4. Soil sampling for oedometric test. Fig.5. Automatic oedometer. This research was funded by Region Walloon. Project N/Réf: DPS/JDX/ph/2009/0092 ; S2009 : 2909
Transcript of Risk assessment of soil compaction in Walloon Region …
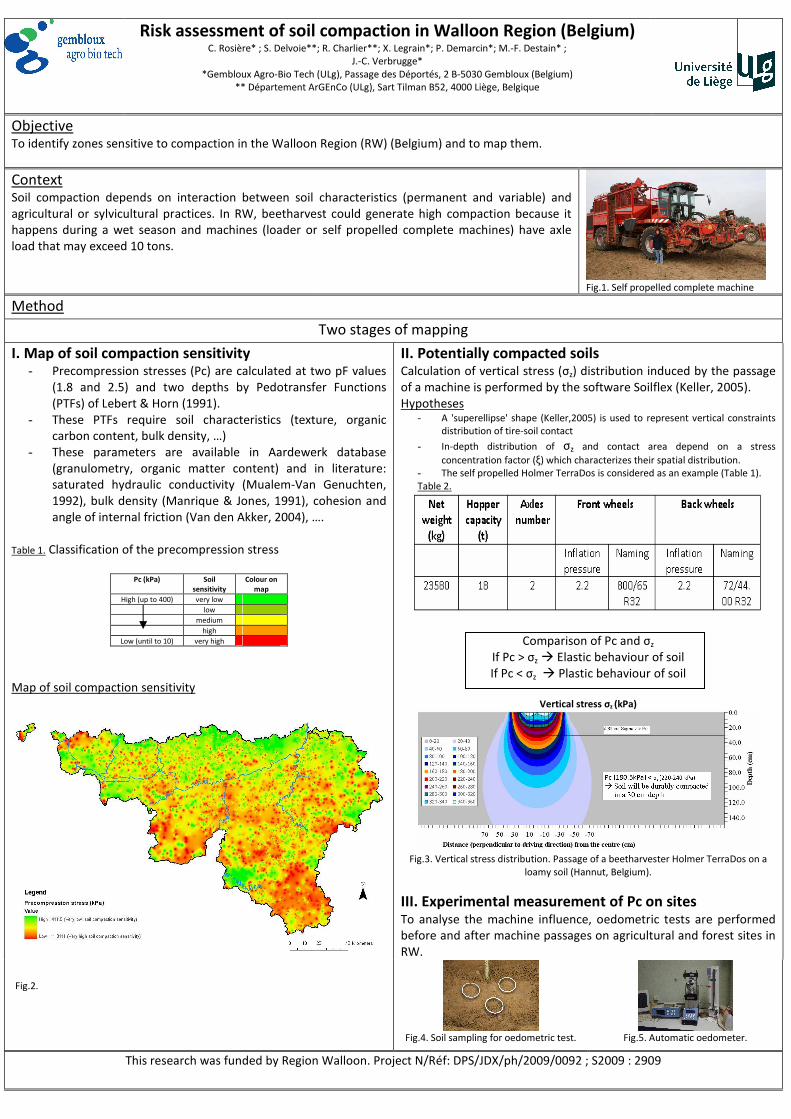
Risk assessment of soil compaction in Walloon Region (Belgium) C. Rosière* ; S. Delvoie**; R. Charlier**; X. Legrain*; P. Demarcin*; M.-F. Destain* ;
J.-C. Verbrugge*
*Gembloux Agro-Bio Tech (ULg), Passage des Déportés, 2 B-5030 Gembloux (Belgium)
** Département ArGEnCo (ULg), Sart Tilman B52, 4000 Liège, Belgique
Objective To identify zones sensitive to compaction in the Walloon Region (RW) (Belgium) and to map them.
Context
Soil compaction depends on interaction between soil characteristics (permanent and variable) and
agricultural or sylvicultural practices. In RW, beetharvest could generate high compaction because it
happens during a wet season and machines (loader or self propelled complete machines) have axle
load that may exceed 10 tons.
Fig.1. Self propelled complete machine
Method
Two stages of mapping
I. Map of soil compaction sensitivity - Precompression stresses (Pc) are calculated at two pF values
(1.8 and 2.5) and two depths by Pedotransfer Functions
(PTFs) of Lebert & Horn (1991).
- These PTFs require soil characteristics (texture, organic
carbon content, bulk density, …)
- These parameters are available in Aardewerk database
(granulometry, organic matter content) and in literature:
saturated hydraulic conductivity (Mualem-Van Genuchten,
1992), bulk density (Manrique & Jones, 1991), cohesion and
angle of internal friction (Van den Akker, 2004), ….
Table 1. Classification of the precompression stress
Pc (kPa) Soil
sensitivity
Colour on
map
High (up to 400) very low
low
medium
high
Low (until to 10) very high
Map of soil compaction sensitivity
II. Potentially compacted soils Calculation of vertical stress (σz) distribution induced by the passage
of a machine is performed by the software Soilflex (Keller, 2005).
Hypotheses - A 'superellipse' shape (Keller,2005) is used to represent vertical constraints
distribution of tire-soil contact
- In-depth distribution of σz and contact area depend on a stress
concentration factor (ξ) which characterizes their spatial distribution.
- The self propelled Holmer TerraDos is considered as an example (Table 1).
Table 2.
Comparison of Pc and σz
If Pc > σz � Elastic behaviour of soil
If Pc < σz � Plastic behaviour of soil
Vertical stress σz (kPa)
Fig.3. Vertical stress distribution. Passage of a beetharvester Holmer TerraDos on a
loamy soil (Hannut, Belgium).
III. Experimental measurement of Pc on sites To analyse the machine influence, oedometric tests are performed
before and after machine passages on agricultural and forest sites in
RW.
Fig.2.
Fig.4. Soil sampling for oedometric test.
Fig.5. Automatic oedometer.
This research was funded by Region Walloon. Project N/Réf: DPS/JDX/ph/2009/0092 ; S2009 : 2909