Risk Assessment for Listeria monocytogenes in Ready … Assessment for Listeria monocytogenes in...
77
Risk Assessment for Listeria monocytogenes in Ready-to-eat Meat and Poultry Products Sarah Ann Endrikat Thesis submitted to the faculty of the Virginia Polytechnic Institute and State University in partial fulfillment of the requirements for the degree of Master of Science In Environmental Engineering Dan Gallagher Mark Widdowson Eric Ebel August 20, 2008 Blacksburg, Virginia Keywords: Listeria monocytogenes, listeriosis, foodborne pathogen, risk assessment Copyright 2008
Transcript of Risk Assessment for Listeria monocytogenes in Ready … Assessment for Listeria monocytogenes in...

Risk Assessment for Listeria monocytogenes in Ready-to-eat Meat
and Poultry Products
Sarah Ann Endrikat
Thesis submitted to the faculty of the Virginia Polytechnic Institute and State University in
partial fulfillment of the requirements for the degree of
Master of Science
In
Environmental Engineering
Dan Gallagher
Mark Widdowson
Eric Ebel
August 20, 2008
Blacksburg, Virginia
Keywords: Listeria monocytogenes, listeriosis, foodborne pathogen, risk assessment
Copyright 2008

Risk Assessment for Listeria monocytogenes in Ready-to-eat Meat
and Poultry Products
Sarah Ann Endrikat
ABSTRACT
Various control methods used in the meat and poultry processing environment to mitigate
listeriosis were evaluated using a dynamic in-plant Monte Carlo model. These control methods
included food contact surface testing, sanitation, post-processing lethality treatment, and product
formulation with microbial growth inhibitors. The dynamic in-plant model served as an input
into the risk assessment model developed by the FDA and FSIS in 2003 which predicts the
number of deaths and illnesses resulting from the use of each control method. The use of growth
inhibitors combined with a post-processing lethality step was estimated to save over 200 more
lives than the FSIS proposed minimum sampling standard.
An analysis of data collected by the National Alliance for Food Safety and Security
(NAFSS) found that retail-sliced deli meats have a greater prevalence and concentration of L.
monocytogenes than prepackaged deli meats. Cross contamination at the retail level is suspected
due to clustering of sample positives by store and the influence of sampling time of day on the
prevalence of L. monocytogenes.
The comparative risk of Listeria monocytogenes in retail sliced versus prepackaged deli
meats was evaluated using a modified version of the 2003 FDA-FSIS risk assessment model
which considered slicing location and the use of growth inhibitors. The comparative risk ratio
for the number of deaths from retail-sliced versus prepackaged deli meats was found to be 9.1
and retail-sliced product with a growth inhibitor was found to be at greater risk for listeriosis
than prepackaged product without growth inhibitor.

iii
Table of Contents
List of Figures ................................................................................................................................. v
List of Tables ................................................................................................................................. vi
Chapter 1. Introduction ................................................................................................................... 1
In-Plant Dynamic Model................................................................................................................. 5
1.1 Introduction..................................................................................................................... 5
1.2 Material and Methods ..................................................................................................... 6
1.2.1 Model Overview. .................................................................................................... 6
1.2.2 Model Limitations................................................................................................... 6
1.2.3 In-plant Dynamic Model......................................................................................... 7
1.2.4 Contamination Event Parameters............................................................................ 9
1.2.5 Model Parameters ................................................................................................. 10
1.2.6 Food Contact Surface and RTE Product Testing. ................................................. 17
1.3 Results and Discussion ................................................................................................. 20
1.3.1 Effect on Listeria concentrations at retail. ............................................................ 20
1.3.2 Public Health Effects. ........................................................................................... 24
1.3.3 Public health policy............................................................................................... 25
1.4 Conclusions................................................................................................................... 26
Chapter 2. Listeria monocytogenes Prevalence and Level in Ready-to-eat Meat and Poultry deli
meat............................................................................................................................................... 28
2.1 Introduction................................................................................................................... 28
2.2 Materials and Methods.................................................................................................. 28
2.2.1 Data Collection. .................................................................................................... 28
2.2.2 Statistical Analyses ............................................................................................... 29
2.3 Results........................................................................................................................... 30
2.3.1 Prevalence and Number of Samples ..................................................................... 30
2.4 Logistic Regression....................................................................................................... 40
2.5 Comparison of Findings of the National Alliance for Food Safety and Security with
those of the Food Processors Association................................................................................. 43
2.6 Conclusions................................................................................................................... 45

iv
Chapter 3. Comparative Risk of Listeria monocytogenes in Ready-to-Eat Meat and Poultry
Products......................................................................................................................................... 47
3.1 Introduction................................................................................................................... 47
3.2 Materials and Methods.................................................................................................. 48
3.2.1 L. monocytogenes sampling. ................................................................................. 48
3.2.2 Statistical Analysis................................................................................................ 48
3.2.3 Risk Assessment Modeling................................................................................... 48
3.2.4 Use of Growth Inhibitors. ..................................................................................... 51
3.2.5 Exponential Growth Rate...................................................................................... 52
3.2.6 Distribution Fitting................................................................................................ 53
3.2.7 Exposure Assessment Modeling. .......................................................................... 55
3.2.8 Dose Response Modeling. .................................................................................... 56
3.2.9 Sensitivity Analysis .............................................................................................. 57
3.3 Results........................................................................................................................... 57
3.3.1 Sensitivity Analysis. ............................................................................................. 62
3.4 Discussion and Conclusions ......................................................................................... 63
Chapter 4. Conclusions ................................................................................................................. 66
References..................................................................................................................................... 68

v
List of Figures
Figure 1. Conceptual model showing the flow of Listeria from the original contamination event
through sanitation measures, post processing, packaging, and on to retail distribution.8
Figure 2. Quantiles of L. monocytogenes at retail for various scenarios tested............................ 21
Figure 3. Retail Listeria concentrations for sampling versus post-processing and growth
inhibitors. ..................................................................................................................... 22
Figure 4. Example temporal clustering during contamination events. ......................................... 23
Figure 5. Estimated number of deaths among the elderly for the various scenarios tested. ......... 25
Figure 6. Fraction of RTE meat production by Interim Final Rule alternative. ........................... 26
Figure 7. Number of RTE samples by location of slicing. ........................................................... 34
Figure 8. Prevalence of L. monocytogenes in deli meat by location of slicing............................. 35
Figure 9. Number of deli meat samples collected per store.......................................................... 36
Figure 10. Number of RTE samples by deli meat type................................................................. 37
Figure 11. Prevalence of L. monocytogenes in RTE deli meats by deli meat type....................... 38
Figure 12. Prevalence of L. monocytogenes in RTE deli meats samples sliced at retail by store. 40
Figure 13. Graphical display of logistic regression results using deli meat sample prevalence at
individuals stores as the dependent variable. ............................................................... 43
Figure 14. Flowchart of the exposure assessment model. Adapted from FDA-FSIS, 2003 (7). . 50
Figure 15. Flowchart of the dose-response model. Adapted from FDA-FSIS, 2003 (7)............. 51
Figure 16. Fitted cumulative density plots for retail- and plant-sliced data. ................................ 55
Figure 17. Recursive partitioning and regression tree. ................................................................. 59
Figure 18. Box plots for each deli meat category by age group. .................................................. 60
Figure 19. Interaction plots comparing the effect of growth inhibitor (GI) use and slicing location
on the mean number of deaths from listeriosis. ........................................................... 61

vi
List of Tables
Table 1. Variables and base values for sanitation of food contact surface. .................................. 11
Table 2. Variables and base values for Listeria concentration on food contact surface............... 11
Table 3. Lot (per line per shift) weight by plant size.................................................................... 12
Table 4. Variables and base values for the concentration of L. monocytogenes in a RTE product
lot produced in the plant............................................................................................... 13
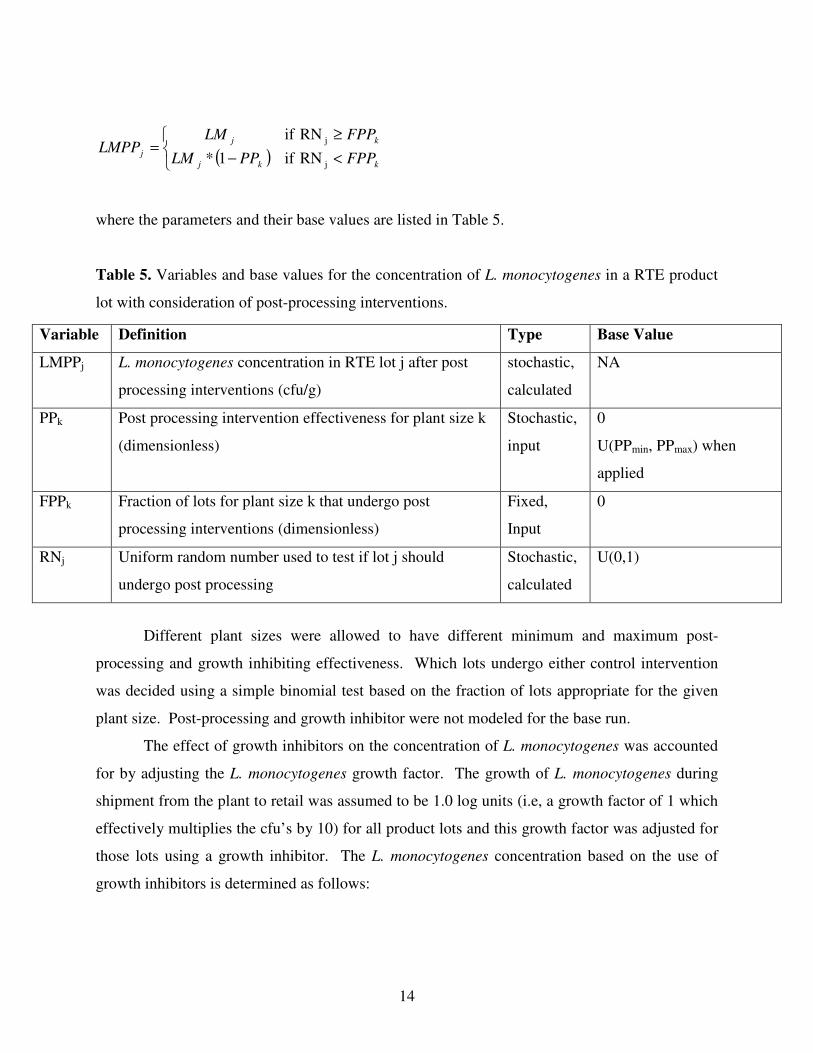
Table 5. Variables and base values for the concentration of L. monocytogenes in a RTE product
lot with consideration of post-processing interventions............................................... 14
Table 6. Variables and base values for modeling growth of L. monocytogenes in product. ........ 15
Table 7. Variables and base values for modeling retail concentration of L. monocytogenes in a
product lot. ................................................................................................................... 16
Table 8. Prevalence of positive product samples1 and stores visited based on sampling site. ..... 31
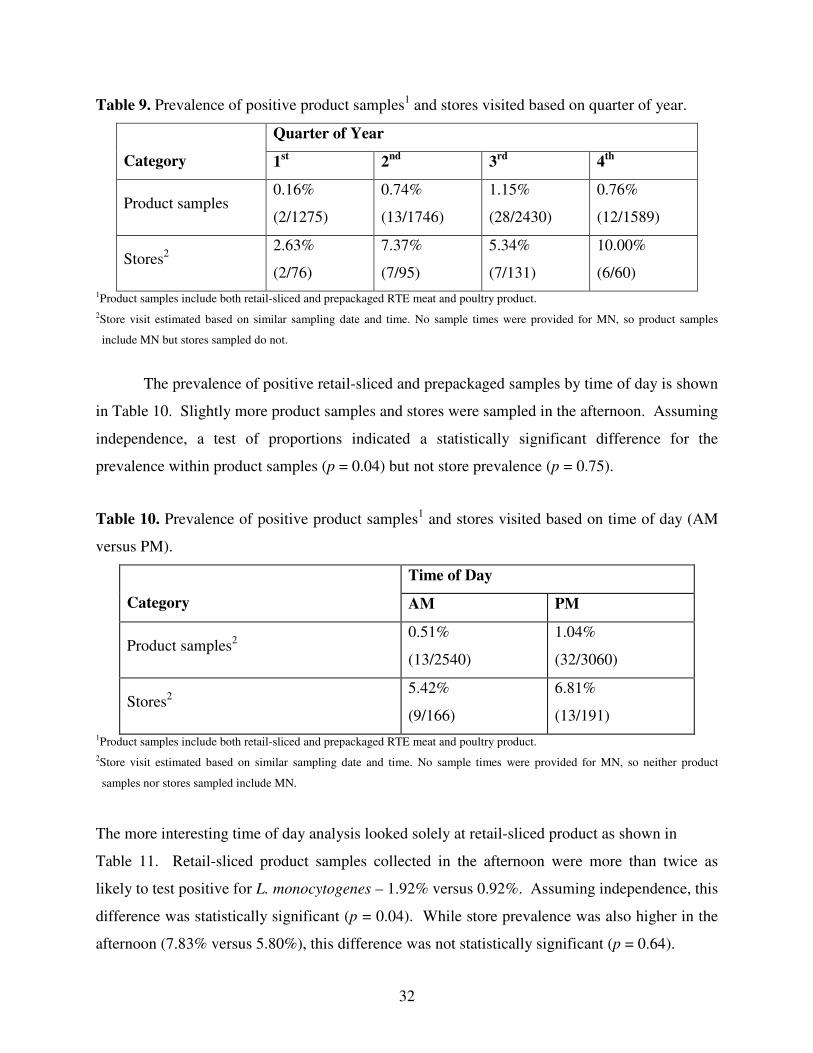
Table 9. Prevalence of positive product samples1 and stores visited based on quarter of year. ... 32
Table 10. Prevalence of positive product samples1 and stores visited based on time of day (AM
versus PM). .................................................................................................................. 32
Table 11. Prevalence of positive retail-sliced product and stores visited based on time of day
(AM versus PM)........................................................................................................... 33
Table 12. Prevalence of positive product samples1 and stores visited based on store type. ......... 33
Table 13. Prevalence of L. monocytogenes in retail-sliced and prepackaged deli meat by site. .. 35
Table 14. Results of logistic regression for store prevalence as function of slicing location, store
type, and time of day indicator variables. .................................................................... 42
Table 15. Prevalence of L. monocytogenes in sliced deli meat by site and slicing location from
the Food Products Association (14). ............................................................................ 44
Table 16. Level of L. monocytogenes in deli meats at retail......................................................... 45
Table 17. Overall results of statistical tests for prevalence of L. monocytogenes on RTE meat and
poultry deli meats by location, season, time of day for slicing at retail, and by deli
meat type. ..................................................................................................................... 46
Table 18. Estimated fraction of production among the various alternatives before and after
implementation of Interim Final Rule 9 CFR 430. ...................................................... 52
Table 19. Survival analysis input for statistical distribution fitting for the level of L.
monocytogenes in deli meats at retail........................................................................... 54

vii
Table 20. Fraction of deli meat production by slicing location and growth inhibitor use during
July 2007. ..................................................................................................................... 56
Table 21. Estimated mean number of deaths per year and 95% confidence interval about the
mean among three populations stratified by age and four deli meat categories. ......... 58
Table 22. Estimated mean number of deaths and illnesses per annum by fraction of consumer
storage time. ................................................................................................................. 62
Table 23. Mean number of deaths and illnesses per annum by shelf life. .................................... 63
Table 24. EGR for product with and without growth inhibitor by shelf life. ............................... 63

1
Chapter 1. Introduction
Listeriosis is a serious public health issue due to its severity of infection and high case
fatality rate. According to the Centers for Disease Control and Prevention (CDC), there are an
estimated 2,500 cases of listeriosis in the United States each year, resulting in 500 deaths (20).
Persons with compromised immune systems, pregnant women, neonates, and the elderly are at
the greatest risk of listeriosis. Listeriosis is caused by infection with the foodborne pathogen
Listeria monocytogenes. Numerous listeriosis outbreaks have been linked to ready-to-eat foods
(7). Ready-to-eat foods are products which are in edible form and require no additional
preparation to achieve food safety (11). Ready-to-eat foods may become contaminated with L.
monocytogenes due to cross contamination or physical contact with contaminated raw foods.
Out of 23 ready-to-eat food categories studied, meat and poultry products were found to pose the
greatest risk for listeriosis (7). Although the incidence of listeriosis has seen a steady decline
from 1996 to 2003 (29), trends observed at Foodborne Diseases Active Surveillance Network
(FoodNet) sites indicate that the incidence has since leveled off (23). The CDC set a target
incidence rate of 2.5 cases per 100,000 population for the year 2005, however, in 2007, this goal
has not been met indicating that additional measures must be taken in order to meet this goal by
2010 (4). The objectives of this work are (i) to evaluate various industry practices and
procedures within meat and poultry processing facilities on their ability to mitigate L.
monocytogenes contamination and (ii) to investigate and compare the risk of listeriosis from deli
meat sliced and packaged at processing establishments versus those sliced and packaged at a
retail slicing location.
Previous research suggests that slicing location of deli meats may have a significant effect
on L. monocytogenes prevalence in ready-to-eat product. In a study conducted by Gombas et
al.(14), ready-to-eat deli meats sliced and packaged at the retail level were found to have a
higher prevalence of L. monocytogenes than deli meats sliced and packaged at a processing
facility. Since the focus of this study was to conduct a survey of L. monocytogenes across a
number of ready-to-eat foods, it did not exclusively examine deli meats. Therefore, this finding
was based on limited data and further analysis was necessary to explain this difference. In 2006,
the National Alliance for Food Safety and Security (NAFSS) completed a more comprehensive
study with the intention of evaluating the relative risk of listeriosis from deli meat sliced and

2
packaged at processing facilities versus those sliced and packaged at retail (6) This paper uses
the dataset collected from the NAFSS study to perform a comparative analysis of the relative risk
of listeriosis from deli meats sliced at retail versus prepackaged. Additionally, the relative risk
of listeriosis for product formulated with and without growth inhibitors was considered. Basic
assumptions of shelf life of ready-to-eat deli meats and typical consumer storage times were
validated and their influence on the outcome of the study were assessed.
Gombas et al. surveyed Listeria monocytogenes in eight categories of ready-to-eat foods.
The purpose of this study was to generate data for calculating the risk of listeriosis across a
number of food groups. The result was the recognition of trends in the prevalence of L.
monocytogenes in deli meats. A prevalence of 0.4% was estimated for luncheon meats packaged
by the manufacturer versus 2.7% for luncheon meats packaged “in-store.” These numbers were
based on a total of 9,199 samples collected from two FoodNet sites. Approximately half of the
samples were collected from a Maryland site and half were collected from a northern California
site. One limitation to this study was that the overall prevalence of L. monocytogenes observed
at the two FoodNet sites were inexplicably different. The prevalence of L. monocytogenes at the
Maryland and the northern California sites were 1.17% and 0.61% respectively. While the
results of this study indicated that slicing location of deli meats has an effect on the prevalence of
L. monocytogenes in retail deli meats, the unexplained difference between overall prevalence of
L. monocytogenes at the two FoodNet sites suggested that further research was necessary to
confirm these findings. Moreover, identification of the factors contributing to the elevated
prevalence of L. monocytogenes in retail-sliced deli meats was necessary in understanding this
difference.
Transmission of L. monocytogenes in retail delis may be one factor contributing to the
elevated risk of listeriosis from retail-sliced products compared to prepackaged products. Retail
delis are most commonly out of compliance with the FDA Food Code for improper holding
times and temperatures of product, poor personal hygiene of workers handling product, and a
lack of adequate safeguards against contamination (8). Since retail-sliced deli meats are sliced
and handled immediately prior to purchase by the consumer, exposure to these factors may
increase the risk of contamination with L. monocytogenes.
Previous studies have found that contamination via deli meat processing equipment is a
common pathway for L. monocytogenes transmission. Lunden et al. (19) conducted an

3
experiment by relocating a dicing machine to three different plants and tracking the movement of
persistent L. monocytogenes strains. It was found that despite regular cleaning and disinfection
of the machine, adherence to stainless steel allowed persistent L. monocytogenes strains to be
transferred from one plant to the next. Vorst et al. (30) investigated the transfer of L.
monocytogenes during the slicing of turkey, bologna, and salami. This study considered the
transfer of L. monocytogenes from an inoculated slicer blade to uninoculated product and from
inoculated product to uninoculated product via the slicer. The transfer of L. monocytogenes from
an inoculated slicer blade to uninoculated product occurred for all three product types. Transfer
of L. monocytogenes from inoculated product to uninoculated product via the slicer was
exhibited at L. monocytogenes levels of 108 CFU/cm
2. For lower levels, L. monocytogenes was
only found to be transferred at detectable levels for certain products and the transfer from one
product type to another was found to be dependent on the order of slicing. The results of this
study indicated that L. monocytogenes may be spread through the use of a mechanical slicer on
contaminated meat and poultry product. When slicing occurs within a processing plant, this
contamination may be mitigated through the use of post-processing treatments, however, retail-
sliced deli meats are purchased immediately after slicing, therefore any contamination
originating at the slicer is passed on the consumer.
The detection of L. monocytogenes in ready-to-eat products has been found to be effected
by consumer refrigerated storage times and deli meat sample sizes. Lin et al. (18) conducted a
study including an analysis on the fate of L. monocytogenes during refrigerated storage and the
effect of sample size on the efficacy of the BAX-PCR and U.S. Department of Agriculture –
Food Safety and Inspection Service enrichment culture assays in detecting L. monocytogenes. It
was found that using larger cell numbers of Listeria for inoculation resulted in a greater number
of samples positive for L. monocytogenes and increasing the sample size taken improved the
detection of L. monocytogenes. Also, growth of L. monocytogenes occurred during the storage
of ready-to-eat deli meats even when kept at a constant 4°C. A study by Wallace et al. (31)
specifically focused on the recovery rate of L. monocytogenes during extended refrigerated
storage. Some plants with frankfurters testing negative for L. monocytogenes during the first 5
days of storage had a significant percent of positive samples from frankfurters taken from the
same lot that were stored for 30 days. There was no statistical difference between the recovery
rate of L. monocytogenes for packages stored at 4° or 10°C. This study indicated the importance

4
of detecting Listeria at low levels before it is able to grow to dangerous levels and the
importance of carefully monitoring consumer storage times. Also, observed clustering of
positive samples at individual plants indicated that cross contamination was occurring in plants
contaminated with L. monocytogenes.
To help reduce and control the growth of Listeria, many processing plants formulate meat
and poultry products with microbial growth inhibitors. In the United States sodium or potassium
lactates combined with sodium diacetate are the most common antimicrobial agents in ready-to-
eat meat processing facilities (13). Other antimicrobials include sodium or potassium acetate,
and sodium diacetate used singly. In 2000, the U.S. Department of Agriculture-Food Safety and
Inspection Service (USDA-FSIS) set the permissible level of the sodium lactate at 3% and
allowed the use of 0.25% sodium acetate and sodium diacetate as an antimicrobial agent in cured
meat products. A study conducted by Bedie et al. (2) compared the effectiveness of
antimicrobial agents on frankfurters stored at 4°C. At 3% sodium lactate there was no significant
L. monocytogenes growth until day 90. In comparison, 0.25% sodium acetate permitted
significant growth of L. monocytogenes at 35 days. In frankfurters not formulated with
antimicrobials, L. monocytogenes levels rose from 3.2 - 3.4 log CFU/cm2 to over 6 log CFU/cm
2
in only 20 days. The results of this study indicated that antimicrobials are effective in
suppressing the growth of L. monocytogenes during refrigerated storage and controlling post-
processing contamination of L. monocytogenes in ready-to-eat meat products , however even the
use of an antimicrobial agent may not prevent L. monocytogenes for the targeted retail shelf life
of 75 to 90 days (32).
The following chapters present three studies that build upon the previous research
concerning L. monocytogenes contamination in ready-to-eat deli meat products. The first
compares the effect of microbial growth inhibitors to post-processing lethality and traditional
testing and sanitation regimes in mitigating L. monocytogenes contamination. The second
analyzes the presence and level of L. monocytogenes based on slicing location as well as store
type (large chain or independent grocer) and time of day (AM or PM) and the final study
calculates the comparative risk of retail-sliced versus prepackaged deli meats. The concluding
chapter summarizes the findings and conclusions from each of these three studies.

5
In-Plant Dynamic Model
1.1 Introduction
Listeria monocytogenes is a foodborne pathogen that is able to grow at refrigeration
temperatures and is resistant to many controls used for other foodborne pathogens (11). It is
found on foods, in household refrigerators, and within food processing environments. It can be
present in ready-to-eat (RTE) foods due to post-processing contamination (20). Listeria
monocytogenes contamination is a critical public health issue, owing to the severity of infection
and high case fatality rate of its associated disease listeriosis (20). In 2003, the Food and Drug
Administration (FDA) and the Food Safety and Inspection Service (FSIS) completed a risk
assessment identifying which RTE foods pose the greatest risk of listeriosis (7). Of the 23 RTE
food categories evaluated, deli meats were found to pose the highest per annum risk of illness
and death. To reduce the prevalence of L. monocytogenes in RTE meat and poultry, product
testing and sanitation are conventional control methods utilized by processing plants. Post-
processing lethality and the use of growth inhibitors are other methods of control.
The objectives of this work were to develop a model to:
i) Determine the effectiveness of various food contact surface testing and sanitation regimes
on mitigating L. monocytogenes contamination in finished RTE product
ii) Determine the effectiveness of other interventions (e.g., post-processing lethality or the
use of growth inhibitors) in mitigating L. monocytogenes contamination in finished RTE
product.
To address these objectives, a dynamic in-plant Monte Carlo model (referred to as the in-
plant model) was developed to quantitatively characterize the relationship between Listeria
species in the in-plant environment and L. monocytogenes in deli meats at retail. The output of
the in-plant model was the concentration of L. monocytogenes on deli meat at retail which was
input to the 2003 FDA-FSIS exposure assessment model for deli meats (7). The FDA-FSIS
exposure assessment model is coupled with the dose-response model to provide estimates of the
subsequent risk of illness or death from consuming RTE products across three population
groups: elderly, intermediate, and neonatal. These two connected models – the in-plant model
and the FDA-FSIS exposure assessment and FDA-FSIS dose-response relationship – comprise
the overall FSIS Listeria risk assessment model. The FSIS Listeria risk assessment model was

6
used to evaluate the effectiveness of various control interventions in mitigating L.
monocytogenes contamination of RTE product and reducing the subsequent risk of illness or
death from listeriosis.
1.2 Material and Methods
1.2.1 Model Overview.
The in-plant model uses Monte Carlo sampling to predict the concentration of L.
monocytogenes in each lot of RTE product across time resulting in a dynamic model. In this
model, a lot was defined as the product produced in an 8-hour period. Many of the parameters
used in the model are stochastic random variables meaning that different values are selected for
each lot produced. The exposure assessment for deli meats also uses Monte Carlo sampling.
The inputs for the in-plant model are modeled as variability distributions. The number
and deposition of Listeria organisms are tracked for both food contact surface area and the
product across time using a mass balance approach. The L. Monocytogenes concentration for
RTE deli meat at retail modeled by the in-plant model is input to the exposure assessment model
and dose-response model to estimate the risk of illness or death on a per serving and per annum
basis for L. monocytogenes on RTE meat and poultry products. The estimated number of
illnesses and deaths are ultimately modeled as functions of Listeria species testing and sanitation
frequency of food contact surfaces, post-processing lethality, and the use of growth inhibitors.
Deli meats were selected for this model based on the 2003 FDA-FSIS risk ranking analysis that
found this food category to pose the greatest risk of illness and death among consumers (7).
1.2.2 Model Limitations.
The data available within the published literature dealing with Listeria in the processing
plant environment was limited. The limited data, the time available for model development, and
the intended use of the model dictated the following:
i) Food contact surfaces are the only source of Listeria species/L. monocytogenes
considered by the model
ii) Food contact surfaces have no spatial component within the plant (e.g., slicer,
conveyor belt, etc.).

7
iii) Listeria species are considered to be evenly distributed across food contact surfaces
iv) L. monocytogenes is considered to be evenly distributed within the product lot
v) The RTE product lot is the smallest unit for which model results are available
vi) Testing and sanitation affect the distribution of Listeria at retail, but do not change the
timing, duration, or concentration of L. monocytogenes transferred during a
contamination event.
1.2.3 In-plant Dynamic Model.
A schematic overview of the conceptual model is provided in Figure 1 below. The model
assumes that a Listeria reservoir exists in the plant that is capable of contaminating the food
contact surface. This reservoir can be harborage sites such as floor drains or air conditioning
ducts, or other surfaces/equipment in the plant (19).
8
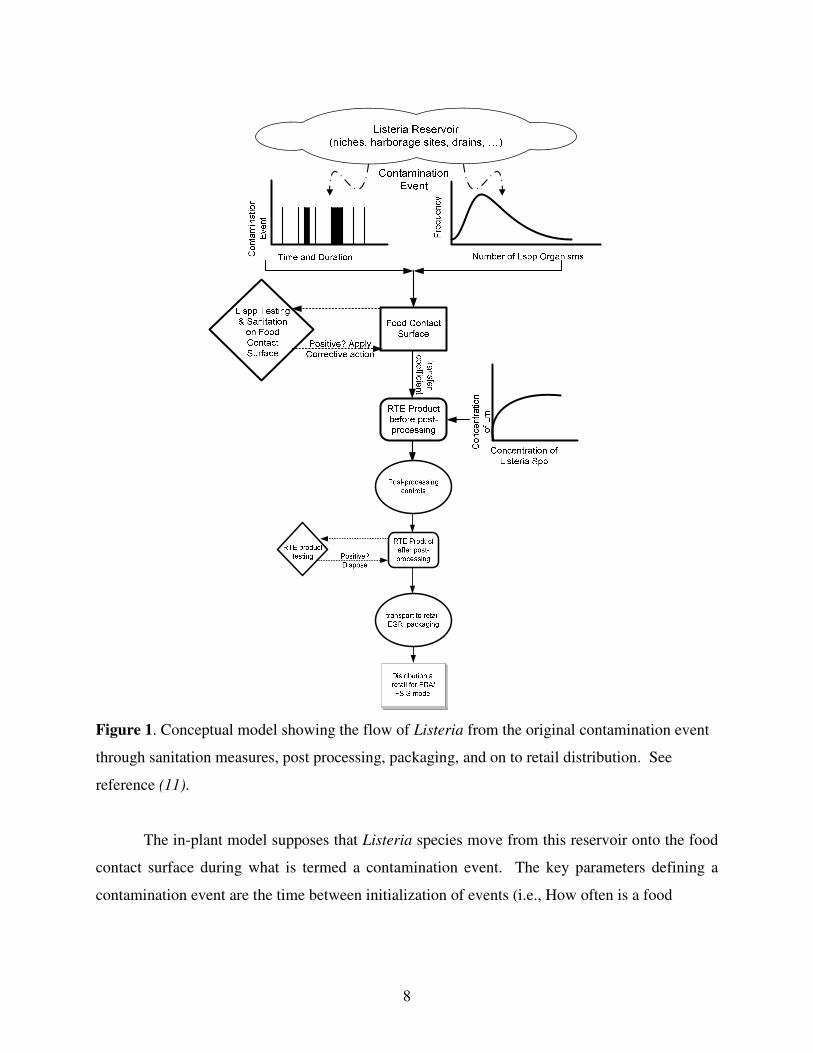
Figure 1. Conceptual model showing the flow of Listeria from the original contamination event
through sanitation measures, post processing, packaging, and on to retail distribution. See
reference (11).
The in-plant model supposes that Listeria species move from this reservoir onto the food
contact surface during what is termed a contamination event. The key parameters defining a
contamination event are the time between initialization of events (i.e., How often is a food

9
contact surface contaminated?); the duration of the event (i.e., How long does it last?); and the
amount of Listeria species transferred from the in-plant reservoir to the food contact surface.
1.2.4 Contamination Event Parameters
The frequency of a contamination event was estimated based on time series Listeria
species prevalence data taken from an FSIS in-depth verification conducted in a plant that was
associated with an L. monocytogenes outbreak in humans (16). The data were analyzed using
survival analysis and distribution fitting using NCSS statistical software (15). Based on this
analysis, the data were found to best fit the lognormal distribution. The mean time between
contamination events was found to be approximately 20 days ± 29 days.
The duration of a contamination event was estimated based on sequential weekly Listeria
species testing results from Tompkin (26). These data provided the number of consecutive
weeks that Listeria species positives persisted during the weekly testing, allowing the duration of
a contamination event to be estimated. For ease of interpretation, consistency, and based on the
maximum likelihood fit as determined using survival analysis and distribution fitting, these data
were also fit to a lognormal distribution for model simulation. The mean contamination event
duration was found to be approximately 9 days ± 20 days.
Once the frequency and duration of a contamination event were estimated, the amount of
Listeria species transferred from the in-plant reservoir to the food contact surface needed to be
determined. As there was no reported literature available to estimate the Listeria spp. transferred
from a harborage site to a food contact surface during a contamination event, the parameters
were calibrated so that the simulated distribution of Listeria spp. concentration at retail under
baseline conditions matched the observed FDA-FSIS risk ranking model’s input for L.
monocytogenes contamination at retail. The parameter vales for the baseline conditions are
given in the Base Value column of each variable table provided. These parameters were changed
as necessary to simulate the desired control scenarios. The mean Listeria spp. transferred was
calibrated to a mean log value of -6 cfu/cm2/shift (one lot per shift) with a standard deviation of
3.5 cfu/cm2.
The amount of Listeria species then transferred from the food contact surface to the RTE
product was estimated based on a number of factors including the transfer coefficient for Listeria
species and the effectiveness of in-plant sanitation procedures. The transfer coefficient (TC)
ranged from 0 to 1 and indicated the fraction of Listeria species transferred from the food contact

10
surface to the product lot being processed. A transfer coefficient of 1 indicated that all the
Listeria species on the food contact surface were transferred to the lot. A transfer coefficient of
0 indicated that the Listeria species transferred from the harborage site remained on the food
contact surface. The mean transfer coefficient of 0.72 was assumed based on the work of
Midelet and Carpentier (21). This is equivalent to a mean log transfer coefficient of -0.14. A
standard deviation of 1 log was assumed based on the studies conducted by Montville et al. (22)
and Chen et al. (5). During a contamination event, the in-plant model modifies the concentration
of Listeria species on the food contact surface by a stochastic amount for each RTE lot simulated
to account for the transfer of organisms from the harborage site to the food contact surface.
1.2.5 Model Parameters
Sanitation effectiveness measures the proportion of bacteria on the food contact surface
that are removed through sanitation procedures. The model assumes the effectiveness of
sanitation between lots is 50% and the effectiveness of sanitation measures at the end of the day
is 75%. Therefore, total effectiveness of daily routine cleaning is actually 1-[(1-50%)*(1-
75%)]=87.5%, or just less than a one log10 reduction in the amount of contamination remaining
on food contact surfaces. The sanitation effectiveness was evaluated for each lot as follows,:
selectedoption sanitation enhanced and positive, testedLS if
day oflot 2nd if
day oflot 1st if
lags-j
=
enhan
sop
wipe
j
s
s
s
s
where the parameters and their base values are listed in Table 1.

11
Table 1. Variables and base values for sanitation of food contact surface.
Variable Definition Type Base Value
sj sanitation effectiveness for RTE lot j calculated NA
swipe between-lot sanitation effectiveness (dimensionless) fixed, input 0.50
ssop end of day sanitation effectiveness (dimensionless) fixed, input 0.75
senhan
enhanced sanitation effectiveness if a previous FCS was
tested, found positive, and the enhanced sanitation option
is selected (dimensionless)
fixed, input 0.95
LSj Listeria spp concentration on food contact surface at end
of lot j (cfu/cm2)
stochastic,
calculated NA
slag Slag=FCS report lag in days x number of lots produced per
day (lot units, i.e. time) fixed, input
6
(3 days x 2 lots per day)
Based on the transfer coefficient and sanitation effectiveness, the Listeria species
concentration on the food contact surface was calculated as:
( )( ) ( ) ( )jjjj sTCjLSLS −−+= − 111 δ
where the parameters and their base values are listed in Table 2.
Table 2. Variables and base values for Listeria concentration on food contact surface.
Variable Definition Type Base Value
TCj transfer coefficient for lot j that explains the fraction of
Listeria transferred from food contact surfaces to RTE
product (dimensionless)
stochastic,
input
LN(-0.14, 1), truncated to
between 0 and 1
δ(j) Listeria spp. concentration added to the food contact
surface if a contamination event is ongoing (cfu/cm2)
( )
−=
evention contaminat during if
evention contaminat duringnot if
)5.3,6(~
0
LNRNjδ
stochastic,
input
LN(-6, 3.5)

12
Once the number of Listeria species present on the food contact surface was calculated,
the model calculated the Listeria species concentration per gram of product in each lot. The lot
size varied based on the size of the processing plant. Three different processing plant sizes were
modeled in this research; large, small, and very small. The size of each plant was classified
according to Hazard Analysis and Critical Control Point (HACCP) guidelines where a large plant
is defined as having 500 or more employees, a small plant defined as having 10 or more, but
fewer than 500 employees, and a very small plant defined as having less than 10 employees (24).
The fraction of the deli meat food supply produced by large, small and very small plants and the
pounds per shift per line for each plant size were estimated. A survey among RTE processors of
deli meats as reported by FSIS found that for deli meats, about 48% of the food supply is
produced by large plants, 48% by small plants, and the remaining 4% by very small plants (11).
The estimated average production volume in pounds of deli meats per line per shift is shown in
Table 3.
Table 3. Lot (per line per shift) weight by plant size.
Plant size Lot weight (lbs) Lot standard deviation (lbs)
Large 19371 14000
Small 7100 10600
Very Small 2800 9500
Lot weights (i.e., pounds of deli meat per line per shift) were varied stochastically from
lot to lot. These distributions were assumed to be normal. Simulated lot weights less than 1000
pounds were rounded up to 1000 pounds.
While the survey found that the average mass of a lot of RTE product varied by plant
size, there was no evidence of a difference in the occurrence of L. monocytogenes in RTE
product by plant size. To account for the variation in lot mass, the model adjusted the food
contact surface area by plant size.
Next, the Listeria species concentration was converted to a concentration of L.
monocytogenes using a L. monocytogenes to Listeria species ratio. This ratio was estimated
from available data on the prevalence of L. monocytogenes to Listeria species. The data
indicated whether or not a food contact surface was positive for L. monocytogenes when a

13
surface was found positive for Listeria species. These prevalence data were available from the
published literature (26) and some unpublished industry data provided to FSIS (33). The mean
ratio of Listeria species/L. monocytogenes was found to be 52% and the standard deviation was
26%. Using this Listeria species/L. monocytogenes concentration ratio, the L. monocytogenes
concentration in the RTE lot was calculated as:
( )( )j
j
j
jjj RM
ATCjLSLM ×××+= − δ1
where the parameters and their base values are listed in Table 4.
Table 4. Variables and base values for the concentration of L. monocytogenes in a RTE product
lot produced in the plant.
The model also considered the effect of post-processing lethality and growth inhibitors in
determining the L. monocytogenes concentration at retail. Post-processing lethality treatment
reduces the concentration of L. monocytogenes in the product and growth inhibitors limit the
growth of L. monocytogenes during the distribution of product from the plant to retail. The
concentration of L. monocytogenes based on the use of post-processing lethality is determined as
follows:
Variable Definition Type Base Value
LMj L. monocytogenes concentration in RTE product lot j,
cfu/g
stochastic,
calculated
NA
Aj* food contact surface area at lot j , stochastic (* only varies
for new contamination event), cm2
stochastic,
input
U(100000, 1000000)
Mj mass of lot j, lb, internally converted to g stochastic,
input
varies by plant size
large: N(19371, 14000)
small: N(7100, 10600)
very small: N(2800, 9500)
Rj L. monocytogenes / Listeria spp ratio for lot j
(dimensionless)
stochastic,
input
N(0.52, 0.26), truncated to
between 0 and 1
14
( )
<−
≥=
kkj
kj
j FPPPPLM
FPPLMLMPP
j
j
RN if1*
RN if
where the parameters and their base values are listed in Table 5.
Table 5. Variables and base values for the concentration of L. monocytogenes in a RTE product
lot with consideration of post-processing interventions.
Different plant sizes were allowed to have different minimum and maximum post-
processing and growth inhibiting effectiveness. Which lots undergo either control intervention
was decided using a simple binomial test based on the fraction of lots appropriate for the given
plant size. Post-processing and growth inhibitor were not modeled for the base run.
The effect of growth inhibitors on the concentration of L. monocytogenes was accounted
for by adjusting the L. monocytogenes growth factor. The growth of L. monocytogenes during
shipment from the plant to retail was assumed to be 1.0 log units (i.e, a growth factor of 1 which
effectively multiplies the cfu’s by 10) for all product lots and this growth factor was adjusted for
those lots using a growth inhibitor. The L. monocytogenes concentration based on the use of
growth inhibitors is determined as follows:
Variable Definition Type Base Value
LMPPj L. monocytogenes concentration in RTE lot j after post
processing interventions (cfu/g)
stochastic,
calculated
NA
PPk Post processing intervention effectiveness for plant size k
(dimensionless)
Stochastic,
input
0
U(PPmin, PPmax) when
applied
FPPk Fraction of lots for plant size k that undergo post
processing interventions (dimensionless)
Fixed,
Input
0
RNj Uniform random number used to test if lot j should
undergo post processing
Stochastic,
calculated
U(0,1)

15
( )
<
≥=
−+
k
GIGF
j
k
GF
j
jFGILMPP
FGILMPPLMGI
j
110log
j
RN if10*
RN if10*
where the parameters and their base values are listed in Table 6.
Table 6. Variables and base values for modeling growth of L. monocytogenes in product.
Variable Definition Type Base Value
LMGIj L. monocytogenes concentration in lot j after growth and
growth inhibition during transport to retail (cfu/g)
Stochastic,
calculated
NA
GF Growth factor applied to all lots Fixed,
input
1
GI Growth inhibition factor (a decimal reduction factor
constrained as 0< GI <1)
Stochastic,
input
0
UN(GImin, GImax) when
applied
FGIk Fraction of lots for plant size k that undergo growth
inhibition (dimensionless)
Fixed,
Input
0
The impact of post-processing lethality treatment and growth inhibitors was evaluated by
running the model using different scenarios to include using post-processing lethality and growth
inhibitors in combination, using each intervention separately, or not using an intervention at all.
Following these control interventions, the lot would then be tested for L. monocytogenes,
either because of routine lot testing or because an earlier food contact surface tested positive for
Listeria species. The lot testing response is lagged by the time it takes to analyze a food contact
surface sample for Listeria species and obtain results of this test. This lag time was assumed to
be 3 days. The model also assumed that product lots of RTE product that test positive for L.
monocytogenes are removed from the food supply.
The final step in the model was to select the lots that appear at retail from among the lots
produced by each plant size: large, small, and very small. The model generates the requested
number of lots for each plant size, then selects a continuous run to combine for the retail
distribution. The number of lots in the run was determined by the fraction of production for each

16
plant size. The L. monocytogenes concentration after combining lots from different plant sizes
was determined by:
=∀
∪=∀
∪=∀
=
Simverysmall
smallvery
k
Simsmall
small
k
Simel
large
k
i
NFPstartkLMGI
NFPstartkLMGI
NFPstartkLMGI
LMComb
*,
*,
*, arg
where the parameters and their base values are listed in Table 7. The union symbol convention is
used here to indicate that the lots simulated for each plant size were combined to arrive at the
resulting distribution.
Table 7. Variables and base values for modeling retail concentration of L. monocytogenes in a
product lot.
Variable Definition Type Base Value
LMCombi L. monocytogenes concentration in lot i after combining
lots from different plant sizes (cfu/g)
Stochastic,
calculated
NA
start Starting lot number for run Fixed,
built-in
100
FPk Fraction of pounds produced by each plant size k
(dimensionless)
Fixed,
input
Large = 0.48
Small = 0.48
Very small = 0.04
NSim Number of lots to simulate for each plant size Fixed,
input
1000000
For the first lot produced, it was assumed that the food contact surface Listeria
concentration was 0 cfu/gram. To prevent this initial value from biasing the final results, the first
100 lots simulated for each plant size were excluded. This seeds the starting food contact surface
concentration.
The final retail distribution is based upon the combined distribution, but filtered
depending on whether or not the lot was tested and the corresponding result of the test. Any lot
that was not tested and any lot that was tested and found negative passes on to retail. Any lot

17
that was tested and found positive is removed. The L. monocytogenes concentration at retail is
calculated as
negative testedinot tested i ||Retail iii LMCombLMCombLM ∪=
The union convention used here indicates the the lots not tested and those lots testing
negative were combined to arrive at the resulting retail distribution. The resulting distribution of
L. monocytogenes concentrations on RTE product at retail serves as an input for the updated
FDA-FSIS risk ranking model to estimate the public health impacts in terms of the estimated
number of illnesses and deaths due to listeriosis.
1.2.6 Food Contact Surface and RTE Product Testing.
The testing procedure for L. monocytogenes in a lot was calculated by first generating a
Poisson random number using a population mean as mean cfu’s within the sample (sample mass,
SMj, g × concentration, LMj, cfu/g):
( )jjjsample LMSMPoissonLM ×=
where the sample mass for this study was approximately 125 g.
The RTE lot sample is judged positive by:
( ) ( )
<−>
=otherwise
0,1UpDLM1-1 and 0LM if sampleLM
sample jjsample
negative
positiveLMR
where the parameters and their base values are listed in Table 8.

18
Table 8. Variables and base values for testing for L. monocytogenes in product.
Variable Definition Type Base Value
LMsample j total L. monocytogenes cfu in test sample j
(cfu)
stochastic,
calculated
NA
pDLM probability of detecting 1 L. monocytogenes cfu in test if
present
(dimensionless)
fixed, input 0.75
U(0,1)j uniform random number between 0 and 1
(dimensionless)
stochastic,
calculated
NA
LMRsample j L. monocytogenes test result for lot j
(positive or negative)
stochastic,
calculated
NA
The testing procedure for food contact surfaces was calculated by generating a Poisson random
number using a population mean as mean cfu’s on the contact surface tested (contact surface
area, Aj, cm2 × concentration, LSj, cfu/cm
2):
( )jjjsample LSAPoissonLS ×=
The FCS sample is judged positive by
( ) ( )
<−>
=otherwise
0,1UpDLS1-1 and 0LS if jsampleLM
jsample jjsample
negative
positiveLSR
where the parameters and their base values are listed in Table 9.

19
Table 9. Variables and base values for testing for Listeria on food contact surface.
Variable Definition Type Base Value
LSsample j total Listeria species cfu in test sample j
(cfu)
stochastic,
calculated
NA
pDLS probability of detecting 1 Listeria species cfu in test if
present
(dimensionless)
fixed, input 0.75
U(0,1)j uniform random number between 0 and 1
(dimensionless)
stochastic,
calculated
NA
LSRsample j LS test result for lot j
(positive or negative)
stochastic,
calculated
NA
For both contact surface testing and product testing, the modeled concentration of the
organism was multiplied by the sample size to estimate the mean of a Poisson distribution. For
food contact surfaces, the concentration is measured in cfu/cm2
and the sample size is measured
in cm2
. For RTE product, the concentration is measured in cfu/gram, and the sample size in
grams. A random number was generated from this distribution to represent the number of cfu’s
in the sample itself.
Once the number of organisms in the sample was known, the probability that a test to
detect the presence of the pathogen would yield a positive result could be determined by using a
binomial distribution:
( sampleLMp positive test)= 1-(1- pDLS)
where pDLS is the probability of detecting 1 cfu in the sample, and sample
LM is the number of
cfu’s in the sample from the Poisson calculation. The pDLS probability is based on the detection
limit and microbiological test sensitivity and is an input parameter to the risk assessment model.
20
1.3 Results and Discussion
1.3.1 Effect on Listeria concentrations at retail.
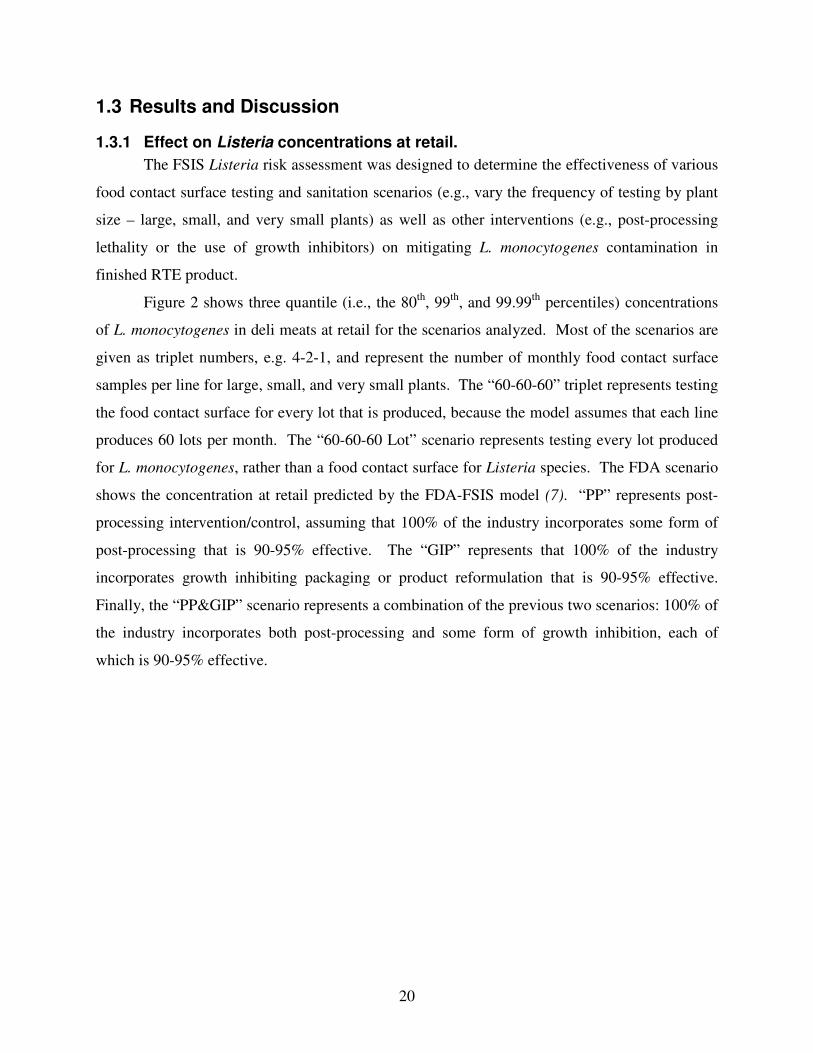
The FSIS Listeria risk assessment was designed to determine the effectiveness of various
food contact surface testing and sanitation scenarios (e.g., vary the frequency of testing by plant
size – large, small, and very small plants) as well as other interventions (e.g., post-processing
lethality or the use of growth inhibitors) on mitigating L. monocytogenes contamination in
finished RTE product.
Figure 2 shows three quantile (i.e., the 80th
, 99th
, and 99.99th
percentiles) concentrations
of L. monocytogenes in deli meats at retail for the scenarios analyzed. Most of the scenarios are
given as triplet numbers, e.g. 4-2-1, and represent the number of monthly food contact surface
samples per line for large, small, and very small plants. The “60-60-60” triplet represents testing
the food contact surface for every lot that is produced, because the model assumes that each line
produces 60 lots per month. The “60-60-60 Lot” scenario represents testing every lot produced
for L. monocytogenes, rather than a food contact surface for Listeria species. The FDA scenario
shows the concentration at retail predicted by the FDA-FSIS model (7). “PP” represents post-
processing intervention/control, assuming that 100% of the industry incorporates some form of
post-processing that is 90-95% effective. The “GIP” represents that 100% of the industry
incorporates growth inhibiting packaging or product reformulation that is 90-95% effective.
Finally, the “PP&GIP” scenario represents a combination of the previous two scenarios: 100% of
the industry incorporates both post-processing and some form of growth inhibition, each of
which is 90-95% effective.

21
FDA
Baselin
e4-2
-18-4
-2
10-10-1
0
16-8-4
32-16-8
40-20-1
0
60-60-6
0
60-60-6
0 LotPP
GIP
PP & G
IP
Lm
Co
nce
ntr
atio
n a
t R
eta
il(c
fu/g
)
1e-9
1e-8
1e-7
1e-6
1e-5
1e-4
1e-3
1e-2
1e-1
1e+0
1e+1
1e+2
1e+3
1e+4
1e+5
1e+6
1e+7
Q80
Q99
Q99.99
Figure 2. Quantiles of L. monocytogenes at retail for various scenarios tested.
The data generally show a decline in the L. monocytogenes concentration in RTE product
at retail as the food contact surface testing and sanitation effort increases. The decline is
apparent in the 99.99th
percent quantile, however there is little change in the 80th
percentile
across the food contact surface testing and sanitation scenarios. This pattern suggests that testing
and sanitation are effective at detecting (and ultimately leading to the removal of) high
concentrations of L. monocytogenes, but may not detect low concentrations.
Post-processing lethality and growth inhibitors each have lower 80th
percent quantiles
than 60-60-60 testing (i.e., testing each lot of RTE product). Most importantly, there is the
greatest decrease in the 80th
percent quantile when post-processing lethality and growth
inhibitors are combined meaning that this combination is the most effective at eliminating the
low concentrations of L. monocytogenes.

22
Cumulative Probability
70 90 99 99.9 99.99
Re
tail
Lis
teri
a C
on
cen
trati
on
(c
fu/g
)
10-9
10-7
10-5
10-3
10-1
101
103
105
107
4-2-1
60-60-60
PP & GIP
Figure 3. Retail Listeria concentrations for sampling versus post-processing and growth
inhibitors.
Figure 3 compares the cumulative probability of detecting L. monocytogenes in RTE
product over a range of retail Listeria concentrations via three control methods for a large
processing plant: the FSIS minimum sampling level, testing every lot of RTE product, and using
a combination of post-processing lethality and growth inhibitors. As seen in the quantile plot,
sampling and testing each product in the lot greatly reduces the higher Listeria concentrations
when compared to the minimum sampling requirement, but at the lower concentrations (i.e.
below the detection limit) increased sampling is ineffective. The detection limit is determined by
the sample size or food contact surface area tested; therefore to improve sampling effectiveness
larger samples would be necessary. The use of a combination of post processing lethality and
growth inhibitor decreases the entire probability distribution of L. monocytogenes to include
even the lowest concentrations. Eliminating the low Listeria concentrations helps prevent
regrowth of Listeria on the product therefore reducing the concentration observed at
consumption and subsequently reducing the number of illnesses and deaths.

23
The vertical distance between the 4 samples/ month and the post-processing lethality and
antimicrobial distributions is controlled by the effectiveness and degree of use within the
industry for the lethality and growth inhibiting controls. A higher effectiveness than the 1.5 – 2
log reduction modeled in this study would lower the location of the line while maintaining a
similar slope. Many currently available post-processing lethality technologies are capable of 5
log or higher reduction(27).
Figure 4. Example temporal clustering during contamination events.

24
In Figure 4 the concentration of Listeria species on a food contact surface was plotted
simultaneously with food contact surface testing results and L. monocytogenes concentrations at
retail for a given time period. The positive food contact surface results were temporally
clustered during contamination events and correlated with the L. monocytogenes and Listeria
species concentrations. This shows that even if sanitation and testing are the only control
interventions used, their effectiveness in mitigating L. monocytogenes contamination may be
enhanced if temporal clustering is occurring. This clustering allows for food safety
improvements if response to a positive food contact surface result is rapid and may help decrease
the duration and severity of a contamination event.
1.3.2 Public Health Effects.
The L. monocytogenes distributions at retail predicted by the in-plant model for the
various scenarios were fed into the FDA-FSIS model to determine the effect on consumer
exposure and the dose-response in terms of the number of deaths and illnesses resulting from
listeriosis. The dose-response portion of the FDA-FSIS model was calibrated to 310 deaths per
year among the elderly (11).
Figure 5 depicts the estimated median numbers of lives saved among the elderly for each
the scenarios tested. For the proposed minimum food contact surface testing (i.e., the 4-2-1
scenario (9) ) the estimated median number of deaths among the elderly was reduced by
approximately 20 per year. Post processing and growth inhibitors used in combination was
estimated to prevent over 180 elderly deaths, a 60% reduction from the number of elderly deaths
estimated in the baseline model.

25
0
50
100
150
200
4-2-
1
8-4-
2
10-1
0-10
16-8
-4
32-1
6-8
40-2
0-10
60-6
0-60
60-6
0-60
RTE
PP-95%
PP-99% G
IP
PP-95%
& G
IP
Scenario
Nu
mb
er
of
an
nu
al
liv
es s
av
ed
am
on
g
eld
erl
y:
Me
dia
n p
red
icti
on
Figure 5. Estimated number of deaths among the elderly for the various scenarios tested.
Based on a monotonic Kendall tau statistical test for trend, the increase in the number of
lives saved with increasing frequency of testing is statistically significant at the 99% significance
level. (tau=0.88, p=0.0028). Nevertheless, the combination of [consistent and universal] post
processing and growth inhibition saves 66 more lives among the elderly than sampling every
product in each lot. This enforces the finding that post-processing lethality treatments used in
combination with antimicrobial growth inhibitors are more effective than product sampling
alone.
1.3.3 Public health policy.
As a result of the FSIS Listeria risk assessment, the USDA created Interim Final Rule 9
CFR 430 (10) to regulate ready-to-eat food processors. The rule allows processors to choose
from 3 alternatives:
1. use both a growth inhibiting agent and a post-processing lethality

26
2. use either a growth inhibiting agent or a post-processing lethality step
3. use neither a growth inhibitor nor a post-processing lethality step.
Plants implementing fewer controls and adopting alternatives 2 or 3 are required to have
higher sampling frequencies than those implementing alternative 1. Since the establishment of
the Interim Final Rule, tracking of food processors indicates a voluntary shift to those categories
using additional controls and the incidence of listeriosis has declined (4). Figure 6 demonstrates
the shift towards alternatives 1 and 2. Based on this analysis, this shift may be preventing a
number of listeriosis deaths.
Alternative
Alt 3: sanitation only
Alt 2A: post lethality
Alt 2B: antimicrobial
Alt 1: both
Fra
ction
of
RT
E D
eli
Mea
t P
rod
uctio
n
0.0
0.2
0.4
0.6
0.8Pre-regulation Current
Figure 6. Fraction of RTE meat production by Interim Final Rule alternative.
1.4 Conclusions
The FSIS Listeria risk assessment model results indicated that the proposed minimal
frequency of testing and sanitation of food contact surfaces, as presented in the FSIS proposed
rule (9), will result in a small reduction in the levels of L. monocytogenes on deli meats at retail,
but greater frequency of food contact surface testing and sanitation is estimated to lead to a
proportionally lower risk of listeriosis. The use of a combination of interventions (e.g., post-
processing lethality and the use of growth inhibitors) is more effective in mitigating potential

27
contamination of RTE meat and poultry product with L. monocytogenes than sampling or any
single intervention used alone. Subsequently, the use of a combination of interventions best
reduces the risk of illness or death due to listeriosis. Also, when relying on sampling alone to
maintain food safety, a timely response to a positive food contact surface may help reduce the
duration and severity of a contamination event due to the temporal clustering of food contact
surface positives.
The FSIS Listeria risk assessment model provides a method for comparing the relative
effectiveness of various control interventions. This is valuable information which has been used
to help guide public policy in an effort to reduce the incidence of listeriosis. In the future, this
model may be used to compare additional management scenarios or demonstrate the effect of the
scenarios presented in this risk assessment for a variety of other RTE products, such as
frankfurters which pose a moderate health risk and have also been associated with a number of
listeriosis outbreaks.

28
Chapter 2. Listeria monocytogenes Prevalence and Level in Ready-to-eat Meat and Poultry deli meat
2.1 Introduction
The presence and level of L. monocytogenes in ready-to-eat (RTE) meat and poultry
products was determined using data from a study conducted by the National Alliance for Food
Safety and Security (NAFFS) (6). The data collected in this study were also used in calculating
the comparative risk ratio for listeriosis in retail-sliced versus prepackaged ready-to-eat meat and
poultry products.
2.2 Materials and Methods
2.2.1 Data Collection.
The sampling group comprised four designated sites in the Foodborne Disease Active
Surveillance Network (FoodNet). These were Northern California (CA), Georgia (GA),
Minnesota (MN), and Tennessee (TN). Sampling was weighted by the populations in counties
(3) so that exposure could be estimated. Approximately 75% of shopping is done at major
supermarket chains and 25% is done at other grocers, such as independent retailers (14). The
number of samples collected from supermarkets versus independent retailers was weighted
accordingly. Also, approximately 50% of consumers purchase RTE meat products that are sliced
at delicatessens with the remainder purchasing sliced prepackaged products (1). The relative
number of samples between prepackaged and retail-sliced was therefore kept approximately
equal as part of the sampling design. Sample data were encoded by the researchers to prevent
identification of the store.
Approximately 2,000 samples (125 grams each) were analyzed from each of the four
designated sites, with approximately equal numbers of retail-sliced and prepackaged samples,
and a small number of intact chubs or logs. Chubs data not included in this analysis. The
sampling protocol was designed to allow for statistically valid comparisons among sites, RTE
products type, and retail-sliced versus prepackaged, assuming an α = 0.05 and a 90% power of
detecting a difference of 2% in the comparison of binomial proportions.
The following product types were sampled: cured poultry, uncured poultry, pork, and
beef. Approximately 1,000 samples of each product type were analyzed to support conclusions
at the desired level of certainty. Use of any growth inhibitors was noted at the time of sample

29
collection. Specific instructions were provided for sample collectors, including the product
category, the number of samples of each type of product to be obtained, size of the sample to be
purchased, and how to choose, collect, hold and transport the sample.
Sample collection was standardized to maintain consistency. Sampling and laboratory
analyses followed standard laboratory practices. These included temperature monitoring during
shipment, chain of custody documentation, aseptic transfer and handling within the laboratory,
and initiating analyses within 24 hours of receipt of sample. The laboratories were instructed to
discard any sample with package damage such that the microbiological integrity of the sample
was not compromised. Samples not meeting quality control requirements were noted and
discarded. The FSIS standard laboratory method for L. monocytogenes detection was
implemented by the laboratories for use in this study. All samples were tested for the presence
of L. monocytogenes by inoculation in UVM broth followed by Fraser broth then modified
Oxford (MOX) agar. Original samples were saved in case the sample was positive so that the
concentration of L. monocytogenes could be quantified in cfu’s per gram. Positive samples were
quantified using a FSIS protocol 9-tube Most Probable Number (MPN) method with a reported
detection limit of 0.3 MPN/gram.
Samples were assigned codes and the following product information recorded: sampling
location (FoodNet site along with producer information, retailer’s name, and location of
purchase), date of receipt at the laboratory, whether the sample appeared to be packaged in-store
or prepackaged, and the use-by or sell-by date. Any store information or identifiers were
removed prior to transfer to FSIS.
2.2.2 Statistical Analyses
Statistical analyses were performed using Number Cruncher Statistical Systems (NCSS)
2001 (15) and R version 2.6.1 (25). For statistical tests, p values less then 0.05 were considered
statistically significant, and p values between 0.05 and 0.10 were considered marginally
significant.
Data were analyzed in a variety of ways. The prevalence of L. monocytogenes among
retail-sliced and prepackaged samples were analyzed by sampling site, product type, store type,
time of day (morning or afternoon), and quarter of the year using tests of proportions. The null
hypothesis for this test was that all the prevalence for both product types were equal. The
alternative hypothesis was that the prevalence differed. This statistical test assumed

30
independence among the samples, although this assumption is not likely met for these data.
Because multiple samples were collected at the same store, multiple positive L. monocytogenes
findings were likely correlated because of cross-contamination and poor hygienic conditions at
the store. Statistical tests with correlated positive samples claim to find statistically significant
results more commonly than intended.
Tests of proportions were also conducted at the retail store level. A store was considered
positive for retail-sliced or prepackaged product if any of the samples for that category were
found positive for L. monocytogenes. Stores are more likely to be independent than the
individual data, but there are problems with using this approach. Store identifiers (even arbitrary
labels) were removed from data provided prior to submittal to FSIS as part of the data encoding
and blinding process. Store visits had to be estimated based on date and time of sampling
collection. Sample collection times were not provided for samples from Minnesota, therefore the
number of stores available was much smaller than the number of samples. Also, statistical tests
based on only a few hundred samples have limited statistical power and are unlikely to detect
small differences in prevalence at reasonable levels of confidence. Finally, this approach does
not directly incorporate the number of samples collected at each store.
Another approach used was a logistic regression to predict the store prevalence for retail-
sliced and prepackaged product as a function of a number of indicator variables: where the
product was sliced, the store type, and the time of day the sample was collected. This approach
is not subject to the correlation problem because it is based on store prevalence. The regression
was weighted by the number of samples taken at the store, and evaluated more than one
explanatory variable simultaneously.
2.3 Results
2.3.1 Prevalence and Number of Samples
Fifty-seven samples were found to be positive for L. monocytogenes resulting in an
overall prevalence of 0.76%. Two of these positives were found in chub samples, six were found
in prepackaged samples, and the remaining 49 positives were found in retail-sliced samples. The
number of prepackaged and retail-sliced samples across the four FoodNet sites is shown in Table
8.

31
Table 8. Prevalence of positive product samples1 and stores visited based on sampling site.
Sampling Site
Category CA GA MN TN
Product samples 0.74%
(10/1360)
0.60%
(12/2000)
0.95%
(16/1685)
0.85%
(17/1995)
Stores2
6.98%
(6/86)
4.93%
(7/142) n/a
3
10.23%
(9/88)
1Product samples include both retail-sliced and prepackaged RTE meat and poultry product.
2 Store visit estimated based on similar sampling date and time. No sample times were provided for MN, so estimate of stores
sampled was not available.
Slightly fewer product samples were taken in CA than other sites. More stores were
sampled in GA than other sites. In addition to prepackaged and retail-sliced product samples,
105 and 300 additional chub samples were collected in MN and TN respectively. Assuming
independence, a test of proportions indicated no statistically significant difference for the
prevalence within product samples among the four sites (p = 0.75). Neither was there any
statistical difference for the store prevalence across the sites (p = 0.31). This allowed for pooling
of the data for purposes of discussing total prevalence. The number and prevalence for retail-
sliced and prepackaged samples by quarter of the year is shown in Table 9. More product
samples and more stores were visited in the 3rd
quarter than in other quarters. Assuming
independence, a test of proportions indicated a statistically significant difference for the
prevalence within product samples (p = 0.01) but not store prevalence (p = 0.31).
32
Table 9. Prevalence of positive product samples1 and stores visited based on quarter of year.
Quarter of Year
Category 1st 2
nd 3
rd 4
th
Product samples 0.16%
(2/1275)
0.74%
(13/1746)
1.15%
(28/2430)
0.76%
(12/1589)
Stores2
2.63%
(2/76)
7.37%
(7/95)
5.34%
(7/131)
10.00%
(6/60)
1Product samples include both retail-sliced and prepackaged RTE meat and poultry product.
2Store visit estimated based on similar sampling date and time. No sample times were provided for MN, so product samples
include MN but stores sampled do not.
The prevalence of positive retail-sliced and prepackaged samples by time of day is shown
in Table 10. Slightly more product samples and stores were sampled in the afternoon. Assuming
independence, a test of proportions indicated a statistically significant difference for the
prevalence within product samples (p = 0.04) but not store prevalence (p = 0.75).
Table 10. Prevalence of positive product samples1 and stores visited based on time of day (AM
versus PM).
Time of Day
Category AM PM
Product samples2
0.51%
(13/2540)
1.04%
(32/3060)
Stores2
5.42%
(9/166)
6.81%
(13/191)
1Product samples include both retail-sliced and prepackaged RTE meat and poultry product.
2Store visit estimated based on similar sampling date and time. No sample times were provided for MN, so neither product
samples nor stores sampled include MN.
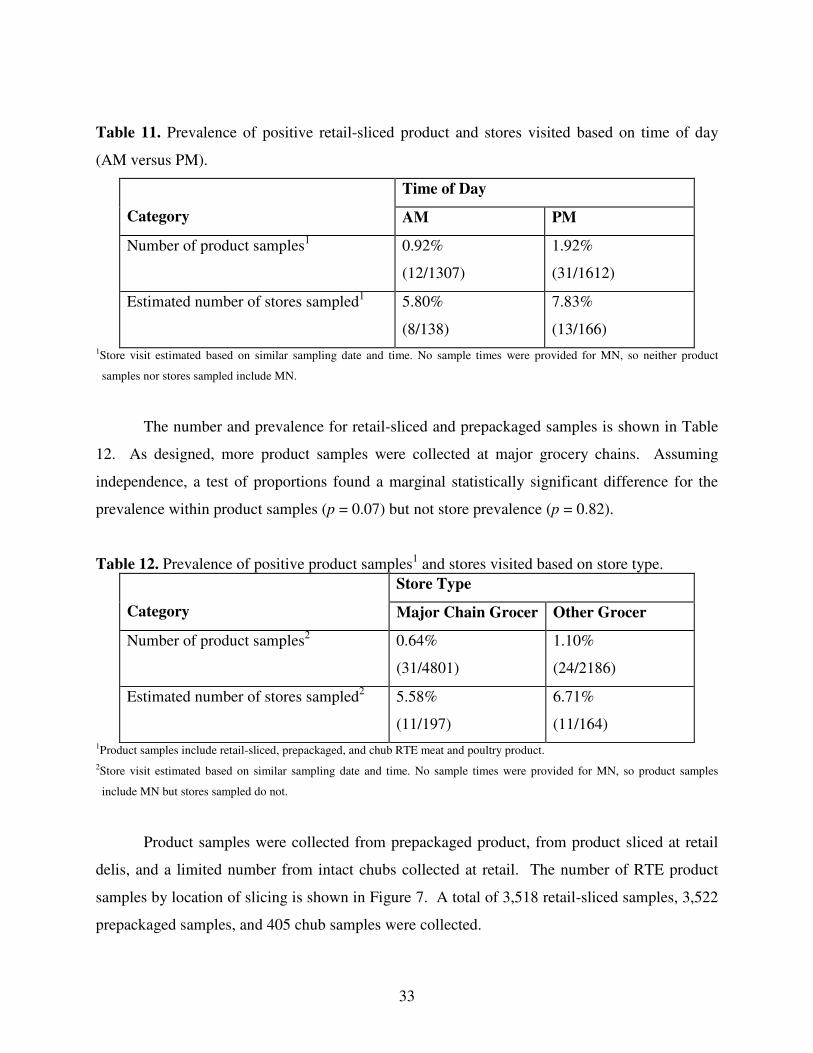
The more interesting time of day analysis looked solely at retail-sliced product as shown in
Table 11. Retail-sliced product samples collected in the afternoon were more than twice as
likely to test positive for L. monocytogenes – 1.92% versus 0.92%. Assuming independence, this
difference was statistically significant (p = 0.04). While store prevalence was also higher in the
afternoon (7.83% versus 5.80%), this difference was not statistically significant (p = 0.64).
33
Table 11. Prevalence of positive retail-sliced product and stores visited based on time of day
(AM versus PM).
Time of Day
Category AM PM
Number of product samples1 0.92%
(12/1307)
1.92%
(31/1612)
Estimated number of stores sampled1 5.80%
(8/138)
7.83%
(13/166)
1Store visit estimated based on similar sampling date and time. No sample times were provided for MN, so neither product
samples nor stores sampled include MN.
The number and prevalence for retail-sliced and prepackaged samples is shown in Table
12. As designed, more product samples were collected at major grocery chains. Assuming
independence, a test of proportions found a marginal statistically significant difference for the
prevalence within product samples (p = 0.07) but not store prevalence (p = 0.82).
Table 12. Prevalence of positive product samples1 and stores visited based on store type.
Store Type
Category Major Chain Grocer Other Grocer
Number of product samples2 0.64%
(31/4801)
1.10%
(24/2186)
Estimated number of stores sampled2 5.58%
(11/197)
6.71%
(11/164)
1Product samples include retail-sliced, prepackaged, and chub RTE meat and poultry product.
2Store visit estimated based on similar sampling date and time. No sample times were provided for MN, so product samples
include MN but stores sampled do not.
Product samples were collected from prepackaged product, from product sliced at retail
delis, and a limited number from intact chubs collected at retail. The number of RTE product
samples by location of slicing is shown in Figure 7. A total of 3,518 retail-sliced samples, 3,522
prepackaged samples, and 405 chub samples were collected.

34
405
3518 3522
0
500
1000
1500
2000
2500
3000
3500
4000
chub retail sliced prepackaged
Source
Tota
l N
um
ber
of S
am
ple
s
Figure 7. Number of RTE samples by location of slicing.
The data also indicate that deli meat sliced at retail is more likely to be contaminated than
prepackaged deli meat (1.39% versus 0.17%). The results are shown in Figure 8. Assuming
independence, a test of proportions between retail and prepackaged prevalence indicated retail-
sliced deli meat had a statistically significant higher prevalence (p < 0.0001).

35
0.0%
0.2%
0.4%
0.6%
0.8%
1.0%
1.2%
1.4%
1.6%
chub retail sliced prepackaged
Pre
va
len
ce
(%
)
49 / 3518
6 / 3522
2 / 405
Figure 8. Prevalence of L. monocytogenes in deli meat by location of slicing.
The site and slicing location results for sliced deli meat only are shown in Table 13.
Chub results are not included. The striking difference in prevalence between retail-sliced versus
prepackaged is evident at all sites. Differences among the sites are relatively minor.
Table 13. Prevalence of L. monocytogenes in retail-sliced and prepackaged deli meat by site.
Site
CA GA MN TN Overall
Retail-sliced
1.3%
(12/929)
1.4%
(10/731)
1.4%
(12/841)
1.5%
(15/1017)
1.4%
(49/3518)
Prepackaged
0.0%
(0/1071)
0.0%
(0/629)
0.5%
(4/844)
0.2%
(2/978)
0.2%
(6/3522)
Pro
cess
ing
Overall
0.6%
(12/2000)
0.7%
(10/1360)
0.9%
(16/1685)
0.9%
(17/1995)
0.8%
(55/7040)
Note: The number of positive samples and the total number of samples are shown in parentheses. Chub data are not
included.

36
For the 362 stores identified across the three sites available (CA, GA, TN) retail-sliced
deli meat was sampled at 308 stores and prepackaged deli meat was sampled at 313 stores. For
most stores, both types of deli meat was collected – 259 of these stores had both retail-sliced and
prepackaged samples collected, 49 had only retail-sliced samples collected, and 54 had only
prepackaged sliced samples collected. The testing results showed that only one store had
positives samples for both retail-sliced and prepackaged deli meat. An additional 20 of the stores
had positive retailed-sliced samples, and one store had positive prepackaged deli meat only.
Histograms of the number of retail-sliced and prepackaged deli meat samples taken at
each store are shown in Figure 9. For retail-sliced deli meat, the number of deli meat samples
per store ranged from 1 to 30, with a median of 8. The 25th
and 75th
% quantiles were 6 and 10
respectively. For prepackaged deli meat, the number of deli meat samples ranged from 1 to 24,
with a median of 9. The 25th
and 75th
% quantiles were 6 and 11, respectively.
Number of samples per store
Fre
quency
0 5 10 15 20
0.0
00.0
20.0
40.0
60.0
80.1
00.1
2
retail slicedprepackaged
Note: MN data are not included because stores could not be identified.
Figure 9. Number of deli meat samples collected per store.

37
Some differences existed among the different sites for labeling types of deli meats. After
correcting for obvious misspellings and accounting for multiple orderings, the types of deli meats
listed in the data were: beef, beef/chicken/pork, beef/chicken/turkey, beef/pork, beef/pork/turkey,
bologna, chicken, chicken/pork, chicken/turkey/pork, ham, mixed, pork, pork/turkey, poultry,
poultry (chicken), poultry (chicken/pork), poultry (chicken/pork/beef), poultry (turkey), poultry
(turkey/pork), and roast beef.
Many categories of deli meat types had very few samples. For purposes of this analysis,
these categories were combined into 5: beef, bologna, pork, poultry, or mixed. Deli meat labeled
as “bologna” was classified into different product types. If labeled by the sampler as “beef
bologna,” it was categorized as beef. If labeled with mixed components, it was categorized as
mixed. If labeled simply as bologna, it was categorized as bologna. Deli meat listed as poultry
but containing mixed components was categorized as mixed. For example, the samples labeled
“poultry (chicken/pork)” were categorized as mixed. Based on this categorization, the counts by
product type are given in Figure 10.
1093
321 229
1727
3669
0
500
1000
1500
2000
2500
3000
3500
4000
beef bologna mixed pork poultry
Product Type
Nu
mb
er
of
Pro
du
ct
Sam
ple
s
Note: Chub data are not included. One sample (not shown) did not include any listing for deli meat type.
Figure 10. Number of RTE samples by deli meat type.

38
The prevalence of L. monocytogenes across the different deli meat types is shown in
Figure 11. Although it appears that beef has a slightly higher prevalence, the differences were
not statistically significant based on a test of proportions (p = 0.22) among the five different deli
meat types (beef, bologna, mixed, pork, poultry). The corresponding L. monocytogenes
prevalence for beef, bologna, mixed meat, pork, poultry deli meats were 1.28%, 0.31%, 0.44%,
0.87%, and 0.65%, respectively. There does not appear to be any difference in the prevalence of
L. monocytogenes based on whether the deli meat was cured or uncured. A similar test was
conducted for retail-sliced only deli meat samples with similar results. Overall, there was no
statistically significant difference in the prevalence of L. monocytogenes among the different deli
meat types (p = 0.43)
0.00%
0.20%
0.40%
0.60%
0.80%
1.00%
1.20%
1.40%
beef bologna mixed pork poultry Grand
Total
Product Type
Pre
vale
nce o
f P
rod
uct
Sam
ple
s (
%)
14 / 1093
1 / 321
1 / 229
15 / 1727
24 / 3669
55 / 7040
Note: Chub data not included.
Figure 11. Prevalence of L. monocytogenes in RTE deli meats by deli meat type.
Samplers were asked to identify if the sample included an antimicrobial formulation. Of
the 7,446 samples, 51 were identified as using an antimicrobial agent, 1,008 did not use an

39
antimicrobial agent, and 6,387 were blank. Antimicrobial agents listed included potassium
lactate, sodium diacetate, sodium erythorbate, calcium lactate, sodium phosphate, sodium
benzoate, ascorbic acid, sodium citrate, and citric acid. Of the 57 samples positive for L.
monocytogenes, 6 listed sodium erythorbate use, 1 listed sodium lactate/sodium diacetate use,
and 50 were blank. Because of the large number of blanks, this antimicrobial formulation data
was not used as part of the risk assessment described below. Instead, USDA data on current
industry practices were used to estimate the fraction of product with antimicrobial usage.
There is an indication that positive retail-sliced samples were clustered by store when
positive L. monocytogenes results were found. Figure 12 illustrates the deli meat sample
prevalence among the 21 stores with at least one positive result for retail-sliced deli meats.
Three of these stores had 50% or greater prevalence, and six of these stores had greater than 30%
prevalence. Of the 308 identified stores sampled for retail-sliced deli meat, 37 L. monocytogenes
positive deli meat samples were found among 22 stores. The remaining positive samples were
from MN, where individual stores could not be identified. Six of these stores accounted for 21
of the 37 positive samples found. Thus, it appears that a few retail stores accounted for most of
the positive deli meat samples found. The clustering of positives among a small number of
stores is indicative of cross contamination at the retail establishment. It is also the reason that the
independence assumption of the test of proportions for deli meat samples is likely not completely
valid.

40
0%
10%
20%
30%
40%
50%
60%
70%
80%
90%
100%
A B C D E F G H I J K L M N O P Q R S T U
Store ID
Pro
du
ct
Sam
ple
Pre
vale
nce (
%)
2/2
5/7
1/2
4/103/8
3/94/14
1/5 1/51/52/11
Note: The estimated store visit was based on similar sampling date and time. No sample times were provided for MN; thus, MN
data not included. Thirty-seven total deli meat samples are shown.
Figure 12. Prevalence of L. monocytogenes in RTE deli meats samples sliced at retail by store.
2.4 Logistic Regression
To overcome the limitations with the test of proportions used above (non-independence
for deli meat samples and small sample size for store samples), a logistic regression was
performed. Logistic regression is appropriate when the dependent variable represents a
proportion of positive results such as the deli meat prevalence for retail-sliced deli meat at an
individual store. The assumptions for standard linear regression are not valid not here: the
dependent variable is bounded to fall between 0 and 1, the errors are not normally distributed,
and the regression must be weighted by the sample size used to calculate the prevalence.
Logistic regression transforms the prevalence to a scale more suitable for regression. The
analysis was performed in R using the generalized linear model (glm). In the language of R, a
binomial family was specified which used the logit transformation as the link function.

41
The prevalence of retail-sliced and prepackaged deli meat was calculated separately for
each store. This prevalence was regressed against several indicator variables: slicing location
(retail-sliced versus prepackaged), time of day, and store type. Retail-sliced and prepackaged
prevalences from the same store were treated as independent. Given that only one store had both
processing types found positive, this seemed a reasonable approach. The number of samples of
each type was used to weight the regression. Thus, store prevalences with only one sample
received less weight than store samples with 30 samples. The logistic regression approach also
had the advantage that all three explanatory variables were included simultaneously. The
regression function was
( ) day of timeβ typestoreβ typeprocessingββprevalencelogit 3210 ⋅+⋅+⋅+=
where: logit() = the logit transformation function; prevalence = the deli meat sample prevalence
for each store and slicing location(retail-sliced versus prepackaged); slicing location= 0/1
indicator variable with 0 for prepackaged and 1 for retail-sliced; store type = 0/1 indicator
variable with 0 for type A stores (major grocery chains) and 1 for type B stores (other grocery
stores); and time of day = 0/1 indicator variable with 0 for AM and 1 for PM.
The number of data points used in the regression was 613. This is less than twice the
number of individual stores sampled (2*362=724) because not all stores had both retail-sliced
and prepackaged samples collected.
The results for the parameter estimates are given in Table 14. The variables slicing
location and store type are statistically significant. The time of day the sample was collected is
marginally significant.

42
Table 14. Results of logistic regression for store prevalence as function of slicing location, store
type, and time of day indicator variables.
Parameter Estimate Standard Error Z value p
Intercept -7.96 0.76 -10.39 <0.0001
Processing type 2.90 0.73 4.00 <0.0001
Store type 0.99 0.33 3.03 0.002
Time of day 0.59 0.35 1.68 0.093
Note: Data for MN not included. N=613.
As expected from examining the data, whether the sample was prepackaged versus retail-
sliced was strongly statistically significant. This is consistent with the test of proportions for deli
meat samples. The result for time of day is consistent with the deli meat sample test of
proportions for time of day. Both results indicate marginal statistical significance.
Figure 13 illustrates the results using logistic regressions based on one explanatory
variable at a time. Because the vast majority of points had 0 prevalence and only two values
(0/1) were used for the explanatory variables, a small random number (the statistical term for this
is jitter) was added to the (x,y) coordinate for each point in order to better illustrate the density of
points at 0 prevalences.

43
Process Type
Sto
re P
reva
len
ce
0.0
0.2
0.4
0.6
0.8
1.0
prepackaged retail-sliced
Store Type
Sto
re P
reva
len
ce
0.0
0.2
0.4
0.6
0.8
1.0
A B
Time of Day
Sto
re P
reva
len
ce
0.0
0.2
0.4
0.6
0.8
1.0
AM PM
Note: MN data not included.
Figure 13. Graphical display of logistic regression results using deli meat sample prevalence at
individuals stores as the dependent variable.
2.5 Comparison of Findings of the National Alliance for Food Safety and Security with those of the Food Processors Association
A comparison of NAFSS retail contamination findings with those of the National Food
Processors Association (now Food Products Association) (14) is enlightening, although keep in
mind that sample collection methods, sample sizes and analytic methods differed and these can
all affect the results. The total number of deli meat samples was roughly equivalent: Gombas et
al. sampled approximately 9,000 deli meat samples compared to about 7,000 (excluding chubs)
for this research. The split between retail-sliced and prepackaged was somewhat different
however. Approximately 77% of the samples from Gombas et al. were prepackaged, versus

44
approximately 50% for this work. USDA/FSIS data suggest that approximately 47% of RTE
deli meat is sliced at the processing plant and prepackaged (1).
Gombas et al. found retail-sliced and prepackaged prevalences of 2.7% and 0.4%
respectively using a sample size of 25 g. This research found prevalences lower by about a
factor of 2: 1.4% and 0.2% respectively using a sample size of 125 g. The prevalence found in
this study is half that of the prevalence from the previous study despite a much larger sample
size. This may indicate improvements in deli meat handling, increased use of post-processing
lethality and antimicrobial growth inhibitor, or other improvements at the processing plant or
retail that occurred between the times the studies were conducted.
The earlier research found a difference in prevalence between their two sampled sites.
Table 15 below shows the derived results. Compare these data to the corresponding Table 18
above for the more recent data. Whereas this work found a consistent prevalence across all sites
and a significant difference between retail-sliced versus prepackaged, the earlier work found no
difference in slicing location at one site and a statistically significant difference at another.
Table 15. Prevalence of L. monocytogenes in sliced deli meat by site and slicing location from
the Food Products Association (14).
Site
CA MD Overall
Retail-sliced 0.70% 4.2% 2.7%
Prepackaged 0.55% 0.19% 0.4%
Pro
cess
ing
1
Overall 0.6%
(28/4600)
1.2%
(54/4599)
0.9%
(82/9199)
1The number of positive samples and the total number of samples are shown in parentheses where available.
Gombas et al. also found that the prevalence was higher for retail-sliced deli meat, but
that the levels of L. monocytogenes within positive samples were actually higher for prepackaged
deli meat. This current work found consistently that both the prevalence and levels were higher
for retail-sliced deli meat compared to prepackaged. The enumeration data collected in this
study are provided in Table 16. All prepackaged positive samples were found to be at or below
the enumeration limit whereas retail-sliced concentrations ranged to greater than 110 MPN/gram.

45
Table 16. Level of L. monocytogenes in deli meats at retail.
Retail-sliced Prepackaged
No.
Samples1
L. monocytogenes level
(MPN/gram)1
No.
Samples
L. monocytogenes level
(MPN/gram)
3,469 ≤0.008 3,516 ≤ 0.008
1 Between 0.008 and 0.3 1 Between 0.008 and 0.3
29 0.3 5 0.3
3 0.92
1 0.93
1 0.94
3 2.3
1 15.3
1 24
1 46
3 ≥ 110 1 L. monocytogenes levels were not given for five positive retail-sliced deli meat samples.
2.6 Conclusions
Table 17 summarizes the results of all the statistical testing. RTE deli meat is more
contaminated with L. monocytogenes, both in terms of prevalence and level, when sliced at retail
than when prepackaged. The marginal statistical link between positive results and time of day as
well as the clustering according to the store where the sample was collected is an indication that
cross contamination within retail establishments is occurring. There was no significant
difference in prevalence of L. monocytogenes among the various four FoodNet sites.

46
Table 17. Overall results of statistical tests for prevalence of L. monocytogenes on RTE meat
and poultry deli meats by location, season, time of day for slicing at retail, and by deli meat type.
Statistical Test1
Variable Deli meat samples2 Stores
3 Logistic regression
4
Geographic location N
(p=0.75)
N
(p=0.31)
Quarter of year Y
(p=0.01)
N
(p=0.31)
Time of Day Y
(p=0.04)
N
(p=0.75)
M
(p=0.093)
Time of day (retail-sliced only) Y
(p=0.04)
N
(p=0.64)
Store Type M
(p=0.07)
N
(p=0.82)
Y
(p=0.002)
Prepackaged versus retail-sliced Y
(p<0.0001)
Y
(p<0.0001)
Deli meat Type
N
(p=0.22)
Deli meat Type (retail-sliced
only)
N
(p=0.43)
1 Chub data were not included in any of the analyses. Statistical test results were considered statistically significant if α < 0.05
and marginal if 0.05 ≤ α ≤ 0.10. A “Y” indicates the differences were statistically significant; an N” indicates that they were
not; an “M” indicates that the differences were marginally significant.
2 Deli meat samples were assumed independent for the purposes of the test of proportions. 3 A store was considered positive if at
least one of the deli meat samples collected at the store was positive for L. monocytogenes.
4 All three explanatory variables were included simultaneously.

47
Chapter 3. Comparative Risk of Listeria monocytogenes in Ready-to-Eat Meat and Poultry Products
3.1 Introduction
Infection with Listeria monocytogenes is a serious foodborne public health problem, owing
to its severity of infection and high case fatality rate (Mead et al 1999). In 2000, the Food and
Drug Administration’s Center for Food Safety and Applied Nutrition (CFSAN) and the U.S.
Department of Agriculture’s Food Safety and Inspection Service (FSIS) initiated a quantitative
assessment of the relative risk to public health from Listeria monocytogenes among twenty-three
categories of ready-to-eat (RTE) foods in the United States (7). The assessment found that deli
meats pose the greatest risk of listeriosis, and subsequent death, among all ready-to-eat foods.
Deli meats were estimated to cause approximately 1,600 cases of listeriosis each year, resulting
in approximately 300 annual deaths. Subsequently, the FDA and FSIS performed a preliminary
analysis of retail deli meats using the L. monocytogenes contamination data collected by Gombas
et al. (14) to estimate the relative risk of listeriosis from deli meat sliced and packaged in FSIS-
inspected processing establishments (prepackaged) versus those sliced and packaged at retail
facilities (retail-sliced). Results suggested that deli meat sliced and packaged at retail posed the
greater risk, accounting for approximately 80% of all listeriosis cases from deli meat.
However, because the study of Gombas et al. (14), on which this analysis was based,
included L. monocytogenes prevalence data from just two sites – one in northern California and
one in Maryland – the data and findings of the analysis were limited. Additionally, the overall
prevalence of L. monocytogenes at each site differed. Therefore, to gather more representative
data for L. monocytogenes in retail RTE meat and poultry products, a study was conducted by
researchers with the National Alliance for Food Safety and Security (NAFSS) - a consortium of
25 research universities (6). Samples of prepackaged and retail-sliced RTE meat and poultry
products were collected from four sites: Georgia, Minnesota, Maryland, and northern California.
Prevalence and enumeration data for L. monocytogenes, as well as information on growth
inhibitor use, were collected from each of the four sites.
Using the L. monocytogenes data from the NAFFS study, the objectives of this research
were (i) to develop a risk assessment model incorporating growth inhibitor use and L.

48
monocytogenes concentrations based on slicing location to estimate the number of deaths and
illnesses resulting from listeriosis and (ii) to determine the comparative risk of deli meat sliced
and packaged at processing establishments versus those sliced and packaged at retail.
3.2 Materials and Methods
3.2.1 L. monocytogenes sampling.
Data for concentration of L. monocytogenes in prepackaged and retail-sliced meant and
poultry deli products were generated by Draughon et al (6). Samples were collected from four
designated sites in the Foodborne Disease Active Surveillance Network (FoodNet). These sites
were Northern California (CA), Georgia (GA), Minnesota (MN), and Tennessee (TN). Food
samples were collected at these FoodNet sites to facilitate relating exposure data and actual cases
of illness. Approximately 2,000 samples (125 grams each) were analyzed from each of the four
designated sites. According to consumer survey data, 50% of deli meat products are retail-sliced
and the remaining half are prepackaged. Therefore, the samples were collected accordingly.
Three categories of products were tested: products sliced and packaged in a processing
establishment and prepackaged for retail sale, products sliced and packaged at a retail
delicatessen, and intact deli meat not yet sliced at retail.
3.2.2 Statistical Analysis.
The data generated by Draughon et al (6) was analyzed using Number Cruncher
Statistical Systems (NCSS) 2001 (15) and R version 2.6.1 (25).
3.2.3 Risk Assessment Modeling.
This risk assessment was conducted using a modified version of the FDA-FSIS Listeria
model (7). The model consists of two sub-models: the exposure assessment model (Figure 14)
and the dose-response model (Figure 15). The exposure assessment model starts with the retail
L. monocytogenes distribution, and predicts the distribution at consumption. The dose-response
model uses the distribution at consumption together with an age-specific dose-response function
to estimate number of deaths for three age groups: neonatal, intermediate, and elderly. Neonates
included fetuses and newborns from 16 weeks after fertilization to 30 days after birth, the
intermediate population were those older than 30 days and less than 60 years old, and the elderly
were defined as being 60 years of age or older. Illnesses are then calculated based on age-
specific illness to mortality ratios: 12.7 for neonatal, 11.3 for intermediate, and 3.7 for elderly.

49
The model contains information on 23 food categories including deli meat, frankfurters, smoked
seafood, and soft cheeses.
The observed L. monocytogenes concentrations at retail were fitted to probability
distributions for retail-sliced and prepackaged deli meats. The probability distributions served as
inputs to the exposure assessment model. The deli meat category of the exposure model was
divided into four categories: prepackaged deli meat with growth inhibitor, prepackaged deli meat
without growth inhibitor, retail-sliced deli meat with growth inhibitor, and retail-sliced deli meat
without growth inhibitor. The exposure assessment model was also modified to account for the
different L. monocytogenes growth rates for product with and without growth inhibitors. Finally,
the dose response model for each age group was modified by splitting the deli meat category into
the four new categories.
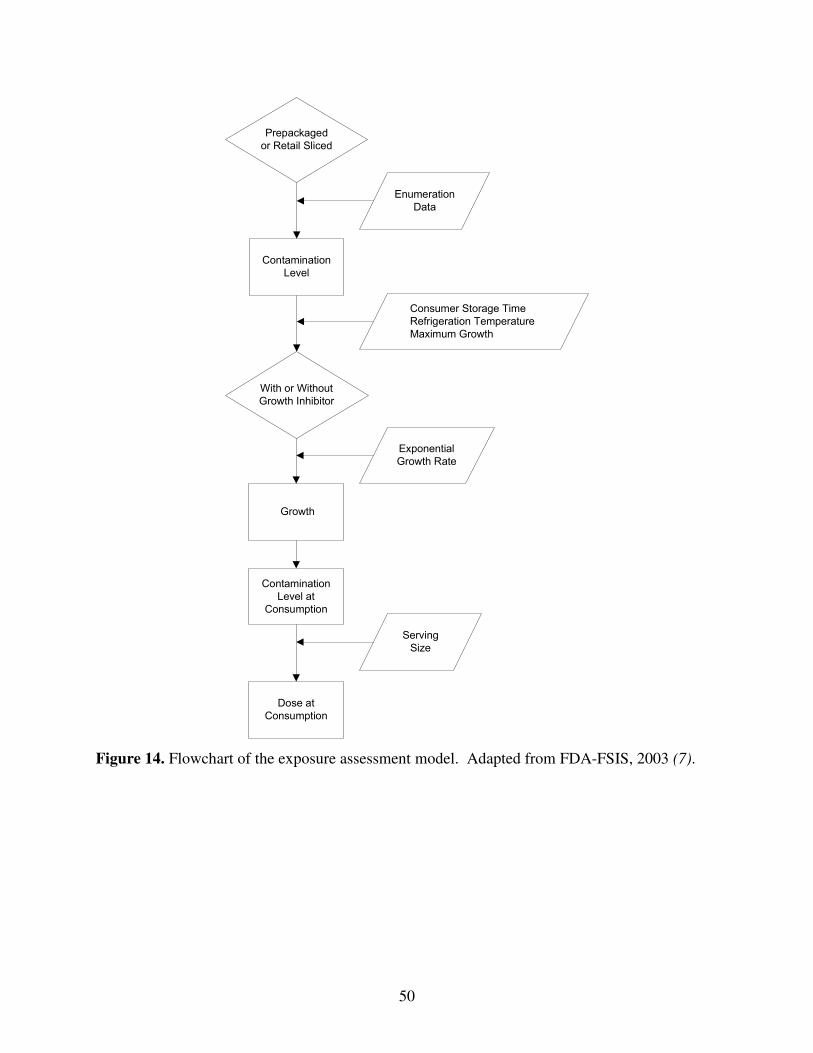
50
Prepackaged
or Retail Sliced
Enumeration
Data
Contamination
Level
With or Without
Growth Inhibitor
Consumer Storage Time
Refrigeration Temperature
Maximum Growth
Exponential
Growth Rate
Contamination
Level at
Consumption
Dose at
Consumption
Serving
Size
Growth
Figure 14. Flowchart of the exposure assessment model. Adapted from FDA-FSIS, 2003 (7).

51
Dose at
Consumption
Number of Deaths
by Age Group
Number of
Illnesses by Age
Group
Scaling Factor
Dose-Response
Function from
Mouse Model
Calibrate
Figure 15. Flowchart of the dose-response model. Adapted from FDA-FSIS, 2003 (7).
3.2.4 Use of Growth Inhibitors.
Microbial growth inhibitors may be used as a post-processing control to retard the growth
of L. monocytogenes in RTE meat and poultry products (13). The use of growth inhibitors was a
key factor considered by the model. In 2003 the USDA passed the Interim Final Rule 9 CFR
430 to regulate ready-to-eat food processors. The rule allows processors to choose from 3
alternatives:
4. use both a growth inhibiting agent and a post-processing lethality
5. use either a growth inhibiting agent or a post-processing lethality step
6. use neither a growth inhibitor nor a post-processing lethality step.
Alternative 2 is divided into two options, to distinguish if only post-processing lethality or only
growth inhibitor was used. The fraction of production under each alternative was estimated
before and after the Interim Final Rule (12) is shown in Table 18. It is estimated growth
inhibitors were used in 17.5% (2.6% + 14.9%) of RTE meat and poultry prior to the
implementation of the Interim Final Rule. It is estimated growth inhibitors are used in 39.3%
(9.2% + 30.1%) of product currently. The growth rate for L. monocytogenes was estimated using
the data from prior to the Interim Final Rule, therefore, the pre-Interim Final Rule data was used
in the model. The percentage of product using growth inhibitor was assumed the same for both
prepackaged and retail-sliced product.

52
Table 18. Estimated fraction of production among the various alternatives before and after
implementation of Interim Final Rule 9 CFR 430.
Alternative Pre Interim
Final Rule
Post Interim
Final Rule
1. Both growth inhibitor and post-processing lethality 2.6% 9.2%
2A. Post-processing lethality alone 6.8% 17.6%
2B. Growth inhibitor alone 14.9% 30.1%
3. Neither growth inhibitor nor post-processing lethality 75.7% 43.1%
3.2.5 Exponential Growth Rate.
To model growth of L. monocytogenes in deli meats, growth rates for RTE meat and
poultry with and without growth inhibitor were determined. The exponential growth rate of L.
monocytogenes was used in the exposure model to simulate growth from retail to consumption.
The growth rate was treated a stochastic input parameter. It was adjusted for stochastic storage
time and temperature and a correlation between the two. The growth rate was calculated using
data from 15 published articles with 23 reported growth rates across a range of deli meat
products (see reference (7)). This growth rate was adjusted to account for the use of growth
inhibitor.
To qualify as using a growth inhibitor under the Interim Final Rule 9 CFR 430, the
growth of L. monocytogenes may not exceed two logs over the shelf life of the product.
Exponential growth rates for L. monocytogenes were calculated for RTE meat and poultry with
and without growth inhibitors using data from the 2003 FDA-FSIS (7) risk assessment and the
estimated fraction of deli meat in each alternative prior to the implementation of the Interim
Final Rule. The FDA-FSIS risk assessment model estimated that the overall mean exponential
growth rate for deli meat at 5o
C was 0.282 log10 cfu/g/day. The Interim Final Rule is vague with
regard to shelf life and temperature. If the Interim Final Rule 9 CFR 430 standard is interpreted
to be 2 log10 growth over 14 days at 5oC, the maximum allowable exponential growth rate is 2
log10 cfu/g/14 days = 0.143 log10 cfu/g/d. Based on these assumptions, the exponential growth
rate (EGR) for product with growth inhibitor (GI) was estimated using a weighted log linear
equation:

53
fGI x EGRwith + (1 - fGI) x EGRwithout = EGRFDA
0.206 x 0.143 log10 cfu/g/d + 0.794 x EGRwithout = 0.282 log10 cfu/g/day
EGRwithout =0.318 log10 cfu/g/day
The calculated mean exponential growth rate was input into the exposure model and the
predicted concentrations of L. monocytogenes at consumption were used in the dose-response
model.
3.2.6 Distribution Fitting.
The L. monocytogenes concentrations at retail were fitted to probability distributions as
inputs to exposure assessment model. Even though a large number of samples was collected,
there were relatively few positives. Therefore, the distribution fits must be considered only
approximate. The prepackaged product, for example, had only six L. monocytogenes-positive
findings out the 3,522 prepackaged samples tested. All six positive samples were reported as
below the reported enumeration limit of 0.3 MPN/g. Forty-nine retail-sliced samples out of
3,513 were found to be positive for L. monocytogenes.
The survival analysis module of the NCSS software package (15) was used to fit an
appropriate statistical model to retail-sliced and prepackaged RTE meat and poultry products
separately. Negative samples were assumed to have a concentration less than or equal to the L.
monocytogenes detection limit of 0.008 MPN/g (i.e. ≤ 1 MPN/125 g). To be conservative, all
but one of the observed positive concentrations listed as ≤ 0.3 MPN/g were treated as = 0.3
MPN/g, and the remaining 1 sample was treated as an interval measurement between 0.008
MPN/g and 0.3 MPN/g. The level of L. monocytogenes and censor inputs for the survival
analysis are provided in Table 19.
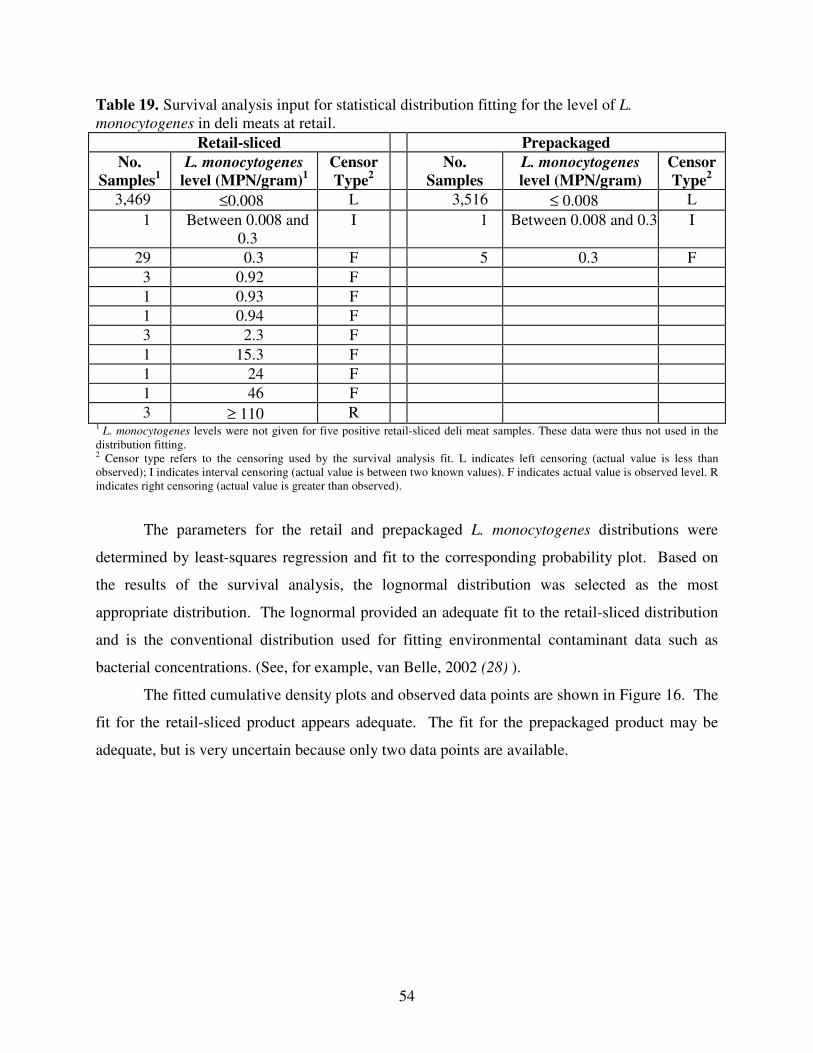
54
Table 19. Survival analysis input for statistical distribution fitting for the level of L.
monocytogenes in deli meats at retail.
Retail-sliced Prepackaged
No.
Samples1
L. monocytogenes
level (MPN/gram)1
Censor
Type2
No.
Samples
L. monocytogenes
level (MPN/gram)
Censor
Type2
3,469 ≤0.008 L 3,516 ≤ 0.008 L
1 Between 0.008 and
0.3
I 1 Between 0.008 and 0.3 I
29 0.3 F 5 0.3 F
3 0.92 F
1 0.93 F
1 0.94 F
3 2.3 F
1 15.3 F
1 24 F
1 46 F
3 ≥ 110 R 1 L. monocytogenes levels were not given for five positive retail-sliced deli meat samples. These data were thus not used in the
distribution fitting. 2 Censor type refers to the censoring used by the survival analysis fit. L indicates left censoring (actual value is less than
observed); I indicates interval censoring (actual value is between two known values). F indicates actual value is observed level. R
indicates right censoring (actual value is greater than observed).
The parameters for the retail and prepackaged L. monocytogenes distributions were
determined by least-squares regression and fit to the corresponding probability plot. Based on
the results of the survival analysis, the lognormal distribution was selected as the most
appropriate distribution. The lognormal provided an adequate fit to the retail-sliced distribution
and is the conventional distribution used for fitting environmental contaminant data such as
bacterial concentrations. (See, for example, van Belle, 2002 (28) ).
The fitted cumulative density plots and observed data points are shown in Figure 16. The
fit for the retail-sliced product appears adequate. The fit for the prepackaged product may be
adequate, but is very uncertain because only two data points are available.

55
-3 -2 -1 0 1 2 3
0.9
85
0.9
90
0.9
95
1.0
00
log10(Lm concentration, MPN/g)
Cum
ula
tive F
raction
retail slicedprepackaged
Figure 16. Fitted cumulative density plots for retail- and plant-sliced data.
3.2.7 Exposure Assessment Modeling.
Four separate exposure assessment models were run: (i) prepackaged with growth
inhibitor; (ii) prepackaged without growth inhibitor; (iii) retail-sliced with growth inhibitor; and
(iv) retail-sliced without growth inhibitor. The starting retail L. monocytogenes concentration
differed between prepackaged and retail-sliced RTE meat and poultry. L. monocytogenes growth
rates differed depending on the use of growth inhibitors. The storage time and temperature
distributions were left unchanged from the FDA-FSIS (7) model and the same time and
temperature distributions were used for both prepackaged and retail-sliced product. Anecdotal
evidence suggests that product sliced at retail is consumed more quickly than prepackaged
product. To investigate this difference, consumer storage times were adjusted in the exposure
assessment model during the sensitivity analysis.

56
3.2.8 Dose Response Modeling.
In each of the three age-specific dose-response models (neonatal, intermediate, and elderly),
the deli meat category was split into the four separate categories (prepackaged with growth
inhibitor, prepackaged without growth inhibitor, retail-sliced with growth inhibitor, and retail-
sliced without growth inhibitor). The L. monocytogenes distributions at consumption from the
exposure assessment model were input to each of the age-specific dose-response models. The
fraction of servings for each of the four deli meat categories was estimated from the USDA July
2007 Form 10,240-1 database (1). These data are shown in Table 20 as a fraction of total
production.
Table 20. Fraction of deli meat production by slicing location and growth inhibitor use during
July 2007.
Alternative Prepackaged
(sliced at plant) Retail-Sliced Total
With growth inhibitor 0.322 0.267 0.589
Without growth inhibitor 0.144 0.267 0.411
Total 0.466 0.534 1.000
Because there have been no human clinical trials with L. monocytogenes, the dose-
response curve is generated by relating the effects observed in mice to the effects of L.
monocytogenes in humans using an appropriate scaling factor. Using a calibrated mode to run
the dose-response model, a scaling factor was used in 4,000 simulations to adjust the dose-
response curve from the mouse model to meet a specified number of deaths in humans. For this
analysis, the target number of deaths was taken from the 2003 FDA-FSIS (7) risk assessment, i.e.
307 elderly deaths, 67 intermediate deaths, and 16 neonatal deaths, across all 26 food groups.
(Recall the original model used 23 food groups, but that deli meat was now split into four groups
for this analysis.)
A bootstrap analysis was used to evaluate if the estimated mean number of deaths
resulting from retail-sliced RTE meat and poultry was different from that for prepackaged. Four
thousand samples (with replacement) were drawn from the 4,000 simulations of each specified
scenario. The mean of each of these samples was then calculated. This process was repeated

57
100,000 times to generate a distribution of means. The mean and 95% confidence interval from
this distribution was then obtained.
3.2.9 Sensitivity Analysis
To investigate the effect of consumer storage time and shelf life assumptions on the
outcome of the model, a sensitively analysis was conducted. Consumer storage times used in the
exposure assessment model were taken from a consumer survey conducted by the American
Meat Institute (AMI) (17). According to the AMI survey, approximately 40% of ready-to-eat
product is stored for up to 2 days, 90% of product is stored up to 9 days, and 99% of product is
stored for 26 days or less (7). The survey did not distinguish between retail-sliced and
prepackaged product; therefore, the same storage time distribution was used for both the retail
and prepackaged exposure assessment models. Consumers may store retail-sliced deli meats for
shorter periods than prepackaged deli meats. Thus, to assess the effect of a reduced consumer
storage time, the storage time distribution in the retail exposure model was adjusted by arbitrary
factors of 0.25, 0.50, and 0.75. The model assumed a shelf life of 14 days for ready-to-eat deli
meat products. To assess the effect of the shelf life assumption, a 10 day and 21 day shelf life
were also considered.
3.3 Results
The estimated mean numbers of deaths per year and the 95% confidence interval about
the means among the three age groups for the four deli meat categories are summarized in Table
21. The estimated mean number of deaths from products with growth inhibitor was 28, while the
estimated mean number of deaths from product without growth inhibitor was 111. Retail-sliced
product, which started with a higher concentration of L. monocytogenes at retail compared to
prepackaged product, saw the greatest reduction in the estimated mean number of deaths with the
use of growth inhibitors.

58
Table 21. Estimated mean number of deaths per year and 95% confidence interval about the
mean among three populations stratified by age and four deli meat categories.
Food Category Elderly Intermediate Neonatal Total
3.4 0.8 0.2 4.4 Prepackaged with growth inhibitor
(3.3, 3.5) (0.8, 0.8) (0.2, 0.2) (4.3, 4.5)
7.2 1.8 0.5 9.4 Prepackaged without growth
inhibitor (7.0, 7.3) (1.7, 1.8) (0.4, 0.5) (9.1, 9.6)
18 4.4 1.1 23.5 Retail-sliced with growth inhibitor
(17.5, 18.4) (4.3, 4.6) (1.1, 1.2) (23.0, 24.1)
78 18.9 5.1 102 Retail-sliced without growth
inhibitor (76.5, 79.6) (18.5, 19.3) (5.0, 5.2) (100.1, 104.0)
10.5 2.6 0.7 13.8 Prepackaged total
(10.3, 10.8) (2.5, 2.6) (0.7, 0.7) (13.5, 14.1)
96 23.3 6.2 125.6 Retail-sliced total
(94.3, 97.7) (22.9, 23.7) (6.1, 6.3) (123.4, 127.7)
21.3 5.3 1.4 27.9 With growth inhibitor total
(20.8, 21.8) (5.1, 5.4) (1.3, 1.4) (27.3, 28.6)
85.2 20.7 5.6 111.4 Without growth inhibitor total
(83.6, 86.8) (20.3, 21.0) (5.5, 5.6) (109.4, 113.4)
106.5 25.9 6.9 139.3 Total
(104.7, 108.3) (25.5, 26.3) (6.8, 7.0) (137.1, 141.6)
The estimated mean number of deaths per year associated with prepackaged product was
13.8, while the estimated mean number of deaths per year associated with retail-sliced product
was 125.5. Ten percent of the estimated annual deaths (13.8/139.3=9.89%) were attributable to
prepackaged product, while the remaining 90% were attributable to retail-sliced product
(125.6/139.3=90.11%). Since 50% of ready-to-eat deli meat products are retail-sliced and the
remaining half are prepackaged, the relative risk for ready-to-eat product retail-sliced product
versus prepackaged product is thus 125.6/13.8=9.1.

59
A similar analysis was conducted for illnesses. The FDA-FSIS (7) model assumed a
constant illness to death ratio by age group of 12.7, 11.3, and 3.7 for neonatal, intermediate, and
elderly age groups, respectively. Because these ratios are fixed, the relative risk of illness from
retail-sliced product versus prepackaged product is similar to that of death. A mean of 76.8
illnesses was attributed to prepackaged product and a mean of 698.0 illnesses for retail-sliced
product, for a relative risk ratio of 9.1. The difference in the mean number of deaths between
prepackaged and retail-sliced deli meats was 111.8 with a 95% confidence interval of 109.6 to
114.0. The difference in means is statistically significant at 95% confidence.
A recursive partitioning and regression tree was generated in R (25) to determine which
factor (age, slicing location, or growth inhibitor use) had the greatest effect on the number of
resulting deaths (Figure 17). The first division in the tree indicates that age is the most important
factor and that the elderly are more likely to die from listeriosis than either the neonatal or
intermediate population. Following the tree along the elderly branch, the next division is by
slicing location. The tree indicates that retail-sliced product is at greater risk for causing
listeriosis than prepackaged product. Finally, the retail-sliced product is divided according the
growth inhibitor use.
Age =
neonatal &
Intermediate
mean deaths = 11.6
n = 48000
Age = Elderly
Sliced =
prepackagedSliced = retail
GI = yes GI = no
mean deaths = 26.6
n = 16000
mean deaths = 4.1
n = 32000
mean deaths = 0.8
n = 16000
mean deaths = 7.4
n = 16000
mean deaths = 2.8
n = 8000mean deaths = 12.0
n = 8000
Age = neonatal Age = intermediate
mean deaths = 5.1
n = 4000
mean deaths = 18.9
n = 4000
Sliced =
prepackagedSliced = retail
mean deaths = 5.3
n = 8000
mean deaths = 48.0
n = 8000
GI = yes GI = no
mean deaths = 18.0
n = 4000
mean deaths = 78.0
n = 4000
Figure 17. Recursive partitioning and regression tree.

60
Using the data from all 4,000 simulations, box plots were generated for each deli meat
category by age group (Figure 18). The box plots reemphasize the effect of age on the risk of
death from listeriosis, with the elderly population having the highest number of deaths for each
of the deli meat categories. Within each age group, growth inhibitor reduced the number of
deaths; however, the box plots show that even with the use of growth inhibitor, retail-sliced deli
meats result in a greater risk of death due to listeriosis than prepackaged meats.
Category
W WO W WO W WO W WO W WO W WO
Es
tim
ate
d N
um
be
r o
f D
ea
ths
10-5
10-4
10-3
10-2
10-1
100
101
102
103
Elderly Intermediate
Prepack Retail Prepack RetailPrepack Retail
Neonatal
*Prepack = prepackaged, Retail = retail-sliced, W = with growth inhibitor, WO = without growth inhibitor
Figure 18. Box plots for each deli meat category by age group.
As seen in the box plots, each of the four deli meat categories follows a similar trend,
with the elderly age group at the highest risk for death by listeriosis. An interaction plot for the

61
elderly age group was created to compare the effect of growth inhibitor use and product slicing
location on the mean number of deaths. There is a significant difference between the mean
number of deaths resulting from retail-sliced product when compared to prepackaged product
(Figure 19a). While the use of growth inhibitor greatly decreased the mean number of deaths
resulting from retail sliced product, prepackaged product without growth inhibitor results in
fewer deaths than retail sliced product with growth inhibitor (Figure 19b).
Slicing Location
prepackaged retail
Me
an
Estim
ate
d D
eath
s
0
20
40
60
80
100
GI
No GI
Growth Inhibitor Use
GI No GI
Mea
n E
stim
ate
d D
ea
ths
0
20
40
60
80
100
Prepackaged
Retail
Figure 19. Interaction plots comparing the effect of growth inhibitor (GI) use and slicing
location on the mean number of deaths from listeriosis.

62
3.3.1 Sensitivity Analysis.
Based on sensitivity analysis, an increase in the consumer storage time increased the total
number of deaths and illnesses (Table 22). When the consumer storage time was halved, the
number of deaths was decreased by nearly 25%. This finding shows that estimations made by
this model are dependent on the accuracy of the consumer storage time assumption. More
investigation into the typical consumer storage times for ready-to-eat meat and poultry products
is necessary to enhance the accuracy of the model. Table 22 also includes the ratio of deaths
resulting from retail-sliced versus prepackaged deli meats. The comparative risk ratio decreased
as the consumer storage times for the retail-sliced meats decreased, however retail-sliced product
is estimated to cause 1.7 times more deaths than prepackaged product even when stored for a
quarter of the time.
Table 22. Estimated mean number of deaths and illnesses per annum by fraction of consumer
storage time.
Storage Time Fraction 25% 50% 75% 100%
Deaths 70.7 105.5 127.1 139.3
Illnesses 397.8 589.9 708.0 774.7
Ratio of Deaths, Retail-sliced:
Prepackaged 1.7 3.7 5.4 9.1
Maintaining the FDA-FSIS Listeria model’s assumed consumer storage distribution, the
EGR of Listeria on deli meat was then changed for both retail-sliced and prepackaged product
based on a shelf life of 10, 14, and 21 days. Increasing the shelf life decreased the number of
deaths (Table 23). The change in shelf life from 10 days to 14 days resulted in a 10% reduction
in the mean number of deaths. A week long extension of shelf life from 14 days to 21 days
resulted in a 5% reduction in the number of deaths. This suggests that the assumption of a 14-
day shelf life may be adequate for predicting the number of deaths or illnesses due to listeriosis.

63
Table 23. Mean number of deaths and illnesses per annum by shelf life.
Shelf Life 10 day 14 day 21 day
Deaths 155.1 139.3 131.7
Illnesses 861.1 774.7 732.9
Ratio of Deaths, Retail-sliced:
Prepackaged 8.1 9.1 7.9
The comparative risk ratios exhibited no definitive correlation with the change in shelf
life; however, the EGR for product with growth inhibitor consistently decreased, while the EGR
for product without growth inhibitor increased as the shelf life increased (Table 24). The
differences in the comparative risk may be a result of the iterative process used to adjust the
dose-response curve and may not necessarily indicate a true difference in the relative risk.
Table 24. EGR for product with and without growth inhibitor by shelf life.
Shelf Life 10 day 14 day 21 day
With GI 0.20 0.14 0.10
Without GI 0.30 0.31 0.32
3.4 Discussion and Conclusions
Results from this study suggest retail-sliced ready-to-eat meat and poultry products are
over nine times more likely to cause listeriosis than prepackaged products. Transmission of L.
monocytogenes in retail delis may be one factor contributing to the elevated risk of listeriosis
from retail-sliced products compared to prepackaged products. Retail delis are most commonly
out of compliance with the FDA Food Code for improper holding times and temperatures of
product, poor personal hygiene of workers handling product, and a lack of adequate safeguards
against contamination (8). Vorst et al.(30) found that L. monocytogenes can spread from
contaminated product to uncontaminated product by mechanical slicers during the slicing of
turkey, bologna, and salami. Moreover, despite regular cleaning and disinfection, processing
equipment may act as a vehicle for transfer of L. monocytogenes between processing plants (19),

64
suggesting sanitation alone is not adequate for preventing L. monocytogenes contamination of
retail-sliced ready-to-eat product.
Our results also suggest that consumption of retail-sliced meat and poultry products is
more likely to result in listeriosis compared to consumption of prepackaged products, regardless
of whether growth inhibitors are used. In addition, consuming retail-sliced products was found
to be riskier than consuming prepackaged products, regardless of consumer age. Finally, if
retail-sliced products are stored for a quarter of the time of prepackaged products, consumption
of retail-sliced products is still nearly two times as likely to cause listeriosis than consumption of
prepackaged products. These findings indicate that while growth inhibitors are an effective
method for controlling L. monocytogenes levels in prepackaged deli meat products, further
measures are necessary to reduce L. monocytogenes concentrations at the retail level.
There were limitations to this study. First, the AMI survey (17) used in this study did not
distinguish between consumer storage times for retail-sliced and prepackaged products.
Consumers may store retail-sliced products for shorter periods than prepackaged products, but
additional studies are needed to support this conjecture. Therefore, our model assumed
consumer storage times for retail-sliced and prepackaged products were identical. Second, in the
study by Draughon et al (6), a low number of samples tested positive for L. monocytogenes and
these positive samples were reported as below the enumeration limit of 0.3 MPN/g. This
resulted in the fitted distribution of the data being only approximate. An increase in the number
of samples and a better method of reporting positive concentrations would improve the goodness
of fit of the chosen distribution. Third, our model was developed using growth inhibitor data
collected prior to the FSIS Interim Final Rule (12). The use of growth inhibitors has since
increased (1), thereby causing the model to likely overestimate the absolute number of deaths
and illness. However, it is important to note that this does not affect the relative risk ratio.
The above limitations notwithstanding, the results from our study provide compelling
evidence that meat and poultry products sliced at retail delis are riskier for listeriosis than
products sliced and packaged at federally-inspected plants. The elevated initial distribution of L.
monocytogenes makes retail-sliced deli meats riskier than prepackaged deli meats regardless of
growth inhibitor use. To better understand the reasons for this, additional studies are needed to
address the extent of cross-contamination of Listeria at retail delis and to identify methods to

65
mitigate and control L. monocytogenes contamination in retail-sliced ready-to-eat meat and
poultry products.

66
Chapter 4. Conclusions
The results of the dynamic in-plant model found that the minimum frequency of
testing and sanitation of food contact surfaces, as presented in the FSIS proposed rule (9), results
in a small reduction in the levels of L. monocytogenes on deli meats at retail, but greater
frequency of food contact surface testing and sanitation is estimated to lead to a proportionally
lower risk of listeriosis. The use of growth inhibitors combined with a post-processing lethality
step was estimated to save over 200 more lives than the FSIS proposed minimum sampling
standard and 66 more lives than even sampling each lot of ready-to-eat product. Thus, the use of
a combination of interventions (e.g., post processing lethality and the use of growth inhibitors) is
more effective in mitigating potential contamination of RTE meat and poultry product with L.
monocytogenes than sampling or any single intervention used alone. Subsequently, the use of a
combination of interventions best reduces the risk of illness or death due to listeriosis. When
relying on sampling alone to maintain food safety, a timely response to a positive food contact
surface may help reduce the duration and severity of a contamination event due to the temporal
clustering of food contact surface positives.
An analysis of the data collected from the NAFSS study (6) found that retail-sliced deli
meat has both a higher prevalence and level of L. monocytogenes than prepackaged product.
Cross contamination within the retail environment is suspected based on the clustering of
positives by store and the putative statistical link between the positives and the time of day of
sampling. There was no significant difference in prevalence of L. monocytogenes among the
four geographically-dispersed FoodNet sites; so these findings seem applicable at a national
level.
The comparative risk assessment results estimate retail-sliced RTE meat and poultry
products are at a 9.1 times greater risk of listeriosis than prepackaged product and slicing
location has a greater effect on the risk of listeriosis than the use of growth inhibitors.
Prepackaged RTE meat and poultry product without growth inhibitor poses less risk of L.
monocytogenes illnesses and deaths than retail-sliced RTE meat and poultry product with growth
inhibitor. Consumer storage times also have a significant effect on the comparative risk ratio,
however, even if retail-sliced deli meat products are stored for a quarter of the time prepackaged
product is stored, retail-sliced deli meats are still nearly two times more likely to cause

67
listeriosis. To help mitigate L. monocytogenes contamination, regulatory action at the retail level
is necessary.

68
References
1. Anonymous. 2007. Industry survey data collected with Form 10240-1 in accordance with
9 CFR 430. In, Production Information of Post-Lethality Exposed Ready-to-eat Products
USDA/FSIS.
2. Bedie, G. K., J. Samelis, J. N. Sofos, K. E. Belk, J. A. Scanga, and G. C. Smith. 2001.
Antimicrobials in the Formulation To Control Listeria monocytogenes Postprocessing
Contamination on Frankfurters Stored at 4° C in Vacuum Packages. Journal of Food Protection.
64:1949-1955.
3. Bureau, U. S. C. Date, 2007. Available at: http://www.census.gov. Accessed.
4. CDC. 2007. Preliminary FoodNet Data on the Incidence of Infection with Pathogens
Transmitted Commonly Through Food — 10 States, 2006. p. 336-339. In, Morbidity and
Mortality Weekly Report, vol. 56. U.S. Government Printing Office.
5. Chen, Y., K. M. Jackson, F. P. Chea, and D. W. Schaffner. 2001. Quantification and
Variability Analysis of Bacterial Cross-Contamination Rates in Common Food Service Tasks.
Journal of Food Protection. 64:72-80.
6. Draughon, A. F. 2006. A collaborative analysis/risk assessment of Listeria
monocytogenes in ready-to-eat processed meat and poultry collected in four FoodNet states. In,
Symposium S-16: Contamination of Ready-to-Eat Foods: Transfer and Risk: Listeria
monocytogenes and Other Microorganisms. International Association for Food Protection 93rd
Annual Meeting, Calgary, Alberta.
7. FDA-FSIS. Date, 2003, Quantitative assessment of relative risk to public health from
foodborne Listeria monocytogenes among selected categories of ready-to-eat foods. Available at:
http://www.foodsafety.gov/~dms/lmr2-toc.html. Accessed.
8. FDA. 2004. FDA Report on the Occurrence of Foodborne Illness Risk Factors in
Selected Institutional Foodservice, Restaurant, and Retail Food Store Facility Types. In FDA
National Retail Food Team.
9. FSIS. 2001. Performance Standards for the Production of Processed Meat and Poultry
Products 66 Federal Registrar 39. p. 12590-12636. In.
10. FSIS. 2003. Interim Final Rule 9 CFR Part 430. In.
11. FSIS. 2003. Risk assessment for Listeria monocytogenes in deli meat. . In, Washington,
D.C.

69
12. FSIS. 2008. Interim Final Rule 9 CFR Part 430. In.
13. Geornaras, I., P. N. Skandamis, K. E. Belk, J. A. Scanga, P. A. Kendall, G. C. Smith, and
J. N. Sofos. 2006. Postprocess Control of Listeria monocytogenes on Commercial Frankfurters
Formulated with and without Antimicrobials and Stored at 10° C. Journal of Food Protection.
69:53-61.
14. Gombas, D. E., Y. Chen, R. S. Clavero, and V. N. Scott. 2003. Survey of Listeria
monocytogenes in Ready-to-Eat Foods. Journal of Food Protection. 66:559-569.
15. Hintz, J. 2001. NCSS and Pass. Number Cruncher Statistical Systems In, Kaysville, UT.
16. Hynes, N. 2000. Draft: Multistate Outbreak - Findings of Epidemiological In-Plant
Investigation. In, Waco, TX.
17. Institute, A. M. 2001. Consumer Handling of RTE Meats. In.
18. Lin, C.-M., K. Takeuchi, L. Zhang, C. B. Dohm, J. D. Meyer, P. A. Hall, and M. P.
Doyle. 2006. Cross-Contamination between Processing Equipment and Deli Meats by Listeria
monocytogenes. Journal of Food Protection. 69:71-79.
19. Lundén, J. M., T. J. Autio, and H. J. Korkeala. 2002. Transfer of Persistent Listeria
monocytogenes Contamination between Food-Processing Plants Associated with a Dicing
Machine. Journal of Food Protection. 65:1129-1133.
20. Mead, P. S., L. Slutsker, V. Dietz, L. F. McCaig, J. S. Bresee, C. Shapiro, P. M. Griffin,
and R. V. Tauxe. 1999. Food-Related Illness and Death in the United States. Emerging Infectious
Diseases. 5:607-625.
21. Midelet, G., and B. Carpentier. 2002. Transfer of Microorganisms, Including Listeria
monocytogenes, from Various Materials to Beef. Applied and Environmental Microbiology.
68:4015-4024.
22. Montville, R., Y. Chen, and D. W. Schaffner. 2001. Glove barriers to bacterial cross-
contamination between hands to food. Journal of Food Protection. 64:845-849.
23. Prevention, C. f. D. C. a. 2007. Preliminary FoodNet Data on the Incidence of Infection
with Pathogens Transmitted Commonly Through Food — 10 States, 2006. p. 336-339. In,
Morbidity and Mortality Weekly Report, vol. 56. U.S. Government Printing Office.
24. Service, F. S. a. I. 1999. HACCP Implementation - Phase II for Small Plants. In USDA
(ed.), Washington, D.C.

70
25. Team, R. D. C. 2007. R: A language and environment for statistical computing. R
Foundation for Statistical Computing. In, Vienna, Austria.
26. Tompkin, R. B. 2002. Control of Listeria monocytogenes in the food-processing
environment. Journal of Food Protection. 65:709-725.
27. Tsui, F. 2007. USDA Personal Communication. In.
28. Van Belle, G. 2002. Statistical rules of thumb. Wiley-Interscience, New York.
29. Voetsch, A. C., F. J. Angulo, T. F. Jones, M. R. Moore, C. Nadon, P. McCarthy, B.
Shiferaw, M. B. Megginson, S. Hurd, B. J. Anderson, A. Cronquist, D. J. Vugia, C. Medus, S.
Segler, L. M. Graves, R. M. Hoekstra, and P. M. Griffin. 2007. Reduction in the Incidence of
Invasive Listeriosis in Foodborne Diseases Active Surveillance Network Sites, 1996–2003. p.
513-520. In, Clinical Infectious Diseases, vol. 44. Centers for Disease Control and Prevention,
Atlanta, GA.
30. Vorst, K. L., E. C. D. Todd, and E. T. Ryser. 2006. Transfer of Listeria monocytogenes
during Mechanical Slicing of Turkey Breast, Bologna, and Salami. Journal of Food Protection.
69:619-626.
31. Wallace, F. M., J. E. Call, A. C. S. Porto, G. J. Cocoma, T. E. S. P. Team, and J. B.
Luchansky. 2003. Recovery Rate of Listeria monocytogenes from Commercially Prepared
Frankfurters during Extended Refrigerated Storage. Journal of Food Protection. 66:584-591.
32. Wederquist, H. J., J. N. Sofos, and G. R. Schmidt. 1994. Listeria monocytogenes
inhibition in refrigerated vacuum packaged turkey bologna by chemical additives. Journal of
Food Science. 59:498-500, 516.
33. Wiedmann, D. M. 2002. Blinded industry data on the ratio of Listeria spp. to Listeria
monocytgenes. In Cornell University.