Rising to new challenges in the face of global demand ...€¦ · in the face of global demand:...
20
Rising to new challenges in the face of global demand: liquefied natural gas in Canada
Transcript of Rising to new challenges in the face of global demand ...€¦ · in the face of global demand:...

Rising to new challenges in the face of global demand: liquefied natural gas in Canada


Canada has immense domestic gas reserves, including conventional gas and unconventional shale gas. But with declining demand from the US (Canada’s only external customer), companies must look further afield to other demand markets in Asia in order to maintain viability.
In the face of these unprecedented changes in supply and demand, Ernst & Young has analyzed key LNG market dynamics, including environmental and operational challenges. Here’s a snapshot of how these new global generation “powerhouses” are rapidly becoming a serious threat to Canadian firms and what Canadian LNG executives need to know to protect and expand their slice of the pie.
Liquefied natural gas in Canada Rising to new challenges in the face of global demand 1
Demand for liquefied natural gas (LNG)is heating up around the world — particularly in emerging Asian countries — and exporters in Australia, Russia, Malaysia and Qatar have been quick to respond. Asian competitors are already well on track to develop the necessary infrastructure to fulfill the needs of this expanding market and are responding by locking in multiyear supply contracts that are leading many closer to home to ask: where does Canada fit in all of this, and has Canada missed the boat?

Liquefied natural gas in Canada Rising to new challenges in the face of global demand2
Three key trends
to monitorIncreasing gas demandAccording to the International Energy Agency World Energy Outlook 2011 report, gas is the only fossil fuel expected to grow in demand this year — at an expected rate of 1.7% per year through 2035. Of that percentage, non-Organisation for Economic Co-operation and Development countries will account for 81% of growth, with the majority expected from China, whose current policies are set to increase domestic demand by almost 400%.
In recent years, the rise of emerging economic powerhouses in India, China and other parts of Asia have led many natural gas suppliers to ramp up production in countries such as Qatar in the face of what seems like unlimited demand. This increase in natural gas production has been followed closely by LNG production, which the Institute for Energy Economics expects to catch up to gas within a year.
Domestically, Canada has seen an increase in new shale gas discoveries and a reduction in US demand due to the country’s own shale gas boom. This has created a gas glut, particularly in Western Canada, with no short-term mechanism to export the excess gas to other markets outside of the US, such as Asia, where demand is expected to remain robust.
Countries exceed Canada’s estimated proven reserves*In 2010, Qatar was the leading global LNG exporter (55.7 million metric tonnes), followed by Indonesia (23.1 million metric tonnes), Malaysia (22.5 million metric tonnes), Australia (18.6 million metric tonnes), Nigeria (17.6 million metric tonnes), and Trinidad and Tobago (15 million metric tonnes).
In recent years, however, potential global suppliers such as Russia and Iran have emerged with considerable proven gas reserves, coupled with the advantage of close proximity to the market. Canada languishes at No. 21 on the list with only 0.9% of proven reserves, not including shale gas.
5,500
5,000
4,500
4,000
3,500
3,000
2,500
2,000
1,500
1,0001980 1990 2000 2010 2020 2023 2035
Bill
ion
cubi
c m
eter
s (b
cm)
Current policies scenario New policies scenario 450 scenario
Source: World Natural Gas Demand (International Energy Agency 2011)
Estimated proven reserves of natural gas*Rank Country Proven reserves
(billion cubic feet), 1 January 2011
Share of total, 11 January 2011
1 Russia 1,680,000 25.3%2 Iran* 1,045,670 15.7%3 Qatar* 895,800 13.5%4 Saudi Arabia* 275,200 4.1%5 Turkmenistan 265,000 4.0%6 United States 244,656 3.7%7 United Arab Emirates* 227,900 3.4%8 Nigeria* 186,880 2.8%9 Venezuela* 178,860 2.7%
10 Algeria* 159,000 2.4%11 Iraq* 111,940 1.7%12 Australia 110,000 1.7%13 China 107,000 1.6%14 Indonesia 106,000 1.6%15 Kazakhstan 85,000 1.3%16 Malaysia 83,000 1.2%17 Egypt 77,200 1.2%18 Norway 72,000 1.1%19 Uzbekistan 65,000 1.0%20 Kuwait* 63,000 0.9%21 Canada 61,950 0.9%22 Libya* 54,680 0.8%
Source: ”World’s Top 22 Natural Gas Proven Reserve Holders,“ 1 January 2011, Oil & Gas Journal *Numbers do not include shale gas given the relatively sparse data that currently exists.
3Liquefied natural gas in Canada Rising to new challenges in the face of global demand
Foreign players continue to secure supply contractsA number of countries around the world continue to compete for a share of LNG demand, and many are aggressively locking in multiyear supply contracts. Australia, Qatar, Malaysia and Russia are seizing market opportunity at a rapid pace and fast becoming powerful threats to Canada. Consider:
• Russia’s gas behemoth Gazprom has inked an agreement with three energy companies to supply up to 7.5 million metric tonnes per year.
• Chevron Australia has signed a 20-year binding agreement with Tokyo Electric Power Company for as much as 3.1 million metric tonnes a year from its Western Australia development. South Korea has announced long-term agreements worth US$84 billion with Royal Dutch Shell and Total to buy 5.64 million metric tonnes per year from LNG projects in Australia from 2013 to 2035. Sinopec recently finalized an agreement with Origin Energy and its LNG partner ConocoPhillips to supply 4.3 million metric tonnes of LNG per year for 20 years from its Australia Pacific project.
• Qatar gas recently signed a 20-year deal with Malaysia to supply 1.5 million metric tonnes of LNG per year starting in 2012 and is in talks to supply gas-hungry Vietnam with significant supplies. The Vietnamese Government has already approved plans for a US$1 billion LNG import terminal capable of handling 2 million to 3 million metric tonnes per year.
• According to the Petroleum Economist, seven LNG terminals have been filed for application by the US. If approved and built, US export capacity could reach 102 mtpa – putting them ahead of Qatar as the largest exporter in the world and changing the regional dynamics in Asia significantly. This could also spur investors in Australia to pull back as buyers and opt instead for Henry Hub spot-based US LNG.
By 2020, total Pacific basin demand is expected to rise to 241 million metric tonnes per annum, up from 120 million metric tonnes today. At the same time, future exports from Asian suppliers are estimated at just 200 million to 230 million metric tonnes per annum (mtpa) based on the supply realities of key exporting countries in the Asia–Pacific region and around the world. While there is a gas glut right now, there will be a gap in supply to meet projected demand within the next decade.
Key challenges facing Canada in meeting future Asian LNG demand
1. Supply
2. Demand
3. Competition
4. Scale
5. Development progress
6. Commodity prices
7. Environment
8. Production cost
9. Facility and pipeline infrastructure
10. Global LNG fleet

Liquefied natural gas in Canada Rising to new challenges in the face of global demand4
Despite a temporary gas glut today, demand is still expected to outstrip supply by 2020
• Taking a supply/demand view of the Asia–Pacific region through 2015, there is still a projected gap in supply to meet projected demand, especially when taking into account the huge growth expected in China and India.
• Although potential future volumes from Canada are small on a global scale, they represent a relatively secure supply channel when compared against some other countries and can play an important role for Asian buyers looking for diversified supply.
• Asian companies are already investing in upstream gas assets in Canada, suggesting an anticipated future need to export to their home countries and an interest in the advantages of an integrated supply chain.
• Iran remains an unknown entity, and UN sanctions will likely slow their progress around building the first LNG facility in the country. Exports of ˜70 mtpa by 2015 seem unlikely.
Abundant Canadian gas supplies, reduced demand from the US and sustained low gas prices are creating a limited number of opportunities for LNG development within Canada.
What is the opportunity for Canada
through 2015?Canada has not missed the boat
in terms of diversifying its supply base for LNG in the future.
Supply Export potential and reserves Major LNG importers Demand
Australia ˜39 mtpa (by 2014) 110 trillion cubic feet of gas (tcf) reserves
China ˜15 mtpa
Qatar ˜77 mtpa (by 2012) 900 tcf reserves
Japan ˜80 mtpa
Russia˜Unknown, but 17.7 mtpa today1,680 tcf reserves
Vietnam˜1 mtpa
Iran˜70 mtpa (by 2015)1,045 tcf reserves
South Korea˜32 mtpa
Malaysia˜22 mtpa (by 2015)83 tcf reserves
Total Pacific basin demand is expected to rise from 120 mtpa to 241 mtpa.
* These numbers are estimated based on available sources.
Source: Ernst & Young
Approximate future exports 200–230 mtpa
Canada˜11.8 mtpa (by 2015)61 tcf reserves

5Liquefied natural gas in Canada Rising to new challenges in the face of global demand
Supply-side snapshot:
key trendsAustraliaCurrent LNG export capacity: ~19.9 mtpa Proven reserves: estimated at 110 tcf
Australia is the third-largest LNG exporter in the Asia–Pacific region and the fourth largest in the world. Together, its current North West Shelf project in Western Australia and its Darwin plant produce almost 20 million metric tonnes each year. A massive Gorgon project is under construction and is expected to add an additional 15 mtpa by 2015, and Chevron has approved a CDN$29 billion Wheatstone project in Western Australia, which will begin producing gas in 2016 and add an additional 25 mtpa within a few years. Longer term, a number of projects are under consideration, with the potential to increase Australia’s output to an estimated 91.5 mtpa by 2020.
QatarCurrent LNG export capacity: ~55.7 mtpa Proven reserves: 900 tcf
Sitting on the third-largest natural gas reserves in the world, Qatar expects to raise LNG exports to 73 million metric tonnes this year. Qatar is already exporting 60% of its LNG to Asia, a percentage that is expected to rise steadily, and has recently announced that it is considering export options to Pakistan. The country was also able to benefit from Japan’s troubled nuclear industry in 2011 and surging demand elsewhere in Asia.
RussiaCurrent LNG export capacity: ~17.7 mtpa Proven reserves: 1,680 tcf
The Russian government, together with Gazprom, the nation’s largest producer, has announced ambitious plans to raise production, principally with a view to serving the European market, which consumes 96% of Russian exports. However, weak European demand and a gas surplus in the Atlantic basin have led Russia to delay development of key projects until 2016. Looking ahead, Russia has significant additional capacity, as its proven reserves are the largest in the world and represent one-quarter of the world’s entire proven reserves of gas. We might start to see additional Russian export capacity coming into Asian markets, both new and existing.
IranCurrent LNG export capacity: 0 mtpa Proven reserves: 1,045 tcf
Iran sits on the second-largest natural gas reserves in the world. A key plant is under development at Tombak Port, including two LNG trains with capacity of 10.8 mtpa, which is set to begin exporting as early as next year. The country aims to become a major LNG supplier, with a production target of 70 million metric tonnes by 2015, and is already in talks with an Indonesian company to export 1.5 million metric tonnes annually. There are, however, reservations as to whether Iran can feasibly develop the facilities and infrastructure required amid increasing sanctions and lack of required skills and associated investment.
MalaysiaCurrent LNG export capacity: ~22.87 mtpa Proven reserves: 83 tcf
Formerly the third-largest LNG exporter, Malaysia is now making plans to begin importing natural gas to meet its growing domestic needs as it struggles to push through gas pricing reform and brace for its own declining gas production. It has recently inked deals to buy 1.5 mtpa in 2013 from Qatar and 3.5 mtpa from Australia’s Gladstone project, in which it has a 27.5% stake. Malaysia continues to export through long-term supply contracts to Japan, Korea and Taiwan. Petronas’ recent strategic partnership deal with Progress Energy in Canada will provide Petronas with desired upstream assets and Progress Energy with capital investment and a potential LNG export channel in the future.
200
180
160
140
120
100
80
60
40
20
0
1989
1990
1991
1992
1993
1994
1995
1996
1997
1998
1999
2000
2001
2002
2003
2004
2005
2006
2007
2008
2009
2010
2011
2012
2013
2014
2015
2016
2017
2018
2019
2020
2021
2022
Source: Centre for Global Energy Studies
Pilbara LNGBonaparte LNGGreater SunriseSouthern Cross LNGQueenslandIchthysWheatstoneGladstoneQueensland CurtisPlutoNorth West Shale
PTTEP FLNGBrowseScarboroughArrow LNG T1-T4Prelude FLNGNewcastleAustralia PacificFisherman’s LandingGorgonDarwin

Liquefied natural gas in Canada Rising to new challenges in the face of global demand6
Demand-side snapshot:
key trendsDemand for natural gas over the last 40 years has been steadily increasing in Southeast Asia, India, China, South Korea and Japan. Consumption stood at 138 million metric tonnes in 2010, representing 60% of the world’s LNG. Pacific basin demand is expected to rise to at least 241 million metric tonnes by 2020 according to Wood MacKenzie and Facts Global Energy, with China driving 56% of the region’s consumption growth.
ChinaDemand for natural gas could rise to as much as 43 billion cubic feet per day in China by 2030 (up from today’s 9 billion per day). However, the country’s LNG import growth could be mitigated by the emergence of indigenous conventional gas and potentially unconventional gas. China also has some very real alternative supply options from Russia via pipeline infrastructure. China currently has 80 tcf, or a 10-year supply of conventional gas resources, but gas deposits found in hard-to-extract sources may account for as much as 75% of the country’s total reserves of 3,687 tcf of gas. If extracted, this reserve could supply the world’s second-largest energy user for a century. However, according to BP’s 2011 statistical review, the need for imports in China will likely continue to rise in the coming years; for example, China drives 56% of the Asian region’s consumption growth in gas.
JapanConsumption of LNG surged in the aftermath of the Japanese earthquake last year, but the country consumed about 88 billion cubic metres (bcm) annually before the crisis. LNG consumption in Japan could increase by about 800,000 metric metric tonnes per month while reactors continue to be down through the spring and summer, and this increase could continue in the event they are not allowed to resume operations.
VietnamGas demand is estimated to be nearly 10 bcm per year in Vietnam, while domestic capacity is only 8.5 bcm. Vietnam’s largest gas producer plans to begin construction of a US$2 billion port for LNG imports and expects to be importing 3 bcm of gas per year by 2015. In the next few years, the country’s demand is expected to reach 17 bcm annually, while supply is expected to cap at only 14 bcm.
800
700
600
500
400
300
200
100
0
bcm
USA China Russia Japan
Source: BP & CGES
1990
1992
1994
1996
1998
2000
2002
2004
2006
2008
2010
2012
2014
2016
2018
2020
2022
2024
2026
2028
2030
2032
2034
2020
2010
0 100 200 300 400
China Rest of Asia Rest of the world
Source: The LNG Review 2010, Wood MacKenzie and Facts Global Energy

7Liquefied natural gas in Canada Rising to new challenges in the face of global demand
Demand markets in 20121. Established LNG markets of Japan,
South Korea and Taiwan are seeking supply security and diversification by fuel type. These countries have effectively locked in LNG demand, growing at steady incremental rates of between 1% and 3% per year.
2. Growing megamarkets of China and India, which started to develop less than a decade ago, are expected to grow at 10% per year and could develop into established markets.
3. Emerging markets of Southeast Asia, including Singapore, Thailand, Malaysia, Indonesia, Vietnam and the Philippines, include some of Asia’s “bedrock” producers — who are now becoming importers, as is the case with Petronas purchasing 3.5 mtpa from the Gladstone LNG project in which Santos, Petronas, Total and Kogas are partners.
Source: Peter Cleary, VP of Corporate Strategy and Development, Santos Ltd.
600
500
400
300
200
100
0
bcm
Under construction/planned Operating No. of importing countries
Source: Centre for Global Energy Studies
1969
1971
1973
1975
1977
1979
1981
1983
1985
1987
1989
1991
1993
1995
1997
1999
2001
2003
2005
2007
2009
2011
2013
2015
2017
2019
Source: Centre for Global Energy Studies
5,000-6,000
4,000-5,000
4,000-4,3003,300-3,600
11,000-11,500
6,500-7,000
6,000-7,000
1,000-1,500
Regasification plants in Asia — number of importers to double by 2015
Approximate distances to key Asian markets (nautical miles)Canada is closer than Qatar to Japan and other Asian markets.

Liquefied natural gas in Canada Rising to new challenges in the face of global demand8
Provided Canada can address the challenges inherent in serving these new markets and focus on ramping up the execution of required projects, there is a concrete opportunity for Canadian firms to position themselves as key future suppliers able to meet some of the projected demand in Asia. Canada can offer an important diversified supply base in the future, and the stability and security of Canadian reserves have the potential to offer a measure of security to countries looking to diversify their contracts, such as Japan, China, South Korea, Vietnam.To achieve success, Canadian firms will need to grapple with these key challenges:
1. Excess supply of gas: North American natural gas storage levels are still tracking at record highs. IHS CERA data shows that storage is high relative to the five-year average partly due to the very warm 2011/12 winter in the US. At the same time, new sources continue to come on stream partly due to the shale gas boom, creating an excess of gas supply both domestically in Canada and in the US as producers can still make economic returns from associated liquid components of overall production.
2. Reduced US demand: According to the National Energy Board, export prices for Canadian gas fell 3% last year to their lowest levels since 1999. Revenues from Canadian gas exports dropped to CDN$15.15 billion in 2010, also the lowest since 1999. If Canada continues to hedge its strategy on a single export customer in the US, the industry will continue to be challenged to grow and remain viable in the longer term.
Canadian exports to the US continue to decline
3. Suppressed North American natural gas prices: With plenty of unconventional gas likely to be developed in North America, it’s likely that gas prices will remain low for several years to come.
4. Current and future competition: Stiff competition in supply from Russia, Qatar and Australia for future Asian contracts, coupled with the excess supply in North America, means Canada faces significant challenges in understanding how to maximize its potential over time.
5. Lack of relative scale: With megaplayers stacking up with considerable export capacity, Canada does not have scale on the international stage.
6. Slow development progress: Canada does not currently have an LNG export facility on the West Coast and likely won’t for at least three to four years. While there are several LNG projects at various stages, only two, including Kitimat (owned by Apache (40%), EOG (30%) and EnCana (30%)) and BC LNG are in formal development with the National Energy Board granting export licenses to both. Two others (Shell West Coast Asian Consortium in Prince Rupert, British Columbia,
Top 10 key challenges
for Canada
10
8
6
4
2
02007 2008 2009 2010 2011 2012 2013 2014 2015 2016 2017
Bcf/d
Net exports - History Net exports - Forecasat
Source: BENTEK Canadian Observer Suite and Energy Trent Analyzer
Annual decline =0.6 bcf/d
Forecast annual decline =0.4 bcf/d

9Liquefied natural gas in Canada Rising to new challenges in the face of global demand
and Progress Energy/Petronas LNG) are still at the concept stage. Overall pipeline infrastructure is not sufficient to support any of these proposals. When compared with the fever pace of development occurring in Russia, Qatar, Iran and Australia, Canada is clearly coming from behind as a potential global leader.
7. Rising environmental and safety concerns: There are several environment, safety and social concerns being raised with LNG production. Producers will benefit by being aware of the issues and the range of solutions available (see sidebar).
8. Cost of production: The Western Canadian Sedimentary Basin has higher costs associated with production than any region in North America. And with the US considering its own LNG export potential, Canada will be challenged to compete on cost.
9. Required facility and infrastructure investment: An estimated CDN$50 billion in new pipelines and liquefaction terminals is expected to be needed over the next 5 to 10 years if Western Canadian producers are to take full advantage of opportunities in Asia through LNG exports. Liquefaction participation also requires a big balance sheet and a long time horizon. It is by far the most capital-intensive part of the value chain.
10. Availability of a global fleet of LNG carriers: LNG production is rising faster than carrier capacity is growing. It is estimated that at least 100 new ships will be needed to meet demand by 2020, with each ship estimated to cost upwards of CDN$250 million to build.
LNG environmental impacts1. Upstream shale gas extraction and production:
Some consider upstream shale extraction to have higher greenhouse gas emissions than traditional natural gas extractions, raising carbon emission concerns, releasing more carbon emissions than even coal or traditional oil extraction, and typically requiring large volumes of water. But new technologies are emerging to capture fugitive emissions, implementing carbon capture and storage. Recycling wastewater using flow-back technology, extracting water from saline aquifers and using water alternatives are coming on stream as viable and increasingly affordable solutions.
2. Pipeline transportation of natural gas to the LNG facility: Natural gas is highly flammable, making gas pipeline leaks vulnerable to explosions. That being said, natural gas pipelines and storage facilities have an excellent and longstanding safety record. This is a broader not-in-my-backyard (NIMBY) issue facing all energy development efforts.
3. Liquefaction of natural gas: Natural gas in a liquid state will immediately turn into gas when exposed to temperatures greater than -110ºC, making pool fires, flammable vapor clouds and flameless explosions all potential safety risks. While the likelihood of such events are minimal, the consequences would be significant. In 2004, a steam boiler explosion adjacent to propane and ethane storage infrastructure at an LNG facility in Algeria led to 27 casualties and 56 injuries. Overall, safety has been improving over time because of technology, and losses have been decreasing.
4. LNG tanker transport: Marine tanker transportation involves several environmental concerns, including tanker emissions, ballast water discharge, oil leakage and noise pollution to sensitive marine life. While identified as having a potential environmental impact, LNG carrier traffic has created little opposition.
5. First Nations and public: The proposed Kitimat LNG facility has received support from politicians and local First Nations people alike because of the lower environmental impact of a natural gas leak along the supply chain in comparison to oil. The production and export of natural gas will also have a much greater economic impact on British Columbia’s economy than the proposed export of bitumen from the Alberta oil sands.
Natural gasproduction
Shipping andmarketing
Regasificationterminals
Delivery andmarketingLiquefaction
High
Low
High
Low
Capital intensity
Returns
Source: J.P. Morgan

Liquefied natural gas in Canada Rising to new challenges in the face of global demand10
Beyond an immediate oversupply and flat commodity prices, an important niche opportunity in the global market exists for Canadian LNG firms in the long term — partly due to the geographic proximity to Asian markets. If Canada is to avoid losing out to the considerable opportunities others are exploiting, the country must immediately and sustainably accelerate the process of building the infrastructure needed to export to Asian markets. For firms hoping to capitalize on future Asian demand, here are some important recommendations:
1. Be prepared for reduced US demand: Canada is currently the largest exporter of natural gas to the US, and Canada’s natural gas pipeline system is highly interconnected with systems south of the border. Today, Canada accounts for approximately 87% of US imports of gas.
In the coming years, however, considerable shale gas reserves in the US will lead to a supply overload, with the US Energy Information Agency forecasting that, by 2030, just 1% of gas consumed in the US will come from Canada. Canadian firms must prepare for these changing dynamics.
2. Seek out new long-term customers: Asian demand for Canadian gas is set to increase in the long term, with China and Japan expected to become Canada’s most important customers. Many are anticipating that we will soon see Western Canadian gas get turned into LNG and sent via Kitimat and other potential LNG plants to Southeast Asia as US and domestic markets become oversupplied. Spending time developing business relationships and securing long-term supply contracts with Asian customers now needs to be a priority.
3. Seize geographic opportunities: Proximity to Japan, China, South Korea and Taiwan is a competitive advantage for Canada over Qatar and allows direct competition with Australia. Winners today will be those that move quickly to secure significant long-term contracts.
4. Take advantage of positive cash spreads: Transportation costs alone make gas produced from Canadian assets uneconomic below CDN$1.90/million British thermal units (Btu). A Wood MacKenzie study commissioned by BC LNG suggests Canadian gas could fetch CDN$11 to CDN$18/million Btu in Asia, costing CDN$5.25 to CDN$5.75/million Btu to produce the LNG and transport it across the Pacific.
Considerations
for Canada

11Liquefied natural gas in Canada Rising to new challenges in the face of global demand
In addition, the proposed West Coast Canadian LNG facilities are well positioned in terms of their connection to the North American natural gas grid. Kitimat owners have significant tested gas production fields that can supply this facility (e.g., Horn River basin).
5. Leverage existing Asian investment: Several Asian companies have made significant investments in Western Canadian upstream assets, including Sinopec, Petro-China, CNOOC, PETRONAS, JACOS, KNOC, Kogas, Mitsubishi and Inpex, in an attempt to potentially integrate their value chain and create security of supply. Canadian companies can use that investment to further integrate down the value chain and seize opportunities to supply gas to these firms through long-term contracts. According to J.P. Morgan, high returns may be derived from players with appropriate levels of control or ownership of key infrastructure. Export capacity, shipping capacity and import capacity can enable and support the development of a very high return trading function, especially given a portfolio of flexible LNG supply contracts.
6. Promote Canada as a safe and efficient place to do business: In comparison to Russia, Iran and Qatar, Canada is a relatively stable, democratic and secure place to do business. This is a significant attractor for customers looking to diversify and ensure stability of supply long term.
7. Consider the demand/supply imbalance long term: Pacific LNG demand is projected to reach 241 mtpa by 2020, while supply from Qatar, Australia, Malaysia, Russia and Iran is projected to reach approximately 200 to 230 mtpa by 2015. There is room now for Canada to position itself to make up some of the difference in the future.
8. Pursue joint ventures to support faster growth: Projects can be too big and too risky for a single company to tackle on its own, and many of the larger LNG and deepwater projects fall into this category. Companies can benefit by partnering for mutual benefit to access resources, leverage technology or optimize the supply chain. Careful planning and a thorough assessment of the risks, capital agenda and potential profit margins are necessary. Companies should also expect to see an increase in joint ventures (JVs) in the Canadian LNG space. A structured approach to establishing a JV will be critical to the success of those entering into strategic partnerships.
At the heart of a successful JV formation and setup is a robust plan based on a number of key foundation elements.
Setup plan
Setup charters Reporting
Vision andprinciples
Investment andsynergy case
Scope
Operating model
Budgeting Targetgovernance
Governance
16
14
12
10
8
6
4
2
01 Mar 11 1 June 11 1 Sep 11 1 Dec 11
US$
/mill
ion
Btu
To PG&E Citygate To Chicago Citygate To Japan/Korea
Source: Bentek Energy (bentekenergy.com)
AECO cash spreads to premium markets

Liquefied natural gas in Canada Rising to new challenges in the face of global demand12
When entering into a JV, companies must consider the various aspects of their business operating model, including strategy, business processes, corporate culture and values, information systems, structure and governance, and leadership and people management. These components can define a JV organization. That’s why a deep understanding of each factor is critical to the success of a new partnership before execution begins. By considering these factors, companies can ensure entering into a JV aligns with their strategic direction. Before a company enters into a JV, it must also consider a host of external influences. Oil and gas prices, consumer behavior, government regulation, infrastructure, export markets, market and economic performance, and the cost of capital have the power to derail any strategic decision.
When a company decides to proceed with a JV — after evaluating its operating model and external environment — it must undertake a series of steps, from the planning to the forming to the operating stage of the partnership. A successful transformation program focuses on project execution, operations excellence, business performance management and talent management throughout the life cycle of the JV.
Planning
1. Define the scope of the JV: The first step is to clearly define the scope of the assets that will be the subject of the JV.
2. Perform commercial analysis of the JV: Commercial analysis and modeling of the JV are key steps and should contain a number of scenarios with sensitivity analyses around key variables such as financials, production and geopolitical influences.
3. Define the legal, tax and financial structure: Consideration needs to be given to whether a separate legal entity is required and, if so, the appropriate legal, tax and financial structure that the JV will assume.
4. Define the business strategy and plan: A business strategy and development plan should be prepared for early discussion with potential JV partners.
5. Identify and select partners: JVs are often complex, long-term arrangements. Trust, therefore, is critical to the success of the relationship. The early signs of whether your company and its partners are compatible will be evident during the negotiation process.
6. Identify and manage third-party risk: While companies often enter into joint arrangements as a means to reduce risk concentration, partnering with another company introduces other risks that must be considered during the planning stage.
Making joint ventures
work for you
13Liquefied natural gas in Canada Rising to new challenges in the face of global demand
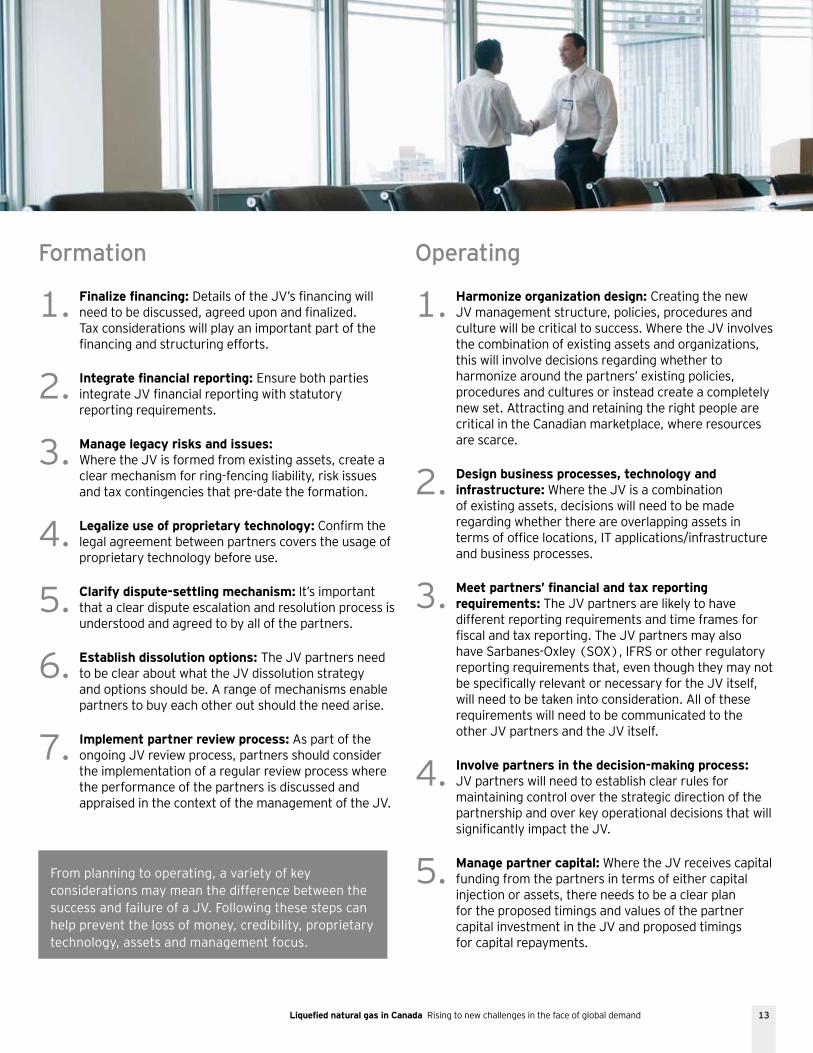
Formation
1. Finalize financing: Details of the JV’s financing will need to be discussed, agreed upon and finalized. Tax considerations will play an important part of the financing and structuring efforts.
2. Integrate financial reporting: Ensure both parties integrate JV financial reporting with statutory reporting requirements.
3. Manage legacy risks and issues: Where the JV is formed from existing assets, create a clear mechanism for ring-fencing liability, risk issues and tax contingencies that pre-date the formation.
4. Legalize use of proprietary technology: Confirm the legal agreement between partners covers the usage of proprietary technology before use.
5. Clarify dispute-settling mechanism: It’s important that a clear dispute escalation and resolution process is understood and agreed to by all of the partners.
6. Establish dissolution options: The JV partners need to be clear about what the JV dissolution strategy and options should be. A range of mechanisms enable partners to buy each other out should the need arise.
7. Implement partner review process: As part of the ongoing JV review process, partners should consider the implementation of a regular review process where the performance of the partners is discussed and appraised in the context of the management of the JV.
Operating
1. Harmonize organization design: Creating the new JV management structure, policies, procedures and culture will be critical to success. Where the JV involves the combination of existing assets and organizations, this will involve decisions regarding whether to harmonize around the partners’ existing policies, procedures and cultures or instead create a completely new set. Attracting and retaining the right people are critical in the Canadian marketplace, where resources are scarce.
2. Design business processes, technology and infrastructure: Where the JV is a combination of existing assets, decisions will need to be made regarding whether there are overlapping assets in terms of office locations, IT applications/infrastructure and business processes.
3. Meet partners’ financial and tax reporting requirements: The JV partners are likely to have different reporting requirements and time frames for fiscal and tax reporting. The JV partners may also have Sarbanes-Oxley (SOX), IFRS or other regulatory reporting requirements that, even though they may not be specifically relevant or necessary for the JV itself, will need to be taken into consideration. All of these requirements will need to be communicated to the other JV partners and the JV itself.
4. Involve partners in the decision-making process: JV partners will need to establish clear rules for maintaining control over the strategic direction of the partnership and over key operational decisions that will significantly impact the JV.
5. Manage partner capital: Where the JV receives capital funding from the partners in terms of either capital injection or assets, there needs to be a clear plan for the proposed timings and values of the partner capital investment in the JV and proposed timings for capital repayments.
From planning to operating, a variety of key considerations may mean the difference between the success and failure of a JV. Following these steps can help prevent the loss of money, credibility, proprietary technology, assets and management focus.

Liquefied natural gas in Canada Rising to new challenges in the face of global demand14
Tectonic shifts all around the world are reconfiguring the landscape for potential Canadian LNG suppliers, as Asian demand heats up and new competitors come on stream. In the short term, Canadian firms will be challenged by reduced US demand, coupled with a temporary excess of supply. Looking ahead, however, an anticipated shortfall by 2020 provides an important market opportunity for Canadian firms.
Canada does not yet have any LNG facilities under construction and lags behind in the development of the necessary infrastructure to transport LNG. But if it acts now, Canada can be well positioned to address the inevitable shortfall, which will begin to be felt within just a few years. Ernst & Young has developed a series of targeted tools designed specifically to assist Canadian LNG players in positioning themselves to succeed in the face of this important future opportunity.
Conclusion
15Liquefied natural gas in Canada Rising to new challenges in the face of global demand
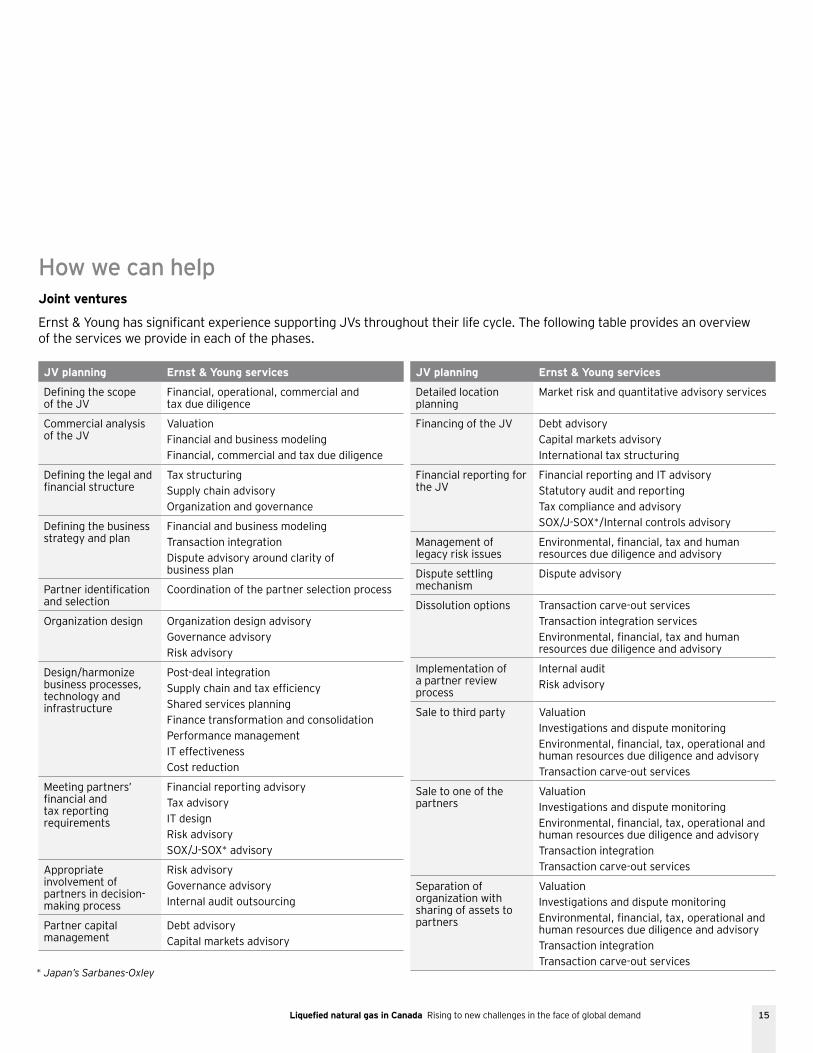
How we can help Joint ventures
Ernst & Young has significant experience supporting JVs throughout their life cycle. The following table provides an overview of the services we provide in each of the phases.
JV planning Ernst & Young services
Defining the scope of the JV
Financial, operational, commercial and tax due diligence
Commercial analysis of the JV
ValuationFinancial and business modelingFinancial, commercial and tax due diligence
Defining the legal and financial structure
Tax structuringSupply chain advisoryOrganization and governance
Defining the business strategy and plan
Financial and business modelingTransaction integrationDispute advisory around clarity of business plan
Partner identification and selection
Coordination of the partner selection process
Organization design Organization design advisory Governance advisoryRisk advisory
Design/harmonize business processes, technology and infrastructure
Post-deal integrationSupply chain and tax efficiencyShared services planningFinance transformation and consolidationPerformance managementIT effectivenessCost reduction
Meeting partners’ financial and tax reporting requirements
Financial reporting advisoryTax advisoryIT designRisk advisorySOX/J-SOX* advisory
Appropriate involvement of partners in decision-making process
Risk advisoryGovernance advisoryInternal audit outsourcing
Partner capital management
Debt advisoryCapital markets advisory
JV planning Ernst & Young services
Detailed location planning
Market risk and quantitative advisory services
Financing of the JV Debt advisoryCapital markets advisoryInternational tax structuring
Financial reporting for the JV
Financial reporting and IT advisoryStatutory audit and reportingTax compliance and advisorySOX/J-SOX*/Internal controls advisory
Management of legacy risk issues
Environmental, financial, tax and human resources due diligence and advisory
Dispute settling mechanism
Dispute advisory
Dissolution options Transaction carve-out servicesTransaction integration servicesEnvironmental, financial, tax and human resources due diligence and advisory
Implementation of a partner review process
Internal auditRisk advisory
Sale to third party ValuationInvestigations and dispute monitoringEnvironmental, financial, tax, operational and human resources due diligence and advisoryTransaction carve-out services
Sale to one of the partners
ValuationInvestigations and dispute monitoringEnvironmental, financial, tax, operational and human resources due diligence and advisoryTransaction integrationTransaction carve-out services
Separation of organization with sharing of assets to partners
ValuationInvestigations and dispute monitoringEnvironmental, financial, tax, operational and human resources due diligence and advisoryTransaction integrationTransaction carve-out services
* Japan’s Sarbanes-Oxley
Liquefied natural gas in Canada Rising to new challenges in the face of global demand16
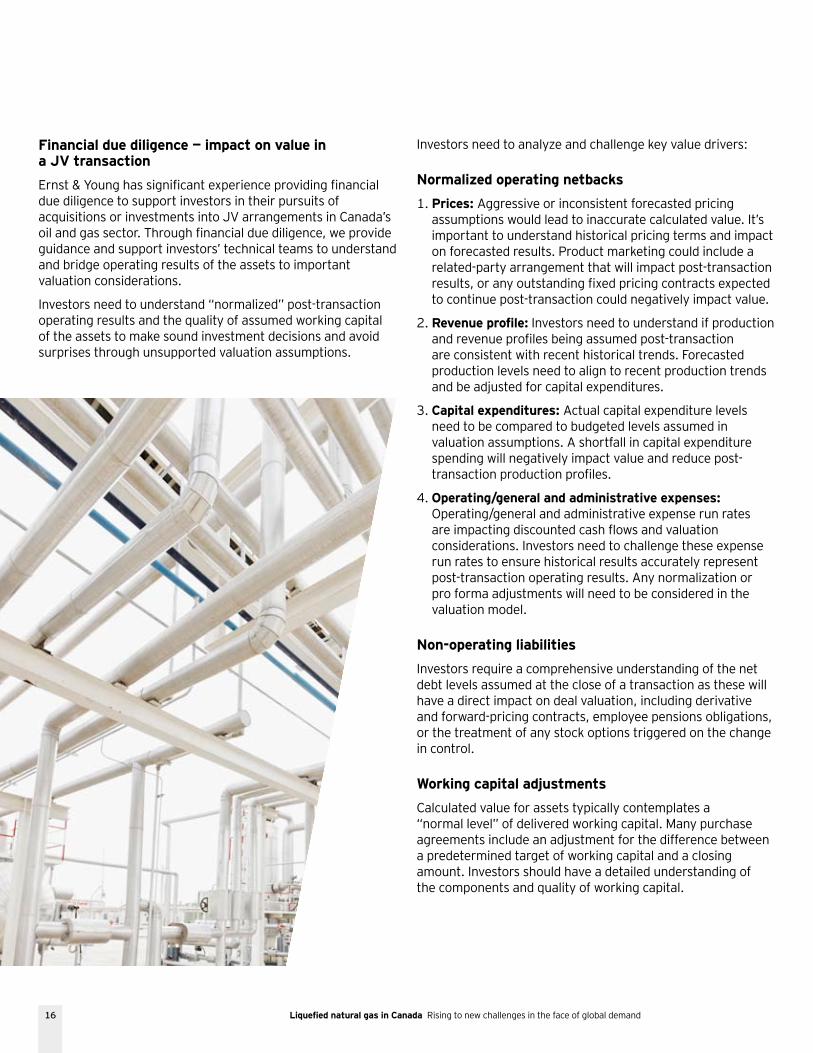
Financial due diligence — impact on value in a JV transactionErnst & Young has significant experience providing financial due diligence to support investors in their pursuits of acquisitions or investments into JV arrangements in Canada’s oil and gas sector. Through financial due diligence, we provide guidance and support investors’ technical teams to understand and bridge operating results of the assets to important valuation considerations.
Investors need to understand “normalized” post-transaction operating results and the quality of assumed working capital of the assets to make sound investment decisions and avoid surprises through unsupported valuation assumptions.
Investors need to analyze and challenge key value drivers:
Normalized operating netbacks1. Prices: Aggressive or inconsistent forecasted pricing
assumptions would lead to inaccurate calculated value. It’s important to understand historical pricing terms and impact on forecasted results. Product marketing could include a related-party arrangement that will impact post-transaction results, or any outstanding fixed pricing contracts expected to continue post-transaction could negatively impact value.
2. Revenue profile: Investors need to understand if production and revenue profiles being assumed post-transaction are consistent with recent historical trends. Forecasted production levels need to align to recent production trends and be adjusted for capital expenditures.
3. Capital expenditures: Actual capital expenditure levels need to be compared to budgeted levels assumed in valuation assumptions. A shortfall in capital expenditure spending will negatively impact value and reduce post-transaction production profiles.
4. Operating/general and administrative expenses: Operating/general and administrative expense run rates are impacting discounted cash flows and valuation considerations. Investors need to challenge these expense run rates to ensure historical results accurately represent post-transaction operating results. Any normalization or pro forma adjustments will need to be considered in the valuation model.
Non-operating liabilitiesInvestors require a comprehensive understanding of the net debt levels assumed at the close of a transaction as these will have a direct impact on deal valuation, including derivative and forward-pricing contracts, employee pensions obligations, or the treatment of any stock options triggered on the change in control.
Working capital adjustmentsCalculated value for assets typically contemplates a “normal level” of delivered working capital. Many purchase agreements include an adjustment for the difference between a predetermined target of working capital and a closing amount. Investors should have a detailed understanding of the components and quality of working capital.

17Liquefied natural gas in Canada Rising to new challenges in the face of global demand
Learn moreTo learn more about our research, drawn from discussions and experience advising international, national and local oil and gas companies, contact one of the following Ernst & Young professionals.
Lance Mortlock [email protected] +1 403 206 5277
Clint MacArthur [email protected] +1 403 206 5034
Robert Alexander [email protected] +1 403 206 5195
Barry Munro Canadian Oil & Gas Leader [email protected] +1 403 206 5017

Ernst & Young LLP
Assurance | Tax | Transactions | Advisory
About Ernst & YoungErnst & Young is a global leader in assurance, tax, transaction and advisory services. Worldwide, our 152,000 people are united by our shared values and an unwavering commitment to quality. We make a difference by helping our people, our clients and our wider communities achieve their potential.
Ernst & Young refers to the global organization of member firms of Ernst & Young Global Limited, each of which is a separate legal entity. Ernst & Young Global Limited, a UK company limited by guarantee, does not provide services to clients. For more information about our organization, please visit www.ey.com.
The Ernst & Young organization is divided into five geographic areas and firms may be members of the following entities: Ernst & Young Americas LLC, Ernst & Young EMEIA Limited, Ernst & Young Far East Area Limited and Ernst & Young Oceania Limited. These entities do not provide services to clients.
ey.com
© 2012 EYGM Limited All Rights Reserved.
EYG no. DW0161 CSG no. 1203-1344361
This publication contains information in summary form, current as of the date of publication, and is intended for general guidance only. It should not be regarded as comprehensive or a substitute for professional advice. Before taking any particular course of action, contact Ernst & Young or another professional advisor to discuss these matters in the context of your particular circumstances. We accept no responsibility for any loss or damage occasioned by your reliance on information contained in this publication.
Expiry date: 6 January 2013