Rishi R. Adhikary , Rinti Banerjee · Rishi R. Adhikary , Rinti Banerjee 1 Department of...
16
Rishi R. Adhikary , Rinti Banerjee 1 Department of Biosciences and Bioengineering, Indian Institute of Technology Bombay Mumbai, India
Transcript of Rishi R. Adhikary , Rinti Banerjee · Rishi R. Adhikary , Rinti Banerjee 1 Department of...

Rishi R. Adhikary, Rinti Banerjee
1
Department of Biosciences and Bioengineering,
Indian Institute of Technology Bombay Mumbai, India

Trigger Responsive
Nanoparticles
(THERApy)
Imaging
(diagNOSTICS)
THERANOSTICS
Source:
GLIOBLASTOMA
TEMOZOLOMIDEULTRASOUND RESPONSIVEAGENTS
Source:
http://en.wikipedia.org/wiki
/Glioblastoma_multiforme
NOSE'TO'BRAIN DRUG
DELIVERY
Source: Gray's anatomy :
the anatomical basis of
clinical practice

“There is Plenty of
Room at the Bottom”
Richard P. Feynman to the
American Physical Society in
Pasadena on December 1959
Source: http://en.wikipedia.org/wiki/Richard_Feynman

ULTRASOUND
� Inexpensive, portable, clinically trusted
� Use of the prodrug TEMOZOLOMIDE
pH
� Simultaneous trigger responsive therapy and diagnostic imaging-THERANOSTICS
� In the CNS:� Opening of the BBB
� Hyperthermia
� Alkaline pH of Glioblastoma
Basic pH
Source: Burger A, Abraham DJ. Burger's Medicinal Chemistry and Drug Discovery:
Chemotherapeutic agents: Wiley; 2003.
4

5

Figure: Gross appearance of the microbubble suspension showing two distinct layers. (1) Upper Layers containing the larger
bubbles (Scale 10µm) (2)Lower layers containing the microbubbles (Scale 100 nm)
6

Choline CH2
CH3
stretching
mode
CH2
stretching
mode
C=O
stretching
mode
C-H
asymmetric
stretch
Phosphate
Choline CH2
rocking
vibrations
7
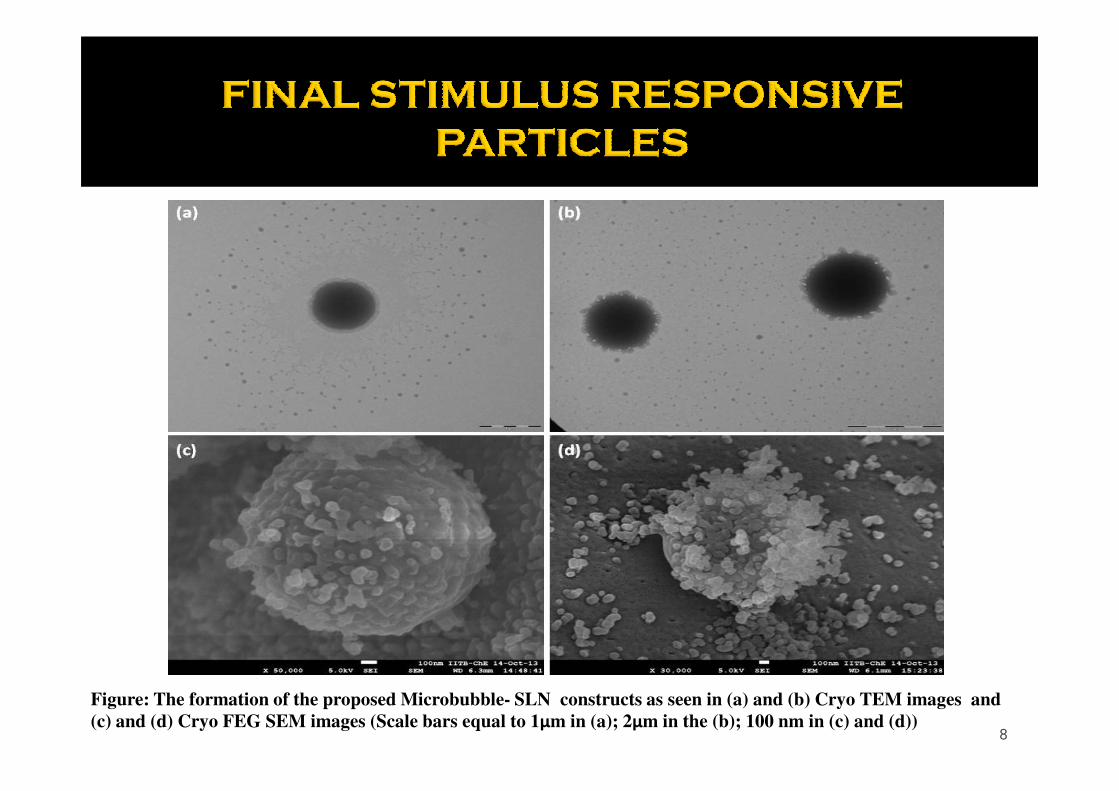
Figure: The formation of the proposed Microbubble- SLN constructs as seen in (a) and (b) Cryo TEM images and
(c) and (d) Cryo FEG SEM images (Scale bars equal to 1µm in (a); 2µm in the (b); 100 nm in (c) and (d))8

Figure: Contact angle measurements for determination of mucoadhesiveness. The values given
indicate the mean contact angle and error bars indicate the standard deviation (* p value
<0.0001 compared to glass). Also, significant difference shown (p value < 0.0001) between SLN
and Coated microbubbles+SLN (Error Bar representing Standard Deviation)
9
**
Pe
rce
nta
ge
of
dru
g c
ross
ing
th
e B
BB
10
Pe
rce
nta
ge
of
dru
g c
ross
ing
th
e B
BB
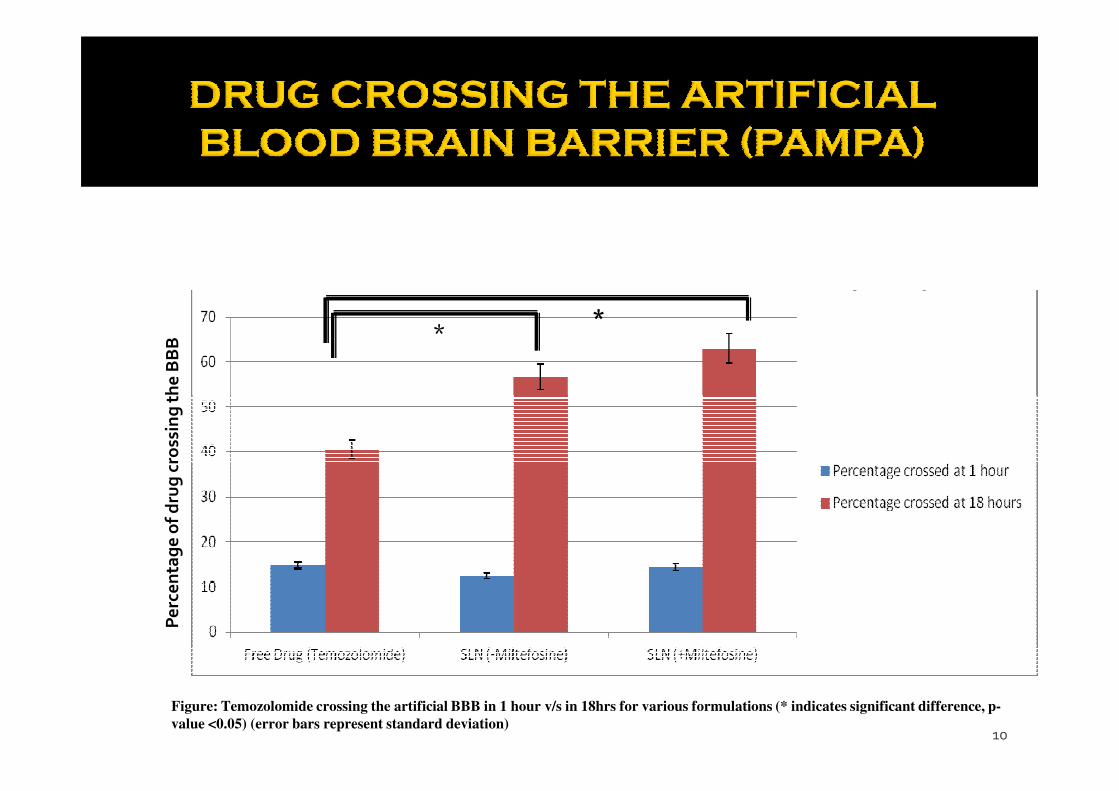
Figure: Temozolomide crossing the artificial BBB in 1 hour v/s in 18hrs for various formulations (* indicates significant difference, p-
value <0.05) (error bars represent standard deviation)
*
*
11
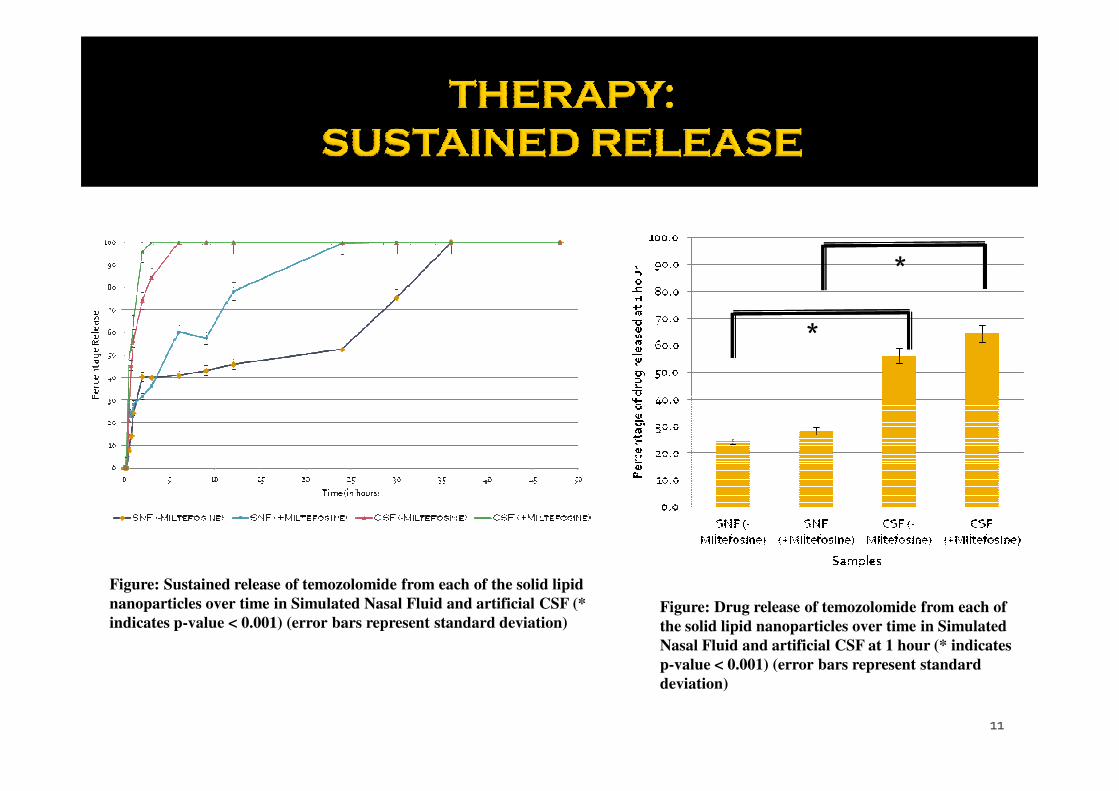
Figure: Sustained release of temozolomide from each of the solid lipid
nanoparticles over time in Simulated Nasal Fluid and artificial CSF (*
indicates p-value < 0.001) (error bars represent standard deviation)Figure: Drug release of temozolomide from each of
the solid lipid nanoparticles over time in Simulated
Nasal Fluid and artificial CSF at 1 hour (* indicates
p-value < 0.001) (error bars represent standard
deviation)

Figure : The Cryo FEG SEM images of SLN-loaded microbubbles prior to application of ultrasound (a) and after ultrasound
application (b-f). Ultrasound was applied using a sonoporator probe of 1MHz frequency, 100 % duty cycle for 15 second at various
intensities (in watt/cm2) viz. (b) 0.2 W/cm2 (c) 0.5 W/cm2 (d) 1 W/cm2 (e) 2 W/cm2 (f) 3 W/cm2
12

60
70
80
90
100
Pe
rce
nta
ge
of
Te
mo
zolo
mid
e R
ele
ase
d
*
*
0
10
20
30
40
50
SLN Alone SLN+US SLN (+MB)+US
Pe
rce
nta
ge
of
Te
mo
zolo
mid
e R
ele
ase
d
Miltefosine -
Miltefosine +
13
Figure : Temozolomide release from the drug delivery systems in the presence or absence of ultrasound and microbubbles for
two different SLNs (* indicates significant difference, p-value <0.01) (error bars represent standard deviation)

Agar Phantom
14
Degassed Water
Microbubbles Coated Microbubbles Final Particles
SLNAgarose Phantom

� THERANOSTIC AGENT: -Stimulus Responsive Drug Delivery (THERApy)-DiagNOSTIC imaging: contrast agent
� Suitable for Intranasal Administration
� Targeted treatment- Triggered therapy
� Novel alternative for toxic and invasive treatments
15

Acknowledgements:� Prof. Rinti Banerjee� Dr. Rima Mukherjee� Nanomedicine Lab � Indian Institute of Technology Bombay� Sophisticated Analytical Instrument Facility (SAIF) � Industrial Research and Consultancy Centre (IRCC)
16