Riptech Internet Security Threat Report -...
43
©2002 by Riptech, Inc. All Rights Reserved Riptech Internet Security Threat Report Attack Trends for Q1 and Q2 2002 Executive Summary The Riptech Internet Security Threat Report provides a broad quantitative analysis of Internet-based attacks targeted at hundreds of organizations during the preceding six- month period. Because of the large sample of organizations studied (selected from Riptech’s client base), the trends presented in this report provide an overall indicator of threats faced by the entire Internet community. This edition of the Riptech Internet Security Threat Report covers the six-month period starting on January 1, 2002 and ending on June 30, 2002. In sum, attack activity for the past six-month period was 28% higher than activity recorded during the prior six-month period, a projected annual growth rate of 64%. This increase is mainly due to the maintenance of relatively high rates of attacks that were attained in December 2001. Fortunately, the first half of 2002 lacked a widespread, devastating event, such as the Nimda and Code Red outbreaks in the summer and fall of 2001. While SQL Spida presented a strong reminder of the ever-present threat of worms, most companies in the sample set viewed it as a nuisance rather than a major threat. It is important to note that virtually all statistics indicate that Internet attack activity remains intense, pervasive, and potentially severe. In addition, because the threat continues to vary for companies by factors such as industry affiliation and ownership structure, it is probable that many types of organizations actually experienced a significant escalation in threat over the past six months. As an example, Power and Energy companies were more likely to suffer a severe attack in the last six months than they were during the prior six-month period. On the positive side, Riptech discovered what appears to be the first quantifiable evidence that companies may be achieving some level of success in defending against Internet attacks. For example, the percentage of companies that suffered at least one severe attack during the past six months declined by nearly half, a trend that is partly attributable to a gradual strengthening of the security postures of companies represented in the sample set. Companies that did not strengthen their security posture likely suffered higher rates of severe attack activity. Finally, this edition of the Threat Report includes an analysis of the modus operandi of various types of attackers. For example, Riptech examined the frequency with which attackers use various operating systems as platforms, as well as the most common systems and services that attackers seek for exploitation. In addition, Riptech initiated an ongoing commitment to track activity from possible sources of cyber terrorism. It is our goal that this information may help companies develop a greater awareness of their relative risk to different types of cyber attack activity. Volume II July 2002 Riptech, Inc. 2800 Eisenhower Avenue Alexandria, VA 22314 (703) 373-5100 Editor Mark Higgins Authors Tim Belcher Chief Technology Officer and Co-Founder Elad Yoran Executive Vice President and Co-Founder Research & Analysis Team Brian Dunphy Director, Analysis Operations Cori Lynn Arnold Research Associate Media Inquiries: [email protected] (703) 373-5350 While Riptech believes that the Threat Report offers a unique perspective on Internet attack activity, observations are inherently biased to some degree. Because Riptech’s sample set only consists of organizations that have implemented at least some security best practices, such as the deployment of well-configured firewalls and intrusion detection systems, they may be significantly less likely to suffer attempted or actual compromises. This being the case, the results of this study should be viewed as a best-case scenario. AN IMPORTANT NOTE ABOUT THE SAMPLE SET
Transcript of Riptech Internet Security Threat Report -...

©2002 by Riptech, Inc. All Rights Reserved
Riptech Internet Security Threat Report Attack Trends for Q1 and Q2 2002 Executive Summary The Riptech Internet Security Threat Report provides a broad quantitative analysis of Internet-based attacks targeted at hundreds of organizations during the preceding six-month period. Because of the large sample of organizations studied (selected from Riptech’s client base), the trends presented in this report provide an overall indicator of threats faced by the entire Internet community. This edition of the Riptech Internet Security Threat Report covers the six-month period starting on January 1, 2002 and ending on June 30, 2002. In sum, attack activity for the past six-month period was 28% higher than activity recorded during the prior six-month period, a projected annual growth rate of 64%. This increase is mainly due to the maintenance of relatively high rates of attacks that were attained in December 2001. Fortunately, the first half of 2002 lacked a widespread, devastating event, such as the Nimda and Code Red outbreaks in the summer and fall of 2001. While SQL Spida presented a strong reminder of the ever-present threat of worms, most companies in the sample set viewed it as a nuisance rather than a major threat. It is important to note that virtually all statistics indicate that Internet attack activity remains intense, pervasive, and potentially severe. In addition, because the threat continues to vary for companies by factors such as industry affiliation and ownership structure, it is probable that many types of organizations actually experienced a significant escalation in threat over the past six months. As an example, Power and Energy companies were more likely to suffer a severe attack in the last six months than they were during the prior six-month period. On the positive side, Riptech discovered what appears to be the first quantifiable evidence that companies may be achieving some level of success in defending against Internet attacks. For example, the percentage of companies that suffered at least one severe attack during the past six months declined by nearly half, a trend that is partly attributable to a gradual strengthening of the security postures of companies represented in the sample set. Companies that did not strengthen their security posture likely suffered higher rates of severe attack activity. Finally, this edition of the Threat Report includes an analysis of the modus operandi of various types of attackers. For example, Riptech examined the frequency with which attackers use various operating systems as platforms, as well as the most common systems and services that attackers seek for exploitation. In addition, Riptech initiated an ongoing commitment to track activity from possible sources of cyber terrorism. It is our goal that this information may help companies develop a greater awareness of their relative risk to different types of cyber attack activity.
Volume II July 2002
Riptech, Inc. 2800 Eisenhower Avenue Alexandria, VA 22314 (703) 373-5100
Editor
Mark Higgins Authors
Tim Belcher Chief Technology Officer and Co-Founder Elad Yoran Executive Vice President and Co-Founder Research & Analysis Team
Brian Dunphy Director, Analysis Operations Cori Lynn Arnold Research Associate Media Inquiries:
[email protected] (703) 373-5350
While Riptech believes that the Threat Report offers a unique perspective on Internet attack activity, observations are inherently biased to some degree. Because Riptech’s sample set only consists of organizations that have implemented at least some security best practices, such as the deployment of well-configured firewalls and intrusion detection systems, they may be significantly less likely to suffer attempted or actual compromises. This being the case, the results of this study should be viewed as a best-case scenario.
AN IMPORTANT NOTE ABOUT THE SAMPLE SET

Riptech, Inc. 2800 Eisenhower Avenue Alexandria, VA 22314 (703) 373-5100 Page 2
©2002 by Riptech, Inc. All Rights Reserved
TABLE OF CONTENTS TABLE OF CONTENTS ................................................................................................. 2 ABOUT THE INTERNET SECURITY THREAT REPORT ...................................... 3 SUMMARY OF FINDINGS............................................................................................ 4 DEMOGRAPHICS OF THE SAMPLE SET................................................................. 7 � INDUSTRY CLASSIFICATION ......................................................................................... 7 � COMPANY SIZE............................................................................................................ 7 � COMPANY OWNERSHIP ................................................................................................ 8 � CLIENT TENURE........................................................................................................... 8 METHODOLOGY ........................................................................................................... 9 � ATTACK IDENTIFICATION AND CLASSIFICATION ........................................................ 10 � CLIENT CLASSIFICATIONS.......................................................................................... 10 � ATTACK METRICS ..................................................................................................... 11 GENERAL ATTACK TRENDS ................................................................................... 16 � OVERALL ATTACK ACTIVITY .................................................................................... 16 � ATTACK SEVERITY .................................................................................................... 17 � ATTACK AGGRESSION ............................................................................................... 18 � ATTACKS BY DAY OF WEEK ...................................................................................... 19 ATTACK VARIANCE BY COMPANY TYPE........................................................... 21 � CLIENT TENURE......................................................................................................... 21 � INDUSTRY.................................................................................................................. 23 � OWNERSHIP STRUCTURE............................................................................................ 25 � COMPANY SIZE.......................................................................................................... 27 ATTACKER PROFILES............................................................................................... 29 � ATTACK SOURCE....................................................................................................... 29 � ATTACKER INTENT .................................................................................................... 31 � ATTACKER PLATFORM............................................................................................... 32 � TOP 20 SCANS ........................................................................................................... 33 � TOP ATTACKING NETWORK BLOCKS ......................................................................... 35 APPENDIX A—CYBER-TERRORISM WATCH LIST.......................................... A-1 APPENDIX B—WORM ACTIVITY ANALYSIS .................................................... B-1

Riptech, Inc. 2800 Eisenhower Avenue Alexandria, VA 22314 (703) 373-5100 Page 3
©2002 by Riptech, Inc. All Rights Reserved
ABOUT THE INTERNET SECURITY THREAT REPORT Riptech’s Internet Security Threat Report provides a broad quantitative analysis of Internet-based attacks targeted at hundreds of organizations. Trends presented in this report are made possible by Riptech’s managed security service. Enabled by the CaltarianSM technology platform, Riptech analyzes data produced by numerous brands of firewalls and intrusion detection systems (IDSs) used by hundreds of clients throughout the world. Using a sophisticated combination of technology and human expertise to analyze this data, Riptech identifies and investigates cyber attacks that occur on corporate networks in real time. As part of this daily investigation of Internet attacks, Riptech has developed and maintained the world’s largest repository of data on validated cyber attacks, which can be analyzed to reveal important and actionable trends. Due to the nature of the data that is used in this analysis, it is important to note that the majority of detected attacks are from external threats. While internal attacks (i.e., those launched by company insiders) are also detected, the trends discussed in the report focus on the threat of attacks launched from the outside. We believe the Internet Security Threat Report series provides a unique view of the state of Internet attack activity. Over the past six months alone, Riptech investigated more than one million potential cyber attacks on behalf of its clients. These attacks were detected by analyzing individual data points consisting of more than 11 billion firewall logs and IDS alerts. From these data points, Riptech isolated more than 1 million possible attacks and more than 180,000 confirmed attacks, which were analyzed for this report. Because the analysis is based on consistent, comparable data reviewed by expert analysts, the findings offer a more reliable view of the state of Internet security as compared to studies that rely on less controlled methodologies. For example, survey-based studies suffer from the widely disparate ways in which organizations detect, track, calculate, and report incidents. Open source data collection services, which are based on the automated analysis of firewall and IDS logs submitted voluntarily by companies, suffer from the inclusion of large numbers of false positive security events. In sum, the Riptech Internet Security Threat Report is the most reliable study to analyze Internet attacks based on actual empirical attack data that have been consistently collected and analyzed over an extended period of time.
Riptech, Inc. 2800 Eisenhower Avenue Alexandria, VA 22314 (703) 373-5100 Page 4
©2002 by Riptech, Inc. All Rights Reserved
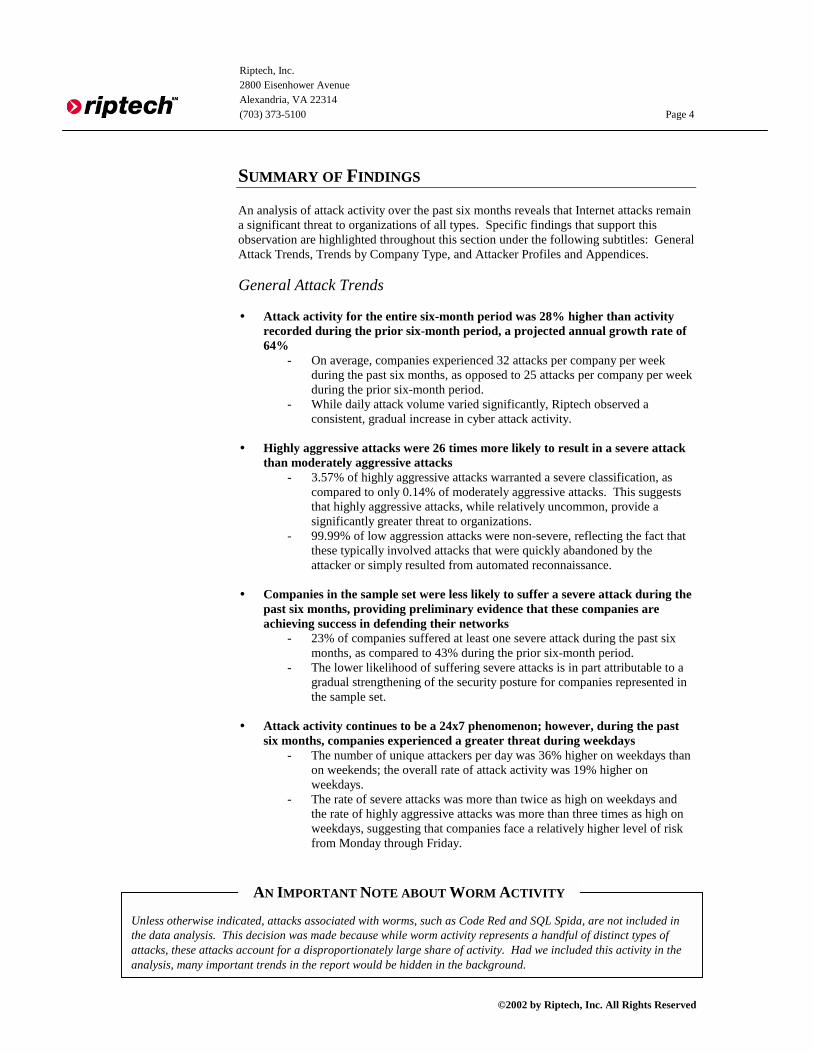
SUMMARY OF FINDINGS An analysis of attack activity over the past six months reveals that Internet attacks remain a significant threat to organizations of all types. Specific findings that support this observation are highlighted throughout this section under the following subtitles: General Attack Trends, Trends by Company Type, and Attacker Profiles and Appendices. General Attack Trends � Attack activity for the entire six-month period was 28% higher than activity
recorded during the prior six-month period, a projected annual growth rate of 64%
- On average, companies experienced 32 attacks per company per week during the past six months, as opposed to 25 attacks per company per week during the prior six-month period.
- While daily attack volume varied significantly, Riptech observed a consistent, gradual increase in cyber attack activity.
� Highly aggressive attacks were 26 times more likely to result in a severe attack
than moderately aggressive attacks - 3.57% of highly aggressive attacks warranted a severe classification, as
compared to only 0.14% of moderately aggressive attacks. This suggests that highly aggressive attacks, while relatively uncommon, provide a significantly greater threat to organizations.
- 99.99% of low aggression attacks were non-severe, reflecting the fact that these typically involved attacks that were quickly abandoned by the attacker or simply resulted from automated reconnaissance.
� Companies in the sample set were less likely to suffer a severe attack during the
past six months, providing preliminary evidence that these companies are achieving success in defending their networks
- 23% of companies suffered at least one severe attack during the past six months, as compared to 43% during the prior six-month period.
- The lower likelihood of suffering severe attacks is in part attributable to a gradual strengthening of the security posture for companies represented in the sample set.
� Attack activity continues to be a 24x7 phenomenon; however, during the past
six months, companies experienced a greater threat during weekdays - The number of unique attackers per day was 36% higher on weekdays than
on weekends; the overall rate of attack activity was 19% higher on weekdays.
- The rate of severe attacks was more than twice as high on weekdays and the rate of highly aggressive attacks was more than three times as high on weekdays, suggesting that companies face a relatively higher level of risk from Monday through Friday.
Unless otherwise indicated, attacks associated with worms, such as Code Red and SQL Spida, are not included in the data analysis. This decision was made because while worm activity represents a handful of distinct types of attacks, these attacks account for a disproportionately large share of activity. Had we included this activity in the analysis, many important trends in the report would be hidden in the background.
AN IMPORTANT NOTE ABOUT WORM ACTIVITY

Riptech, Inc. 2800 Eisenhower Avenue Alexandria, VA 22314 (703) 373-5100 Page 5
©2002 by Riptech, Inc. All Rights Reserved
� Attacks from countries on the Cyber-Terrorism Watch List were moderate in
volume, but showed several distinct attributes - Countries on the Watch List generated less than 1% of all attacks detected
over the past six months; 84% of this activity originated in Kuwait, Pakistan, Egypt, Indonesia, and Iran.
- Attacks were detected from only three of the seven countries designated by the U.S. State Department as “State Sponsors of Terrorism.” Iraq, Syria, North Korea, and Libya did not show any attacks over the past six months; however, this is likely attributable to Internet connectivity and mapping restraints.
- Scanning patterns from countries on the Watch List differed from patterns observed from all other countries, suggesting that the modus operandi of attackers operating from countries on the Watch List may differ from those of attackers elsewhere in the world.
Trends by Company Type � Long-term security monitoring clients experienced a relatively lower level of
risk exposure than newer security monitoring clients - Approximately 30% of companies with less than 12 months of tenure as
security monitoring clients experienced at least one severe attack during the past six months, as compared to only 17% of companies with greater than 12 months of tenure.
- Approximately 3% of companies with less than 12 months of tenure experienced at least one highly aggressive attack, as compared to 19% of companies with more than 12 months of tenure, suggesting that long-term monitoring clients drive attackers to resort to more highly aggressive tactics.
- In sum, as both volume and aggressiveness of attacks increase over time, security monitoring provides a quantifiable reduction in the likelihood of successful compromise.
� Industry risk exposure was relatively consistent over the past two six-month
periods - High Tech, Financial Services, and Power and Energy companies continue
to show the highest rates of attack activity per company. - 70% of Power and Energy companies suffered a severe attack during the
past six months, as opposed to 57% during the prior six-month period. � Public companies continue to experience higher risk exposure than Private,
Nonprofit, and Government entities - Public companies experienced an overall attack rate that is more than 50%
higher than the mean for the sample set. - Public companies were also nearly twice as likely to experience at least one
severe attack and nearly twice as likely to suffer a highly aggressive attack as Private, Nonprofit, and Government entities.

Riptech, Inc. 2800 Eisenhower Avenue Alexandria, VA 22314 (703) 373-5100 Page 6
©2002 by Riptech, Inc. All Rights Reserved
Attacker Profiles and Appendices � Analysis of attacks by country of origin over the past six months shows many
consistencies with the prior six-month period; however, a few compelling changes were also observed
- The majority of Internet attacks (approximately 80%) were launched from the top ten attacking countries; up from the 70% rate recorded during the prior six-month period. This increase was mostly attributable to the rise in attacks originating in the United States.
- The average attacks per Internet capita for countries with between 100,000 and 1 million Internet users is approximately 50% higher than the average rate for countries with more than 1 million Internet users.
- Among countries with less than 1 million Internet users, Iran and Kuwait show the highest rate of attacks per 10,000 Internet users.
� An analysis of attacker profiles and modus operandi revealed several entirely
new insights, while also confirming past observations - The percentage of attacks that appeared targeted at a specific company
remained relatively unchanged—37% of attacks appeared targeted during the past six months versus 39% during the prior six-month period.
- 93% of attackers detected over the past six months were only active for a single day. This likely reflects a large volume of home users, who constantly change their source IP address. If conventional wisdom were to hold true—that most attackers repeatedly use the same previously compromised systems to launch their attacks—one would expect this number to be much lower. This finding suggests that the majority of attackers that Riptech detected came from the actual systems or general location used by the attackers.
- 99.9% of all scans detected over the past six months were focused on only 20 services.
- The 47 network blocks flagged for high rates of attack activity were located in only 7 different countries; 72% of these network blocks were located in China and the United States.
� While worms are still appropriately considered a potential major threat,
activity from new and existing worms over the past six months was relatively high in volume, but presented only a moderate threat to companies in the sample set
- 44% of overall attack activity over the past six months resulted from worms, as opposed to 63% during the previous six-month period.
- Three major worms (Code Red, Nimda, and SQL Spida) continue to produce a large volume of scanning activity; however, over the past six months, less than 1% of companies in the sample set experienced a severe attack as a result of this activity.
- Because of the low severity rate, the majority of companies in the sample set viewed Code Red, Nimda, and SQL Spida as a nuisance rather than a significant threat.
- Interestingly, Riptech observed that a small percentage of apparent Code Red-related scans came from Unix systems. Since Unix systems are not susceptible to Code Red infection, Riptech believes that these attackers were using Code Red to disguise their activity and avoid detection by security administrators.

Riptech, Inc. 2800 Eisenhower Avenue Alexandria, VA 22314 (703) 373-5100 Page 7
©2002 by Riptech, Inc. All Rights Reserved
DEMOGRAPHICS OF THE SAMPLE SET The sample set from which the attack trends in this report was derived consists of a subset of more than 400 companies, located in more than 30 countries throughout the world. Combined, the security infrastructure at these companies protects millions of Internet-connected hosts. In terms of diversity, the sample set includes a broad array of organizations as measured by criteria such as industry, size, ownership type, and length of time as a security monitoring client. Key characteristics of the sample set are outlined in greater detail below. � Industry Classification Figure 1 presents the industry break down of the sample set in percentage terms. Industry groups were determined by reviewing a variety of public and private standards for industry classification, as well as engaging in direct client interactions. For the current edition of the Threat Report, ASP and E-Commerce were consolidated under one “E-Commerce” classification. � Company Size The total number of employees was used as a proxy to measure company size. Employee number was selected as the best proxy for company size because the number of employees typically correlates best to the relative size of a company’s network. Employee counts were gathered from public sources, as well as engaging in direct, client interactions. Figure 2 indicates the break down by company size for the sample set.
* “Other” includes industries that each represents less than 2% of the sample size. Industries that are accounted for in this category include retail, telecommunications, transportation, education, legal, government, and real estate.
Figure 1: Industry Breakdown
for Sample Set
Business Services25%
High Tech16%
Financial Services12%
E-Commerce10%
Healthcare7%
Manufacturing6%
Nonprofit6%
Power & Energy5%
Media/Entertainment4%
Other*9%
Figure 2: Company Size by Number of
Employees for Sample Set
Fewer than 50067%
5000+14%
1000-499912%
500-9997%

Riptech, Inc. 2800 Eisenhower Avenue Alexandria, VA 22314 (703) 373-5100 Page 8
©2002 by Riptech, Inc. All Rights Reserved
� Company Ownership Figure 3 indicates the break down by ownership type for the sample set. Data indicating the ownership structure of clients was gathered from public sources, as well as engaging in direct client interactions. � Client Tenure This metric indicates the length of time in which organizations in the sample set have subscribed to Riptech’s security monitoring service. The companies in the sample set are distributed between short, medium, and long-term time periods in which they subscribed to Riptech’s security monitoring service.
Figure 3: Company Ownership Typefor Sample Set
Government4% Nonprofit
7%
Private68%
Public21%

Riptech, Inc. 2800 Eisenhower Avenue Alexandria, VA 22314 (703) 373-5100 Page 9
©2002 by Riptech, Inc. All Rights Reserved
METHODOLOGY Trends discussed in the Internet Security Threat Report are based on the analysis of cyber attacks that were directed at a sample of organizations selected from among Riptech’s client base. The subset for this issue of the report consisted of over 400 companies that subscribed to Riptech’s real-time security monitoring service over the past six months. Each attack analyzed for this report was identified, investigated, annotated and classified appropriately by Riptech’s Security Operations Center (SOC) analysts. False positive signs of malicious activity (which can constitute up to 99% of raw IDS alerts and other security product output) are excluded from this analysis, as these alerts provide a misleading perception of the true nature of the Internet security threat. In addition, unless otherwise indicated, attacks associated with worms, such as Code Red and SQL Spida, are not included in the data analysis. This decision was made because while worm activity represents a handful of distinct types of attacks, these attacks account for a disproportionately large share of activity. Had we included this activity in the analysis, many trends in the report would likely be hidden in the background. Over the past six months, Riptech analyzed, validated, and categorized more than one million potential attacks, which were generated from the analysis of approximately 11 billion individual data points in the form of firewall logs and IDS alerts. From these data points, Riptech isolated more than 1 million potential attacks and 180,000 confirmed attacks, which were analyzed for this report. In order to provide a detailed understanding of how attack trends were determined, this section outlines the following three critical components of Riptech’s methodology: � Attack Identification and Classification—Riptech uses a combination of
technology and human expertise to review security-relevant data, weed out false positive signs of attack activity, and document valid instances of attempted attacks. The process of identifying and classifying attacks is critical to Riptech’s ability to gain insight into actual attack activity occurring on the Internet.
� Client Classification—Riptech categorizes each of its clients according to a wide
range of criteria, such as industry, company size, and company ownership type. Classifications are based on industry standards, and are determined from reviewing several public sources of information, as well as consulting directly with clients.
� Attack Metrics—Riptech used a wide variety of attack metrics to determine the
nature of attack activity over time, including: 1. Overall Attack Activity 5. Attack Aggression 2. Attack Severity 6. Attacker Profiles 3. Attack Type 7. Cyber-Terrorism Watch List 4. Attack Source 5. Attacker Intent
Each of the three core components of the methodology is summarized in greater detail throughout the remainder of this section.
Riptech, Inc. 2800 Eisenhower Avenue Alexandria, VA 22314 (703) 373-5100 Page 10
©2002 by Riptech, Inc. All Rights Reserved
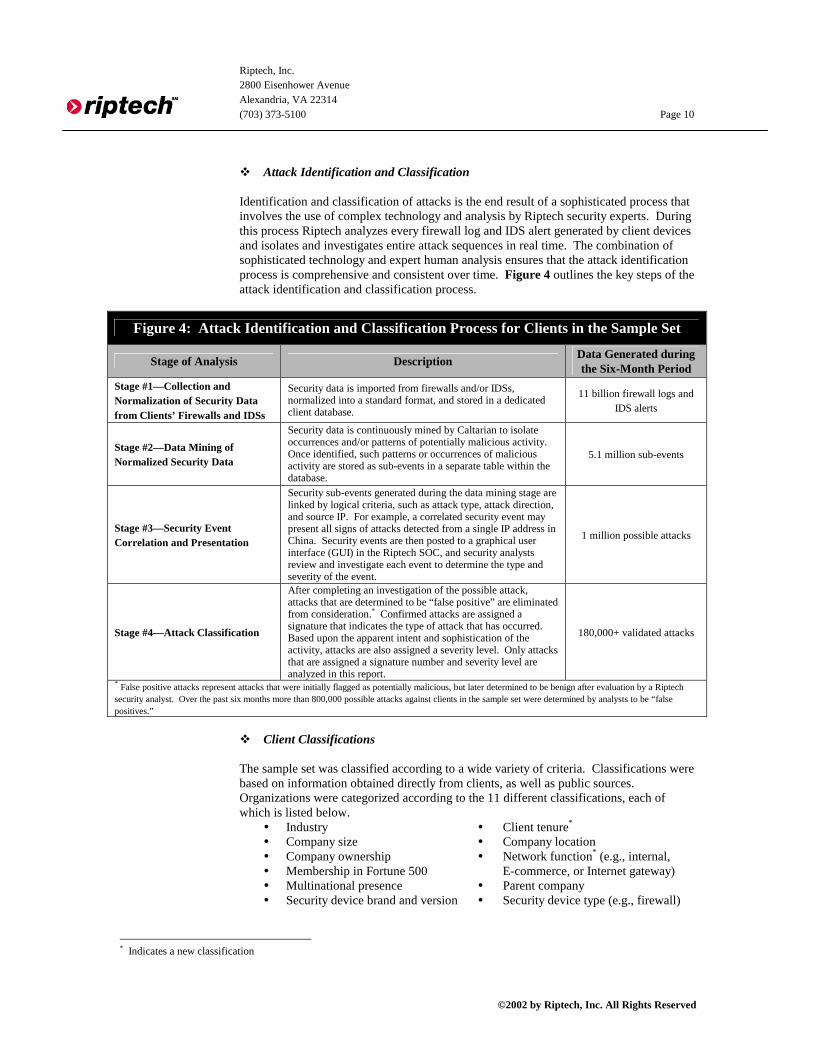
� Attack Identification and Classification Identification and classification of attacks is the end result of a sophisticated process that involves the use of complex technology and analysis by Riptech security experts. During this process Riptech analyzes every firewall log and IDS alert generated by client devices and isolates and investigates entire attack sequences in real time. The combination of sophisticated technology and expert human analysis ensures that the attack identification process is comprehensive and consistent over time. Figure 4 outlines the key steps of the attack identification and classification process.
Figure 4: Attack Identification and Classification Process for Clients in the Sample Set
Stage of Analysis Description Data Generated during the Six-Month Period
Stage #1—Collection and Normalization of Security Data from Clients’ Firewalls and IDSs
Security data is imported from firewalls and/or IDSs, normalized into a standard format, and stored in a dedicated client database.
11 billion firewall logs and IDS alerts
Stage #2—Data Mining of Normalized Security Data
Security data is continuously mined by Caltarian to isolate occurrences and/or patterns of potentially malicious activity. Once identified, such patterns or occurrences of malicious activity are stored as sub-events in a separate table within the database.
5.1 million sub-events
Stage #3—Security Event Correlation and Presentation
Security sub-events generated during the data mining stage are linked by logical criteria, such as attack type, attack direction, and source IP. For example, a correlated security event may present all signs of attacks detected from a single IP address in China. Security events are then posted to a graphical user interface (GUI) in the Riptech SOC, and security analysts review and investigate each event to determine the type and severity of the event.
1 million possible attacks
Stage #4—Attack Classification
After completing an investigation of the possible attack, attacks that are determined to be “false positive” are eliminated from consideration.* Confirmed attacks are assigned a signature that indicates the type of attack that has occurred. Based upon the apparent intent and sophistication of the activity, attacks are also assigned a severity level. Only attacks that are assigned a signature number and severity level are analyzed in this report.
180,000+ validated attacks
* False positive attacks represent attacks that were initially flagged as potentially malicious, but later determined to be benign after evaluation by a Riptech security analyst. Over the past six months more than 800,000 possible attacks against clients in the sample set were determined by analysts to be “false positives.”
� Client Classifications The sample set was classified according to a wide variety of criteria. Classifications were based on information obtained directly from clients, as well as public sources. Organizations were categorized according to the 11 different classifications, each of which is listed below. � Industry � Client tenure* � Company size � Company location � Company ownership � Network function* (e.g., internal, � Membership in Fortune 500 E-commerce, or Internet gateway) � Multinational presence � Parent company � Security device brand and version � Security device type (e.g., firewall)
* Indicates a new classification

Riptech, Inc. 2800 Eisenhower Avenue Alexandria, VA 22314 (703) 373-5100 Page 11
©2002 by Riptech, Inc. All Rights Reserved
In this edition of the Threat Report, Riptech focused on trends related to industry, company size, company ownership, and client tenure, as these classifications demonstrated the most notable variance in threat exposure. In future reports, other classifications, such as geographic location, may also be highlighted. In addition, several new classifications will be added in future reports to determine additional risk factors that affect the nature of cyber security threats. � Attack Metrics Riptech uses a wide variety of metrics to discover trends in attack activity. These metrics are then applied to different classifications of clients to determine whether a statistically significant relationship exists. For example, the average number of attacks per company is evaluated for companies that reside in different industries to test if certain industries are more prone to attacks than others. Each metric used to measure the nature of the cyber security threat is summarized below. Overall Attack Activity Riptech uses two basic metrics to quantify overall attack activity, Attacks Per Company and Unique Attackers. As a general rule, the Attacks Per Company metric serves as the most reliable indicator of attack volume over a specified time period, while the Unique Attackers metric serves as the most reliable indicator of the total number of attackers that were active over a specified time period. This is an important distinction considering the fact that a single attacker may be responsible for dozens (if not hundreds) of attacks. Each metric is explained in more detail below. � Attacks Per Company— Measures the total number of attacks per company that
were detected against the sample over a set time (i.e., day, week, month, etc.). The Attacks per Company metric is the most reliable indicator of attack volume detected over a specified time period. For the six-month period of the report, this metric is calculated by taking the average attacks per company each day, and then averaging the sum of these averages over six months. The attacks per company metric was specifically designed to account for clients that were added to the sample set throughout the past six months. The formula ensures that changes to the client base over time do not affect measures of overall attack activity.
� Unique Attackers—Measures the total number of unique source IP addresses that
launched attacks over a set time (i.e., day, week, month, etc.). The Unique Attackers metric is the most reliable indicator of the actual number of attackers that launched attacks over a specified time period.
As final note, it is important to explain that several types of Denial of Service attacks, which are misleading indicators of the overall number of unique attackers and the number of attacks during the past six months, were not included in the data set used for this study.

Riptech, Inc. 2800 Eisenhower Avenue Alexandria, VA 22314 (703) 373-5100 Page 12
©2002 by Riptech, Inc. All Rights Reserved
Attack Severity Every attack validated by a Riptech security analyst is assigned one of four severity classifications: informational, warning, critical, and emergency. The primary purpose of this rating system is to prioritize responses to attacks based on the relative level of danger that the event presents. A determination of severity is based on characteristics of an attack, defensive posture of the client, value of the assets at risk, and the relative success of the attack. For the current edition of the Threat Report, these four severity levels are further grouped into two classifications: severe and non-severe attacks. Severe attacks include attacks classified as either “emergency” or “critical”, while non-severe attacks include attacks classified as either “informational” or “warning.” The severity classification system is explained in greater detail in Figure 5.
Figure 5: Attack Severity Metrics
Severity Classification
Severity Level Description
Informational
These attacks consist of scans for malicious services and IDS attacks that do not have a significant impact on the client’s network. Example: � Scans for vulnerable services where all connection attempts are dropped by the firewall.
Non-Severe
Warning
These attacks represent malicious attacks that were successful in bypassing the firewall, but did not compromise the intended target systems. Example: � Scans/horizontal sweeps where some connections were allowed, but a compromise has not
occurred.
Critical
These attacks are malicious in nature and require action on the part of Riptech or the client to remedy a weakness or actual exploit of the client network or devices. By definition, if a critical attack is not addressed with countermeasures, the attack may result in a successful compromise of a system. Examples: � Continuous attacks by a single IP address against the client network. � A significant vulnerability on the client's network that was identified by either an attacker or the
Security Operations Center (SOC). For example, a web exploit is observed and appears to be successful, but there is no observed follow-up activity to take advantage of the vulnerability.
� Unknown suspicious traffic that warrants an investigation by the client to track or eliminate the traffic flow.
Severe
Emergency
These attacks indicate that a security breach has occurred on the client’s protected network. An emergency attack requires the client to initiate some form of recovery procedure. Examples: � Successful exploit of a vulnerable web server.

Riptech, Inc. 2800 Eisenhower Avenue Alexandria, VA 22314 (703) 373-5100 Page 13
©2002 by Riptech, Inc. All Rights Reserved
Attack Type For this edition of the Threat Report, Riptech replaced the list of the top 10 exploits with a list of the top 20 network scans. The change is designed to provide information that is more actionable for members of the Internet community. Because attackers can literally use dozens of different vulnerabilities to exploit any single service, it is more valuable for security administrators to know which services attackers are most likely to target, rather than the specific exploits that are most commonly used. Riptech discovered in the past that many of the top exploits were targeted at a single service. Therefore, information on top exploits only offers a partial view of the overall risk that organizations face. Attack Source Riptech identified the national and regional source of attacks by cross-referencing source IP addresses of every attack with a third-party, subscription-based database that links the geographic location of hosts to source IP addresses. While these databases are generally reliable, there is a small margin of error. Currently, Riptech cross references source IPs of attacks against every country in the world and also analyzes attack trends according to the following regions as defined by the 2001 CIA World Fact Book: � Africa � Asia � Caribbean � Eastern Europe � Latin America
� Middle East � North America � Oceania � South America � Western Europe
It is important to note that while Riptech has a reliable process for identifying the source IP of the host and/or network block that is directly responsible for launching an attack, it is impossible to verify whether the attacker is actually physically present at this location. It is probable that many apparent sources of attacks are, in fact, systems that were compromised and then used by attackers as a platform to disguise his/her identity and true location. Attacker Intent In order to determine general attacker objectives, Riptech looked at a sample of more than 100 clients who share a common network block. Riptech then examined all attacks launched against these companies, and determined the percentage that suffered targeted and opportunistic attacks. Figure 6 outlines how each type of attack was categorized.

Riptech, Inc. 2800 Eisenhower Avenue Alexandria, VA 22314 (703) 373-5100 Page 14
©2002 by Riptech, Inc. All Rights Reserved
Figure 6: Definitions of Attacker Intent
Objective Description
Opportunistic
Opportunistic attacks appear to be intent on locating any vulnerable system that exists on the Internet regardless of who owns the system or the specific function of the system. In this situation the victim of the attack was not identified in advance, but rather was selected after being identified as a vulnerable system. Typically, these attacks are preceded by a scan of many systems on the Internet until the attacker pinpoints a system that has vulnerabilities that he/she knows how to compromise.
Targeted
Targeted attacks appear to be directed at a specific organization. In theory, attackers who launch these types of attacks have identified the target company in advance and have made a conscious and deliberate attempt to gain access to their network. In this situation, the attacker is not looking for a specific vulnerability to gain access to ANY organization, but rather is looking for ANY vulnerability that will enable them to gain access to a specific system. For this report, these include all attacks in which the attacker did not perform any scan on any other networks within the network block of the sample set. In this situation, the attacker has only shown signs of malicious activity against one client.*
* It is important to note that it is possible that some attacks that appear targeted are actually opportunistic in nature. This is due to the fact that some attackers may use tools that randomly select a target without systematically scanning an entire network block for vulnerable systems. While it is expected that the number of these occurrences is small, this does introduce some margin of error in this calculation.
Attack Aggression
Riptech created a measure of Attack Aggression to quantify the level of effort associated with each attack detected during the study period. Creating a precise method to measure relative levels of Attack Aggression, however, is a considerable challenge due to the fact that the same technical attack characteristics that indicate high aggression in one case may indicate low aggression in another. For example, in many cases, attacks that involve a large number of exploits indicate a high level of aggression, while in other cases it indicates that an attacker is using a sophisticated (but easy to operate) hacking tool. To correct for this complication, Riptech's Attack Aggression Scale is based on multiple factors, including the number of signatures triggered, number of companies affected, and the duration of the attack. The specific technical indicators that were taken into account in the aggression scale are described in Figure 7. Once all attacks were ranked in terms of aggression, Riptech created a distribution curve to separate attacks into three levels of aggression: high, moderate, and low.
Figure 7: Attack Aggression Indicators
Technical Indicator Description
Number of Signatures Triggered
Measures the number of attack signatures triggered by the attacker during the course of the attack. The number of attack signatures has a direct correlation to the Attack Aggression score.
Number of Companies Affected
Measures the number of companies targeted by the attacker. The number of companies attacked has an inverse correlation to the Attack Aggression score.
Attack Duration Measures the time duration of the attack. The length of time spent by the attacker has a direct correlation to the Attack Aggression score.
Note: Measuring aggression is inevitably subjected to viewer perception. For example, while Code Red could be considered a highly aggressive attack if one considers the magnitude of its impact to the Internet community, from a single client’s perspective, Code Red represents a low aggression attack because it only involve a small amount of time and effort directed specifically at a single company’s network. For this study, Attack Aggression is measured from the perspective of a single target company, rather than the entire Internet community.

Riptech, Inc. 2800 Eisenhower Avenue Alexandria, VA 22314 (703) 373-5100 Page 15
©2002 by Riptech, Inc. All Rights Reserved
It is important to clarify the difference between Attack Severity and Attack Aggression. Attack Aggression is based on an algorithm that approximates the level of effort associated with an attack from a single company’s perspective, while Attack Severity is based on human analysis of the actual level of threat that an attack represents to the target organization. Just as a severe attack can result from a relatively non-aggressive attack, a highly aggressive attack may be non-severe in nature because it fails to uncover an exploitable vulnerability. In sum, severity is a proxy for threat and risk, while aggression is a proxy for effort and sophistication. Attacker Profiles For this edition of the Threat Report, Riptech designed an automated system that profiles a subset of attackers immediately after they attack one or more companies. The profiler gathers public data, such as the attacker’s operating system and services available on the attacker’s system. Combined with other metrics of attack activity, the profiler provides deeper insight into attackers’ modus operandi. It is important to note, however, that many of the systems identified as “attackers,” may actually be systems that were themselves compromised and then used as a launching point by attackers located elsewhere. Cyber-Terrorism Watch List In response to warnings issued by the United States Department of Homeland Security indicating that terrorists may be exploring the use of cyber-terrorism, Riptech created the Cyber-Terrorism Watch List. The Watch List tracks cyber attack activity from two types of countries: those designated by the U.S. State Department as State Sponsors of Terrorism and those from which terrorists have reportedly operated and recruited in the past. Countries selected for the latter category were based on a review of a variety of public sources that indicate possible “hot spots” of terrorist activity. It is important to note that, while Riptech does not claim to have specific expertise in terrorism, we believe this list presents an adequate starting point for tracking potential cases of cyber terrorism by monitoring some of the more likely sources. Countries included on the Cyber-Terrorism Watch List are listed in Figure 8.
FIGURE 8: COUNTRIES CURRENTLY ON THE CYBER-TERRORIST WATCH LIST
(January 1, 2002 – June 30, 2002) U.S. State Department
Designated State Sponsors of Terrorism
Countries with Reported Terrorist Activity
� Cuba � Iran � Iraq � Libya � North Korea � Sudan � Syria
� Afghanistan � Egypt � Indonesia � Jordan � Kuwait � Lebanon � Morocco � Pakistan � Saudi Arabia � United Arab Emirates

Riptech, Inc. 2800 Eisenhower Avenue Alexandria, VA 22314 (703) 373-5100 Page 16
©2002 by Riptech, Inc. All Rights Reserved
GENERAL ATTACK TRENDS � Overall Attack Activity The overall rate of attack activity for the past six months was 64% higher on an annualized basis. While fluctuations occurred during the past six months, on average, companies suffered approximately 32 attacks per company per week, as compared to 25 attacks per company per week during the prior six-month period. Specific observations relating to the overall rate of attack activity are summarized below. � Attack activity for the entire six-month period was 28% higher than activity recorded
during the prior six-month period, a projected annual growth rate of 64%. � While daily attack volume varied significantly, Riptech observed a consistent
gradual increase in cyber attack activity over the past six months. Figure 9 shows the average attacks per company per week over the past year.
Figure 9: Attacks Per Company Per Week
(January 1, 2002 - June 30, 2002)
0
5
10
15
20
25
30
35
40
45
50
7/8/
2001
7/22
/200
1
8/5/
2001
8/19
/200
1
9/2/
2001
9/16
/200
1
9/30
/200
1
10/1
4/20
01
10/2
8/20
01
11/1
1/20
01
11/2
5/20
01
12/9
/200
1
12/2
3/20
01
1/6/
2002
1/20
/200
2
2/3/
2002
2/17
/200
2
3/3/
2002
3/17
/200
2
3/31
/200
2
4/14
/200
2
4/28
/200
2
5/12
/200
2
5/26
/200
2
6/9/
2002
6/23
/200
2
Week
Ave
rage
Att
acks
Pe
r C
ompa
ny P
er W
eek
January 1, 2002

Riptech, Inc. 2800 Eisenhower Avenue Alexandria, VA 22314 (703) 373-5100 Page 17
©2002 by Riptech, Inc. All Rights Reserved
� Attack Severity Similar to the prior six-month period, all of the companies in the sample set experienced some form of attack activity over the past six months; however, the majority of these attacks were relatively non-severe in nature. Additional positive news is that the percentage of companies experiencing severe attacks was nearly half the percentage recorded during the prior six-month period. Specific observations relating to trends in Attack Severity are outlined below. � Similar to the prior six-month period, more than 99% of all attacks detected by
Riptech were non-severe in nature and did not present an immediate threat to companies.
� 23% of companies suffered at least one severe attack during the past six months, as
compared to 43% during the prior six-month period. While the percentage of companies suffering at least one severe attack has declined overall, the fact that nearly one quarter of companies faced an imminent security breach is still concerning.
� While several factors may have contributed to this decline, this trend is partly a
function of gradual improvements made to the security posture of companies represented in the sample set. Companies that did not strengthen their security posture likely suffered higher rates of severe attacks. This observation is discussed in more depth on page 21.

Riptech, Inc. 2800 Eisenhower Avenue Alexandria, VA 22314 (703) 373-5100 Page 18
©2002 by Riptech, Inc. All Rights Reserved
� Attack Aggression Background Riptech introduces a new attack metric, called Attack Aggression, in this edition of the Threat Report. This metric quantifies the level of effort that various attackers exert in order to penetrate target systems. Due to the complex nature of Attack Aggression, Riptech created a scale based on multiple factors, including the number of signatures triggered, number of companies affected, and the duration of the attack. Once all attacks were ranked in terms of aggression, Riptech created a distribution curve to separate attacks into three levels: high, moderate, and low. For a full description of the methodology used to calculate Attack Aggression, see page 14. Findings Significant observations with regard to Attack Aggression are summarized below. � Approximately 3.57% of highly aggressive attacks were also severe, while
approximately 0.14% of moderately aggressive attacks and 0.01% of low aggressive attacks were also severe. While highly aggressive attacks were relatively uncommon (less than 1% of all attacks were categorized as highly aggressive), this data indicates that when these attacks occur, they are more than 26 times more likely to be severe than moderately aggressive attacks.
� Only 0.01% of severe attacks were categorized as low aggression. This ratio most
likely reflects the fact that a low aggression attack typically involved one of the following scenarios:
1. The attacker commenced an attack, but quickly gave up after determining that the network was not a viable target.
2. An attacker was simply trolling the Internet looking for vulnerable systems and decided not to follow up with exploit attempts against a potential target.
Figure 10 illustrates the break down of attacks according to various levels of aggression and severity.
Figure 10: Breakdown of Aggression Levels by Severity
(January 1, 2002 – June 30, 2002) Aggression Level
High Moderate Low Severe 3.57% 0.14% 0.01%
Non-Severe 96.43% 99.86% 99.99% Total 100% 100% 100%

Riptech, Inc. 2800 Eisenhower Avenue Alexandria, VA 22314 (703) 373-5100 Page 19
©2002 by Riptech, Inc. All Rights Reserved
� Attacks by Day of Week Several metrics suggest that companies were exposed to higher risk of potential attack and compromise on weekdays as compared to weekends.1 Specifically, companies suffered higher overall rates of attack activity during weekdays and were also more likely to suffer severe and highly aggressive attacks on these days. Observations relating to the rate of attack activity by day of week are outlined below. � Over the past six months, the average rate of overall attack activity on weekdays was
approximately 19% higher than the rate of activity on weekends. � The average number of unique attackers per day during weekdays was 36% higher
than the number of unique attackers per day during the weekend, suggesting that many attackers may have decreased their level of activity on weekends.
� The rate of severe attacks on weekdays is more than double the rate on weekends,
and the rate of highly aggressive attacks on weekdays is more than triple the rate on weekends.
Figure 11 illustrates the percent of attacks of various types that occur on each day of the week; Figure 12 illustrates the percent of all unique attackers detected by day of week; and Figure 13 visually depicts the predictable dips in attack activity on weekends.
1 Riptech used Greenwich Mean Time (GMT) to determine boundaries for each day of the week. Saturday and Sunday are considered “weekends” and Monday, Tuesday, Wednesday, Thursday, and Friday are considered “weekdays.”
Figure 11: Percent of Attacks by Day of Week(January 1, 2002 - June 30, 2002)
13.9%14.9%
16.1%15.0%
12.8% 12.4%
18.0%
16.4%
19.7%
4.9%
6.6%
11.6%
15.5%
21.9%
15.5%
9.7%
5.8%
15.0%14.8%
19.7%20.0%
0%
5%
10%
15%
20%
25%
Monday Tuesday Wednesday Thursday Friday Saturday Sunday
Day of Week
Perc
ent o
f All
Atta
cks
in E
ach
Cat
egor
y
Total Attacks Highly Aggressive Attacks Severe Attacks

Riptech, Inc. 2800 Eisenhower Avenue Alexandria, VA 22314 (703) 373-5100 Page 20
©2002 by Riptech, Inc. All Rights Reserved
Figure 12: Unique Attackers by Day of Week(January 1, 2002 - June 30, 2002)
14.6%
15.9%16.4%
15.5%14.9%
11.5% 11.3%
0%
2%
4%
6%
8%
10%
12%
14%
16%
18%
Monday Tuesday Wednesday Thursday Friday Saturday Sunday
Day of Week
Perc
ent o
f All
Uni
que
Atta
cker
s
Riptech, Inc. 2800 Eisenhower Avenue Alexandria, VA 22314 (703) 373-5100 Page 21
©2002 by Riptech, Inc. All Rights Reserved
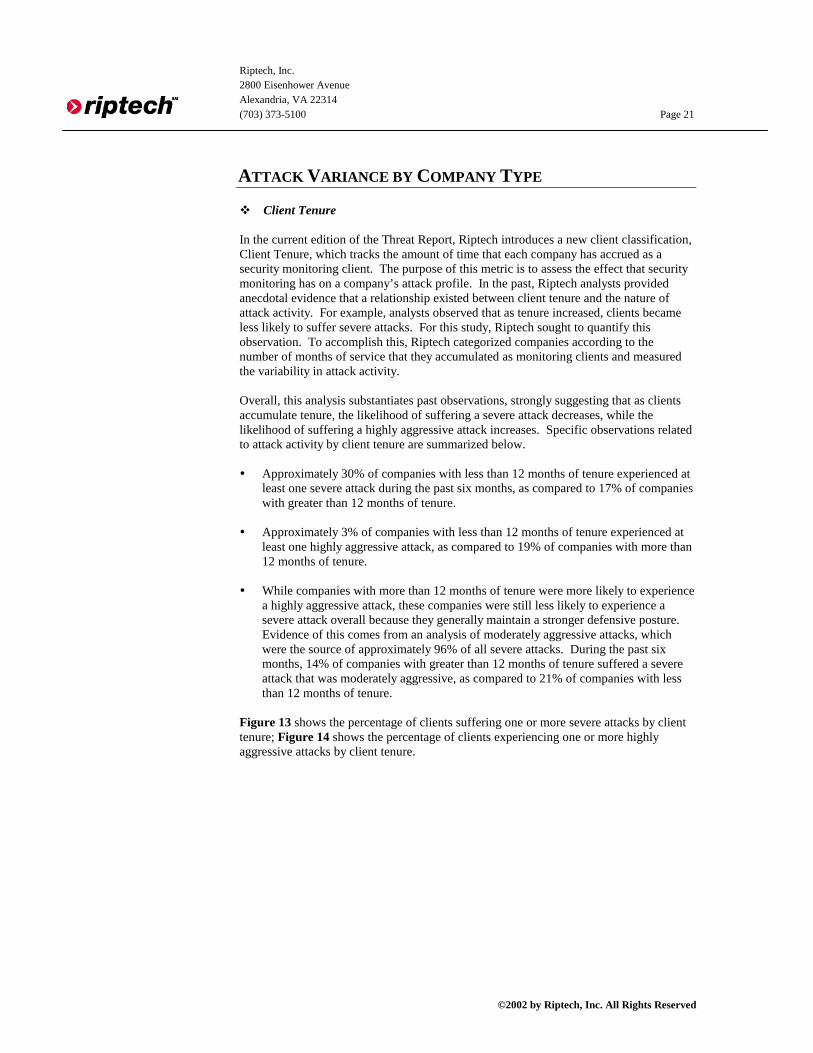
ATTACK VARIANCE BY COMPANY TYPE � Client Tenure In the current edition of the Threat Report, Riptech introduces a new client classification, Client Tenure, which tracks the amount of time that each company has accrued as a security monitoring client. The purpose of this metric is to assess the effect that security monitoring has on a company’s attack profile. In the past, Riptech analysts provided anecdotal evidence that a relationship existed between client tenure and the nature of attack activity. For example, analysts observed that as tenure increased, clients became less likely to suffer severe attacks. For this study, Riptech sought to quantify this observation. To accomplish this, Riptech categorized companies according to the number of months of service that they accumulated as monitoring clients and measured the variability in attack activity. Overall, this analysis substantiates past observations, strongly suggesting that as clients accumulate tenure, the likelihood of suffering a severe attack decreases, while the likelihood of suffering a highly aggressive attack increases. Specific observations related to attack activity by client tenure are summarized below.
� Approximately 30% of companies with less than 12 months of tenure experienced at
least one severe attack during the past six months, as compared to 17% of companies with greater than 12 months of tenure.
� Approximately 3% of companies with less than 12 months of tenure experienced at
least one highly aggressive attack, as compared to 19% of companies with more than 12 months of tenure.
� While companies with more than 12 months of tenure were more likely to experience
a highly aggressive attack, these companies were still less likely to experience a severe attack overall because they generally maintain a stronger defensive posture. Evidence of this comes from an analysis of moderately aggressive attacks, which were the source of approximately 96% of all severe attacks. During the past six months, 14% of companies with greater than 12 months of tenure suffered a severe attack that was moderately aggressive, as compared to 21% of companies with less than 12 months of tenure.
Figure 13 shows the percentage of clients suffering one or more severe attacks by client tenure; Figure 14 shows the percentage of clients experiencing one or more highly aggressive attacks by client tenure.

Riptech, Inc. 2800 Eisenhower Avenue Alexandria, VA 22314 (703) 373-5100 Page 22
©2002 by Riptech, Inc. All Rights Reserved
Figure 14: Incidence of Highly Aggressive Attacks by Client Tenure
(January 1, 2002 - June 30, 2002)
2.0% 1.5%
4.5% 4.9%
15.2%
25.0%
0.0%
5.0%
10.0%
15.0%
20.0%
25.0%
30.0%
1-3 Months 4-6 Months 7-9 Months 10-12Months
13-15Months
16-18Months
Months as Client
Perc
ent S
uffe
ring
One
or
Mor
e H
ighl
y A
ggre
ssiv
e A
ttac
ks
Figure 13: Incidence of Severe Attacks by Client Tenure(January 1, 2002 - June 30, 2002)
40.7%
30.3%
22.4%
27.2%
17.0% 16.7%
0%
5%
10%
15%
20%
25%
30%
35%
40%
45%
1-3 Months 4-6 Months 7-9 Months 10-12Months
13-15Months
16-18Months
Months as Client
Perc
ent S
uffe
ring
One
or
Mor
e Se
vere
Att
acks

Riptech, Inc. 2800 Eisenhower Avenue Alexandria, VA 22314 (703) 373-5100 Page 23
©2002 by Riptech, Inc. All Rights Reserved
� Industry Overall, attack rates by industry were similar to those recorded during the prior six-month period. The Power and Energy, Financial Services, and High Tech sectors suffered relatively high rates of attack activity, while industries, such as E-Commerce and Manufacturing suffered relatively moderate to low rates of attack activity. Specific highlights from this analysis are presented below. � Power and Energy, Financial Services, and High Tech companies continued to
experience the highest rate of overall attack activity, and also suffered relatively higher rates of severe and highly aggressive attacks during the past six months.
� 70% of Power and Energy companies suffered at least one severe attack during the
first six months of 2002, as opposed to 57% during the last six months of 2001. Figure 15 shows the number of attacks per company by industry; Figure 16 and Figure 17 show the percentage of companies suffering severe and highly aggressive attacks by industry.
Figure 15: Attacks Per Company by Industry(January 1, 2002 - June 30, 2002)
438
617 623 659 667 700
899977 1,018
1,280
0
200
400
600
800
1,000
1,200
1,400
Other
Manufa
cturin
g
Media/
Enterta
inmen
t
E-Com
merce
Healthc
are
Busine
ss Serv
ices
Nonpro
fit
High Tech
Financ
ial Serv
ices
Power
& Energy
Industry
Ave
rage
Atta
cks P
er C
ompa
ny

Riptech, Inc. 2800 Eisenhower Avenue Alexandria, VA 22314 (703) 373-5100 Page 24
©2002 by Riptech, Inc. All Rights Reserved
Figure 17: Incidence of Highly Aggressive Attacks by Industry
(January 1, 2002 - June 30, 2002)
3%
5%
9% 9%10%
11%
13%
18%19%
20%
0%
5%
10%
15%
20%
25%
E-Com
merce
Busine
ss Serv
ices
Other
Healthc
are
Manufac
turing
Nonpro
fit
Financi
al Serv
ices
Media/E
nterta
inmen
t
High Tech
Power
& Energy
Industry
Perc
ent S
uffe
ring
One
or
Mor
e H
ighl
y A
ggre
ssiv
e A
ttack
s
Figure 16: Incidence of Severe Attacks by Industry(January 1, 2002 - June 30, 2002)
9%12% 13%
18% 19% 21%
27%32%
46%
70%
0%
10%
20%
30%
40%
50%
60%
70%
80%
Healthc
areOthe
r
E-Com
merce
Media/E
nterta
inmen
t
Manufac
turing
Busine
ss Serv
ices
High Tech
Nonpro
fit
Financi
al Serv
ices
Power
& Energy
Industry
Perc
ent o
f Com
pani
es S
uffe
ring
O
ne o
r M
ore
Seve
re A
ttack
s

Riptech, Inc. 2800 Eisenhower Avenue Alexandria, VA 22314 (703) 373-5100 Page 25
©2002 by Riptech, Inc. All Rights Reserved
� Ownership Structure An analysis of attack activity by company ownership structure yielded mixed results with regard to Government, Nonprofit, and Private companies, while Public companies experienced a higher level of attack activity along all attack metrics. These results are similar to those recorded in the prior six-month period, which also indicated that Public companies suffered higher rates of overall attack activity. Specific highlights of this analysis are presented below. � Public companies experienced overall attacks per company at a rate that was
approximately 50% higher than the mean for all companies, and were nearly twice as likely to experience severe and highly aggressive attacks.
� Private, Nonprofit, and Government entities varied with regard to risk; however, in
comparison to public companies, these types of companies consistently suffered lower rates of attack activity.
Figure 18, Figure 19, and Figure 20 show the rate of various forms of attack activity by company ownership.
Note: It is important to note that Government clients principally include small state and local organizations.
Figure 19: Attacks Per Company by Ownership(January 1, 2002 - June 30, 2002)
475
693804
1274
0
200
400
600
800
1,000
1,200
1,400
Government Private Nonprofit Public
Ownership Structure
Ave
rage
Atta
cks P
er C
ompa
ny

Riptech, Inc. 2800 Eisenhower Avenue Alexandria, VA 22314 (703) 373-5100 Page 26
©2002 by Riptech, Inc. All Rights Reserved
Figure 21: Incidence of Highly Aggressive Attacksby Company Ownership
(January 1, 2002 - June 30, 2002)
8.0%8.5%
13.2%
0.0%
2.0%
4.0%
6.0%
8.0%
10.0%
12.0%
14.0%
Nonprofit Private Public
Ownership Structure
Perc
ent S
uffe
ring
At L
east
One
Hig
hly
Agg
ress
ive
Att
ack
Figure 20: Incidence of Severe Attacks by Company Ownership
(January 1, 2002 - June 30, 2002)
16%
27% 28%
34%
0%
5%
10%
15%
20%
25%
30%
35%
40%
Private Government Nonprofit Public
Ownership Structure
Perc
ent o
f Com
pani
es S
uffe
ring
At
Leas
t One
Sev
ere
Att
ack
Note: Government organizations did not suffer any highly aggressive attacks over the past six months.

Riptech, Inc. 2800 Eisenhower Avenue Alexandria, VA 22314 (703) 373-5100 Page 27
©2002 by Riptech, Inc. All Rights Reserved
� Company Size Riptech used the number of company employees as a proxy to measure the relative size of companies. While it appears that larger companies are exposed to a relatively higher threat, the results of this analysis are less conclusive than the analysis of companies along other classifications. Specific highlights of this analysis are presented below. � Companies with more than 1,000 employees experienced nearly 40% more attacks
per company than companies with less than 1,000 employees. � Companies with more than 5,000 employees were the most likely to suffer both
highly aggressive and severe attacks. Figure 22, Figure 23, and Figure 24 show the rate of various forms of attack activity by company size.
Figure 22: Attacks Per Company by Company Size
(January 1, 2002 - June 30, 2002)
681741
1,110
1,007
0
200
400
600
800
1,000
1,200
1-499 Employees 500-999 Employees 1000-4999 Employees 5000+ Employees
Number of Employees
Att
acks
Per
Com
pany

Riptech, Inc. 2800 Eisenhower Avenue Alexandria, VA 22314 (703) 373-5100 Page 28
©2002 by Riptech, Inc. All Rights Reserved
Figure 24: Incidence of Highly Aggressive
Attacks by Company Size(January 1, 2002 - June 30, 2002)
9%
10%
5%
16%
0%
2%
4%
6%
8%
10%
12%
14%
16%
18%
1-499 Employees 500-999 Employees 1000-4999Employees
5000+ Employees
Number of Employees
Perc
ent S
uffe
ring
One
or
Mor
e H
ighl
y A
ggre
ssiv
e A
ttac
ks
Figure 23: Incidence of Severe Attacks by Company Size
(January 1, 2002 - June 30, 2002)
16%
33%
26%
36%
0%
5%
10%
15%
20%
25%
30%
35%
40%
1-499 Employees 500-999Employees
1000-4999Employees
5000+ Employees
Number of Employees
Perc
ent o
f Com
pani
es S
uffe
ring
One
or
Mor
e Se
vere
Att
acks

Riptech, Inc. 2800 Eisenhower Avenue Alexandria, VA 22314 (703) 373-5100 Page 29
©2002 by Riptech, Inc. All Rights Reserved
ATTACKER PROFILES Riptech has built a wide variety of tools to identify attacker attributes, such as their apparent country of origin, the systems they are running, and their scans and exploits of choice. This section outlines several of these trends. � Attack Source An analysis of attacks over the past six months by country of origin revealed many similarities to the prior six-month period. It is important to note that for the current edition of the Threat Report, Riptech analyzed two separate categories of attacking countries per Internet capita. The first summarizes attacks per Internet capita for countries with more than 1 million Internet users; this group represents countries with a relatively large, developed Internet infrastructure. The second summarizes attacks per Internet capita for countries with between 100,000 and 1,000,000 Internet users; this group represents countries with relatively smaller and less-developed Internet infrastructures. Countries with fewer than 100,000 Internet users were excluded from this analysis. Highlights with regard to attack activity by source are summarized below. � The list of top ten attacking countries remained relatively consistent over the past
two six-month periods. While the order varied slightly, the top ten countries on both lists were identical.
� Approximately 80% of Internet attacks were launched from the top ten attacking
countries, up from 70% recorded during the last study period. This increase appears mostly attributable to the rise in attacks originating from the United States.
� The average attacks per Internet capita for countries with between 100,000 and 1
million Internet users is approximately 50% higher than the average rate for countries with more than 1 million Internet users.
� Iran and Kuwait top the list of attacking countries per Internet capita for countries
with less than one million Internet users. The rate of attack activity from Kuwait far exceeds the rest of the top ten countries and is more than twice the mean of all of the top ten attacking countries in this category.
Figure 25 shows the breakdown of all attacks by country of origin.
Figure 25: Breakdown of Attacks by Country of Origin
Country Percent of Total Attacks January – June 2002
Percent of Total Attacks July – December 2001
United States 40.0% 29.6% Germany 7.6% 5.9%
South Korea 7.4% 8.8% China 6.9% 7.8% France 5.2% 4.5% Canada 3.0% 3.9%
Italy 2.7% 2.5% Taiwan 2.4% 2.6%
Great Britain 2.1% 2.5% Japan 2.1% 2.0% Total 79.6% 70.1%

Riptech, Inc. 2800 Eisenhower Avenue Alexandria, VA 22314 (703) 373-5100 Page 30
©2002 by Riptech, Inc. All Rights Reserved
Figure 26 and Figure 27 show the rate of attacks per 10,000 Internet users for countries with two different ranges of Internet populations.2
Figure 26: Attacks Per Internet Capita
(More than 1 M Internet Users)
Country Attacks Per
10,000 Internet Users (January 1, 2002 – June 30, 2002)
Israel 33.1 Hong Kong 22.1
France 19.9 Belgium 17.6 Thailand 15.9 Poland 15.7
South Korea 15.5 Taiwan 13.8
Germany 13.1 China 10.4
Top Ten Average 14.4
Figure 27: Attacks Per Internet Capita (Less than 1 M & Greater than 100,000 Internet Users)
Country Attacks Per
10,000 Internet Users (January 1, 2002 – June 30, 2002)
Kuwait 50.8 Iran 30.8 Peru 24.5 Chile 24.4
Nigeria 23.4 Morocco 22.3
Puerto Rico 20.8 Argentina 19.3
Estonia 17.3 Romania 16.5
Top Ten Average 21.7
2 It is important to note that per capita rates are based on the 2001 CIA World Fact Book, which was not updated during the past six months. As a result, apparent changes in per capita rates over the past six-month period, as compared to the prior six-month period do not account for rates of growth in each country’s Internet population.

Riptech, Inc. 2800 Eisenhower Avenue Alexandria, VA 22314 (703) 373-5100 Page 31
©2002 by Riptech, Inc. All Rights Reserved
� Attacker Intent One of the most intriguing and challenging questions about Internet attacks is that of intent—was the attacker targeting a specific organization, or simply trolling the Internet and searching for an opportunity to exploit any vulnerable systems. Riptech’s methodology separates attacks into two general categories: those that were opportunistic (i.e., the attack was intended to exploit any vulnerable organization discovered on the Internet), and those that were targeted specifically at a given organization. For a description of the methodology, see page 13. During the prior six-month period, Riptech discovered that 39% of attacks appeared to be targeted. Analysis over the past six months revealed similar breakdowns—37% of all attacks appeared targeted in nature, while 63% appeared opportunistic. Figure 28 shows the breakdown of opportunistic versus targeted attacks for the past six months. Figure 28: Attacks by Attacker Intent
(January 1, 2002 - June 30, 2002)
Targeted37%
Opportunistic63%

Riptech, Inc. 2800 Eisenhower Avenue Alexandria, VA 22314 (703) 373-5100 Page 32
©2002 by Riptech, Inc. All Rights Reserved
� Attacker Platform Riptech developed and maintains a proprietary, automated system to continuously identify the platforms used by a random sample of attackers immediately after they are detected launching an attack against companies. The intent of this system is to profile typical attackers both in terms of the systems that they most commonly use and the services that they most commonly run. In addition, Riptech also tracks the number of days that attackers were active. Major insights from this investigation are listed below. � The Microsoft Windows suite of operating systems were used by more than 63% of
attackers, which is not surprising considering the dominant market penetration of Windows and the fact that most home users use Windows systems. Generic Unix and various versions of Linux accounted for approximately 20% of activity.
� Unreachable systems, a large percentage of which are likely to represent the actual
systems used by attackers, accounted for only 10% of the attack sample.3 This finding suggests that at least 10% of attackers detected during the past six months launched attacks directly against their intended target.
� Perhaps most interesting is that 93% of all attackers detected were only active for a
single day. This likely reflects a large volume of home users, who constantly change their source IP address. If conventional wisdom were to hold true—that most attackers repeatedly use the same previously compromised systems to launch their attacks—one would expect this number to be much lower. This finding suggests that the majority of attackers that Riptech detected came from the actual systems or general location used by the attackers.
Figure 29 shows the breakdown of attackers by the systems used to launch the attack.
3 “Unreachable Systems” could not be profiled by Riptech either because the attacker quickly disconnected from the Internet or the attacker was protected by a highly restrictive firewall.
Figure 29: Breakdown of Attackers
by Operating Systems Used(January 1, 2002 - June 30, 2002)
Windows (other)21.2%
Windows 2000/XP42.2%
Linux (generic)1.0%
Unknown4.2%
Linux (RedHat)8.6%
Unreachable10.3%
Unix (generic)12.1%
Solaris0.5%

Riptech, Inc. 2800 Eisenhower Avenue Alexandria, VA 22314 (703) 373-5100 Page 33
©2002 by Riptech, Inc. All Rights Reserved
� Top 20 Scans For this edition of the Threat Report, Riptech provides a list of the twenty most frequent scans detected against companies in the sample set. The frequency of different types of scans serves as a high level indicator of the types of services for which hackers are most often searching. Overall Trends During the past six months, 99.9% of scanning activity was concentrated on only 20 services. Each of these services is listed in Figure 30. While it may be comforting to know that the majority of scanning is focused on a relatively small subset of services, it is also important to note how quickly a low frequency scan can transform into a high frequency scan. As an example, after the emergence of the SQL Spida worm on May 20, 2002, Riptech saw the average number of scans for Microsoft SQL increase from five to several thousand per day. Even six weeks after SQL Spida, Microsoft SQL still accounts for 15% of all scanning activity. The case of SQL Spida illustrates why a truly effective security posture must adequately address both high-risk services, as well as relatively low-risk services, which always have the potential to transform rapidly into a high-impact threat.
Figure 30: Top Twenty Network Scans (January 1, 2002 – June 30, 2002)
Scan Type Operating Systems Affected
Percent of Total Scans
FTP All 31.7% MSSQL Windows 15.0%
SSH Primarily Unix 12.4% RPC (tcp) Primarily Unix 10.4%
HTTP* All 9.5% SubSeven Windows/Mac 4.8%
LPD Unix 3.2% CDE Subprocess Control Unix 2.1%
DNS (tcp) Primarily Unix 2.1% Netbios (137/udp) Windows 1.7%
Telnet Primarily Unix 1.6% Wingate Proxy/SOCKS (1080/tcp) Primarily Windows 1.2%
Netbios (139/tcp) Windows 1.0% Squid Proxy Primarily Unix 0.8%
SMTP All 0.7% SNMP All 0.5%
Netbus (12345/tcp) Mostly Windows 0.5% SMB/File Sharing (445/tcp) Windows 0.4%
HTTPS All 0.2% Kazaa Windows 0.1%
* It is important to note that many sources have suggested that the majority of Internet attacks target the HTTP service. Unfortunately, these observations are typically based only on the analysis of data from IDSs. Since a disproportionate share of IDS alerts are focused on HTTP attacks, coupled with the fact that many IDSs cannot detect scanning activity, analysis of IDS alerts alone yields distorted findings. Riptech avoids this distortion by looking solely at attack scanning activity, rather than restricting analysis only to exploits triggered by IDS alarms. In the end, this methodology provides more precise data concerning the types of services that attackers are most frequently seeking for exploitation.

Riptech, Inc. 2800 Eisenhower Avenue Alexandria, VA 22314 (703) 373-5100 Page 34
©2002 by Riptech, Inc. All Rights Reserved
Noteworthy Shifts in Activity Over the past six months, Riptech noted several interesting shifts in scanning activity, each of which is discussed below. � FTP—Scans for FTP increased by 86% during the first three months of 2002, and
then declined slightly through June. Close to 36% of FTP scans originated in Germany and France. Currently, the rate of FTP scans is 50% higher than levels recorded in January 2002. Riptech has observed that the majority of attackers that scan for FTP have one of two objectives: (1) fully compromise a system by leveraging well-known vulnerabilities, or (2) leverage misconfigurations to “borrow” an FTP server for use in uploading and storing pirated software, music, or movies.
� Microsoft SQL—Scans for Microsoft SQL increased dramatically over the past 6
months as a result of the SQL Spida worm. While Riptech first began detecting low levels of scanning for Microsoft SQL in the Fall 2001, the release of the SQL Spida worm on May 20, 2002 immediately caused more than a 500-fold increase in the rate of these scans. Since the release of SQL Spida, the SOC has identified more than 20,000 hosts infected by the SQL Spida worm.
� SSH—Once considered a secure alternative to Telnet, SSH is widely used by system
administrators to access Unix (and some Windows) systems remotely. Unfortunately, over the past year, a variety of remotely exploitable vulnerabilities emerged, rendering this service highly exposed to attack. While SSH remains the third highest target of scans, over the past six months this rate declined by 50%. However, considering the fact that several new SSH vulnerabilities were disclosed over the past few weeks (see http://www.cert.org/ advisories/CA-2002-18.html), SSH scans may soon rise again.
� RPC—RPC has been one of the most frequently targeted Unix services over the past
five years. A variety of Unix applications utilize the RPC daemon, and vulnerabilities in any one of these services can be targeted by attacking port 111 (tcp & udp). In the past six months, the number of scans for RPC increased by 20%.
� HTTP—Web servers continue to be a popular target for attackers. Over the past six
months, scans for web servers increased by 123%, with the majority of this increase occurring in May and June. Due to a variety of new Microsoft IIS and Apache vulnerabilities, Riptech expects scans for HTTP to continue increasing at a rapid rate. It is distinctly possible that the increase in scans for HTTP signifies that attackers are creating an inventory of the different versions of web servers operating on the Internet. These attackers may then use this inventory to create new worms that target web servers more efficiently than in the past.
� CDE Subprocess Control—Most likely as a result of the release of a new
vulnerability in January 2002 (see http://www.cert.org/advisories/CA-2002-01.html), the rate of CDE scans in June 2002 were more than four times the rate recorded in January 2002.
� SNMP—Several new SNMP vulnerabilities that affect countless systems were
disclosed in February 2002. While these vulnerabilities led to an initial increase in scans for SNMP in February, no significant increases have been detected since.

Riptech, Inc. 2800 Eisenhower Avenue Alexandria, VA 22314 (703) 373-5100 Page 35
©2002 by Riptech, Inc. All Rights Reserved
� Top Attacking Network Blocks When evaluating repeat sources of attacks, tracking network blocks, rather than individual source IPs, yields the most actionable information. While attackers frequently change their apparent source IP address—more than 93% of unique source IPs that attacked companies in the sample set were only active for a single day over the past six months—they are less likely to change the network block from which they operate. Therefore, network blocks that contain one or more highly active attackers will often show a high volume of attacks from many unique source IPs over an extended period of time. By identifying network blocks that match this profile, one can develop a better sense of where future attacks may originate. Over the past six months, Riptech isolated 47 highly active Class C network blocks, each of which was active for more than 10 days and was the source of more than 15 unique attacking source IPs. It is important to note that ISPs and companies associated with these network blocks are most likely not the true source of attacks. In fact, many are systems that were previously compromised, and others are network blocks allocated to home users. Keeping this caveat in mind, the top attacking network blocks are listed in Figures 31 – 33, and high-level observations regarding this list are provided below. Network blocks from the same ISP location are grouped together. � Only 7 countries in the world (United States, China, South Korea, France, Germany,
Turkey, and the Philippines) contributed to the list of top attacking network blocks. 72% of these were located in only 2 countries: China and the United States.
� The majority of network blocks represent space allocated to dial-up users and/or
individual home users, suggesting that corporate networks are rarely used in mass as a frequent attack launch point. It is important to note that a highly active dial-up network range may be the result of only a few (or even a single) attackers over time.
Figure 31: Top Attacking Network Blocks from North America
(January 1, 2002– June 30, 2002)
Network Block Unique Sources
Total Days Active Location
208.191.23.0/24 64.24.150.0/24 66.19.72.0/24 66.19.76.0/24
64.24.149.0/24 66.19.176.0/24 64.24.148.0/24
210 107 United States
65.139.127.0/24 65.139.126.0/24 65.141.51.0/24
172 62 United States
199.232.245.0/24 199.232.242.0/24 199.232.255.0/24
66 28 United States
216.53.218.0/24 59 28 United States 209.128.161.0/24 33 24 United States 205.208.148.0/24 28 21 United States 63.199.200.0/24 19 23 United States
63.11.67.0/24 18 14 United States 64.2.142.0/24 16 16 United States

Riptech, Inc. 2800 Eisenhower Avenue Alexandria, VA 22314 (703) 373-5100 Page 36
©2002 by Riptech, Inc. All Rights Reserved
Figure 32: Top Attacking Network Blocks from Asia
(January 1, 2002– June 30, 2002)
Network Block Unique Sources
Total Days Active Location
218.24.129.0/24 29 26 China 61.132.208.0/24 24 48 China 61.182.255.0/24 23 29 China 61.185.221.0/24 21 18 China 61.177.118.0/24 20 26 China 61.157.80.0/24 19 24 China 61.157.84.0/24 19 27 China
61.144.140.0/24 18 21 China 202.101.10.0/24 17 65 China 61.145.232.0/24 17 18 China 218.11.140.0/24 17 28 China 218.20.225.0/24 16 18 China 211.98.136.0/24 16 28 China 61.182.248.0/24 16 29 China 211.153.0.0/24 16 20 China
202.164.166.0/24 16 13 Philippines 218.233.206.0/24 25 21 South Korea
61.254.88.0/24 19 22 South Korea 211.183.5.0/24 18 14 South Korea
211.252.216.0/24 16 13 South Korea
Figure 33: Top Attacking Network Blocks from All Other Regions(January 1, 2002– June 30, 2002)
Network Block Unique Sources
Total Days Active Location
62.212.118.0/24 16 18 France 217.3.5.0/24 24 27 Germany 217.1.1.0/24 24 25 Germany
213.20.128.0/24 23 22 Germany 212.185.239.0/24 23 25 Germany
213.20.64.0/24 20 20 Germany 213.20.224.0/24 17 16 Germany 212.175.38.0/24 23 57 Turkey

Riptech, Inc. 2800 Eisenhower Avenue Alexandria, VA 22314 (703) 373-5100 Page 37
©2002 by Riptech, Inc. All Rights Reserved
Riptech, Inc., the premier provider of scalable, real-time managed security services, protects clients through advanced outsourced security monitoring and professional services. Riptech's unique CaltarianSM technology platform provides Real-Time Information ProtectionSM through around-the-clock monitoring, analysis, and response. The Caltarian technology is capable of processing large volumes of network security data to separate security threats from false positives in real-time, with carrier-class scalability. Additionally, Riptech's Security Professional Services group provides security policy development, assessment and auditing, penetration testing, incident forensics, and response. Riptech security specialists have secured hundreds of organizations including Fortune 500 companies and federal agencies. Founded in 1998 by former Department of Defense security professionals and market experts, Riptech is headquartered in Alexandria, Virginia with offices in San Jose, California, and New York City.
ABOUT RIPTECH

Riptech, Inc. 2800 Eisenhower Avenue Alexandria, VA 22314 (703)-373-5100 Page A-1
©2002 by Riptech, Inc. All Rights Reserved
APPENDIX A—CYBER-TERRORISM WATCH LIST Background In response to a recent warnings issued by the United States Department of Homeland Security indicating that terrorists may be exploring the use of cyber-terrorism, Riptech added the Cyber-Terrorism Watch List to current and future editions of the Threat Report. The Watch List tracks cyber attack activity from two types of countries: those designated by the U.S. State Department as State Sponsors of Terrorism and those from which terrorists have reportedly operated and recruited in the past. For a full description of the methodology used to select countries on the Watch List, see page 15. Findings An analysis of attack activity from countries on the Cyber-Terrorism Watch List is presented below. � Attacks were detected from only three of the seven countries designated by the U.S.
State Department as “State Sponsors of Terrorism.” 90% of this activity emanated from Iran, while the remaining 10% was split evenly between Cuba and Sudan. It is important to note that because Iraq, North Korea, Syria, and Libya, have little, if any, IP space assigned to them, it is difficult to detect attacks coming directly from these nations. Therefore, it is certainly possible that these countries are launching attacks, but they are being funneled through ISPs located in neighboring countries.
� Countries on the Watch List generated less than 1% of all attacks detected during the
past six-month period; 84% of this activity originated in Kuwait, Pakistan, Egypt, Indonesia, and Iran. Figure 34 shows the breakdown of attack activity from countries on the Watch List.
� The monthly rate of attack activity from countries on the Watch List remained
relatively constant over the past six months. At a high level, the variations in attack activity roughly match the patterns observed from all countries throughout the world. Figure 35 shows the rate of attack activity from countries on the Watch List over the past six months.
� Only one severe attack over the past six months came from a country on the Watch
List. This attack originated in Iran and was targeted at an E-commerce company with less than 500 employees located in the United States. Riptech has no evidence suggesting that this attack was in any way related to cyber terrorism.
� RPC was the target of approximately 25% of all scans from countries on the Watch
List, versus only 10.4% from all countries throughout the world. Other significant differences in scanning activity, such as the rate of scanning for FTP, LPD, and SubSeven, suggests that the modus operandi of attackers from countries on the Watch List may differ from the modus operandi of attackers located in other countries throughout the world. Figure 36 shows the top ten scans from countries on the Watch List.

Riptech, Inc. 2800 Eisenhower Avenue Alexandria, VA 22314 (703)-373-5100 Page A-2
©2002 by Riptech, Inc. All Rights Reserved
Figure 34: Breakdown of Attacks from Countries on the Cyber-Terrorism Watch List
(January 1, 2002 - June 30, 2002)
Asia22.7%
Europe28.3%
North America43.7%
Cyber-TerrorismWatch List
0.7%Other4.5%
Jordan0.3%
Sudan0.6%
Cuba0.7%
Morocco8.3%
United Arab Emirates3.5%
Pakistan19.0%
Indonesia14.8%
Egypt19.0%
Kuwait19.4%
Lebanon1.0%
Saudi Arabia1.7%
Iran11.7%
Figure 35: Attacks Per Company Per Month fromCountries on the Cyber-Terrorism Watch List
(January 1, 2002 - June 30, 2002)
0
1
2
3
4
5
6
7
January February March April May June
Month
Atta
cks p
er C
ompa
ny

Riptech, Inc. 2800 Eisenhower Avenue Alexandria, VA 22314 (703)-373-5100 Page A-3
©2002 by Riptech, Inc. All Rights Reserved
Figure 36: Top Ten Scans from Countries on the Cyber-
Terrorism Watch List (January 1, 2002– June 30, 2002)
Scan Type Scan Breakdown for
Cyber-Terrorism Watch List Countries
Scan Breakdown for All Countries
RPC 25.5% 10.4% FTP 22.6% 31.7% LPD 10.3% 3.2%
SubSeven 9.8% 4.8% SSH 6.6% 12.4%
HTTP 5.3% 9.5% CDE Subprocess
Control 5.0% 2.1%
DNS 4.2% 2.1% Telnet 3.2% 1.6%

Riptech, Inc. 2800 Eisenhower Avenue Alexandria, VA 22314 (703)-373-5100 Page B-1
©2002 by Riptech, Inc. All Rights Reserved
APPENDIX B—WORM ACTIVITY ANALYSIS The outbreak of Code Red and Nimda during the last half of 2001 illustrated the growing sophistication and danger of Internet worms. According to estimates set forth by Carlsbad, Florida-based Computer Economics, variants of Code Red alone infected several million hosts worldwide within a matter of hours, and cost organizations more than $2 billion in clean up expenses and lost productivity.4 In light of continued activity by Code Red and Nimda, coupled with the recent emergence of the SQL Spida worm, Riptech investigated the relative threat that these worms presented to the Internet community over the past six months. Highlights are presented below. � Code Red, Nimda, and SQL Spida showed a high level of activity over the past six
months, as indicated by the observations below. - Worms accounted for approximately 44% of all attack activity over the
past six months, as compared to 63% during the prior six-month period. - The rate of Code Red scans rose by nearly 50% from January 2002 to
February 2002, and then remained level through June 2002. - Nimda appeared as an ever-present source of scanning activity, but
average daily scans in June were approximately 50% lower than the average daily scans in January.
- SQL Spida, which first emerged on May 20, 2002, created a significant amount of scanning activity in a short burst of time. While these scans decreased after a few days, as of June 30, 2002, Riptech was still detecting more than 500 unique hosts scanning for Microsoft SQL per day as a result of this worm.
� Despite the relative frequency of Code Red, Nimda, and SQL Spida scans, these
worms only presented a moderate threat to the Internet community, and only a slight threat to the companies represented in the sample set. This is mainly due to the fact that most companies have taken the necessary steps to implement the required patches to protect their systems. As a result, less than 1% of companies in the sample set suffered a severe attack as a result of these worms.
� Using our attacker profiling system, Riptech determined that a small percentage of
apparent Code Red-related scans over the past six months came from Unix systems. Since Unix systems are not susceptible to Code Red, Riptech believes that these attackers were attempting to disguise their activity as Code Red in order to avoid the attention of security administrators.
� As a final note, it is important to consider the fact that Code Red, Nimda, and SQL
Spida still represent a major “potential” threat to organizations—even those that have properly safeguarded their systems from infection. As an example, there is always the possibility for an attacker to introduce a new variant of a worm, such as Code Red, that uses the thousands of systems that remain vulnerable as a launching point for a distributed denial of service attack.
Figures 37 -- 39 show the rate of scans per day resulting from Code Red, Nimda, and SQL Spida. Figure 40 illustrates the relative scale of activity among the three major worms.
4 Jesdenun, A. “Despite More Security Spending, Internet a More Dangerous Place.” Associated Press. (January 16, 2002).

Riptech, Inc. 2800 Eisenhower Avenue Alexandria, VA 22314 (703)-373-5100 Page B-2
©2002 by Riptech, Inc. All Rights Reserved
Figure 38: Unique Source IPs Per Day from Nimda
(January 1, 2002 - June 30, 2002)
0
5,000
10,000
15,000
20,000
25,000
1/1/
2002
1/8/
2002
1/15
/200
2
1/22
/200
2
1/29
/200
2
2/5/
2002
2/12
/200
2
2/19
/200
2
2/26
/200
2
3/5/
2002
3/12
/200
2
3/19
/200
2
3/26
/200
2
4/2/
2002
4/9/
2002
4/16
/200
2
4/23
/200
2
4/30
/200
2
5/7/
2002
5/14
/200
2
5/21
/200
2
5/28
/200
2
6/4/
2002
6/11
/200
2
6/18
/200
2
6/25
/200
2
Date
Uni
que
Sour
ce IP
s
Figure 37: Unique Source IPs Per Day
From Code Red and Variants(January 1, 2002 - June 30, 2002)
0
5000
10000
15000
20000
25000
30000
35000
40000
45000
1/1/
2002
1/8/
2002
1/15
/200
2
1/22
/200
2
1/29
/200
2
2/5/
2002
2/12
/200
2
2/19
/200
2
2/26
/200
2
3/5/
2002
3/12
/200
2
3/19
/200
2
3/26
/200
2
4/2/
2002
4/9/
2002
4/16
/200
2
4/23
/200
2
4/30
/200
2
5/7/
2002
5/14
/200
2
5/21
/200
2
5/28
/200
2
6/4/
2002
6/11
/200
2
6/18
/200
2
6/25
/200
2
Date
Uni
que
Sour
ce IP
s
Note: Due to Code Red’s attack algorithm, which initiates propagation on the first day of each month and ceases on the 20th of each month, activity appeared in predictable peaks and valleys.

Riptech, Inc. 2800 Eisenhower Avenue Alexandria, VA 22314 (703)-373-5100 Page B-3
©2002 by Riptech, Inc. All Rights Reserved
Figure 40: Unique Source IPs Per Day from Major Worms
(January 1, 2002 - June 30, 2002)
0
5,000
10,000
15,000
20,000
25,000
30,000
35,000
40,000
45,000
1/1/
2002
1/8/
2002
1/15
/200
2
1/22
/200
2
1/29
/200
2
2/5/
2002
2/12
/200
2
2/19
/200
2
2/26
/200
2
3/5/
2002
3/12
/200
2
3/19
/200
2
3/26
/200
2
4/2/
2002
4/9/
2002
4/16
/200
2
4/23
/200
2
4/30
/200
2
5/7/
2002
5/14
/200
2
5/21
/200
2
5/28
/200
2
6/4/
2002
6/11
/200
2
Date
Uni
que
Sour
ce IP
s
Code Red SQL Spida Nimda
Figure 39: Unique Source IPs Per Day from SQL Spida
(January 1, 2002 - June 30, 2002)
0
500
1,000
1,500
2,000
2,500
3,000
3,500
4,000
1/1/
2002
1/8/
2002
1/15
/200
2
1/22
/200
2
1/29
/200
2
2/5/
2002
2/12
/200
2
2/19
/200
2
2/26
/200
2
3/5/
2002
3/12
/200
2
3/19
/200
2
3/26
/200
2
4/2/
2002
4/9/
2002
4/16
/200
2
4/23
/200
2
4/30
/200
2
5/7/
2002
5/14
/200
2
5/21
/200
2
5/28
/200
2
6/4/
2002
6/11
/200
2
6/18
/200
2
6/25
/200
2
Date
Uni
que
Sour
ce IP
s