RIPSAC Real-Time Integrated Platform for Services & Analytics - CSE…cs620/RIPSAC_IITB_CSE.pdf ·...
33
1 Copyright © 2011 Tata Consultancy Services Limited RIPSAC – Real-Time Integrated Platform for Services & Analytics Dated : March 2013
Transcript of RIPSAC Real-Time Integrated Platform for Services & Analytics - CSE…cs620/RIPSAC_IITB_CSE.pdf ·...

1 Copyright © 2011 Tata Consultancy Services
Limited
RIPSAC – Real-Time Integrated
Platform for Services & Analytics
Dated : March 2013

2
RIPSAC - Objectives
Make it easy to develop applications that use
– sensors that can be reached using web protocols
– Sensor available on smart phones
Unlock sensor data from application silos
Provide a scalable and secure cloud based platform for these
apps
Provide a scalable platform for analytics can be performed

3
RIPSAC - A PaaS platform for IoT Applications
PaaS
Provider
Inte
rne
t
Sensor
Services
Analytics
Storage
Services
Internet
RIPSAC
App Developers
End User
Sensors
Sensor Providers
For Platform Provider
Core IoT Services
Identity , Security, Privacy
End User License Mgmt
Ad Delivery
Multi-tenancy
Sandboxes
Operation Support
Systems
For Sensor Provider
Feature, Phenomena &
Sensor description
Define feeds & sensor
streams
Publish & share sensor
streams
Define access control and
privacy preferences
For Application Developer
Dev & Test Sandboxes
SDK & APIs
Test Data
Publish Apps
Define EULAs
Manage App Life Cycle
For End User
Download Apps
Subscribe / Unsubscribe
Services
Control Privacy Settings
View usage history,
billing etc.
RIPSAC PaaS Cloud Use Case
RIPSAC – Real-time Integrated Platform for Services & AnalytiCs
Overview Java PaaS for Sensor Web & Mobile Crowd
Sensing Apps
Provides OGC SWE standards
SDK and APIs provided in RIPSAC

4
How Sensors connect with RIPSAC
Internet
Sensors
directly
connected to
Internet
Sensors connected to internet via gateways or handheld
devices
RIPSAC platform services
Sensor Networks
Web Services calls over Wireless / cellular
networks / m2m networks
Gateway Devices
handhelds
Sensors
directly
connected to
handheld device
Web Services interfaces exposed by RIPSAC
Platform services

5
RIPSAC Platform Services & APIs
RIPSAC provides the following services and APIs
Multi-tenant platform with secure virtual environment for each tenant
Java and JavaScript APIs
Sensor Services
– Sensor & sensor observation description, metadata & discovery
– Sensor observation recording and query
– Support for geo-spatial and spatio- temporal queries
– Can support any type of sensor & sensor observations
Database & Storage
– Relational and Document database services
– Load balanced and scale-out services
Analytics & Visualization Services
– Auto-scaling and load balanced „R‟ server farms
– Message driven batch analytics framework
– JavaScript APIs for visualizing and exploring Sensor Data

6
RIPSAC Applications
Producer
Applications
Consumer
Applications
RIPSAC
Platform
Services Producer
Applications
RIPSAC
“Producer”
Applications
RIPSAC
Platform
Services
RIPSAC
Platform
Services
Consumer
Applications RIPSAC
“Consumer”
Applications
Sensors, Gateway
Devices, Handhelds
( Source of sensor
observations )
End User
Application outputs

7
Integration with Infrastructure Cloud Services
Producer
Applications Producer
Applications RIPSAC
Applications
RIPSAC Platform Services RIPSAC Platform Services RIPSAC Platform Services
Infrastructure Cloud Services
RIPSAC Portal
Auto Scaling & Load Balancing Services
VM VM VM
Virtual Machines
Infrastructure Cloud Services API calls

8
Components in RIPSAC
Sensor Application @
Edge Gateway
Application @ Backend
Gateway
Sensor
Observation
Service
SOS
Authentication
SOS
Logging
SOS RDBMS
Sensor
discovery
RDBMS for App
Task Queue Load Balancer
R R
Portal
Visualization
Control
Logic Analytics
Consum
er
Applic
ation
Java SOS
Library
App Life Cycle
Mgt
DB Mgt
Analytics
Dashboard Multi Tenancy
Maven
Archetype
Service
Dashboard Visualization
Library
MongoDB
ObjectStore
JavaScript
SOS Library
On
Openstack
based TCS
Cloud
On
Amazon
ASW Cloud

9
RIPSAC Features
Feature List
• OGC Sensor Observation Service ( SOS)
• Sensor catalog service / registry service
• Time Series Database
• Sensor Simulator
• Template Project/Code Generator
• Authentication & Logging for SOS
• APIs
• Java Client libraries
• JavaScript client libraries
• Relational Database Service
• Document Database (NoSQL) service
• Play Framework support
• Task Queues
Feature List
• R based Scalable Analytics Service
• Batch jobs framework
• Tenant Management
• Multi-tenant app deployment support
• Application life cycle management
• Service Dashboard
• OpenStack infrastructure cloud integration
• JavaSacript Sensor Data Visualization libraries
• Horizontal scalability of sensor and analytics services
• Runs on OpenStack based TCS Cloud
• Runs on Amazon AWS cloud

10 Copyright © 2011 Tata Consultancy Services
Limited
Example RIPSAC Applications

11
Smart Transportation Solution
Sensor Interface
Services
Storage & Database
Services
Analytics Services
RIPSAC + Apps
iDigi M2m
Cloud
Bus Tracking System
Parking Management
Cab & Passenger Tracking
Reports & Alerts
Location ( GPS), Speed,
Accelerometer, Passenger Ids
Valid passenger
lists, Route Info
Images / video
feeds of entry &
exit ramps of
underground
parking lots
Images of cab
registration
number,
Passenger Ids

ReSolver: Wind Forecasting on RIPSAC
Protocol
Convertor
System Network
SCADA Workstation 2
SCADA Workstation 1
Wind Operator Control Room
Internet
Historian Workstation
Forecaster Workstation
Dash board Workstation
Forecast 1
Forecast 2
Adaptive Combination
Forecast 3 . .
RIPSAC Communication & Reporting
Adaptive Wind Forecasting Boost forecast accuracy of a given
predictor Adaptively combine multiple
predictors for better accuracy Benefits Better asset utilization Real-time competitive advantage in
energy trading markets Minimize imbalance charges Features Adaptive forecast Program maintenance Data security 24x7 service SLA compliance Reporting
13
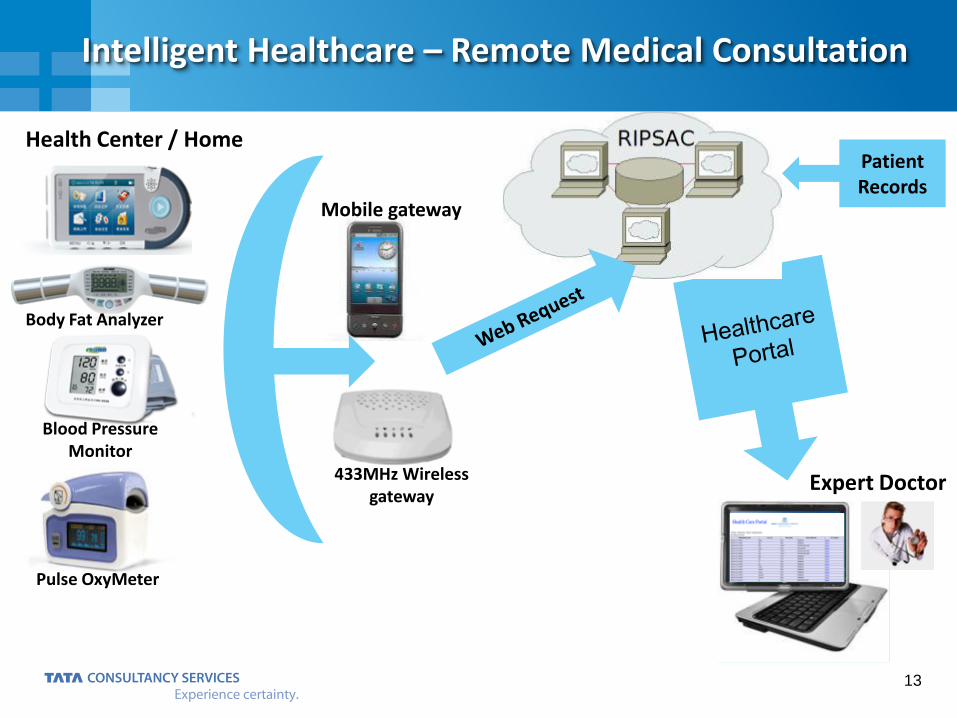
Intelligent Healthcare – Remote Medical Consultation
ECG
Body Fat Analyzer
Blood Pressure Monitor
Pulse OxyMeter
Mobile gateway
433MHz Wireless gateway
Patient Records
Health Center / Home
Expert Doctor

14
RIPSAC and Big Data

Big Data Approaches in RIPSAC
Scale out of SOS and Analytics Server
Map Reduce on Mongo DB
Export of SOS Data to HDFS
Meta Data in SOS, Big Data in Hadoop HBase

Scale out of SOS and Analytics Server
Sensor Observation Service ( SOS)
Front-end
SOS
Server
Load Balancer
R
Analytics Server Farm
Application
SOS
Server SOS
Server R R

Map Reduce on Mongo DB
Sensor Observation Service
Mongo DB
Map Reduce on
Mongo

Export of SOS Data to HDFS
Sensor Observation
Service
SOS to
HDFS
Adapter HDFS
Map Reduce

109 207 246
Dark 1
255 255 255
Light 1
131 56 155
Dark 2
0 99 190
Light 2
85 165 28
Accent 1
214 73 42
Accent 2
185 175 164
Accent 3
151 75 7
Accent 4
193 187 0
Accent 5
255 221 62
Accent 6
255 255 255
Hyperlink
236 137 29
Followed Hyperlink
127 175 221
Tata Blue 50%
203 215 238
Tata Blue 25%
179 149 197
Purple 50 %
212 195 223
Purple 25 %
255 242 171
Yellow 50 %
255 249 213
Yellow 25 %
229 205 186
Brown 50 %
248 241 235
Brown 25 %
180 213 154
Green 50 %
214 231 200
Green 25 %
241 240 202
Light Green 50%
251 251 241
Light Green 25%
Title and Content
Sensor Services in RIPSAC

OGC Sensor Web Enablement
Sensor Web Vision
Sensor Data Discovery
Sensor Data Access
Synchronous
Asynchronous
Control Sensor parameters
Information Model Interface Specification
• SensorML
• Observation & Measurement ( O & M )
• SOS
• SES
• SPS

SensorML
Sensor ID URN preferred
Sensor Location Last known location - latitude, longitude, (optionally) altitude
Sensor Attributes Is it Mobile ? Is it Active ?
Input Phenomena to Sensor Optional
Sensor Outputs One or more fields along with their type
Offering Sensor outputs are clustered into offering
Sensor Components Optional
• Describe Sensor or Sensor System • Used to model Meta Data about sensors • Can describe physical sensor, sensor system, soft-sensors – method, algorithm
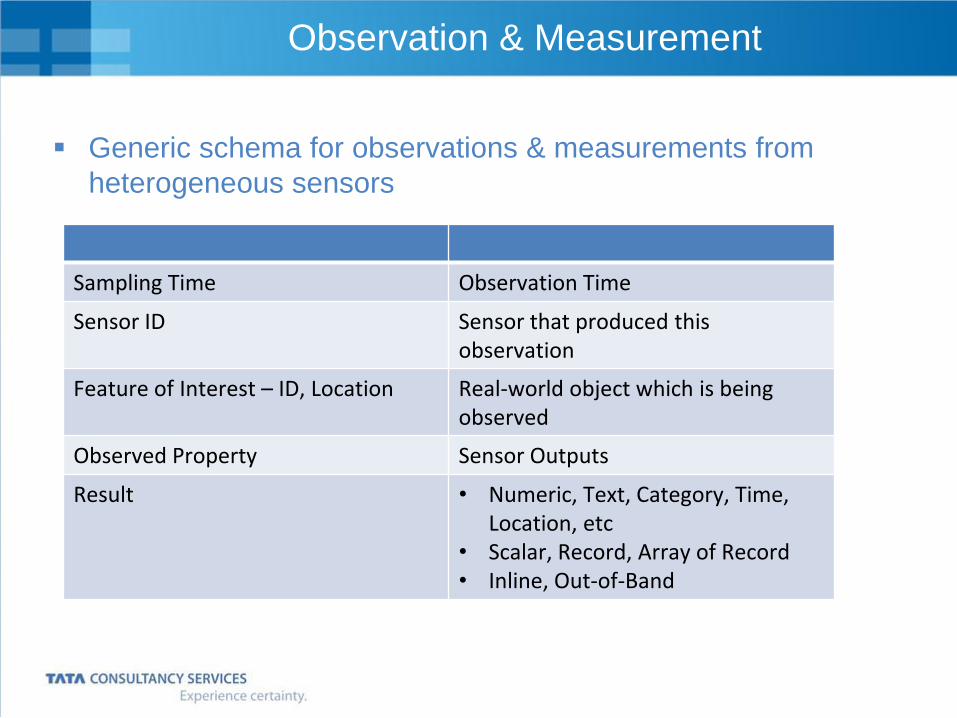
Observation & Measurement
Generic schema for observations & measurements from
heterogeneous sensors
Sampling Time Observation Time
Sensor ID Sensor that produced this observation
Feature of Interest – ID, Location Real-world object which is being observed
Observed Property Sensor Outputs
Result • Numeric, Text, Category, Time, Location, etc
• Scalar, Record, Array of Record • Inline, Out-of-Band

Observation & Measurement Schema
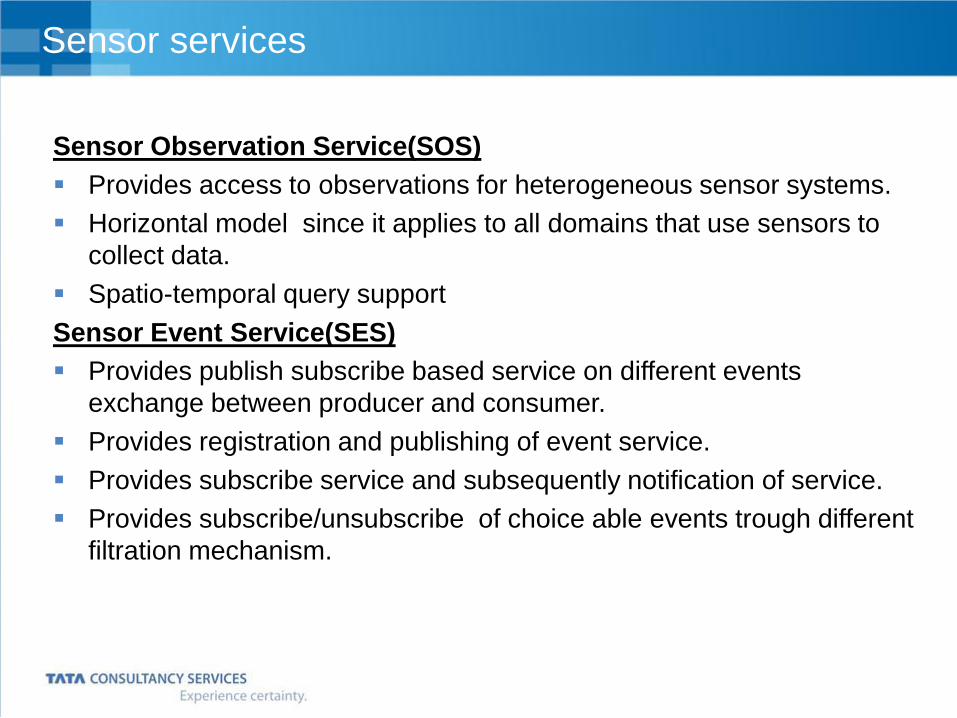
Sensor services
Sensor Observation Service(SOS)
Provides access to observations for heterogeneous sensor systems.
Horizontal model since it applies to all domains that use sensors to
collect data.
Spatio-temporal query support
Sensor Event Service(SES)
Provides publish subscribe based service on different events
exchange between producer and consumer.
Provides registration and publishing of event service.
Provides subscribe service and subsequently notification of service.
Provides subscribe/unsubscribe of choice able events trough different
filtration mechanism.

Sensor services
Sensor Planning Service
• Control sensors and provides operations for task management in
Sensor.
• Checks feasibility ,define , submit a task in sensor
• Provides getStatus, update or modify , cancellation of an running
task.
• Uses WNS to communicate Client in asynchronous manner
• New task created via SPS would subsequently is a service of SOS
Web Notification Service (WNS)
• Provides standard web service interface for asynchronous delivery of
messages or alerts
• The SES either sends the alert directly to the client, or makes use of
the WNS in order to deliver the alert message
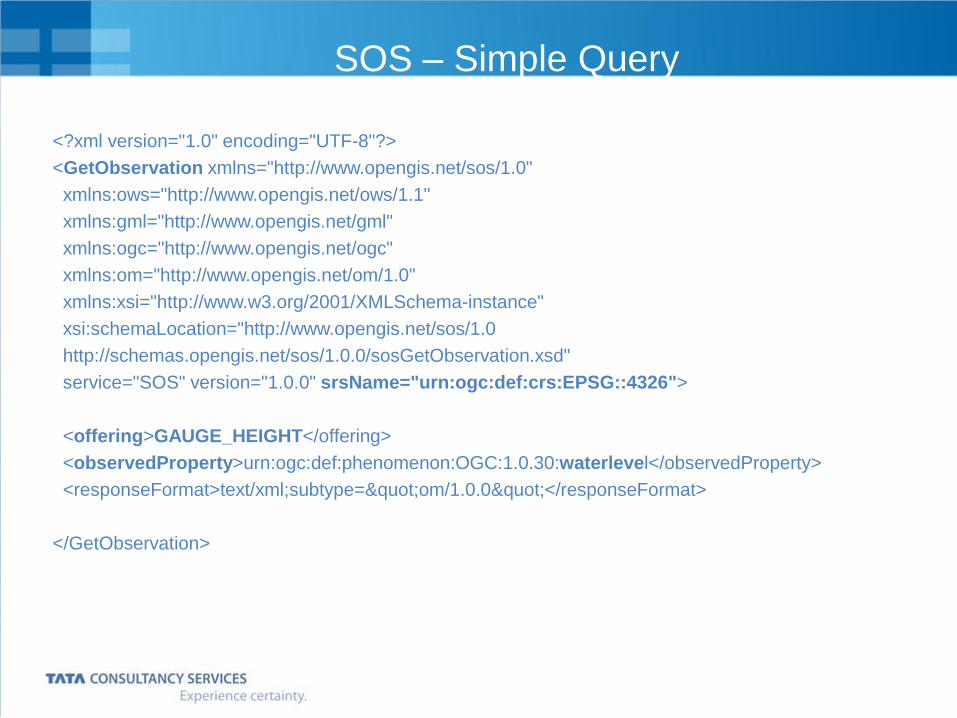
SOS – Simple Query
<?xml version="1.0" encoding="UTF-8"?>
<GetObservation xmlns="http://www.opengis.net/sos/1.0"
xmlns:ows="http://www.opengis.net/ows/1.1"
xmlns:gml="http://www.opengis.net/gml"
xmlns:ogc="http://www.opengis.net/ogc"
xmlns:om="http://www.opengis.net/om/1.0"
xmlns:xsi="http://www.w3.org/2001/XMLSchema-instance"
xsi:schemaLocation="http://www.opengis.net/sos/1.0
http://schemas.opengis.net/sos/1.0.0/sosGetObservation.xsd"
service="SOS" version="1.0.0" srsName="urn:ogc:def:crs:EPSG::4326">
<offering>GAUGE_HEIGHT</offering>
<observedProperty>urn:ogc:def:phenomenon:OGC:1.0.30:waterlevel</observedProperty>
<responseFormat>text/xml;subtype="om/1.0.0"</responseFormat>
</GetObservation>

SOS : Spatio-Temporal Query
<offering>GAUGE_HEIGHT</offering>
<eventTime>
<ogc:TM_During>
<ogc:PropertyName>om:samplingTime</ogc:Pro
pertyName>
<gml:TimePeriod>
<gml:beginPosition>2011-10-
01T17:44:15+00:00</gml:beginPosition>
<gml:endPosition>2011-12-
31T17:44:15+00:00</gml:endPosition>
</gml:TimePeriod>
</ogc:TM_During>
</eventTime>
<procedure>urn:ogc:object:feature:Sensor:IFGI:ifgi-
sensor-1</procedure>
<observedProperty>urn:ogc:def:phenomenon:O
GC:1.0.30:waterlevel</observedProperty>
<featureOfInterest>
<ogc:BBOX>
<ogc:PropertyName>urn:ogc:data:location</
ogc:PropertyName>
<gml:Envelope
srsName="urn:ogc:def:crs:EPSG::4326">
<gml:lowerCorner>50.0
7.0</gml:lowerCorner>
<gml:upperCorner>53.0
10.0</gml:upperCorner>
</gml:Envelope>
</ogc:BBOX>
</featureOfInterest>
<result>
<ogc:PropertyIsGreaterThan>
<ogc:PropertyName>urn:ogc:def:phenomenon:
OGC:1.0.30:waterlevel</ogc:PropertyName>
<ogc:Literal>5</ogc:Literal>
</ogc:PropertyIsGreaterThan>
</result>

RIPSAC Demonstrator -Siruseri Smart Campus
Solution
Sensor Interface Services
Storage & Database Services
Analytics Services
RIPSAC + Apps
iDigi M2m Cloud
Bus Tracking System
Parking Management
Cab & Passenger Tracking
Reports & Alerts
Location ( GPS), Speed, Accelerometer, Passenger Ids
Valid passenger lists, Route Info
Images / video feeds of entry & exit ramps of underground parking lots
Images of cab registration number, Passenger Ids

Siruseri Bus Fleet Management - Deployment

Bus Fleet – Sensor Observation & Measurement
Schema

Related Work
Project Who & When Contribution
Cooltown HP Labs, 2001 Web based ubiquitous computing
IrisNet Intel Research & CMU , 2003
World wide sensor web design
CarTel MIT CSAIL , 2007 Vehicular cyber-physical system
CitySense Harvard, 2007 Urban scale wireless sensor network testbed
WikiCity MIT Senseable City Lab, 2007
Real-time urban dynamics ( “Real Time Rome”)
Nericell Microsoft Research, 2008
Road and Traffic Condition monitoring using Mobile Crowdsensing
UBI Univ of Oulu, Finland, 2009
Open Urban Computing testbed
Sensor Web 52 North, Germany OGC SWE reference implementation
Spitfire EU Project Architecture for semantic applications involving Internet connected sensors

Further Reading
1. IrisNet: An Architecture for a Worldwide Sensor Web, Philip B. Gibbons, et.al,
October 2003 IEEE Pervasive Computing , Volume 2 Issue 4
2. OGC Sensor Web Enablement Architecture, Open Geospatial Consortium,
December 2008
3. Using Google App Engine, Charles Severance, O Reilly | Google Press, May
2009
4. Participatory Sensing: Applications and Architecture, Deborah Estrin ,
January/February 2010, IEEE Internet Computing
5. The Internet of Things, Michael Chui, et.al, McKinsey Quarterly 2010,
Number 2
6. Semantic Sensor Network XG Final Report, W3C Incubator Group Report 28,
June 2011
7. SPITFIRE: Towards a Semantic Web of Things, Dennis Pfisterer et.al,
November 2011, IEEE Communication Magazine,

109 207 246
Dark 1
255 255 255
Light 1
131 56 155
Dark 2
0 99 190
Light 2
85 165 28
Accent 1
214 73 42
Accent 2
185 175 164
Accent 3
151 75 7
Accent 4
193 187 0
Accent 5
255 221 62
Accent 6
255 255 255
Hyperlink
236 137 29
Followed Hyperlink
127 175 221
Tata Blue 50%
203 215 238
Tata Blue 25%
179 149 197
Purple 50 %
212 195 223
Purple 25 %
255 242 171
Yellow 50 %
255 249 213
Yellow 25 %
229 205 186
Brown 50 %
248 241 235
Brown 25 %
180 213 154
Green 50 %
214 231 200
Green 25 %
241 240 202
Light Green 50%
251 251 241
Light Green 25%
Title and Content
Thank You Contact: [email protected]