Rinki Project
92
PROJECT REPORT ON “Ratio Analysis of Bharti Airtel” AT Bharti Airtel A Project Report submitted in partial fulfillment of the requirements of POST GRADUATE DIPLOMA IN MANAGEMENT By Rinki Kumari Reg no-MP08171 INSTITUTE OF BUSINESS MANAGEMENT & RESEARCH IBMR House, # 44, 6th Cross, Wilson Garden, Hosur Main Road, Bangalore. 560027. INDIA
Transcript of Rinki Project
8/8/2019 Rinki Project
http://slidepdf.com/reader/full/rinki-project 1/92
PROJECT REPORT ON
“Ratio Analysis of Bharti Airtel”
AT
Bharti Airtel
A Project Report submitted in partial fulfillment of the requirements of
POST GRADUATE DIPLOMA IN MANAGEMENT
By
Rinki Kumari
Reg no-MP08171
INSTITUTE OF BUSINESS MANAGEMENT & RESEARCHIBMR House, # 44, 6th Cross, Wilson Garden, Hosur Main Road,
Bangalore. 560027. INDIA

8/8/2019 Rinki Project
http://slidepdf.com/reader/full/rinki-project 2/92
A Project Report of
Rinki Kumari
“Ratio Analysis of Bharti Airtel”
is approved and is acceptable in quality and form.
Research Guide’s Name……………
Signature………………..
Qualification and Designation……………
Phone Number…………

8/8/2019 Rinki Project
http://slidepdf.com/reader/full/rinki-project 3/92
CERTIFICATE
This is to certify that the Project Report titled
“Ratio Analysis Of Bharti Airtel “
Submitted in partial fulfillment of the requirements for the
Post Graduate Program In Management
Rinki Kumari
has worked under my supervision and guidance and that no part of this report hasbeen submitted for the award of any other Degree, Diploma, Fellowship or other
similar titles or prizes and that the work has not been published in any journal or
magazine.
Registration No.: MP08171
Attested Certified
Dr. Chandra Niranjan Mr. ………….
Dean, IBMR Faculty Guide

8/8/2019 Rinki Project
http://slidepdf.com/reader/full/rinki-project 4/92
The Project Report of
Rinki Kumari
“Ratio Analysis Of Bharti Airtel”
is approved and is acceptable in quality and form.
Internal Examiner External Examiner
Signature: _____________ Signature_____________
Name: _____________ Name: ____________
8/8/2019 Rinki Project
http://slidepdf.com/reader/full/rinki-project 5/92
STUDENT’S DECLARATION
I hereby declare that the Project Report titled
“Ratio Analysis Of Bharti Airtel “
Submitted in partial fulfillment of the requirements for the
POST GRADUATE PROGRAM IN MANAGEMENT
to IBMR Business School, Bangalore.
It is my original work and not submitted for the award of any other
Degree, Diploma, Fellowship or other similar title or prizes.
Place: Bangalore Name: Rinki Kumari
Date: Reg No: MP08171

8/8/2019 Rinki Project
http://slidepdf.com/reader/full/rinki-project 6/92
Acknowledgement
I am grateful to the Dean of IBMR, Dr. Chandra Niranjan for giving me the
opportunity to carry on this project work, which in all means was as enriching
experience with loads to learn and ample participation ensured there upon.
The successful completion of this project has been the result of the help
extended by a number of people. Hence I would like to place on record my
acknowledgment.
My special thanks to Mr. Pankaj Kumar, Chartered Accountant, Finance
Department, Bharti Airtel limited who guided me throughout the project
giving adequate guidance & feedback during my project completion.
I would like to thank Mrs Shivi Khanna. …………, Faculty Institute of
Business Management and Research, who has guided me in getting my project
completed effectively. I would like to thank him for all the words of
encouragement and support that he has granted me during my project
In last but not least I would like say thanks to everyone who is directly or
indirectly helped me to complete this project specially my family members
and friends, who inspired and motivated me in taking up this project, and
making it a success.
8/8/2019 Rinki Project
http://slidepdf.com/reader/full/rinki-project 7/92
EXECUTIVE SUMMARY
To run a business, we need Capital and thus Finance is the blood for any
organization to function efficiently. Since every single business activity
revolve around a broad common objective, i.e. to earning a PROFIT. The
subject on Finance gives an opportunity to understand their effective
application, utilization & funding the business & playing a pivotal role in the
success of the organization. Therefore, though not completely covering the
financial aspects of the business, still brief study on the Working Capital &
Ratio Analysis forming the part of Financial Statements are interpreted in this
Topic.
In the above context, the Topic provides me the insights on financial standingof the organization. It helps in understanding & explore, how the financial
resources are being utilized during the operations of the business, the
application & source of funds in various fixed assets & working capital, how
the company is perceived in the eyes of the shareholders which reflects
through the Earnings Per Share, and many more such financial expressions…
Apart from the given reason, there are other dimensions to choose this topic.
unlike manufacturing or trading industries, Service industries are much
different in managing their Working Capital. Like; the inventories are most of
the time in the intangible form. The working capital is funded mostly from
the long-term sources; like in the case of Bharti Airtel Limited.

8/8/2019 Rinki Project
http://slidepdf.com/reader/full/rinki-project 8/92
Table of Content
Chapter Content Page No.
1. Introduction To The Company 10-32a. Business Profile 10-18
b. Corporate Profile 19-28
c. Milestone Of The Company 29-30
d. Product Profile 31
e. Swot Analysis 32
2. Introduction to The Product 33-43
3. Project Profile 44-46
a. Objective Of The Product
b. Methodology and Procedure
4. Data Analysis and Interpretation 47-78
5. Findings and Recommendation 79-84
6. Limitation Of The Study 85-87
7. Conclusion 88-90
8 Refrences 91-92
Chapter 1

8/8/2019 Rinki Project
http://slidepdf.com/reader/full/rinki-project 9/92
“INTRODUCTION”
Introduction To The Industry :
Telecommunications started in the nineteenth century with the Telegraphy,
and developed through the Telephone and Ratio to Television to Satellites and
the Internet etc. The data transmitted has advanced from signals (Morse code)
through voice to pictures and data and, with the development of convergence,
to combinations of these. Every year, new technologies increase the services
available and the speed of delivery. A combination of factors is resulting in
the ever-decreasing cost of these services. This free report gives an overview
of this development, and the role of regulators to control it.

8/8/2019 Rinki Project
http://slidepdf.com/reader/full/rinki-project 10/92
Since people wanted to say something to other people who were out of
earshot, there have been attempts at communication. These attempts have
advanced from carrier pigeons, signaling towers, smoke signals through
telegraph, telephone, radio and satellite. Technology has advanced to allow
TV, the Internet, high speed data transmission and a combination of these.
This report includes a time line of the major developments in physical means
of communication, then telecommunications for the past 25 years
Despite retaining their role as cash cows for incumbent operators, fixed and
mobile voice services are progressively being overtaken by broadband.
Increasingly, operators will need to take a holistic view of the market,
necessitating a total review of this 100-year-old product. For various reasons,
fixed-line operators have not introduced significant new products, services or
cost-saving technologies in the same way that mobile operators have. There iscertainly room for new premium voice services, based on more intuitive
navigation, CD sound quality and interactivity between handset and TV.
Fixed-line voice will probably be with us forever, but will become a subset of
broadband, instead of the other way around. Broadband will combine voice
and data, providing the opportunity to open up a number of triple play
markets. High mobile charges are also an interesting target for VoIP over
wireless broadband. This report includes BuddeCommn’s analysis of the
future of voice, with a focus on fixed, mobile and VoIP.
The larges sector of the telecommunications industry continues to be made up
of wired telecommunications carriers. Establishments in this sector mainly
8/8/2019 Rinki Project
http://slidepdf.com/reader/full/rinki-project 11/92
provide telecommunications services via wires and cables that connect
customers’ premises to central offices maintained by telecommunications
companies. The central offices contain switching equipment that routes
content to its final destination or to another switching center that determines
the most efficient route for the content to take. These companies also
maintain the cable network that connects different regions of the country as
well as foreign countries, and forms the backbone of the industry. While
voice used to be the main type of data transmitted over the wires, wired
telecommunications service now includes the transmission of all types of
graphic, video and electronic data mainly over the Internet.
These new services are made possible through the use of digital technologies
that provide much more efficient use of the telecommunications networks.
One major technology breaks digital signals into packets during transmission. Networks of computerized switching equipment route the packets. Packets
may take separate paths to their destination and may share the paths with
packets from other users. At the destination, the packets are reassembled, and
the transmission is completed. Because packet switching considers alternate
routes, and allows multiple transmissions to share the same route, it results in
a more efficient use of telecommunications capacity as packets are routed
along less congested routes.
The transmission of voice signals requires relatively small amounts of
capacity on telecommunications networks. By contrast, the transmission of
data, video and graphics requires much higher capacity. This transmission

8/8/2019 Rinki Project
http://slidepdf.com/reader/full/rinki-project 12/92
capacity is referred to as “bandwidth”. As the demand increased for high-
capacity transmissions- especially with the rising volume of Internet data-
telecommunications companies have been expanding and upgrading their
networks to increase the amount of available bandwidth.
Cable and other program distribution is another sector of the
telecommunications industry. Establishments in this sector provide television
and other services on a subscription or fee basis. these establishments do not
include cable networks. (Information on cable networks is included in the
section on broadcasting, which appears elsewhere in the Career Guide.)
Distributors of pay television services transmit programming through two
basic types of systems. Cable systems transmit programs over fiber optic and
coaxial cables. Direct Broadcasting Satellite (DBS) operators constitute a
growing segment of the pay television industry. DBS operators transmit programming from orbiting satellites to customers’ receivers, known as
‘minidishes’. Establishments in the cable and other program distribution
industry generate revenue through subscriptions, providing Internet access,
providing phone service, and advertising sales. They also charge fees for pay-
per-view or video-on-demand programs.
Wireless telecommunications carriers, many of which are subsidiaries of the
wired carriers, transmit voice, graphics, data, and Internet access through the
transmission of signals over networks of radio towers. The signal is
transmitted through an antenna into the wire line network. Increasing
8/8/2019 Rinki Project
http://slidepdf.com/reader/full/rinki-project 13/92
numbers of consumers are choosing to replace their hoe landline phones with
wireless phones. Other wireless services include beeper and paging services.
Resellers of telecommunications services are another sector of the
telecommunications industry. These resellers lease transmission facilities,
such as telephone lines or space on a satellite, from existing
telecommunications networks, and then resell the service to other customers.
Other sectors in the industry include message communications services such
as e-mail and facsimile services, satellite telecommunications, and operators
of other communication services ranging from radar stations to radio networks
used by taxicab companies.
Recent Developments:
Telecommunications carriers are expanding their bandwidth by replacing
copper wires with fiber optic cables. Fiber optic cable, which transmits light
signals along glass strands, permits faster, higher capacity transmissions than
traditional copper wire lines. In some areas, carries are extending fiber optic
cable to residential customers, enabling them to offer cable television, video-
on-demand, very high-speed Internet, and conventional telephone
communications over a single line. However, the high cost of extending fiber
to homes has slowed deployment. In most areas, wired carries are instead
leveraging existing copper lines that connect most residential customers with a
central office, to provide digital subscribe lines (DSL) Internet service.

8/8/2019 Rinki Project
http://slidepdf.com/reader/full/rinki-project 14/92
8/8/2019 Rinki Project
http://slidepdf.com/reader/full/rinki-project 15/92
providers’ high-speed Internet connections also can be used for VoIP and
cellular phones are being developed that use VoIP to make calls using local
wireless Internet connections. All of the major sectors of the
telecommunications industry ware or will increasingly use VoIP.
Wireless telecommunications carriers are deploying several new technologies
to allow faster data transmission and better Internet access that should make
them more competitive with wire line carriers. With faster Internet
connections speeds, wireless carriers are selling music, videos, and other
exclusive content that can be downloaded and a played on cellular phones.
Wireless equipment companies are developing the next generation of
technologies that will allow even faster data transmission. The replacement of
landlines with cellular service should become increasingly common because
advances in wireless systems will provide ever faster data transmissionspeeds.
Other reasons for choosing ‘Indian Telecom’ sector are: (Consumerist
Outlook)
One of the largest Working Population giving huge market potential
Emerging Economy
Rising Income & Growing availability of Retail Credit resulting in
increased consumerism
Largest youth population
Communication being a necessity in professional & personal lives

8/8/2019 Rinki Project
http://slidepdf.com/reader/full/rinki-project 16/92
Telecommunication Companies in India
Telecommunication Reforms in India revolutionized the telecom industries
sector in India, which is an important factor for the growth of the Indian
telecom sector and in turn helped the Indian economy to perform well for the
past few years. The Telecommunication reforms in India were development
and growth oriented. Technological advancements and innovations
contributed largely towards the reformation of the telecom sector in India.
The sector of telecom was a monopoly under the Central Government of
India. During the 1990s this sector faced fierce challenges due to the
development in the technological sector. The sector was privatized and with
the abolition of the monopoly new player entered the consumer market. The
competition increased in the telecom sector, the rates were slashed in order to
grab the share of the market and the customers were provided with better services.
The telecommunication reforms in India started in the eighties with the
mission better communication. This is regarded as the first phase of the
reformation process. Several private manufacturers of tailor made equipments
entered the market. There were private developer for indigenous technologies
and the franchisee for STD/ISD and PCO increased. The Videsh Sanchar
Nigam Limited (VSNL) and Mahanagar Telephone Nigam Limited (MTNL)
were set up under the Government of India’s Department of
Telecommunication.

8/8/2019 Rinki Project
http://slidepdf.com/reader/full/rinki-project 17/92
The second phase of telecommunication reforms in India came in the early
nineties. The introduction of the New Economic Policy (NEP) in the year
1991 was a landmark in the history of telecom industry sector in India. The
manufacturing of equipments pertaining to telecom sector was decentralized
and several value added services were introduced into the market. The telecom
services were divided into basic telephony, radio paging and cellular mobile
The TRAI was established an independent regulatory body pertaining to
telecom sector. The growth of the private sector increased.
The third phase of the telecommunication reforms in India took place in the
period of the late nineties. The government of India introduced the New
Telecom Policy 1999. The TRAI was endowed with more power. The concept
of revenue sharing was introduced to replace the fixed license fee. The
National Long Distance was introduced with free entrance. Moreover, therewas introduction of International Long Distance schemes. The Bharat Sanchar
Nigam Limited (BSNL), a corporate body of the telecom service sector was
formed, followed by the introduction of the Internet to the Indian market.
The stupendous growth of the telecommunication companies in India over the
last fifteen years can be attributed to the liberal government of India,
economic policy. The economic renaissance effected in the early 1990s
brought around a paradigm shift on the overall business scenario of India. The
telecommunication companies in India went through a huge make-over during
the implementation of the open-market policy of India. The erstwhile closed
market policy was replaced by a more liberal form of economic policy. A
8/8/2019 Rinki Project
http://slidepdf.com/reader/full/rinki-project 18/92
whole new form of Indian Telecommunication Policy was drafted to
compliment the change effected in the economic policy of India. The
amendment effected the new telecommunication policy of India made huge
changes with respect to investments and entry of Foreign Direct Investments
(FDI) and Foreign Institution Investors (FII) respectively, into the virgin
Indian telecommunication market. This resulted entry of private, domestic and
foreign telecommunication companies in India.
8/8/2019 Rinki Project
http://slidepdf.com/reader/full/rinki-project 19/92
Introduction to the Company
Bharti Airtel
Telecom giant Bharti Airtel is the flagship company of Bharti Enterprises. The
Bharti Group, has a diverse business portfolio and has created global brands in
the telecommunication sector. Bharti has recently forayed into retail business
as Bharti Retail Pvt. Ltd. under a MoU with Wal-Mart for the cash & carry
business. It has successfully launched an international venture with EL
Rothschild Group to export fresh agri- products exclusively to markets in
Europe and USA and has launched Bharti AXA Life Insurance Company Ltd
under a joint venture with AXA, world leader in financial protection and
wealth management.
Airtel comes to you from Bharti Airtel Limited, India’s largest integrated and
the first private telecom services provider with a footprint in all the 23 telecom
circles. Bharti Airtel since its inception has been at the forefront of technology
and has steered the course of the telecom sector in the country with its world
class products and services. The businesses at Bharti Airtel have been
structured into three individual strategic business units (SBU’s) - Mobile
Services, Airtel Telemedia Services & Enterprise Services. The mobile
business provides mobile & fixed wireless services using GSM technology
across 23 telecom circles while the Airtel Telemedia Services business offers
broadband & telephone services in 94 cities. The Enterprise services provide
end-to-end telecom solutions to corporate customers and national &

8/8/2019 Rinki Project
http://slidepdf.com/reader/full/rinki-project 20/92
international long distance services to carriers. All these services are provided
under the Airtel brand.
Bharti Airtel is one of India's leading private sector providers of
telecommunications services based on an aggregate of 71.77 million
customers as on June 2008, consisting of 69.38 million GSM mobile
customers and 2.39 Bharti Telemedia Customers.
Bharti Airtel Limited, a group company of Bharti Enterprises, is India’s
leading integrated telecom services provider with an aggregate of 71.77
million customers as of end of June 2008, consisting of 69.38 million mobile
customers. Bharti Airtel has been rated among the best performing companies
in the world in the Business Week IT 100 list 2007. Bharti Airtel is structured
into three strategic business units - Mobile services, Telemedia services andEnterprise services. The mobile business provides mobile & fixed wireless
services using GSM technology across 23 telecom circles. The Telemedia
business provides broadband and telephone services in 94 cities and is
foraying into the IPTV and DTH segments. The Enterprise business provides
end-to-end telecom solutions to corporate customers and national and
international long distance services to carriers. All these services are provided
under the Airtel brand. Airtel’s high-speed optic fibre network currently spans
over 78,540 kilometers covering all the major cities in the country. The
company has two international landing stations in Chennai that connects two
submarine cable systems - i2i to Singapore and SEA-ME-WE-4 to Europe.
8/8/2019 Rinki Project
http://slidepdf.com/reader/full/rinki-project 21/92
Company shares are listed on The Stock Exchange, Mumbai (BSE) and The
National Stock Exchange of India Limited (NSE).
Vision & Promise :
By 2010 Airtel will be the most admired brand in India :
• Loved by more customers
• Targeted by top talents
• Benchmarked by more businesses
“We at Airtel always think in fresh and innovative ways about the needs of
our customers and
how we want them to feel. We deliver what we promise and go out of our
way to delight the
customer witha little bit more”
Quality Policy :
We will deliver error free service to our customer by doing our jobs right
and first time every time.
8/8/2019 Rinki Project
http://slidepdf.com/reader/full/rinki-project 22/92
Partners :
The company has a strategic alliance with SingTel. The investment made by
SingTel is one of the largest investments made in the world outside Singapore,
in the company.
The company’s mobile network equipment partners include Ericsson and
Nokia. In the case of the broadband and telephone services and enterprise
services (carriers), equipment suppliers include Siemens, Nortel, Corning,
among others. The Company also has an information technology alliance with
IBM for its group-wide information technology requirements and with Nortel
for call center technology requirements. The call center operations for the
mobile services have been outsourced to IBM Daksh, Hinduja TMT, Teletech
& Mphasis.
Airtel was born free, a force unleashed into the market with a relentless and
unwavering determination to succeed. A spirit charged with energy,
creativity and a team driven “to seize the day” with an ambition to become the
most globally admired telecom service. Airtel, after just ten years, has risen to
the pinnacle of achievement.
As India’s leading Telecommunications Company, Airtel brand has played the
role as a major catalyst in India’s reforms, contributing to its economic
resurgence.

8/8/2019 Rinki Project
http://slidepdf.com/reader/full/rinki-project 23/92
Today, we touch people’s lives with our Mobile services, Telemedia services,
to connecting India’s leading 1000+corporate. We also connect Indians living
in USA with our call home service.
Corporate Governance
Bharti Airtel Limited firmly believes in the principles of Corporate
Governance and is committed to conduct its business in a manner, which will
ensure sustainable, capital-efficient and long-term growth thereby maximizing
value for its shareholders, customers, employees and society at large.
Company’s policies are in line with Corporate Governance guidelines
prescribed under Listing Agreement/s with Stock Exchanges and the
Company ensures that various disclosures requirements are complied in ‘letter
and spirit’ for effective Corporate Governance.
During the financial year 2003-04, your Company was assigned highest
Governance and Value Creation (GVC) rating viz. ‘Level 1’ rating by
CRISIL, which indicates that the company’s capability with respect to
creating wealth for all its stakeholders is the highest, while adopting sound
Corporate Governance practices. This rating was re-affirmed by CRISIL on
20th April 2006.
• Board of Directors
• Audit Committee
• Human Resource (HR)/ Remuneration Committee

8/8/2019 Rinki Project
http://slidepdf.com/reader/full/rinki-project 24/92
• ESOP Compensation Committee
• Investors Grievance Committee
•
Memorandum of Association
• Article of Association
Business Divisions
Mobile Services:
Bharti Airtel offers GSM mobile services in all the 23-telecom circles of India
and is the largest mobile service provider in the country, based on the number
of customers.
Enterprise Services (Corporate):
The group focuses on delivering telecommunications services as an integrated
offering including mobile, broadband & telephone, national and international
long distance and data connectivity services to corporate, small and medium
scale enterprises.
Airtel Telemedia Services :
The group offers high speed broadband internet with a best in class network.
With Landline services in 94 cities we help you stay in touch with your friends
& family and the world.

8/8/2019 Rinki Project
http://slidepdf.com/reader/full/rinki-project 25/92
Enterprise Services (Carrier Services):
The Company compliments its mobile and broadband & telephone services
with national and international long distance services. It has over 35,016 route
kilometers of optic fibre on its national long distance network. For
international connectivity to east, it has a submarine cable landing station at.
For international connectivity to the west, the Company is a member of the
South East Asia-Middle East-Western Europe – 4 (SEA-ME-WE-4)
consortiums along with 15 other global telecom operators.
8/8/2019 Rinki Project
http://slidepdf.com/reader/full/rinki-project 26/92
Board of Directors :
The board of directors of the Company has an optimum mix of executive and
non-executive directors, which consists of two executive and twelve non-
executive directors. The Chairman and Managing Director,
Mr. Sunil Bharti Mittal, is an Executive Director and the number of
Independent Directors on the Board is 50% of the total board strength. The
independence of a director is determined on the basis that such director does
not have any material pecuniary relationship with the Company, its promoters
or its management, which may affect the independence of the judgment of a
Director. The board members possess requisite skills, experience and expertise
required to take decisions, which are in the best interest of the Company.
The composition of the Board is as under:
• Sunil Bharti Mittal
• Rajan Bharti Mittal
• Akhil Gupta
• Rakesh Bharti Mittal
• Chua Sock Koong
• N. Kumar
• Kurt Hellstrom
• Donald Cameron
• Paul O'Sullivan

8/8/2019 Rinki Project
http://slidepdf.com/reader/full/rinki-project 27/92
• Pulak Chandan Prasad
• Bashir Abdulla Currimjee
•
Ajay Lal
• Arun Bharat Ram
• Francis Henggm

8/8/2019 Rinki Project
http://slidepdf.com/reader/full/rinki-project 28/92
Organization Chart – Bharti Airtel
8/8/2019 Rinki Project
http://slidepdf.com/reader/full/rinki-project 29/92
Milestone of the Company : -
Awards and Recognitions :
Bharti Airtel has recently won multiple recognitions in the field of
Information Technology including Spamhaus Group‘Whitehat Network
Star’; ‘Security Strategist Award’ and‘Intelligent Enterprise Award‘ at
the Technology Senate2009 and ‘CIO Hall of Fame’
Bharti Airtel has won the CNBC-TV18 India Business Leader Award for
the Outstanding Company of the year, 2007
Bharti draws top honours at the NDTV Profit Business Leadership
Awards 2007
Bharti Airtel Ranked 3rd on Shareholder Returns in Business Week IT
100 List
Sunil Bharti Mittal conferred Degree of Doctor of Science (Honoris
Causa) by G. B. Pant University

8/8/2019 Rinki Project
http://slidepdf.com/reader/full/rinki-project 30/92
Highlights :
Overall customer base crosses 7.17 crore
Market leader with a market share of all India wireless subscribers at
24.2%
Bharti Airtel and Pacnet join forces to deliver enhanced connectivity
to and from India
Bharti Airtel, India’s leading private telecom services provider
would observe a 'Silent Period' from the close of business on June
30, 2008 (Monday), till the declaration of results for the first quarter
ended June 30, 2008, as a commitment towards highest level of
corporate governance.
Bharti Airtel and Apple to Bring iPhone 3G to India
Joins hands with IFFCO to usher in the Second Green Revolution to
benefit millions of rural consumers
Airtel Spells “End of Distance” in India
]Financial Year 2008 : Strong Revenue Growth of 46% and ending
at over Rs. 27,000 Crore
Product Profile

8/8/2019 Rinki Project
http://slidepdf.com/reader/full/rinki-project 31/92

8/8/2019 Rinki Project
http://slidepdf.com/reader/full/rinki-project 32/92

8/8/2019 Rinki Project
http://slidepdf.com/reader/full/rinki-project 33/92
Chapter – 2
Introduction to the Project
Introduction to Working Capital Management

8/8/2019 Rinki Project
http://slidepdf.com/reader/full/rinki-project 34/92
Working Capital Management (WCM) is the management of short-term
financing requirements of a firm. This includes maintaining optimum balance
of working capital components – receivables, inventory and payables – and
using the cash efficiently for day-to-day operations. Optimization of working
capital balance means minimizing the working capital requirements and
realizing maximum possible revenues. Efficient WCM increases firm’s free
cash flow, which in turn increases the firm’s growth opportunities and return
to shareholders. Even though firms traditionally are focused on long term
capital budgeting and capital structure, the recent trend is that many
companies across different industries focus on WCM efficiency. There is
much evidence in the financial literature that present the importance of WCM.
Results of empirical analysis show that there is statistical evidence for a strong
relationship between the firm’s profitability and its WCM efficiency. TheTelecommunication industry is characterized by high intensive working
capital requirements and high competition because of rapid technology
changes, which make the WCM crucial to bring attractive earnings to
shareholders. The analysis is done to get insight into how efficiently WCM is
managed in Bharti Airtel Limited is more inclined to in improving WCM
efficiency.
Management of short term assets and short run sources of finance is described
as working capital management. Working capital management is concerned
with all decisions and acts that influence the size and effectiveness of working
capital. The goal of working capital management is to manage each of the
8/8/2019 Rinki Project
http://slidepdf.com/reader/full/rinki-project 35/92
firm’s current assets and current liabilities in such a way that an acceptable
level of working capital is maintained. It is concerned with the determination
of appropriate levels of current assets and their efficient use as well as the
choice of financing mix for raising the current resources.
Proper management of working capital is very important for the success of a
concern. It aims at protecting the purchasing power of assets and maximizing
the return on investment. The manner of management of working capital to a
very large extent determines the success of operations of the concern. Failure
of business is undoubtedly due to poor management of working capital.
Shortage of working capital is so often advanced as the main cause of failure
of an industrial concern.
Working Capital refers to the cash a business requires for day-to-dayoperations, or, more specifically, for financing the conversion of raw materials
into finished goods, which the company sells for payment. Among the most
important items of working capital are levels of inventory, debtors and
creditors. These items are looked at for signs of a company’s efficiency and
financial strength.
The better a company manages its working capital, the less the company needs
to borrow. Even companies with cash surpluses need to manage working
capital to ensure that those surpluses are invested in ways that will generate
suitable returns for investors.
Working Capital Management Concepts :

8/8/2019 Rinki Project
http://slidepdf.com/reader/full/rinki-project 36/92
The working capital meets the short-term financial requirements of a business
enterprise. It is the investment required for running day-to-day business. It is
the result of the time lag between the expenditure for the purchase of raw
materials and the collection for the sales of finished products. The
components of working capital are inventories, accounts to be paid to
suppliers, and payments to be received from customers after sales. Financing
is needed for receivables and inventories net of payables. The proportions of
these components in the working capital change from time to time during the
trade cycle. The working capital requirements decide the liquidity and
profitability of a firm and hence affect the financing and investing decisions.
Lesser requirement of working capital leads to less need for financing and less
cost of capital and hence availability of more cash for shareholders. However,
the lesser working capital may lead to lost sales and thus may affect the profitability. The management of working capital by managing the
proportions of the WCM components is important to the financial health of
businesses from all industries. To reduce accounts receivable, a firm may
have strict collections policies and limited sales credits to its customers. This
would increase cash inflow. However the strict collection policies and lesser
sales credits would lead to lost sales thus reducing the profits. Maximizing
account payables by having longer credits from the suppliers also has the
chance of getting poor quality materials from supplier that would ultimately
affect the profitability. Minimizing inventory may lead to lost sales by stock-
outs. The working capital management should aim at having balanced;
8/8/2019 Rinki Project
http://slidepdf.com/reader/full/rinki-project 37/92
optimal proportions of the WCM components to achieve maximum profits and
cash flow.
Gross Working Capital :
The gross working cycle refers to the length of time between the firms paying
cash for material, etc., entering into the production process / stock and the
inflow of cash from debtors (sales). Some raw materials will be available on
credit but, cash will be paid out for the other part immediately. Then it has to
pay labour costs and incurs factory overheads. These three combined together
will constitute work-in-progress. After the production cycle is complete,
work-in-progress will get converted into finished products. The finished
products when sold on credit into sundry debtors. Sundry debtors will be
realized in cash after the expiry of credit period. This cash can again be usedfor financing raw materials, work-in-progress, etc. Thus there is a complete
cycle from cash to cash wherein cash get converted into raw materials, work-
in-progress, finished goods, debtors, and finally into cash again. This cycle is
also known as Operating Cycle.
8/8/2019 Rinki Project
http://slidepdf.com/reader/full/rinki-project 38/92
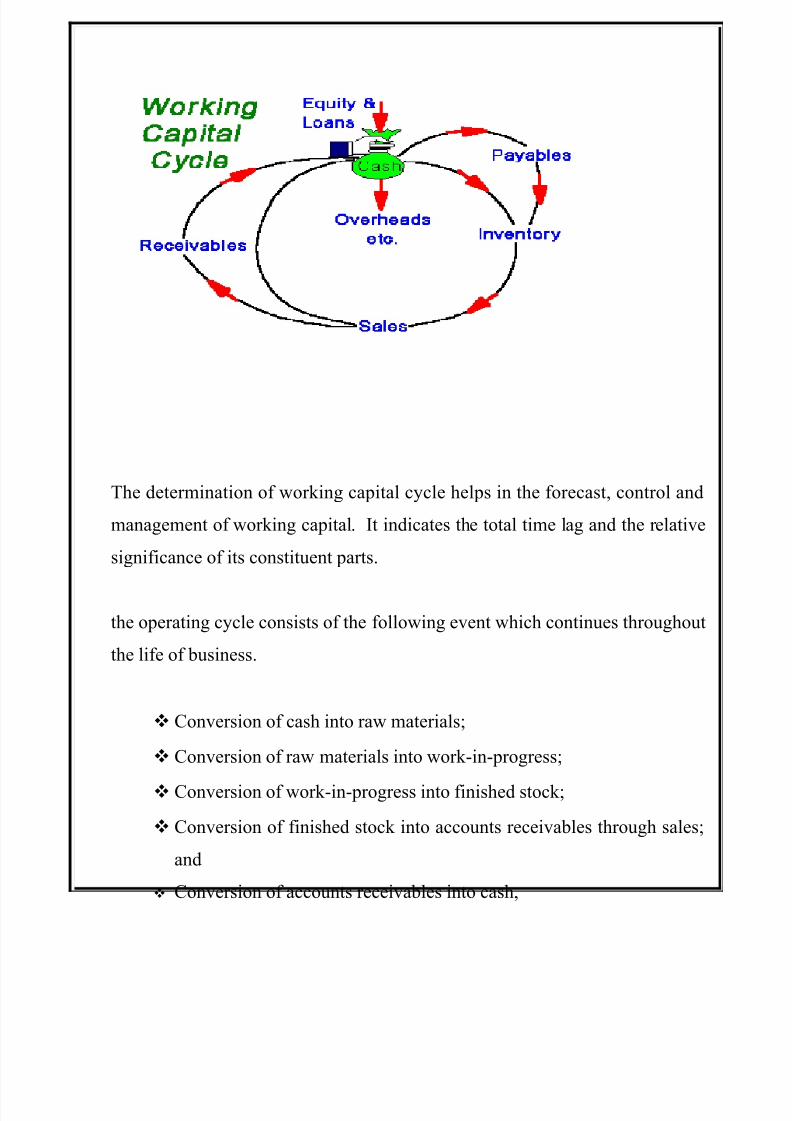
The determination of working capital cycle helps in the forecast, control and
management of working capital. It indicates the total time lag and the relative
significance of its constituent parts.
the operating cycle consists of the following event which continues throughout
the life of business.
Conversion of cash into raw materials;
Conversion of raw materials into work-in-progress;
Conversion of work-in-progress into finished stock;
Conversion of finished stock into accounts receivables through sales;
and
Conversion of accounts receivables into cash,
8/8/2019 Rinki Project
http://slidepdf.com/reader/full/rinki-project 39/92
Working Capital of Bharti Airtel Limited has been analysed by using
Ratio Analysis :
Meaning of Ratio :
A Ratio is a simple arithmetical expression of the relationship of one number
to another.
Definition :
According to Accountants Handbook of Wixon, Kell & BedFord, “Ratio
Analysis is the expression of the quantitative relationship between two
numbers”
Use & Significance of Ratio Analysis :
The ratio analysis is one of the most powerful tools of financial analysis. It is
used as a device to analyse and interpret the financial health of the enterprise.
(A) Management use of Ratio Analysis
Helps in Decision making
Helps in Financial forecast and planning

8/8/2019 Rinki Project
http://slidepdf.com/reader/full/rinki-project 40/92
Helps in Communicating
Helps in Co-ordination
Helps in Control
(B) Utility to share holders and investors
(C) Utility to Creditors
(D) Utility to Employees
(E) Utility to Government
Types of Ratios used:
Current Ratio :
Current Ratio is the indicator of the firm’s commitment to meet its short-term
liability. Current Assets mean assets that will either be used up or converted
into cash within a year’s time. Current liabilities mean liabilities payable
within a year or during the operating cycle, which ever is longer.
Quick Ratio :
The Quick ratio is also termed as “Acid-Test Ratio”. This ratio is ascertained
by comparing the liquid assets (i.e., assets which are immediately convertible
in to cash without much loss) to current liabilities. Prepaid expenses and stock
are not taken as liquid assets. This may be expressed as:

8/8/2019 Rinki Project
http://slidepdf.com/reader/full/rinki-project 41/92
Gross Profit Ratio :
These ratios express the relationship between gross profit and net sales.
Gross Profit = Sales – Cost of goods sold (Including Operating Expenses) –
Depreciation – Amortization
Net Profit Ratio :
This ratio helps in determining the efficiency with which affairs of the
business are being managed. An increase in ratio over previous period
indicates improvement in the operational efficiency of the business provided
the gross profit ratio is constant.
Operating Ratio :
This ratio is complementary of Net Profit Ratio. In case Net Profit is 20 %, it
means Operating Ratio is 80 %.
Debtor Turnover Ratio :
Debtors constitute an important constituent of current assets and therefore the
quality of debtors to a great extent determines a firm’s liquidity. Debt

8/8/2019 Rinki Project
http://slidepdf.com/reader/full/rinki-project 42/92
collection period indicates the extent to which the debts have been collected in
time. It gives the average debt collection period.
Inventory Turnover Ratio :
This ratio is also known as stock turnover ratio establishes the relation
between the cost of goods sold during the year and average inventory held
during the year.
Fixed Assets Turnover Ratio :
A high fixed assets turnover ratio indicates efficient utilization of fixed assets
in generating sales. A firm whose plant and machinery are old may show
higher fixed assets turnover ratio than the firm which has purchased them
recently.
Debt Equity Ratio :
The Debt Equity Ratio is determined to ascertain the soundness of the long
term financial policies of the company. It is also known as “External –
Internal” Equity Ratio.
Earnings Per Share :

8/8/2019 Rinki Project
http://slidepdf.com/reader/full/rinki-project 43/92
The profitability of the firm from the point of view of ordinary shareholders
can be measured in terms of number of equity shares. This is known as
Earnings Per Share
Comparative Balance Sheet or Comparative Financial Statement :
Any financial statement that reports the comparisons of data of two are more
consecutive accounting periods is known as “Comparative Financial
Statement”. According to A.F.Foulke “Comparative financial statement are
statements of the financial position of the business so designed as to provide
time prospective to the consideration of various elements of financial position
embodied in such statements”. Such a statement spotlights trends and
establishes relationship between items that appear on the same row of a
comparative balance sheet. It discloses changes in items on financialstatements over time in both rupees and percentage form. Each item on a row
for one fiscal period is compared with same item in a different period.
Much valuable information is obtained from financial statement in this
manner. The analyst will get benefit from such comparative study particularly
because he/she will discover the key factors which have affected profitability
or financial position of the concern.

8/8/2019 Rinki Project
http://slidepdf.com/reader/full/rinki-project 44/92
8/8/2019 Rinki Project
http://slidepdf.com/reader/full/rinki-project 45/92
“AN ANALYSIS ON WORKING CAPITAL MANAGEMENT &
RATIOS
Objectives & Scope of the study
• To study the working capital of Bharti Airtel Limited
Secondary Objective :
• To find out the size of working capital and to measure its liquidity and
operational efficiency by using ratio analysis
• To make an element wise analysis of working capital and to identify the
elements responsible for variations in working capital
• To evaluate the performance of the company through Net Assets,
inventory, Receivables and cash management
• To analyze the relationship existing between liquidity and profitability
8/8/2019 Rinki Project
http://slidepdf.com/reader/full/rinki-project 46/92
Methodology and Procedure of Work :
The project work was carried on along with the expert guidance fromcompany’s Finance Team and Legal & Regulatory Team, while collecting &
collating the information & models in the endeavor of preparing the project.
The source of information is purely from Secondary Data, fetched out from s
ites like – Google, Airtel.in & other Finance management publications.
Micro-soft application is used extensively for entire project work. Spread
sheet in MS-Excel used to compute Comparative Statements & Working
Capital Analysis. And Flow charts, Line Diagrams were computed for graphical presentation to give a feel of comprehensive understanding in the
project. MS-Word used to draft the entire project, placing Tables & Diagram
wherever necessary in describing.
Key insights on the back ground of evolution of Tele-communication & the
telecommunication Industry in India were fetched from “Google”, “the
information searching engine”. And about the company (Bharti Airtel Ltd),
the latest information and abstracts were derived & used as source for preparing the project. These were indeed easy if search options were applied
accurately, to fetch from the internet & intranet tool while preparing the
introduction to the project. However, the data on figures for the last three
years from the annual reports of the company were meticulously derived for
computing various ratios & interpreting the results with the guidance from the
Finance Managers, were the key time consumer apart from giving the project
“The conclusion”.
The secondary data which was to an extent easily available had a very goodinfluence on my project in terms of getting the relevant data & information in
time. And Secondly, it gave me immense opportunity & pleasure to explore
the content in understanding the subject matter in context to my academics.
Despite of the heavy work load & audit schedules, the finance & legal
personnel’s were able to manage with their time to cooperate with me in
various clarifications & fact establishments in the accomplishment of the
project.

8/8/2019 Rinki Project
http://slidepdf.com/reader/full/rinki-project 47/92
Chapter – 4
DataAnalysis & Interpretation
8/8/2019 Rinki Project
http://slidepdf.com/reader/full/rinki-project 48/92
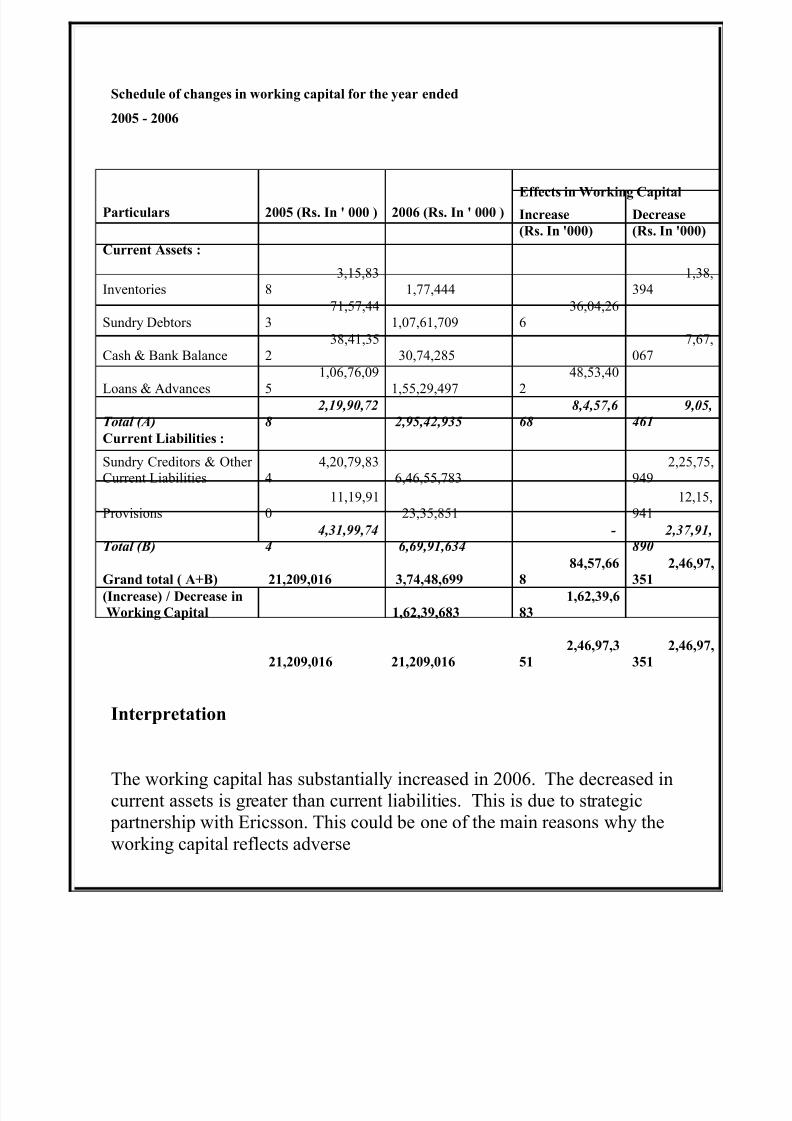
Schedule of changes in working capital for the year ended
2005 - 2006
Particulars 2005 (Rs. In ' 000 ) 2006 (Rs. In ' 000 )
Effects in Working Capital
Increase
(Rs. In '000)
Decrease
(Rs. In '000)
Current Assets :
Inventories
3,15,83
8 1,77,444
1,38,
394
Sundry Debtors
71,57,44
3 1,07,61,709
36,04,26
6
Cash & Bank Balance
38,41,35
2 30,74,285
7,67,
067
Loans & Advances
1,06,76,09
5 1,55,29,497
48,53,40
2
Total (A)
2,19,90,72
8 2,95,42,935
8,4,57,6
68
9,05,
461
Current Liabilities :
Sundry Creditors & Other
Current Liabilities
4,20,79,83
4 6,46,55,783
2,25,75,
949
Provisions
11,19,91
0 23,35,851
12,15,
941
Total (B)
4,31,99,74
4 6,69,91,634
- 2,37,91,
890
Grand total ( A+B) 21,209,016
3,74,48,699
84,57,66
8
2,46,97,
351
(Increase) / Decrease in
Working Capital
1,62,39,683
1,62,39,6
83
21,209,016 21,209,016
2,46,97,3
51
2,46,97,
351
Interpretation
The working capital has substantially increased in 2006. The decreased in
current assets is greater than current liabilities. This is due to strategic
partnership with Ericsson. This could be one of the main reasons why the
working capital reflects adverse

8/8/2019 Rinki Project
http://slidepdf.com/reader/full/rinki-project 49/92

8/8/2019 Rinki Project
http://slidepdf.com/reader/full/rinki-project 50/92
Schedule of changes in working capital for the year ended
2007 - 2008
Particulars 2007 (Rs. In ' 000 ) 2008 (Rs. In ' 000) Effects in Working Capital
Increase
(Rs. In '000)
Decrease
(Rs. In '000)
Current Assets :
Inventories 4,78,14
5
5,68,60
7 90,462
Sundry Debtors 1,87,32,95
8
2,77,64,57
2 90,31,614
Cash & Bank Balance 78,04,60
5
50,29,39
0 27,75,215
Loans & Advances 1,74,39,05
8 2,91,47,541 1,17,08,483
Total (A) 4,44,54,76
6 6,25,10,110 2,08,30,559 27,75,215
Current Liabilities :Sundry Creditors & Other
Current Liabilities 9,42,94,23
1
11,90,02,13
9 2,47,07,908
Provisions 41,52,48
0 20,98,762 20,53,718
-
Total (B)
9,84,46,711 12,11,00,901 20,53,718 2,47,07,908
Grand total ( A+B)
5,39,91,94
5
5,85,90,79
1
2,28,84,
277
2,74,83,
123
(Increase) / Decrease in
Working Cpaital
4,598,846
4,598,8
46
539,91,945
53,991,945
27,483,1
23
27,483,
123
Interpretation :

8/8/2019 Rinki Project
http://slidepdf.com/reader/full/rinki-project 51/92
The Current Asset has increased compared to the previous year. However, the
Current Liability is substantially higher than the current year’s Current Asset.
This resulted in considerable amount of decrease in working capital. This is
due to strategic partnership with Ericsson. This could be one of the main
reasons why the working capital reflects adverse.
8/8/2019 Rinki Project
http://slidepdf.com/reader/full/rinki-project 52/92
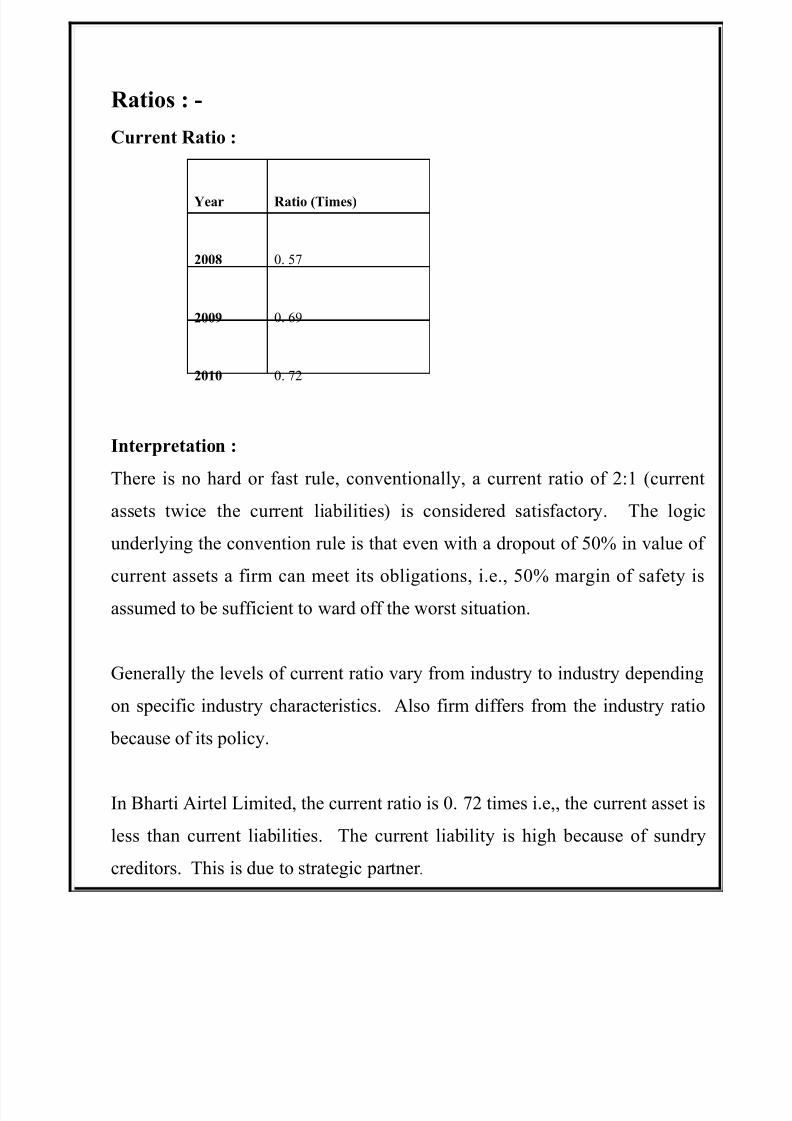
Ratios : -
Current Ratio :
Interpretation :
There is no hard or fast rule, conventionally, a current ratio of 2:1 (current
assets twice the current liabilities) is considered satisfactory. The logic
underlying the convention rule is that even with a dropout of 50% in value of
current assets a firm can meet its obligations, i.e., 50% margin of safety is
assumed to be sufficient to ward off the worst situation.
Generally the levels of current ratio vary from industry to industry depending
on specific industry characteristics. Also firm differs from the industry ratio
because of its policy.
In Bharti Airtel Limited, the current ratio is 0. 72 times i.e,, the current asset is
less than current liabilities. The current liability is high because of sundry
creditors. This is due to strategic partner .
Year Ratio (Times)
2008 0. 57
2009 0. 69
2010 0. 72

8/8/2019 Rinki Project
http://slidepdf.com/reader/full/rinki-project 53/92
Chart showing the Current Ratio of Bharti Airtel Limited for the year
ended 2008 – 20010
Current Ratio
0.57
0.720.69
0.50
0.55
0.60
0.65
0.70
0.75
0.80
0.85
0.90
0.95
1.00
2008 2009 2010
R a t i o ( T i m e s )
8/8/2019 Rinki Project
http://slidepdf.com/reader/full/rinki-project 54/92
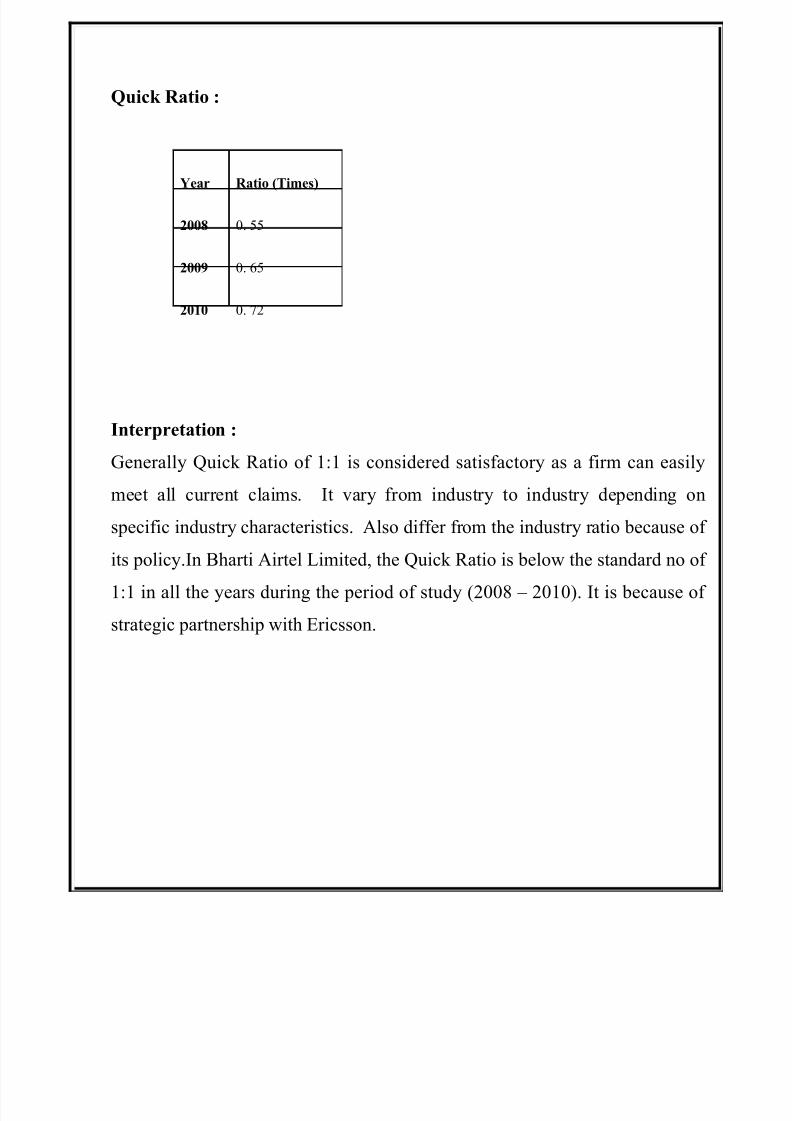
Quick Ratio :
Interpretation :
Generally Quick Ratio of 1:1 is considered satisfactory as a firm can easily
meet all current claims. It vary from industry to industry depending on
specific industry characteristics. Also differ from the industry ratio because of
its policy.In Bharti Airtel Limited, the Quick Ratio is below the standard no of
1:1 in all the years during the period of study (2008 – 2010). It is because of
strategic partnership with Ericsson.
Year Ratio (Times)
2008 0. 55
2009 0. 65
2010 0. 72

8/8/2019 Rinki Project
http://slidepdf.com/reader/full/rinki-project 55/92
Chart showing the Quick Ratio of Bharti Airtel Limited for the year
ended 2008 – 2010
Quick Ratio
0.55
0.72
0.65
0.40
0.45
0.50
0.55
0.60
0.65
0.70
0.75
0.80
2008 2009 2010
R a t i o
( T i m e s )

8/8/2019 Rinki Project
http://slidepdf.com/reader/full/rinki-project 56/92
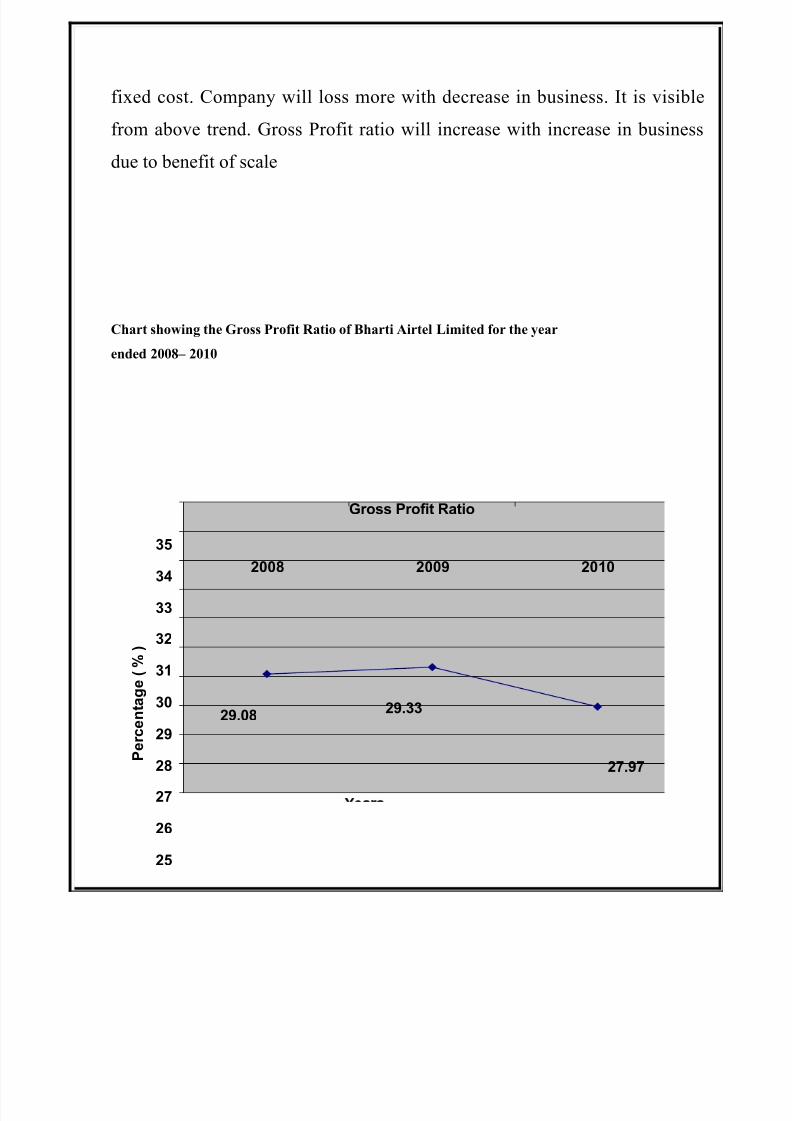
Gross Profit Ratio :
Interpretation :
In interpreting the gross profit ratio at is important to observe any trend, but in
making comparison between companies at is vital to appreciate that the gross
profit ratio varies considerably from industry to industry. In telecom Gross
profit is very high considering Low operating cost and high depreciation on
capex led by them. Gross profit of 45-50% is highest among all the industries.
In Bharti Airtel, the Gross Profit Ratio is high during the year 2008 and low
during the year 2010. As major expense is towards depreciation which is
fixed cost. Company will loss more with decrease in business. It is visible
from above trend. Gross Profit ratio will increase with increase in business
due to benefit of scale.
In interpreting the gross profit ratio at is important to observe any trend, but in
making comparison between companies at is vital to appreciate that the gross
profit ratio varies considerably from industry to industry. In telecom Gross
profit is very high considering Low operating cost and high depreciation on
capex led by them. Gross profit of 45-50% is highest among all the industries.
In Bharti Airtel, the Gross Profit Ratio is high during the year 2008 and lowduring the year 2010. As major expense is towards depreciation which is
Year 2008 2009 2010
Percentage
( %)29.08 29.33 27.97
8/8/2019 Rinki Project
http://slidepdf.com/reader/full/rinki-project 57/92
fixed cost. Company will loss more with decrease in business. It is visible
from above trend. Gross Profit ratio will increase with increase in business
due to benefit of scale
Chart showing the Gross Profit Ratio of Bharti Airtel Limited for the year
ended 2008– 2010
Gross Profit Ratio
27.97
29.0829.33
25
26
27
28
29
30
31
32
33
34
35
2008 2009 2010
P e r c e n t a g e ( % )
8/8/2019 Rinki Project
http://slidepdf.com/reader/full/rinki-project 58/92
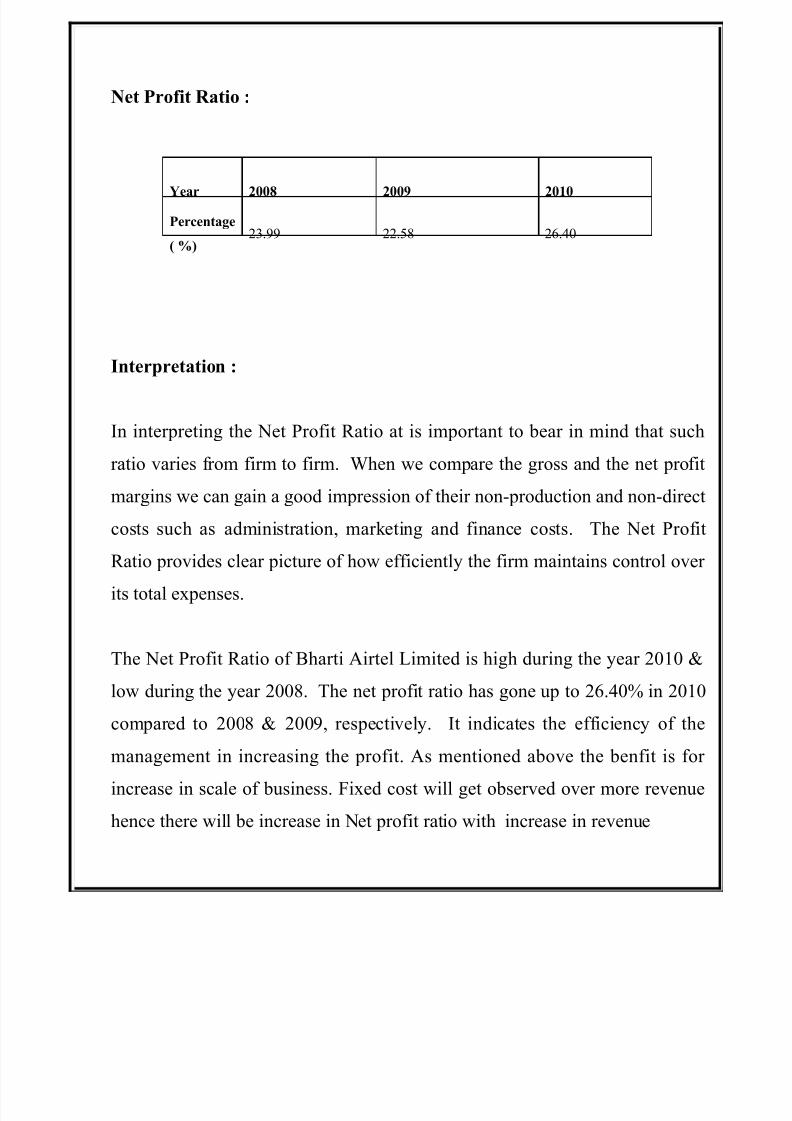
Net Profit Ratio :
Interpretation :
In interpreting the Net Profit Ratio at is important to bear in mind that such
ratio varies from firm to firm. When we compare the gross and the net profit
margins we can gain a good impression of their non-production and non-direct
costs such as administration, marketing and finance costs. The Net Profit
Ratio provides clear picture of how efficiently the firm maintains control over
its total expenses.
The Net Profit Ratio of Bharti Airtel Limited is high during the year 2010 &
low during the year 2008. The net profit ratio has gone up to 26.40% in 2010compared to 2008 & 2009, respectively. It indicates the efficiency of the
management in increasing the profit. As mentioned above the benfit is for
increase in scale of business. Fixed cost will get observed over more revenue
hence there will be increase in Net profit ratio with increase in revenue
Year 2008 2009 2010
Percentage
( %)23.99 22.58 26.40

8/8/2019 Rinki Project
http://slidepdf.com/reader/full/rinki-project 59/92
Chart showing the Net Profit Ratio of Bharti Airtel Limited for the year
ended 2008 – 2010
Net Profit Ratio
26.40
23.99
22.58
15
18
21
24
27
30
2008 2009 2010
P e r c e n t a g e ( % )
8/8/2019 Rinki Project
http://slidepdf.com/reader/full/rinki-project 60/92
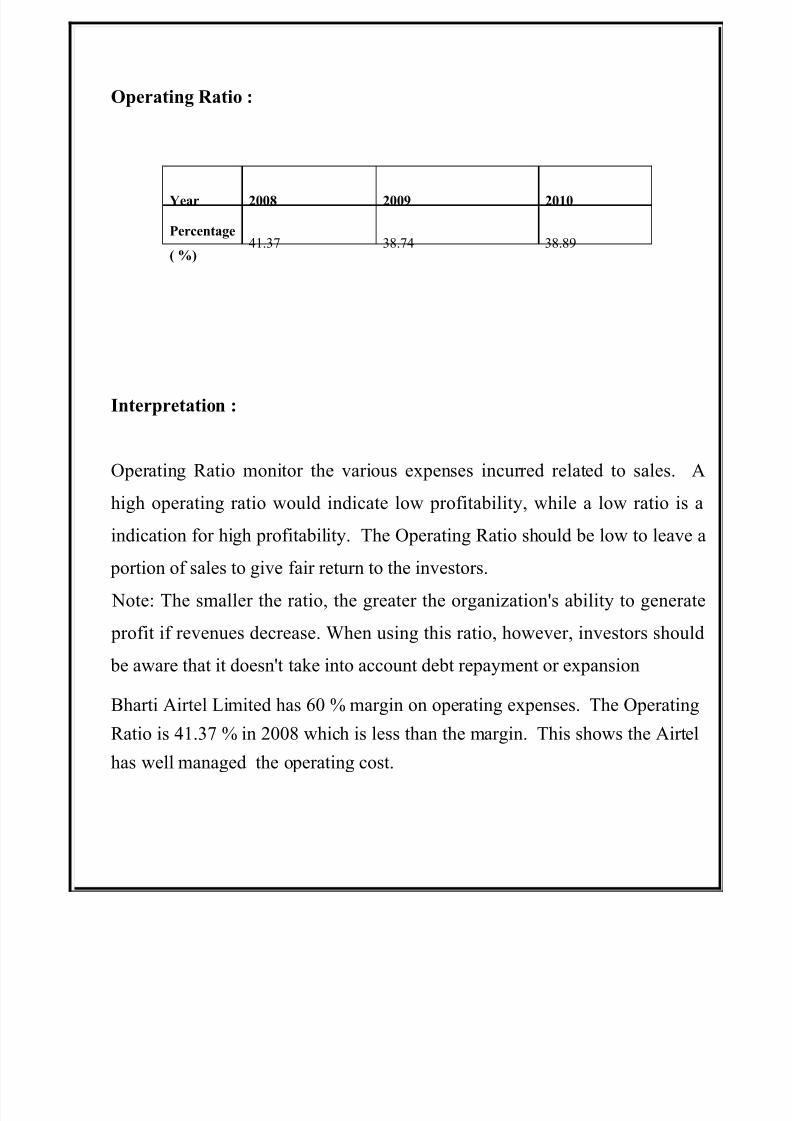
Operating Ratio :
Interpretation :
Operating Ratio monitor the various expenses incurred related to sales. A
high operating ratio would indicate low profitability, while a low ratio is a
indication for high profitability. The Operating Ratio should be low to leave a
portion of sales to give fair return to the investors.
Note: The smaller the ratio, the greater the organization's ability to generate
profit if revenues decrease. When using this ratio, however, investors should
be aware that it doesn't take into account debt repayment or expansion
Bharti Airtel Limited has 60 % margin on operating expenses. The Operating
Ratio is 41.37 % in 2008 which is less than the margin. This shows the Airtel
has well managed the operating cost.
Year 2008 2009 2010
Percentage
( %)41.37 38.74 38.89

8/8/2019 Rinki Project
http://slidepdf.com/reader/full/rinki-project 61/92
Chart showing the Operating Ratio of Bharti Airtel Limited for the year
ended 2008– 2010
Operating Ratio
38.89
41.37
38.74
35
37
39
41
43
45
47
49
2008 2009 2010
P e r c e n t a g e ( % )

8/8/2019 Rinki Project
http://slidepdf.com/reader/full/rinki-project 62/92
Debtor Turnover Ratio :
Interpretation :
Receivable Turnover Ratio which indicates the number of times that the
average outstanding net receivables is turned over, or converted into cash
through collections during the year. Receivables turnover is the period
required for one complete cycle; from the time receivables are recorded
through collection, to the time new receivables are recorded. On the other
hand, a longer credit period granted to creditors would adversely effect the
firm’s liquidity position.
The debtor turnover ratio has increased in all the years during the period under
study. Though it has increased, still with the growth in the business &
receivables, it indicates that the company’s strength in debtor management.
The operation of debtors is through channel partners in postpaid. The debtor
is zero in prepaid operation because they are paid through demand draft. The
operation of prepaid is through Distributors – Retailers – Customers.
Year 2008 2009 2010
Ratio ( Times ) 12.28 12. 78 15.73

8/8/2019 Rinki Project
http://slidepdf.com/reader/full/rinki-project 63/92
Chart showing the Debtors Turnover Ratio of Bharti Airtel Limited for the year
ended 2008 – 20010
Debtors Turnover Ratio
15.73
12.2812.78
8
10
12
14
16
18
2008 2009 2010
R a t i o ( T i m e s )

8/8/2019 Rinki Project
http://slidepdf.com/reader/full/rinki-project 64/92
Inventory Turnover Ratio :
Interpretation :
The liquidity of inventories is measured by the number of times per year that
inventory is converted into cost of goods sold. Hence it is a device to measure
the efficiency of the inventory management. Inventory turnover ratio rates
vary tremendously by the nature of the business.
Bharti Airtel Limited, average inventory holding period is one day. In
telecom inventory will only include sim inventory which will be nominal in
comparision to revenue. . Capex inventory will be grouped under fixed assets.
Year 2008 2009 2010
Ratio ( Times ) 453.06 547.83 1307.05

8/8/2019 Rinki Project
http://slidepdf.com/reader/full/rinki-project 65/92
8/8/2019 Rinki Project
http://slidepdf.com/reader/full/rinki-project 66/92
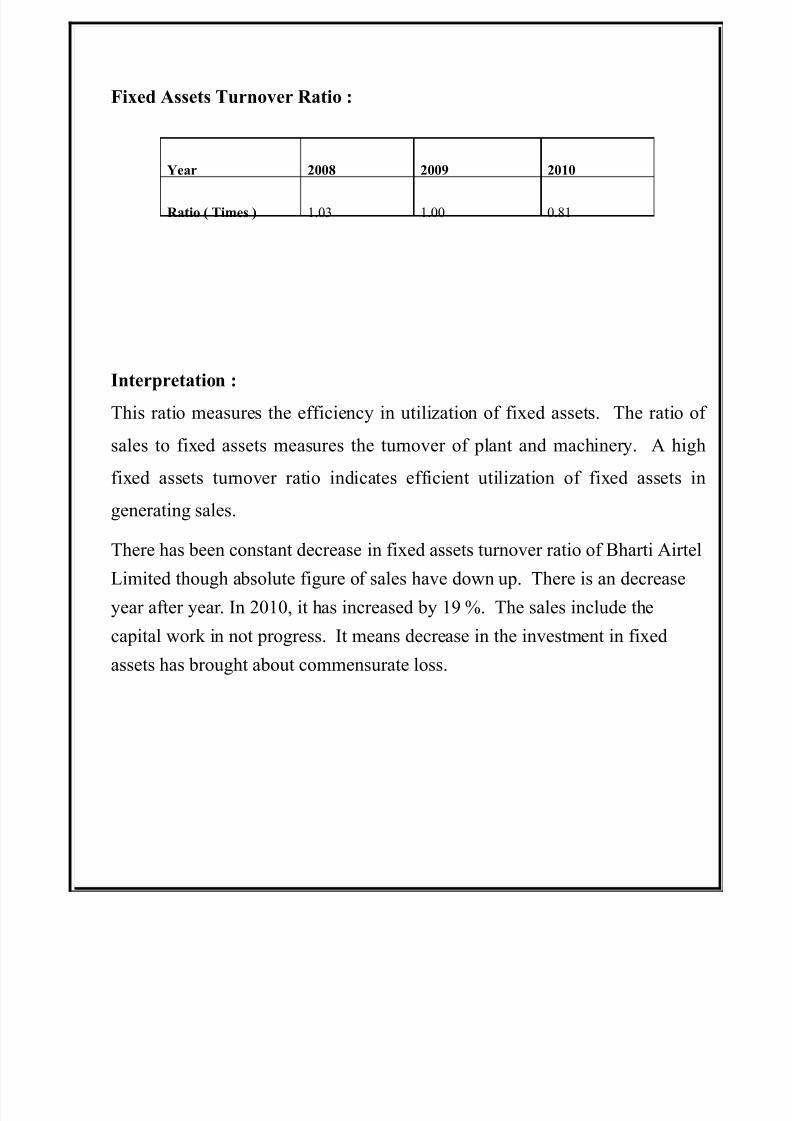
Fixed Assets Turnover Ratio :
Interpretation :
This ratio measures the efficiency in utilization of fixed assets. The ratio of
sales to fixed assets measures the turnover of plant and machinery. A high
fixed assets turnover ratio indicates efficient utilization of fixed assets in
generating sales.
There has been constant decrease in fixed assets turnover ratio of Bharti Airtel
Limited though absolute figure of sales have down up. There is an decrease
year after year. In 2010, it has increased by 19 %. The sales include the
capital work in not progress. It means decrease in the investment in fixed
assets has brought about commensurate loss.
Year 2008 2009 2010
Ratio ( Times ) 1.03 1.00 0.81

8/8/2019 Rinki Project
http://slidepdf.com/reader/full/rinki-project 67/92
8/8/2019 Rinki Project
http://slidepdf.com/reader/full/rinki-project 68/92
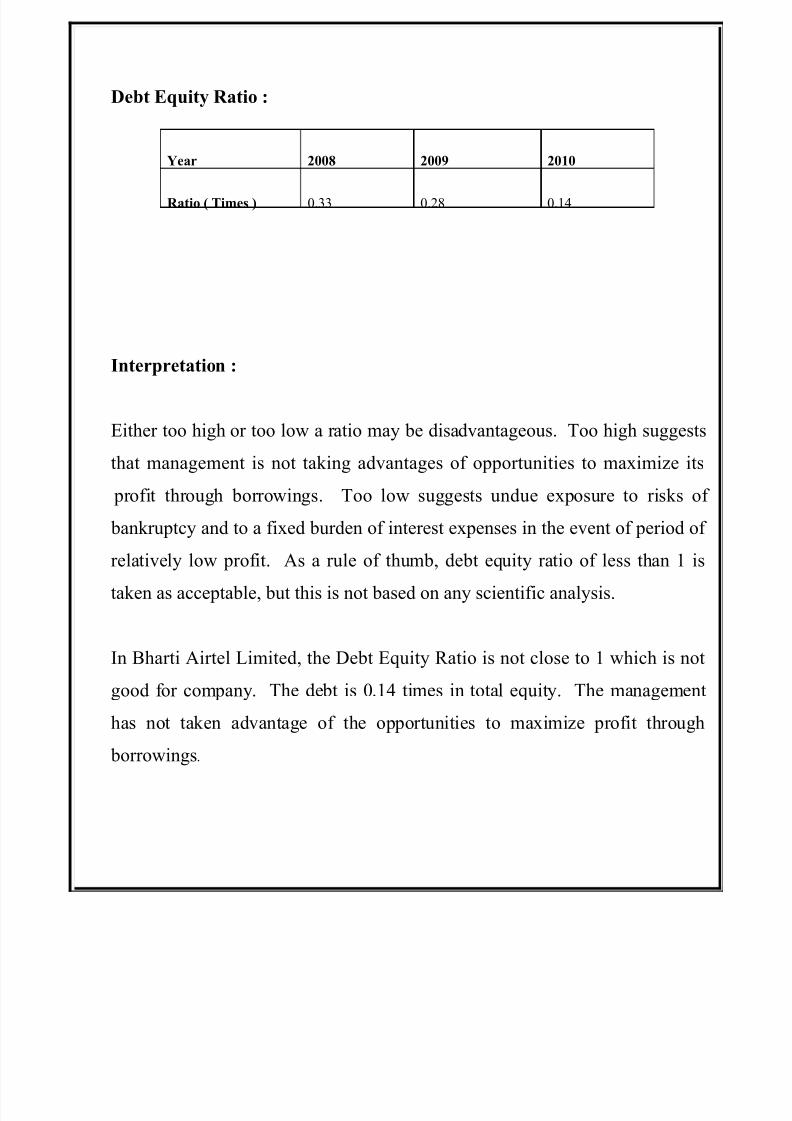
Debt Equity Ratio :
Interpretation :
Either too high or too low a ratio may be disadvantageous. Too high suggests
that management is not taking advantages of opportunities to maximize its
profit through borrowings. Too low suggests undue exposure to risks of
bankruptcy and to a fixed burden of interest expenses in the event of period of
relatively low profit. As a rule of thumb, debt equity ratio of less than 1 is
taken as acceptable, but this is not based on any scientific analysis.
In Bharti Airtel Limited, the Debt Equity Ratio is not close to 1 which is not
good for company. The debt is 0.14 times in total equity. The managementhas not taken advantage of the opportunities to maximize profit through
borrowings.
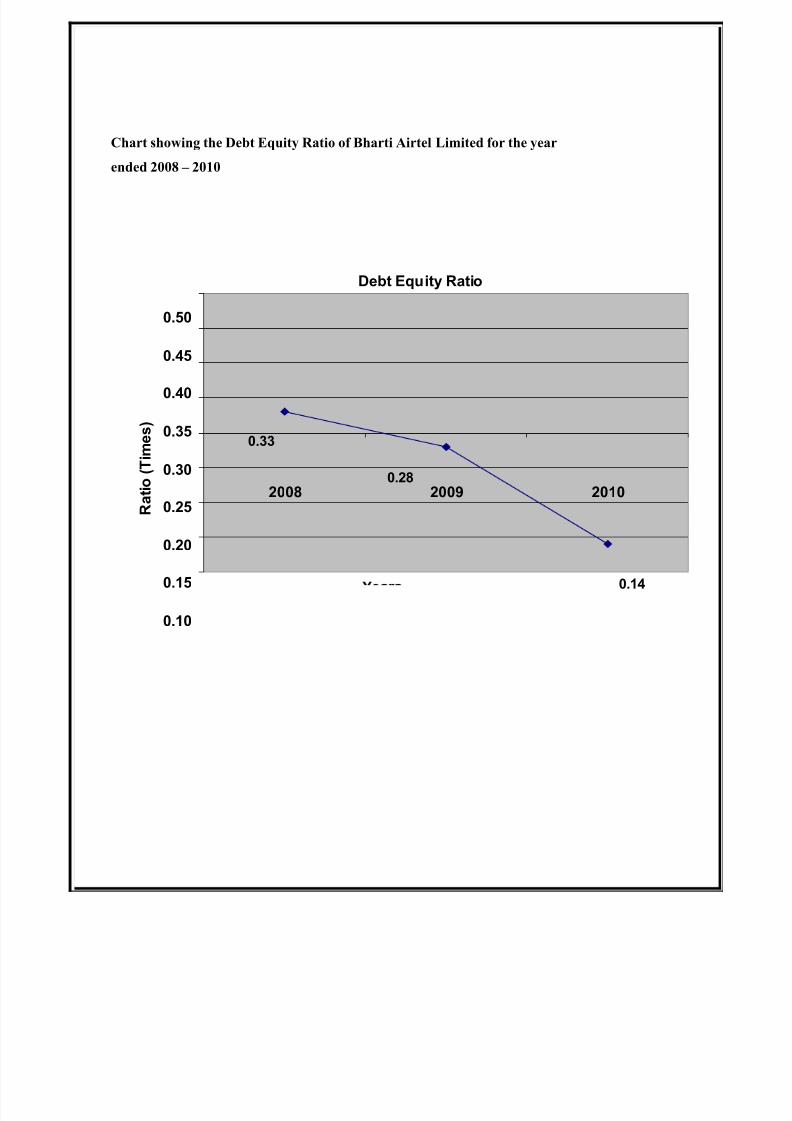
Year 2008 2009 2010
Ratio ( Times ) 0.33 0.28 0.14
8/8/2019 Rinki Project
http://slidepdf.com/reader/full/rinki-project 69/92
Chart showing the Debt Equity Ratio of Bharti Airtel Limited for the year
ended 2008 – 2010
Debt Equity Ratio
0.14
0.33
0.28
0.10
0.15
0.20
0.25
0.30
0.35
0.40
0.45
0.50
2008 2009 2010
R a t i o ( T i m e s )

8/8/2019 Rinki Project
http://slidepdf.com/reader/full/rinki-project 70/92
Earnings Per Share :
Interpretation :
This is well known and widely used indicator of profitability because it can
easily be compared to the previous EPS figure. The earnings per share
represent average amount of net income earned by single equity share.
Earnings per share are generally considered to be the single most important
variable in determining a share's price. It is also a major component of the
price-to-earnings valuation ratio.
The Earnings Per Share of Bharti Airtel Limited is has been consistently
increasing in 2009and it decreased in 2010. This shows the equity share
capital is being effectively used in 2009 but not in 2010. This is also getting
impacted with No-dividend policy of Bharti. Bharti has never declared
dividend so share holder is not getting benefited with the decresation in EPS.
Year 2008 2009 2010
Earnings Per Share
(Amount in Rs.)32.90 40.79 24.82

8/8/2019 Rinki Project
http://slidepdf.com/reader/full/rinki-project 71/92
Chart showing the Earnings Per Share of Bharti Airtel Limited for the year
ended 2008 – 20010
Earnings Per Share
24.82
32.90
40.79
20
25
30
35
40
45
2008 2009 2010
A m o u n t ( I n R s )
8/8/2019 Rinki Project
http://slidepdf.com/reader/full/rinki-project 72/92
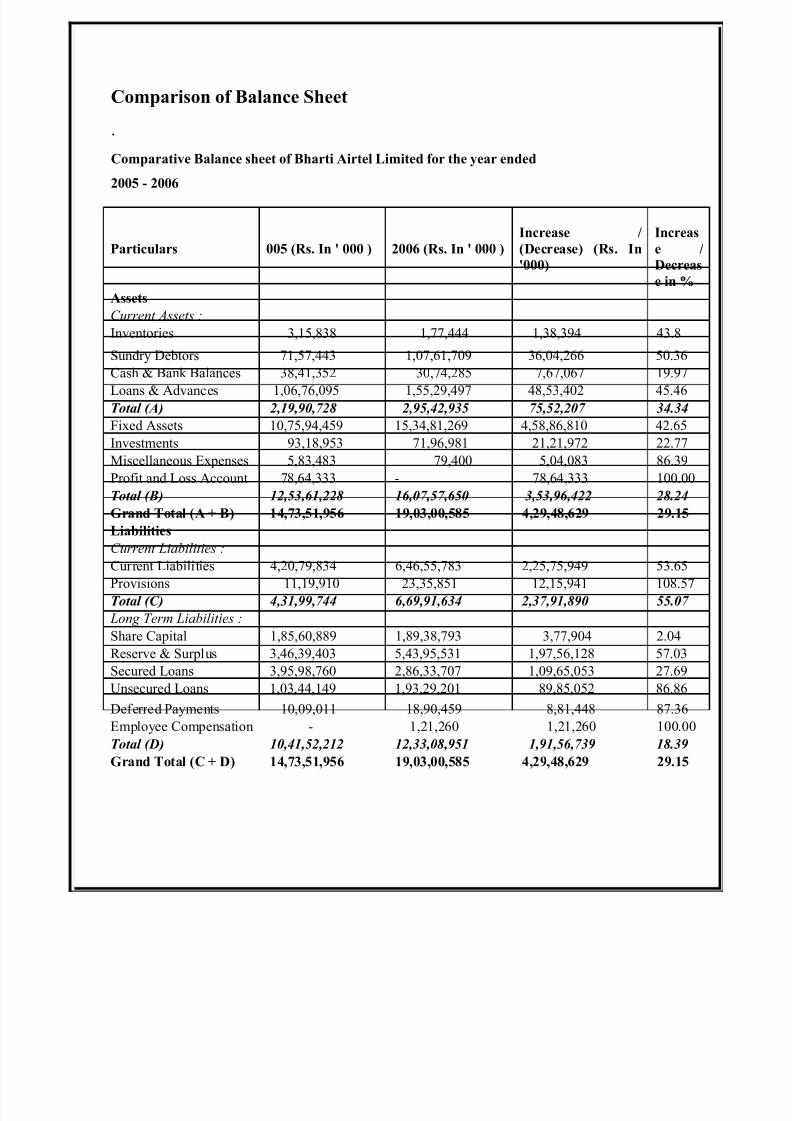
Comparison of Balance Sheet
.
Comparative Balance sheet of Bharti Airtel Limited for the year ended
2005 - 2006
Particulars 005 (Rs. In ' 000 ) 2006 (Rs. In ' 000 )
Increase /
(Decrease) (Rs. In
'000)
Increas
e /
Decreas
e in %
Assets
Current Assets :
Inventories 3,15,838 1,77,444 1,38,394 43.8
Sundry Debtors 71,57,443 1,07,61,709 36,04,266 50.36
Cash & Bank Balances 38,41,352 30,74,285 7,67,067 19.97
Loans & Advances 1,06,76,095 1,55,29,497 48,53,402 45.46
Total (A) 2,19,90,728 2,95,42,935 75,52,207 34.34
Fixed Assets 10,75,94,459 15,34,81,269 4,58,86,810 42.65
Investments 93,18,953 71,96,981 21,21,972 22.77
Miscellaneous Expenses 5,83,483 79,400 5,04,083 86.39
Profit and Loss Account 78,64,333 - 78,64,333 100.00
Total (B) 12,53,61,228 16,07,57,650 3,53,96,422 28.24
Grand Total (A + B) 14,73,51,956 19,03,00,585 4,29,48,629 29.15
Liabilities
Current Liabilities :
Current Liabilities 4,20,79,834 6,46,55,783 2,25,75,949 53.65
Provisions 11,19,910 23,35,851 12,15,941 108.57
Total (C) 4,31,99,744 6,69,91,634 2,37,91,890 55.07
Long Term Liabilities :
Share Capital 1,85,60,889 1,89,38,793 3,77,904 2.04
Reserve & Surplus 3,46,39,403 5,43,95,531 1,97,56,128 57.03
Secured Loans 3,95,98,760 2,86,33,707 1,09,65,053 27.69
Unsecured Loans 1,03,44,149 1,93,29,201 89,85,052 86.86
Deferred Payments 10,09,011 18,90,459 8,81,448 87.36
Employee Compensation - 1,21,260 1,21,260 100.00
Total (D) 10,41,52,212 12,33,08,951 1,91,56,739 18.39
Grand Total (C + D) 14,73,51,956 19,03,00,585 4,29,48,629 29.15
8/8/2019 Rinki Project
http://slidepdf.com/reader/full/rinki-project 73/92
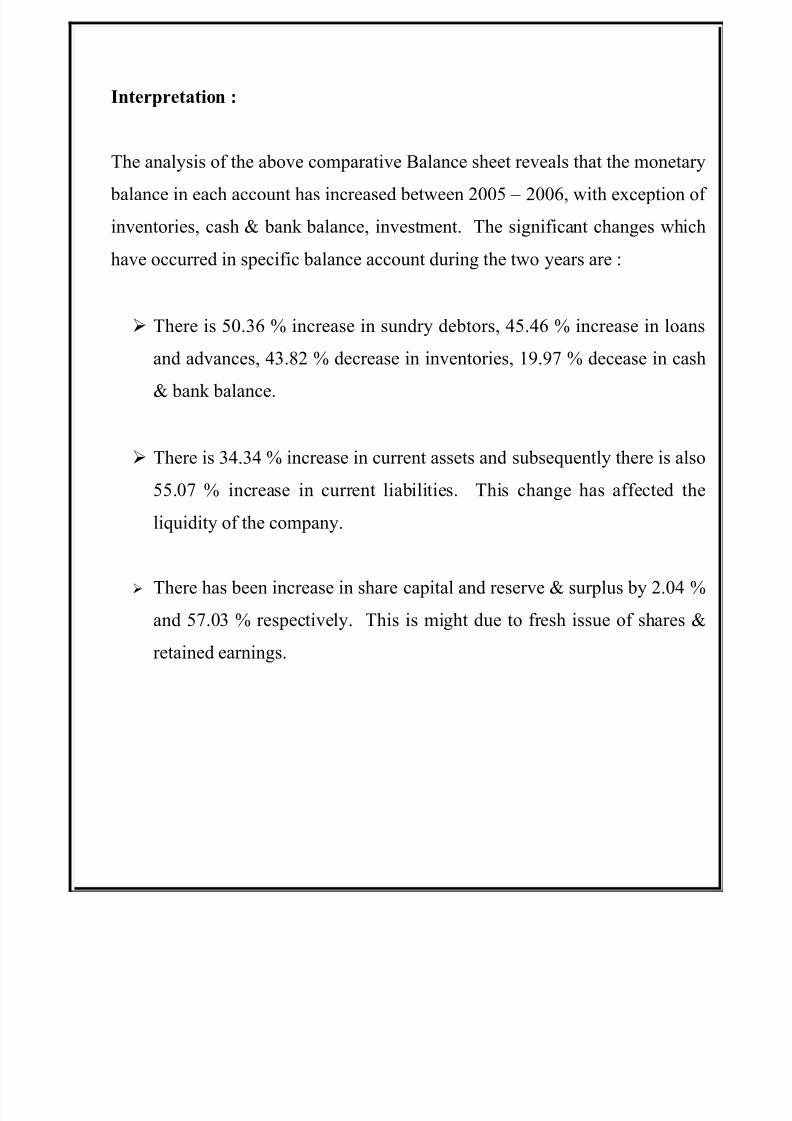
Interpretation :
The analysis of the above comparative Balance sheet reveals that the monetary
balance in each account has increased between 2005 – 2006, with exception of
inventories, cash & bank balance, investment. The significant changes which
have occurred in specific balance account during the two years are :
There is 50.36 % increase in sundry debtors, 45.46 % increase in loans
and advances, 43.82 % decrease in inventories, 19.97 % decease in cash
& bank balance.
There is 34.34 % increase in current assets and subsequently there is also
55.07 % increase in current liabilities. This change has affected the
liquidity of the company.
There has been increase in share capital and reserve & surplus by 2.04 %
and 57.03 % respectively. This is might due to fresh issue of shares &
retained earnings.

8/8/2019 Rinki Project
http://slidepdf.com/reader/full/rinki-project 74/92
Comparative Balance sheet of Bharti Airtel Limited for the year ended
2006 - 2007
Particulars 2006 (Rs. In ' 000 ) 2007 (Rs. In ' 000 )Increase / Decrease (Rs.
In '000)
Increase
/
Decrease
in %
Assets
Current Assets :
Inventories 1,77,444 4,78,145 3,00,701 169
.46
Sundry Debtors 1,07,61,709 1,41,85,170 34,23,461 31
.81
Cash & Bank Balances
30,74,285 78,04,605
47,30,320 153
.87
Loans & Advances
1,55,29,497 2,19,86,846 64,57,349
41
.58
Total (A)
2,95,42,935 4,44,54,766 1,49,11,831
50.
48
Fixed Assets
15,34,81,269 21,68,14,497 6,33,33,228
41
.26
Investments
71,96,981 70,58,179 1,38,802
1.9
3
Miscellaneous Expenses
79,400 26,630 52,770
66.4
6
Profit & Loss a/c
Total (B)
1,60,757,650 2,23,899,306 6,31,41,656 39.28
Grand Total (A + B)
19,03,00,585 26,83,54,072 7,80,53,487 41.02
Liabilities
Current Liabilities :
Current Liabilities
6,46,55,783 9,42,94,231 2,96,38,448
45
.84
Provisions
23,35,851 41,52,480 8,16,629
77
.77
Total (C)
6,69,91,634 9,84,46,711 3,14,55,077
46.
95
Long Term Liabilities :
Share Capital
1,89,38,793 1,89,59,342 20,5490
.11
Reserve & Surplus
5,43,95,531 9,51,73,342 4,07,77,811
74
.97
Secured Loans
2,86,33,707 26,64,475 25,969,232
90.6
9
Unsecured Loans
1,93,29,201 5,04,43,577 3,11,14,376
160
.97
Deferred Payments
18,90,459 23,66,621 4,76,162
25
.19
Employee Compensation
121,260 3,00,004 1,78,744
147
.41
Total (D)12,33,08,951 16,99,07,361 4,65,98,410 37.79
Grand Total (C + D) 19,03,00,585 26,83,54,072 7,80,53,487 41.02
8/8/2019 Rinki Project
http://slidepdf.com/reader/full/rinki-project 75/92
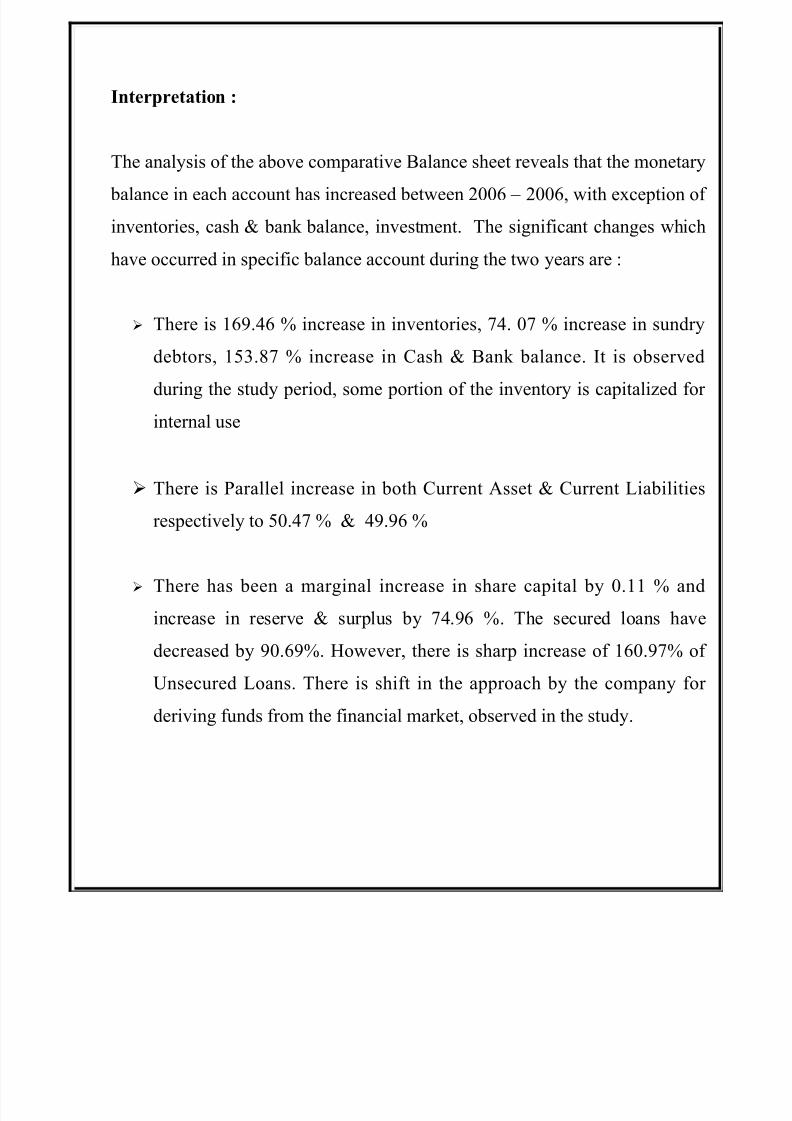
Interpretation :
The analysis of the above comparative Balance sheet reveals that the monetary
balance in each account has increased between 2006 – 2006, with exception of
inventories, cash & bank balance, investment. The significant changes which
have occurred in specific balance account during the two years are :
There is 169.46 % increase in inventories, 74. 07 % increase in sundry
debtors, 153.87 % increase in Cash & Bank balance. It is observed
during the study period, some portion of the inventory is capitalized for
internal use
There is Parallel increase in both Current Asset & Current Liabilities
respectively to 50.47 % & 49.96 %
There has been a marginal increase in share capital by 0.11 % and
increase in reserve & surplus by 74.96 %. The secured loans have
decreased by 90.69%. However, there is sharp increase of 160.97% of
Unsecured Loans. There is shift in the approach by the company for
deriving funds from the financial market, observed in the study.

8/8/2019 Rinki Project
http://slidepdf.com/reader/full/rinki-project 76/92
Comparative Balance sheet of Bharti Airtel Limited for the year ended
2007 - 2008
Particulars 2007 (Rs. In ' 000 ) 2008 (Rs. In ' 000 ) Increase / (Decrease)
(Rs. In '000)
Increase /
Decrease in
%
Assets
Current Assets :
Inventories
4,78,145 5,68,607 90,462
18.9
2
Sundry Debtors
1,87,32,958 2,77,64,572 9,031,614
48.2
1
Cash & Bank Balances
78,04,605 50,29,390 27,75,215
35.56
Loans & Advances
1,74,39,058 2,91,47,541 1,17,08,483
67.1
4
Total (A)
4,44,54,766 6,25,10,110 1,80,55,344
40.6
2
Fixed Assets
21,68,14,497 21,78,17,263 10,02,766
0.4
6
Investments
70,58,179 10,95,28,528 10,24,70,349
1,451.8
0
Miscellaneous Expenses
26,630 2,034 24,596
92.36
Total (B)
22,38,99,306 32,73,47,825 10,34,48,519
46.2
0
Grand Total (A + B)
26,83,54,072 38,98,57,935 12,15,03,863
45.2
8Liabilities
Current Liabilities :
Current Liabilities
9,42,94,231 11,90,02,139 2,47,07,908
26.2
0
Provisions
41,52,480 20,98,762 20,53,718 49.46
Total (C)
9,84,46,711 12,11,00,901 2,26,54,190
23.0
1
Long Term Liabilities :
Share Capital
1,89,59,342 1,89,79,074 19,732
0.1
0
Reserve & Surplus9,51,73,342 18,28,59,525 8,76,86,183
92.13
Secured Loans
26,64,475 5,24,244 21,40,231
80.32
Unsecured Loans
5,04,43,577 6,51,79,172 1,47,35,595
29.2
1
Deferred Payments
23,66,621 6,38,684 17,27,937
73.01
Employee Compensation
3,00,004 5,76,335 2,76,331
92.1
1
Total (D)
16,99,07,361 2,,68,57,034 9,88,49,673
58.1
8
Grand Total (C + D)
26,83,54,072 38,98,57,935 12,15,03,863
45.2
8

8/8/2019 Rinki Project
http://slidepdf.com/reader/full/rinki-project 77/92
Interpretation :
The analysis of the above comparative Balance sheet reveals that the monetary
balance in each account has increased between 2007 – 2008, with exception of
inventories, cash & bank balance, investment. The significant changes which
have occurred in specific balance account during the two years are :
There is marginal increase of 18.92 % in inventories, 48. 21 % increase
in sundry creditors, 67.14 % increase in loans and advances and a dip in
cash & bank balance of 35.56%. Investment has substantial increase of
1451. 80%
Both, Current Assets & Current Liabilities has upward trend of 40. 62 %
& 46. 20%, respectively
There is hardly any impact on share capital. However, there is increase
in reserve & surplus by 92.13 %. The secured loans have decreased by
further 80. 32%.
There is increase of 92. 11% in Employee compensation. This is due to
additional ESOPs outstanding
There is hardly any impact on fixed assets during the year, observed
during the period under study.

8/8/2019 Rinki Project
http://slidepdf.com/reader/full/rinki-project 78/92
Chapter – 5
Findings & Recommendation

8/8/2019 Rinki Project
http://slidepdf.com/reader/full/rinki-project 79/92
Findings :-
Gross Working Capital of the company shows increasing trend during
the period of study.
Net Working Capital of the company shows in negatively increasing
trend. This is because the Working capital is funded from Long-Term
Fund. This is because of the strategic partnership policy with Ericsson.
Atleast 98% of the Current Liability is from Ericsson as most of the
funds are utilized for Network Expansion (Capex) which involves
Installations of MSC, BTS, cables & various connectivity related
expenses. And the Partner is paid accordingly as per the business
agreement.
Working Capital Turnover Ratio of the company shows the decreasing
trend, because the sundry creditors in current liabilities are high. This is
due to commitment or strategic partnership with Ericsson.
It was observed from the analysis that the largest average share in
working capital was sundry debtors. Due to credit given to subscribers
for 1 month.
The share of loans and advances in working capital was 67.14% in 2008
and it is responsible for variations in working capital of different years
under the period of study.

8/8/2019 Rinki Project
http://slidepdf.com/reader/full/rinki-project 80/92
The overall performance of the company regarding inventory
management is progressive in terms of utilization of inventories during
the period of study.
Findings in Ratios :-
the current ratio is 0. 72 times i.e,, the current asset is less than current
liabilities. The current liability is high because of sundry creditors.
Quick Ratio of 1:1 is considered satisfactory as a firm can easily meet all
current claims. It vary from industry to industry depending on specific
industry characteristics. Also differ from the industry ratio because of
its policy.In Bharti Airtel Limited, the Quick Ratio is below the standard
no of 1:1 in all the years during the period of study (2008 – 2010).
The Net Profit Ratio of Bharti Airtel Limited is high during the year
2010 & low during the year 2008. The net profit ratio has gone up to
26.40% in 2010 compared to 2008 & 2009, respectively. It indicates the
efficiency of the management in increasing the profit. As mentioned
above the benfit is for increase in scale of business.
The debtor turnover ratio has increased in all the years during the period
under study. Though it has increased, still with the growth in the
business & receivables, it indicates that the company’s strength in debtor
management. The operation of debtors is through channel partners in
postpaid.

8/8/2019 Rinki Project
http://slidepdf.com/reader/full/rinki-project 81/92
There has been constant decrease in fixed assets turnover ratio of Bharti
Airtel Limited though absolute figure of sales have down up. There is
an decrease year after year. In 2010, it has increased by 19 %. The sales
include the capital work in not progress. It means decrease in the
investment in fixed assets has brought about commensurate loss.
The Earnings Per Share of Bharti Airtel Limited is has been increasing
in 2009and it decreased in 2010. This shows the equity share capital is
being effectively used in 2009 but not in 2010.
8/8/2019 Rinki Project
http://slidepdf.com/reader/full/rinki-project 82/92
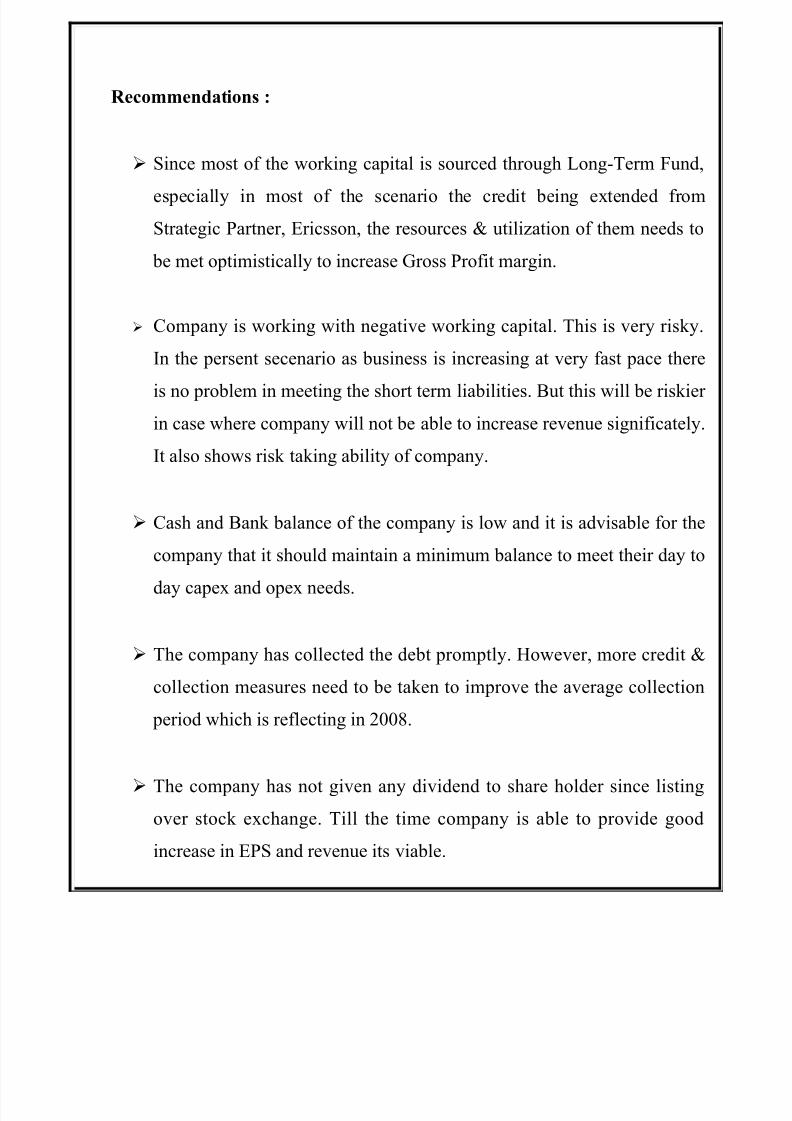
Recommendations :
Since most of the working capital is sourced through Long-Term Fund,
especially in most of the scenario the credit being extended from
Strategic Partner, Ericsson, the resources & utilization of them needs to
be met optimistically to increase Gross Profit margin.
Company is working with negative working capital. This is very risky.
In the persent secenario as business is increasing at very fast pace there
is no problem in meeting the short term liabilities. But this will be riskier
in case where company will not be able to increase revenue significately.
It also shows risk taking ability of company.
Cash and Bank balance of the company is low and it is advisable for the
company that it should maintain a minimum balance to meet their day to
day capex and opex needs.
The company has collected the debt promptly. However, more credit &
collection measures need to be taken to improve the average collection
period which is reflecting in 2008.
The company has not given any dividend to share holder since listing
over stock exchange. Till the time company is able to provide good
increase in EPS and revenue its viable.
8/8/2019 Rinki Project
http://slidepdf.com/reader/full/rinki-project 83/92
Company should raise funds through short term sources for short
termrequirement of funds, which comparatively economical as compare
to long term funds.
Company should take control on debtors collection period which is
major part of current assets.
Company has to take control on cash balance because cash is non
earning assets and increasing cost of funds.
Company should reduce the inventory holding period with use of zero
inventory concepts.
Over all company has good liquidity position and sufficient funds to
repaymentof liabilities. Company has accepted conservative financial policy
and thus maintaining more current assets balance. Company is increasing sales
volume per year which supported to company for sustain 2nd position in the
world.

8/8/2019 Rinki Project
http://slidepdf.com/reader/full/rinki-project 84/92
Chapter – 6
Limitation of the study
8/8/2019 Rinki Project
http://slidepdf.com/reader/full/rinki-project 85/92
Limitations of the study
Following limitations were encountered while preparing this project:
1) Limited data:-
This project has completed with annual reports; it just constitutes one part
ofdata collection i.e. secondary. There were limitations for primary
datacollection because of confidentiality.
2) Limited period:-
This project is based on five year annual reports. Conclusions
andrecommendations are based on such limited data. The trend of last five
yearmay or may not reflect the real working capital position of the company
3) Limited area:-
Also it was difficult to collect the data regarding the competitors and their
financial information. Industry figures were also difficult to get.

8/8/2019 Rinki Project
http://slidepdf.com/reader/full/rinki-project 86/92
Limitations of Ratio Analysis :
The ratio analysis is one of the most powerful tools of financial tools of
financial management. Though ratios are simple to calculate and easy to
understand, they suffer from some serious limitations.
Limited use of single ratio
Lack of adequate standards
Inherent Limitations of accounting
Change of accounting procedure
Window dressing
Personal bias
Incomparability
Absolute figures distort
Price level changes
Ratios no substitute

8/8/2019 Rinki Project
http://slidepdf.com/reader/full/rinki-project 87/92
Chapter - 7
Conclusion

8/8/2019 Rinki Project
http://slidepdf.com/reader/full/rinki-project 88/92
Working capital is a capital required to manage day to day operations of the
business. Management of adequate working capital is essential as it has direct
impact on profitability and liquidity.
The entire Working Capital structure in this study has different dimension.
That is, as studied in this topic, the Net working capital is increasing in the
negative trend though there is enough of profit generated & capital employed.
This is because of the partnership with Strategic Partner (Ericsson/Nokia).
Payment to strategic partner is based on revenue generated and 98% of current
liability is pertains to them. So there is no major threat visible on day to day
operation of company.
The performance of the company during the period under study was
encouraging. Sundry debtors are the major components of current assets in
determining the size of working capital. The company was managing its
receivables satisfactorily as there was no heavy locking of funds in
receivables. Company is utilizing fund flow to meet its capex need and day to
day deployement of network. As this is directly linked to generation of
revenue so its good to have negative working capital till the time business is
growing at very high pace. In case of economy/idutrial slowdown company
has to improve on there working capital management.

8/8/2019 Rinki Project
http://slidepdf.com/reader/full/rinki-project 89/92
On the basis of this assignment’s data we can say that there will be benefit to
investors to invest their money in telecom industry because telecom industry
is
growing industry.And Indian government is also providing various facilities in
the development of telecom industry. In India Bharti Airtel is growing
company. On the basis of its various ratios like Current ratio, Quick ratio , Net profit margin ratio, Inventory turnoverratios, Account receivable ratio ,
Earning per share we can say that company has good profitability condition,
good liquidity position, good market condition because earning per share is
increasing every year.

8/8/2019 Rinki Project
http://slidepdf.com/reader/full/rinki-project 90/92
Chapter - 8
Refrences
8/8/2019 Rinki Project
http://slidepdf.com/reader/full/rinki-project 91/92
References
Wesites :-
www.airtel.in
www.airtelindia.co.in
www.moneycontrol.com
www.wikipedia.com
www.google.com
Books & Magazine :-
Management Accounting Principles and Practices, Vikas Publishing House, M.A.Sahaf
Principles of Management accounting, Sultan Chand & Sons, Dr. S. Maheshwari.
Financial Management, ICAI, New Delhi

8/8/2019 Rinki Project
http://slidepdf.com/reader/full/rinki-project 92/92