Zevenhoven & Kilpinen PARTICULATES 4.2.2004 5-1 Chapter 5 ...
O c t o b e r 2 0 0 9
Grimmway Farms System Automation Master Controllers Save Energy
®

Atlas Copco turns your demands into sustainable solutions
Atlas Copco Carbon Zero CompressorsSending your energy costs into free-fall
www.carbonzerocompressors.comWe are committed to your superior productivity through interaction and innovation.
The “Carbon Zero” compressor !100% of the energy is recoverable*
With over 30 local offices and a network of appointed distributors across the US, Atlas Copco’s compressed air experts are always available right where you do business!
Atlas Copco is very proud to have been named as one of the top 100 sustainable companies in the world for 4 years running.
Call today and start SAVING!
Atlas Copco turns your demands into sustainable solutions
866-688-9611
*100% energy recovery is only possible under certain conditions

“Hitachi DSP Oil-Free Compressors are designed with market leading technologies for increased customer satisfaction. Innovations of Compression, Air Quality, Protection of Process, Longevity of Design, and Efficiency of Application all combine to provide an unparalleled sum of value for the discriminating air user.”
Oil Mist Remover (Patented)
Motorized Isolation Valve (Exclusive)
No Inlet Valve Design (Patented)
Hi-Precooler (Patented)
Hitachi MFG High Efficiency Motor
and Inverter
Stainless Rotors with PTFE-Free Coatings
(Patented)
HITACHI AMERICA, LTD. AIR TECHNOLOGY GROUP 5808-Q Long Creek Park Drive, Suite Q; Charlotte, NC 28269
Tel: 704.494.3008 ext 28 www.hitachi-america.us/airtech; [email protected] Hitachi Industrial Equipment Systems Co., Ltd.
DSP Series Oil-Free Air Compressors (15-240 kw/20-300 hp)
S U S T A I N A B L E M A N U F A C T U R I N G F E A T U R E S The System Assessment of the Month: | 12 Grimmway Farms Implements System Automation By Patricia Boyd, Ecos Air
Seven Sustainability Projects for Industrial Energy Savings: | 18 Heat-Reclaim Economics of Air- and Water-Cooled Air Compressors By Mike Wlodarski, HydroThrift Corporation
The Technology Provider: | 24 Easy-to-Implement Master Control and Monitoring Systems By Jan Hoetzel, SIGA Green Technologies
The Technology Provider: | 30 Compressed Air Management Systems Assist Sustainability Programs By Compressed Air Best Practices®
The System Assessment: | 35 Evaluating Central Compressed Air Management Systems By Hank Van Ormer, Air Power USA
The Technology Provider: | 41 Control Systems for Small- and Medium-Size Air Compressors By Bob Foege, Standard Pneumatic Products
C O L U M N S From the Editor | 5 Sustainable Manufacturing News: | 6 Siemens, Baxter, Rockwell Automation, 3M
Resources for Energy Engineers: | 43 Training Calendar, Industry News and Product & Literature Picks
Wall Street Watch | 47
Advertiser Index | 49
The Marketplace | 50
12
41
30
24
COLUMNS® | 1 0 / 0 9
4 www.ai rbestpract ices .com
From the editorCompressed Air Management Systems
The compressed air industry joins Kaeser Compressors in mourning
the passing this month of Mr. Carl Kaeser. We offer our condolences
to his family and all Kaeser employees around the world.
The System Assessment of the Month details the System Automation
implemented by Grimmway Farms in California. Ecos Air and Accurate
Air Engineering teamed up to provide Grimmway with a system which
qualified for a 55% energy incentive from Pacific Gas & Electric.
Heat-reclaim “economics” of rotary screw air compressors are reviewed by Mr. Mike Wlodarski
of HydroThrift Corporation. This is an interesting article written from the perspective of a cooling
system manufacturer with significant experience in this field. There are great opportunities
for most existing compressed air installations.
The topic of master controllers and management systems for compressed air supply equipment
is examined in our Technology Provider articles. Air compressors, air treatment products and
measurement devices can all work together to optimize a compressed air system — even if
they are of different makes and models. In a new era where energy managers want data from
their compressed air systems, demand for compressed air management systems is growing.
Manufacturers of these technologies (like Pneu-Logic, SIGA Airleader and Standard Pneumatic
Products) share their knowledge with us on the topic.
Some Energy Managers have expressed confusion over the differences between the types of master
controllers and sequencers available on the market. Mr. Hank Van Ormer of Air Power USA shares
his practical approach to system assessments. In his article, he provides some suggestions on how
to evaluate the different central compressed air management systems available today.
We hope you enjoy this edition, and thank you again for your support and for investing
in industrial energy efficiency.
kW
CO2 Grimmway Farms received
a $66,000 incentive check from Ecos Air and PG&E.
COLUMNS ®1 0 / 0 9 |
5
S u S t a i n a b l e M a n u f a c t u r i n g n e w S
Siemens, Baxter, Rockwell Automation, 3MSOURCED FROM THE WEB
Siemens Corporate Responsibility
Energy consumption, water consumption, greenhouse gas emissions, VOC emissions, emissions
of R11 equivalents and waste volumes are all key parameters that we track at a company level.
In fiscal 2008, 315 locations in 37 countries (100% of the company units required to file
reports — see the chapter on Environmental Protection in the “Management” section) submitted
environmental performance data through SESIS (Siemens Environmental and Technical Safety
Information System). In 2008, our reporting base changed once again: 46 new locations were
added and 82 were removed — the latter primarily as a result of the sale of Siemens VDO.
Energy Consumption
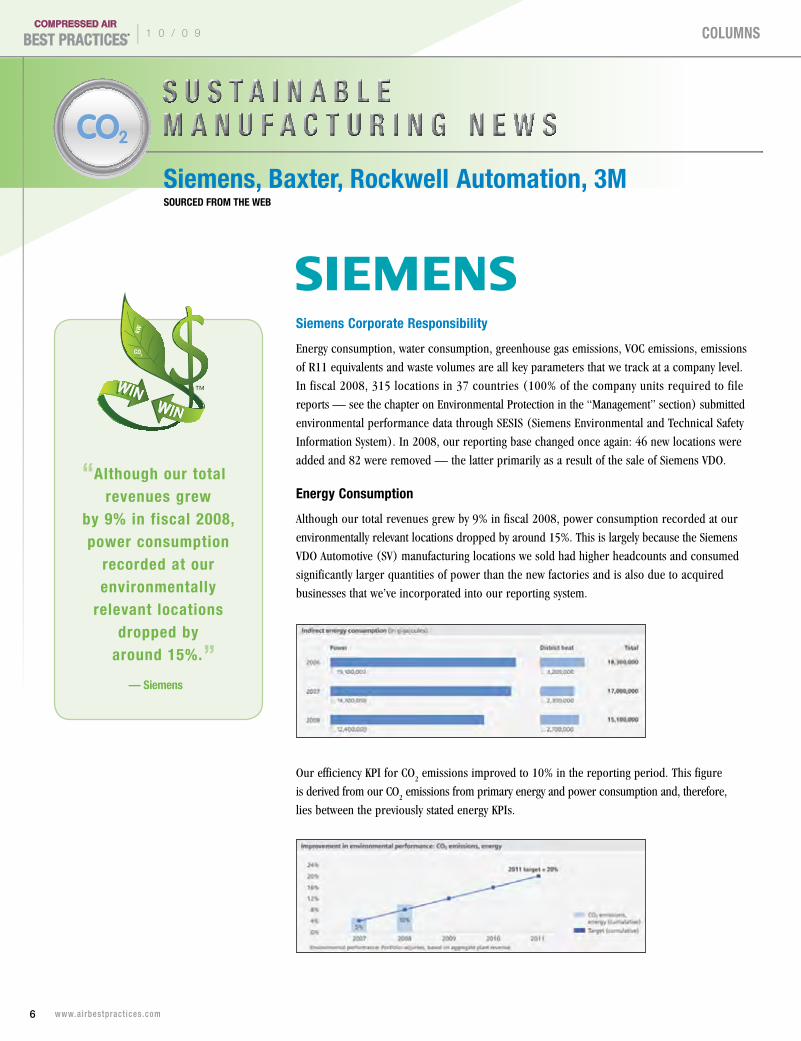
Although our total revenues grew by 9% in fiscal 2008, power consumption recorded at our
environmentally relevant locations dropped by around 15%. This is largely because the Siemens
VDO Automotive (SV) manufacturing locations we sold had higher headcounts and consumed
significantly larger quantities of power than the new factories and is also due to acquired
businesses that we’ve incorporated into our reporting system.
Our efficiency KPI for CO2 emissions improved to 10% in the reporting period. This figure
is derived from our CO2 emissions from primary energy and power consumption and, therefore,
lies between the previously stated energy KPIs.
kW
CO2
“Although our total revenues grew
by 9% in fiscal 2008, power consumption
recorded at our environmentally
relevant locations dropped by
around 15%.”— Siemens
COLUMNS® | 1 0 / 0 9
6 www.ai rbestpract ices .com

In fiscal 2007, we decided to align our greenhouse gas reporting
with guidelines issued by the World Business Council for Sustainable
Development and the World Resources Institute (Greenhouse Gas
Protocol). All of our greenhouse gas emissions figures are now
calculated according to this system. Specifically, this means:
p Emissions figures are extrapolated to 100% if the data collected does not cover the whole of Siemens
p Reporting is based on continuing operations. In other words, figures are adjusted to reflect portfolio changes by eliminating emissions for those locations that have been sold. If no exact figures are available for emissions at recently acquired locations, these are estimated for prior years and added to the series
p The base year for the computation is fiscal 2005
In 2008, we again had our greenhouse gas report reviewed and verified by
Det Norske Veritas (DNV). Besides ensuring transparency, the verification
process gives us an opportunity to discuss our computation methods with
experts in this field and to refine these methods from year to year.
Our greenhouse gas emissions in 2008 totaled four million tons. They
were primarily caused by power generation, burning fossil fuels and the
emission of sulfur hexafluoride (SF6) from the manufacture of high-voltage
equipment converted into CO2 equivalents. Other greenhouse emissions were
caused by glass furnaces, cooling systems, test stations, small office locations
and business travel.
As the series of figures below shows, our greenhouse gas emissions have
dropped steadily since 2006, and in 2008, we succeeded in cutting output
by 8% from the previous year.
Source: www.siemens.com
COLUMNS ®1 0 / 0 9 |
7
Hankison products are globally recognized for sustaining premium performance, reliability, and energy savings. Choose Hankison...New ideas...New products...after 61 years....still the best!
TEL: 724 | 745 | 1555
Email: [email protected]
www.hankisonintl.com/best
© 2
009
SP
X
Bringing Out the Best..in Compressed Air Treatment Solutions
since1948!
Baxter Management of Energy Use and Cost
Effectively managing
energy usage enhances
business efficiency,
conserves natural resources and benefits human, and other life, on earth.
Reducing the use of fossil fuels, such as coal and fuel oil, enhances air
quality by reducing fine particulates that contribute to adverse health effects,
and helps limit the generation of greenhouse gas (GHG) emissions, which
contribute to climate change. In addition, limiting the use of non-renewable
energy sources helps preserve their availability for future generations.
While energy conservation benefits the environment, it also makes
good business sense for Baxter, since energy is among the company’s
most significant manufacturing costs. Since 2005, while Baxter’s sales
increased nearly 24% through 2008, absolute energy usage increased
just 3%. However, due to sharply increasing global energy prices, energy
costs increased 42% during that time, to a total of $182 million. This
underscores the importance of Baxter’s ongoing energy management
efforts. During the last decade, Baxter has strengthened its energy
management program. In 1999, it re-energized its corporate energy
management group, and in 2001, it established a formal position statement
on Climate Change and Energy. In 2005, Baxter hired a director of energy
management to lead long-term strategic energy planning, coordinate global
energy conservation activities and support energy conservation projects.
Baxter’s corporate energy management group oversees the company’s global
energy conservation activities and reports energy usage, cost and efficiency
improvements quarterly to senior management. Since 2005, Baxter has
increased the number of annual facility energy reviews, expanded the use
of a third-party utility invoice payment service, established and provided
training on facility “Lean” energy standards and promoted best practices
in energy management across the company. In addition, to encourage the
implementation of energy efficiency projects, Baxter has lowered its internal
rate of return for such projects.
“Lean” Energy Program
In 2007, Baxter launched a “Lean” energy program for the company’s
63 principal manufacturing facilities. The program established four sets
of energy standards — prerequisite, bronze, silver and gold — to be
phased in from 2007 to 2010. Each category defines 25–30 requirements
a facility’s energy program should meet. In 2008, 17 locations met 100%
of the bronze-level requirements, and several facilities are on target
to achieve silver and gold status.
Biennial Global Energy Conference
Baxter Facilities Engineering Services, with the support of the company’s
Manufacturing Council, coordinates a biennial Global Energy Conference
for Baxter facility energy managers. The most recent conference was
held in autumn 2008 in San Jose, California. Approximately 120 Baxter
energy managers, corporate staff, outside presenters and guests attended
this conference, which included a special focus on renewable energy
and alternative power generation.
Performance
Baxter extended its commitment to reducing energy usage from operations
from its original 2010 goal of a 20% reduction indexed to revenue,
compared to 2005, to a 30% reduction by 2015, also indexed to revenue
and compared to 2005. Energy usage from operations includes the energy
used by Baxter-managed and Baxter-operated facilities, sales and truck fleets.
From 2005 to 2008, energy consumption for Baxter operations increased
3% in absolute terms, from 8,945 to 9,216 trillion joules. During this same
period, Baxter improved overall energy efficiency (energy usage indexed
to revenue) by 18%. This puts the company on track to meet its energy
improvement goals.
Source: www.baxter.com
S U S T A I N A B L E M A N U F A C T U R I N G N E W S Siemens, Baxter, Rockwell Automation, 3M
COLUMNS® | 1 0 / 0 9
8 www.ai rbestpract ices .com
Rockwell Automation Environmental Performance
Rockwell Automation concentrates most of its
energy conservation programs on reducing
electricity usage because electricity constitutes
the majority of its energy consumption and
carbon footprint. In 2008, when normalized
to sales, Rockwell Automation reduced
electricity usage in its 56 manufacturing
locations by 9% as compared to 2007.
Only 10% of the carbon footprint is from
natural gas usage. While that is a small
portion of the total energy profile, we were
disappointed that usage increased 18% in
2008 when normalized to sales. Liquid fuels
are less than 1% of our carbon footprint and,
when normalized to sales, we used 27% less
compared to the previous year.
While liquid fuels and natural gas do result
in CO2 emissions, nearly 90% of our emissions
are indirect because CO2 generation takes place
at the electric utility, not at our sites. For 2008,
our total CO2 emissions dropped 9%.
In the coming year, we will expand and redefine
our global greenhouse gas reduction efforts,
both in terms of the number of facilities
we monitor and the scope of emissions
we measure. We’ll then set new baseline
measurements to track energy use and
greenhouse gas emissions. We’ve embarked
on this effort as part of our new US EPA
Climate Leaders membership.
Source: www.rockwellautomation.com
COLUMNS ®1 0 / 0 9 |
9
RCP Piston Series1.5 - 20 hp
Join Our Successful Team1-877-861-2722
High-performance products.Designed for you !
Complete Line of Dryers & Filters
CP Compressors1800 Overview DriveRock Hill, SC 29730www.cp.com
CP Compressors Canada 125 McBrine Place #2 Kitchener, Ontario, N2R 1G4
Rotary Screw 3-250 hp
3M Climate Change and Energy Management
Recognition
In 2009, 3M received the
ENERGY STAR Sustained
Excellence Award for Energy Management from the EPA and the U.S.
Department of Energy in recognition of continuous improvement in
energy management. 2009 marked the sixth year in a row that 3M was
recognized by ENERGY STAR — a record for an industrial company.
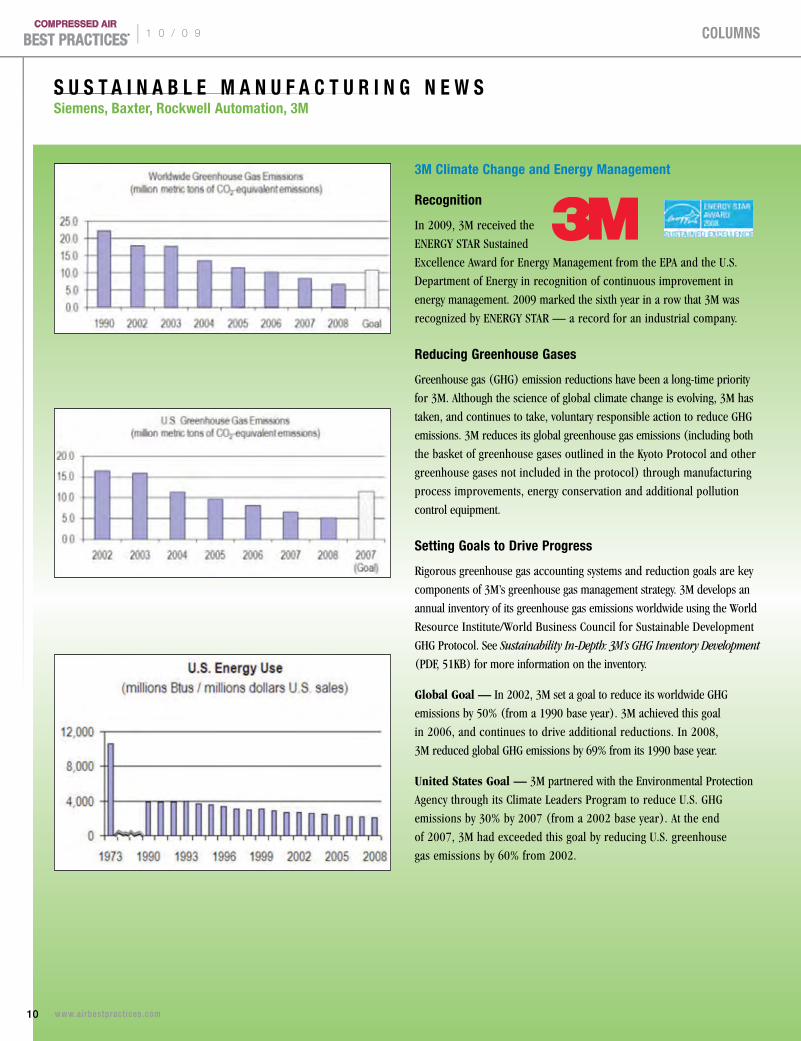
Reducing Greenhouse Gases
Greenhouse gas (GHG) emission reductions have been a long-time priority
for 3M. Although the science of global climate change is evolving, 3M has
taken, and continues to take, voluntary responsible action to reduce GHG
emissions. 3M reduces its global greenhouse gas emissions (including both
the basket of greenhouse gases outlined in the Kyoto Protocol and other
greenhouse gases not included in the protocol) through manufacturing
process improvements, energy conservation and additional pollution
control equipment.
Setting Goals to Drive Progress
Rigorous greenhouse gas accounting systems and reduction goals are key
components of 3M’s greenhouse gas management strategy. 3M develops an
annual inventory of its greenhouse gas emissions worldwide using the World
Resource Institute/World Business Council for Sustainable Development
GHG Protocol. See Sustainability In-Depth: 3M’s GHG Inventory Development
(PDF, 51KB) for more information on the inventory.
Global Goal — In 2002, 3M set a goal to reduce its worldwide GHG
emissions by 50% (from a 1990 base year). 3M achieved this goal
in 2006, and continues to drive additional reductions. In 2008,
3M reduced global GHG emissions by 69% from its 1990 base year.
United States Goal — 3M partnered with the Environmental Protection
Agency through its Climate Leaders Program to reduce U.S. GHG
emissions by 30% by 2007 (from a 2002 base year). At the end
of 2007, 3M had exceeded this goal by reducing U.S. greenhouse
gas emissions by 60% from 2002.
S U S T A I N A B L E M A N U F A C T U R I N G N E W S Siemens, Baxter, Rockwell Automation, 3M
COLUMNS® | 1 0 / 0 9
10 www.ai rbestpract ices .com
3M’s energy efficiency efforts date back to 1973,
when the 3M Energy Management Department
was formed. Improvements result from employee
programs that increase energy efficiency of existing
operations, new equipment and facilities designed
to be energy efficient and the development of new,
more energy efficient 3M products and processes.
Using Life Cycle Management, new product
development teams work to improve the energy
efficiency of 3M products. They consider energy
efficiency in their choice of raw materials, product
formulations and manufacturing processes.
To drive continuous improvement in energy
management, the company has set a goal
to improve energy efficiency by 20% from
2005–2010. This goal is in addition to previous
energy efficiency efforts, which achieved an 80%
improvement in energy efficiency at 3M’s U.S.
operations since 1973, and a 43% improvement
in energy efficiency at 3M’s operations worldwide
since 1998.
During 2008, 3M implemented 212 energy
projects, which saved over $9.7 million.
3M has realized $37 million in energy savings
from its 2005 base year by implementing more
than 1,400 employee-inspired projects. We
continue to adopt new methods to improve
energy efficiency, including the use of Six Sigma
methodology and an increase in our use
of alternative, renewable energy.
Source: www.3m.com
COLUMNS ®1 0 / 0 9 |
11 www.ai rbestpract ices .com
ALMiGFamily of Intelligent Control
Systems
Exclusive Distribution Opportunities Available!
ALMiG USA Corporation – Green Bay – [email protected] – Toll free: 866.992.5644
EFFICIENT º INNOVATIVE º IN STOCK!
With the ALMiG control family AIR CONTROL, MULTI CONTROL and PLANT CONTROL – you can control, manage and monitor your entire compressed air supply.
reduce power costs
think, monitor, document
create reliable supply of compressed air
integrate the compressed air station into central instrumentation and control systems
make existing compressed air station more cost-effective
T h e S y S T e m A S S e S S m e n T o f T h e m o n T h
Grimmway Farms Implements System Automation While Receiving an Incentive for 55% of the Total Project CostBy PATRICIA BOyD, ECOS AIR
kW
CO2
October System Assessment of the Month
Where: Arvin, CA
Industry: Food Processing
Issues: Multiple compressors are not automated and are therefore inefficient
Audit Type: Compressed Air System
System Assessment Win/Win Results*
Reduction in Energy Use: 765,274 kWh
Reduction in CO2 Emissions: 545 metric tons
Equivalent CO2 for Homes: 72 homes
Equivalent CO2 for Vehicles: 100 vehicles
Approximate Annual Savings: $64,283
Investment: $120,000
Energy Rebate: $65,482
Simple ROI: 11 months
*Annual energy consumption
Introduction
This article presents a case study of Grimmway Farms, a carrot growing and packing firm located
in California’s Central Valley, that was able to improve its compressed air system’s efficiency after
implementing system automation and making relatively small equipment and piping changes.
Grimmway Farms uses compressed air for the production and clean-up processes in their carrot
packing plants. After having been approached by the Ecos Air Program (see sidebar), members
of Grimmway’s energy efficiency program realized that in addition to decreasing the continued
energy use of their compressed air system while simultaneously improving overall performance,
there may also be an opportunity to receive a considerable monetary incentive, which could offset
the cost of the suggested energy reduction improvements.
Ecos Air worked with auditor Kyle Harris, a Department of Energy “Compressed Air System
Energy Expert” and a major contributor to this article, to perform the assessment of the existing
compressed air system.
Building D
Building A1
N/C Valve
4”
4”
N/C Valve
N/O Valve
3”
4”
Bldg A1 Loops
4”
6”
6”
4” X 5” Flow Control Set 83 psig
Valve Currently Open, Mixing Dew Points
N/O Valve
6” 6”
6”
6” 4”
N/C Valve
4”
#1 100 hp 100 psi 470 cfm
#2 150 hp 100 psi 726 cfm
#3 150 hp 100 psi 726 cfm
#4 150 hp 100 psi 726 cfm
#5 200 hp 100 psi 1000 cfm
#1 150 hp 125 psi 608 cfm
#2 150 hp 125 psi 608 cfm
1020 gl
6”
6”
AP2100 Dryer ‐40 F 2100 cfm
Deltech Dryer +40 F 2050 cfm
Gardner Dryer +40 F 1250 cfm
3000 gl
3000 gl
6”
3” X 4” Flow Control Set 83 psig
3” X 4” Flow Control Set 32 psig To Plant
1020 gl
Deltech Dryer +40 F 2050 cfm
4” X 5” Flow Control Set 87 psig 3” from F Extension
(excess air from 15 hp air compressor)
820 & 821 Filters
New 200 hp 100 psi 974 cfm Not currently installed
Scheduled to be removed
Grimmway Farms, Malaga Plant Compressed Air System 7/2008
Bldg D Loops
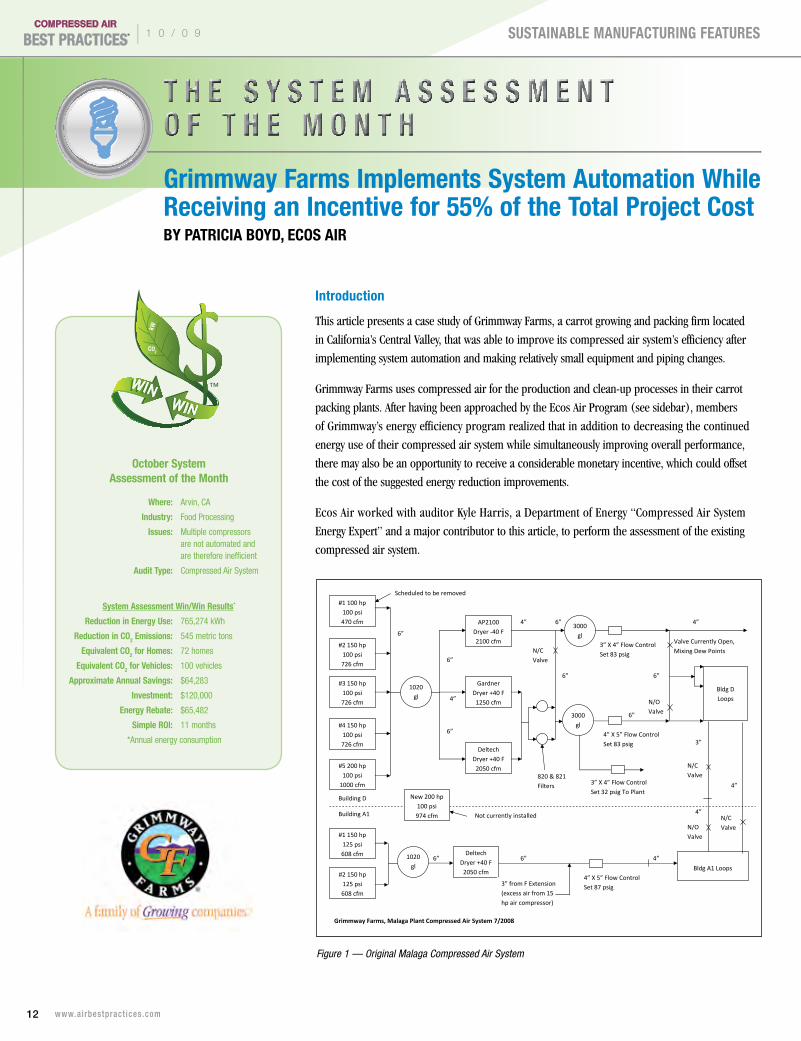
Figure 1 — Original Malaga Compressed Air System
SUSTAINABLE MANUFACTURING FEATURES® | 1 0 / 0 9
12 www.ai rbestpract ices .com
kW
CO2
Compressor System before Assessment
Operating Hours: 8736 hours
Power Cost kW/h: $0.084
Avg. Air Flow: 1903 acfm
Plant Air Pressure: 100 psig, controlled to 85 psig and 32 psig
Compressed Air Specific Power: 21.7 kW/100 cfm
Annual Energy: 3,596,788 kWh
Annual Energy Cost: $302,130
Compressor System after Assessment
Operating Hours: 8736 hours
Power Cost kW/h: $0.084
Avg. Air Flow: 1782 acfm
Plant Air Pressure: 100 psig, controlled to 83 psig and 32 psig
Compressed Air Specific Power: 18.2 kW/100 cfm
Annual Energy: 2,831,338 kWh
Annual Energy Cost: $237,822
System Before Assessment
The pre-project system (Figure 1), located in
two buildings (D and A1) with normally closed
interconnected piping, operated independently
and consisted of 1 x 200 horsepower, 5 x 150 hp
and 1 x 100 hp (not in operation) oil-flooded,
variable displacement controlled, rotary screw
air compressors. An additional new 200 hp
air compressor had been previously purchased
for the facility, but had not yet been installed.
Local controls for each of the Building D air
compressors maintained a system pressure of
97–99 psig, with full flow at 97 psig, and no flow
at approximately 102 psig. If unloaded for ten
minutes, the compressors would automatically
shut down until system pressure reached
90 psig, at which time they would restart. These
air compressors discharged into a common
1,020-gallon air receiver before entering one
of two refrigerated air dryers or a desiccant-
filled blower purge air dryer. Compressed air
from the blower purge air dryer discharged into
a 3,000-gallon air receiver and then through
a flow controller/demand expander, which was
set at 83 psig. After exiting the refrigerated air
dryers, the compressed air entered a separate
3,000-gallon receiver and discharged through
one of two flow controller/demand expanders.
One flow controller was set at 83 psig, while the
second was set at 32 psig for a specific process
in the plant. At the time of the assessment,
the normally closed crossover valve between
the discharge of the refrigerated compressed
air dryers and the desiccant blower purge
air dryer was found to be open.
SUSTAINABLE MANUFACTURING FEATURES ®1 0 / 0 9 |
13 www.ai rbestpract ices .com
THE CONDENSATE MANAGEMENT SPECIALISTS
JORC offers a product range that covers ALL condensate requirements. We provide total quality and reliability so that you don’t have to compromise—our range of versatile and cost-effective solutions are designed to meet all of your condensate management needs. Through continued investment in research and development, we offer up-to-date solutions that you can count on.
At JORC we never compromise on Quality or Reliability—why should you?
Contact us today:JORC Industrial LLC.
1146 River Road • New Castle, DE 19720Phone: 302-395-0310 • Fax: 302-395-0312
E-mail: [email protected]
See our new online catalog atwww.jorc.com
Motorized Ball Valves
Magnetic Zero Air Loss Drains
Electronic Zero Air Loss Drains
Timer Drains
Compressed Air Leak Detector
Oil Water Separators
kW
CO2
Building A1’s compressor controls operated similarly, except system pressure was maintained
at 106–108 psig with full flow at 106 psig and no flow at approximately 114 psig. They, too,
would automatically shut down if unloaded for ten minutes, but would restart at approximately
95 psig. These air compressors discharged into a common 1,020-gallon air receiver, where the
air entered a single refrigerated air dryer. The compressed air was then controlled by a flow
controller/demand expander to a set point of 87 psig.
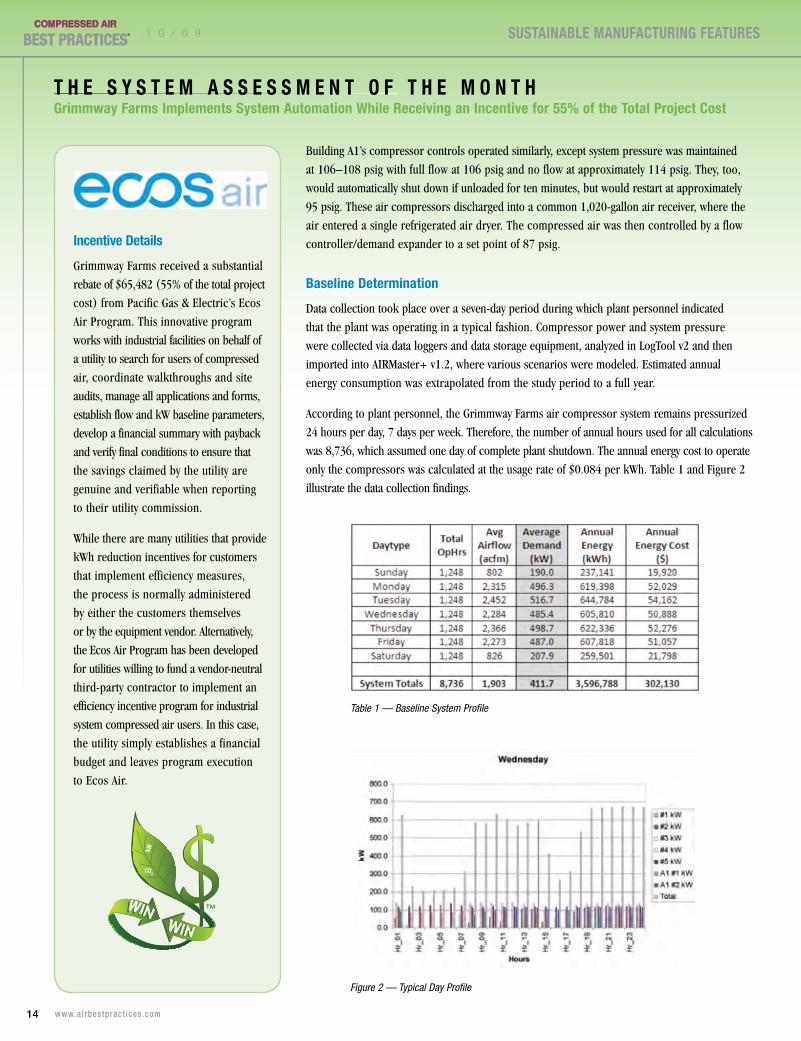
Baseline Determination
Data collection took place over a seven-day period during which plant personnel indicated
that the plant was operating in a typical fashion. Compressor power and system pressure
were collected via data loggers and data storage equipment, analyzed in LogTool v2 and then
imported into AIRMaster+ v1.2, where various scenarios were modeled. Estimated annual
energy consumption was extrapolated from the study period to a full year.
According to plant personnel, the Grimmway Farms air compressor system remains pressurized
24 hours per day, 7 days per week. Therefore, the number of annual hours used for all calculations
was 8,736, which assumed one day of complete plant shutdown. The annual energy cost to operate
only the compressors was calculated at the usage rate of $0.084 per kWh. Table 1 and Figure 2
illustrate the data collection findings.
Incentive Details
Grimmway Farms received a substantial
rebate of $65,482 (55% of the total project
cost) from Pacific Gas & Electric’s Ecos
Air Program. This innovative program
works with industrial facilities on behalf of
a utility to search for users of compressed
air, coordinate walkthroughs and site
audits, manage all applications and forms,
establish flow and kW baseline parameters,
develop a financial summary with payback
and verify final conditions to ensure that
the savings claimed by the utility are
genuine and verifiable when reporting
to their utility commission.
While there are many utilities that provide
kWh reduction incentives for customers
that implement efficiency measures,
the process is normally administered
by either the customers themselves
or by the equipment vendor. Alternatively,
the Ecos Air Program has been developed
for utilities willing to fund a vendor-neutral
third-party contractor to implement an
efficiency incentive program for industrial
system compressed air users. In this case,
the utility simply establishes a financial
budget and leaves program execution
to Ecos Air.
Figure 2 — Typical Day Profile
T H E S y S T E M A S S E S S M E N T O F T H E M O N T H Grimmway Farms Implements System Automation While Receiving an Incentive for 55% of the Total Project Cost
Table 1 — Baseline System Profile
SUSTAINABLE MANUFACTURING FEATURES® | 1 0 / 0 9
14 www.ai rbestpract ices .com
Issues with the System
Common to multiple compressor facilities without automated control systems or interconnected
piping, the Grimmway Farms compressed air system was not optimally matching compressor
output to system demand. Data collection proved this to be the case and multiple compressors
were found to be operating partially loaded and, therefore, not running at maximum efficiency.
The goal is to always have “base” compressors running at full load with “trim” units responding
to swings in demand, rather than operating two or more compressors at partial load. Additionally,
connecting the two separate compressed air systems would enable both loops to be supported
by compressors in either building. The major modifications recommended were as follows:
p Automate the entire air compressor system
p Open the 3" and 4" headers connecting Buildings D and A1 to allow the compressed air to feed either building
p Install the 200 hp (new) compressor and remove the 100 hp (unused) compressor
p Install a new refrigerated air dryer, flow controller, three flow meters and a dew point meter for the lowest dew point process
p Lower overall system pressure
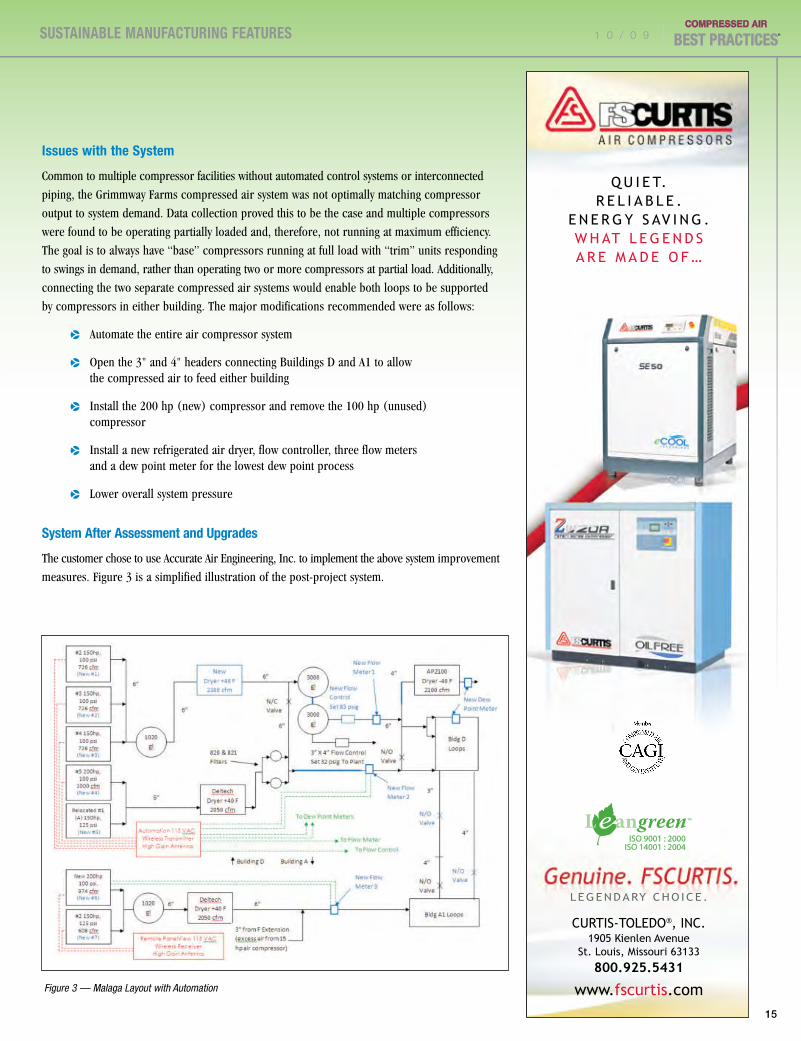
System After Assessment and Upgrades
The customer chose to use Accurate Air Engineering, Inc. to implement the above system improvement
measures. Figure 3 is a simplified illustration of the post-project system.
Figure 3 — Malaga Layout with Automation
SUSTAINABLE MANUFACTURING FEATURES ®1 0 / 0 9 |
15
Q U I E T.R E L I A B L E .
E n E R g y S Av I n g .W H AT L E g E n d S A R E m A d E o f …
cURTIS-ToLEdo®, Inc.1905 Kienlen Avenue
St. Louis, missouri 63133
800.925.5431
www.fscurtis.com
LEgEndARy cHo IcE .
May09-CABP.indd 1 5/5/09 11:04:03 AM

The original compressor #1 (100 hp)
in Building D was removed, as was
the flow controller in Building A1.
The new 200 hp compressor was
installed in Building A in place
of one of the 150 hp compressors,
which was relocated into Building D.
A central Gardner Denver control system was installed to automate all
compressors in the system. This control system enables the compressors
to operate within a narrow dead-band and at a lower pressure using a “Base
Load and Trim” strategy. Compressors are now initiated only when needed in
a fixed (last-in/first-out) order sequence. For convenience, the compressors
were renumbered (Table 2).
The combined systems’ “trim” station includes compressors #1, #2 and #3,
which now operate from 84–98 pisg (rather than 98 psig). They discharge
into the 1,020-gallon wet receiver before entering into a new refrigerated
air dryer. Next, the air enters the combined 3,000-gallon dry receivers
(the GD air dryer was removed and the two 3,000-gallon receivers
connected) before flowing through a new 3,200 cfm flow controller/
demand expander set at 83 psig ± 1 psig, which is maintained with
a full PID digital control loop connected to the automation panel.
Building D’s “base” compressors, #4 and #5, connect to the main
supply header downstream of the new “trim” flow controller. Building
A’s compressors, #6 and #7, are also part of the “base” station and
now feed both Building D and Building A. All “base” compressors, which
originally operated from 98–107 psig, now operate 100% loaded at 83 psig.
This is due to the fact that they are piped in downstream of the new Building
D flow controller, which forces them to operate 100% loaded at a pressure
that is lower than their design, enabling them to deliver the same flow using
less power.
Control Scheme
To determine “trim” compressor loading, rate-of-change pressure
is calculated and monitored at the two trim station 3,000-gallon air
receivers. “Base” compressor loading is determined by downstream
pressure in the plant.
From a zero flow point and with compressed air demand rising, the #1
(150 hp) “trim” compressor starts and runs load/no-load until fully loaded.
When system demand exceeds the capacity of the #1 air compressor (rate
of decay in 3,000 x 2 gallons = negative), the #3 (150 hp) “trim” air
compressor will start and run load/no-load until it, too, is fully loaded.
When system demand exceeds the capacity of the #1 and #3 (300 hp total)
compressors, the #7 (150 hp) “base” compressor will start. The #1 and
#3 air compressors will respond by unloading until the demand exceeds the
new #7 air compressor. As load again increases, the “trim” compressors
begin to load as described in the previously listed steps.
When the demand exceeds the capacity of the #1, #3 and #7 compressors
(450 hp total), the #4 (200 hp) “trim” compressor initiates. Again, the steps
listed above for the “trim” air compressors will repeat, and any additional
demand will initiate the #5 (150 hp) compressor and, finally, the #6
(200 hp) air compressor. The #2 (150 hp) “trim” air compressor will start
if another “trim” compressor fails, if any other air compressor fails and
the demand is greater than the output of the operating air compressor(s)
or if the demand exceeds the capacity of all other air compressors.
“Base” compressors drop out when the demand expander is 100% closed,
“trim” compressors are unloaded and the system pressure rises to 1.5 psig
above the demand expander set-point, or 84.5 psig.
Table 2 — Summary of Compressor Ratings, Location and Use
T H E S y S T E M A S S E S S M E N T O F T H E M O N T H Grimmway Farms Implements System Automation While Receiving an Incentive for 55% of the Total Project Cost
kW
CO2 “As a result of the above changes to Grimmway Farm’s
compressed air system, compressor output more closely matches system demand, and continued energy costs have
been reduced by approximately $64,000 annually.”— Patricia Boyd, Ecos Air
SUSTAINABLE MANUFACTURING FEATURES® | 1 0 / 0 9
16 www.ai rbestpract ices .com
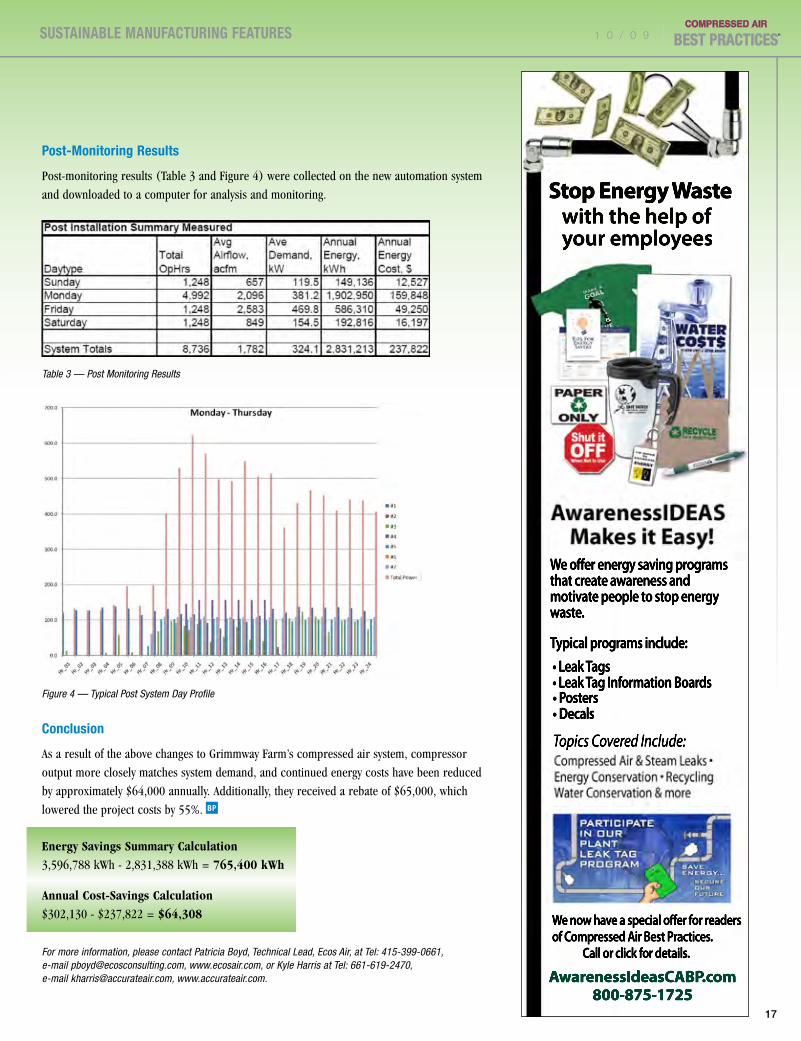
Post-Monitoring Results
Post-monitoring results (Table 3 and Figure 4) were collected on the new automation system
and downloaded to a computer for analysis and monitoring.
Conclusion
As a result of the above changes to Grimmway Farm’s compressed air system, compressor
output more closely matches system demand, and continued energy costs have been reduced
by approximately $64,000 annually. Additionally, they received a rebate of $65,000, which
lowered the project costs by 55%.
Energy Savings Summary Calculation3,596,788 kWh - 2,831,388 kWh = 765,400 kWh
Annual Cost-Savings Calculation$302,130 - $237,822 = $64,308
For more information, please contact Patricia Boyd, Technical Lead, Ecos Air, at Tel: 415-399-0661, e-mail [email protected], www.ecosair.com, or Kyle Harris at Tel: 661-619-2470, e-mail [email protected], www.accurateair.com.
Table 3 — Post Monitoring Results
Figure 4 — Typical Post System Day Profile
SUSTAINABLE MANUFACTURING FEATURES ®1 0 / 0 9 |
17
AwarenessIdeasCABP.com800-875-1725
Stop Energy Wastewith the help of your employees
We offer energy saving programs that create awareness and motivate people to stop energy waste.
Typical programs include: • Leak Tags • Leak Tag Information Boards • • Posters • Decals
Topics Covered Include:
We now have a special offer for readersof Compressed Air Best Practices. Call or click for details.

S e v e n S u S t a i n a b i l i t y P r o j e c t S f o r i n d u S t r i a l e n e r g y S a v i n g S
Heat-Reclaim Economics of Air- and Water-Cooled Air CompressorsBy MIkE WLODARSkI, HyDROTHRIFT CORPORATION
Introduction
It is widely recognized that compressed air systems account for 10% of all electricity, and roughly 16% of United States industrial motor system energy use. Seventy-percent of all manufacturing facilities in the U.S. use compressed air to drive a variety of process equipment. (1)
There are many ways that compressed air users can reduce their energy costs through air audits and by eliminating wasteful air-consuming processes, which can lead to a 10–15% system energy reduction, with simple paybacks in less than two years. (2)
System operators should also examine if reduced system pressure could be used. Use of a central control system can more effectively stage the existing air compressors to cyclical demand. Increased storage capacity can also reduce the unnecessary high-demand cycling of compressors.
This article is mainly directed at identifying and quantifying the potential for heat reclaim from the air compressors themselves. Both air-cooled and water-cooled air compressors can be used to provide cost savings in a manufacturing plant through the use of a properly designed and sized heat-reclamation system.
kW
CO2
1. Metering
2. Demand Control
3. HVAC Optimization
4. Compressed Air
5. Lighting
6. Heat Recovery
7. Project Implementation and Funding
Seven key Sustainability Projects
SUSTAINABLE MANUFACTURING FEATURES® | 1 0 / 0 9
18 www.ai rbestpract ices .com
For more than 30 years, HydroThrift has been building industry-leadingcooling systems, designed and manufactured with careful attention toquality. With more than 15,000 thermal transfer systems installed aroundthe globe, HydroThrift has built a reputation for quality and integrity thatis second to none. Every HydroThrift system is guaranteed to work asquoted, providing customers with peace of mind.
DESIGNERS ANDMANUFACTURERSOF ENGINEEREDEQUIPMENT THATWITHSTANDS THEMOST DEMANDINGENVIRONMENTS.
HydroThrift’s experienced engineers design eachsystem to meet the most rigorous demands. Customdesigned OEM solutions are also available, makingHydroThrift the right choice for nearly any application.
HydroThrift is well-versed in all types of process cooling, process heating and custom heat recovery systems. Whether you need a standard system or a custom-engineered solution, HydroThrift’s experienced sales, engineering and manufacturing staff can help. HydroThrift will analyze the application and recommend or engineer a solution for your process cooling or heating needs. Custom design proposals are provided with no extra or hidden engineering fees.
If required, local representatives are available for on-site calls and start-up assistance. Private labeling is alsoavailable.
telephone: 330-837-5141 Fax: 330-837-0558 www.hydrothrift.com
about Hydrothrift
capabilities
telephone: 330-837-5141 Fax: 330-837-0558 www.hydrothrift.comtelephone: 330-837-5141 Fax: 330-837-0558 www.hydrothrift.com
HydroThrift’s experienced engineers design eachsystem to meet the most rigorous demands. Customdesigned OEM solutions are also available, makingHydroThrift the right choice for nearly any application.
HydroThrift’s experienced engineers design eachsystem to meet the most rigorous demands. Customdesigned OEM solutions are also available, makingHydroThrift the right choice for nearly any application.
HydroThrift is well-versed in all types of process cooling, process heating and custom heat recovery systems. Whether you need a standard system or a custom-engineered solution, HydroThrift’s experienced sales, engineering and manufacturing staff can help. HydroThrift will analyze the application and recommend or engineer a solution for your process cooling or heating needs. Custom design proposals are provided with no extra or hidden engineering fees.
If required, local representatives are available for on-site calls and start-up assistance. Private labeling is alsoavailable.
capabilitiescapabilities
DESIGNERS ANDMANUFACTURERSOF ENGINEEREDEQUIPMENT THATWITHSTANDS THEMOST DEMANDINGENVIRONMENTS.
DESIGNERS ANDMANUFACTURERSOF ENGINEEREDEQUIPMENT THATWITHSTANDS THEMOST DEMANDINGENVIRONMENTS.
For more than 30 years, HydroThrift has been building industry-leadingcooling systems, designed and manufactured with careful attention toquality. With more than 15,000 thermal transfer systems installed aroundthe globe, HydroThrift has built a reputation for quality and integrity thatis second to none. Every HydroThrift system is guaranteed to work asquoted, providing customers with peace of mind.

Calculating Reclaimable BTUs
It is possible to reduce your plant’s total “carbon footprint”, energy consumption and operating costs by recovering the excess heat air that compressors produce.
The electric motor puts energy into the compressed air stream through the compression process. Motor power is typically rated in horsepower. One horsepower is the equivalent of 2,545 BTU per hour. Although most air compressors are sold in nominal horsepower sizes, they generally can operate at loads 10% above the motor nameplate rating to achieve rated compressor discharge pressure and full capacity output. The horsepower at the compressor shaft, also referred to as brake horsepower (bhp), can be 10% above motor nameplate horsepower and consume most of the motor’s 1.15 service factor safely. Therefore, a 100 hp compressor (110 bhp) converts electricity into almost 280,000 BTU per hour at full load. In addition, the air-cooled motor itself, having an assumed efficiency of 93%, dissipates an additional 19,600 BTU of heat per hour.
The air compressor increases the pressure and proportionately reduces the volume of the air. The energy potential of the original entering air is now at a much higher level due to the increased pressure, ready to do work downstream in the compressed air system.
It is possible to extract, by heat transfer, as much as 80–90% of the energy that the electric motor placed into the compressed air. Heat must be removed to maintain the compressor tolerances and clearances, and the compressed air usually must be cooled to make it suitable for most processes. The compressed air still contains energy to do useful work, even after the excess heat has been removed.
Heat and work are two different methods of transferring energy. After the compression process increases the air pressure and raises its temperature, the amount of energy not used as work, the excess heat of compression, is now available for reuse. Unfortunately, most facilities now “dump” this excess heat outside when they could be reusing it and reducing operating costs.
The most common uses for the recovered energy include industrial process heating, supplemental space heating, makeup air heating, domestic or process hot water heating or boiler make-up water pre-heating.
Air-Cooled Air Compressors
Typically, the heat-reclaim potential from an air-cooled compressor has been limited to supplemental space heating. When considering the use of air-cooled compressors, properly sized ductwork and the use of booster fans to direct the heat being reclaimed from a central compressor room to the needed location of the reclaimed heat can be a significant expense.
Many times, the air-cooled compressors are relegated to “boiler rooms” that do not have proper ventilation. These centralized compressors can experience elevated operating temperatures that reduce equipment life, increase maintenance and repair cost and, ultimately, potentially yield an unreliable air system. The initial cost of a good ventilation system is usually far less than the ongoing, increased maintenance costs of a hot operating environment. It is advisable to consult with HVAC experts to ensure proper ventilation, and to evaluate possible heat-recovery opportunities with air-cooled compressors.
The larger the air compressor system, the harder it is to reclaim a majority of the generated heat, due to the large air flows required. At 250 bhp, an air-cooled air compressor will generate about 636,000 BTU/Hr of heat. This will require about 15,000 cfm of air movement.
The compressor ventilating system design should also consider the additional effect on the rest of the plant’s ventilating system, including heating, air conditioning and possible negative and positive pressures that can affect the performance of the air compressor.
Water-Cooled Air Compressors
The heat-reclaim potential from a water-cooled compressor has the flexibility to allow for varied forms of heat usage. There are two major types of water-cooled systems available: open-cooling loops and closed-cooling loops. Open-loop cooling is accomplished by using recirculating, open-loop cooling tower water, or once-through well water or city water, that is then discharged to the sewer or environment.
Once-Through Cooling Systems
Once-through cooling systems can be effective at raising the temperature of the incoming water from 50 °F to about 90 °F, and can then be used for preheating boiler feed water, domestic or process-heated water. This water must eventually be discharged to a sanitary sewer, or a permit for discharging to the environment must be obtained. Since the water is not treated, scale buildup from dissolved solids and potential corrosion of the air compressor heat exchanger must be factored into the life-cycle maintenance costs of an air compressor system.
The cost of discharging this water can be more expensive than the incoming cost of water due to the sewer fees, environmental testing and permits and possible treatment required.
S E V E N S U S T A I N A B I L I T y P R O j E C T S F O R I N D U S T R I A L E N E R G y S A V I N G S
SUSTAINABLE MANUFACTURING FEATURES® | 1 0 / 0 9
20 www.ai rbestpract ices .com

Recirculating Open-Loop Cooling Systems
Cooling towers are the most common form of this type of system. These systems utilize the principle of evaporation to cool the water to below-ambient dry-bulb conditions. Most tower systems are designed to provide 85 °F cooling water in the U.S., based upon a 75–78 °F wet-bulb temperature.
A cooling tower will drastically reduce the amount of water consumption compared to a once-through system. They have, however, the requirement of additional water treatment costs to reduce the potential for:
p Scale from the higher concentration of dissolved solids in the cooling water
p Potential biological contamination of the cooling water from algae and bacteria
p Increased filtration of the cooling water from the atmospheric dirt and debris blown into the water from the tower fans
Most cooling towers are designed for a 10 °F rise in temperature — but can be designed to go higher. The scale formation potential is increased as the temperature of the water goes up. Care must be used to make sure the hot water does not exceed the temperature rating of the PVC fill that is in most cooling towers to avoid decomposition of the fill.
Open-loop cooling water can be used for preheating boiler feed water, domestic or process-heated water. It might be used for space heating potential, but the typical lower inlet temperatures (95° F) produce a lower-grade heated air from the cooling coil that is sometimes considered “too cool”.
Also, at these lower temperatures the surface area of the coil is larger to enable proper heat extraction. Tower water should not be used to temper building make-up air because when the inlet ambient temperature is below freezing, there is a strong chance that the coils might freeze.
Closed-Loop Recirculating Cooling System
There are four main types of closed-loop cooling systems that are available: dry type, dry type with trim cooler, evaporative type and water-to-water heat exchanger systems.
The main advantage of all of these systems is that, since they are closed-loop, you can almost eliminate water-caused maintenance issues with your compressors. Besides the initial expense of filling them with an ethylene or propylene glycol mixture with corrosion inhibitors, they require no ongoing water treatment, except for checking the concentration yearly for your winter ambient air conditions and to verify the proper pH levels.
Since the compressor heat exchangers will remain virtually scale free, one can take a higher temperature differential across the compressors heat exchangers without loss of cooling to the equipment. Most compressors are designed to allow for a 25–30 °F rise in temperature across a clean heat exchanger. If a new closed-loop cooling system is retrofitted to an existing system that previously was on an open-cooling water loop, the heat exchanger must be cleaned before placement on a new closed-loop cooling system.
Closed-loop systems enable better space heating potential because of the higher fluid temperatures returning from the load. These higher temperatures allow the discharge air from the heat reclaim coils to typically be in the high 90 °F range. Again, with a higher operating system temperature, the size of the cooling coil can be reduced and still enable proper cooling of the air compressor cooling fluid. Also, since they will have the proper solution of glycol for protection from freezing in winter conditions, they could be used for preheating make-up air on a central air handler.
A Closed-loop Evaporative Cooler System
A Closed-loop Heat Exchanger
A Closed-loop Dry Cooler
SUSTAINABLE MANUFACTURING FEATURES ®1 0 / 0 9 |
21 www.ai rbestpract ices .com
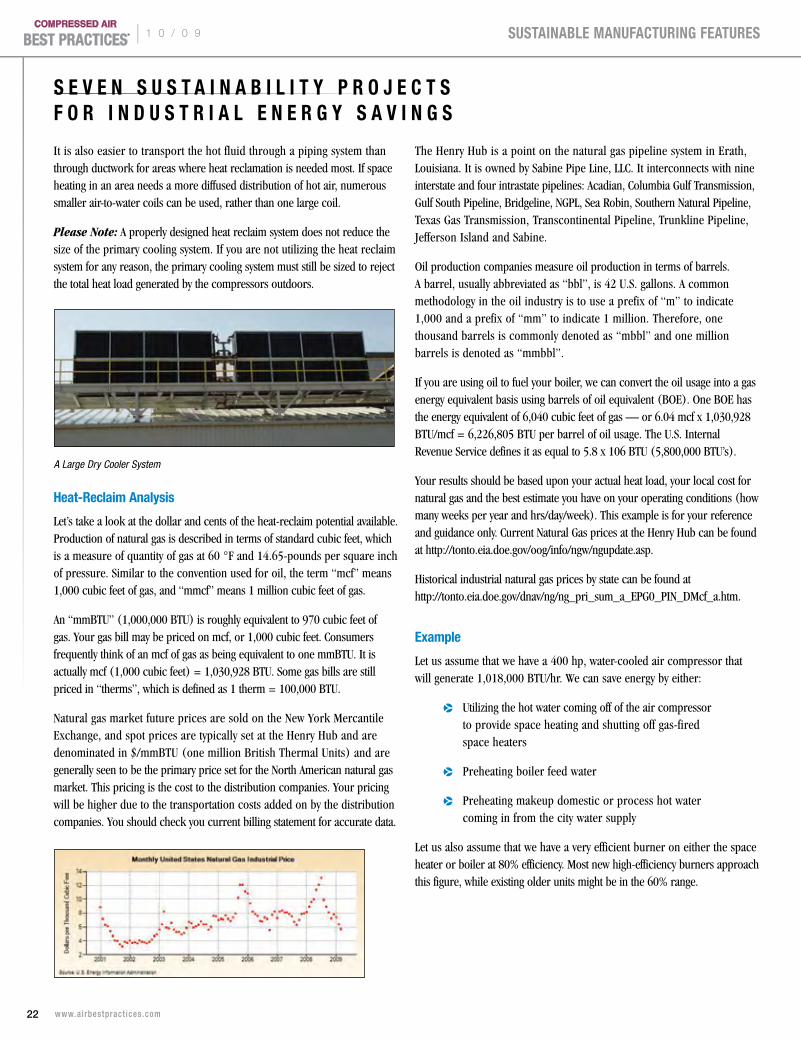
It is also easier to transport the hot fluid through a piping system than through ductwork for areas where heat reclamation is needed most. If space heating in an area needs a more diffused distribution of hot air, numerous smaller air-to-water coils can be used, rather than one large coil.
Please Note: A properly designed heat reclaim system does not reduce the size of the primary cooling system. If you are not utilizing the heat reclaim system for any reason, the primary cooling system must still be sized to reject the total heat load generated by the compressors outdoors.
Heat-Reclaim Analysis
Let’s take a look at the dollar and cents of the heat-reclaim potential available. Production of natural gas is described in terms of standard cubic feet, which is a measure of quantity of gas at 60 °F and 14.65-pounds per square inch of pressure. Similar to the convention used for oil, the term “mcf” means 1,000 cubic feet of gas, and “mmcf” means 1 million cubic feet of gas.
An “mmBTU” (1,000,000 BTU) is roughly equivalent to 970 cubic feet of gas. Your gas bill may be priced on mcf, or 1,000 cubic feet. Consumers frequently think of an mcf of gas as being equivalent to one mmBTU. It is actually mcf (1,000 cubic feet) = 1,030,928 BTU. Some gas bills are still priced in “therms”, which is defined as 1 therm = 100,000 BTU.
Natural gas market future prices are sold on the New York Mercantile Exchange, and spot prices are typically set at the Henry Hub and are denominated in $/mmBTU (one million British Thermal Units) and are generally seen to be the primary price set for the North American natural gas market. This pricing is the cost to the distribution companies. Your pricing will be higher due to the transportation costs added on by the distribution companies. You should check you current billing statement for accurate data.
The Henry Hub is a point on the natural gas pipeline system in Erath, Louisiana. It is owned by Sabine Pipe Line, LLC. It interconnects with nine interstate and four intrastate pipelines: Acadian, Columbia Gulf Transmission, Gulf South Pipeline, Bridgeline, NGPL, Sea Robin, Southern Natural Pipeline, Texas Gas Transmission, Transcontinental Pipeline, Trunkline Pipeline, Jefferson Island and Sabine.
Oil production companies measure oil production in terms of barrels. A barrel, usually abbreviated as “bbl”, is 42 U.S. gallons. A common methodology in the oil industry is to use a prefix of “m” to indicate 1,000 and a prefix of “mm” to indicate 1 million. Therefore, one thousand barrels is commonly denoted as “mbbl” and one million barrels is denoted as “mmbbl”.
If you are using oil to fuel your boiler, we can convert the oil usage into a gas energy equivalent basis using barrels of oil equivalent (BOE). One BOE has the energy equivalent of 6,040 cubic feet of gas — or 6.04 mcf x 1,030,928 BTU/mcf = 6,226,805 BTU per barrel of oil usage. The U.S. Internal Revenue Service defines it as equal to 5.8 x 10⁶ BTU (5,800,000 BTU’s).
Your results should be based upon your actual heat load, your local cost for natural gas and the best estimate you have on your operating conditions (how many weeks per year and hrs/day/week). This example is for your reference and guidance only. Current Natural Gas prices at the Henry Hub can be found at http://tonto.eia.doe.gov/oog/info/ngw/ngupdate.asp.
Historical industrial natural gas prices by state can be found at http://tonto.eia.doe.gov/dnav/ng/ng_pri_sum_a_EPG0_PIN_DMcf_a.htm.
Example
Let us assume that we have a 400 hp, water-cooled air compressor that will generate 1,018,000 BTU/hr. We can save energy by either:
p Utilizing the hot water coming off of the air compressor to provide space heating and shutting off gas-fired space heaters
p Preheating boiler feed water
p Preheating makeup domestic or process hot water coming in from the city water supply
Let us also assume that we have a very efficient burner on either the space heater or boiler at 80% efficiency. Most new high-efficiency burners approach this figure, while existing older units might be in the 60% range.
A Large Dry Cooler System
S E V E N S U S T A I N A B I L I T y P R O j E C T S F O R I N D U S T R I A L E N E R G y S A V I N G S
SUSTAINABLE MANUFACTURING FEATURES® | 1 0 / 0 9
22 www.ai rbestpract ices .com
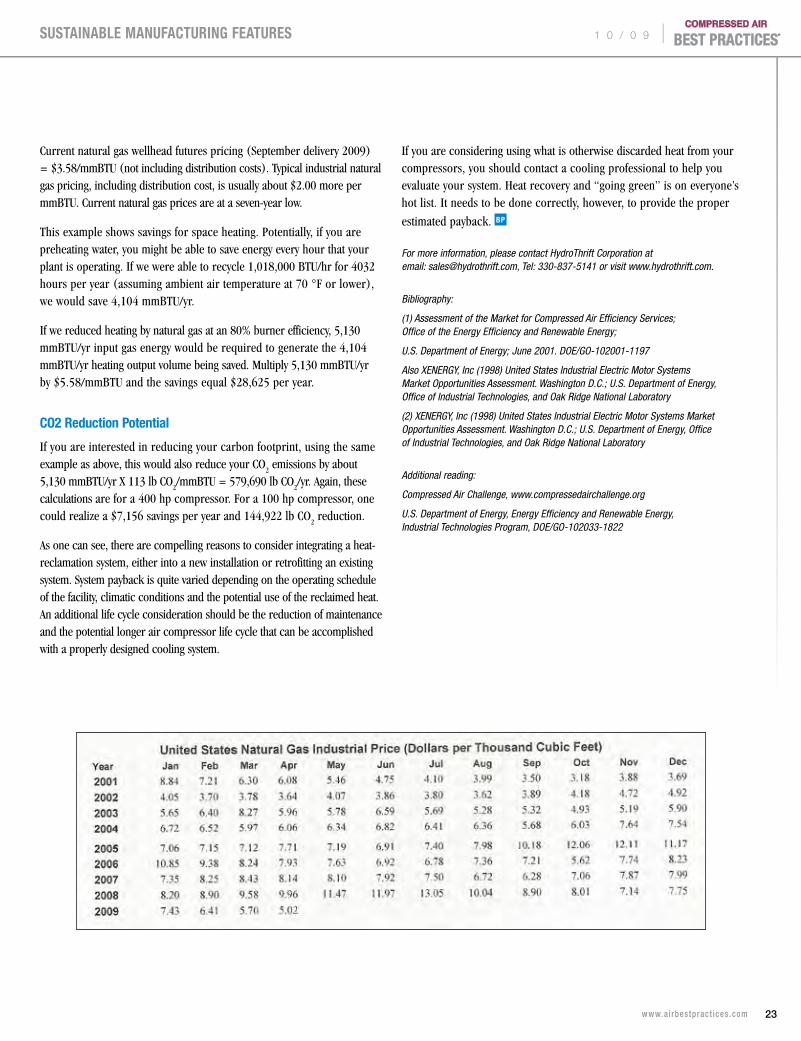
Current natural gas wellhead futures pricing (September delivery 2009) = $3.58/mmBTU (not including distribution costs). Typical industrial natural gas pricing, including distribution cost, is usually about $2.00 more per mmBTU. Current natural gas prices are at a seven-year low.
This example shows savings for space heating. Potentially, if you are preheating water, you might be able to save energy every hour that your plant is operating. If we were able to recycle 1,018,000 BTU/hr for 4032 hours per year (assuming ambient air temperature at 70 °F or lower), we would save 4,104 mmBTU/yr.
If we reduced heating by natural gas at an 80% burner efficiency, 5,130 mmBTU/yr input gas energy would be required to generate the 4,104 mmBTU/yr heating output volume being saved. Multiply 5,130 mmBTU/yr by $5.58/mmBTU and the savings equal $28,625 per year.
CO2 Reduction Potential
If you are interested in reducing your carbon footprint, using the same example as above, this would also reduce your CO
2 emissions by about
5,130 mmBTU/yr X 113 lb CO2/mmBTU = 579,690 lb CO
2/yr. Again, these
calculations are for a 400 hp compressor. For a 100 hp compressor, one could realize a $7,156 savings per year and 144,922 lb CO
2 reduction.
As one can see, there are compelling reasons to consider integrating a heat- reclamation system, either into a new installation or retrofitting an existing system. System payback is quite varied depending on the operating schedule of the facility, climatic conditions and the potential use of the reclaimed heat. An additional life cycle consideration should be the reduction of maintenance and the potential longer air compressor life cycle that can be accomplished with a properly designed cooling system.
If you are considering using what is otherwise discarded heat from your compressors, you should contact a cooling professional to help you evaluate your system. Heat recovery and “going green” is on everyone’s hot list. It needs to be done correctly, however, to provide the proper
estimated payback.
For more information, please contact HydroThrift Corporation at email: [email protected], Tel: 330-837-5141 or visit www.hydrothrift.com.
Bibliography:
(1) Assessment of the Market for Compressed Air Efficiency Services; Office of the Energy Efficiency and Renewable Energy;
U.S. Department of Energy; June 2001. DOE/GO-102001-1197
Also XENERGY, Inc (1998) United States Industrial Electric Motor Systems Market Opportunities Assessment. Washington D.C.; U.S. Department of Energy, Office of Industrial Technologies, and Oak Ridge National Laboratory
(2) XENERGY, Inc (1998) United States Industrial Electric Motor Systems Market Opportunities Assessment. Washington D.C.; U.S. Department of Energy, Office of Industrial Technologies, and Oak Ridge National Laboratory
Additional reading:
Compressed Air Challenge, www.compressedairchallenge.org
U.S. Department of Energy, Energy Efficiency and Renewable Energy, Industrial Technologies Program, DOE/GO-102033-1822
SUSTAINABLE MANUFACTURING FEATURES ®1 0 / 0 9 |
23 www.ai rbestpract ices .com

T h e T e c h n o l o g y P r o v i d e r Easy-to-Implement Master Control and Monitoring SystemsBy jAN HOETzEL, SIGA GREEN TECHNOLOGIES
Introduction
Compressed air is one of the most expensive energy sources used in our industrial plants. However,
most compressed air systems have large energy savings potential. Easy-to-implement master control
and monitoring systems provide crucial system information, including the key performance indicators
required to manage air compressors and their associated energy costs. Master control systems run air
compressors based on actual air demand and automatically select the most energy efficient compressor
combination. They reduce unwanted unload running time and wasted energy, regardless of air demand,
and continuously provide essential compressed air performance and cost information.
The Problem
Most segments of industry continue to have little information on what their compressed air system
is doing. Little performance and efficiency data or cost information is available for a very expensive
system. Accurate data to charge compressed air costs to different departments in the facility is not
retrievable. It is common to have compressed air cost assigned to departments by using the amount
of square feet a process, or a department, uses in the factory — not the amount of compressed air
it uses! This provides no incentive to save compressed air at the department level.
Multiple air compressors are installed in most facilities. As the facility grows, more air compressors
are added. It is common to see more than one air compressor room serving the facility with a complete
lack of an overall air compressor control strategy.
Jan Hoetzel, General Manager, SIGA Green Technologies
SUSTAINABLE MANUFACTURING FEATURES® | 1 0 / 0 9
24 www.ai rbestpract ices .com

The first Airleader air compressor
control was invented twenty years ago
in Germany by Mr. Werner Weidner of WF
Steuerungstechnik GmbH. Mr. Weidner
founded WF Steuerungstechnik GmbH with
the clear company mission of improving
the efficiency of air compressor systems through intelligent compressor controls. Today, the
Airleader product family consists of different air compressor controls, monitoring systems and
data loggers for compressed air system audits. Based in southern Germany, the technology
is private-labeled for air compressor manufacturers, sold to distributors and also delivered
directly to end users as part of compressed air audits. Our tremendous success in Europe,
with more than 6,000 units sold, as well as the positive feedback from our clients, dealers
and OEM customers, gave WF Steuerungstechnik the confidence to go overseas. In 2008,
WF Steuerungstechnik GmbH partnered with SIGA Green Technologies to bring the Airleader
product family to the North American market.
Confusion over Compressor Controls
As awareness of the energy costs related to
compressed air has grown, the end user has
been bombarded with information about the
on-board compressor controls. Each on-board
air compressor controller can optimize the
efficiency of that particular machine. Air
compressor controllers include modulation,
load/unload, inlet valve and variable-speed
drive controls.
What the individual compressor controller
cannot do, however, is work together with
the unique demands of the factory and all the
other installed air compressors in order to
optimize energy efficiency. For this, the market
offers net-pressure cascading controls, various
sequencers and master controllers. All of these
technologies can be effective in saving energy
under specific operating circumstances. However,
under different operating conditions such
as 2nd or 3rd shift, weekends or holidays, these
technologies will not save energy.
Many factory employees we speak to are confused
and frustrated by the lack of knowledge in how
to appropriately deploy compressor control
strategies. Some have installed sequencers, but
are not seeing energy savings and have turned
them off. Others have purchased variable speed
drive air compressors, but their energy bill
has not been reduced. Many end users do not
have the visibility they desire to manage the
compressed air system or to know if the control
strategies they have purchased are working.
While the various compressor control
technologies can deliver energy savings, the
difficulty lies with choosing the appropriate
application. Plant conditions change and
the compressor control can no longer
deliver the original results. There can also
be performance issues with specific air
compressors that arise, which result in the
control strategy not performing as desired.
Airleader Master Control and Monitoring
SUSTAINABLE MANUFACTURING FEATURES ®1 0 / 0 9 |
25 www.ai rbestpract ices .com
- Real-time demand based control- Web accessible monitoring and alerting - Ongoing system efficiency benchmarking- Continuous data logging and trending
Compressor Management
- Designed for compressed air systems- Easy evaluation, many tables and graphs - Verify savings for utility incentive programs- 8 channels, 1 second data recording
Visit us at the WEEC 2009, booth 639
[email protected]: (616) 828 0716
Technology Simplifies the Solution
My personal experience comes from working as a manager and engineer for Tier 2 automotive
suppliers. We recognized compressed air was a critical “4th Utility” in the facility and so we
focused primarily on whether or not we had enough compressed air to produce our products.
We knew we spent a lot of money to power the air compressors, but we did not have any
visibility into these costs.
The Airleader family of master control and monitoring products provided the solution. The
master controller will optimize compressor performance automatically, while the monitoring
provides the data required for a manager to visualize and manage the compressed air system
from the office.
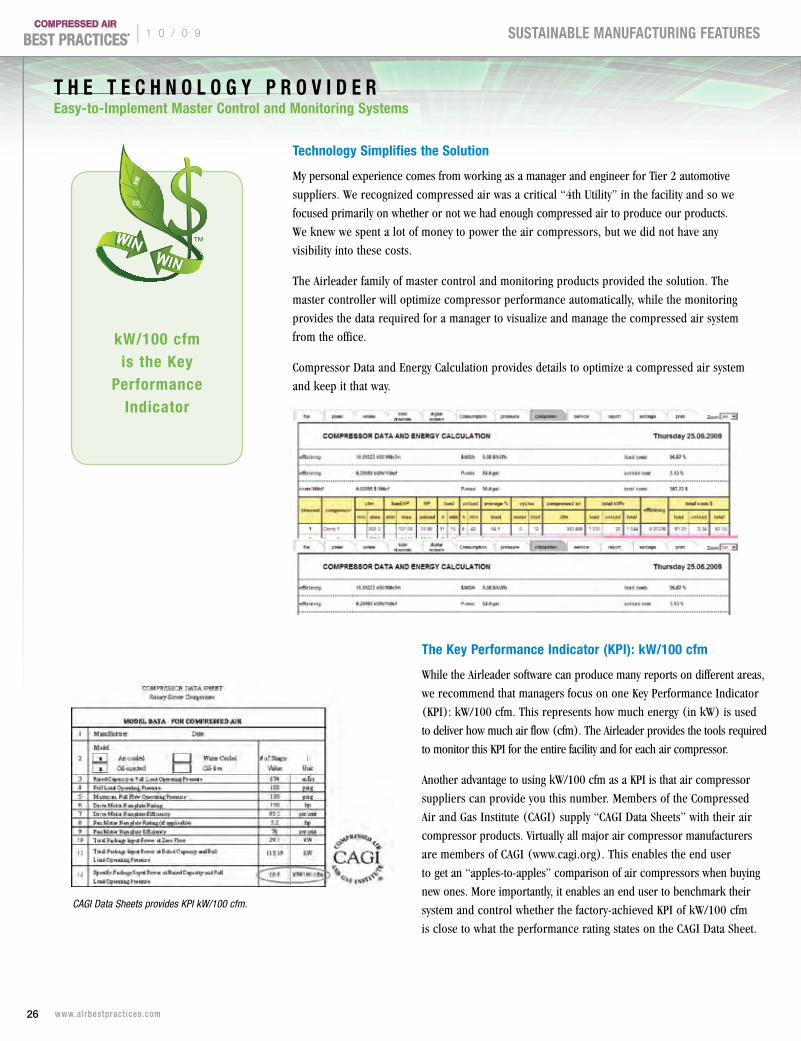
Compressor Data and Energy Calculation provides details to optimize a compressed air system
and keep it that way.
CAGI Data Sheets provides KPI kW/100 cfm.
T H E T E C H N O L O G y P R O V I D E REasy-to-Implement Master Control and Monitoring Systems
kW
CO2
kW/100 cfm is the key
Performance Indicator
The key Performance Indicator (kPI): kW/100 cfm
While the Airleader software can produce many reports on different areas,
we recommend that managers focus on one Key Performance Indicator
(KPI): kW/100 cfm. This represents how much energy (in kW) is used
to deliver how much air flow (cfm). The Airleader provides the tools required
to monitor this KPI for the entire facility and for each air compressor.
Another advantage to using kW/100 cfm as a KPI is that air compressor
suppliers can provide you this number. Members of the Compressed
Air and Gas Institute (CAGI) supply “CAGI Data Sheets” with their air
compressor products. Virtually all major air compressor manufacturers
are members of CAGI (www.cagi.org). This enables the end user
to get an “apples-to-apples” comparison of air compressors when buying
new ones. More importantly, it enables an end user to benchmark their
system and control whether the factory-achieved KPI of kW/100 cfm
is close to what the performance rating states on the CAGI Data Sheet.
SUSTAINABLE MANUFACTURING FEATURES® | 1 0 / 0 9
26 www.ai rbestpract ices .com
The Airleader Master Controller documents which air compressors
are most efficient. Each unit is monitored, and the manager is given
a detailed report including a kW/100 cfm for every air compressor.
As circumstances in the plant or with the air compressor change, the
master controller measures and monitors the performance of each
compressor and of the system. If the performance of a compressor
deteriorates, the master controller provides information and alerts.
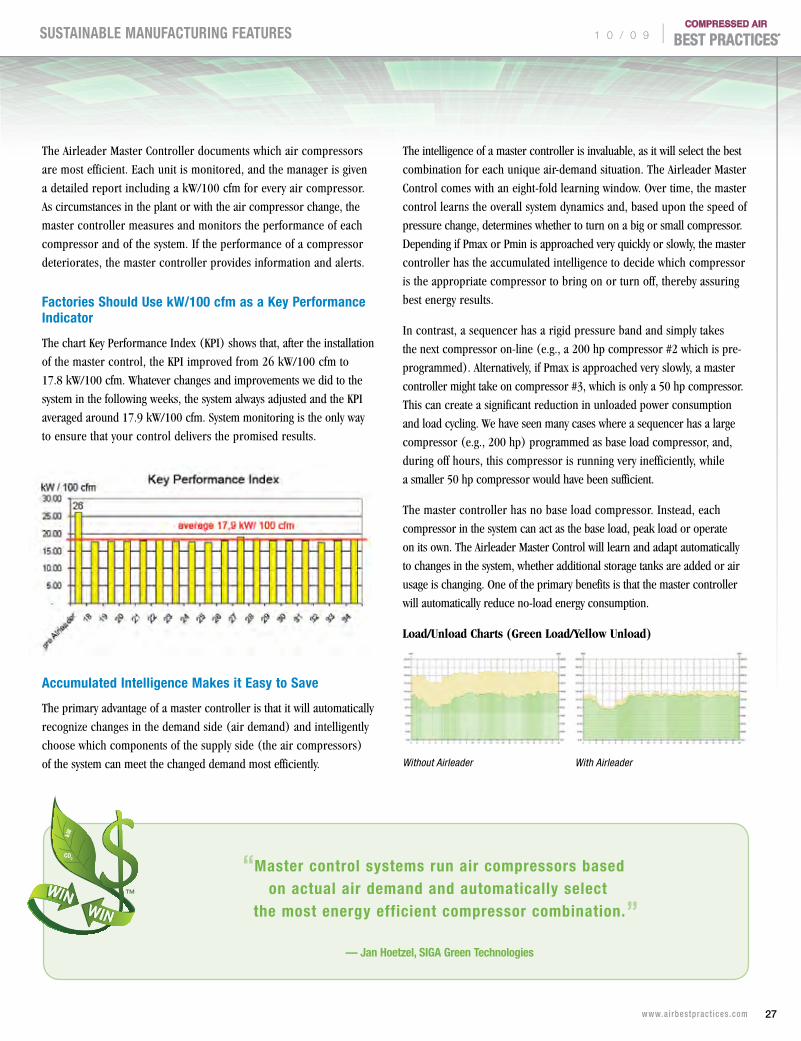
Factories Should Use kW/100 cfm as a key Performance Indicator
The chart Key Performance Index (KPI) shows that, after the installation
of the master control, the KPI improved from 26 kW/100 cfm to
17.8 kW/100 cfm. Whatever changes and improvements we did to the
system in the following weeks, the system always adjusted and the KPI
averaged around 17.9 kW/100 cfm. System monitoring is the only way
to ensure that your control delivers the promised results.
Accumulated Intelligence Makes it Easy to Save
The primary advantage of a master controller is that it will automatically
recognize changes in the demand side (air demand) and intelligently
choose which components of the supply side (the air compressors)
of the system can meet the changed demand most efficiently.
The intelligence of a master controller is invaluable, as it will select the best
combination for each unique air-demand situation. The Airleader Master
Control comes with an eight-fold learning window. Over time, the master
control learns the overall system dynamics and, based upon the speed of
pressure change, determines whether to turn on a big or small compressor.
Depending if Pmax or Pmin is approached very quickly or slowly, the master
controller has the accumulated intelligence to decide which compressor
is the appropriate compressor to bring on or turn off, thereby assuring
best energy results.
In contrast, a sequencer has a rigid pressure band and simply takes
the next compressor on-line (e.g., a 200 hp compressor #2 which is pre-
programmed). Alternatively, if Pmax is approached very slowly, a master
controller might take on compressor #3, which is only a 50 hp compressor.
This can create a significant reduction in unloaded power consumption
and load cycling. We have seen many cases where a sequencer has a large
compressor (e.g., 200 hp) programmed as base load compressor, and,
during off hours, this compressor is running very inefficiently, while
a smaller 50 hp compressor would have been sufficient.
The master controller has no base load compressor. Instead, each
compressor in the system can act as the base load, peak load or operate
on its own. The Airleader Master Control will learn and adapt automatically
to changes in the system, whether additional storage tanks are added or air
usage is changing. One of the primary benefits is that the master controller
will automatically reduce no-load energy consumption.
Load/Unload Charts (Green Load/Yellow Unload)
Without Airleader With Airleader
kW
CO2 “Master control systems run air compressors based
on actual air demand and automatically select the most energy efficient compressor combination.”
— jan Hoetzel, SIGA Green Technologies
SUSTAINABLE MANUFACTURING FEATURES ®1 0 / 0 9 |
27 www.ai rbestpract ices .com
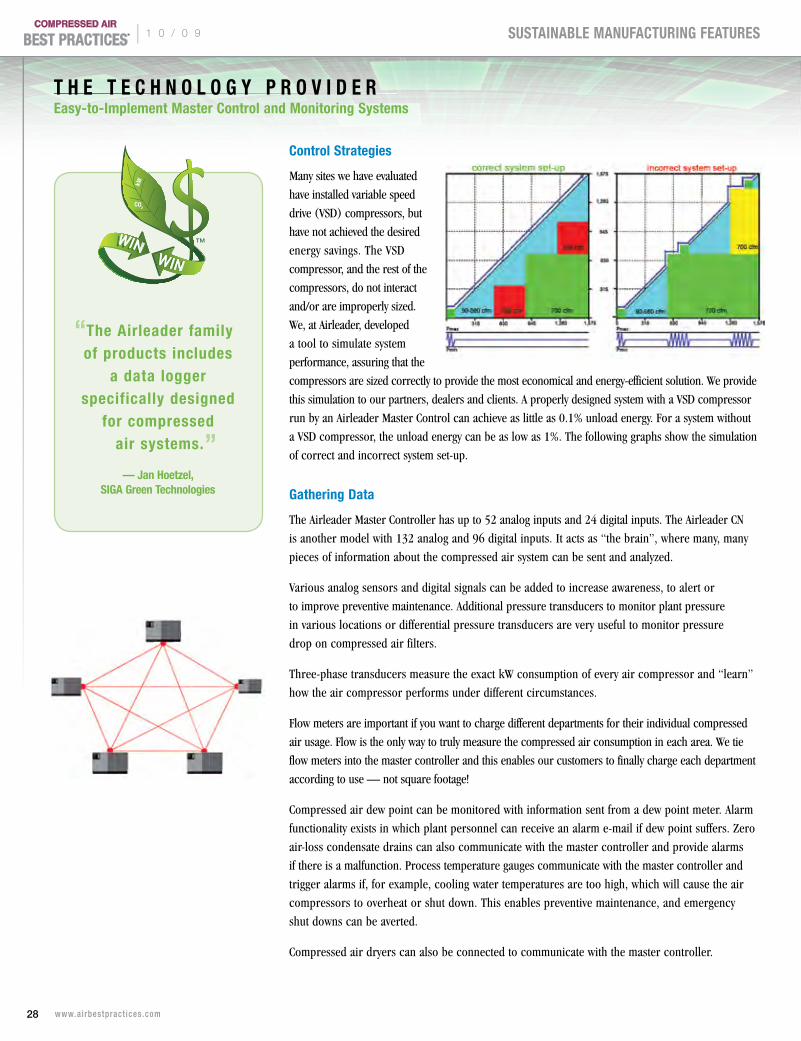
Control Strategies
Many sites we have evaluated
have installed variable speed
drive (VSD) compressors, but
have not achieved the desired
energy savings. The VSD
compressor, and the rest of the
compressors, do not interact
and/or are improperly sized.
We, at Airleader, developed
a tool to simulate system
performance, assuring that the
compressors are sized correctly to provide the most economical and energy-efficient solution. We provide
this simulation to our partners, dealers and clients. A properly designed system with a VSD compressor
run by an Airleader Master Control can achieve as little as 0.1% unload energy. For a system without
a VSD compressor, the unload energy can be as low as 1%. The following graphs show the simulation
of correct and incorrect system set-up.
Gathering Data
The Airleader Master Controller has up to 52 analog inputs and 24 digital inputs. The Airleader CN
is another model with 132 analog and 96 digital inputs. It acts as “the brain”, where many, many
pieces of information about the compressed air system can be sent and analyzed.
Various analog sensors and digital signals can be added to increase awareness, to alert or
to improve preventive maintenance. Additional pressure transducers to monitor plant pressure
in various locations or differential pressure transducers are very useful to monitor pressure
drop on compressed air filters.
Three-phase transducers measure the exact kW consumption of every air compressor and “learn”
how the air compressor performs under different circumstances.
Flow meters are important if you want to charge different departments for their individual compressed
air usage. Flow is the only way to truly measure the compressed air consumption in each area. We tie
flow meters into the master controller and this enables our customers to finally charge each department
according to use — not square footage!
Compressed air dew point can be monitored with information sent from a dew point meter. Alarm
functionality exists in which plant personnel can receive an alarm e-mail if dew point suffers. Zero
air-loss condensate drains can also communicate with the master controller and provide alarms
if there is a malfunction. Process temperature gauges communicate with the master controller and
trigger alarms if, for example, cooling water temperatures are too high, which will cause the air
compressors to overheat or shut down. This enables preventive maintenance, and emergency
shut downs can be averted.
Compressed air dryers can also be connected to communicate with the master controller.
T H E T E C H N O L O G y P R O V I D E REasy-to-Implement Master Control and Monitoring Systems
kW
CO2
“The Airleader family of products includes
a data logger specifically designed
for compressed air systems.”
— jan Hoetzel, SIGA Green Technologies
SUSTAINABLE MANUFACTURING FEATURES® | 1 0 / 0 9
28 www.ai rbestpract ices .com
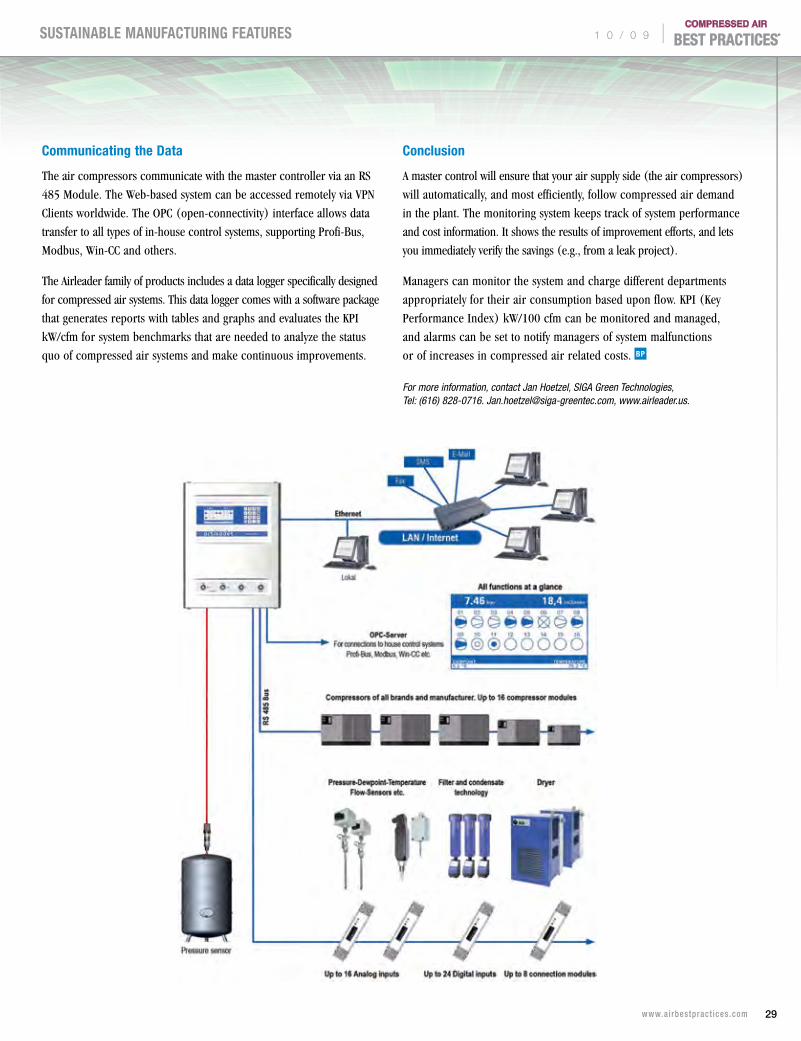
Communicating the Data
The air compressors communicate with the master controller via an RS
485 Module. The Web-based system can be accessed remotely via VPN
Clients worldwide. The OPC (open-connectivity) interface allows data
transfer to all types of in-house control systems, supporting Profi-Bus,
Modbus, Win-CC and others.
The Airleader family of products includes a data logger specifically designed
for compressed air systems. This data logger comes with a software package
that generates reports with tables and graphs and evaluates the KPI
kW/cfm for system benchmarks that are needed to analyze the status
quo of compressed air systems and make continuous improvements.
Conclusion
A master control will ensure that your air supply side (the air compressors)
will automatically, and most efficiently, follow compressed air demand
in the plant. The monitoring system keeps track of system performance
and cost information. It shows the results of improvement efforts, and lets
you immediately verify the savings (e.g., from a leak project).
Managers can monitor the system and charge different departments
appropriately for their air consumption based upon flow. KPI (Key
Performance Index) kW/100 cfm can be monitored and managed,
and alarms can be set to notify managers of system malfunctions
or of increases in compressed air related costs.
For more information, contact Jan Hoetzel, SIGA Green Technologies, Tel: (616) 828-0716. [email protected], www.airleader.us.
SUSTAINABLE MANUFACTURING FEATURES ®1 0 / 0 9 |
29 www.ai rbestpract ices .com
T h e T e c h n o l o g y P r o v i d e r Compressed Air Management Systems Assist Sustainability ProgramsBy COMPRESSED AIR BEST PRACTICES®
Compressed Air Best Practices® spoke with Mark Reed, President, and Dusty Smith, Director of Engineering, Pneu-Logic Corporation.
Good morning. How is “sustainability” changing the market for compressed air management systems?
Good morning. We are finding significant changes in the industry with regards to which managers are
involved in our discussions. With energy awareness and costs at high levels, we now find that “C-level”
executives and plant managers are becoming much more interested in compressed air systems and the
opportunities available to drive costs down. In the past, we sold compressor controls primarily to plant
engineers and maintenance managers who were very experienced in the operational aspects of production
systems. We now spend more time discussing energy-saving opportunities with chief operating officers
and chief executive officers, as well as with the plant team.
The second change is the topic itself. We are no longer simply discussing compressor controls. We are
examining compressed air management, as a whole, with the client. This involves topics like management
reporting with regards to kW consumption, dollar costs and greenhouse gas emissions.
This takes the conversation to the “C-level”, as we are impacting sustainability programs in a positive manner.
Executives are really interested in reducing their carbon footprint and eventually monetizing their carbon
credits. Our PL4000 technology can track and aggregate carbon credits. Now, you have a manageable tool
supporting a corporation’s ability to realize a payback on their energy initiatives.
What advances in application trends are you experiencing?
A significant advancement in application trends is in what we call “managing zones”. This is when
the compressed air management system provides the client with the ability to look at different “zones” in the
system. Some of our clients have an expansive compressed air network with two or three compressor rooms,
along with production floor compressors. Our PL4000 technology is being used to enable managers to break
up the network into separate “zones”, and monitor and manage them.
Zones can involve managing air quality. As an example, an aluminum extruder had a plant floor air
compressor providing compressed air to a painting process. Desiccant dryers were installed to provide the
low-dew point air required. The duty cycle was very intermittent, and the customer said they knew they were
“over-drying” the compressed air, which, in turn, was creating unnecessary energy costs. We worked with
them to make this process a “zone” we would manage with our technology. We placed dew point sensors
in-line, and were able to automate the performance of the desiccant dryers to avoid the unnecessary energy
costs — while maintaining the correct dew point. Alarm functions were also set up to send automatic alarm
emails to managers if dew point or energy costs deviated from the accepted specification for the zone.
SUSTAINABLE MANUFACTURING FEATURES® | 1 0 / 0 9
30 www.ai rbestpract ices .com

Zones can also be specific demand-side air users. A customer was experiencing abnormally high
maintenance and replacement costs on a pneumatic power wrench. Upon examination, the root cause
was that the wrench was receiving compressed air at a pressure of 100 psig — instead of the specified
45 psig. We placed pressure transducers at the location and started monitoring and managing
the pressure of this “zone” with very positive results.
What impact on maintenance costs can these management systems have?
That is a great question, because maintenance is a topic many people don’t think about when
discussing compressed air management systems. Our clients have found that maintenance
can be one of the largest beneficiaries of our systems!
Our compressed air management systems can enable users to switch from “time-based” to
“condition-based” maintenance programs for their installed air compressors and compressed air
treatment products. The technology will monitor actual usage patterns and data log the multiple air
compressors, dryers and filters. We can monitor run-time and oil temperature in the air compressors.
The technology will also automatically rotate air compressors to even out run-times.
Factories spend a lot of money on the consumables required to appropriately maintain their
compressed air equipment. By helping them switch to “condition-based” maintenance programs,
we can help them reduce these costs and improve productivity by reducing the number
of maintenance interruptions.
Are there any new trends with financing and/or rebates?
Our technology allows for exciting advancements in financing options. The measurement and data-
logging technology we deploy enables us to provide what we call “proof-statements” to our clients,
documenting the actual and verified performance of their compressed air system. When we compare
this to the data gathered during our base-lining studies, the customer is able to receive hard proof
of the realized energy savings and carbon emission reductions.
These more highly sophisticated measurements have helped us to develop new financing partners and
opportunities. We are developing a new program where customers do not need to supply any up-front
capital to install our systems. The customer makes their payments based upon documented energy
savings. We have a customer who is paying for their system, over a four-year period, based upon
the realized energy savings of our compressed air management system. This is a managed service,
guaranteeing ROI for the customer. We anticipate an increase in these types of contracts.
With regards to rebates, we are seeing more funds become available through BC Hydro and
other public utility departments that underwrite portions of big projects. For smaller systems,
the Oregon Energy Trust is very active here. We recently introduced new management products,
namely the PL500 and PL1000, designed for smaller compressed air systems. The Oregon Energy
Trust has us do a simple walk-through and then make a recommendation. The Trust will rebate
up to 50% of the equipment purchase cost for the customer. A third party does the verification
measurement for the Oregon Energy Trust.
Mark Reed, President of Pneu-Logic Corporation
Dusty Smith of Pneu-Logic tunes a PL4000 compressor management system
kW
CO2
“Our PL4000 technology can
track and aggregate carbon credits.”
— Mark Reed, President, Pneu-Logic
SUSTAINABLE MANUFACTURING FEATURES ®1 0 / 0 9 |
31 www.ai rbestpract ices .com

How do your systems interface with in-house controls?
We sell direct to strategic accounts like Weyerhaeuser, Toyota and FEMSA.
This will continue to be a big part of our strategy because it breeds customer
intimacy. Although we are primarily an engineering and technology firm,
it is critical that we remain close to major users so that we can continue
to develop ground-breaking technologies.
An example of this is what we call our “Distributed Compressor Module”.
We have given plant engineers at some of our strategic accounts access
to the invisibility files in our PLCs. We work with FEMSA, the brewery
operator, which has standardized on Allen Bradley PLCs. Boeing is another
corporation with a strong bias towards Allen Bradley platforms. They
appreciate our flexibility and technology capabilities in providing full
integration into their in-house systems. Our open systems and architecture
enables us to go into multi-vendor environments. We have a generic SCADA
server that accommodates most DCS systems that we encounter in the
United States through a Modbus TCP connection.
I see you have received an award for international sales?
Yes. In May of this year, we were honored to receive, from the City of
Portland, the Mayor’s International Business Award in the New Exporter
category. We have found demand for our technologies in foreign markets
like South Africa and Mexico, where customers are paying 15–20 cents per
kilowatt/hour. Industries that use a lot of compressed air, like pulp and paper,
mining, metal fabrication and Tier 2 automotive companies, have given
us the opportunity to do a lot of engineering work successfully with them.
What sales channels do you deploy?
Aside from our direct strategic accounts, we also have a large private
label agreement with Norgren. They have a business unit called Norgren
IQ “Technology by Pneu-Logic”. Norgren is using its global base
of customers and its expertise in pneumatics to take our technology
to market. We are also in the process of announcing a new OEM
agreement with a compressor manufacturer. Pneu-Logic also works
with select air compressor sales and service companies who are focused
on reducing the energy costs of their customers.
Let’s discuss technology. When is a lead/lag controller appropriate?
Pneu-Logic offers compressed air management solutions for all compressor
installations, large and small, as we recognize that each facility has a unique
set of circumstances. There is a lot of small manufacturing here in Oregon,
with 25 hp systems that can really benefit from these types of controls.
First, let’s define “lead/lag”. Inconsistency in the industry has created some
confusion around the usage of this term. We see “lead/lag” controllers as
potentially appropriate for installations with two air compressors — one
is lead (the base demand compressor) and one is lag (trim). Other firms
use lead/lag terminology for multiple air compressors, where one is lead and
multiple others are lag. Even more confusing is that some firms say lead/lag
and actually refer to lead as the trim compressor.
We feel it’s easier to think of trim and base controllers. That’s how we define
our PL500 pressure-based system. We find that there are far too many
compressor controllers that work off of electro-pneumatic controls (pressure
switches and/or timer relays). These systems are inexpensive to purchase,
but almost impossible to tune because of the pneumatic components, which
can have a wide range of tolerance.
There is a big advantage to using one pressure transducer vs. two or three
switches on traditional systems. Three mechanical components (pressure
switches) have to be set with a dial, and it is common to see them work
against each other. Another issue can be accuracy. The accuracy range may
be larger than the load/unload band. Within the HMI, you can visualize
what is happening to plant pressure from the single transducer, see the
compressor pressure and make decisions and tuning adjustments.
The Pneu-Logic PL500 uses a Web-based HMI with one pressure transducer
— which dictates control of both air compressors. It has a micro-controller,
permitting monitoring, reporting and management functions. Monitoring
individual load and unload, restart delays and pressure trending can all be
done through Internet Explorer. If you have a network, you can monitor what
is happening in your compressor room — even if you have “just” two small
air compressors.
A Pneu-Logic Master Controller Installed at a Lumber Mill
T H E T E C H N O L O G y P R O V I D E RCompressed Air Management Systems Assist Sustainability Programs
SUSTAINABLE MANUFACTURING FEATURES® | 1 0 / 0 9
32 www.ai rbestpract ices .com
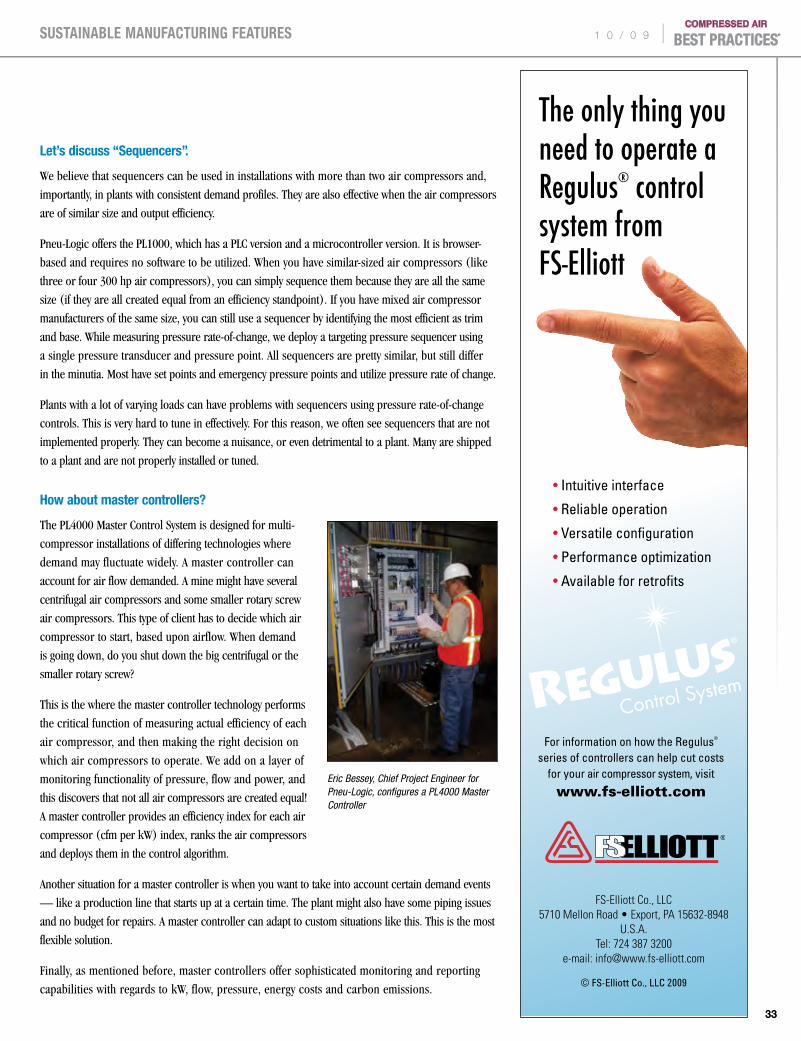
Let’s discuss “Sequencers”.
We believe that sequencers can be used in installations with more than two air compressors and,
importantly, in plants with consistent demand profiles. They are also effective when the air compressors
are of similar size and output efficiency.
Pneu-Logic offers the PL1000, which has a PLC version and a microcontroller version. It is browser-
based and requires no software to be utilized. When you have similar-sized air compressors (like
three or four 300 hp air compressors), you can simply sequence them because they are all the same
size (if they are all created equal from an efficiency standpoint). If you have mixed air compressor
manufacturers of the same size, you can still use a sequencer by identifying the most efficient as trim
and base. While measuring pressure rate-of-change, we deploy a targeting pressure sequencer using
a single pressure transducer and pressure point. All sequencers are pretty similar, but still differ
in the minutia. Most have set points and emergency pressure points and utilize pressure rate of change.
Plants with a lot of varying loads can have problems with sequencers using pressure rate-of-change
controls. This is very hard to tune in effectively. For this reason, we often see sequencers that are not
implemented properly. They can become a nuisance, or even detrimental to a plant. Many are shipped
to a plant and are not properly installed or tuned.
How about master controllers?
The PL4000 Master Control System is designed for multi-
compressor installations of differing technologies where
demand may fluctuate widely. A master controller can
account for air flow demanded. A mine might have several
centrifugal air compressors and some smaller rotary screw
air compressors. This type of client has to decide which air
compressor to start, based upon airflow. When demand
is going down, do you shut down the big centrifugal or the
smaller rotary screw?
This is the where the master controller technology performs
the critical function of measuring actual efficiency of each
air compressor, and then making the right decision on
which air compressors to operate. We add on a layer of
monitoring functionality of pressure, flow and power, and
this discovers that not all air compressors are created equal!
A master controller provides an efficiency index for each air
compressor (cfm per kW) index, ranks the air compressors
and deploys them in the control algorithm.
Another situation for a master controller is when you want to take into account certain demand events
— like a production line that starts up at a certain time. The plant might also have some piping issues
and no budget for repairs. A master controller can adapt to custom situations like this. This is the most
flexible solution.
Finally, as mentioned before, master controllers offer sophisticated monitoring and reporting
capabilities with regards to kW, flow, pressure, energy costs and carbon emissions.
Eric Bessey, Chief Project Engineer for Pneu-Logic, configures a PL4000 Master Controller
SUSTAINABLE MANUFACTURING FEATURES ®1 0 / 0 9 |
33 33
FS-Elliott Co., LLC 5710 Mellon Road • Export, PA 15632-8948
U.S.A.Tel: 724 387 3200
e-mail: [email protected]
© FS-Elliott Co., LLC 2009
For information on how the Regulus® series of controllers can help cut costs
for your air compressor system, visit
www.fs-elliott.com
The only thing you need to operate a Regulus® control system from FS-Elliott
• Intuitive interface
• Reliable operation
• Versatile configuration
• Performance optimization
• Available for retrofits
AirBestPractices Ad-3.indd 1 9/1/09 12:18 PM

Why do your master controllers focus on airflow?
We use air flow meters to get a reading on the air flow profile of the plant. We prefer mass
air flow meters that are pilot-tube type or thermal mass flow meters. Both technologies
are relatively inexpensive and have some measure of repeatable accuracy.
They must be installed at the exit of the compressor room, where one can measure total
air demand. You can put them on each air compressor or, if there is a common header
at the exit, you can put it there. If you have dryers that are purging, you should locate
the flow meter upstream as they are just another form of demand.
Once you know flow, you have choices that sequencers don’t have. You can now decide to trade
three air compressors for one. A sequencer always goes from compressor #1 to compressor
#2 to compressor #3 and so on — a master controller using flow gives you total flexibility.
How do you manage remote/differing locations?
Remote IO cards can be used to have one master controller manage multiple air compressors
in several locations. It’s almost always a hard-wire situation. We have used radio in a couple
of situations. We had a river and a major road separating compressor rooms once, and we
did use radio and industrial wireless solutions. The microcontrollers on the compressors
T H E T E C H N O L O G y P R O V I D E RCompressed Air Management Systems Assist Sustainability Programs
can function as the remote IO card in most
cases. Modbus protocol is popular in North
America, and PROFIBUS protocol is popular
in Europe. This is very cost effective, since
you don’t have to double-instrument. You
can use the pressure transducers native
to the air compressor, along with the
compressor’s remaining instrument set.
What lies in the future for Pneu-Logic?
Pneu-Logic is focused on reducing industrial
energy consumption. We estimate that, since
2005, we have helped our top 30 customers
save over $20 million in energy costs. We will
continue to develop technologies and sales
channels to keep achieving these goals.
This takes us back to the topic of “zones”.
If a plant engineer wants to manage compressed
air, refrigeration, steam and water in a common
consol, we expect in the future to help him break
the processes down into zones. We will provide
engineering with the same user interface and
track savings zone-by-zone. Pneu-Logic
is a management and control provider of all
these integrated services. We have started
with compressed air, and will evolve into other
processes where we can leverage our patents
and engineering capabilities.
For more information, please contact Mark Reed, Pneu-Logic Corporation, Tel: 503-718-0126, e-mail: [email protected], www.pneulogic.com.
SUSTAINABLE MANUFACTURING FEATURES® | 1 0 / 0 9
34 www.ai rbestpract ices .com

Evaluating Central Compressed Air Management SystemsBy HANk VAN ORMER, AIR POWER USA
The hardest part about evaluating the capabilities of various central air management control systems
for multiple pieces of compressed air equipment, specifically air compressors, is that, according
to their marketing sales materials, they all essentially do the same thing.
Productivity and profits are very directly linked to the compressed air system, as is waste elimination. High-
performance central compressed air management systems can respond quickly to even extreme system
fluctuations, improving productivity and minimizing energy waste. This is accomplished with modern software
systems that analyze and process appropriate data and trigger proactive actions — before the dynamics affect
the compressed air production system. This is an advancement, as compared to the old-style solution where
a central air system’s action occurs after an event or events. Do all central air management systems do this
with all units? No, they certainly don’t! To start with, ask appropriate questions:
p Can you handle positive displacement air compressors and dynamic (centrifugal)? Separately? Together?
p Can you handle all brands? All types of capacity controls? Old and new units?
p Will your central air system tie in with auxiliary equipment such as dryers, cooling towers, pumping stations and crossover valves (high pressure to low pressure)?
p Can the system be accessed remotely?
p Will it notify appropriate personnel for service if required?
p What is the data-analyzing protocol?
The list can go on and on, but in the end you will still have a lot of systems to look at and try to best
fit to your circumstances.
T h e S y S T e m A S S e S S m e n T
SUSTAINABLE MANUFACTURING FEATURES ®1 0 / 0 9 |
35 www.ai rbestpract ices .com
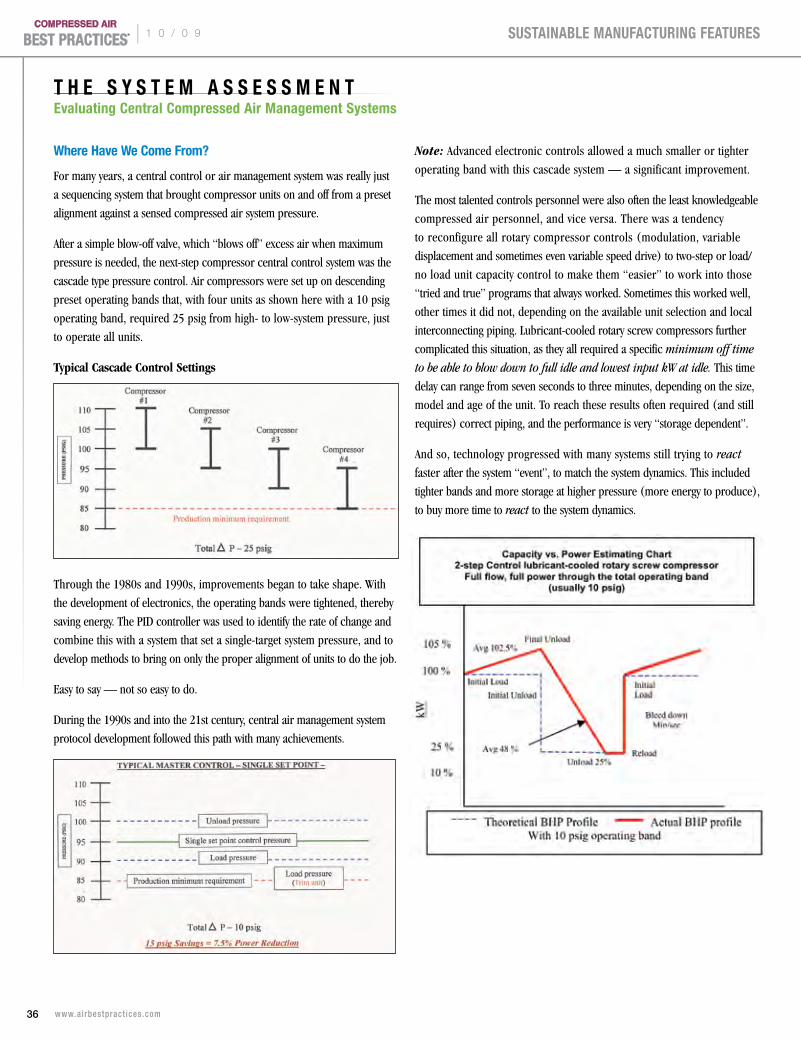
Where Have We Come From?
For many years, a central control or air management system was really just
a sequencing system that brought compressor units on and off from a preset
alignment against a sensed compressed air system pressure.
After a simple blow-off valve, which “blows off” excess air when maximum
pressure is needed, the next-step compressor central control system was the
cascade type pressure control. Air compressors were set up on descending
preset operating bands that, with four units as shown here with a 10 psig
operating band, required 25 psig from high- to low-system pressure, just
to operate all units.
Typical Cascade Control Settings
Through the 1980s and 1990s, improvements began to take shape. With
the development of electronics, the operating bands were tightened, thereby
saving energy. The PID controller was used to identify the rate of change and
combine this with a system that set a single-target system pressure, and to
develop methods to bring on only the proper alignment of units to do the job.
Easy to say — not so easy to do.
During the 1990s and into the 21st century, central air management system
protocol development followed this path with many achievements.
Note: Advanced electronic controls allowed a much smaller or tighter
operating band with this cascade system — a significant improvement.
The most talented controls personnel were also often the least knowledgeable
compressed air personnel, and vice versa. There was a tendency
to reconfigure all rotary compressor controls (modulation, variable
displacement and sometimes even variable speed drive) to two-step or load/
no load unit capacity control to make them “easier” to work into those
“tried and true” programs that always worked. Sometimes this worked well,
other times it did not, depending on the available unit selection and local
interconnecting piping. Lubricant-cooled rotary screw compressors further
complicated this situation, as they all required a specific minimum off time
to be able to blow down to full idle and lowest input kW at idle. This time
delay can range from seven seconds to three minutes, depending on the size,
model and age of the unit. To reach these results often required (and still
requires) correct piping, and the performance is very “storage dependent”.
And so, technology progressed with many systems still trying to react
faster after the system “event”, to match the system dynamics. This included
tighter bands and more storage at higher pressure (more energy to produce),
to buy more time to react to the system dynamics.
T H E S y S T E M A S S E S S M E N T Evaluating Central Compressed Air Management Systems
SUSTAINABLE MANUFACTURING FEATURES® | 1 0 / 0 9
36 www.ai rbestpract ices .com

In many cases, these reactions worked fine, depending on the situation.
However, here is one situation where they did not work, and here’s why:
At a powdered metals plant in North Central Pennsylvania, the operation had the following demand profile with established targets for the control system:
Central Air Demand Profile Management Target
Average Flow = 1750 scfm Average Flow = 1750 scfm
Maximum Flow = 2150 scfm Maximum Flow = 2150 scfm
(This is a very tight demand (1) base = 1800 scfm
profile and should be relatively (1) trim = 440 scfm
easy to respond to effectively) 100 hp part-time
Nominal Operating Pressure = 100 psig Pressure Range = 100 ± 2 psig
The air supply consisted of:
p (1) 400 hp two-stage variable displacement rotary screw 1850 scfm at 100 psig
p (3) 100 hp single-stage constant speed inlet modulation control 440 scfm at 100 psig
p Central Air Management Control System Design Parameters:
p Tie all four units to a central air management system; system pressure based
p Convert all units to load/no load control (two-step) because:
– The supplier felt it “was the most efficient”…and…
– “This was the only protocol” that existed in the software
– Operate a ±2 psig target band
They also installed two 3,500-gallon air receivers as storage to create
the allowable permissive time for the controls to react.
Note: The piping in Figure 1:
p Single-point entry and exit to the first air receiver. Air cannot leave the receiver when the line pressure is higher than the receiver. As soon as the trim compressor loads in, the line pressure rises more rapidly than the receiver, blocking the stored air within seconds, and rapid response is destroyed
p The second receiver can only get air to the system control after the pressure falls in the first receiver. In this case, it may never get out
p The pressure flow controller is there to stabilize system pressure, but it does have a 5 psig pressure loss built-in. The 5 psid loss will increase as the entry pressure falls. This item would not be required in a properly controlled system because the central controller can deliver a steady lower pressure
p If the 400 hp unit is unloaded, it must fight its way past all the 100 hp units that are loading into the header with 90° crossing tee’s in order to reload. The back pressure causes it, and the 100 hp units, to short cycle. The actual operating pressure band ranges from 103–117 psig, with all the action taking place in the piping, which is at a higher pressure than the receivers (103 psig), most of the time effectively blocking them from the system
Figure 1
SUSTAINABLE MANUFACTURING FEATURES ®1 0 / 0 9 |
37 www.ai rbestpract ices .com
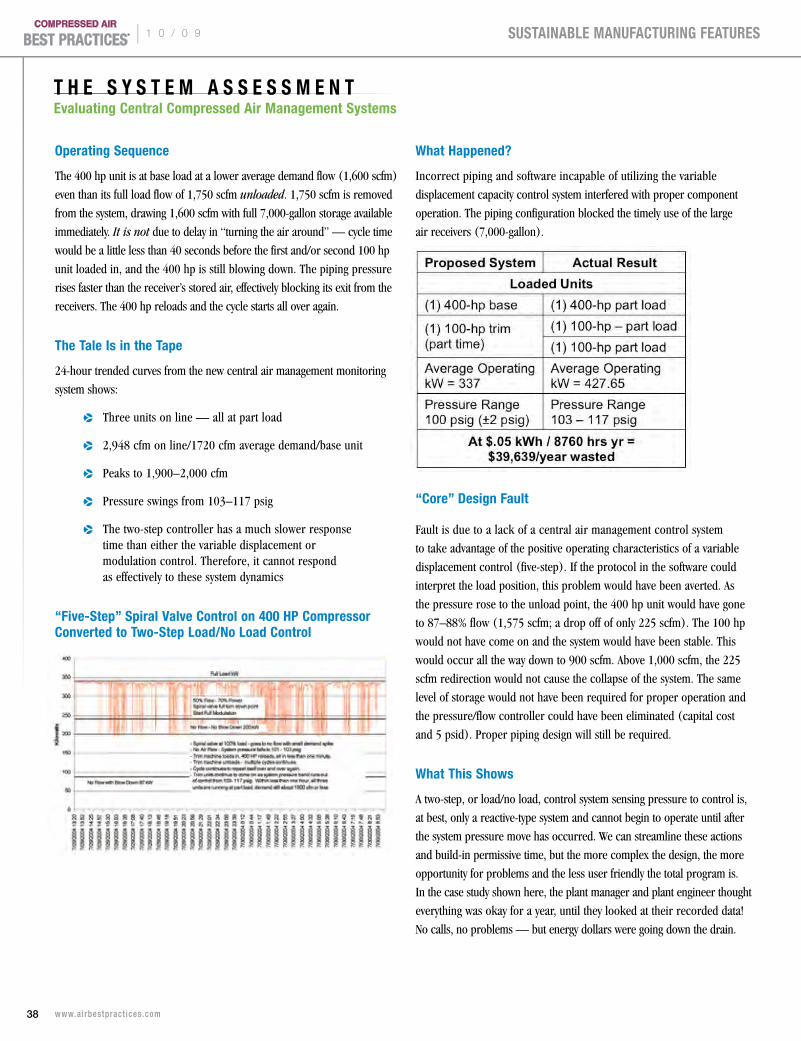
Operating Sequence
The 400 hp unit is at base load at a lower average demand flow (1,600 scfm)
even than its full load flow of 1,750 scfm unloaded. 1,750 scfm is removed
from the system, drawing 1,600 scfm with full 7,000-gallon storage available
immediately. It is not due to delay in “turning the air around” — cycle time
would be a little less than 40 seconds before the first and/or second 100 hp
unit loaded in, and the 400 hp is still blowing down. The piping pressure
rises faster than the receiver’s stored air, effectively blocking its exit from the
receivers. The 400 hp reloads and the cycle starts all over again.
The Tale Is in the Tape
24-hour trended curves from the new central air management monitoring
system shows:
p Three units on line — all at part load
p 2,948 cfm on line/1720 cfm average demand/base unit
p Peaks to 1,900–2,000 cfm
p Pressure swings from 103–117 psig
p The two-step controller has a much slower response time than either the variable displacement or modulation control. Therefore, it cannot respond as effectively to these system dynamics
“Five-Step” Spiral Valve Control on 400 HP Compressor Converted to Two-Step Load/No Load Control
What Happened?
Incorrect piping and software incapable of utilizing the variable
displacement capacity control system interfered with proper component
operation. The piping configuration blocked the timely use of the large
air receivers (7,000-gallon).
“Core” Design Fault
Fault is due to a lack of a central air management control system
to take advantage of the positive operating characteristics of a variable
displacement control (five-step). If the protocol in the software could
interpret the load position, this problem would have been averted. As
the pressure rose to the unload point, the 400 hp unit would have gone
to 87–88% flow (1,575 scfm; a drop off of only 225 scfm). The 100 hp
would not have come on and the system would have been stable. This
would occur all the way down to 900 scfm. Above 1,000 scfm, the 225
scfm redirection would not cause the collapse of the system. The same
level of storage would not have been required for proper operation and
the pressure/flow controller could have been eliminated (capital cost
and 5 psid). Proper piping design will still be required.
What This Shows
A two-step, or load/no load, control system sensing pressure to control is,
at best, only a reactive-type system and cannot begin to operate until after
the system pressure move has occurred. We can streamline these actions
and build-in permissive time, but the more complex the design, the more
opportunity for problems and the less user friendly the total program is.
In the case study shown here, the plant manager and plant engineer thought
everything was okay for a year, until they looked at their recorded data!
No calls, no problems — but energy dollars were going down the drain.
T H E S y S T E M A S S E S S M E N T Evaluating Central Compressed Air Management Systems
SUSTAINABLE MANUFACTURING FEATURES® | 1 0 / 0 9
38 www.ai rbestpract ices .com
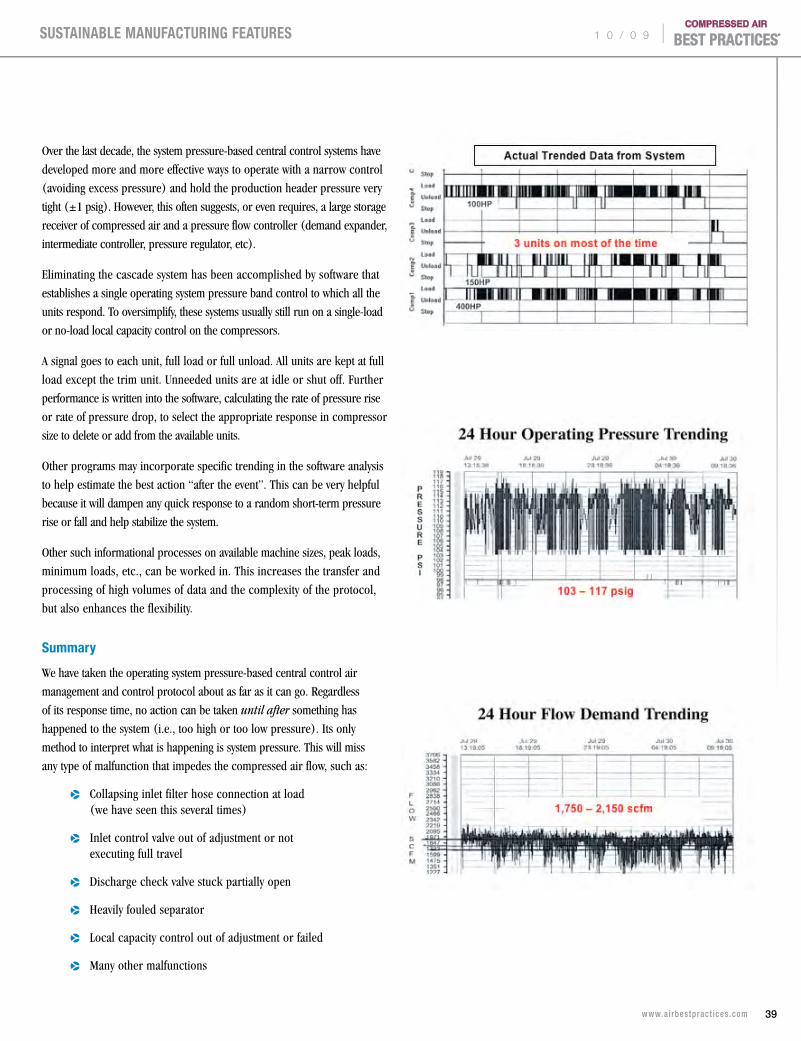
Over the last decade, the system pressure-based central control systems have
developed more and more effective ways to operate with a narrow control
(avoiding excess pressure) and hold the production header pressure very
tight (±1 psig). However, this often suggests, or even requires, a large storage
receiver of compressed air and a pressure flow controller (demand expander,
intermediate controller, pressure regulator, etc).
Eliminating the cascade system has been accomplished by software that
establishes a single operating system pressure band control to which all the
units respond. To oversimplify, these systems usually still run on a single-load
or no-load local capacity control on the compressors.
A signal goes to each unit, full load or full unload. All units are kept at full
load except the trim unit. Unneeded units are at idle or shut off. Further
performance is written into the software, calculating the rate of pressure rise
or rate of pressure drop, to select the appropriate response in compressor
size to delete or add from the available units.
Other programs may incorporate specific trending in the software analysis
to help estimate the best action “after the event”. This can be very helpful
because it will dampen any quick response to a random short-term pressure
rise or fall and help stabilize the system.
Other such informational processes on available machine sizes, peak loads,
minimum loads, etc., can be worked in. This increases the transfer and
processing of high volumes of data and the complexity of the protocol,
but also enhances the flexibility.
Summary
We have taken the operating system pressure-based central control air
management and control protocol about as far as it can go. Regardless
of its response time, no action can be taken until after something has
happened to the system (i.e., too high or too low pressure). Its only
method to interpret what is happening is system pressure. This will miss
any type of malfunction that impedes the compressed air flow, such as:
p Collapsing inlet filter hose connection at load (we have seen this several times)
p Inlet control valve out of adjustment or not executing full travel
p Discharge check valve stuck partially open
p Heavily fouled separator
p Local capacity control out of adjustment or failed
p Many other malfunctions
SUSTAINABLE MANUFACTURING FEATURES ®1 0 / 0 9 |
39 www.ai rbestpract ices .com

During the 1990s, great progress was made using flow-based data, individual unit load position,
reactive specific power (efficiency) and, particularly, mass flow compressors (centrifugals) and
ambient or inlet air conditions.
From the late 1990s into the 21st century, new advancements into software protocols were
developed to take action on the software-predicted event before the event occurred, enabling
it to be more proactive. Built into these modern protocols were such things as:
p Relative efficiency of each unit of compressed air supply, considered at full load, type of capacity control and part load capability to activate sequencing/alignment
p Permissive start and/or reaction time required
p Low- and high-pressure limitations
p All units lined up in a preferred sequence. The preferred sequence is modified when operating conditions call for it
p System pressure, compressor discharge pressure, storage pressure, system flow, unit flow, motor input kW (power), all combined and compared real time to accurately portray the actual system operating conditions
– Changes in flow demand are picked up at the very beginning of a potential cycle
and proper required action, if any, can be started before any effect is showing.
Timely control action can often completely avoid any effect
p Capable of handling all types and brands of air compressors in a single system
p Capable of handling and controlling auxiliary equipment, such as dryers, filters, cooling systems, etc. They include such things as controlling the adjustable purge on a desiccant dryer and/or monitoring the true performance of a refrigerated or desiccant dryer
p Offer a customized remote monitoring system which can be viewed from anywhere in the world with a computer and web browser
p Preventative service maintenance reminders
p Notify appropriate contacts when service is, or has been, required
p Remote control of system with password protection
p Communicate to one or several central locations
The list of control and monitoring opportunities goes on and on. The modern central air
management system is more than a sequencer. It can be a great working partner to help you
monitor and keep those hard-won compressed air energy savings.
For more information, please contact Hank Van Ormer, Air Power USA, Tel: 740-862-4112, e-mail: [email protected], www.airpowerusainc.com.
T H E S y S T E M A S S E S S M E N T Evaluating Central Compressed Air Management Systems
kW
CO2
“High-performance central compressed air management systems can respond quickly
to even extreme system fluctuations,
improving productivity and minimizing
energy waste.”— Hank Van Ormer,
Air Power USA
SUSTAINABLE MANUFACTURING FEATURES® | 1 0 / 0 9
40 www.ai rbestpract ices .com
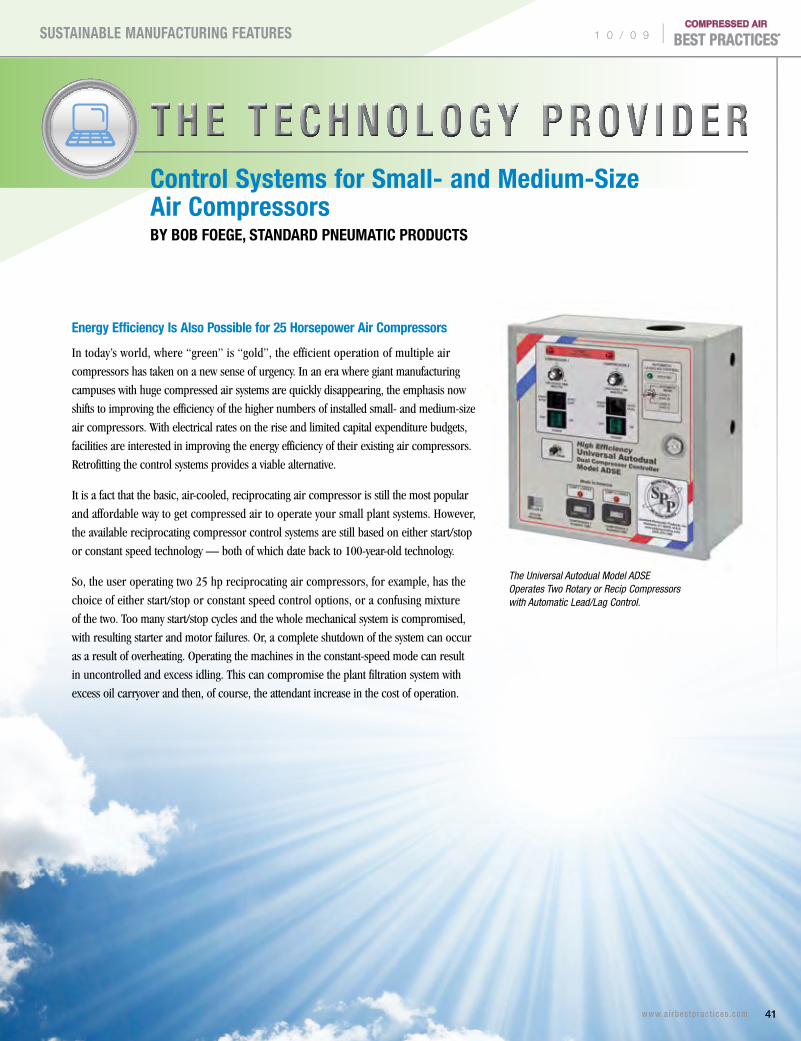
Energy Efficiency Is Also Possible for 25 Horsepower Air Compressors
In today’s world, where “green” is “gold”, the efficient operation of multiple air
compressors has taken on a new sense of urgency. In an era where giant manufacturing
campuses with huge compressed air systems are quickly disappearing, the emphasis now
shifts to improving the efficiency of the higher numbers of installed small- and medium-size
air compressors. With electrical rates on the rise and limited capital expenditure budgets,
facilities are interested in improving the energy efficiency of their existing air compressors.
Retrofitting the control systems provides a viable alternative.
It is a fact that the basic, air-cooled, reciprocating air compressor is still the most popular
and affordable way to get compressed air to operate your small plant systems. However,
the available reciprocating compressor control systems are still based on either start/stop
or constant speed technology — both of which date back to 100-year-old technology.
So, the user operating two 25 hp reciprocating air compressors, for example, has the
choice of either start/stop or constant speed control options, or a confusing mixture
of the two. Too many start/stop cycles and the whole mechanical system is compromised,
with resulting starter and motor failures. Or, a complete shutdown of the system can occur
as a result of overheating. Operating the machines in the constant-speed mode can result
in uncontrolled and excess idling. This can compromise the plant filtration system with
excess oil carryover and then, of course, the attendant increase in the cost of operation.
T h e T e c h n o l o g y P r o v i d e r Control Systems for Small- and Medium-Size Air CompressorsBy BOB FOEGE, STANDARD PNEUMATIC PRODUCTS
The Universal Autodual Model ADSE Operates Two Rotary or Recip Compressors with Automatic Lead/Lag Control.
SUSTAINABLE MANUFACTURING FEATURES ®1 0 / 0 9 |
41 www.ai rbestpract ices .com
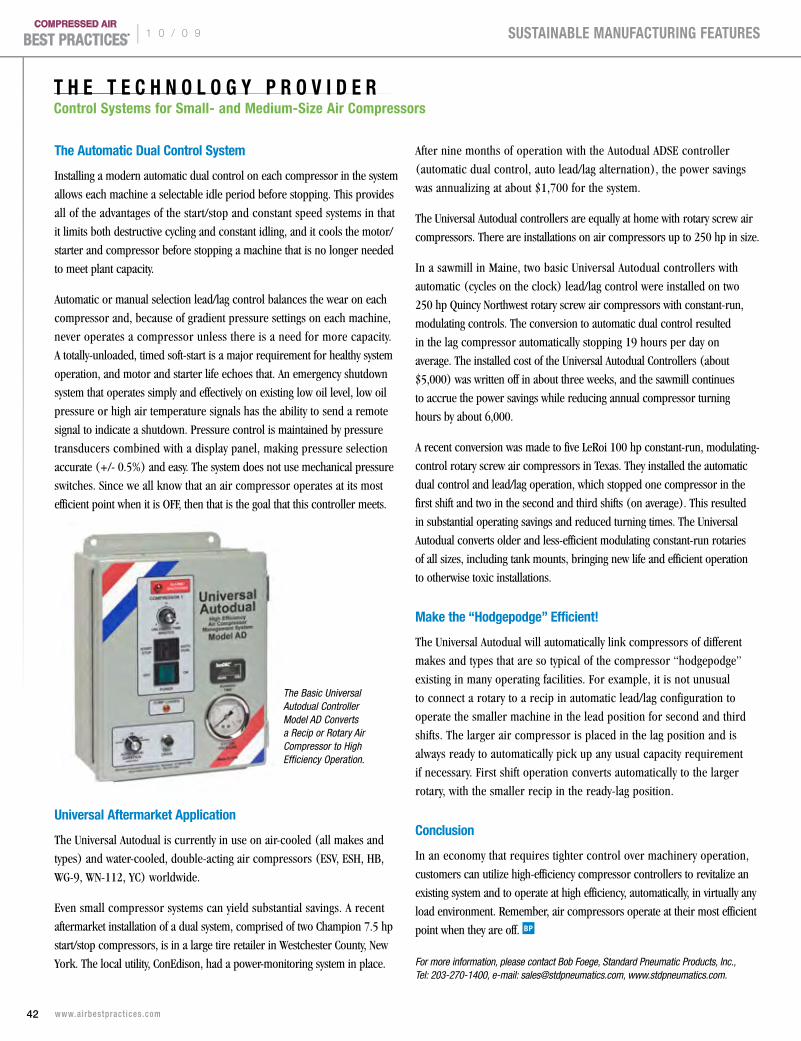
The Automatic Dual Control System
Installing a modern automatic dual control on each compressor in the system
allows each machine a selectable idle period before stopping. This provides
all of the advantages of the start/stop and constant speed systems in that
it limits both destructive cycling and constant idling, and it cools the motor/
starter and compressor before stopping a machine that is no longer needed
to meet plant capacity.
Automatic or manual selection lead/lag control balances the wear on each
compressor and, because of gradient pressure settings on each machine,
never operates a compressor unless there is a need for more capacity.
A totally-unloaded, timed soft-start is a major requirement for healthy system
operation, and motor and starter life echoes that. An emergency shutdown
system that operates simply and effectively on existing low oil level, low oil
pressure or high air temperature signals has the ability to send a remote
signal to indicate a shutdown. Pressure control is maintained by pressure
transducers combined with a display panel, making pressure selection
accurate (+/- 0.5%) and easy. The system does not use mechanical pressure
switches. Since we all know that an air compressor operates at its most
efficient point when it is OFF, then that is the goal that this controller meets.
Universal Aftermarket Application
The Universal Autodual is currently in use on air-cooled (all makes and
types) and water-cooled, double-acting air compressors (ESV, ESH, HB,
WG-9, WN-112, YC) worldwide.
Even small compressor systems can yield substantial savings. A recent
aftermarket installation of a dual system, comprised of two Champion 7.5 hp
start/stop compressors, is in a large tire retailer in Westchester County, New
York. The local utility, ConEdison, had a power-monitoring system in place.
After nine months of operation with the Autodual ADSE controller
(automatic dual control, auto lead/lag alternation), the power savings
was annualizing at about $1,700 for the system.
The Universal Autodual controllers are equally at home with rotary screw air
compressors. There are installations on air compressors up to 250 hp in size.
In a sawmill in Maine, two basic Universal Autodual controllers with
automatic (cycles on the clock) lead/lag control were installed on two
250 hp Quincy Northwest rotary screw air compressors with constant-run,
modulating controls. The conversion to automatic dual control resulted
in the lag compressor automatically stopping 19 hours per day on
average. The installed cost of the Universal Autodual Controllers (about
$5,000) was written off in about three weeks, and the sawmill continues
to accrue the power savings while reducing annual compressor turning
hours by about 6,000.
A recent conversion was made to five LeRoi 100 hp constant-run, modulating-
control rotary screw air compressors in Texas. They installed the automatic
dual control and lead/lag operation, which stopped one compressor in the
first shift and two in the second and third shifts (on average). This resulted
in substantial operating savings and reduced turning times. The Universal
Autodual converts older and less-efficient modulating constant-run rotaries
of all sizes, including tank mounts, bringing new life and efficient operation
to otherwise toxic installations.
Make the “Hodgepodge” Efficient!
The Universal Autodual will automatically link compressors of different
makes and types that are so typical of the compressor “hodgepodge”
existing in many operating facilities. For example, it is not unusual
to connect a rotary to a recip in automatic lead/lag configuration to
operate the smaller machine in the lead position for second and third
shifts. The larger air compressor is placed in the lag position and is
always ready to automatically pick up any usual capacity requirement
if necessary. First shift operation converts automatically to the larger
rotary, with the smaller recip in the ready-lag position.
Conclusion
In an economy that requires tighter control over machinery operation,
customers can utilize high-efficiency compressor controllers to revitalize an
existing system and to operate at high efficiency, automatically, in virtually any
load environment. Remember, air compressors operate at their most efficient
point when they are off.
For more information, please contact Bob Foege, Standard Pneumatic Products, Inc., Tel: 203-270-1400, e-mail: [email protected], www.stdpneumatics.com.
The Basic Universal Autodual Controller Model AD Converts a Recip or Rotary Air Compressor to High Efficiency Operation.
T H E T E C H N O L O G y P R O V I D E RControl Systems for Small- and Medium-Size Air Compressors
SUSTAINABLE MANUFACTURING FEATURES® | 1 0 / 0 9
42 www.ai rbestpract ices .com

R e s o u R c e s f o R e n e R g y e n g i n e e R s
Mourning the Loss of Carl kaeser
Carl Kaeser, Chief Executive Officer of Kaeser Kompressoren GmbH, passed away
on July 8, 2009, shortly after his 95th birthday. Under Carl Kaeser’s leadership, Kaeser
Kompressoren evolved from a regional and national compressor manufacturer into
one of the world’s most successful compressed air systems providers.
Up until the beginning of the 1970s, the main focus of Kaeser Kompressoren’s product
range was reciprocating compressors. However, thanks to Carl Kaeser’s keen insight,
the company developed the groundbreaking and highly efficient “Sigma Profile” rotary
screw compressor. His drive and pioneering spirit were clearly demonstrated again
by the decision to integrate compressor and modern digital technology in order
to achieve enhanced efficiency and reliability. The “Sigma Control” system was the first
industrial PC controller of its kind to be standard on a rotary screw compressor.
Carl Kaeser, CEO of Kaeser Kompressoren GmbH passed away on the 8th of July 2009, shortly after his 95th birthday.
INDUSTRy NEWS
TRAINING CALENDAR
TITLE SPONSOR(S) LOCATION DATE INFORMATION
Compressed Air Challenge®
Fundamentals of Compressed AirNorthwest Energy Efficiency Alliance Idaho Power Co., BPA, WSU
Nampa, ID 9/30/09 tel: 505-241-4404 www.compressedairchallenge.org
Compressed Air Challenge®
Fundamentals of Compressed AirNational Grid DOE EERE UMASS Energy Efficiency Partnership
Waltham, MA 10/8/09 Mark Gerrish tel: 413-545-2853 [email protected] www.compressedairchallenge.org
Compressed Air System Benchmarking, System Sizing and Simulation
SIGA Green Technologies Webinar 3 p.m. EST
10/22/09 Jan Hoetzel tel: 616-828-1024 [email protected] www.airleader.us
Compressed Air Challenge®
Fundamentals of Compressed AirManitoba Hydro Winnipeg, MB 10/27/09 Veronica Walls
tel: 204-360-7229 [email protected] www.compressedairchallenge.org
Editor’s Note: If you conduct compressed air system training and would like to post it in this area, please e-mail your info to [email protected].
COLUMNS ®1 0 / 0 9 |
43 www.ai rbestpract ices .com

INDUSTRy NEWS
PRODUCT PICkS
Mourning the Loss of Carl kaeser (cont.)
Both technically and commercially accomplished, Carl Kaeser continued
to steer the company on its successful course — together with his son
Thomas Kaeser, who joined him in the early 1980s — right up until just
a few weeks before his passing. Under his leadership, the company grew
to its present total of almost 4,000 employees worldwide.
After German reunification, Carl Kaeser once again proved his visionary
foresight with the acquisition of Germany’s oldest compressor plant, situated
in Gera. He subsequently not only added compressed air refrigeration
dryers to Kaeser’s product portfolio, but rotary blowers as well.
Everyone in the company felt Carl Kaeser’s presence. He sought out dialogue
and direct personal contact, and he was always willing to listen to his
employees’ concerns. When a decision had to be made, he always took
the direct route and confidently led his team at all times. Furthermore,
his impressive knowledge of operational details and methods, along
with his vision and commitment, made him a leader upon whom
employees relied and whom they valued and trusted.
Carl Kaeser was especially proud of the fact that so many employees
had been with his company for a long time and relished the celebration
of employees’ five, 10, 25, 40 or even 50 years of service. However,
he personally held the distinction of being the longest-serving Kaeser
employee, with over 70 years of dedication to the company founded
by his own father in 1919.
Carl Kaeser received numerous honors for his lifetime achievements.
He was a recipient of the Bavarian Order of Merit, the Order of Merit
of the Federal Republic of Germany (First Class) and the State Medal
for Special Services to the Bavarian Economy, and he was made
a Freeman of the town of Coburg and Honorary Senator at the University
of Coburg. He will be greatly missed, though he will always be present
in the hearts and minds of friends and colleagues around the globe.
Kaeser Compressors Tel: 800-777-7873 www.kaeser.com
R E S O U R C E S F O R E N E R G y E N G I N E E R S
New GA Series Compressor
Atlas Copco announced the latest offering in the 110–160 kW (150–200 hp)
category — the GA FIT. The entry-level GA FIT range provides air
compressor technology for customers in need of standard efficiency levels.
With the addition of the GA FIT, the GA range of air compressors now
encompasses four option levels in order to provide additional customization
for all types of users. Ensuring a long and trouble-free life at the lowest
possible cost, the GA FIT utilizes the latest generation of Atlas Copco’s oil-
injected screw element in order to provide reliable service in the harshest
environments, even in ambient temperatures up to 115 °F/46 °C.
Completing Atlas Copco’s GA 110–160 kW range are the GA Standard,
GA + and GA VSD (variable speed drive) versions. Each variant
provides an increased level of performance and benefits, such
as energy recovery, modulating controls, phase sequence relay
and additional energy-saving technologies. The GA FIT models
are available from stock within the United States.
Atlas Copco www.atlascopco.us
COLUMNS® | 1 0 / 0 9
44 www.ai rbestpract ices .com

PRODUCT PICkS
New Compressed Air Data Logger
SIGA Green Technologies announces the new Airleader high-performance
data logger. It has eight channels and performs one-second data
recordings for precise compressed air system evaluations. Its large
memory can record data for weeks without memory overflow. The
system records 4–20mA signals. Any 4–20mA pressure transducer, flow
meter, dew point sensor, differential pressure transducer, temperature
sensor, ampere and three-phase kW current transducer can be installed.
The data logger works with an easy-to-use software program to evaluate
data and generate reports that contain graphs and tables. The zoom
function enables detailed analysis. Data can be downloaded with
a USB stick or cable for fast on-site data evaluation. This assures the
collection of good and complete data before the system is dismantled,
avoiding expensive double work.
The data logger precisely captures energy and output data. It can be
used to document exact kWh savings for utilities’ energy efficiency
incentive programs.
Flexible data logging merges data from multiple compressor rooms
into an overall system evaluation. Wireless set-up is optional for
data logging of pressure transducers throughout the plant or for
compressors in remote locations.
SIGA Green Technologies Tel: 616-828-1024 E-mail: [email protected] www.airleader.us
New Generation Air Compressor
Boge America Inc. announced the launch of the second generation
SD 20-2, SD 24-2 and SD 29-2 screw compressors with integral
dryers. These compact compressed air stations offer a space-saving
solution. The new generation 20, 25 and 30 hp models form part
of the Boge S Series product range. The award winning Boge S Series
design incorporates a clever cabinet layout with a high-quality finish
and maximum efficiency. All maintenance parts are easily accessible
from one side of the compressor, keeping maintenance costs
to a minimum.
The new generation SD Series models are available in the standard
pressure of 115–190 psig. Output capacities range from 67–122 cfm
and motor power from 20–30 hp.
BOGE America Tel: 770-874-1570 www.boge.com/us
COLUMNS ®1 0 / 0 9 |
45 www.ai rbestpract ices .com
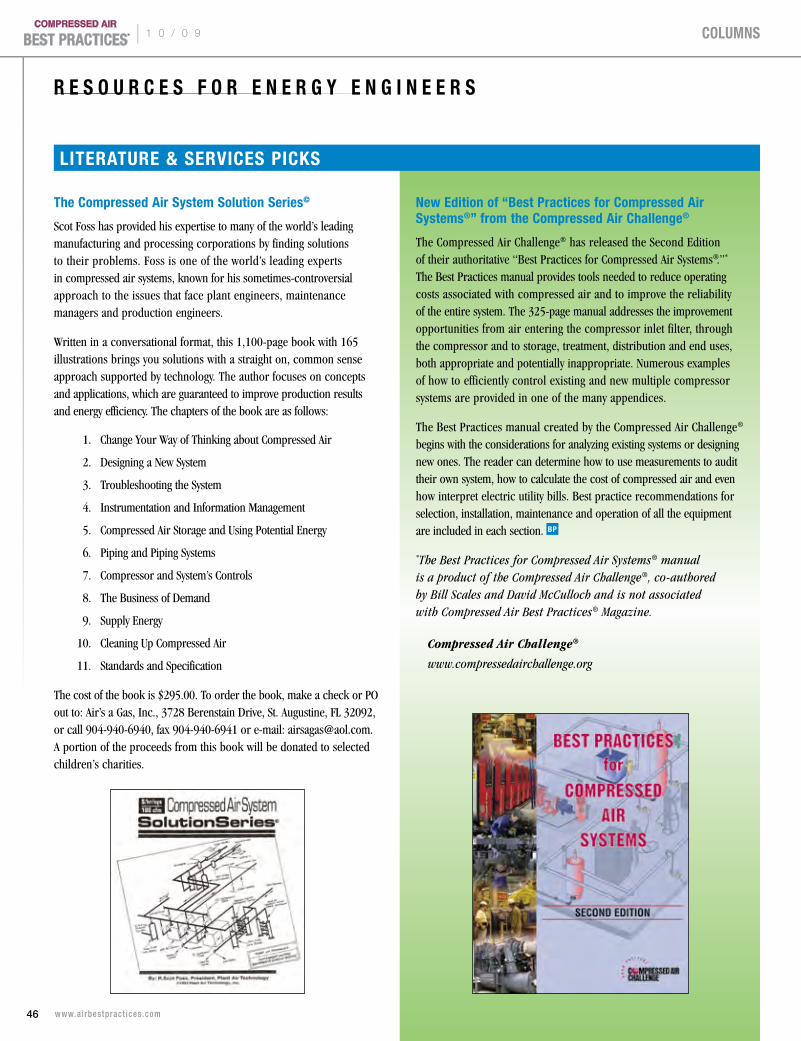
The Compressed Air System Solution Series©
Scot Foss has provided his expertise to many of the world’s leading manufacturing and processing corporations by finding solutions to their problems. Foss is one of the world’s leading experts in compressed air systems, known for his sometimes-controversial approach to the issues that face plant engineers, maintenance managers and production engineers.
Written in a conversational format, this 1,100-page book with 165 illustrations brings you solutions with a straight on, common sense approach supported by technology. The author focuses on concepts and applications, which are guaranteed to improve production results and energy efficiency. The chapters of the book are as follows:
1. Change Your Way of Thinking about Compressed Air
2. Designing a New System
3. Troubleshooting the System
4. Instrumentation and Information Management
5. Compressed Air Storage and Using Potential Energy
6. Piping and Piping Systems
7. Compressor and System’s Controls
8. The Business of Demand
9. Supply Energy
10. Cleaning Up Compressed Air
11. Standards and Specification
The cost of the book is $295.00. To order the book, make a check or PO out to: Air’s a Gas, Inc., 3728 Berenstain Drive, St. Augustine, FL 32092, or call 904-940-6940, fax 904-940-6941 or e-mail: [email protected]. A portion of the proceeds from this book will be donated to selected children’s charities.
LITERATURE & SERVICES PICkS
R E S O U R C E S F O R E N E R G y E N G I N E E R S
New Edition of “Best Practices for Compressed Air Systems®” from the Compressed Air Challenge®
The Compressed Air Challenge® has released the Second Edition of their authoritative “Best Practices for Compressed Air Systems®.”* The Best Practices manual provides tools needed to reduce operating costs associated with compressed air and to improve the reliability of the entire system. The 325-page manual addresses the improvement opportunities from air entering the compressor inlet filter, through the compressor and to storage, treatment, distribution and end uses, both appropriate and potentially inappropriate. Numerous examples of how to efficiently control existing and new multiple compressor systems are provided in one of the many appendices.
The Best Practices manual created by the Compressed Air Challenge® begins with the considerations for analyzing existing systems or designing new ones. The reader can determine how to use measurements to audit their own system, how to calculate the cost of compressed air and even how interpret electric utility bills. Best practice recommendations for selection, installation, maintenance and operation of all the equipment are included in each section.
*The Best Practices for Compressed Air Systems® manual is a product of the Compressed Air Challenge®, co-authored by Bill Scales and David McCulloch and is not associated with Compressed Air Best Practices® Magazine.
Compressed Air Challenge®
www.compressedairchallenge.org
COLUMNS® | 1 0 / 0 9
46 www.ai rbestpract ices .com
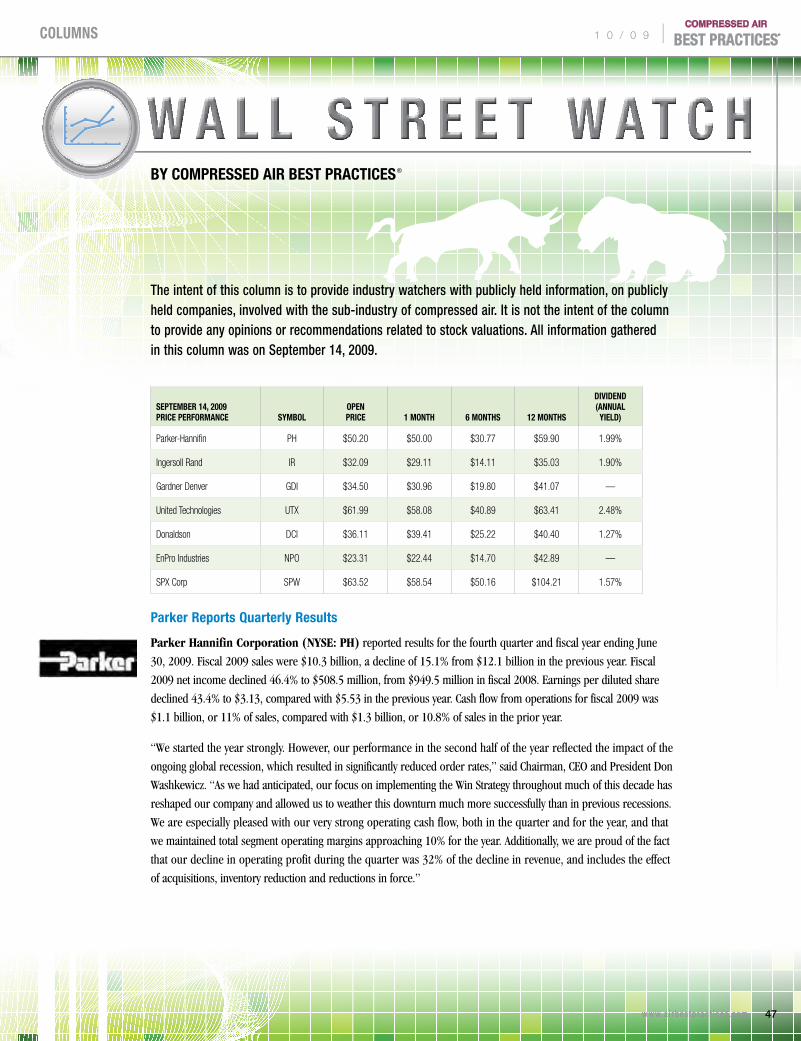
By COMPRESSED AIR BEST PRACTICES®
w a l l s t r e e t w a t c h
The intent of this column is to provide industry watchers with publicly held information, on publicly held companies, involved with the sub-industry of compressed air. It is not the intent of the column to provide any opinions or recommendations related to stock valuations. All information gathered in this column was on September 14, 2009.
SEPTEMBER 14, 2009 PRICE PERFORMANCE SyMBOL
OPEN PRICE 1 MONTH 6 MONTHS 12 MONTHS
DIVIDEND (ANNUAL
yIELD)
Parker-Hannifin PH $50.20 $50.00 $30.77 $59.90 1.99%
Ingersoll Rand IR $32.09 $29.11 $14.11 $35.03 1.90%
Gardner Denver GDI $34.50 $30.96 $19.80 $41.07 —
United Technologies UTX $61.99 $58.08 $40.89 $63.41 2.48%
Donaldson DCI $36.11 $39.41 $25.22 $40.40 1.27%
EnPro Industries NPO $23.31 $22.44 $14.70 $42.89 —
SPX Corp SPW $63.52 $58.54 $50.16 $104.21 1.57%
Parker Reports Quarterly Results
Parker Hannifin Corporation (NYSE: PH) reported results for the fourth quarter and fiscal year ending June
30, 2009. Fiscal 2009 sales were $10.3 billion, a decline of 15.1% from $12.1 billion in the previous year. Fiscal
2009 net income declined 46.4% to $508.5 million, from $949.5 million in fiscal 2008. Earnings per diluted share
declined 43.4% to $3.13, compared with $5.53 in the previous year. Cash flow from operations for fiscal 2009 was
$1.1 billion, or 11% of sales, compared with $1.3 billion, or 10.8% of sales in the prior year.
“We started the year strongly. However, our performance in the second half of the year reflected the impact of the
ongoing global recession, which resulted in significantly reduced order rates,” said Chairman, CEO and President Don
Washkewicz. “As we had anticipated, our focus on implementing the Win Strategy throughout much of this decade has
reshaped our company and allowed us to weather this downturn much more successfully than in previous recessions.
We are especially pleased with our very strong operating cash flow, both in the quarter and for the year, and that
we maintained total segment operating margins approaching 10% for the year. Additionally, we are proud of the fact
that our decline in operating profit during the quarter was 32% of the decline in revenue, and includes the effect
of acquisitions, inventory reduction and reductions in force.”
COLUMNS ®1 0 / 0 9 |
47 www.ai rbestpract ices .com

W A L L S T R E E T W A T C H
Fiscal 2009 fourth quarter sales were $2.2 billion, a decline of 33.9% from $3.3 billion in the same quarter a year ago. Net income for the fourth quarter declined 80.4% to $49.5 million, from $252.6 million in the fourth quarter of fiscal 2008. Earnings per diluted share for the quarter declined 79.2% to $0.31, compared with $1.47 in last year’s fourth quarter. Cash flow from operations in the quarter was $413.1 million, or a record 18.7% percent of sales, compared with $452.8 million, or 13.5%, in the fourth quarter of fiscal 2008. The company used its cash flow to pay down $321 million in outstanding debt in the quarter.
Reflecting on the quarter, Washkewicz added, “Our fourth quarter performance was influenced by order rates, which declined year-over-year and sequentially from the third quarter levels. This led to a 32% decline in organic sales for the quarter, while foreign currency translation negatively impacted sales by 5% and acquisitions contributed 3% to sales. The decline in sales was the primary driver of lower profitability levels, and our Industrial International segment was hit particularly hard, as reductions in workforce have taken longer to implement. However, with cash being our primary focus, I am particularly pleased that fourth quarter cash flow reached such a strong level. We remain committed to deploying cash to pay down debt and strengthening our balance sheet to prepare the company to fund future growth opportunities, while maintaining our long-standing dividend increase record.
“As we move into fiscal 2010, we will continue to manage our business for cash, while maintaining productivity levels and reducing inventories. Actions to reduce our workforce to align with customer order rates, a broad-based wage freeze, reduced work weeks and significantly reduced discretionary spending are anticipated to benefit us more fully in the year ahead. While many challenges and uncertainties await, our ability to respond reflects favorably on our management team and is a credit to the remarkable performance of Parker employees throughout our company. They have stepped up to the challenges presented to them with their capabilities, loyalty, perseverance and sacrifice.”
Segment Results
In the Industrial North America segment, fourth-quarter sales declined 33.3% to $777.5 million, and operating income declined 67% to $53.7 million, compared with the same period a year ago. For the full year, Industrial North America sales declined 12.1% to $3.7 billion, and operating income declined 35% to $394.9 million, compared with fiscal 2008.
In the Industrial International segment, fourth-quarter sales declined 42.6% to $793.2 million, and the segment reported an operating loss of $5.7 million, compared with an operating profit of $213.0 million in the same period a year ago. For the full year, Industrial International sales declined 22.2% to $3.9 billion, and operating income declined 55.6% to $350.7 million, compared with fiscal 2008.
Donaldson Announces 4th Quarter Results
Donaldson Company, Inc. (NYSE: DCI) announced its financial results for its fourth quarter ended July 31, 2009.
Summarized financial results for the periods ended July 31 are as follows (dollars in millions, except per share data):
THREE MONTHS ENDED TWELVE MONTHS ENDED
jULy 31 jULy 31
2009 2008 CHANGE 2009 2008 CHANGE
NET SALES $421.3 $607.4 -30.6% $1,868.6 $2,232.5 -16.3%
OPERATING INCOME 34.8 67.9 -48.8% 170.0 245.8 -30.9%
NET EARNINGS 23.6 48.6 -51.5% 131.9 172.0 -23.3%
DILUTED EPS $0.30 $0.60 -50.0% $1.67 $2.12 -21.2%
Included in the above results are pre-tax restructuring expenses of $6.7 million in the quarter and $17.8 million for the year. The impact of these restructuring expenses reduced diluted EPS by $0.05 in the quarter and $0.15 for the year. Excluding the impact of these restructuring expenses, diluted EPS was $0.35 in the quarter and $1.82 for the year.
“None of us anticipated how dramatically the global recession would impact our customers and, consequently, our sales levels over the past six months,” said Bill Cook, Chairman, President and CEO. “However, I am very proud of how quickly and effectively our Donaldson team has responded. As a result of our restructuring efforts, cost reduction initiatives and working capital improvement projects, we delivered a sequential improvement in our gross margin during our fourth quarter.
“In addition, we continued to improve our already-strong liquidity position as we generated substantial free cash flow of $61 million and $231 million for the fourth quarter and year, respectively. This has allowed us to continue to invest in our business for the future and reduce debt by $49 million this quarter, while still increasing our global cash reserves and maintaining our dividend.
“While we continue to be significantly impacted by the global recession, we are seeing signs that some of our end markets were beginning to stabilize in our fourth quarter, as our overall sales were up 2% from our third quarter.
“Compared to our very strong prior year, our overall fourth quarter sales were down 31% and, excluding the impact of currency translation, were down 27%. In our Engine Products segment, local currency sales decreased 27%. In our Industrial Products segment, local currency sales also decreased 27%. Market conditions were also weak globally as our local currency sales decreased by 19% in Asia, 25% in the Americas and 35% in Europe.
COLUMNS® | 1 0 / 0 9
48 www.ai rbestpract ices .com

Compressed Air Best Practices® is published monthly by Smith Onandia Communications LLC., 217 Deer Meadow Drive, Pittsburgh, PA 15241. Phone 251-510-2598, Fax 412-831-3091, email [email protected]. Compressed Air Best Practices® is a trademark of Smith Onandia Communications, LLC. Publisher cannot be heldliable for non-delivery due to circumstances beyond its control. No refunds. Standard postage is paid at 233 Jefferson Street, Greenfield, Ohio 45123. Canadian and international distribution: IMEX International Mail Express, 1842 Brummel Drive, Elk Grove Village, IL 60007. POSTMASTER: Send address changes to Compressed Air Best Practices,® 217 Deer Meadow Drive, Pittsburgh, PA 15241. SUBSCRIPTIONS: Qualified reader subscriptions are accepted from compressed air professionals, plant managers, plant engineers, service and maintenance managers, operations managers, auditors, and energy engineers in manufacturing plants and engineering/consulting firms in the U.S. To apply for qualified reader subscriptions, please fill in the reader response cards herein and mail or fax or go to www.airbestpractices.com. To non-qualified subscribers subscriptions are $65 in Canada and $95 for other countries. When available, extra copies of back issues are $4 plus shipping. Contact Patricia Smith for subscription information at tel: 251-510-2598 or email: [email protected]. REPRINTS: Reprints are available on a custom basis, contact Patricia Smith for a price quotation at tel: 251-510-2598 or email: [email protected]. All rights are reserved. The contents of this publication may not be reproduced in whole or in part without consent of Smith Onandia Communications LLC. Smith Onandia Communications LLC does not assume and hereby disclaims any liability to any person for any loss or damage caused by errors or omissions in the material contained herein, regardless of whether such errors result from negligence, accident, or any other cause whatsoever. Printed in the U.S.A.
COMPRESSED AIR BEST PRACTICES®
w w w . a i r b e s t p r a c t i c e s . c o m
Advertising & : Rod Smith Editorial [email protected] Tel: 251-680-9154
Subscriptions & : Patricia Smith Administration [email protected] Tel: 251-510-2598 Fax: 412-831-3091
A Publication of : Smith Onandia Communications L.L.C. 217 Deer Meadow Drive Pittsburgh, PA 15241
COMPRESSED AIR BEST PRACTICES®
w w w . a i r b e s t p r a c t i c e s . c o m
ADVERTISER INDEx
Company Page Web Site
Kaeser Compressor Outside www.kaeser.com/ada
Back Cover
World Energy Engineering Inside www.energycongress.com
Congress Back Cover
Atlas Copco Inside www.carbonzerocompressors.com
Front Cover
Hitachi 3 www.hitachi-america.us/airtech
Mikropor America 5 www.mikroporamerica.com
SPX Hankison 7 www.hankisonintl.com/best
Chicago Pneumatic 9 www.cp.com
ALMiG USA 11 www.almig.us
JORC Industrial 13 www.jorc.com
FS Curtis Air Compressors 15 www.fscurtis.com
Awareness Ideas 17 www.awarenessideasCABP.com
HydroThrift Corporation 19 www.hydrothrift.com
SIGA Airleader 25 www.airleader.us
FS-Elliott 33 www.fs-elliott.com
Pneu-Logic Corporation 34 www.pneulogic.com
“We continued working on our restructuring plans, but did not complete all of our anticipated actions by the end of the quarter. Unfortunately, these restructuring actions included further workforce reductions of 100 employees in our fourth quarter, for a total workforce reduction of 2,800, or 21%, since the beginning of our fiscal year. From the actions we completed, we realized savings of approximately $23 million in the quarter and $43 million for the year. We anticipate that the cumulative effect of the restructuring actions completed in FY09 will generate over $100 million of annualized cost savings at our current sales levels.
“While we project many of our businesses to remain steady at their current levels during the first half of FY10, we expect difficult year-over-year comparisons for the first two quarters of FY10, and then slowly improving comparisons in the second half of the year. Our restructuring efforts will size us appropriately if economic activity remains at these currently depressed levels for an extended period, while also providing us with the financial strength to capitalize on growth opportunities as they emerge.”
COLUMNS ®1 0 / 0 9 |
49 www.ai rbestpract ices .com

Magazine adsFor smaller classified-type ads use
the following rates per column inch: 1x per year: $94.00* 3x per year: $90.00* 12x per year: $84.00*
*reversed ads = 1.5x normal priceAdd $50.00 to post the ad on
www.airbestpractices.com when you purchase an ad in the magazine
Contact Rod Smith for 4 color full page, 1/2 page and 1/3 page ad rates
Small Price Per Bulk Price Per Qty. Posting Qty. Posting 1 $250 5-9 $185 2 230 10-24 170 3 210 25-49 150 4 195 50+ 135
tel: 251-680-9154
COMPRESSED AIR BEST PRACTICES®
THE MARkETPLACE ADVERTISING RATES
T H E M A R K E T P L A C E
TECHNOLOGy
Contact Rod Smith for ad rates:
[email protected], tel: 251-680-9154
www.s2000wireless.com (800) 643-1339
AwarenessIdeasCABP.com800-875-1725
Stop Energy Wastewith the help of your employees
We offer energy saving programs that create awareness and motivate people to stop energy waste.
Typical programs include: • Leak Tags • Leak Tag Information Boards • • Posters • Decals
Topics Covered Include:
We now have a special offer for readersof Compressed Air Best Practices. Call or click for details.
COLUMNS® | 1 0 / 0 9
50 www.ai rbestpract ices .com


www.kaeser.com/ada
At Kaeser, our tradition of saving energy goes back generations.
Kaeser Compressors, Inc., Fredericksburg, VA USA n (866) 516-6888* Source: U.S. Department of Energy; Compresed Air Challenge®. ©2008 Kaeser Compressors, Inc. All rights reserved.
Energy costs have never been higher. That’s why it’s so important to
get maximum efficiency out of your compressed air system. And with as
much as 50%* of compressed air being wasted, you could save a bundle.
Trust the specialists at Kaeser to find energy savings by reduc-
ing inefficiency in your air system, while also cutting maintenance costs
and delivering process improvements. We are the industry leader in
conducting true, comprehensive air system audits, so you know you’ll get
the best possible advice and recommendations.
Visit www.kaeser.com/ada to see if you’ll benefit from an Air
Demand Analysis (ADA) - and how we’ve helped other plants significant-
ly improve their bottom line.
Untitled-1 1 7/1/2008 2:47:57 PM