Rights / License: Research Collection In Copyright - Non ...25026/eth-25026-02.pdf · SADAP SA0F...
158
Research Collection Doctoral Thesis Phosphorus availability and crop production in seven Swiss field experiments Author(s): Gallet, Anne Publication Date: 2001 Permanent Link: https://doi.org/10.3929/ethz-a-004313259 Rights / License: In Copyright - Non-Commercial Use Permitted This page was generated automatically upon download from the ETH Zurich Research Collection . For more information please consult the Terms of use . ETH Library
Transcript of Rights / License: Research Collection In Copyright - Non ...25026/eth-25026-02.pdf · SADAP SA0F...

Research Collection
Doctoral Thesis
Phosphorus availability and crop production in seven Swiss fieldexperiments
Author(s): Gallet, Anne
Publication Date: 2001
Permanent Link: https://doi.org/10.3929/ethz-a-004313259
Rights / License: In Copyright - Non-Commercial Use Permitted
This page was generated automatically upon download from the ETH Zurich Research Collection. For moreinformation please consult the Terms of use.
ETH Library

Diss. ETH Nr. 14476
Phosphorus availability and crop productionin seven Swiss field experiments
A dissertation submitted to the
Swiss Federal Institute of Technology Zurich
For the degree of
Doctor of Natural Sciences
presented by
ANNE GALLET
DEA INPL (France)
born June 19, 1974
citizen of Gradignan (France)
accepted on the recommendation of
Prof. Dr. E. Frossard, examiner
Dr. J.C. Fardeau, co-examiner
Dr. A.N. Sharpley, co-examiner
Dr. S. Sinaj, co-examiner
Zurich, 2001

Table of contents

Table of contents 2
List of abbreviations 5
Summary 9
Résumé 13
General Introduction 17
Phosphorus in soils 18
Role of phosphorus in plants 18
Plant P uptake and requirements 18
Soil P availability 19
P fertilization and residual P 20
Long-term field experiments 21
Environmental issues 22
Thesis objectives 23
Chapter I: Effect of P input / outpout regime on soil P exchangeability,crop yields and P uptake under a temperate climate 25
Abstract 26
Introduction 27
Materials and methods 28
Results and discussion 37
Conclusions 57
Chapter II: Evaluation of four chemical extractions to assess the changesin phosphorus availability induced by three input regimes in seven field
experiments conducted under a temperate climate. 59
Abstract 60
Introduction 61

Table of contents 3
Materials and methods 62
Results and discussion 65
Conclusions 77
Chapter III: Uptake of fresh and residual phosphate fertilizers byLolium perenne and Trifolium repens grown separately or in association 79
Abstract 80
Introduction 81
Materials and methods 83
Results and discussion 95
Conclusions 115
General conclusions 117
Literature cited 125
List of tables and figures 139
Annexes 147
Remerciements 153
Curriculum Vitae 157

List of abbreviations

List of abbreviations 6
List of abbreviations
CP
DAP
DM
EDTA
E,
F,
^lmin-3m
OF
F
L+AL
P
Pi
P-AAEDTA
p-co2
P-H20
Po
P-Olsen
Pt
OP
P
P>exp
concentration of water soluble P (mg P L"1)
diammonium phosphate
dry matter
ethylenediamine tetra-acetic acid
quantity of isotopically exchangeable P at a time t (mg P kg"1 soil)
amount of P isotopically exchangeable within 1 minute
pool of isotopically exchangeable P between lmin and 3 months (mg P kg"1
soil)
pool of P which can not be isotopically exchanged within 3 months (mg P kg"1
soil)
fertilization treatment where no P was applied
fertilization treatment where P was annually applied as triple superphosphate
in quantities equivalent to the offtake by the crops
quantity of available soil P determined according to the Larsen method (mg P
kg"1 soil)
quantity of available P in soil F with residual P (mg P kg"1 soil)
parameter describing the rate of disappearance of the tracer from the solution,
calculated using a linear regression between log r, / R and log(t) for t< 100 min
phosphorus
inorganic phosphorus
quantity of P (mg P kg"1 soil) extracted by ammonium acetate-EDTA
quantity of P (mg P kg"1 soil) extracted by C02-saturated water
quantity of P (mg P kg"1 soil) extracted by deionized water
total organic phosphorus (mg P kg"1 soil)
quantity of P (mg P kg"1 soil) extracted by sodium bicarbonate (NaHC03, pH
8.5)
total phosphorus (mg P kg"1 soil)
fertilization treatment where no P was applied
fertilization treatment where P was applied to cover the crop exportations
fertilization treatment where the quantities of P applied were higher than the
crop exportations

List of abbreviations 7
PDFff%(0F+DAP) fraction of P (%) taken up by the plant derived from the fresh fertilizer on the
OF+DAP treatment
PDFff%(F+DAP) fraction of P (%) taken up by the plant derived from the fresh fertilizer P on
the F+DAP treatment
PDFso1i%(of+dap) fraction of P (%) taken up by the plant derived from the soil on the OF+DAP
treatment
PDFS01i%F fraction of P (%) taken up by the plant derived from the soil on the F treatment
PDFS01|%(i.+DAp) fraction of P (%) taken up by the plant derived from the soil on the F+DAP
treatment
PDFrf%p fraction of P (%) taken up by the plant derived from the residual P on the F
treatment
PDFrf%(F+DAp) fraction of P (%) taken up by the plant derived from the residual P on the
F+DAP treatment
q total P uptake (mg P kg"1 soil)
q0F total P uptake for the OF treatment (mg P kg"1 soil)
q(0F+DAP) total P uptake for the OF+DAP treatment (mg P kg"1 soil)
qF total P uptake for the F treatment (mg P kg"1 soil)
Q(f+dap) total P uptake for the F+DAP treatment (mg P kg"1 soil)
qL P taken up from available soil P (mg P kg'1 soil)
qAL P taken up from available residual P (mg P kg"1 soil)
q'L P taken up from available soil P in the presence of DAP (mg P kg"1 soil)
q'AL P taken up from available residual P in the presence of DAP (mg P kg"1 soil)
qff P taken up by the plant derived from the freshly applied fertilizer (mg P kg"1
soil)
qff(0F+DAP) fresh P fertilizer plant uptake for the OF+DAP treatment (mg P kg"1 soil)
Qff(F+DAP) fresh P fertilizer plant uptake for the F+DAP treatment (mg P kg"1 soil)
qrf P taken up by the plant derived from the residual fertilizer (mg P kg"1 soil)
q,ff residual P plant uptake for the F treatment (mg P kg"1 soil)
qrf(F+DAP) residual P plant uptake for the F+DAP treatment (mg P kg"1 soil)
qSOii P taken up by the plant derived from the soil (mg P kg"1 soil)

List of abbreviations 8
<lsoil(OF+DAP)
IsoilF
<îsoil(F+DAP)
Q
R
R'
R/r,
r0F
r(OF+DAP)
ÎF
r(F+DAP)
rL
rAL
rt
ri
r«,
SA
SADAP
SA0F
SA(0F+DAP)
SAF
SA(F+DAP)
soil plant uptake for the OF+DAP treatment (mg P kg"' soil)
soil plant uptake for the F treatment (mg P kg"1 soil)
soil plant uptake for the F+DAP treatment (mg P kg"1 soil)
total quantity of applied fresh fertilizer (mg P kg"1 soil)
radioactivity (MBq kg"1 soil) used to label the soil available P
radioactivity (MBq kg"1 soil) used to label the total quantity of applied fresh
fertilizer (mg P kg"1 fertilizer)
ratio of total introduced radioactivity R to the radioactivity remaining in
solution after 1 minute of isotopic exchange ^
radioactivity measured in the plant (MBq kg"' soil) grown on the OF treatment
radioactivity measured in the plant (MBq kg"1 soil) grown on the OF+DAP
treatment
radioactivity measured in the plant (MBq kg"1 soil) grown on the F treatment
radioactivity measured in the plant (MBq kg"1 soil) grown on the F +DAP
treatment
radioactivity in the plant coming from the available soil P (MBq kg"1 soil)
radioactivity in the plant coming from the available residual P (MBq kg"1 soil)
radioactivity (MBq) remaining in solution after a time t of isotopic exchange
radioactivity (MBq) remaining in solution after lmin of isotopic exchange
radioactivity (MBq) remaining in solution after an infinite time of isotopic
exchange
specific activity (ratio 33P / 31P)
specific activity ofthe applied fresh fertilizer (MBq mg"1 P)
specific activity in the plant grown on the OF soil (MBq mg"1 P)
specific activity in the plant grown on the OF+DAP treatment (MBq mg"1 P)
specific activity in the plant grown on the F soil (MBq mg"1 P)
specific activity ofthe plant growing on the F+DAP soil (MBq mg"1 P)

Summary

Summary 10
Summary
Phosphorus inputs in agro-ecosystems in amounts exceeding the P needs of plants have
resulted in the accumulation of available P in the surface horizon of most European
soils. Limiting the inputs of phosphate fertilizers in soil presenting a high available P
content can contribute to decrease P losses to ground and surface water. The general
objective of this work was to determine the contribution of residual fertilizations to crop
nutrition, in order to propose new fertilization strategies which would allow a reduction
of agricultural P losses to the environment while maintaining an optimum plant
production.
Seven Swiss long- or middle-term field experiments established on different soil types
and cropped with different rotations (six field crops rotations: Rümlang, FAL,
Eilighausen, Oensingen, Cadenazzo, Changins; one grassland:Vaz) were conducted
during 9 years (for 6 trials) or 27 years (for one trial) testing the effects of 3 P
fertilization regimes (OP: no P, P: P input equivalent to P off-take by crops, P>exp: P
input higher than P off-take) on crop yield, P uptake and soil P availability. The P
balances were calculated as the difference between P input and P off-take by crops. Soil
total, mineral, organic P and soil available P determined by the isotopic exchange
kinetics method and by four extraction methods (P-H2O, P-CO2, P-AAEDTA, P-Olsen)
were measured in the 0-20 cm and 30-50 cm layers of the soils cultivated under field
crop rotations and in the 0-10 cm layer of the grassland soil. Omitting P fertilization
resulted only in one field crop trial in significant yield decreases which were only
observed when the soil available P concentration characterized as the amount of P
isotopically exchangeable within one minute (Eimm) reached values lower than 5 mg P
kg"1 soil. The corresponding values determined by resp. the P-H2O, P-CO2, P-
AAEDTA, P-Olsen, extractions methods were resp. 1.0, 0.5, 34.5, 37.3 mg P kg"1 soil.
Omitting P fertilization decreased significantly P uptake on the grassland trial for soil
available P values much higher than for field crops rotations. Different P sources
contributed to the P nutrition of the crops when no P was applied: soil mineral P
decreased in the upper horizon at almost all sites, soil organic P decreased at two sites
and soil available P decreased in the 30-50 cm horizon. Available P decreased with time
Summary 11
in the upper horizon for all treatments, even when P inputs were higher than the crops
needs, showing that in these soils the higher P inputs were not sufficient to maintain the
high initial available P levels. Final values of isotopic exchange kinetics parameters
(R/ri, n, Cp) and Eimin depended strongly on the initial values (measured at the
beginning of trial) and on the P balance. The decrease of soil P availability measured by
extraction methods was highly correlated to the initial amount and to selected soil
characteristics. Altogether these results suggested that it is possible to model the
decrease in P availability in field crops grown in the absence of P fertilization in similar
agro-climatic conditions.
As soil P testing is of major importance for making sustainable fertilization
recommendations, the four extraction methods mentioned above were evaluated in their
ability to assess soil P availability in the same seven field experiments. This study
showed that each of these extraction methods could give a relevant information on soil
P availability since the amounts extracted were highly significantly correlated to the
amount of P isotopically exchangeable within one minute. A higher correlation
between the amounts of P extracted and the cumulated P balances was observed for the
Olsen extraction, suggesting that this method was the most adapted on the studied
systems to assess the changes in P availability when the soil P status changed. Finally,
the obtained results showed that the actual Swiss interpretation scales of the P-
AAEDTA and P-CO2 methods underestimated the soil available P status.
As residual value of fertilizers could not be estimated in field experiments where yield
is not limited by phosphorus, isotopic techniques were used under controlled conditions
in a pot experiment to estimate the contribution of past and fresh fertilizations to plant
nutrition. English ryegrass (Lolium perenne, cv Bastion) and white clover (Trifolium
repens, cv Milkanova) were grown on soils coming from three of the field experiments
described above: Cadenazzo, Ellighausen and Changins. Treatments with or without
application of fresh DAP (fertilizer-P labelled or not with 33P04) on soils with or
without residual P (residual-P labelled or not with 33P04) allowed the estimation of the
quantities of P taken up by plants coming from different sources of fertilizers. Fourteen

Summary 12
to 62% of the P taken up by the aerial parts of both plants, grown separately or in
association, were derived from the residual P-fertilizers whereas only 7 to 28% were
derived from a fresh P-fertilizer addition. The proportion of P derived from residual P
was mainly controlled by the total amount of P-fertilizers added to the soils, whereas the
proportion of P derived from fresh P-fertilizer was mainly controlled by the
concentration of P in the soil solution. The kinetics of P-uptake derived from the soil,
residual and fresh fertilizers were the same as the kinetics of dry matter yield production
of clover and ryegrass grown separately or in association, suggesting that the uptake of
phosphorus coming from different sources of fertilizers was controlled by the
accumulation of assimilates derived from the photosynthesis.
This work outlined the importance of long-term agricultural research for understanding
the soil-plant-fertilizer interactions and for the implementation of sustainable and
environmentally-sound fertilization strategies.

Résumé

Résumé 14
Résumé
Des apports de phosphore dans les agro-écosystèmes supérieurs aux besoins des
cultures ont conduit à l'accumulation de P disponible dans les horizons de surface de la
plupart des sols européens. Limiter les apports de fertilisants P sur les sols présentant un
niveau élevé en P disponible pourrait contribuer à réduire les pertes de P vers les eaux
de surface et profondes. L'objectif principal de ce travail était donc de déterminer la
contribution des fertilisations résiduelles à la nutrition des cultures afin de mettre en
œuvre de nouvelles stratégies de fertilisation qui permettraient de réduire les pertes de P
d'origine agricole dans l'environnement tout en maintenant un niveau optimal de
production.
Sept expériences suisses de longue ou moyenne durée établies sur différents types de
sols avec différentes rotations (six rotations avec des grandes cultures: Riimlang, FAL,
Ellighausen, Oensingen, Cadenazzo, Changins; une prairie permanente:Vaz) ont été
menées pendant 9 ans (pour 6 essais) ou 27 ans (pour un essai). Ces expériences
testaient les effets de 3 régimes de fertilisation phosphatée (OP: pas de fertilisation, P:
apports de P equivalents aux exportations des cultures, P>exp: apports de P supérieurs
aux exportations) sur les rendements et le prélèvement des cultures, ainsi que sur la
disponibilité du P dans le sol. Les bilans en phosphore ont été calculés en faisant la
différence entre les apports et les exportations des cultures. Le P total, minéral,
organique ainsi que le P disponible mesuré par la méthode des cinétiques d'échange
isotopique et par quatre méthodes d'extraction (P-H20, P-CO2, P-AAEDTA, P-Olsen)
ont été mesurés sur les couches 0-20 cm et 30-50 cm des rotations de grandes cultures et
sur la couche 0-10 cm de la prairie. L'absence de fertilisation a conduit à des
diminutions significatives de rendements des grandes cultures sur un seul essai à partir
de valeurs de P isotopiquement échangeable en une minute (Eimin) inférieures à 5 mg P
kg" soil. Les valeurs correspondantes déterminées par les méthodes P-H2O, P-CO2, P-
AAEDTA, P-Olsen, correspondaient respectivement à 1.0, 0.5, 34.5, 37.3 mg P kg"1
soil. L'absence de fertilisation P a conduit à une diminution significative des
prélèvements sur la prairie, alors que les valeurs de P disponible étaient bien plus
élevées que sur les rotations incluant des grandes cultures. On a montré que différentes

Résumé 15
sources de P ont contribué à la nutrition des cultures, car le P minéral a diminué dans
l'horizon supérieur de presque tous les sites, le P organique a diminué dans deux sites,
et le P disponible a décru dans l'horizon 30-50 cm. Le P disponible dans l'horizon
supérieur a diminué dans le temps pour tous les traitements même quand les apports
étaient supérieurs aux exportations des cultures. Ceci montre que dans ces sols, ces
apports élevés n'étaient pas suffisants pour maintenir des niveaux initiaux en P
disponible élevés. On a montré que les valeurs finales des paramètres des cinétiques
d'échange isotopique ((R/ri, n, Cp) et Eimin dépendaient fortement des valeurs initiales
(mesurées au début des essais) et du bilan. De même, la décroissance de la disponibilité
mesurée par les méthodes d'extraction était fortement corrélée aux quantités de départ
extraites et à certaines caractéristiques du sol. Tous ces résultats suggèrent qu'il est
possible de modéliser en absence de fertilisation P la décroissance de la disponibilité de
cet élément sur les rotations de grandes cultures dans des conditions agro-climatiques de
même nature.
Comme l'évaluation du statut phosphaté du sol est extrêmement importante pour établir
des recommendations de fertilisation durables, les quatre méthodes d'extraction
mentionnées plus haut ont été évaluées pour leur capacité à évaluer le P disponible dans
les sept mêmes expériences de longue durée. Chacune des méthodes était capable de
fournir des informations satisfaisantes sur la disponibilité du P, puisque les quantités
extraites étaient toutes hautement corrélées au P isotopiquement échangeable en une
minute. Une corrélation plus élevée a été cependant observée entre les quantités
extraites par la méthode Olsen et les bilans cumulés, ce qui montre que pour les
systèmes étudiés, cette méthode pourrait être la mieux adaptée pour estimer les
changements de disponibilité de P quand le statut P du sol change. Enfin, les résultats
obtenus ont montré que les barèmes actuels d'interprétation des méthodes P-CO2 et P-
AAEDTA sous-estiment le statut des sols en P disponible.
Comme il n'est pas possible d'estimer la valeur résiduelle des fertilisants sur des essais
où le P n'est pas un facteur limitant de la production, la contribution de fertilisations
fraîche et résiduelles a été mesurée dans une expérience en pots, en conditions

Résumé 16
contrôlées, à l'aide de techniques isotopiques. On a fait pousser du raygras anglais
(Lolium perenne, cv Bastion) et du trèfle blanc (Trifolium repens, cv Milkanova) sur
des sols provenant de trois des expériences de longue durée décrites plus haut:
Cadenazzo, Ellighausen et Changins. Grâce à des traitements où une fertilisation P
fraîche sous forme de DAP (fertilisant marqué ou non avec du PO4) était appliquée ou
non sur des sols avec ou sans P résiduel (P résiduel marqué ou non avec du PO4), on a
pu estimer les quantités de P prélevées par les plantes provenant des différentes sources
de fertilisation. De 14 à 62% du P prélevé par les parties aériennes des deux plantes
seules ou en association provenaient des fertilisations résiduelles alors que seulement de
7 à 28% avaient pour origine l'addition récente de P. La proportion de P dérivée des
fertilisations résiduelles était contrôlée essentiellement par la quantité totale de
fertilisants appliquée dans les sols, alors que la proportion de P dérivée de la fertilisation
récente était plutôt dépendante de la concentration en P dans la solution du sol. Les
cinétiques de prélèvement de P provenant du sol, des fertilisations résiduelles et fraîche
étaient les mêmes que celles de la production de matière sèche. Ceci suggère que le
prélèvement de P provenant de différentes sources de fertilisants était contrôlé par
l'accumulation dans la plante des assimilats dérivant de la photosynthèse.
Ce travail souligne l'importance de la recherche de longue durée en agriculture afin de
comprendre les interactions sol-plante-fertilisant, et de mettre en œuvre des stratégies de
fertilisation durables et respectueuses de l'environnement.

General introduction

General introduction 18
Phosphorus in soils
Soils contain between 100 and 3000 mg P kg-1 soil (Frossard et al, 2000). In
uncultivated soils, the soil parent material and the pedogenesis determine the nature and
stability of native P (Walker and Syers, 1976) while P inputs are generally small.
Agricultural systems are characterised by increased P inputs through fertilization and by
increased P outputs through crops removals. Finally, the low concentration and low
solubility of phosphorus in soils make it commonly a growth limiting nutrient in soils.
Role ofphosphorus in plants
Phosphorus is an essential constituant of nucleic acids composing DNA and RNA
molecules, and therefore plays a key-role in the constitution and translation of genetic
information. Phospholipids are constituants of biomembranes, P as ATP has a central
role in the energy transfer in the cell (Marschner, 1995). During the vegetative stage of
growth, phosphorus requirement for optimal growth is in the range of 0.3-0.5% dry
matter. P deficiency results in reduced leaf growth, reduced photosynthesic activity and
therefore reduced root growth and crop yield (Plénet et al., 2000; Mollier and Pellerin,
1999).
Plant P uptake and requirements
Plants act as a sink for P. Phosphorus is taken up by roots from the soil solution mainly
as orthophosphate ions H2PO4" and HPO42". This is an active, energy dependent process
where uptake occurs against an electrochemical gradient and is mediated by a H
cotransport (review by Frossard et al., 1995). Plants have access to soil P by three
mecanisms: root interception (negligible), mass flow and diffusion, which is the
movement of a substance from one region to adjacent regions where that species has a
lower concentration. Ninety five percent of P taken up by crop plants is attributed to
diffusion from the soil to the root (Jungk and Claassen, 1997). Diffusion depends on
soil characteristics, water content, structure, etc and plant characteristics, such as
kinetics of P uptake, size and morphological properties of the root systems, the
symbiosis with mycorrhizae. Moreover, the exudation of protons, of low molecular
weight organic ligands or enzymes in the rhizosphere may contribute to the liberation of

General introduction 19
Pi from insoluble Pi forms or from organic P (Frossard et al., 1995). Plant species differ
in their internal requirements, i.e. the amount of P needed in the plant to produce one
unit of dry matter (P concentration) and in their external P requirements, i.e. the needed
P content in soil to achieve a satisfying yield (Föhse et al., 1988). Responsiveness to P
fertilization therefore vary among plant species (Greenwood et al., 1980). For instance,
yield variations depend much more on variations of soil P level for beet or potato than
for wheat or maize. For the particular case of the Swiss agriculture, field crops
exportations are ranging between 20 kg P ha"1 year"1 for barley and 49 kg P ha"1 year"1
for beet, and between 9 and 47 kg P ha"1 year"1 for grassland, depending on the use
intensity (Walter at al., 2001).
Soil P availability
In Western European soils, the P from the soil solution represents in average only 2% of
the total plant uptake (Fardeau, 1996). Consequently, during plant growth, most of the
plant Pi has to be delivered from the solid phase of the soil by a combination of abiotic
processes such as dissolution and desorption, and biotic processes such as
mineralisation (Frossard et al., 2000).
Pi availability is characterised by three factors (Beckett and White, 1964): (i) the
intensity factor, which is the activity of phosphate ions in the soil solution, (ii) the
quantity factor, which is the amount of P that can be released from the soil solid phase
into the soil solution, and (iii) the buffer capacity, which describes the ability of a soil to
maintain the intensity constant when the quantity varies.
P fertilization of agricultural soils is generally needed to maintain the initial soil P
fertility or to increase it if it is low, in order to reach a satisfying level of crop
production. Phosphorus availability has therefore to be estimated in order to make
appropriate fertilizer recommendations. Different methods can be used for this purpose:
the isotopic exchange (Fardeau, 1996) that will be fully described in the first chapter of
this thesis, other methods using an anion exchange resin (Sibbesen, 1978), or an infinite
sink (Lookman et al. 1995) and extraction methods (Kamprath and Watson, 1980).
Chemical extractions with water, acids or bases remain the most simple, rapid and
cheap methods to estimate soil P availability, even if it has been shown that they extract

General introduction 20
variable proportions of available and unavailable P (Fardeau et al, 1988; Kato et al,
1995). The amounts of P extracted are generally correlated to the crops yield and uptake
in order to determine a so-called "critical P level", which is an estimate of the optimum
P status for an optimum crop production (Dahnke and Olson, 1990). Once this critical
value has been determined, soil P supply can be divided into different categories (for
instance low, medium, high) corresponding to the different probabilities to obtain a crop
response to applied nutrient. This evaluation of soil P status as respectively high,
medium or low will afterwards determine the P fertilizer quantities to be applied: e.g. no
P, P applications covering crop offtakes, P applications higher than crop offtakes
(Tunney et al. 1997). In Switzerland, two extraction methods are used: C02-saturated
water (Dirks-Scheffer, 1930) and ammonium acetate EDTA (Cottenie et al., 1982).
More details will be given on these methods in the Chapter 2 of this thesis.
Pfertilization and residual P
P fertilizers can be added as water soluble inorganic fertilizers, as less soluble inorganic
fertilizers (rock phosphates) and as organic fertilizers of varying origins. In this thesis
only fertilization with water soluble inorganic fertilizers will be studied. When a P
fertilizer is added to soil, complex reactions occur (Sample et al., 1980): phosphate is
closely and chemically bonded to the surface of Fe and Al oxides, or with CaC03 in
calcareous soils. These reactions take place in two steps: a rapid step in which some of
the phosphate ions are adsorbed on the surface of soil particles, then a slower step in
which phosphate is converted in a more firmly held form with solid-state diffusion
processes (Barrow, 1980). The fraction of P applied transferred on soil components
varies with soils, but it increases when time of contact between soil and phosphate and
temperature increase for all soils (Barrow, 1983). When fresh soluble fertilizers are
applied to agricultural soils, only a small proportion (from nearly 0% to 15%) of such
fertilizers is taken up by crops the first year (Morel, 1988; Morel and Fardeau, 1990)
and gradually less the following years. Consequently, up to 85 % of the P applied one
year remains in the soil and react with soil components or becomes for a limited fraction
microbial P (Fardeau, 1996). Nevertheless, the residual P can contribute to the nutrition
of present crops. This residual value of past fertilizations has been measured most of the

General introduction 21
times in P limited soils, where differences of crops yield or uptake could be observed in
presence of residual fertilizers (Barrow, 1980; Mendoza, 1992; Bolland et al., 1999). On
soils where plant nutrition is not limited by phosphorus, residual value of fertilizers can
be measured with isotopic techniques (Morel, 1988; Morel and Fardeau, 1989 a and b).
These techniques will be presented in detail in the third chapter of this thesis. Residual
value of fertilizer can be also measured in long-term field experiments by comparing
yield and crop uptake obtained on fertilized plots with those obtained on plots where
fertilization was omitted (Boniface and Trocmé, 1988; Mc Collum, 1991).
Long-termfield experiments
Long-term field experiments are indispensable for agricultural and ecological research
(Poulton, 1996). They allow to identify the biological, and physico-chemical factors
which control the productivity of agricultural systems. The long-term field studies are
essential because many soil properties change very slowly over time, and it is therefore
difficult to detect the effects of a particular treatment on short-term experiments. In the
particular case of phosphorus, it is difficult to detect many effects quickly, because of
the high reactivity and buffering capacity of P in soils and the interactions with soil
inorganic and organic components that happen simultaneously (Rubask, 1999). Long-
term field experiments allow to determine the critical soil P levels below which yield of
crops will decline appreciably. They are an essential tool for the calibration of
extraction methods, as seen before. Moreover, observations in agricultural research may
have a great variability due to soil properties, climate, varieties, etc and long-term
observations are also required to separate a trend from a very variable background
(Southwood, 1994). Finally calculations of P balances (P inputs minus P outputs) can
only be made over long periods, because it is difficult to measure accurately small
changes over short periods against the large quantities of P usually present in soil.
Long-term field experiments provide not only informations on nutrient cycling in
agrosystems, but they are also the basis for long-term political objectives, such as for
example the introduction of legislation which limits the inputs to the land (Ellmer et al.,
2000). Long-term research is therefore essential for the establishment of a sustainable
agriculture, and particularly the sustainable management of the limited resources in P

General introduction 22
implies to consider the long-term effects of different P fertilization strategies not only
on the crops but also on the environment.
Environmental issues
Phosphorus applied as fertilizer to arable lands often improves crop production. The
extent of P fertilization varies greatly between developed and industrialised countries. In
general, P deficiency is typical of developing countries (Sanchez and Uehara, 1980),
whereas high application rates in the industrialised ones have raised environmental
issues (Sharpley and Menzel, 1987). Long-term application of phosphate fertilizers at
levels exceeding crop requirements have resulted in the accumulation of high
concentration of available P in the surface horizon of most European soils (Sibbesen
and Runge-Metzger, 1995). This has increased the losses through runoff, erosion and
leaching of P from agroecosystems to ground and surface waters (Sharpley and Withers,
1994; Sinaj et al., 2002). In Switzerland, in 1995, the total P inputs in agriculture was
20000 t year"1 (51% mineral fertilizers) and the P balance calculated between 1975 and
1995 was a positive balance of+13kg P ha"1 (Spiess and Besson, 1999). Furthermore,
the eutrophication of some lakes on the Swiss plateau was related to diffuse P losses
from agricultural soils which had been heavily fertilized with organic and inorganic
sources of P (Stamm et al., 1998; Gächter et al, 1996). In order to limit the losses of P
to the environment, the Swiss agricultural authorities have proposed, within the frame
work of "integrated production" to calculate the P fertilization according the following
criteria (Walter et al., 1994): (i) the P requirements of the crops, defined by the quantity
of P contained in harvested products, (ii) the P level in the surface horizon, which is
determined using a chemical extraction to measure a quantity, corrected using the soil's
clay content as an indicator of the soil's buffer capacity, (iii) the P balance of the
complete farm, which has to be equilibrated. However, in order to limit these
environmental problems linked to P losses, it is maybe not only necessary to limit P
inputs but also, if crop yields and quality remain unaffected, to even decrease soil P
availability.

General introduction 23
Thesis objectives
As most of the Western European soils, Swiss agricultural soils have been fertilized for
many years, in amounts larger than the crops exportations, and this excess of P
fertilizers should have accumulated in soils. The main hypothesis of this work was that
fertilizers added in the past could contribute to the nutrition of present crops and that it
was possible to stop P fertilization during a time to be defined without any negative
effect on crop production. The objective of this thesis was therefore to determine the
contribution of residual fertilizations to crop nutrition, in order to implement new
fertilization strategies which would allow a reduction of agricultural P losses to
environment while maintaining an optimum plant production.
In the first chapter, we have studied the influence of three different P fertilization
regimes (OP, no P applied since the beginning of the trials; P: P fertilization covering
the crop exportations; P>exp: P fertilization higher than the crops exportations) on crop
yield and P uptake in seven Swiss long- or middle-term field experiments with different
rotations of crops with different P requirements. In this part, soil P availability was
determined with the isotopic exchange kinetics method of Fardeau (1996).
As extraction methods remain the routine methods to estimate soil P availability and
therefore to make fertilizer recommendations, we have evaluated in the second chapter
four extractions methods in their capability to assess the changes in phosphorus
availability induced by the same P fertilization treatments in the same field experiments
as in the chapter 1. The extraction methods tested were water extraction, sodium
bicarbonate extraction (Olsen et al., 1954), and two methods commonly used in
Switzerland: C02-saturated water (Dirks-Scheffer, 1930) and ammonium acetate EDTA
extraction (Cottenie et al., 1982). Extraction results were compared to those obtained
with the isotopic exchange method (Fardeau, 1996), used as a reference for P
availability determination.
In the third chapter, we assessed in a pot experiment by the use of isotopic techniques
(Morel and Fardeau, 1989 a and b) the efficiency of fertilizers applied either in the past

General introduction 24
or freshly for two plants grown separatly and in association, Lolium perenne and
Trifolium repens, and on soils non limited in P coming of three of the seven field
experiments cited above.

CHAPTER I
Effect of P input / output regime on soil P exchangeability, crop yields and P
uptake under a temperate climate

I. Effect of P input/output regime on soil P exchangeability, crop yields and P uptake 26
Abstract
Limiting the inputs of phosphate (P) fertilizers in soil of high available P concentration
can contribute to decrease P losses to ground and surface water. However, such a
strategy is acceptable only if crop yields remain unaffected. Seven Swiss field
experiments established on a wide range of soil types and cropped with different
rotations (6 field crops rotations, 1 grassland) were conducted during 9 years (for 6
trials) or 27 years (for one trial) evaluating the effects of 3 P fertilization regimes (no P,
P input equivalent to P off-take by crops, P input higher than P off-take) on crop yield,
P uptake and soil P availability. The P balances were calculated as the difference
between P input and P off-take by crops. Soil total, inorganic, organic P and available
soil P determined by isotopic exchange kinetics were measured in 0-20 cm and 30-50
cm layers of soils cultivated under field crop rotations and in the 0-10 cm layer of the
grassland soil. Omitting P fertilization resulted only in one field crop trial in significant
yield decreases, which were only observed when the available soil P concentration (i.e.
the amount of P isotopically exchangeable within one minute (Eimin) reached values
lower than 5 mg P kg"1 soil. Omitting P fertilization significantly decreased P uptake on
the grassland trial. When no P was applied, soil inorganic P decreased in the upper
horizon at almost all sites (from 468 to 418 mg P kg"1 soil in average), soil organic P
decreased at two sites (from 515 to 466 mg P kg"1 soil in average), suggesting that
different P sources contributed to the P nutrition of the crops. Available P decreased
with time in the upper horizon for all treatments (from 15.6 to 7.4 mg P kg"1 soil in
average), even when P inputs were higher than the crops needed, showing that in these
soils, the higher P inputs were not sufficient to maintain the high initial available P
levels. Final values of isotopic exchange kinetics parameters (R/ri, n, Cp) and Eimin
depended strongly on initial values (measured at the beginning of trial) and on P
balance. These results suggest that knowing initial soil P availability and expected P
balance, it is possible to predict the decrease of available soil P in field crops grown in
the absence of P fertilization in similar agro-climatic conditions as those studied here.
Key-words: field crop rotations, field experiments, isotopic exchange kinetics, grassland, P availability,
phosphorus fertilization

I. Effect of P input/output regime on soil P exchangeability, crop yields and P uptake 27
Introduction
Phosphorus inputs in agro-ecosystems in amounts exceeding the P needs of plants
resulted in the accumulation of high concentration of available P in the surface horizon
of most European soils (Sibbesen and Runge-Metzger, 1995). The transfer of P from
agricultural soils to water bodies is positively correlated to the soil available P content
(Sibbesen and Sharpley, 1997). To limit the environmental problems linked to P losses
it is therefore necessary to limit P inputs and in certain cases to decrease soil P
availability. However this can only be accepted if crop yields remain unaffected by the
decreased rates P of fertilization.
The effect of different rates of P fertilization on crop yield and soil P availability can
only be answered by long-term field experiments. Works published for the Temperate
Zone determining critical levels of available P under which the yields of specific crops
significantly decreased, have been carried in a limited number of situations (Mc Collum,
1991; Webb et al., 1992; Stumpe et al., 1994; Jungk et al., 1993; Rubaek, 2000; Morel et
al., 1992). These works showed that depending on the initial soil P status, on the
climatic conditions and crop P requirements, the time during which P fertilization can
be omitted without any significant yield losses or differences in P uptake varies from 1
(Richards et al., 1998) to 60 years (Ellmer et al., 2000). However in most of the cases
the omission of P fertilization for periods shorter than 10 years had no significant effect
on crop yield (Boniface and Trocmé, 1988; Jaakola et al., 1997; Gransee and Merbach,
2000). This set of data must, however, be completed to identify the soil available P level
above which the yield of different crops grown under different environmental
conditions does not increase after an additional P fertilization, and the soil available P
level below which P fertilization systematically increases yields. Furthermore
information is needed to predict how long can P fertilization be omitted without
affecting yield in rotation including crops with high P requirements grown under
different environmental conditions.
The objective of the present work was to study the influence of different P fertilization
regimes (no P application, P inputs covering crop exportations, P inputs higher than
crop needs) on crop yield and P uptake in seven field experiments in which crops with
different P requirements were grown in different rotations. These parameters were then

I. Effect of P input/output regime on soil P exchangeability, crop yields and P uptake 28
compared to the changes in total, inorganic, organic, and soil available P measured after
4 and 9 years for six of the seven field experiments and after 22 and 27 years for the last
trial. Soil P availability was assessed using an isotopic method (Fardeau, 1996).
Materials and Methods
Experimental sites andPfertilization treatments
Six of the seven field experiments were established by the Swiss Federal Station for
Agroecology (Zurich) in 1989 in Rümlang (canton of Zurich), Reckenholz-FAL (canton
of Zurich), Ellighausen (canton of Thurgau), Oensingen (canton of Aargau), Cadenazzo
(canton of Ticino) and Vaz (canton of Graubünden). The oldest trial was established in
1971 by the Swiss Federal Research Station for Plant Production (Nyon) in Changins
(canton of Geneva). All trials are still ongoing. Their location, climate and soil
characteristics are given in Tables 1.1 and 1.2. Rotations were field crops at all sites
excepted at Vaz that was under permanent grassland (Table 1.3).
The experiments had one factor randomized block design with six different phosphorus
rates at Rümlang, FAL, Ellighausen, Oensingen and Cadenazzo. There were 4 field
replicates for each P level. Each microplot had a length of 8.25 m and a width of 4 m
(except Cadenazzo: length of 8 m and width of 4.5 m), and a distance of 1.25 m
separated micro-plots along the smallest side. P treatments studied were OP: no P
applied; P: P applied as triple superphosphate in quantities equivalent to the P off-take
by the crops; P>exp: P applied as triple superphosphate in quantities higher than the
off-take by the crops (5/3 of the P off-take). Apart from P, all the other nutrients were
applied in the trial according to the Swiss guidelines for integrated production (Walter
et al., 1994), i.e. the nutrients were applied according to the requirements of the crops
and their availability in the soil. The micro-plots were ploughed along their longest side
and crop residues were taken off the field.
At Changins, the experiment had a randomized block design with 5 different treatments
P-K and 4 field replicates. Each micro-plot had a length of 15 m and a width of 8m, and
a distance of 1 m separated micro-plots along the smallest side. Treatments studied were

I.EffectofPinput/output
regi
meon
soilPexchangeability,
cropyi
elds
andPuptake
29
Table
1.1.Main
characteristicsofthesevenex
peri
ment
alsites.
Experimental
FAO
location
altitude
meanannual
prec
ipit
ation
plough
soil
apparentdensityof
site
soil
classification
temperature
depth
surfacehorizon
(m)
(°C)
(mm)
(cm)
(g.c
m"3)
Rümlang
CalcaricCambisol
681.95E/254.82N
443
8.5
1042
25
1.37
FAL
EutricGl
eyso
l681.95E/254.82N
443
8.5
1042
25
1.14
Elli
ghau
sen
EutricCambisol
728.1IE/274.62N
440
8.5
916
25
1.22
Oensingen
Gley
i-ca
lcar
icCambisol
622.10E/237.07N
422
8.2
1013
25
1.3
Cadenazzo
EutricFluvisol
715.50E/113.21N
197
10.5
1772
25
1.22
Changins
Gley
icCambisol
507.85W/139.30N
438
9.5
940
25
1.22
Vaz
Gley
icFluvisol
759.01E/173.08N
1190
4.9
1042
10
1.07
Table
1.2.Mainph
ysic
o-ch
emic
alcharacteristicsofthesurfacehorizonofthestudied
soils.
Experimental
site
pH(H20)
Corg
clay
sand
Aid
Fed
CEC
cmol
ckg
"1&KB
Rümlang
7.9
20
240
458
1.22
11.22
21.3
FAL
7.4
27
388
260
1.42
11.94
35.1
Ellighau
sen
6.7
23
329
307
1.74
9.10
37.0
Oensingen
7.0
24
370
225
1.29
14.82
26.6
Cadenazzo
6.3
14
91
362
1.09
8.35
14.3
Changins
6.7
48
540
160
1.93
15.88
29.4
Vaz
6.8
65
273
397
n.d.
n.d.
n.d

I.EffectofPin
put/
outp
utre
gime
on
soilP
exchangeability,
cropyi
elds
andPuptake
30
Table
1.3.
Croprotationsforthedifferentex
peri
ment
alstations.
19711989
1990
1991
1992
1993
1994
1995
1996
1997
1998
Rümlang
*grass.R
wheat
maize
wheat
/grass.R
potato
wheat
/grass.R
grass.R
potato
wheat
FAL
grass.R
wheat
maize
wheat
potato
wheat
/grass.R
grass.R
potato
wheat
Ellighausen
wheat
potato
barl
ey/grass.R
maize
beet
grass.R
grass.R
potato
wheat
Oensingen
barl
ey/grass.R
maize
wheat
/grass.R
beet
grass.R
grass.R
maize
beet
wheat
/grass.R
Cadenazzo
maize
soybean
potato
wheat
/grass.R
grass.R
maize
/grass.R
soybean
potato
wheat
Changins
*w/m/w/r
rape
wheat
maize
wheat
rape
wheat
maize
wheat
rape
Vaz
*Per.grass.
Per.grass.
Per.grass.
Per.grass.
Per.grass.
Per.grass.
Per.grass.
Per.grass.
Per.grass.
Abbreviations
*w/m/w/r:rotationwheat-maize-wheat-rape
*grass.R:grasslandincludedincroprotation
*Per.grass:permanentgrassland

I. Effect of P input/output regime on soil P exchangeability, crop yields and P uptake 31
OP: no P,no K applied; P: P as triple superphosphate and K applied in quantities
equivalent to the off-take by the crops and P>exp: P applied as triple superphosphate in
quantities equivalent to the off-take by the crops with an additional fertilization of 26.2
kg P ha"1, and 166 kg K ha"1 were added to the normal K fertilization. N was applied in
the trial according to the Swiss guidelines for integrated production (Walter et al.,
1994). The micro-plots were ploughed along their longest side and crop residues were
left on the field.
In Vaz the trial was a 4x4 factorial experiment including four different rates for
phosphorus and potassium. Each micro-plot had a length of 5 m and a width of 2 m, and
a distance of 1 m between micro-plots along the smallest side. Three P treatments were
studied in this trial: OP no P applied; P: P spread at the surface as triple superphosphate
in quantities equivalent to the off-take by the crops and P>exp: P applied as triple
superphosphate in quantities higher than the off-take by the crop (3/2 of the P off-take).
Potassium was applied at the same rate: 179.3kg K ha"1, while N was applied according
to the Swiss guidelines for integrated production (Walter et al., 1994).
Soil sampling
Soils were sampled yearly, after the harvest and before the fertilizer application, from
the plough (0-20 cm) and the 30-50 cm layers for all sites except Changins (only the 0-
20 cm layer) and Vaz (grassland) where the soil was only sampled from the topsoil, 0-
10 cm layer. At least 8 cores with a diameter of 2.5-3 cm were taken randomly within
the fertilized area of each plot. Plant residues were removed from the soil and the
individual samples were mixed to form a composite sample per plot. The soils were
then air-dried and sieved at 2 mm before being used for further analysis. To compare
treatment effects with the original soil status, samples of the plough layer from 1989
(the first year of the trial), 1993 and 1998 were analyzed for all sites except Changins
where, because of the lack of the initial samples, only the samples from 1993 and 1998
were analyzed. Samples from the 30-50 cm layer were analyzed in 1989 and 1998.

I. Effect of P input/output regime on soil P exchangeability, crop yields and P uptake 32
Phosphorus analyses
Total, inorganic and organic phosphorus. Total phosphorus (Pt) and total inorganic
phosphorus (Pi) were measured using the ignition method described by Saunders and
Williams (1955). One gram of soil sample was ignited at 550 °C for 1 hour. Both
ignited and unignited soil samples (1 g) were then extracted with 50 ml 0.5 M H2SO4
for 16 hours. The P in the extracts was determined using malachite green colorimetry
(Ohno and Zibilski, 1991) after filtration of the extracts (Whatman 40). The quantity of
P extracted from the ignited soil was considered as the total P content of the soil. The
quantity of P extracted from the non-ignited soil was considered as the total inorganic P
content of the soil. The total organic P (Po) was calculated as the difference between
total P and total inorganic P. For these agricultural soils, P extracted with H2SO4 from
ignited soils was not different (p<0.001, data not shown) from the total P extracted from
0.5 g dry soil with a microwave digestion method (Microdigest A 301, Prolabo)
combining subsequently an extraction with 5 ml concentrated (95-97%) H2SO4 during
15 min at a 70 W microwave power, with H2O2 30% (8 ml added in 4 steps of 2 min
with a 80 W microwave power) and with concentrated (70%) HCIO4 (5 ml added in 2
steps of 10 min with a 40 W microwave power)
Isotopic exchange kinetics. According to Beckett and White (1964), P availability is
governed by three factors: (i) the intensityfactor, which is the activity of phosphate ions
(H2PÛ4~; HPO4 ~) in the soil solution; (ii) the quantity factor, which is the amount of
phosphate ions that can be released into the soil solution from the solid phase of the soil
during the interval of time considered for plant growth and (iii) the buffer capacity,
which describes the ability of a soil to maintain the intensity factor constant when the
quantity varies.
The experimental procedure of the isotopic exchange kinetics method, conducted on a
soil-solution system in a steady-state with a soil solution ratio of 1:10 has been recently
described (Fardeau, 1996; Frossard and Sinaj, 1997). After an addition of a solution of
carrier-free PO4 ions to a soil solution system in steady-state, the soil solution is
sampled four times from 1 to 100 minutes. When 33PÛ4 ions are added to a soil solution

I. Effect of P input/output regime on soil P exchangeability, crop yields and P uptake 33
system at a steady-state equilibrium, the radioactivity in solution decreases with time
according to the following equation (Fardeau et al, 1985):
rt/R = (n/R) x [t + (n/R)1/n ]-n + rJR [1]
where R is the total introduced radioactivity (= 0.1 MBq); n and rx are, respectively, the
radioactivity (MBq) remaining in the solution between 1 minute and infinity, and n is a
parameter describing the rate of disappearance of the radioactive tracer from the
solution after 1 minute. The parameter n is calculated as the slope of the linear
regression between log [r(t/R] and log(t). The ratio r«, /R, which is the maximum
possible dilution of the isotope, is operationally approximated by the ratio of the water
soluble P to the total inorganic P of the soil (Pl5 expressed in mg P kg"1 soil; Fardeau,
1996). Thus:
roo/R=10xCp/P1 [2]
where Cp is the water soluble P (mg P L"1). The factor 10 arises from the fact that,
during the experiment of isotopic exchange, the soil: solution ratio is 1:10 so that 10 x
Cp is equivalent to the water-soluble P quantity in the soil expressed in mg kg" .
The quantity, E(t) (mg P kg"1 soil), of isotopically exchangeable P at a time t can be
calculated assuming that (i) 31P04 and 33PÛ4 ions have the same fate in the system and
(ii) whatever the time, t, the specific activity of the phosphate ions in the soil solution is
similar to that of the isotopically exchanged phosphate ions in the whole system:
rt/(10xCp) = R/E(t) [3]
Therefore, Et = 10 x CP x (R/rt) [4]
For t = 1 minute, Eimi„ = 10 x CP x (R/ri) [5]
R/n is an estimation of the P-ions buffering capacity of soils (Frossard et al., 1993;
Salcedo et al., 1991; Sen Tran et al., 1988). With R/n being higher than 5, the buffering
capacity is considered to be high, with 2.5 - 5 medium and below 2.5 low.
To obtain data that are relevant from an agronomic point of view, Fardeau (1996)
proposed the following pools depicting P availability.

I. Effect ofP input/output regime on soil P exchangeability, crop yields and P uptake 34
(i) The pool of P exchangeable within 1 minute (Eimin). Ions present in this pool are
composed of ions in the soil solution and those ions that are adsorbed on the solid phase
of the soil but have the same kinetic properties than those in solution (Fardeau et al.,
1985; Morel et al., 2000). Phosphate ions located in this compartment are completely
and immediately plant available.
(ii) The pool ofP exchangeable between 1 minute and 3 months (Eimin-sn) corresponds
to the quantity of phosphate exchangeable during a period equivalent to the time of
active P uptake by the entire root system of an annual crop.
(iii) The pool ofP which can not be exchanged within 3 months (E>3m) represents forms
of P which are not readily available to plants.
The P content of Eimin_3m pools is calculated using equation [4] while the P content of
E>3m pool is calculated as the difference between the total inorganic P and the amount of
P exchangeable within 3 months (E3m).
The isotope exchange kinetics method provides information on: (i) the quantity of
isotopically exchangeable P [E(t)] which gives information on the quantity factor, and
(ii) the R/ri ratio which corresponds to the capacity factor. Simultaneously, the
phosphate concentration in the soil solution (Cp) which corresponds to the intensity
factor, is determined.
Harvest andplant analyses
The crop rotations are shown in Table 1.3. The harvested area varied between years,
depending on the crops. For cereals, the harvested area was 1.32 m x 7 m, for maize and
potato 1.5 m x 7 m, for grassland in crop rotations 1.5 m x 6.75 m, and for permanent
grassland 1.25 m x 5 m. Dry matter and P content of each crop component (aerial parts
for maize, wheat, barley, soybean, rape; aerial parts and tubers and roots for
respectively potato and beet) and of each grass cut (aerial parts) were determined for
each treatment and each year. The P content in plant material was determined using
colorimetry (Murphy and Riley, 1962) after calcination of 5g plant material (2h at
450°C) and subsequent solubilization of the ashes in 7.5ml concentrated (37%) HCl and

I. Effect of P input/output regime on soil P exchangeability, crop yields and P uptake 35
5 ml HF (40%). The P balances were calculated by cumulating the yearly fertilizer
inputs and subtracting the cumulated P uptake by crops. P uptake was calculated from
yields and P contents of all the harvested crop components.
Statistics
Specificity oflong-termfield experiments
Some difficulties may arise when working with data from long-term field experiments:
(i) some informations or observations may be missing, (ii) the measurements can be
difficult to interpret, because the treatments effects may develop very slowly with time
and large variations between years can be observed (Jaakola et al., 1997), especially for
yields because of different conditions in the growing season (Rubœk, 2000), (iii) the
trial design and decision about measurements were often made by someone else several
years ago, and the objectives for the experiment now may be different from those
decided at the beginning, (iv) statistical methods used today does not correspond exactly
to the old experimental design. These specific experiments have to be carefully
statistically analyzed, because data recorded from the same plots through several years
are correlated, and there are few replications for the different treatments studied. These
various statistical difficulties may be overcome by choosing an appropriate statistical
analysis.
Yields: Except for the Vaz grassland, the crop rotations included more than one crop.
Thus, to perform statistical analyses on time series of yield from variable crops, the dry
matter yield each year was expressed as the percentage of the yield obtained on the P
treatment (relative yield), assuming that the yield obtained from this treatment was the
optimal yield for the analyzed crop and soil type. The effect of P fertilization on crop
yields and P uptake was tested with an ante-dependence analysis of covariance (Ersb0ll,
1994; Kenward, 1987; Rubaek, 2000) on the relative yield and performed with the
MIXED procedure of the SAS software (SAS Institute, Cary, NC, USA, version 8,
2000). In this modified multivariate analysis, the measurement of the previous year was

I. Effect of P input/output regime on soil P exchangeability, crop yields and P uptake 36
included as covariate making possible the differentiation of the time profiles between
treatments.
Soil analysis: Comparisons of P availability parameters measured between 1989 and
1993 or 1989 (1993 for Changins) and 1998 for each treatment were performed using
the T-TEST procedure with paired comparisons (SAS, 2000), because measurements on
the same plots were not independent. Treatment effects in 1998 were detected for each
site by performing one-way analysis of variance (ANOVA) with the GLM procedure of
the SAS software. Means were compared with the Duncan's multiple range test;
statistical significance indicated at the 0.05 probability level. Linear regressions were
performed using the REG procedure of the SAS software.

I. Effect of P input/output regime on soil P exchangeability, crop yields and P uptake 37
Results and discussion
Yields
The mean, minimum and maximum yields obtained for the different crops of the
studied rotations are presented in the Table 1.4.
Table 1.4. Mean, minimum and maximum yields obtained in the seven field experiments
over all years and treatments for the main crop components
crops component mean yield minimum maximum
tha"1
beet roots 18.9 9.6 29.0
maize grains 8.1 1.1 11.5
potato tubers 6.9 2.2 12.3
soybean grains 3.3 2.9 3.7
wheat grains 5.2 2.0 6.9
barley grains 6.9 5.2 8.4
rape grains 2.5 1.3 3.7
grassland R all cuts 11.7 6.1 17.4
grassland P all cuts 7.6 4.2 10.7
The ante-dependence analysis performed for all sites from 1989 to 1998 showed that no
significant differences in yields were observed between the three treatments (OP, P,
P>exp) at six from the seven trials (Table 1.5). The relative yields compared to the P
treatment are shown in the Figure 1.1 for the Cadenazzo trial. The yields observed in the
OP treatment at Rümlang are since 1994 significantly lower than those observed in the
two other treatments (P and P>exp) (Figure 1.2). The first crop on which a yield
decrease was observed in the absence of P fertilization was potato that is known for its
high requirements in nutrients (Greenwood et al., 1980; Khiari et al., 2000). The results
obtained in our study agree with those of previous works showing that for diverse soil
types and crop rotations under European conditions, the omission of P fertilization for
periods shorter than 10 years has little effect on crop yield (Boniface and Trocmé, 1988;

I. Effect of P input/output regime on soil P exchangeability, crop yields and P uptake 38
Figure 1.1. Relative yields for the main crops components expressed as percentage of
the yields obtained on the P treatment in the Cadenazzo site from 1990 to 1998.
180
160
140
^ 120
S
2 100
<u
I 80
*60
40 -
20
0
-- OP
-
—— p
-•- 5/3P
-/\
mr^^Jm~ —è—**
1990 1992 1994
years
1996 1998
Figure 1.2. Relative yields for the main crops components expressed as percentage of
the yields obtained on the P treatment in the Rümlang site from 1990 to 1998.

I. Effect of P input/output regime on soil P exchangeability, crop yields and P uptake 39
Rubaek, 2000; Ellmer et al., 2000; Jungk et al., 1993; Gransee and Merbach; 2000).
Stumpe et al. (1993) reported also that alfalfa, potato and sugar beet showed the highest
yield decreases after 20 years without P fertilization in a Phaeozem soil.
Table 1.5. Results of the ante-dependance analysis performed for the period 1989-
1998 in all sites for yields of main crop components and total plant P uptake.
Experimental site Effect of P fertilisation Effect of P fertilisation
on yields on P uptake
Rümlang *
FAL n.s.
Ellighausen n.s.
Oensingen n.s.
Cadenazzo n.s.
Changins n.s.
Vaz n.s.
* indicates significance at p < 0.05
** indicates significance at p < 0.01
n.s. indicates no significance at p < 0.05
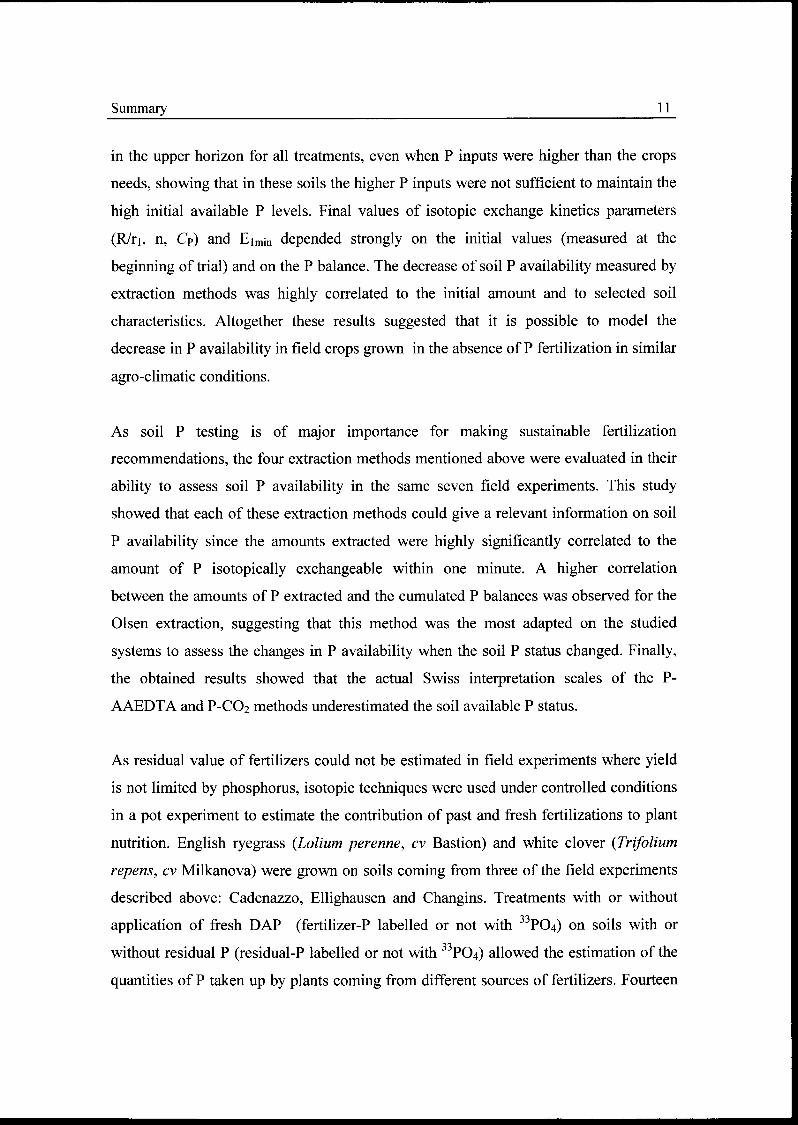
P uptake andPconcentration in different crop species
The ante-dependence analysis performed for all sites from 1989 to 1998 showed that no
significant differences in P uptake were observed between the three treatments (OP, P,
P>exp) at five of the seven sites (Table 1.5). After nine years, the treatment OP resulted
in lower P uptake only in Rümlang and Vaz while the P and P>exp treatments gave
similar results (Table 1.5, Figures 1.3 and 1.4). The first statistically significant
difference in P uptake between OP on one side and P and P>exp on the other side was
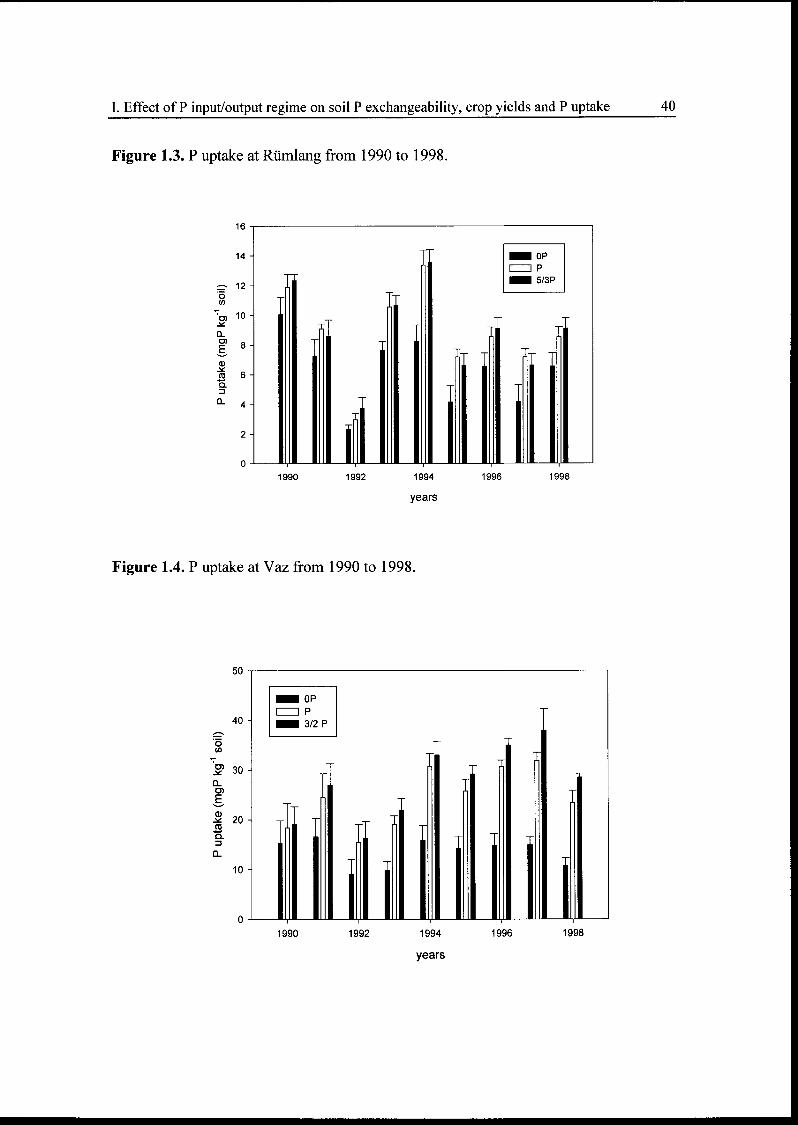
observed in 1992 in Rümlang for maize. In the permanent grassland trial at Vaz, very
large differences in P uptake were observed between OP on the side and P and P>exp
**
n.s.
n.s.
n.s.
n.s.
n.s.
**
I. Effect of P input/output regime on soil P exchangeability, crop yields and P uptake 40
Figure 1.3. P uptake at Rümlang from 1990 to 1998.
Figure 1.4. P uptake at Vaz from 1990 to 1998.

I. Effect of P input/output regime on soil P exchangeability, crop yields and P uptake 41
since 1993. This observation was consistent with that of Castillon (1991), who showed
that yield decrease and reduction in P uptake in permanent grasslands receiving no P
could be observed very quickly even on soils with high available P levels. Certain
grassland species such as Trifolium repens are known for their higher P requirements
than grasses (Dunlop and Hart, 1987; Caradus, 1990; Chapter 3 of this thesis).
However, changes in botanical composition of the grassland observed during the trial
did not explain this reduction in P uptake in the OP treatment. At the beginning of the
trial, the grassland had 32% dicotylédones, 60% grasses and 6% legumes. In the OP
treatment after 9 years of trial, the dicotylédones had increased by 8% while the
proportion of grasses decreased and the proportion of legume remained constant. The
botanical composition was not affected in the two other treatments (P and P>exp).
The P concentrations in the harvested plant parts (Table 1.6) were in the range of the
reference values given for Switzerland (Walter et al, 1994).
Table 1.6. Mean P concentrations determined for the main crop components over all sites,
years and treatments, compared to the reference concentrations given by Walter et al.
(1994).
crops component mean concentration reference concentrations
g kg"1 Dry Matter
beet roots 1.98 1.74-2.62
maize grains 2.88 1.74-3.49
potato tubers 2.73 0.44 -0.87
soybean grains 6.01 4.36 -7.85
wheat grains 4.05 2.83 - 3.92
barley grains 4.29 3.05 - 3.92
rape grains 6.99 5.67 - 8.28
grassland R first cut 3.64 3.05 - 3.92
grassland P first cut 2.31 2.40- 3.49

I. Effect of P input/output regime on soil P exchangeability, crop yields and P uptake 42
Concentrations below the references were only observed for maize in 1996 and for
rapeseed in 1998 at Changins OP and for grassland in 1996 at Rümlang OP. Fertilization
(P>exp treatment) increased the P concentration in potato in Cadenazzo and Rümlang,
and in rapeseed in Changins, otherwise, the effects of P>exp on the P concentration of
crops remained limited. This is consistent with other studies showing that in European
agroecosystems different P fertilization regimes had little effect on the P content in
cereal grains (Jaakola et al., 1997) or on shoot P concentrations (Jungk et al., 1993)
during at least the first ten years of trial. The climatic conditions have a higher impact
on crop P concentration than the P fertilization (Jaakola et al., 1997; Boniface and
Trocmé, 1988). For the permanent grassland, values on the OP treatment were almost
always under the reference concentration range.
P balances
The 3 P fertilization regimes resulted at all sites in different P balances both in 1993 and
in 1998 (Table 1.7). These balances were negative for the OP treatment and positive for
both the P and the P>exp treatments. By 1998, the balance observed in the OP treatment
demonstrated that soils had been able to deliver 88 to 144 mg P kg"1 soil without
significant effect on crop yield in 6 of the seven trials. This ability of plants to mobilize
P in freshly non-fertilized soils has been observed in all long-term field experiments
conducted in Western Europe. Ellmer et al. (2000) showed that even after 60 years of
trial 16 kg P ha"1 year"1 could still be mobilized by a rotation spring barley-potato-maize
in a sandy soil. The positive balance observed in the P treatment showed that the P
taken up by the plants was lower than the applications, even though this treatment was
meant to compensate the crop exportations. The P surplus in the P>exp treatment had
no effect on crop yields.
Changes in total, inorganic and organic P
Changes in Pi, Po and Pt with time. The OP treatment led to a significant (p<0.05)
decrease in the total P content of the 0-20 cm horizon between 1989 and 1998 in
Cadenazzo, FAL, Ellighausen and Rümlang and to a significant (p<0.05) decrease in
inorganic P in Cadenazzo, FAL, Ellighausen and Oensingen (Table 1.8). Significant
decreases of total and mineral P between 1989 and 1993 were only observed in the 0-20

I. Effect of P input/output regime on soil P exchangeability, crop yields and P uptake 43
Table 1.7. Cumulative P balances in mg P kg"1 soil in 1993 and 1998 for all
sites and treatments, calculated as the difference between the cumulative P
inputs and the cumulative P uptake.
Experimental site treatment 1993 1998
OP -32 c* -61 C
Rümlang P 4 B 17 B
P > exp 33 A 82 A
OP -48 C -91 C
FAL P 2 B 19 B
P > exp 39 A 102 A
OP -64 C -113 C
Ellighausen P 0 B 11 B
P > exp 42 A 95 A
OP -62 C -119 C
Oensingen P 5 B 8 B
P > exp 45 A 87 A
OP -38 C -88 C
Cadenazzo P 3 B 6 B
P > exp 31 A 71 A
OP -124 C -144 C
Changins P 116 B 134 B
P > exp 287 A 347 A
OP -51 C -121 C
Vaz P 58 B 84 B
P > exp 118 A 208 A
*Different higher case letters for the same site indicate a statistically significantdifference between treatment at the 5% probability level by the Duncan's
multiple range test.

I.EffectofPinput/output
regi
meon
soilPexchangeability,
cropyi
elds
andPup
take
44
Table
1.8.
Mineral,
OrganicandTotalPcontentofthesurfacehorizonofthestudied
soil
sin1989,1993and
1998.
Experimental
treatment
site
Pi
mgP
kg"1
1989
1993
1998
Po
mgP
kg"1
1989
1993
1998
Pt
mgP
kg"1
1989
1993
1998
OP
Rümlang
P
P>exp
458
442
n.s.B
465
n.s.B
579
546
n.s.A
622
n.s.A
580
615
n.s.A
619
n.s.A
392
401
n.s.A
323
**
A
354
242
n.s.A
301
n.s.A
382
381
n.s.A
336
n.s.A
850
843
n.s.B
787
**
A
933
788
n.s.AB
923
n.s.
A
962
997
n.s.A
955
n.s.
A
OP
FAL
P
P>exp
427
401
*A
356
**
B
469
441
**
A432
*A
436
437
n.s.A
443
n.s.A
637
619
n.s.A
609
*A
649
646
n.s.A
657
n.s.A
622
594
n.s.A
624
n.s.A
1064
1021
**A
965
**
B
1117
1086
*A
1090
*A
1058
1031
n.s.A
1067
n.s.
A
OP
Ellighausen
P
P>exp
354
324
n.s.
A287
**
A
403
391
n.s.A
359
n.s.A
409
434
n.s.
A404
n.s.A
524
517
n.s.A
502
n.s.A
547
536
n.s.A
521
n.s.A
518
524
n.s.A
411
n.s.A
878
842
n.s.A
789
*A
950
927
n.s.A
880
n.s.
A
927
958
n.s.A
815
n.s.
A
OP
Oensingen
P
P>exp
444
472
n.s.A
352
*C
433
497
n.s.
A400
*B
466
448
n.s.
A454
n.s.A
584
561
n.s.A
602
n.s.A
596
571
n.s.
A604
n.s.A
599
576
n.s.A
607
n.s.A
1028
1033
n.s.A
954
n.s.
A
1028
1069
n.s.A
1004
**
A
1065
1024
n.s.A
1061
n.s.
A
OP
Cadenazzo
P
P>exp
951
932
n.s.A
910
**
B
937
948
n.s.
A950
n.s.AB
956
978
n.s.
A997
n.s.A
274
274
n.s.A
263
n.s.A
285
289
n.s.A
285
n.s.A
263
272
n.s.A
262
n.s.A
1225
1206
n.s.A
1174
*B
1222
1238
n.s.A
1235
n.s.
A
1219
1250
n.s.A
1259
**
A
OP
Changins
P
P>exp
n.d.
227
199
*C
n.d.
316
365
*B
n.d.
434
544
**
A
n.d.
387
391
n.s.A
n.d.
396
396
n.s.A
n.d.
419
425
n.s.A
n.d.
614
n.s.A
590
n.s.
C
n.d.
711
n.s.A
761
n.s.
B
n.d.
853
n.s.A
969
*A
OP
Vaz
P
P>exp
418
379
n.s.
B358
n.s.
C
413
420
n.s.
B456
**
B
409
519
*A
591
**
A
890
936
n.s.A
1011
n.s.A
980
924
n.s.A
985
n.s.A
955
930
n.s.A
1057
n.s.A
1309
1314
n.s.A
1370
n.s.
B
1393
1344
n.s.A
1441
n.s.
B
1364
1449
n.s.A
1648
**
A
n.s.indicatesno
sign
ific
antdifferencesbetween1989and1993
orbetween1989(1993
forCh
angi
ns)and1998
atp<
0.05
,*indicatessi
gnif
ican
tdifferences
between1989and
1993
orbetween
1989(1993
forCh
angi
ns)and
1998
at
p<0.05,**
indicates
sign
ific
antdifferencesbetween
1989and
1993
orbetween
1989
(1993
forChangins)and
1998
atp<
0.01
.Different
high
ercase
lett
ers
forthesame
soil
and
forthesame
year
indicate
astatisticallysi
gnif
ican
t
differencebetweentreatment
atthe5%
prob
abilitylevelbytheDuncan'smultiple
range
test.

I. Effect ofP input/output regime on soil P exchangeability, crop yields and P uptake 45
cm horizon of the FAL trial. Decreases in the organic P content of the 0-20 cm were
observed in Rümlang and FAL between 1989 and 1998, indicating that mineralisation
occurred in these two soils. The P treatment induced a decrease in total and mineral P in
the surface horizon of the FAL (in 1993 and 1998) Oensingen (1998) trials and an
increase in inorganic P in the surface horizon of the Changins and Vaz trials.
Phosphorus applications higher than crop needs (P>exp) significantly increased the
total P content of the upper horizon of Cadenazzo, Vaz and Changins. Excepted in the
subsoil of ftP-Ellighausen, where a significant decrease in Pt, Pi and Po was observed
between 1989 and 1998, no significant variations was observed in the subsoil of the
other sites.
Comparison of Pi, Po, Pt between the three P fertilization regimes. Few differences
were observed between the OP, P and P>exp treatments in 1993. In 1998 however, in
all sites excepted Ellighausen where these changes were not statistically significant, Pi
content in the upper horizon was maximum in the P>exp treatment followed by the P
treatment and by the OP treatment. A similar trend was observed between these
treatments for the Pt content of the upper horizon of all sites (although the variations
were not always statistically significant). No differences were observed between the
treatments with respect to the Pi, Po and Pt content of the 30-50 cm horizon of all the
studied sites.
Comparison between the P balance and the changes in Pt in the surface and subsurface
horizons. The decrease in total P in the 0-20 cm horizon of the sites Rümlang, FAL,
Ellighausen, Oensingen and Cadenazzo was positively correlated to the P balance
calculated in 1993 and 1998 only for the OP treatment (decrease in total P (mg P kg"1
soil) = 0.88 x balance (mg P kg"1 soil) - 15.2; r2 = 0.58; PO.05). In Changins and Vaz,
changes in Pt were not related to P balance in the OP treatment. In treatments P and
P>exp, no relation could be observed whatever the site between the P balance and the
changes in total P. The positive relation observed in the OP treatments of the above-
mentioned sites, shows that most of the P taken up by the crops was derived from this
horizon. However the coefficient of regression lower than one, suggests that the crops
might have obtained a fraction of their P from lower horizons. This is confirmed in the
case of Ellighausen by the decrease in mineral and total P observed in the 30-50 cm

I.EffectofP
input/output
regi
meon
soilP
exch
ange
abil
ity,
cropyi
elds
andPuptake
46
Table
1.9.Mineral,OrganicandTotalPcontentofthe30-50cmhorizonofthestudiedsoilsin1989andin1998.
Experimental
site
treatment
Pi
mgP
kg"1
1989
1998
Po
mgP
kg"1
1989
1998
Pt
mgP
kg"1
1989
1998
OP
Rümlang
P
P>exp
400
347
n.s.
A
416
565
n.s.
A
459
503
n.s.
A
152
222
n.s.A
175
152
n.s.A
131
191
n.s.A
553
569
n.s.
A
590
536
n.s.
A
590
693
n.s.
A
OP
FAL
P
P>exp
315
310
n.s.
A
351
278
*A
290
267
n.s.
A
266
321
n.s.A
254
327
*A
296
331
n.s.A
581
630
n.s.
A
605
605
n.s.
A
586
598
n.s.
A
OP
Ellighausen
P
P>exp
139
107
*A
219
134
n.s.
A
185
161
n.s.
A
365
293
*A
443
353
n.s.A
344
332
n.s.A
503
400
*A
662
487
n.s.
A
529
493
n.s.
A
OP
Oensingen
P
P>exp
281
207
n.s.
A
183
167
n.s.
A
206
178
n.s.
A
476
466
n.s.A
434
429
n.s.A
407
424
n.s.A
757
674
n.s.
A
617
596
n.s.
A
614
603
n.s.
A
OP
Cadenazzo
P
P>exp
746
763
n.s.
A
763
793
n.s.
A
774
826
n.s.
A
165
141
n.s.A
196
137
n.s.A
157
125
n.s.A
911
904
n.s.
A
959
930
n.s.
A
931
951
n.s.
A
n.s.
indicatesno
significantdifferencesbetween
1989and
1998
atp<0.05,
indicates
significantdifferencesbetween
1989and
1998
at
p<0.05,**
indicatessi
gnificantdifferencesbetween1989and1998
atp<0.01
Different
high
ercase
letters
for
thesame
soil
and
for
thesame
year
indicate
ast
atis
tica
lly
significant
differencebetween
treatment
atthe5%
prob
abil
itylevelbytheDuncan'smu
ltip
lerange
test.

I. Effect of P input/output regime on soil P exchangeability, crop yields and P uptake 47
horizon (Table 1.9). Decreases of total P content in the upper soil layer lower than the
cumulative P uptake by crops have been also observed in other studies (Wechsung and
Pagel 1993; Stumpe et al, 1994; Gransee and Merbach 2000; Oehl et al 2001) and
assigned to crop uptake of subsoil P. The absence of relation observed between the
decrease in total P and P balance in treatments P and P>exp, can be explained by the
probably high spatial heterogeneity of the studied soils and by the low sensitivity of the
method used to assess total P. This makes it difficult to detect reliably changes of 10 to
100 mg P kg" in soils containing between 800 and 1200 mg P kg" .Another explanation
for this lack of relation between P balance and changes in total P in the upper soil
horizon, could be the transfer of added P to lower soil horizons as already observed in
other long-term field experiments (Mercik et al., 2000; Oehl et al., 2001). This
hypothesis could not be, however, confirmed in our study as no soil sampling and P
analysis were done in the 20-30 cm horizon and, the Pi, Po and Pt of the 30-50 cm
horizon remained constant in soils fertilized with P.
Changes in soil P exchangeability in the surface horizon ofthe studied soils
Changes in R/rj. The parameter R/ri, which is the ratio between the total introduced
radioactivity and the radioactivity remaining in the solution after 1 min of isotopic
exchange gives an information on the immediate P buffering capacity of the soils. The
ratio R/ri measured at the beginning of the field trials is positively correlated to the iron
oxides content of the soil in all sites excepted Changins and Vaz (r2= 0.95, PO.01). R/ri
increased with time for all P treatments in Rümlang, FAL, Ellighausen and Cadenazzo
(Table 1.10). These changes were already observed after 4 years of field trial. However
these increases were much stronger in the OP treatment than in the two other treatments.
In Oensingen and Changins, R/ri increased with time in the OP and P treatments and
decreased in the P>exp treatment, while R/ri did not vary in Vaz. In 1998 the R/ri ratio
was at all sites significantly higher in the OP than P>exp treatment. In all sites except
Vaz, the R/ri observed at the end of the field trial was linearly correlated with the R/ri
measured at the beginning of the field trial (Table 1.11). Different equations of
regression were observed for OP, P and P>exp treatments. The slope of the equation

I.EffectofP
input/output
regi
meon
soilPexchangeability,
cropyi
elds
andPuptake
48
Table
1.10.
Parameters
Cp,
R/ri
andndeterminedby
the
isotopic
exchange
kineticsmethod
inthe
surfacehorizonofthe
studied
soil
s.
Experimental
site
treatment
Cp mgL"1
1989
1993
1998
R/r,
1989
1993
1998
n
1989
1993
1998
OP
Rümlang
P
P>exp
0.16
0.10
n.s.B
0.03
*B
0.46
0.29
n.s.A
0.14**
B
0.44
0.31
n.s.A
0.26
*A
4.3
5.0
*A
6.1
*A
3.2
3.7
*B
4.6n.sAB
3.2
3.4
n.s.B
3.8
*B
0.31
0.32
n.s.A
0.37
n.s.A
0.26
0.27
n.s.A
0.29
n.s.B
0.25
0.30
n.s.A
0.27
n.s.
B
OP
FAL
P
P>exp
0.46
0.27
*B
0.08
**
B
0.58
0.44
n.s.A
0.23
*A
0.51
0.47
n.s.A
0.26
**A
4.2
5.0
*A
6.6
**
A
4.1
4.4
n.s.A
4.4
n.s.B
4.1
4.6
n.s.A
5.0
*AB
0.26
0.29
*A
0.33
**
A
0.25
0.28
*AB
0.29
**
B
0.26
0.27
n.s.B
0.28
**
B
OP
Ellighausen
P
P~>exp
0.60
0.30
*A
0.12
**
B
0.66
0.62
n.s.A
0.23
*AB
0.69
0.61
n.s.A
0.34
n.s.A
2.4
3.0
**
A3.8**
A
2.9
2.8
n.s.A
3.6
n.s.A
2.3
2.3
n.s.A
3.2
n.s.A
0.28
0.33
*A
0.37
*A
0.26
0.28
n.s.B
0.33
**
B
0.26
0.26
n.s.B
0.30
*B
OP
Oensingen
P
P>exp
0.26
0.27
n.s.A
0.05
**
B
0.33
0.27
n.s.A
0.12
**
B
0.42
0.24
*A
0.21
*A
5.7
6.0
*A
10.5
*A
5.5
6.8
n.s.A
6.3
*B
5.3
6.6
n.s.A
4.7
n.s.B
0.31
0.30
n.s.AB
0.36
**
A
0.31
0.29
n.s.B
0.34
n.s.AB
0.30
0.31
n.s.A
0.31
n.s.
B
OP
Cadenazzo
P
P>exp
0.69
0.41
**
B0.23
**
C
0.63
0.50
**
AB
0.35
**
B
0.77
0.57
n.s.B
0.45
n.s.A
1.6
1.7
**
A2.3
**
A
1.6
1.6
n.s.A
2.1
**
B
1.6
1.6
n.s.A
2.0
*B
0.23
0.27
**
A0.32
**
A
0.24
0.26
*A
0.30
**
B
0.22
0.25
n.s.B
0.28
*C
OP
Changins
P
P>exp
n.d.
0.07
0.04
n.s.B
n.d.
0.17
0.19
n.s.B
n.d.
0.39
0.69
*A
n.d.
5.8
6.6
n.s.A
n.d.
3.9
4.3
n.s.B
n.d.
3.5
3.1
n.s.C
n.d.
0.41
0.41
n.s.A
n.d.
0.35
0.33
n.s.
B
n.d.
0.30
0.26
*C
OP
Vaz
P
P>exp
1.73
1.17
n.s.C
0.77
n.s.C
2.27
2.38
n.s.B
1.55
*B
2.40
3.31
n.s.A
3.08
n.s.A
2.4
1.6
n.s.A
1.4
n.s.A
1.5
1.4
*B
1.4
n.s.A
1.4
1.4
n.s.B
1.3
n.s.A
0.23
0.25
n.s.A
0.25
n.s.A
0.23
0.21
n.s.B
0.20
n.s.
B
0.21
0.18
n.s.C
0.17
*B
n.s.
indicatesno
significant
differencesbetween
1989
and
1993
orbetween
1989
(1993
forCh
angi
ns)
and
1998
atp<
0.05
,indicates
sign
ific
ant
differencesbetween
1989and
1993
orbetween
1989(1993
forCh
angi
ns)and
1998
at
p<0.05,**
indicates
sign
ific
antdifferencesbetween1989and
1993
orbetween
1989
(1993
forCh
angi
ns)
and
1998
atp<
0.01
.Differenthi
gher
case
letters
for
thesame
soil
and
forthesame
year
indicate
a
statisticallysi
gnificantdifferencebetweentreatmentatthe5%
probabilitylevelbytheDuncan'smultiple
range
test.

I. Effect of P input/output regime on soil P exchangeability, crop yields and P uptake 49
relating R/ri at the beginning to R/rj at the end reached 1.34 in the OP treatment and
0.79 in the P>exp treatment. A multiple correlation analysis for all treatments and all
field crops showed that the final R/rj value is explained both by the initial R/ri value
and by the P balance observed on the plot (Table 1.11). These results show that in these
temperate soils, RAj is not only a function of the soil iron oxide content as observed by
Frossard et al. (1993) but also of the fertilization regime. Boniface and Trocmé (1988)
showed as well that the P fixing capacity of temperate soils could be affected by P
fertilization regime.
Changes in n. The parameter n, which is calculated from the isotopic exchange kinetics
experiment as the factor of the linear regression between log [rt/R] and log(t), describes
the ability of PO4 ions to be transferred with time from the solid phase to the soil
solution (Fardeau, 1981). No relation was observed between the parameter n and any
soil properties. In Cadenazzo, FAL and Ellighausen the parameter n increased between
1989 and 1998 in all treatments (Table 1.10). In Oensingen, n increased only in the OP
treatment between 1989 and 1998 while this parameter decreased in Vaz P>exp and
Changins P>exp. As for R/ri, at all sites in 1998 the n parameter was higher in the OP
treatment and lower in the P>exp treatment. There was a linear negative regression
between P balance and the n parameter in the OP treatment for all sites excepted Vaz
(r = 0.62, p<0.0001). A significant positive linear regression was observed in the OP
treatment of all sites, excepted Vaz, between n measured at the beginning of the
experiment and at the end of the experiment (Table 1.11). A similar correlation but with
a lower degree was observed for the P treatment while no such relation could be found
for the P>exp treatment. A multiple correlation analysis for all treatments and all field
crops showed that the final n value is explained both by the initial n value and by the P
balance observed on the plot (Table 1.11). These results agree with those of Fardeau
(1991) and Morel et al. (1994) who observed that increasing soil P availability through
P inputs decreased n while the decrease in P availability following plant P uptake
increased this parameter.
Changes in the P concentration in the soil solution (Cp). As for R/ri a negative relation
was observed between Cp and the iron oxide content of the soils for all sites excepted

I.EffectofP
inpu
t/ou
tput
regi
meon
soilP
exch
ange
abil
ity,
cropyi
elds
andPuptake
50
Table
1.11.CorrelationsestablishedfortheparametersR/
ri,n,CpandEimjn
forallfieldcropsrotations.
OP
PP>exp
R/n
finalR/ri=
1.34
initialR/
r,+
0.64
r2=0.70,
P<0.0001,n=24
fina
lR/
ri=0.95
initialR/
r;+
0.83
r2=0
.74,
P<0.0001,n=24
finalR/r,=0.79
initialR/^+1.01
r2=0
.69,
P<0.0001,n=24
fina
lR/
rr=
1.24
initialR/^
-0.01Pbalance+0.29
r2=0
.85,
P<0.0001,n=18
n
finaln=0.46
initialn+0.22
r2=0.73,
P<0.0001,n=24
fina
ln=0.48
initialn+0.18
r2=0.43,P<0.001,n=24
n.s.
fina
ln=0.57
initialn
-0.0003Pbalance+0.16
r2=0
.87,
P<0.0001,n=18
Cp
CPdecrease=0.74
initialCP+0.003
1^=0.96,
P<0.0001,n=24
CPdecrease=0.75
initialCP
-0.09
r2=0.78,P<0.0001,n=24
CPdecrease=0.91
initialCP
-0.32
r2=0.63,P<0.0001,n=24
fina
lCp=0.45
initialCP+0.0007Pbalance-0.025
r2=0.86,P<0.0001,n=18
^lmin
Elmindecrease=0.81
initial
Elmin
-1.85
r2=0.96,P<0.0001,n=24
Elmmdecrease=0.83
initial
Elmin
-5.21
r2=0.88,P<0.0001,n=24
Elmmdecrease=0.85
initial
Elmin
-9.60
r2=0.60,P<0.0001,n=24
fina
lElmm=0.21
initialE,
min+0.026Pbalance+3.99
r2=
0.87,P<0.0001,n=18

I. Effect of P input/output regime on soil P exchangeability, crop yields and P uptake 51
Changins and Vaz (r2= 0.85, PO.05). Excepted in Changins P, P>exp and in Vaz
P>exp, Cp systematically decreased between the beginning of the trial and 1998 (Table
1.10). The decreases were however much stronger in the OP treatment than in the P>exp
treatments. Decreases in Cp were already observed in 1993, i.e. 4 years after the
beginning of the trial. Nevertheless, in 1998 whatever the site, Cp was at the lowest
observed values in the OP treatment and highest for the P>exp treatment. In the soils
studied in this work, P inputs higher than the highest applied dose would have been
needed to keep the Cp at its initial level. Decreases in P availability even following P
inputs have already been observed on other long-term field experiments where the
initial soil P availability was high because of past applications (Fardeau, 1991; Oberson
et al., 1993; Webb et al., 1992; Oehl et al., 2001). These decreases could be related to
slow reactions between soluble P and the solid phase of the soil due to the diffusion of P
within aggregates (Sinaj et al., 1997), or within solids (Barrow 1983) or to the
precipitation of P in amorphous or crystallinous phases (Pierzynski et al., 1990). Mc
Collum (1991) also suggested that these reactions would be more efficient than crop
removal in depleting the extractable P pool and also more important on soils with a high
available P level. Finally the Cp decrease measured between 1989 (1993 for Changins)
and 1998 for all field crop sites linearly correlated to the Cp measured at the beginning
of the experiments (Table 1.11). Similar regression equations were obtained for the OP,
P and P>exp treatments. As for n a multiple correlation showed for all treatments and
all field crops that Cp measured in 1998 was a function of the initial Cp and of the P
balance (Table 1.11). Finally Cp was strongly negatively correlated to n values for all
field crops soils and all sampling dates (Figure 1.5). This has also been observed byIT
Morel et al. (1994). The main explanation is that both immediate and delayed P
exchange between soil components and soil solution are dependent on the concentration
of P in solution.
In Rümlang OP, where the only significant yield decreases have been observed from
1994 the Cp varied from 0.1 in 1993 to 0.03 mg P L"1 in 1998. This suggests that the
critical Cp level under which P could become limiting for the crops grown in this
rotation (potato, wheat, grassland, potato) would be above 0.1 mg P L"1. No significant
yield decrease was observed until 1998, neither in Changins and Oensingen OP nor in

I. Effect of P input/output regime on soil P exchangeability, crop yields and P uptake 52
Figure 1.5. Relationship between n and Cp measured in the 0-20 cm horizon in 1989
(except Changins), 1993 and 1998 for all soils and treatments.
u.to-
y p= -0.098 x +0.24
\ 5 r2 = 0.680.40 -
>^A
p< 0.0001
0.35 -
\
f
A* #
yp>exp= -0.10x + 0.23
r2 = 0.72
0.30 -
y0P = -0.10x + 0.24
r*=0.75
• p< 0.0001
0.25 - p< 0.0001_
* A
1« A
•
0.20 - A ^Vs^
0P <•0.1b - A P
• P>exp
i
•
0.10 -
i
-1
logCp

I. Effect of P input/output regime on soil P exchangeability, crop yields and P uptake 53
FAL OP but might occur if a crop with high P requirement such as potato is grown
again. Phosphorus uptake has been strongly reduced in Vaz after 1993, although water
soluble P concentration in the OP treatment was still high (1.2 mg PL"1) compared to
concentrations observed in the field crop rotations, where soil is ploughed and then
mixed each year.
Changes in Eimm Eimm.sm and E>3m pools. The quantity of P in the Eimin pool,, was not
related to any of the measured soil chemico-physical properties. Apart from that, Eimm
varied as Cp (Table 1.12). Excepted in Changins P and P>exp, Eimin systematically
decreased between the beginning of the trial and 1998 (Table 1.12). The decreases were,
however, much stronger in the OP than in the P>exp treatment. Decreases in Eimm
(although not significant) were already observed in 1993. Nevertheless, in 1998,
whatever the site, Eimm was at lowest in the OP treatment and maximum for the P>exp
treatment. Eimin decrease measured between 1989 (1993 for Changins) and 1998 for all
field crop sites was linearly correlated to the Eimin measured at the beginning of the
experiments (Table 1.11). Similar regression equations were obtained for the OP, P and
P>exp treatments. Finally, Eim,„ in 1998 was correlated to both Eimin measured at the
beginning and P balance for all field crop sites and for all P treatments (Table 1.11).
In Rümlang OP, where the only significant yield decreases have been observed from
1994 onward, Eimin varied from 5.2 in 1993 to 1.9 mg P kg"1 in 1998. This suggests that
the critical Eimm level under which P could become a limiting factor for the crops grown
in this rotation, would be below 5.2 mg P kg"1. Phosphorus uptake has been strongly
reduced in Vaz after 1993, although Eimin in the OP treatment was still high (18 mg P
kg"1 ). In 1998, the amount of P isotopically exchangeable between 1 min and 3 months
was lowest in the OP treatment and maximum in the P>exp treatment in most trials. The
amount of P present in this pool decreased with time in most of the trials excepted in
Cadenazzo (OP, P and P>exp) and in Changins P and OP. These decreases suggest that
crops have used an important fraction of P present in the Eimin-3m pool and/or that some
of this P has been transferred to more slowly exchangeable forms (Barrow, 1983). The
variations of E>3m are much less consistent. This is due to the structure of this parameter
that is calculated by substracting the amount of P isotopically exchangeable within three
months from the amount of total inorganic P. This parameter is therefore strongly

I.EffectofP
inpu
t/ou
tput
regi
meon
soilP
exch
ange
abil
ity,
cropyi
elds
andPuptake
54
Table
1.12.
Pools
Eimjn,
Eimin-3mandE>3mdeterminedbytheisotopic
exchangekineticsmethod
inthesurfacehorizonofthe
studied
soil
s.
Experimental
site
treatment
mg
Pkg"1
1989
1993
1998
^lmin-3m
mgP
kg"1
1989
1993
1998
E>3m
mgP
kg"1
1989
1993
1998
OP
Rümlang
P
P>exp
6.9
5.2
n.s.
B1.9
*C
14.6
10.7
n.s.
A6.0
**
B
13.6
10.8
n.s.
A9.2
n.s.
A
161
143
n.s.A
109
**
B
181
162
**
A138
**
AB
170
212
n.s.A
147
*A
290
294
n.s.
A354
*A
384
373
n.s.
A478
n.s.
A
397
393
n.s.
A463
n.s.
A
OP
FAL
P
P>exp
18.7
13.2
*B
5.1
**
C
22.6
18.1
n.s.
A9.7
**
B
20.8
20.9
n.s.
A12.6
**
A
185
187
n.s.
B144
*C
194
209
n.s.A
165
n.s.B
197
210
*A
185
*A
223
201
*A
207
n.s.
B
252
214
n.s.
A258
n.s.
A
218
207
*A
245
**
A
OP
Ellighausen
P
P>exp
14.3
8.9
n.s.
A4.6
*B
18.9
16.8
n.s.
A7.9**
AB
16.2
14.8
n.s.
A10.5
n.s.
A
170
175
n.s.A
155
n.s.A
186
185
n.s.A
177
*A
160
143
n.s.A
181
n.s.A
170
141
n.s.
B128
n.s.
A
199
189
n.s.
AB
157
n.s.
A
232
277
n.s.
A179
n.s.
A
OP
Oensingen
P
P>exp
14.7
15.9
n.s.
A4.8
**
B
18.2
18.2
n.s.
A7.2
**
B
21.9
14.6
*A
9.6
*A
232
235
n.s.A
168
*B
244
243
n.s.A
187
*AB
264
232
*A
191
**
A
197
220
n.s.
A179
n.s.
A
170
236
n.s.
A206
n.s.
A
179
202
n.s.
A253
*A
OP
Cadenazzo
P
P>exp
10.7
8.9
n.s.
A5.3
**
C
9.9
8.1
**
A7.4**
B
12.3
9.4
n.s.
A8.8
n.s.
A
131
128
n.s.A
183
**
A
129
143
n.s.A
188
**
A
123
133
n.s.A
184**
A
809
795
n.s.
A722
**
B
799
797
n.s.
A755
**
B
822
835
n.s.
A804
n.s.
A
OP
Changins
P
P>exp
n.d.
4.7
2.5
**
C
n.d.
7.6
8.3
n.s.
B
n.d.
15.1
21.3
*A
n.d.
149
120
*C
n.d.
165
176
n.s.B
n.d.
201
226
n.s.A
n.d.
73
77
n.s.
C
n.d.
143
180
*B
n.d.
218
297
**
A
OP
Vaz
P
P>exp
33.2
18.0
n.s.
C10.4
n.s.
C
34.6
34.1
n.s.
B21.1
*B
32.8
45.7
*A
40.0
n.s.
A
173
155
n.s.A
115
n.s.B
192
172
n.s.A
123
n.s.B
164
172
n.s.A
151
n.s.A
212
206
n.s.
B233
n.s.
C
186
214
n.s.
B311*
B
212
302
*A
400
**
A
n.s.
indicatesno
significantdifferencesbetween
1989and
1993
orbetween
1989(1993
forCh
angi
ns)and
1998
atp<
0.05
,indicates
sign
ific
antdifferences
between1989and1993
orbetween1989(1993
forCh
angi
ns)and1998
at
p<0.05,**
indicates
sign
ific
antdifferencesbetween
1989and1993
orbetween1989
(1993
forChangins)and
1998
atp<0.01.
Differenthi
gher
case
letters
forthesame
soil
and
forthesame
year
indicatea
statistically
sign
ific
ant
difference
betweentreatment
atthe5%
prob
abil
itylevelbytheDuncan'smultiple
range
test.

I. Effect of P input/output regime on soil P exchangeability, crop yields and P uptake 55
subject to all errors made on both total inorganic P and the amount of isotopically
exchangeable P and can not be interpreted reliably.
Changes in soil P exchangeability in the subsurface horizon ofthe studied soils.
Results obtained in the 30-50 cm soil layer of the OP treatments of Rümlang, FAL and
Oensingen show a decrease of P exchangeability and therefore of P availability (Table
1.13). Eimm decreased and R/ri increased in Rümlang OP and Oensingen OP, while Eimin
decreased in Ellighausen OP.These results suggest either that available P from this
horizon has contributed to the P nutrition of the crops, or that similar slow reactions
between soluble P and the soil solid phase as those described for the 0-20 cm layer
occurred. On the other hand, in the P>exp treatment no increase in isotopically
exchangeable P was observed in the 30-50 cm soil layer.
Comparison between the sevenfield trials.
The five trials (Rümlang, FAL, Ellighausen, Oensingen, Cadenazzo) started in 1989,
with similar types of rotation, studying the effect of P fertilization regime on crop yield,
P uptake and changes in soil P availability had been established in soils with different
characteristics and in different climatic zones of Switzerland. However, they gave very
consistent and generic results. Results obtained in Changins and Vaz did not conform to
the trends observed in the 5 other trials. For Changins, this might be related to the
different age of the trial. It was started in 1971 and since then, the soils have either been
depleted in P or strongly enriched in P, reaching different P status as in the 5 other field
crop rotation trials. Another difference in Changins is that the rotation was very
simplified compared to the other field crop sites and which contained few crops with
high P requirements. The different behavior of Vaz can be related both to its vegetation
(permanent grassland) and to its soil type. Vaz was located on a very superficial soil
(depth of 20 cm) and as in most grasslands most of the plant roots were probably
located in the upper 10 cm of this soil, making this crop sensitive to water deficit. It is
known that plant growing in a superficial soil proned to water deficit need a high P
availability to reach a given yield than the same crop grown in a deep soil with an

I.EffectofP
input/output
regi
meon
soilP
exch
ange
abil
ity,
cropyi
elds
andPup
take
56
Table
1.13.
ParametersCp
,R/ri,nandpo
olsEimm,
Eimin-3m
andE>3mdeterminedbytheisotopic
exchangekineticsmethod
inthe
30-50cmhorizonofthestudied
soils.
Experiment
altreatment
site
Cp
mgL"1
1989
1998
R/rl
1989
1998
n
1989
1998
t-lmin
^lmin-3m
*^>3m
mgP
kg'1
1989
1998
1989
1998
1989
1998
OP
Rümlang
P
P>exp
0.01
0.004
n.sC
0.03
0.01
n.sB
0.05
0.03
n.sA
17
22
*A
915
n.s.AB
88
n.s.B
0.41
0.48
*A
0.37
0.42
*B
0.34
0.33
n.s.C
1.9
1.0
*B
3.3
1.4
n.s.
AB
2.7
2.6
n.s.
B
150
152
n.s.A
149
140
n.s.A
112
99
n.s.A
249
195
n.s.A
263
424
n.s.A
344
401
n.s.A
OP
FAL
P
P>exp
0.02
0.01
*A
0.02
0.01
n.s.A
0.02
0.01
n.s.A
18
18
n.s.A
14
18
n.s.A
22
22
n.s.A
0.40
0.45
*A
0.38
0.44
*A
0.41
0.43
n.s.A
2.7
1.8
*B
3.7
1.9
n.s.
B
3.0
2.5
n.s.
A
150
163
n.s.A
158
150
n.s.A
159
159
n.s.A
162
145
n.s.A
189
126
n.s.A
128
106
*A
OP
Ellighausen
P
P>exp
0.04
0.01
n.s.A
0.17
0.01
n.s.A
0.08
0.02
n.s.A
82
**
C
618
**
A
10
10
n.s.B
0.43
0.45
n.s.A
0.37
0.47
n.s.A
0.41
0.43
n.s.A
3.2
1.7
n.s.
A
5.8
1.8
n.s.
A
3.9
2.1
n.s.
A
101
27
n.s.B
133
99
n.s.A
115
105
n.s.A
35
78
n.s.AB
80
33
n.s.
B
66
55
n.s.
B
OP
Oensingen
P
P>exp
0.05
0.01
n.s.A
0.04
0.01
n.s.A
0.05
0.01
*A
15
24
*A
16
18
n.s.A
18
20
n.s.A
0.37
0.41
n.s.A
0.39
0.42
n.s.A
0.40
0.41
n.s.A
6.4
2.4
*A
6.1
2.2
*A
8.0
2.7
**
A
173
121
*A
131
101
n.s.A
154
108
*A
102
84
n.s.A
46
64
n.s.A
44
68
n.s.A
OP
Cadenazzo
P
P>exp
0.11
0.14
n.s.B
0.16
0.13
n.s.B
0.11
0.15
n.s.B
22
n.s
B
22
n.s
B
22
n.s
B
0.32
0.33
n.s.AB
0.30
0.33
n.s.AB
0.31
0.35
n.s.A
2.2
2.5
n.s.
B
2.9
2.4
n.s.
B
2.0
2.4
n.s.
B
77
97
n.s.A
79
97
n.s.A
71
126
n.s.A
667
663
n.s.A
681
694
n.s.A
701
697
n.s.A
n.s.indicatesno
significantdifferencesbetween
1989and
1998
atp<
0.05
,indicates
significantdifferencesbetween
1989and
1998
atp<
0.05
,**
indicates
sign
ific
antdifferencesbetween1989and1998
atp<0.01
Differenthi
gher
case
lettersforthesame
soil
and
forthesameyearindicatea
stat
isti
call
ysignificantdifferencebetweentreatment
atthe5%
prob
abil
itylevelby
theDuncan'smu
ltip
lerangetest

I. Effect of P input/output regime on soil P exchangeability, crop yields and P uptake 57
adequate humidity. Finally, P requirements are probably very different for pasture
plants than for crops (Chapter 3 of this thesis, Whitehead, 2000), rendering difficult any
comparison between field trials conducted with both systems. Further research on the P
dynamics in permanent grassland and on the P nutrition of such grassland plants is
required.
Conclusions
The main results of this research showed the following:
Adding P fertilizer in excess to plant needs in soils where P is not a limiting factor had
no significant effect on crop yield. Omitting P fertilization during 9 years caused yield
decreases in only one of the seven field experiments studied. The first yield decrease
was observed on potato, which had the highest P needs. For these climatic conditions,
these types of soils, rotations and expected yields, the minimum Eimjn value determined
by the isotopic exchange kinetics method for an adequate production was 5 mg P kg"
soil. It was not possible to determine a critical P level under which P fertilization would
systematically increase yield because response to P fertilization was obtained in only
one trial. For the grassland, P uptake and P concentration decreased when Eimin was
lower than 18 mg P kg"1 soil. This could be both due to a particular soil type and to the
specific grassland ecosystem. Further research on P dynamics in grassland soils is
required.
When P fertilization was omitted, inorganic P decreased in most of the trials in the 0-20
cm horizon and organic P decreased in two sites. In the absence of fertilization, P
availability in the surface horizon decreased for all the treatments in 5 of the field crops
rotations. Phosphorus applications higher than crops needs were not sufficient to
maintain P availability at its initial level. But this decrease in P availability had no effect
on crop yields. In addition, P availability decreased in the 30-50 cm horizon of the OP
treatment in three field crop sites, showing that available P from the subsoil could have
contributed to the P nutrition of crops, or that similar reactions between soluble P and
the soil solid phase as those described for the 0-20 cm layer happened. However, no
accumulation of total, inorganic, organic or available P was observed in the 30-50 cm
when P inputs were higher than plant needs.

I. Effect of P input/output regime on soil P exchangeability, crop yields and P uptake 58
Finally values of Cp and Eimm measured in 1998 were correlated to the initial values and
to P balance. These relationships allow predicting the changes in Cp and Eimm with time
under these agro-climatic conditions. More specifically, it is possible to predict when
the available soil P level will reach a limiting level for crop production (i.e. Eimm of 5
mg P kg"1 soil) in field crops grown in the absence of P fertilization.

CHAPTER II
Evaluation of four chemical extractions to assess the changes in phosphorus
availability induced by three P input regimes in seven field experiments
conducted under a temperate climate

II. Evaluation of four chemical extraction methods 60
Abstract
Soil P testing is of major importance for proposing sustainable fertilization
recommendations so as to obtain optimum crop yields and minimize P losses to
environment. Four extraction methods based on deionized water (P-H2O), CO2-
saturated water (P-CO2), ammonium acetate EDTA (P-AAEDTA) and sodium
bicarbonate (P-Olsen), were evaluated for their capability to assess the soil P
availability in seven long-term (9 to 27 years) field experiments testing 3 P fertilization
regimes (no P fertilization OP, P inputs equivalent to P off-take P, P inputs higher than
crop off-take P>exp). In the upper soil horizon the amounts of P extracted by the four
tested methods were correlated to the amount of P isotopically exchangeable within one
minute showing that each of these extraction methods can give a relevant information
on soil P availability. P-C02 and P-H20 methods extracted less P than the P-AAEDTA
and P-Olsen which probably also extracted significant quantities of unavailable forms of
P. All methods gave results significantly correlated to the cumulated P balances
observed in the field experiments, however the higher degree of correlation was
observed with the P-Olsen method suggesting that for the studied systems this method is
more adapted to routinely assess the changes in P availability when the P status of the
soil changes. The decrease in soil P extractability between the beginning of the trial and
the last measurement was highly correlated to the initial amount of P extracted by
whatever method and to selected soil characteristics suggesting that the decrease in P
extractability can be modeled with time in the studied systems. The actual Swiss
interpretation scales of the AAEDTA and C02-saturated water extractions
underestimate the soil available P status. Decreases in extractable P were also observed
with the P-CO2 method in the 30-50 cm horizon of the studied soils suggesting a
contribution of deeper horizons to the plant P nutrition. These results showed the
importance of long-term field experiments for soil-test calibrations and development of
appropriate fertilization recommendations.
Key-words: ammonium-acetate-EDTA extraction, C02-saturated water extraction, field experiments,
Olsen extraction, phosphorus availability, water extraction, fertilizer recommendation

II. Evaluation of four chemical extraction methods 61
Introduction
Available phosphorus (P) is composed of phosphate ions that can move to the plant root
during plant growth (Barber, 1995). Plants take up P as inorganic orthophosphate (Pi)
from the soil solution. The release of Pi from soils and soil minerals in the soil solution
results from a combination of abiotic (precipitation-dissolution, adsorption-desorption)
and biotic (immobilization-mineralisation) processes (Frossard et al., 2000). According
to Beckett and White (1964), soil Pi availability is characterized by three factors: (i) the
intensity, which is the activity of phosphate ions (H2PO4", HPO4") in the soil solution;
(ii) the quantity, which is the total amount of phosphate ions that can potentially be
released into the soil solution from the solid phase of the soil and (iii) the buffer
capacity, which describes the ability of a soil to maintain the intensity constant when
the quantity factor varies. The availability of soil P for plants is commonly estimated
using a variety of methods that includes extraction with water (van der Pauw, 1971),
dilute acids and bases (Kamprath and Watson, 1980), anion exchange resin (Sibbesen,
1978), isotopic exchange (Fardeau, 1996), or infinite sinks (van der Zee et al., 1987;
Lookman et al., 1995). No method is, however, able to extract all and only the available
P. These methods fail to reliably estimate the P release from soil due to root induced
acidification or to root exudation of low molecular organic compounds and no
extraction method can quantify the rate of Po mineralisation. Fardeau et al. (1988) and
then Kato et al. (1995) showed that chemical extractions solubilize variable proportions
of available and unavailable soil P and, therefore, can only give a rough estimate of the
quantity factor. Routine chemical extractions remain, however, important for devising P
fertilizer recommendations because they can give a lot of results within a reasonable
amount of time and at a low cost. The calibration of these extractions is based on the
establishment of relationships in pot and field experiments between crop yield, P uptake
and the amount of soil P extracted by a given method. This approach allows for
assessing the probability of a crop to respond to P fertilization for a given soil P
extractability (Dahnke and Olson, 1990; Kamprath and Watson, 1980). Based on this,
three broad fertilizer strategies can be applied (Tunney et al., 1997): (i) the build-up of
the P status by adding P-fertilizer at rates greater than those required by the crops when
the soil P availability is considered as low; (ii) the maintenance of soil P level by P

II. Evaluation of four chemical extraction methods 62
applications covering the off take of P by crop, when the value is moderate; and (iii) the
omission of P fertilization when soil P availability is considered as high or very high.
The objective of this work was to test the capability of four extraction methods using
deionized water, water saturated with CO2 (Dirks-Scheffer, 1930), sodium bicarbonate
(Olsen et al., 1954) and ammonium acetate EDTA (Cottenie et al., 1982) to characterize
soil P availability. To achieve this, soils were sampled in seven Swiss long- or middle-
term field experiments where three fertilizer rates (OP: no P applied; P: P applied to
compensate the off-take of P by crops; P>exp: P applied higher than crops off-take)
were applied. Finally, a comparison of results obtained by the various soil extractions
and of crop response to P fertilizers was carried out to update the current interpretation
scheme for P fertilization in Switzerland (Walter et al., 2001). In this work soil
extraction results were compared to the amount of P isotopically exchangeable within
one minute deduced from the isotope exchange kinetics experiment (Fardeau, 1996),
because this method gives the most sound physico-chemical informations on the
immediately and totally plant available P.
Materials and methods
Experimental sites andPfertilization treatments
The 6 crop rotations field experiments (Rümlang, FAL, Ellighausen, Oensingen,
Cadenazzo and Changins) and the grassland field trial of Vaz studied in this work have
been already described in detail in the Chapter 1 of this thesis.
Soil sampling
Soil samples used here were the same as those analyzed for the Chapter 1 of this thesis.

II. Evaluation of four chemical extraction methods 63
Phosphorus analyses
Isotopically exchangeable P
The quantity of P isotopically exchangeable within 1 minute (Eimin), obtained from the
isotopic exchange kinetics method (Fardeau, 1996), was used in this paper as a
reference of the quantity of plant available phosphorus. This pool contains ions in the
soil solution plus ions located on the solid phase with the same mobility as the ions in
the solution (Fardeau et al., 1985; Salcedo et al., 1991). They are totally and
immediately available to crops without chemical transformation (Fardeau, 1996). For
details concerning the isotopic exchange kinetics method see the Chapter 1 of this
thesis.
Extraction methods
Extraction by CC>2-saturated water (P-CO2) Available soil phosphorus was extracted
from air dried soil during 1 hour by C02-saturated water (pH 3.5-4, pco: 6 bars) at
ambient temperature with a soil-solution ratio lg : 2.5ml. After paper filtration
(Schleicher & Schuell, 790 1/2) of the extracts, solution P concentration was determined
colorimetrically (Murphy and Riley, 1962). During the extraction, the initially acid pH
of the solution changes very quickly to reach the soil pH. It can be, therefore, assumed
that this extraction does not solubilize large quantities of insoluble P forms
Water extraction (P-H2O) P was extracted by water during 16 hours, with a soil-solution
ratio lg : 10ml at ambient temperature (see Chapter 1 of this thesis, isotopic exchange
kinetics description). After filtration of the extracts (Sartorius, 0 0.2 urn), solution P
concentration was determined using malachite green colorimetry (Ohno and Zibilski,
1991). By decreasing the soil-solution ratio this method decreased the P concentration
in the solution allowing for the transfer of P from the solid phase of the soil to the
solution.
Extraction by an ammonium acetate EDTA mixture (P-AAEDTA) Soil P was extracted
during 60 min by a mixture containing ammonium acetate 0.5M, acetic acid (0.5M) and

II. Evaluation of four chemical extraction methods 64
EDTA (0.02M) at pH 4.65, constant temperature 23+/- 1°C and with a soil-solution
ratio of lg : 10 ml. After paper filtration (Schleicher & Schuell, 790 ) of the extracts,
the P concentration in the solution was determined by colorimetry (Murphy and Riley,
1962). This acid extraction solubilized P forms by decreasing the pH of the soil solution
and by complexing with EDTA the phosphate binding cations such as calcium,
aluminum and ferric ions.
Sodium bicarbonate extraction (Olsen P) P was extracted during 30 min by a 0.5M
NaHC03 solution at pH 8.5, with a soil-solution ratio lg : 20ml at ambient temperature
(Olsen et al. 1954). After filtration of the extracts (Sartorius, 0 0.2 urn), extract P
concentration was determined using malachite green colorimetry (Ohno and Zibilski,
1991). The main effect of this basic extraction was to decrease the ionic activity of Ca
by precipitation of CaCÛ3, which in turn increased P solubility. Thus P from the surface
of calcium phosphates was extracted by the dissolution of calcium phosphate in
calcareous, alkaline and neutral soils. The HCO3" and OH" ions in this extract might
have also promoted the desorption of P from the surface of Fe and Al hydrous oxides in
acid soils.
Harvest and Plant analyses
See Chapter 1 of this thesis.
Statistics
Comparisons of the P availability parameters measured between 1989 and 1993 or 1989
(1993 for Changins) and 1998 for each treatment were performed using the T-TEST
procedure with paired comparisons (SAS, 2000). Treatment effects in 1998 were
detected for each site by performing one-way analysis of variance (ANOVA) with the
GLM procedure of the SAS software. Means were compared with the Duncan's
multiple range test; statistical significance indicated at the 0.05 probability level. Linear
regressions were performed using the REG procedure of the SAS software.

II. Evaluation of four chemical extraction methods 65
Results and Discussion
Changes in soil available P estimated by the 4 methods
Surface horizon
Quantities of soil P extracted by the Dirks-Scheffer method (P-CO2) in samples taken in
1993 for Changins and in 1989 for the other trials ranged from 0.2 mg P kg"1 soil in
Changins to 9.3 mg P kg"1 soil in Vaz (Table 2.1). For the field crop rotations started in
1989 (Rümlang, FAL, Ellighausen, Oensingen and Cadenazzo), quantities extracted at
y
the beginning of the trials were negatively correlated to the clay content of the soils (r =
0.89, p<0.05). Water alone extracted about twice more P as the C02-saturated water.
The quantities of P-H2O of the soils sampled in 1989 in Rümlang, FAL, Ellighausen,
Oensingen and Cadenazzo were negatively correlated to the free Fe oxides content of
the soils (r2= 0.98, p<0.01). The AAEDTA and Olsen methods extracted much more P
than the two preceding methods. The amount of P extracted with AAEDTA varied from
9.3 in Changins to 73.4 mg P kg"1 soil in Rümlang, while the amount of P extracted by
the Olsen method ranged from 20.7 in Changins to 61.7 mg P kg"1 soil in Oensingen.
The quantities of P extractable by the AAEDTA method were close to those extracted
by the Olsen method in the soils sampled at the beginning of the trial in the field crop
rotations started in 1989.
Nine years without fertilization (OP treatment) significantly decreased the extractable P
content estimated by all methods for all field crops rotations started in 1989 (Table 2.1).
This decrease was already significant in 1993 for all extraction methods for the sites of
Ellighausen and Cadenazzo. The decrease in P-CO2 between 1989 and 1998, and
between 1993 and 1998 for Changins, was negatively correlated for all sites to the free
iron oxides content of the soils (r2= 0.84, p<0.05). For all field crop rotations started in
1989, this decrease was negatively correlated to the initial soil P fixing capacity (R/ri
value, see Chapter 1 of this thesis; r2= 0.86, p<0.05). The decrease in P-AAEDTA was
negatively correlated to the initial n value of the field crops rotations started in 1989
y
(r = 0.81, p<0.05). The decrease in P-Olsen was positively correlated to the clay content
y 'y
of all soils except Changins (r = 0.70, p<0.05) and to the iron oxides content (r = 0.81,
p<0.05) and to the initial organic P content (r2= 0.78, p<0.05) measured in the soils of

II.Evaluationoffourchemical
extractionmethods
66
Table
2.1.
P-availabilitydeterminedby
fourextractionmethodsand
Eimm
value
inthe
surfacehorizonofthestudied
soils
in
1989,1993and
1998.
P-H20
P-C02
P-AAEDTA
P-Olsen
Ei,
mgPkg
'
Site
treatment
1993
1998
1989
1993
1998
1989
1993
1998
1989
1993
1998
1989
1993
1998
OP
Rumlang
PPexp
1.6
1.0
ns
B0.3
*B
4.6
2.9
nsA
1.4
**B
4.4
3.1
nsA
2.6
*A
0.8
0.5
**
B0.2
**
C
1.3
1.0n
sA
0.7
*B
1.3
1.1ns
A1.3n
sA
49.8
34.5n
sB
30.4
**
B
73.4
54.3
*A
58.4n
sA
72.4
57.7n
sA
74.6n
sA
44.8
37.3
**
B31.6
*B
61.9
53.4ns
A57.8nsA
57.3
55.8ns
A69.3n
sA
6.9
5.2n
sB
1.9
*C
14.6
10.7n
sA
6.0
**
B
13.6
10.8n
sA
9.2nsA
OP
FAL
PPexp
4.6
2.7
*B
0.8
**B
5.8
4.4
nsA
2.3
*A
5.1
4.7
nsA
2.6
**A
0.9
0.6
**
B0.4
**
B
1.0
0.9n
sA
0.7n
sA
0.9
0.9n
sA
1.0n
sA
57.8
33.5n
sA
31.6
*B
60.1
40.8
**
A45.7
*A
61.3
43.7
*A
56.3n
sA
48.2
40.6
**
B28.5
**
C
55.7
50.2
*A
45.8
*B
56.5
56.3n
sA
56.2n
sA
18.7
13.2
*B
5.1
**
C
22.6
18.1n
sA
9.7
**
B
20.8
20.9n
sA
12.6
**A
OP
EllighausenPP
exp
6.0
3.0
*A
1.2
**B
6.6
6.2
nsA
2.3
*AB
6.9
6.1
nsA
3.4
nsA
1.2
0.7
*C
0.4
*B
1.4
1.3n
sB
0.7
**
AB
1.7
1.9ns
A1.2ns
A
41.5
22.6
**
B21.1
**
B
60.5
41.2
*AB
36.6
**AB
70.6
51.8n
sA
48.5
*A
33.7
27.6
*B
21.2
**
B
45.9
38.1
nsB
37.7n
sA
45.7
52.5n
sA
45.2n
sA
14.3
8.9n
sA
4.6
*B
18.9
16.8n
sA
7.9
**AB
16.2
14.8n
sA
10.5n
sA
OP
Oensingen
PPexp
2.6
2.7
nsA
0.5
**B
3.3
2.7
nsA
1.2
**B
4.2
2.4
*A
2.1
*A
0.8
0.7n
sA
0.4n
sC
0.7
0.6n
sA
0.6n
sB
0.9
1.0n
sA
0.9n
sA
48.7
50.5n
sAB
29.9
*B
56.2
60.7n
sA
44.9n
sAB
53.8
46.1n
sB
53.8n
sA
48.8
54.2n
sAB
28.4
**
C
55.6
59.3n
sA
44.6
*B
61.7
48.5n
sB
59.8n
sA
14.7
15.9n
sA
4.8
**
B
18.2
18.2n
sA
7.2
**
B
21.9
14.6
*A
9.6
*A
OP
Cadenazzo
PPexp
6.9
4.1
**B
2.3
**C
6.3
5.0
**AB
3.5
**B
7.7
5.7
ns
B4.5
nsA
1.6
1.0
**
C0.4
**
C
1.5
1.4n
sA
0.8
*A
1.3
1.2n
sB
0.6
**
B
57.2
30.7
*A
31.6
*C
59.7
35.5
**
A49.8n
sA
54.7
33.5
*A
42.3
*B
42.0
37.5
**
B32.7
**
C
41.6
43.7n
sAB
43.4n
sB
43.6
44.7n
sA
50.0
*A
10.7
8.9n
sA
5.3
**
C
9.9
8.1
**A
7.4
**
B
123
9.4n
sA
8.8n
sA
OP
ChanginsPP
exp
n.d.
0.7
0.4
ns
B
n.d.
1.7
1.9
ns
B
n.d.
3.9
6.9
*A
n.d.
0.2
0.3
*C
n.d.
0.4
0.7n
sB
n.d.
1.0
1.7
*A
n.d.
9.3
12.2n
sC
n.d.
15.8
28.1n
sB
n.d.
30.7
61.5
**A
n.d.
20.7
17.6
*C
n.d.
36.8
45.2n
sB
n.d.
61.9
89.6
**A
n.d.
4.7
2.5
**
C
n.d.
7.6
8.3n
sB
n.d.
15.1
21.3
*A
OP
Vaz0-10
PPexp
17.3
11.7
nsC
7.7
ns
C
22.723.8
nsB
15.5
*B
24.0
33.1
nsA
30.8
nsA
9.3
5.0
*B
3.7
**
C
9.6
7.5n
sAB
7.4n
sB
9.3
10.0n
sA
15.7
*A
42.3
23.2
**
C20.7
**
C
42.8
43.6n
sB
62.6
*B
42.6
77.9
**
A148.0
**A
42.4
36.5n
sC
25.4n
sC
51.4
45.9n
sB
48.2n
sB
50.2
56.4n
sA
83.6
**A
33.2
18.0n
sC
10.4n
sC
34.6
34.1ns
B21.1
*B
32.8
45.7
*A
40.0n
sA
n.s
indicatesno
significantdifferencesbetween
1989and
1993
orbetween
1989(1993
forChangins)and
1998
atp<0.05,
indicates
significantdifferencesbetween
1989and
1993
or
between1989(1993
forChangins)and1998
atp<0
05,**
indicatessignificant
differencesbetween1989and1993
orbetween1989(1993
forChangins)
and1998
atp<001
Differenthigher
case
lettersforthesame
soiland
forthesame
year
indicatea
statisticallysignificant
differencebetween
treatment
atthe5%
probabilitylevelby
theDuncan's
multiple
range
test.

IL Evaluation of four chemical extraction methods 67
the field crops rotations in 1989. These last two correlations confirmed that the Olsen
method is likely to extract organic P and P-bound to iron compounds (Sen Tran and
Giroux, 1985).
In the P treatment where P was applied to match crop exportations, significant P-CO2
decreases between 1989 and 1998 were observed in Rümlang, Ellighausen and
Cadenazzo. For all the field crop rotations started in 1989, P-CO2 decreases were
negatively correlated to the free iron oxides content of all soils (r2= 0.91, pO.01) and to
the initial soil P fixing capacity (r2= 0.86, p<0.05). P-AAEDTA significantly decreased
in FAL, Ellighausen and Vaz, whereas P-Olsen decreased significantly in FAL and
Oensingen. In all soils excepted Changins, the decrease in P-Olsen between 1989 and
1998 was positively correlated to clay content (r2= 0.93, p<0.01) and to initial P organic
content (r2= 0.90, p<0.05) for the field crops rotations started in 1989. P-H20 decreased
in all soils excepted Changins.
For the treatment where P applications where higher than crop exportations (P>exp), P-
CO2 significantly decreased only in Cadenazzo, while P-CO2 significantly increased in
Changins and Vaz. The variations in P-CO2 were negatively correlated to the iron
oxides content of all soils (r2= 0.84, p<0.05). P-AAEDTA decreased in FAL in 1993
and Ellighausen in 1998, whereas it increased in Cadenazzo, Changins and Vaz. P-
Olsen increased in Cadenazzo, Vaz and Changins. No correlation could be found
between the changes in P-Olsen and P-AAEDTA and the soil properties studied in this
study.
Using the isotope exchange kinetics method, it has been shown in the first chapter of
this thesis that the P-availability had decreased in all P treatments in field crop rotations
started in 1989 and that the decrease was a function of initial soil P status and P
fertilization regime. Similarly, the decrease of P-H20, P-CO2, P-AAEDTA and P-Olsen
between 1989 and 1998 for six of the seven sites and between 1993 and 1998 for
Changins were highly linearly correlated to the quantity of P extractable by these
methods measured in 1989 or 1993 for all P fertilization regimes excepted for P-Olsen
in the P> exp treatment (Table 2.2). Nevertheless, in 1998, whatever the site and

II.Evaluationoffourchemicalextractionmethods
68
Table2.2.
Correlationsbetween
initialP
status
(x)and
avai
labi
lity
decrease
(y)
in
the
0-20cm
horizon
between1989(1993
forChangins)and1998
forthethreetreatmentsand
allfieldcropsrotations.
Pav
aila
bili
tydecrease
OP
PP>exp
P-H2O
(1989)
"
P-H2O
(1998)
y=0.71x-0.11
r2=0
.87,
p<0.0001
y=0.96x-2.00
r2=
0.75,pO.0001
y=
1.31x
-4.21
r2=
0.86,p<0.0001
P-CO2
(1989)"
P-CO2
(1998)
y=0.90x-0.25
r2=0.97,p<0.0001
y=0.83x-0.53
r2=
0.81,p<0.0001
y=0.77x-0.86
r2=
0.45,p<0.001
P-AAEDTA
(1989)-P-AAEDTA
(l99
i)y=0.57x-7.43
r2=0
.84,
p<0.0001
y=0.50x-16.73
r2=
0.54,p<0.0001
y=
0.70x-38.96
r2=
0.51,p<0.0001
P-Olsen
(1989)-P-Olsen
(1998)
y=0.50x-6.99
r2=0
.64,
p<0.0001
y=0.55x-2.00
r2 =
0.33,p<0.01
n.s.
Elmi
n(1989)"
Eimln
(1998)
v=
0.81x-1.85
i*=0.90,
p<0.0001
y=0.83x-5.21
r2=
0.88,pO.0001
y=0.85x-9.6
r2=
0.60,p<0.0001
n.s.non
significantcorrelation

II. Evaluation offour chemical extraction methods 69
whatever the extraction method, the lowest P extractability was observed for the OP
treatment, and the highest for the P>exp treatment.
In Rümlang OP, where significant yield decreases have been observed from 1994
onwards (see Chapter 1), P-CO2, P-H2O, P-AAEDTA, and P-Olsen varied respectively
from 0.5, 1.0, 34.5, 37.3 in 1993 to 0.2, 0.3, 30.4, 31.6 mg P kg"1 soil in 1998. This
suggests that the critical levels under which a P deficiency would occur in these
crop/soil systems would be lower than 0.5, 34.5, 37.3, 1.0 mg P kg"1 soil for P-CO2, P-
AAEDTA, P-Olsen and P-H2O, respectively. The P uptake has been strongly reduced in
Vaz after 1993 (see Chapter 1), although levels of P-C02 (5 mg P kg"1 soil) and P-H20
(11.7 mg P kg"1 soil) were much higher than the critical level observed in the field crops
rotations soils, while levels determined with Olsen (23.2 mg P kg"1 soil) and AAEDTA
(37.3 mg P kg"1 soil) extraction methods were closer to the critical levels determined for
the field crops rotations.
30-50 cm horizon
At four of the five field crop rotation sites started in 1989 significant decrease in P-CO2
were observed between 1989 and 1998 in the 30-50 cm horizon (Table 2.3), suggesting
that the crops had taken up P from the subsoil or, as already seen in the Chapter 1, that
slow reactions between soluble P and the soil solid phase occurred. P-H2O decreased
significantly in two sites between 1989 and 1998, while P-AAEDTA and P-Olsen
showed both increases and decreases. In the samples taken in 1998 in Rümlang, P-H2O,
P-CO2, P-AAEDTA and P-Olsen values were significantly lower in the OP treatment
compared to the P>exp treatment. No significant differences were observed between the
P fertilization regimes in 1998 in the other sites.
Correlations between the P-balances and the quantities ofP extracted
Relationships between cumulated P balances and quantities of P extracted by the
different extraction methods are represented in Figure 2.1 and correlation equations are
presented for each site in Table 2.4. The best correlations for all sites were obtained for

II.Evaluationoffourchemicalextractionmethods
70
Table
2.3.
P-availability
determinedby
fourextractionmethodsand
Eimi„value
inthe30-50cm
horizonofthe
studied
soilsin1989
and
1998.
Site
treatment
P-H20
P-C02
P-AAEDTA
P-Olsen
E,
mgP
kg"1
1989
1998
1989
1998
1989
1998
1989
1998
1989
1998
OP
RUmlang
P P>exp
0.12
0.04
n.sC
0.35
0.10
n.sB
0.45
0.31
n.sA
0.17
0.05
*B
0.22
0.08
**
B
0.29
0.21
n.s.A
3.77
8.03
*B
10.27
10.37
n.s.B
8.57
22.47
n.s.A
18.25
15.08
*B
26.32
20.23
n.s.AB
23.92
29.32
n.s.A
1.91
0.98
*B
3.29
1.41
n.s.AB
2.65
2.56
n.s.B
OP
FAL
P P>exp
0.16
0.11
*A
0.25
0.11
n.s.A
0.15
0.13
n.s.A
0.09
0.04
**
A
0.11
0.05
n.s.A
0.08
0.08
n.s.A
10.87
13.77
n.s.A
11.73
13.87
n.s.A
11.33
15.17
n.s.A
9.55
9.00
n.s.A
11.01
8.66
n.s.A
10.17
12.91
n.s.A
2.74
1.81
*B
3.70
1.94
n.s.B
3.04
2.51
n.s.A
OP
Ellighausen
P P>exp
0.38
0.10
n.s.A
1.66
0.10
n.s.A
0.79
0.22
n.s.A
0.23
0.06
n.s.B
0.25
0.08
*B
0.34
0.16
n.s.AB
8.17
4.90
n.s.B
18.90
7.08
n.s.B
12.17
12.33
n.s.AB
11.70
5.51
n.s.A
14.59
11.61
n.s.A
22.26
6.68
n.s.A
3.23
1.69
n.s.A
5.80
1.84
n.s.A
3.88
2.09
n.s.A
OP
Oensingen
P P>exp
0.45
0.10
n.s.A
0.39
0.13
n.s.A
0.48
0.14
*A
0.29
0.05
n.s.A
0.14
0.05
*A
0.13
0.05
*A
15.90
11.57
*A
9.10
10.27
n.s.A
8.78
9.53
n.s.A
18.49
12.46
n.s.A
15.20
14.86
n.s.A
16.86
14.64
n.s.A
6.39
2.38
*A
6.14
2.17
*A
7.99
2.70
**A
OP
Cadenazzo
P P>exp
1.12
1.39
n.s.B
1.64
1.34
n.s.B
1.10
1.51
n.s.B
0.30
0.33
n.s.A
0.30
0.41
n.s.A
0.34
0.31
n.s.A
15.35
13.90
n.s.A
12.03
15.90
n.s.A
16.70
13.95
n.s.A
13.25
17.32
*A
17.71
19.00
n.s.A
12.88
20.77
*A
2.18
2.45
n.s.B
2.92
2.37
n.s.B
2.02
2.40
n.s.B
n.s.indicatesno
significantdifferencesbetween1989and1998
atp<
0.05
,indicates
sign
ific
antdifferencesbetween
1989and1998
atp<
0.05
,**
indicatessi
gnificantdifferencesbetween1989and1998
atp<
0.01
Differenthigher
case
lettersforthesame
soil
and
forthesameyearindicate
astatisticallysi
gnificantdifferencebetweentreatmentatthe5%
probabilitylevelbytheDuncan'smultiple
range
test.
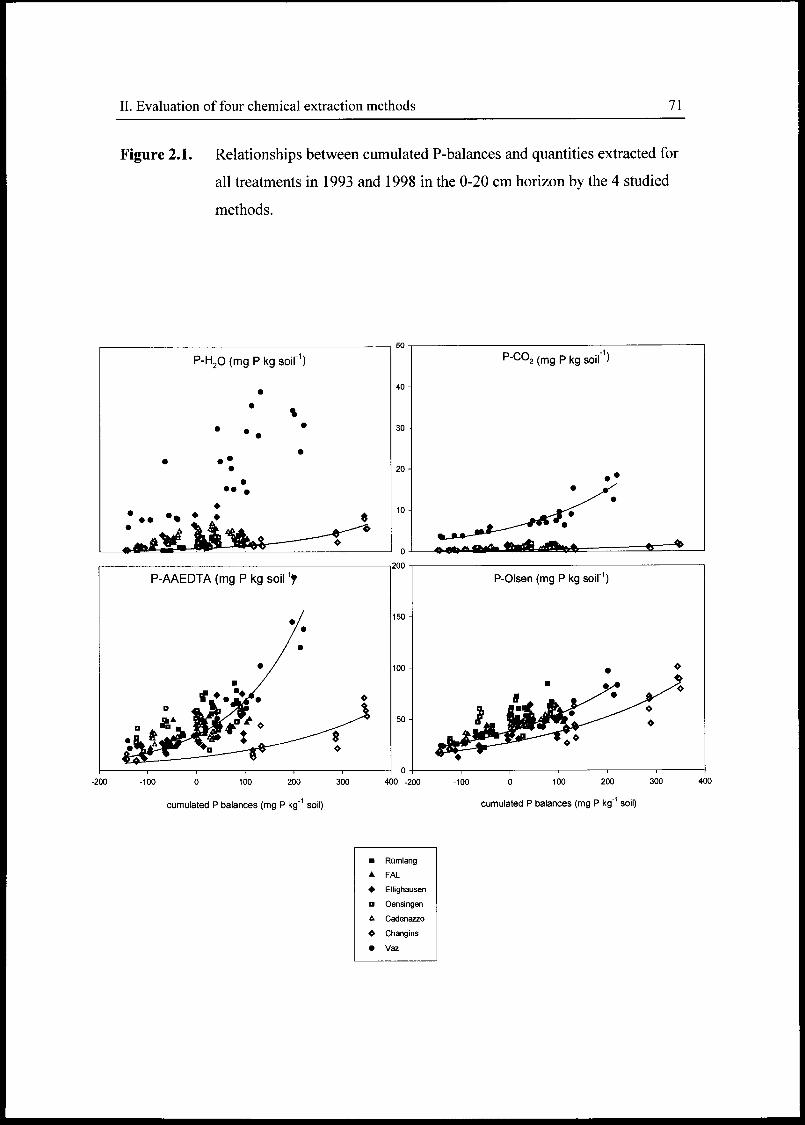
IL Evaluation offour chemical extraction methods 71
Figure 2.1. Relationships between cumulated P-balances and quantities extracted for
all treatments in 1993 and 1998 in the 0-20 cm horizon by the 4 studied
methods.
P-H2o (mg P kg soil"1)
•
*
%
•
• •••
•
•••
•
" **%
* *
40
-200 -100
20
100 200 300 400 -200
p_c02 (mg P kg soil )
P-Olsen (mg P kg soil"1)
cumulated P balances (mg P kg" soil)
-100 0 100 200 300
cumulated P balances (mg P kg1 soil)
Rumlang
FAL
Ellighausen
D Oensingen
b. Cadenazzo
o Changins
• Vaz

IL Evaluation of four chemical extraction methods 72
-y
Olsen extraction. In 1993, coefficients of correlation (r ) ranged from 0.34 to 0.76 for P-
C02, from 0.17 to 0.80 for P-AAEDTA, from 0.44 to 0.81 for P-Olsen and from 0.54 to
0.75 for P-H2O (not shown). These results suggest that the Olsen method is, for the
studied soil/crop systems, the most appropriate analysis to routinely detect changes in P
availability when soil P status varies.
Correlations between the amount ofP extracted by the studied extraction methods
0-20 cm horizon
The statistically significant regression equations obtained between all extraction
methods for all soils and treatments for the 0-20 cm horizon are given in Table 2.5. P-
H2O and P-CO2 were highly correlated with Eimm in all soils and P treatments. P-H2O
and P-CO2 were in all P treatments highly significantly correlated. P-Olsen and P-
AAEDTA were also significantly linearly correlated to Eimin, but with a lower degree of
significance than P-H20 and P-CO2 in OP and P treatments. P-H2O and P-CO2 were not
correlated to P-AAEDTA and P-Olsen in the OP and P treatments, but P-AAEDTA and
P-Olsen were in all P treatments highly significantly correlated.
These results show that all the tested methods give an indication of the amount of P
immediately and totally plant available as assessed by the Eimin value. These relations
also show that a P-CO2 extraction gives an information close to the P-H2O extraction
(i.e. the intensity factor) and that AAEDTA extraction gives an information similar to
that given by the Olsen extraction. However, the AAEDTA or Olsen extraction do not
give any information on the intensity factor.
30-50 cm horizon
Results obtained by the different extraction methods in the 30-50 cm horizons of the
different soils were not statistically correlated to each other. This absence of relation
hinders the identification of a method that could allow assessing the P availability in
subsurface horizon.

ILEvaluationoffourchemicalextractionmethods
73
Table
2.4.
CorrelationsbetweenP-quantities
extractedbythefourstudiedmethods
(y)andPbalances(x)
measuredin1993and1998
for
alltreatmentsandeach
soil.
P-H20
P-C02
P-AAEDTA
P-Olsen
sitesequation
r2P
equationr2
Pequation
r2P
equationr2
P
Rümlang
FAL
Ellighausen
Oensingen
Cadenazzo
Changins
Vaz
All
fieldcropsrotations
started
in1989
Allfieldcropsrotations
All
sitestogether
y=0.017x+1.8
0.47
O.001
y=0.0097x+
2.9
0.16
<0.05
n.s.
n.s.
y=0.015
x+4.2
0.42
<0.001
y=0.79e00061x
0.86
O.0001
y=0.075x+16.7
0.63
<0.0001
y=0.011
x+2.9
0.12
<0.0001
y=0.087x+2.7
0.20
O.0001
y=0.026
x+4.8
0.13
O.0001
y=0.0073
x+0.8
0.67
O.0001
y=0.0032x+
0.7
0.65
O.0001
y=0.0048x+1.0
0.35
<0.01
y=0.0027
x4-0.7
0.29
<0.0001
n.s.
y=0.31
e00047x0.84
<0.0001
y=5.64e0048x
0.85
O.0001
y=0.0037
x+
0.8
0.30
<0.0001
y=0.0023
x4-0.8
0.28
O.0001
y=0.010x4-1.6
0.11
O.0001
y=0.31x4-49.4
0.69
<0.0001
y=0.13x4-41.4
0.46
O.0001
y=0.16x4-37.7
0.40
<0.001
y=0.083x4-
48.1
0.19
<0.05
y=0.070
x4-37.4
0.23
<0.05
y=12.85e0004lx0.77
<0.0001
y=34.34e00069x
0.88
O.0001
y=0.14x4-
43.1
0.32
<0.0001
y=0.063x
4-39.2
0.14
<0.0001
y=0.012
x4-40.9
0.25
O.0001
y=0.26x4-49
0.69
<0.0001
y=0.14x4-45.7
0.71
<0.0001
y=0.14x4-37.7
0.51
<0.0001
y=0.11
x4-49.8
0.39
<0.001
y=0.11x4-
42.3
0.75
O.0001
y=27.23e00033x
0.88
O.0001
y=38.39e00036x
0.91
<0.0001
y=0.14x+
45.1
0.47
O.0001
y=0.11x4-43.2
0.54
<0.0001
y=0.12x4-43.1
0.59
O.0001
n.s.non
significantcorrelation

II.Evaluationoffourchemicalextractionmethods
74
Table
2.5.CorrelationsbetweenthedifferentmethodsofP-availability
determinationforthe0-20cm
horizon.
alltreatmentsallsoils
OP
allsoils
Pallsoils
P>exp
allsoils
equation
r2
Pequation
r2
Pequation
r2
Pequation
r2
P
Eim,„=117P-H204-73
078
<00001
Ellmn=238P-C02
4-9
5056
<00001
E,mm=023P-AAEDTA
4-34
029
<00001
Ei
=035P-Olsen
-179
026
<00001
P-H20=2
11P-C02
-067
079
<00001
P-H20=014P-AAEDTA
4-17
019
<00001
P-H20=015
P-Olsen
-113
0092
<00001
P-C02=0062P-AAEDTA-0
9020
<00001
P-C02=006P-Olsen-079
0082
<00001
P-AAEDTA=114
P-Olsen
-63
054
<00001
Elmm=
139P-H204-49
074<00001
E,mln=246P-C02+
68
044<00001
Elmm=022P-AAEDTA
4-29
018
<0001
Ei,=042P-Olsen-426
031
<005
P-H20=
169P-C02+
148
054<00001
P-H20=005P-AAEDTA
4-20
003
ns
P-H20=013
P-Olsen-079
008
<0
01
P-CO2=001P-AAEDTA4-11
005
ns
P-C02=003P-Olsen4-035
002
ns
P-AAEDTA=114
P-Olsen
-59
064<00001
Eimm=112P-H20
4-805
072
<00001
Elmm=241P-CO24-10
13
055
<00001
Elmm=015P-AAEDTA4-79
008
<005
Elnun=027P-Olsen+
189
0083
<001
P-H20=226P-C024
163
085
<00001
P-H20=003P-AAEDTA
4-4
7001
ns
P-H20=
001P-Olsen4-5
500004
ns
P-C02=001P-AAEDTA-t-14
001
ns
P-CO2=001P-Olsen4-135
0002
ns
P-AAEDTA=
11P-Olsen
-44
038
<00001
Ei„u„=
1068P-H20+927
082
<00001
Elmi„=217P-C024-1208
063
<00001
Elmln=024P-AAEDTA4-39
033
<00001
Eimm=034P-Olsen-162
018
<00001
P-H20=2
11P-C024-241
083
<0001
P-H20=020P-AAEDTA
-37
033
<00001
P-H20=018
P-Olsen-216
007
<005
P-CO2=
01P-AAEDTA
-33
046
<00001
P-C02=0
1lP-Olsen
-336
013
<001
P-AAEDTA=
12P-Olsen
-89
037
<0001
n.s.non
signif
icantcorrelation

IL Evaluation of four chemical extraction methods 75
Interpretation of the results obtained by thefour tested extraction methods according
to the Swiss interpretation schemefor Pfertilization
The classification of soil P availability into 4 categories (very low, low, medium, high,
very high) for extraction with C02-saturated water and with AAEDTA in the different
soils is given in Table 2.6. Classes for the two extraction methods were made according
to clay content of each soil, as proposed by Walter et al. (2001). According to Walter et
al. (2001), P applications should correspond to 1.5 x crop P exportations in the form of a
water-soluble mineral P fertilizer for very low soil P levels. For low levels, P
applications should range between 1.2 and 1.4 x crop exportations. For medium levels,
P applications should be comprised between 0.9 and 1.0 x crop exportations when P-
availability is measured with the Dirks-Scheffer method (P-CO2), and P applications
should cover crop exportations when P-availability is estimated as medium with the
Cottenie method (AAEDTA). For high levels, P applications should be comprised
between 0.2 and 0.8 x crop exportations. For very high levels, it is recommended to
apply no P.
With the Swiss classification using the Dirks-Scheffer (P-CO2) method, the P-level at
the beginning of the trials was considered as medium for all field crops rotations started
in 1989 and very high for the Vaz grassland. With the AAEDTA extraction method, the
P-level at the beginning of the trials was considered for medium except for Cadenazzo,
Changins and Vaz, where the initial P-level was considered as low. At the end of the
trials for the OP treatment, according to the Dirks-Scheffer method (P-C02), the P-level
was considered as low for all field crops rotations except Rümlang and Cadenazzo
where it was estimated as very low, and still very high for the Vaz grassland. Soil P
levels at the end of the trials for the OP treatment were estimated as low for all sites by
the Cottenie extraction method (AAEDTA). Different P fertilization regimes did not
affect yield at the studied sites, except for Rümlang OP, where yields significantly
decreased after 1994 for a P level estimated as low. It can be concluded, therefore, that
the actual scheme of interpretation of P-CO2 and P-AAEDTA results (Walter et al.,
2001) clearly underestimates the P status of the studied field crops rotations. For the
Olsen method, a level of 37 mg P kg"1 soil could be considered as critical. This critical
value is higher than that found by Kamprath and Watson (1980), who reported a critical

ILEvaluationoffourchemicalextractionmethods
76
Table
2.6.
ClassificationofP-availability
levelsofthestudied
soilsfortheC02-saturatedwaterandAAEDTA
extractions
for
the0-20cm
horizon.
Recommendation
P-level(meP
ks"1soil)
determinedbvC02-saturatedwaterextraction
vervlow
low
medium
high
vervhigh
P-level(mgP
kg"1soil)
determinedbvAAEDTA
extraction
vervlow
low
medium
hieh
vervhish
1.5xCE
1.2-1.4xCE
0.9-1.OxCE
0.2-0.8xCE
noapplications
1.5xCE
1.2-1.4xCE
1.0xCE
0.2-0.8xCE
noannlications
Rfimtanp
0-04
b»p
05-09
»nn
bp
09-7
171-40
>40
/10
-49
9
a»p.bop
SO
-749
a.bp,bp>^rn
75-
1149
>115
FÂI
/0-04
b/ip
OS-
1S
a.bp«
bp>^rn
15-7
8>7
8/
0-449
bop.bp
45
-699
70
-1099
>110
Flliohaii«pn
/0-06
b»p
06-17
a.bp.
bp>...„
17-11
>1
1/
0-449
45
-699
ap.bp>„„
70
-1099
>110
Opn«inoen
/0-04
b»P
OS-
1S
15-7
8>7S
/0-449
bop,bp
45
-699
a,bp>*vn
70
-1099
>110
Cat\ena77n
n-ns
b/in.bp,
bp.Bjp
08-12
17-78
a
78-5
7>5
70-149
1S
-599
a.bop.bp.bp»,.„
60
-84
985
-1749
>175
Chantrin«
/0-01
afop»bop
01-19
a'p,8'p.op,
bp
17-71
bP>exp
>71
/0-149
a'o/><a'p>
a'pietp,
15-599
60
-99
9
Op>exp
>100
V»7
o-oi
01-08
08-18
19-1
S>16
allvalues
/0-499
a.bop
SO
-749
bp
75-1149
>115
bp,»
Abbreviations:
CE
a»p
aP>exp
a'»/>
a'P
a'
P>exp
bop
bp
bP>exp
cropexportations
initialP
statusin1989
forthefieldcropsrotationsstarted
in1989
initialP
statuswhen
the
initialP
statuswas
differentfortheOPtreatmentforthefieldcropsrotationsstartedin1989
initialP
statuswhen
the
initialP
statuswas
differentfortheP
treatmentforthefieldcropsrotationsstartedin1989
initialP
statuswhen
the
initialP
statuswas
differentfortheP>exp
treatmentforthefieldcropsrotationsstartedin1989
Pstatusin1993
inChangins
fortheOPtreatment
Pstatusin1993
inChanginsfortheP
treatment
Pstatus
in1993
inChangins
fortheP>exptreatment
finalP
status
in1998fortheOPtreatment
finalP
statusin1998
fortheP
treatment
finalP
status
in1998
fortheP>exp
treatment

IL Evaluation of four chemical extraction methods 77
Olsen-P level of 10 mg P kg-1 soil for wheat, alfalfa and cotton on many neutral to
calcareous soils or by Johnston et al. (1986) cited by Sibbesen and Sharpley (1997),
who showed that 95% of maximum yield of potatoes, sugar beets, spring barley and
winter wheat could be achieved in an acid soil at Olsen P levels between 20 to 25 mg P
kg" soil. For permanent grassland, Tunney et al. (1997) reported that Olsen P levels
higher than 20 mg P kg"1 soil were classified as very high for a medium textured soil,
which is again much lower level than the P-levels observed in our particular study (site
Vaz). For the water extraction method used in this work, the critical level for field crops
would be close to 1 mg P kg"1 soil. In their review, Sibbesen and Sharpley (1997)
reported critical levels for potato ranging from 9 to 20 mg P kg"1 soil, but they cited
work using a water extraction of 1 hour with a 1:60 soil.solution ratio. Precise
classification and interpretation scales can only be given when yield responses occur
systematically. This is why long-term field experiments are of major importance to
determine soil P critical levels, and the time during which P fertilization can be omitted
without negative effects on crops yields.
Conclusions
In the upper soil horizon the amount of P extracted by all the tested methods (P-CO2, P-
H2O, P-AAEDTA, P-Olsen) were highly significantly correlated to the amount of P
isotopically exchangeable within one minute. Therefore, each of these four extraction
methods can give relevant information on soil P availability. P-CO2 and P-H2O methods
extracted less P than the P-AAEDTA and P-Olsen which probably also extracted
significant quantities of unavailable forms of P. P-AAEDTA and P-Olsen probably
more closely reflects the quantity factor, while P-H2O and P-CO2 reflect the intensity
factor as defined by Beckett and White (1964). All methods gave results significantly
correlated to the cumulated P balances observed in the field experiments, however a
higher degree of correlation was observed with the Olsen P method. This suggests that
the Olsen P method is, for the studied systems, more adapted to routinely assess changes
in P availability when soil P status changes. The decrease in soil P extractability
between the beginning of the trial and the last measurement was highly correlated to the

IL Evaluation of four chemical extraction methods 78
initial amount of P extracted by all methods and to selected soil characteristics
suggesting that the decrease in P extractability can be modeled with time in the studied
systems.
The actual Swiss interpretation scales of the AAEDTA and C02-saturated water
extractions underestimated the soil available P status. Under Swiss conditions, when
crops with high P requirements such as potato are grown in rotation, values of resp. P-
C02, P-AAEDTA, P-Olsen, P-H20 should remain above resp.0.5, 34.5, 37.3, and 1.0
mg P kg"1 soil to avoid P limitation.
This work outlines again the importance of long-term field experiments for estimating
properly the soil-available P status in relation to crop yields and for making adequate
fertilization recommendations.

CHAPTER III
Uptake of fresh and residual phosphate fertilizers
by Lolium perenne and Trifolium repens grown separately or in association

III. Uptake of fresh and residual fertilizers in a pot experiment 80
Abstract
Residual phosphorus may significantly contribute to plant nutrition. To test this
hypothesis, a pot experiment was conducted with English ryegrass (Lolium perenne, cv
Bastion), white clover (Trifolium repens, cv Milkanova) and a mixture Lolium I
Trifolium growing on three Swiss agricultural soils under controlled conditions.
Treatments with or without application of a fresh soluble P-fertilizer (fertilizer-P
labelled or not with 33PÛ4) on soils with or without residual P (residual-P labelled or not
with 33P04) allowed estimation of the quantities of P taken up by plants coming from
different sources of fertilizers. Yield increases were observed for clover in most soils in
the presence of residual and fresh fertilizations, showing the higher requirements of this
plant for P. Larger proportions of ryegrass were observed in the mixture, reflecting the
competitive ability of the two species for light and nutrients. Fourteen to 62% of the P
taken up by the aerial parts of white clover or English ryegrass, grown separately or in
association, were derived from residual P-fertilizers whereas only 7 to 28% were
derived from a fresh P-fertilizer addition. The proportion of P derived from residual P
was mainly controlled by the total amount of P-fertilizers added to the soils, whereas the
proportion of P derived from fresh P-fertilizer was mainly controlled by the
concentration of P in soil solution. The kinetics of P-uptake derived from soil, residual
and fresh fertilizers were the same as the kinetics of dry matter yield production of
clover and ryegrass grown separately or in association. This similarity suggests that the
uptake of P coming from different source of fertilizers is driven by plant demand for P,
which itself was controlled by the accumulation of assimilates derived from the
photosynthesis. The improved understanding of the contribution of residual P to P
supply of ryegrass and white clover will assist in the design of more agronomically
appropriate and environmentally sensitive P fertilization strategies.
Key words: Lolium perenne, Trifolium repens, mixture Lolium I Trifolium, fresh fertilization, isotopic
methods, phosphorus, residual fertilization

III. Uptake of fresh and residual fertilizers in a pot experiment 81
Introduction
Long-term applications of phosphate (P) fertilizers at levels exceeding crop
requirements have resulted in an accumulation of plant available P in the upper layer of
agricultural soils in many countries (Barberis et al., 1996; Sibbesen and Runge-Metzger,
1995). This has increased the transfer of P from agroecosystems to ground and surface
waters (Frossard et al., 2000; Sinaj et al., 2001; Sharpley and Withers, 1994). A
decrease in P availability in these soils might contribute to reduce P losses to the
environment. It is, therefore, of interest to assess the contribution of P fertilizers added
in the past to the nutrition of present crops, i.e. the value of residual P fertilizer.
This can be assessed in long-term field experiments by comparing the yield and/or P
uptake of crops grown with a yearly application of P fertilizer to those of crops grown
after cessation of P fertilization. A large number of long-term field experiments
conducted in Western Europe have shown that crop yield had not decreased even
several years after the cessation of P fertilization (Boniface and Trocmé, 1988; Rubask,
2000; Gransee and Merbach, 2000). However, because of their costs, long-term field
experiments can not be conducted in many situations.
A large amount of research have been conducted to assess the value of residual P
fertilizer in P limited soils (Barrow, 1980). Barrow and Campbell (1972) quantified the
value of residual P by comparing the effect of a previously applied fertilizer to the effect
of the same fertilizer freshly applied on crop yield or P uptake. The residual value has
been measured using response curves relating yield, P uptake or soil test values with the
application of fertilizers (Mendoza, 1992; Bolland et al., 1999). Response curves
relating yield to fertilization, however, can not be used in soils where plant growth is
not limited by P availability (Morel, 1988). Little information is therefore available on
the effect of past fertilizations on soils with high available P levels.
Isotopic techniques have been used to assess the efficiency of P fertilizers, mostly in pot
experiments, since decades (Fried and Dean, 1952; Fardeau, 1996). The use of
radioactive P allows measuring the contribution of a P fertilizer to the P nutrition of a
plant grown in a soil / fertilizer mixture where either the soil available P or the fertilizer
P has been labelled. Morel and Fardeau (1989a; 1989b) have extended the use of these

III. Uptake offresh and residual fertilizers in a pot experiment 82
isotopic techniques to assess the value of residual P fertilizer. They consider the residual
P as a P pool which, when taken up by the plant, will dilute the radioactive P taken up
by the plant added either with the freshly applied fertiliser or to label the soil available
P. By comparing the specific activities of harvests, it becomes possible to quantify the
amount of P taken up by the plant derived from residual P, freshly applied P and soil.
As this approach allows following the fate of P in the soil / plant system, it can be used
in soils where plant growth is not limited by P availability.
Since plants have different requirements for P, the choice of a given plant species might
affect the value of residual P fertilizer although Barrow and Campbell (1972) could not
find any difference between Lolium rigidum and Trifolium subterraneum. Most of the
studies conducted with radioactive P have been done with English ryegrass (Lolium
perenne) (Morel and Fardeau 1989 a and b) which has a highly ramified root system, a
high P acquisition efficiency (g P taken up / plant) and a high nutrient use efficiency (g
P taken up / kg DM) (Caradus, 1980; Föhse et al., 1988; Bailey, 1991; Marschner,
1995). To obtain a more realistic assessment of the residual value of P fertilizer another
plant species should be considered with a root system less efficient in term of P uptake
and with higher P requirements such as Trifolium repens (Dunlop and Hart, 1987;
Caradus, 1990, Whitehead, 2000 ). Moreover, excessive P accumulation in soils under
temperate climate is often observed in intensive animal production systems where
animal slurries are repeatedly applied to pastures where both plants are associated
(Hooda et al., 1999; Mc Dowell and Condron, 2000). This is why the choice of Lolium
perenne and Trifolium repens to assess the residual value of P fertilizer is also relevant
in this study.
The objective of this research was to quantify, using the approach of Morel and Fardeau
(1989 a and b), the contribution of residual phosphorus to the nutrition of Lolium
perenne and Trifolium repens, grown in a pot experiment conducted under controlled
conditions either separately or in association. The soil samples used for this study were
taken in three field experiments located in Switzerland, where soils had received either a
yearly P fertilization equivalent to the amount of P annually exported by the crops or no
P and, where the cessation of P fertilization had not yet resulted in significant and
consistent yield decrease. In this work the term "residual P" refers to the difference in

III. Uptake of fresh and residual fertilizers in a pot experiment 83
soil total P observed between these two treatments which resulted from the different P
applications in fertilizers and P exportations by crops. A secondary objective of this
work was to compare the efficiency of the residual P to that of a freshly applied
fertilization.
Material and Methods
Soils
The soils were collected in 1998 from three field experiments (Cadenazzo, Ellighausen
and Changins) in two treatments applied since the beginning of the trial (OF: no P
applied, and F: P annually applied as triple superphosphate in quantities equal to the
off-take by the crops).
The field trial of Cadenazzo was located in the canton of Ticino, Switzerland
(715.500W / 113.215N), at an altitude of 197 m with an average rainfall and mean air
temperature of respectively 1772 mm and 10.5°C. The crop rotation established in this
trial was maize, soja, potato, winter wheat and grassland (2 years). The treatment F
received also 41 CaO ha"1 year"1.
The field trial of Ellighausen was located in the canton of Thurgau, Switzerland
(728.110W / 274.625N), at an altitude of 440 m with a respective average rainfall and
mean air temperature of 916 mm and 8.5°C. The crop rotation established in this trial
was winter wheat, potato, winter barley, maize, sugar beet, grassland (2 years), potato.
The field trial of Changins was located in the canton of Genève, Switzerland (507.85W /
139.30N), at an altitude of 438 m with a respective average rainfall and mean air
temperature of 940 mm and 9.5°C. The crop rotation established in this trial was winter
wheat, maize, winter wheat, winter rape.
Two of the trials (Cadenazzo, Ellighausen) had been established by the Swiss Federal
Research Station for Agroecology (Zurich) in 1989, whereas the Changins trial had
been established by the Swiss Federal Research Station for Plant Production in 1971.

III. Uptake of fresh and residual fertilizers in a pot experiment 84
All field trials had a randomized block design with 4 replicates. Each microplot had
length of 8.25 m and a width of 4 m for Cadenazzo and Ellighausen and 15 m and 8 m
for Changins. The distance between microplots along the longest side was 1 m. In
Cadenazzo and Ellighausen, apart from P, all the other nutrients were applied according
to the guidelines of the Swiss integrated production (Walter et al., 1994), i.e. the
nutrients were applied according to the requirements of the crops and their availability
in the soil. On the Changins OF treatment, no K was applied, and N was applied
according to the guidelines of the Swiss integrated production (Walter et al., 1994).
In each trial, the 0-20 cm layer was sampled in the 4 replicates of the OF and F
treatments by taking 16 points at random in the inner part of each microplot. The coarse
plant debris were removed from the soil by hand and the samples were carefully mixed.
The soils were then air-dried and sieved at 2 mm before been used for further analysis
and in the pot experiment. Soil types and some of the soil characteristics are presented
in the Table 3.1.
Pot experiment
Treatments
Twelve treatments were considered for each soil: 4 "rates of P fertilization" combined
with 3 "plants" in a completely randomized design. Each treatment was replicated four
times. The four P treatments were as follows: OF; F; OF+DAP in which the OF treatment
received at the beginning of the pot experiment a fresh fertilization in the form of
diammonium phosphate; and F+DAP. The 3 "plants" treatments were: soils planted
with Lolium perenne (cv Bastion) alone, Trifolium repens (cv Milkanova) alone or in a
mixture.

III.Uptakeoffreshandresidualfertilizersinapotexperiment
85
Table
3.1.Selectedpr
oper
ties
ofthestudiedsoils
Sitelocation
Soilty
pet
Treatment
pHf
BSJ
%
TOC#
Clay
Nt
gkg
"1
Fed§
Aid
Cadenazzo
EutricFluvisol
OF F
6.0
7.7
35.6
82.2
11.3
11.9
80
1.5
1.4
8.4
8.3
1.1
1.1
Ellighause
nEutricCambisol
OF F
6.4
6.5
64.6
65.5
20.3
19.1
310
2.8
2.5
9.6
9.1
1.8
1.7
Changins
Gley
icCambisol
OF F
6.3
6.4
70.8
69.8
23.8
24.9
540
2.3
2.4
16.6
15.9
2.0
1.9
tFAO
classification
fpH
wasmeasuredinasu
spen
sion
oflg
dry
soil
to2.5mL
deionizedwater
tBase
saturation:rateofCEC
saturation(Ca+Mg+Na+K)*100/CEC(Thomas,1982)
#TOC:
totalorganicC
content
§Fe
d,Aid:dithionite-citrate-bicarbonateextractableFeandAl

III. Uptake offresh and residual fertilizers in a pot experiment 86
Quantification ofthe P taken up by a crop derivedfrom the soil (qSOii), from the residual
fertilizers (qrß andfrom thefreshfertiliser (qjj): the principles
Phosphorus taken up by a crop (q) on a freshly fertilized soil is the sum of the P derived
from the soil (qSOii), the fertilizers applied before the pot experiment, i.e. from residual
fertilizers (qrf) and from fertilizer applied during the pot experiment, i.e. the freshly
applied fertilizer (qff). Based on isotopic dilution principles (Fried and Dean, 1952),
different sources can be distinguished by labelling the soil available P with carrier-free
PO4 ions before P fertilization or by using a labelled fresh P fertilizer. A plant growing
on a soil with a labelled P source (for instance soil P) is characterised by a defined
specific activity SA (ratio 33P / 31P). If other non-labelled sources of P (residual
fertilizer, fresh fertilizer) are available to the plant, 33P isotope coming from the labelled
source becomes diluted in the plant by P coming from other non-labelled P sources.
The comparison of specific activities of plants growing on different treatments with a
labelled P source and with or without additional non-labelled P, allows the contribution
of each P source to plant nutrition to be determined.
Determination ofP derivedfrom the freshfertilizer (q/ß
The effectiveness of a fresh fertilization can be estimated by the quantity of P in the
plant derived from fresh fertilizer uniformly labelled 33P04 (Fardeau et al., 1996). It can
be calculated as follows:
Parameters used are the following:
• q<0F+DAP): the total plant uptake for the OF+DAP treatment (mg P kg"1 soil)
• qtï(0F+DAP) : the fresh P fertilizer uptake for the OF+DAP treatment (mg P kg"1 soil)
• qsoii(OF+DAP): the soil P uptake for the OF+DAP treatment (mg P kg"1 soil)
• r<0F+DAP): the radioactivity measured in the plant (MBq kg"1 soil) grown on the
OF+DAP treatment
• SAdap: the specific activity of the applied fresh fertilizer (MBq mg" P)
• SA(of+dap>: the specific activity in the plant grown on the OF+DAP treatment (MBq
mg"1 P)

III. Uptake of fresh and residual fertilizers in a pot experiment 87
• PDFff%(OF+DAP): the fraction of P (%) taken up by the plant derived from the fresh
fertilizer on the OF+DAP treatment
• PDFso1i%(of+dap): the fraction of P (%) taken up by the plant derived from the soil on
the OF+DAP treatment
then:
qff(0F+DAP)= T(0F+DAP) X SAdAP [1 ]
It follows for a soil having received a fresh fertilization but that does not contain
residual P (treatment OF+DAP) that:
PDFff%(OF+DAP) = (SA(0F+DAP) / SADAp) x 100 [2 ]
qsoil(0F+DAP)=
q(0F+DAP) " qff(0F+DAP) [3 ]
and:
PDFsojl%(0F+DAP) = ((q(0F+DAP) " qff(0F+DAP)) / q(0F+DAP)) x 100 [4 ]
Determination ofthe amount ofP in the plant derivedfrom the residualfertilizer (qrf) in
the absence ofafresh Pfertilizer
The residual effect of past fertilizations can be measured by comparing the specific
activities of plants growing in the presence (treatment F) and absence (treatment OF) of
residual P. In this case, soil available P is labelled with carrier-free 33P in both
treatments (F and OF) and a plant is grown. Phosphorus derived from the unlabelled
residual P will dilute P in the crop derived from soil available P initially labelled with
33P. The following calculations of the quantity in the plant derived from residual
fertilizer are made according to Morel and Fardeau (1989 a and b).
Parameters used are the following:
• L: the quantity of available soil P (mg P kg"1 soil) determined according to the
Larsen method (Larsen, 1952)

III. Uptake of fresh and residual fertilizers in a pot experiment 88
• tof: the radioactivity (MBq kg" soil) measured on the plant grown on the OF
treatment
• qoF: the total plant uptake for the OF treatment (mg P kg"1 soil)
• L+AL: the quantity of available P in soil F with residual P (mg P kg"1 soil)
• rF : the radioactivity mesured in the plant (MBq kg"1 soil) grown on the F treatment
tf=
tl + tal, where rL is the radioactivity in the plant coming from available soil P
(MBq kg"1 soil) and rAL is the radioactivity in the plant coming from the available
residual P (MBq kg"1 soil)
• qF : the total plant uptake for the F treatment (mg P kg"1 soil)
qF=
qL + qAL where qL is the P taken up from available soil P (mg P kg"1 soil)
and is the P taken up from available residual P qAL (mg P kg"1 soil)
• R: the radioactivity (MBq kg"1 soil) used to label the soil available P
• SAof : the specific activity in the plant grown on the OF soil (MBq mg" P)
• SAF: the specific activity in the plant grown on the F soil (MBq mg"1 P)
• qSOiiF : the soil plant uptake for the F treatment (mg P kg"1 soil)
• qrfF : residual plant uptake for the F treatment (mg P kg"1 soil)
• PDFSoii%F : the fraction of P (%) taken up by the plant derived from the soil on the F
treatment
• PDF,f%F : the fraction of P (%) taken up by the plant derived from the residual P on
the F treatment
According to Larsen (1952), the specific activity of the P in the plant is the same as the
specific activity ofthe available pool in the soil. Therefore:
• On the OF treatment: tof / qoF= R / L [5]
• On the F treatment: rF / qF= R / (L+AL) [6]

III. Uptake of fresh and residual fertilizers in a pot experiment 89
According to Fried and Dean (1952), a plant that is growing on a soil with two sources
is taking up phosphorus from the two sources in direct proportion to the respective
amounts available. For the F treatment it can therefore be deduced that:
qL/L = qAL/AL = (qL + qAL)/(L+AL) = qF/(L+AL) [7]
The percentage of P in the crop derived from the residual fertilizer (PDFrf%F) can then
be calculated:
PDFrf%F=100x(qAL/qF) [8]
It follows for a soil containing residual P but that has not received any fresh fertilization
(treatment F) that:
PDFrf%F = 100 x (1- (SAF / SAof)) [9]
qrff= PDFrf%FxqF [10]
qsoilF=
qF - qrfF [11]
and
PDFsoi1%f = (qS0,iF / qF) x 100 [12]
Determination ofthe amount ofP in the plant derivedfrom the residualfertilizer (qrß in
the presence ofafresh Pfertilizer
The residual effect of past fertilizations in the presence of fresh fertilizer can be
measured by comparing the specific activities of plants growing on unlabelled soils with
freshly applied labelled fertilizer (e.g. DAP labelled with 33P) in the presence (soils
F+DAP) or absence (soils OF+DAP) of residual P. In this case, the 33P-labelled fertilizer
P is diluted by the phosphorus derived from the unlabelled residual P and from the

III. Uptake of fresh and residual fertilizers in a pot experiment 90
unlabelled soil P, assuming that the principles of Fried and Dean (1952) can be
generalised for three sources.
Parameters used are the following:
• T(of+dap) : the radioactivity measured in the plant (MBq kg"1 soil) grown on the
OF+DAP treatment
• q(0F+DAP): the total plant uptake for the OF+DAP treatment (mg P kg"1 soil)
• qff(0F+DAP): the fresh fertilizer plant uptake for the OF+DAP treatment (mg P kg"1
soil)
• T(F+dap): me radioactivity measured in the plant (MBq kg"1 soil) grown on the F
treatment
• q(F+DAP) : the total plant uptake for the F+DAP treatment (mg P kg"1 soil) q(F+DAP)=
q'L + q'AL + qff(F+DAP) where q\ is the P taken up from available soil P in the
presence of DAP and q'AL is the P taken up from available residual P in the presence
ofDAPCmgPkg'soil)
• qff(F+DAP) : the fresh P fertilizer plant uptake for the F+DAP treatment (mg P kg"1
soil)
• R': the radioactivity (MBq kg"1 soil) used to label the total quantity Q of applied
fresh fertilizer (mg P kg"1 soil)
• SA(of+dap): the specific activity in the plant grown on the OF+DAP treatment (MBq
mg"1 P)
• SA(F+DAp): the specific activity of the plant grown on the F+DAP treatment (MBq
mg"1 P)
• qSOii(F+DAP): the soil P plant uptake for the F+DAP treatment (mg P kg"1 soil)
• qrf(F+DAP>: the residual P plant uptake for the F+DAP treatment (mg P kg"1 soil)
• PDFS0,i%(f+dap): the fraction of P (%) taken up by the plant derived from the soil on
the F+DAP treatment

III. Uptake of fresh and residual fertilizers in a pot experiment 91
• PDFrf%(F+DAP): the fraction of P (%) taken up by the plant derived from the residual
P on the F+DAP treatment
• PDFff%(F+DAP): the fraction of P (%) taken up by the plant derived from the fresh
fertilizer P on the F+DAP treatment
The proportion in the crop derived from residual phosphorus in the presence of a fresh
fertilizer is given by:
PDFrf%(F+DAP) = 100 x (q'AL / q(F+DAP)) [13]
By considering the following equations based on the principles presented above it
follows that:
T(0F+DAP) / q(0F+DAP)= R' / (L+Q)
T(F+DAP) / q<F+DAP)= R' / (L+AL+Q)
q'AL / AL =
q(F+DAP) / (L+ AL+Q)
It follows for a soil containing residual P and that has received a fresh fertilization
(treatment F+DAP) that:
PDFrf%(F+DAP) = 100 x (1- (SA(F+dap) / SA(0F+DAP))) [14]
qrf(F+DAP)= PDFrf%(F+DAP) X q(F+DAP) [15]
qsoil(F+DAP)=
q(F+DAP) " qrf(F+DAP) " qff(F+DAP) [16]
where qff(F+DAP) is calculated as described above for qff(0F+DAP)
and
PDFS01i%(F+DAP) = (qsoil(F+DAP) / q<F+DAP)) x 100 [17]

III. Uptake of fresh and residual fertilizers in a pot experiment 92
PDFff%(F+DAP) = (qtf(F+DAP) / q(F+DAP)) X 100 [18]
Experiment
Solid DAP was labelled with 33P04 at the rate of 0.19 MBq mg"1 P after solubilisation in
water, addition of PO4 ions, reprecipitation in pure aceton and drying the precipitate
for 2 days at air temperature (Boniface et al., 1979). Afterwards, the DA33P was added
in the OF+DAP and the F+DAP treatment at a rate of 15 mg P kg"1 soil. Soil and solid
labelled fertilizer were then carefully mixed by hand. In the OF and F treatments soil
available P was labelled with carrier free 33P04 at the rate of 4.8 MBq kg"1 soil. Soil and
liquid labelled solution were carefully mixed by hand.
Pots were filled with 500 g DM soil. Prior to sowing and after each cut, plants were
fertilized with a P-free nutrient solution bringing the following macro nutrients: 55 mg
N kg"1 soil (as NH4NO3 for the treatments without DAP and as NH4NO3 and DAP for
the treatments with DAP), 80 mg K kg"1 soil (K2S04) and 12 mg Mg kg"1 soil
(MgS04.7H20), as recommended for intensively grasslands (Walter et al., 1994), and
the following micronutrients: 2 mg Cu kg"1 soil (CUSO4.5H2O), 2 mg Mn kg"1 soil
(MnS04.H20), 1 mg Zn kg"1 soil (ZnS04.7H20), 1 mg B kg"1 soil (H3BO3) and 0.1 mg
Mo kg"1 soil (M0O3). Pots were then sown with 0.5 g seeds of Lolium perenne for the
ryegrass alone treatment, 4 seeds (around 4.3 mg) of Trifolium repens for the clover
alone treatment and 0.25 g of Lolium seeds and 2 seeds (around 2.1 mg) of Trifolium in
the ryegrass / clover association. After sowing, pots were placed in a growth chamber
for 4 months under controlled conditions (18°C night / 22°C day, 65% atmospheric
humidity and 16 h d"1 photoperiod, 300 umol s"1 m"2 light intensity). Pots were placed in
a completely randomized design in the growth chamber. Soil humidity was maintained
at 70% of the water holding capacity by daily weighing the pots. Plants were cut four
times. The first cut was made after 29 days for ryegrass and mixture and after 39 days
for clover. Afterwards, plants were harvested at 23 days intervals for all plants. After
each cut, dry matter of the aerial parts and P uptake (33P and 31P) were determined. In
the mixture, aerial parts of clover and ryegrass were analysed separately. qSOii, qtr, qrf,
PDFS01i%, PDFff% and PDF,f% were calculated as described above. At the end of the pot

III. Uptake of fresh and residual fertilizers in a pot experiment 93
experiment, roots were separated from the soil and the dry matter production and P
uptake in roots were measured. The roots from clover could not be separated from the
roots of ryegrass in the mixture, only the total production and the mean P concentration
were considered. The radioactive P content of roots was not measured because of the
unavoidable contamination by soil particles. The effect of the seed P on the specific
activities of the plants (Truong and Pichot, 1976) was checked and was found negligible
(data not shown).
Isotopic Exchange Kinetics
This method was used in this work as described by Fardeau (1996) to assess the three
following parameters:
(i) Cp: concentration of water soluble P (mg P L"1).
(ii) R/ri : the ratio of total introduced radioactivity (R) to the radioactivity remaining in
solution after 1 minute of isotopic exchange (ri). R/ri is positively correlated to the P
fixing capacity of soils (Frossard et al., 1993).
(iii) Eimm: the amount of P isotopically exchangeable within 1 minute, which is totally
and immediately plant available (Fardeau, 1996). Eimm is calculated as follows:
Elmm=10xCpxR/r1 [19]
where the factor of 10 arises from the soil solution ratio of 1 g of soil in 10ml of water
so that 10 x Cp is equivalent to water soluble soil P concentration expressed in mg kg" .
Chemical analysis
The water-soluble orthophosphate (Cp), the soil total phosphorus (Pt) and the P content
of plant material were measured using malachite green colorimetry (Ohno and Zibilski,
1991). Soil Pt (Table 2) was measured following soil ignition (1 h at 550°C) according
to Saunders and Williams (1955), whereas the P content in plant material was measured
after calcination (4 h at 550°C) and subsequent solubilization of the ashes in 2ml
concentrated HCl.

III. Uptake of fresh and residual fertilizers in a pot experiment 94
P was measured by mixing lmL of plant radioactive solution in 10 mL of scintillation
liquid (Ultima Gold, Packard Instrument Co., Downers Grove, IL.). Actual counts per
minute (cpm) were always corrected for quenching in order to obtain an absolute
measure of the activity (Bq) (Kessler, 1989).
Statistics
One-way ANOVA analyses with the general linear model procedure (GLM) of the SAS
software (SAS Institute, Cary, NC, USA, version 8, 2000) were carried out firstly to
detect the treatment effects for each soil and secondly, to detect the soil effects for each
treatment. Comparisons have also been made between plants for a same treatment and a
same soil. Means were compared with the Duncan's multiple range test; statistical
significance indicated a 0.05 probability level.

HI. Uptake of fresh and residual fertilizers in a pot experiment 95_
Results and Discussion
Total and isotopically exchangeable P ofthe OF and F soils
The OF Cadenazzo soil had the highest total P content compared to Ellighausen and
Changins OF soils (Table 3.2). In each soil, the F treatment resulted in significantly
higher total P concentration compared to the OF treatment (Table 3.2). The difference in
total P calculated between the two treatments (F and OF) in each soil, was of the same
order of magnitude as the difference in P balance calculated as the difference between P
inputs and P outputs by crops since the beginning of the field trial. We can assume that
crop uptake of P in the OF treatment originated mainly from P fertilizations added
before the beginning of the trial. In this work, we therefore defined the term "residual P
fertilizer" as the difference between the total P concentration of F minus OF treatment.
There was a significant linear regression between the concentration of Pi in soil solution
(Cp) and the total P content of the soils (r2= 0.79; p<0.05). The amount of P isotopically
exchangeable within 1 minute (Eimin) is in all cases, excepted Changins OF, higher than
the value 3.8 mg P kg"1 soil, above which P availability does not limit the production of
winter wheat (Morel et al., 1992). In Changins OF that has not received any P input
since 1971, Eimin has reached a value of 2.6 mg P kg"1 soil. As noted for the total P, the
concentration of phosphate ions in soil solution (Cp) and the amount of P isotopically
exchangeable within 1 minute (Eimin) were significantly higher in the F treatments
compared to the OF treatments.
The R/ri values were maximum in the Changins soils and minimum in the Cadenazzo
soils (Table 3.2). A negative log-log relation could be observed between R/n and the
total P content (r = 0.90; p<0.0001) showing that stopping P fertilisation can result in an
increase of the P fixing capacity of the soil. R/ri was also controlled by chemical
characteristics of the soils as shown by Frossard et al. (1993) since the R/rj values were
maximum in the Changins soils which had the highest clay, Fed and Aid contents and
minimum in the Cadenazzo soil where the lowest values were observed (Tables 3.1 and
3.2).

III.Uptakeoffreshandresidual
fertilizersin
apot
experiment96
Table
3.2.
TotalP,
balance,andparametersoftheisotopic
exchangekineticexperiment
characterisingtheinorganic
Pavailability
in
thestudied
soils.
Pbalanceswere
calculatedasthedifferencebetweentheP
appliedquantities
andthePexported
bythecropsduring
the
fieldexperiments,
usinganapparent
soildensity
of
1.30g
/cm3
forCadenazzo,and
1.22g
/cm3
forEllighausen
and
Changins.
Cp
R/rl
Elmin
Pt
mgP
kg"1P-Balance
Cadenazzo
OF
0.301
A1.7
C5.1
A1159
A-88
A
F0.515***a
1.4
**
c72
***
b1302***a
21
***
ab
EllighausenOF
0.166
B3.0
B5.0
B770
B-113
B
F0.354***b
2.4
**
b85
***
ab
845
***b
"I"1
¥tt
r*
Changins
OF
0.033
C8.1
A2.7
C553
C-144
C
F0.197***c
4.5
***
aQO
***
a750***
c133
***
a
**
indicatessignificant
differencesbetweentheOFandFtreatmentforasame
soilatp<
0.01
(t-test)
***
indicatessignificant
differencesbetweentheOFandFtreatmentforasame
soilatp<0.001
(t-test)
Differenthigher
case
lettersfor
theOF
treatment
indicate
astatistically
significantdifferencebetween
soilsatthe5%
probabilitylevelby
theDuncan's
test.
Differentlowercase
lettersfortheFtreatmentindicatea
statisticallysignificant
differencebetween
soilsatthe5%
probabilitylevelbytheDuncan's
test.

HI. Uptake of fresh and residual fertilizers in a pot experiment 97
Dry matter yieldproduction ofaerialparts and roots ofryegrass and clover
The total dry matter production of aerial parts of both plants grown alone or in mixture
was highest in the OF Ellighausen soil compared to the production obtained in the
Changins and Cadenazzo OF soils (Table 3.3). The highest dry matter production of
aerial parts was obtained when clover was grown alone whereas it made only 7 to 28 %
of the total yield of aerial parts in the mixture. The yield of aerial parts of ryegrass
grown alone and in the mixture was similar.
Total root production was higher for clover than ryegrass in the Cadenazzo and
Changins soils (Table 3.4). The mixture produced the highest quantity of roots in
Changins and while it gave a production lower than clover and higher than ryegrass in
Cadenazzo. No difference in root production was seen for Ellighausen.
Effect ofresidualfertilizer
In Ellighausen, no differences in aerial dry matter were observed between the OF and F
treatments. In Changins, significantly higher aerial parts yields were observed for all
plants in the F treatment compared to OF. In Cadenazzo, increased yields were only
observed in the presence of residual P when clover was grown alone or when ryegrass
was grown in the mixture (Table 3.3). Residual fertilization increased root dry matter
production for both plants grown separately and in the mixture in the Changins OF soil
(Table 3.4). In the Cadenazzo soil, the residual fertilization decreased root production of
the ryegrass grown alone.
Effect offreshfertilization
Fresh DAP applied on OF soils increased the yields of aerial parts of all plants on the
Changins soil, with the exception of the clover production, which remained constant
when grown in association with ryegrass. The aerial parts yield of clover grown alone
increased in all OF soils in the presence of DAP. When grown in association with
clover, the yield of ryegrass increased when DAP was added in the treatment OF. Fresh
DAP applied on soil F, increased the aerial part production of clover in the Changins F

III.Uptakeoffreshandresidualfertilizers
inapotex
peri
ment
98
Table
3.3.
Dry
matterpr
oduc
tion
ofthe
aerialparts(e
xpre
ssed
ingDM
kg"1
soil
)ofEnglishryegrassandwhite
clovergrown
separately
orinmixture
inthree
soil
sasaffectedbyfourphosphorustreatments(OF:
noP
fertilization;
OF+DAP:
OF+
afreshadditionofDAP
atthe
rateof
15mg
Pkg
"1so
il;
F:
residualP
fert
iliz
er;F+DAP:F+afreshadditionofDAP
attherateof15mgP
kg"1
soil
).
Cadenazzo
Ellighausen
Changins
Loliumperenne
1.0F
11.7
Ab
B13.0
Aa
B10.9
Cb
A
alone
2.0F+DAP
11.7
Aa
B12.1AB
a5
12.6
Ba
B
3.F
11.1Acß
12.7
Ab
B14.4
Aa
B
4.F+DAP
10.6
Ab
B11.3
Bb
B14.4
Aa
B
Trifoliumrepens
1.0F
15.7
Ba
A16.6
Ba
A10.1
Db
AB
alone
2.0F+DAP
20.3
Aa
A20.4
Aa
A13.7
Cb
A
3.F
20.9
Aa
A17.9BA
aA
20.6
Ba
A
4.F+DAP
23.8
Aa
A19.0BA
bA
23.5
Aa
A
Loliumperenne
1.0F
10.3
Ab
B11.1
Aa
B9.9
Db
B
mixture
2.0F+DAP
9.4
BC
bC
9.5
Bb
C11.0
Ca
C
3.F
9.6
BC
cB
11.2
Ab
B13.1
Aa
B
4.F+DAP
9.0
Cb
B9.7
Bb
B12.3
Ba
C
Trifoliumrepens
1.0F
2.0
AB
bC
4.3
Aa
C0.7
Bb
C
mixture
2.OF+DAP
1.3
Bb
D4.7
Aa
D1.3
Bb
D
3.F
3.9
Aa
C2.6
Aa
C3.0
Aa
C
4.F+DAP
1.8
AB
bC
5.2
Aa
C3.2
Aab
D
Differenthigher
case
lettersforthesame
soil
indicatea
stat
isti
call
ysignificantdifferencebetweentreatment
atthe5%
prob
abil
itylevelby
the
Duncan's
test.
Different
lower
case
letterswithin
thesame
treatment
indicate
ast
atis
tica
lly
significant
differencebetween
soils
at
the5%
prob
abil
itylevelbytheDuncan's
test.Different
italic
higher
case
lett
ersforthesame
soil
andsametreatmentindicatea
statisticallysi
gnif
ican
tdifferencebetweenplants
atthe5%
prob
abil
itylevelbytheDuncan'smu
ltip
lerange
test.

III. Uptake of fresh and residual fertilizers in a pot experiment 99
soil, and the production of ryegrass grown in the mixture in the Changins and
Ellighausen soils (Table 3.3). Fresh DAP increased root dry matter production on
Changins OF for ryegrass and white clover when they were grown alone. In the
Cadenazzo OF soil the fresh DAP application increased root yield of ryegrass grown
alone and decreased the root dry matter ofthe mixture (Table 3.4).
Kinetics ofdry matterproduction
The kinetics of dry matter production of aerial parts is presented in the Figure 1 for the
Ellighausen soil for both plants grown alone or in mixture. The other soils gave similar
results. With ryegrass grown alone or in mixture the maximum production was obtained
after 29 days and it decreased afterwards.
Figure 3.1a. Kinetics of aerial parts dry matter production of English ryegrass grown
alone in the Ellighausen soil as affected by 4 P treatments (OF: no P fertilization;
OF+DAP: OF + a fresh addition of DAP at the rate of 15 mg P kg"1 soil; F: residual P
fertilizer; F+DAP: F + a fresh addition of DAP at the rate of 15 mg P kg"1 soil).
6
o<n
')
>-
5Q 2.
0 "~T 1 1 1
40 60 80 100 120
days after sowing

III.Uptakeoffreshandresidual
fertilizersin
apot
experiment100
Table
3.4.
Dry
matter
production(expressed
ingDM
kg"1soil)
of
the
rootsofEnglish
ryegrassand
white
clovergrown
separatelyorinmixture
inthree
soilsasaffectedby4phosphorustreatments(OF:
noP
fertilization;OF+DAP:OF+a
freshadditionofDAP
attherateof15mgP
kg"1soil;
F:residualP
fertilizer;F+DAP:F+afreshadditionofDAP
at
therateof15mgP
kg"1soil).
Cadenazzo
EllighausenChangins
Loliumperenne
1.OF
alone
2.0F+DAP
3.F
4.F+DAP
4.13B
bC
5.02A
aB
3.53C
bB
3.63C
cC
5.12A
aA
5.1A
aA
4.88A
aA
5.17A
aA
1.79B
cB
3.95A
bC
3.89A
bB
4.19A
bB
Trifoliumrepens
EOF
alone
2.0F+DAP
3.F
4.F+DAP
5.44B
aB
6.17B
aA
6.83BA
aA
8.14A
aA
5.02A
aA
5.41A
ab
A
5.52A
aA
4.74A
bA
3.14C
bA
4.87B
bB
6.81A
aA
7.75A
aA
Mixture
Lolium/Trifolium
1.0F
2.0F+DAP
3.F
4.F+DAP
6.98A
aA
4.96B
bB
5.89AB
bA
5.84AB
bB
5.1A
bA
4.84A
bA
5.07A
bA
4.87A
bA
3.89C
cA
6.55BC
aA
8.04BA
aA
10.87A
aA
Differenthigher
case
lettersforthesame
soilindicatea
statisticallysignificant
differencebetween
treatment
atthe5%
probabilitylevelby
theDuncan's
test.
Differentlowercase
letterswithinthesametreatmentindicatea
statisticallysignificant
differencebetween
soilsatthe5%
probabilitylevelbytheDuncan's
test.
Different
italichigher
case
lettersforthesame
soilandsametreatmentindicatea
statisticallysignificant
differencebetweenplants
atthe5%
probabilitylevelby
theDuncan'smultiple
range
test.

III. Uptake of fresh and residual fertilizers in a pot experiment 101
Clover reached a maximum production after 62 days of growth (i.e. at the 2" cut) when
grown alone. Its production was afterwards constant.
Figure 3.1.b. Kinetics of aerial parts dry matter production of white clover grown
alone in the Ellighausen soil as affected by 4 P treatments (OF: no P fertilization;
OF+DAP: 0F+ a fresh addition of DAP at the rate of 15 mg P kg"1 soil; F: residual P
fertilizer; F+DAP: F + a fresh addition of DAP at the rate of 15 mg P kg"1 soil).
8 -r
7 -
6 -
'o^ 4-
>-2 3-Q
2 -
1 -
0 -
When grown in association with ryegrass the production of clover remained low but
increased steadily during the 4 cuts of the experiment. Nevertheless at the end of the
experiment, i.e. after 92 days of growth the aerial part yield of clover grown in mixture
had reached 2.5 g DM kg"1 soil whereas it had reached 6 g DM kg"1 soil only after 62
days when grown alone.
The difference in growth rate and total yield observed between both plants when they
were grown separately might be partly related to their nitrogen nutrition. Despite regular
N fertilization, this nutrient became probably more limiting for ryegrass growth than for
-1 1 1 1
40 60 80 100 120
days after sowing

III. Uptake of fresh and residual fertilizers in a pot experiment 102
white clover, which could cover its need through the additional N2 biologically fixed
from the atmosphere. This hypothesis should be checked by additional analyses.
Figure 3.I.e. Kinetics of aerial parts dry matter production of both plants grown in
mixture in the Ellighausen soil as affected by 4 P treatments (OF: no P fertilization;
OF+DAP: OF + a fresh addition of DAP at the rate of 15 mg P kg soil"1; F: residual P
fertilizer; F+DAP: F + a fresh addition ofDAP at the rate of 15 mg P kg soil"1).
5 -r
4 -
==• 3 -
oCO
o>sc
-- 2 -
S
>
Q 1 -
0 -
-1 -•
_._ OF Lolium
—A— OF+DAP Lolium
F Lolium
—— F+DAP Lolium
—O— 0F Trifolium
—D— OF+DAP Trifolium
—A— F Trifolium
-°- F+DAP Trifolium
The increase in aerial part and root dry matter yields observed in Changins between OF
and the other treatments for all plants is due to the low P availability of the OF soil. The
absence of yield increase of ryegrass grown alone in the other soils confirms for this
40 60 80 100 120
days after sowing

III. Uptake of fresh and residual fertilizers in a pot experiment 103
plant the critical level (Eimin= 3.8 mg P kg"1 soil) given by Morel et al. (1992) for winter
wheat. The positive yield reaction of clover observed in most soils in the presence of a
residual fertilizer or in the presence of a fresh DAP application reflects the higher
requirements of this plant for P (Caradus, 1990; Dunlop and Hart, 1987; O'Hara, 2001).
This result shows that the critical limit given for winter wheat by Morel et al. (1992)
does not hold for white clover. The results obtained in the ryegrass / clover association
reflect the competitive ability of these two species for resources. A number of works
have shown that because of its slower growth rate and its higher energy requirement the
growth of clover can be strongly reduced when it is shaded by ryegrass foliage (Haynes,
1980; Harris, 1987). Furthermore because of its fine, ramified root system covered with
long root hairs ryegrass can probably take up available nutrients much more rapidly
than clover (Haynes, 1980; Harris, 1987; Evans, 1977). This competition for light and
nutrients explain the large proportion of ryegrass observed in the mixture.
P uptake in aerialparts ofryegrass and clover
Uptake ofP derivedfrom the soil (qSOit)
The amount of P taken up from the soil (qSOii) ranged between 7.8 and 20.5 mg P kg"
soil for the aerial parts of ryegrass and between 9.9 and 30.6 mg P kg"1 soil for those of
clover when plants were grown alone (Table 3.5). When grown in mixture the qSOii of
clover ranged between 0.6 and 7.3 mg P kg"1 soil while the qS01i of ryegrass ranged
between 8.1 and 16 mgP kg"1 soil. The lowest qSOii values were observed in Changins.
The fraction of plant P derived from the soil (PDFSOii%) varied between 71.7 % and 88.5
% of the plant P in the OF+DAP treatment, between 37.3 % and 77.5 % of the plant P in
the F treatment and between 32.2 % and 76.1 % of the plant P in the F+DAP treatment.
Effect ofresidualfertilizer. In Changins qso,i increased in the presence of residual P for
ryegrass grown alone or in mixture and for clover grown alone. In Ellighausen and
Cadenazzo qsoü of ryegrass significantly decreased when the F soils were fertilized with
DAP. The same trend could be observed when ryegrass was grown in the mixture in the
Ellighausen soil.

III.Uptakeoffreshandresidual
fertilizersinapotexperiment
104
Table
3.5.
TotalPuptake
(qex
pres
sedinmgP
kg"1
soil),
upta
keofPfromthe
soil
(qSO
ii),up
take
ofPfromtheresidual
fert
iliz
er(q^-)and
upta
keofP
from
the
fresh
fertilizer
(qff
),in
the
aerial
partsofEn
glis
hryegrassand
white
clovergrown
separately
or
in
mixture
inthree
soilsasaffectedby4phosphorustreatments(OF:
noP
fert
iliz
atio
n;OF+DAP:OF+
afreshadditionofDAP
at
therateof15mgP
kg"1
soil
;F:residualP
fertilizer;F+DAP:F+afreshadditionofDAP
attherateof15mgP
kg"1
soil
).
Cadenazzo
Ellighausen
Changins
qff
qrf
qsoil
qtot
qff
qrf
qsoil
qtot
qff
qrf
qsoil
qtot
Loliumperenne
l.OF
0.0
0.0
17.5B
aß
17.5B
aB
alone
2.0F+DAP
3.5A
aAB
0.0
20.5A
aß
24.1A
aß
3.F
0.0
11.9A
aB
15.8B
aB
27.7A
aß
4.F+DAP
2.2Be
ß15.4A
a^fi
11.8C
aß
29.5A
abB
0.0
0.0
17.4A
aß
17.4Baß
3.9A
aB
0.0
18.1A
bB
22.0A
bB
0.0
6.3A
bB
17.0A
aB
23.3A
bB
2.8B
bB
7.6A
bß
12.9Baß
23.4A
bß
0.0
0.0
7.8D
bB
7.8D
bB
3.8A
aB
0.0
9.9C
cB
13.7C
cB
0.0
13.5Baß
15.5A
aA
29.0Baß
4.5B
aA
17.7A
aB
11.6B
aB
33.8A
aß
Trif
oliu
mrepens
l.OF
0.0
0.0
24.6A
àA
24.6C
aA
alone
2.OF+DAP
4.6A
bA
0.0
30.3A
aA
34.9B
aA
3F
0.0
19.0A
aA
30.6A
aA
49.6A
aA
4.F+DAP
4.7A
aA
22.5A
aA
28.1A
aA
55.3A
aA
0.0
0.0
27.7B
aA
27.7C
aA
5.4A
aA
0.0
31.1A
aA
36.4B
aA
0.0
9.3B
bA
26.8B
bA
36.1B
bA
4.8B
aA
13.5A
aA
29.2BA
aA
47.5A
bA
0.0
0.0
9.9B
bA
9.9D
bA
43Bb/l
0.0
13.6A
bA
17.9C
bA
0.0
23.2A
aA
13.8A
cA
37.0B
bA
4.7A
aA
26.4A
aA
15.4A
aA
46.5A
bA
Loliumperenne
1OF
0.0
0.0
14.4AB
aB
14.4C
aB
mixture
2.0F+DAP
3.0A
bB
0.0
16.0A
aC
19.0B
aC
3.F
0.0
11.9A
aB
13.1AB
bC
25.0A
aB
4.F+DAP
2.5A
cB
11.5A
bAB
12.2B
aß
26.2A
bB
0.0
0.0
14.7A
aC
14.7C
aC
3.5A
aC
0.0
15.0A
bC
18.4B
bC
0.0
5.3A
bß
15.7A
aß
21.0A
bB
3.1B
bB
5.1A
cB
13.2Baß
21.4A
cB
0.0
0.0
8.1C
bB
8.1D
bB
3.4Ba
B0.0
8.7C
cB
12.1C
cC
0.0
14.6A
aB
13.3A
bA
27.9Baß
4.1A
aB
17.2A
aB
10.1Baß
31.5A
aB
Trif
oliu
mrepens
l.OF
0.0
0.0
2.0B
bf
2.0B
bC
mixture
2.0F+DAP
0.2A
bC
0.0
1.4B
bD
1.6B
bD
3.F
0.0
2.4A
aC
3.8A
aD
6.2A
aC
4.F+DAP
0.2B
bC
1.5A
aß
1.5B
bB
3.3B
bC
0.0
0.0
6.6A
aD
6.6A
aD
0.9A
aD
0.0
7.3A
aD
8.2A
aD
0.0
1.1A
aC
3.9A
aT
5.1A
aC
1.0A
aC
1.3A
aC
7.6A
aC
9.8A
aC
0.0
0.0
0.6B
bC
0.6B
bC
0.2A
bC
0.0
1.0AB
bC
1.2B
bD
0.0
2.2A
aC
1.7A
aß
3.9A
aC
0.3A
bC
1.8A
aC
1.7A
bC
3.9A
bC
Differenthi
gher
case
lettersforthesame
soil
indicatea
stat
isti
call
ysignificant
differencebetween
treatment
atthe5%
prob
abil
ity
levelby
theDuncan's
test.
Differentlower
case
letterswithin
thesame
treatment
indicate
ast
atis
tica
llysignificantdifferencebetween
soils
atthe5%
prob
abil
ity
levelby
theDuncan's
test.
Different
ital
ichi
gher
case
lettersforthesame
soil
andsametreatmentindicatea
stat
isti
call
ysi
gnif
ican
tdifferencebetween
plan
tsatthe5%
prob
abil
itylevelbythe
Duncan'smultiple
range
test.

III. Uptake of fresh and residual fertilizers in a pot experiment 105
Effect offresh fertilizer. In Changins and Cadenazzo OF treatment qsoü increased in the
presence of DAP for ryegrass grown alone. Similarly qs0,i of clover increased in
Changins and Ellighausen OF upon DAP application. The application of DAP decreased
qSOii for ryegrass grown alone in all F+DAP soils compared to the F soils. The same
results were observed when ryegrass was grown in the mixture in the Ellighausen and
Changins F and F+DAP soils.
Kinetics of qso,i uptake. The kinetics of qSOü uptake present the same trends as the
kinetics of dry matter yield production (Figure 3.1 a, b, c). With ryegrass grown alone
or in mixture the maximum qS0ll uptake was obtained after 29 days and it decreased
afterwards. Clover reached a maximum after 85 days when grown alone. When grown
in association with ryegrass the soil P uptake of clover remained low but increased
steadily.
The increase in qso,i for ryegrass after a fresh P fertilization on a low P soil has been
observed by Morel and Fardeau (1989 a) and was explained by a greater soil exploration
or a greater root activity. This hypothesis is in our case confirmed since the root
production of ryegrass and clover grown alone or in the mixture was lower in the
Changins OF soil than in the Changins soils which had received either a fresh or a
residual fertilization (Table 3.4). The decrease in qso,i for ryegrass after a fresh P
fertilization on a soil containing important amounts of available P has been observed by
Morel and Fardeau (1990). They explained this either by a decrease in the geographical
extension of the root system or by a modification of P uptake by root resulting in a
preferential uptake of P where its concentration was highest. The data obtained for
ryegrass in the Cadenazzo soils from which the root separation was the easiest, support
these hypotheses, as the root production was lower and the root P content higher in the
F and F+DAP soils than the root production and the root P content observed in the OF
and OF+DAP soils.
In Cadenazzo and Ellighausen soils where P was not strongly limiting clover growth,
qSOii was higher in clover tops than in ryegrass tops. The higher uptake of P by clover
can be explained by the higher requirements of this plant for P related in the case of our

III. Uptake of fresh and residual fertilizers in a pot experiment 106
study to the higher dry matter production and the biological N2 fixation (Mengel, 1994)
and to the high cation exchange capacity of its roots (Caradus, 1990). This high cationic
capacity might allow clover to release P from Ca-P complexes from soil particles by
absorbing the Ca and taking up the released P. Our results do not allow to check this
hypothesis. The results obtained in the mixture reflect the competitiveness of both
species in our experimental set up. In addition to a smaller plant density in the mixture,
the slowest and limited growth of white clover (Figure 3.1 c) resulted in a strong
decrease in qS01i as compared to the results obtained when clover was planted alone. The
decreased dry matter production of clover tops in the mixture resulted probably in a
decreased root production which itself resulted in a low P uptake and finally to a low
qSoii- In contrast, ryegrass suffered little from competition in the mixture and yielded qSOii
similar to those obtained when it was planted alone. Altogether, the results obtained
with both plants grown alone or in mixture suggest that total P uptake is not only a
function of soil P availability but also of plant demand. Mollier and Pellerin (1999) and
Pellerin et al. (2000) have shown that the plant P requirement itself was driven by the
total dry matter production i.e. by the accumulation of assimilates derived from the
photosynthesis.
Uptake ofP derivedfrom the residualfertilizer (qrß
The amount of P taken up from the residual fertilizer (qrf) ranged between 6.3 and 17.7
mg P kg"1 soil for ryegrass and between 9.3 and 26.4 mg P kg"1 soil for clover when
plants were grown alone (Table 3.5). When grown in mixture the qrf of clover ranged
between 1.1 and 2.4 mg P kg"1 soil while the qrf of ryegrass ranged between 5.1 and 17.2
mg P kg"1 soil. The fraction of plant P derived from the residual fertilizer (PDFrf%)
varied between 22.5 % and 62.7 % of the plant P in the F treatment and between 14.3 %
and 56.8 % of the plant P in the F+DAP treatment. The kinetics of qrf uptake are the
same as those of dry matter production (Figure 3.1).
The highest qrf and PDFrf% were observed in the Changins soils and the lowest in the
Ellighausen soils. Furthermore, although the increases were not statistically significant,
qrf and PDFrf% increased in most of the cases upon DAP fertilization. The Figure 3.2

III. Uptake of fresh and residual fertilizers in a pot experiment 107
shows that qrf obtained for each plant grown alone or in association, with the exception
of the clover grown in the mixture, was positively related to total amount of fertilizer
(residual + fresh) added to the three soils calculated as the difference between the total P
ofthe F treatment in the presence or not ofDAP and the total P of OF for each soil.
Figure 3.2. Relation between the quantity of P taken up by the plant and derived from
the residual fertilizer (qrf) and the total amount of fertilizer (residual and fresh) added to
the 3 studied soils for English ryegrass and white clover grown separately or in a
mixture.
30
25
20
Oto
a.
tcr
15
10
' white clover alone"
r2 = 0 95
p<001
0 11 x + 2 37
J ryegrass alone
r2 = 0 87
p<001
:0 075x + 1 14
/ ryegrass in the mixture
^ = 097
p < 0 001
= 0 087 x -1 76
60 80 100 120 140 160 180 200
residual + fresh fertiliser (mg P kg1 soil)
220
ryegrass alone
t white clover alone
n ryegrass in mixture
v white clover in mixture
Whereas different linear relations were obtained for each plant between qrf and the total
amount of P fertilizers added to the soils, almost similar relations were obtained for
ryegrass, and clover grown alone or in association when PDFrf% was considered instead
of qrf (Figure 3.3).

III. Uptake of fresh and residual fertilizers in a pot experiment 108
Figure 3.3. Relation between the proportion of P taken up by the plant and derived from
the residual fertilizer (PDFrf%) and the total amount of fertilizer (residual and fresh)
added to the 3 studied soils for English ryegrass and white clover grown separately or in
a mixture.
aa.
70
60
50
40
30
20
10
y ryegrass alone
r2=0 84
_ p < 0 05
= 0.17x + 16.96
T
y white clover alone— u ^^
r2 = 0 92
p<001
X +4.51
a
^^ yryegrass in the mixture
~ O.^O X I.Zl
r2 = 0 92
p < 0.01
A
- I
Y white clover in the mixture~ 0.27 X-1 OD
r2=0 84
p < 0.05
i i i
60 80 100 120 140 160 180
residual + fresh fertiliser (mg P/ kg soil)
200 220
ryegrass alone
T white clover alone
ryegrass in mixture
V white clover in mixture
These results suggest that in these soils the total amount of fertilizer P, added in the past
or recently, controls the qrf and that the soil physico-chemical properties do not exert a
major influence in the utilisation of residual P by the plant. These results also suggest
that the uptake of residual P is also driven by the plant requirement for P and therefore
by the accumulation of assimilates in the plant. Our results complement those obtained
by Barrow and Campbell (1972) who reported no differences in the use of residual P by
Lolium rigidum and Trifolium subterraneum, eventhough, the soils they studied and
their experimental approach were very different from those used in our work.

III. Uptake of fresh and residual fertilizers in a pot experiment 109
Uptake ofP derivedfrom thefreshfertilizer (qjß
The amount of P taken up from the fresh fertilizer (qff) ranged between 2.2 and 4.5 mg P
kg"1 soil for ryegrass and between 4.3 and 5.4 mg P kg"1 soil for clover when plants
were grown alone (Table 3.5). When grown in mixture the qff of clover ranged between
0.2 and 1.0 mg P kg"1 soil while the qff of ryegrass ranged between 2.5 and 4.1 mg P kg"
soil. The fraction of plant P derived from the fresh fertilizer (PDFff%) varied between
11.0 % and 28.3 % of the plant P in the OF+DAP treatment and between 7.0 % and 14.4
% of the plant P in the F+DAP treatment. The kinetics of qff uptake were the same as
those of dry matter production (Figure 3.1). The PDFff% values obtained for ryegrass
are in the range of values published for soils where P availability does not limit plant
yield (Morel and Fardeau, 1989 a and 1989 b).
Figure 3.4. Relation between the quantity of P taken up by the plant and derived from
the fresh fertilizer and the concentration of P in the soil solution of the 3 studied soils
for English ryegrass and white clover grown separately or in the mixture.
4 -
Q.
U>
E
*=
D
y ryegrass mixture:
r 2=0 76
p < 0.05
-3 7 x +4 4
y ryegrass alone:
r2=0.87
p< 0.05
.1x+5.2
00 01 02 03 04
Cp of OF and F soils (mg P L"1)
0 5 06
ryegrass alone
t white clover alone
a ryegrass in mixture
v white clover in mixture

III. Uptake of fresh and residual fertilizers in a pot experiment 110
For ryegrass grown either alone or in mixture qff were maximum when the
concentration of P in the soil solution (Cp) of the soils non-amended with DAP were
lower than 0.2 mg P L"1. Above this value qff decreased steadily as the Cp of soils non-
amended with DAP increased (Figure 3.4). The qff of clover grown alone or in mixture
did not show any dependence on the Cp of soils non-amended with DAP. However
similar negative linear relations were observed between the PDFff% of both plants
grown alone or in the mixture and the Cp of soils non-amended with DAP (Figure 3.5).
Figure 3.5. Relation between the proportion of P taken up by the plant and derived from
the fresh fertilizer (PDFff%) and the concentration of P in the soil solution of the 3
studied soils for English ryegrass and white clover grown separately.
Qa.
30
25
20
15
10-
y ryegrass alone
r2 = 0 84
p<001
= -36 84 x +25 11 y white clover alone
r2=0 68
p<0 05
= -28 x + 20 92
y ryegrass in the mixture
r 2=0 76
p<005
-33 6 x + 25 39y white clover in the mixture
"
r2 = 069
p<005
-17 03 x +15 29
00 01 02 03 04 05
Cp of OF and F soils (mg P L"1)
06
rye grass alone
white clover alone
Q ryegrass in mixture
V white clover in mixture

III. Uptake of fresh and residual fertilizers in a pot experiment 111
These results suggest that in our experiment the uptake of P derived from a fresh
fertilizer was controlled on the one side by the concentration of P in the soil solution,
and on the other side as shown for q,f and qS01i by the plant demand in P.
P concentration in the aerialparts and roots ofryegrass and clover
The P concentrations varied little during the course of the pot experiment (data not
shown), therefore only mean P contents of ryegrass and clover tops grown alone or in
association are presented (Table 3.6). The concentration of P in aerial parts and roots of
both plants grown alone or in mixture was lower in the Changins OF compared to the
Cadenazzo and Ellighausen OF soils (Tables 3.6 and 3.7). The P concentrations of
aerial parts of ryegrass alone were lower than those of clover alone on the OF Changins
and OF Ellighausen soils. Phosphorus concentrations of ryegrass grown alone and in the
mixture were the same, whereas concentration of clover grown in the mixture were
lower than clover grown alone. Root concentrations of the mixture were lower than root
concentration of clover and ryegrass on all OF soils.
Effect ofresidualfertilization
Residual fertilization increased significantly the P concentration of aerial parts of both
plants grown alone or in mixture in all soils, except when clover was grown in the
mixture in the Ellighausen soil (Table 3.6). Similarly, the presence of residual P
increased the P content of roots in all cases excepted for the clover grown alone on the
Cadenazzo soil and for the mixture grown on the Ellighausen soil (Table 3.7).
Effect offreshfertilization
The P concentration of aerial parts of ryegrass grown alone or in the mixture increased
upon DAP application in all soils independently of the presence of residual P. The fresh
application of DAP resulted in an increased concentration of P in the aerial parts of
clover when grown alone only in Changins, in the absence of residual P, and in
Ellighausen in the presence of residual P. When grown in mixture, the addition of DAP
had no influence on the P content of the aerial parts of clover. Fresh fertilisation with

III.Uptakeoffreshandresidual
fertilizersin
apotex
peri
ment
112
Table
3.6.
-i
Pconcentration(express
edinmgP
g"1DM)
ofthe
aeri
alpartsofEn
glis
hryegrassandwhite
clovergrown
separately
orinmixture
inthree
soilsasaffectedby4phosphorustreatments
(OF:
noP
fert
iliz
atio
n;OF+DAP:
OF+
afreshadditionofDAP
atthe
rateof
15mgP
kg"1
soil;
F:
residualP
fert
iliz
er;F+DAP:
F+
afresh
additionofDAP
attherateof15mgP
kg"1
soil).
Cadenazzo
Ellighausen
Changins
Loliumperenne
1.OF
alone
2.OF+DAP
3.F
4.F+DAP
1.5D
aA
2.1C
aAB
2.5B
aA
2.8A
aA
1.4C
bC
1.8B
bA
1.8B
cAB
2.1A
cAB
0.7D
cC
1.1C
cA
2.0B
bA
2.4A
bAB
Trif
oliu
mrepens
1.OF
alone
2.OF+DAP
3.F
4.F+DAP
1.6B
aA
1.7B
aA
2.3A
aB
2.4A
aB
1.7C
aA
1.8C
aB
2.0B
bAB
2.5A
aAB
1.0C
bA
1.3B
bA
1.8A
bA
2.0A
bB
Loliumperenne
1.OF
mixture
2.0F+DAP
3.F
4.F+DAP
1.4D
aA
2.0C
aB
2.6B
aA
2.9A
aA
1.3C
aC
1.9B
a^
1.9B
cA
2.2A
cv45
0.8D
bC
1.1C
bA
2.2B
bA
2.6A
bA
Trif
oliu
mrepens
1.OF
mixture
2.0F+DAP
3.F
4.F+DAP
1.1B
bB
1.3B
bB
1.7A
ab
C
1.8A
aß
1.6A
a5
1.7A
aC
2.0A
a5
2.0A
aB
0.9B
b5
0.9B
cB
1.2A
b5
1.2A
bB
Different
higher
case
lett
ers
for
thesame
soil
indicate
ast
atis
tica
lly
sign
ific
ant
differencebetween
treatment
at
the5%
prob
abil
ity
levelby
the
Duncan's
test.Differentlowercase
letterswithinthesame
treatment
indicatea
stat
isti
call
ysignificantdifferencebetween
soils
atthe5%
prob
abil
ity
levelbytheDuncan's
test.Different
italic
higher
case
lettersforthesame
soil
andsametreatmentindicatea
statisticallysi
gnif
ican
tdifferencebetween
plan
tsatthe5%
prob
abil
itylevelbytheDuncan'smultiple
range
test.

III. Uptake of fresh and residual fertilizers in a pot experiment 113
DAP increased the root P content of ryegrass when it was grown alone excepted in the
OF and OF+DAP Changins soils where root P content remained constant. The effect of
DAP application on the P content of roots in the mixture was significant on the OF
Changins soil. Finally, DAP application increased the root P content of clover on the
Ellighausen F soil. The P content of ryegrass aerial parts grown either alone or in
association is in the OF soils systematically below the range of 1.5 to 2.5 mg P g"1 DM
given by Bailey (1991) under which a P deficiency would limit the yield. The absence
of a clear yield increase following P fertilization in Ellighausen and Cadenazzo suggests
that under our experimental set up the critical P of English ryegrass content was lower
than 1.5 mg P g"1 DM. The concentration of 0.7 mg P g"1 DM observed in Changins OF
however clearly limited plant growth. The P content observed in the aerial parts of
clover in the OF treatments were probably close to the critical limit since DAP
application significantly increased the yield. In their review, Dunlop and Hart (1987)
stated that the critical concentration for white clover grown alone is between 1 and 2.5
mg P g"1 DM. This range is consistent with the results of our study. Altogether these
results confirm the high P requirements of white clover related e.g. to its needs for the
N2 biological fixation (Haynes, 1980, Mengel, 1994; O'Hara, 2001). The P content of
ryegrass roots increased much more in the presence of residual P and in the presence of
a fresh DAP application than the P content of clover. This is consistent with the results
of Evans (1977) who showed that the roots of ryegrass are finer, more ramified, covered
with longer root hairs than the roots of clover since these attributes would make the root
system of ryegrass more efficient in nutrient uptake (Caradus, 1980, Whitehead, 2000).
Whereas the P content of aerial parts of ryegrass was similar when grown alone or in
mixture, the P content of clover tops were lower in Changins and in Cadenazzo when
grown in mixture. In their review, Dunlop and Hart (1987) stated that when grown in
association with ryegrass the critical P content of aerial part of white clover is in the
range of 3 to 4 mg P g"1 DM. The much lower values observed in our study showed that
white clover suffered from a P deficiency when grown in the presence of ryegrass.

III.Uptakeoffreshandresidual
fertilizersinapotex
peri
ment
114
Table
3.7.
Pconcentration
(expre
ssed
inmg
Pg"
DM)
of
the
roots
of
Engl
ish
ryegrass
and
white
clovergrown
separately
orinmixture
inthree
soil
sasaffectedby4phosphorustreatments(OF:
noP
fert
iliz
atio
n;OF+DAP:
OF+
afreshadditionofDAP
atthe
rateof15mgP
kg'1
soil;
F:
residualP
fert
iliz
er;F+DAP:
F+
afresh
additionofDAP
attherateof15mgP
kg"1
soil).
Cadenazzo
Elli
ghau
sen
Changins
Loliumperenne
alone
l.OF
2.0F+DAP
3.F
4.F+DAP
1.6D
aA
2.2C
aA
2.5B
aA
2.8A
aA
1.1C
1.6B
1.7B
2.0A
b b b c
AB
A A A
1.0C
b
1.0C
c
1.9B
b
2.5A
b
A A A A
Trif
oliu
mrepens
alone
l.OF
2.0F+DAP
3.F
4.F+DAP
1.6AB
aA
1.5AB
aB
1.7A
aB
1.3B
bB
1.1C
bA
1.2C
bB
1.4B
bB
1.7A
aB
0.8B
cB
0.8B
cB
1.0A
bB
1.1A
bB
Mixture
Loli
um/T
rifo
lium
l.OF
2.0F+DAP
3.F
4.F+DAP
1.0B
aB
1.0B
aC
1.4A
aC
1.4A
aB
0.9B
aB
1.0AB
aC
1.0AB
bC
1.2A
abC
0.5C
bC
0.7B
bB
0.9A
bB
0.9A
bB
Differenthigher
case
letters
for
thesame
soil
indicate
ast
atis
tica
lly
significantdifferencebetween
treatment
atthe5%
prob
abil
ity
levelby
the
Duncan's
test.Differentlowercase
letterswithinthesametreatmentindicatea
stat
isti
call
ysi
gnif
ican
tdifferencebetween
soils
atthe5%
prob
abil
ity
levelby
theDuncan's
test.
Different
italic
high
ercase
letters
forthesame
soil
andsame
treatment
indicatea
statistically
sign
ific
ant
difference
between
plants
atthe5%
prob
abil
itylevelbytheDuncan'smultiple
range
test.

III. Uptake of fresh and residual fertilizers in a pot experiment 115
Conclusions
The results of this research showed the following:
In a pot experiment, between 14 and 62 % of the P taken up by the aerial parts of white
clover or English ryegrass grown separately or in association in three soils in a pot
experiment, were derived from residual P fertilizers whereas only between 7 and 28 %
of it derived from a fresh addition of DAP. The quantity of P derived from the residual
fertilizers taken up by the plants depended on the total amount of residual and fresh
fertilizer added to the soils and by the amount of P exported by the plant. The
proportion of P derived from residual P however was mainly controlled by the total
amount of fertilizers P (fresh and residual) added to the soils and was independent from
their physico-chemical properties.
The quantity of P derived from the fresh fertilizer taken up by the plants was explained
by the concentration of P in the soil solution of the soils non-amended with DAP and by
the amount of P exported by the plant. The proportion of P derived from the fresh P
fertilizer was mainly controlled by the concentration of P in the soil solution.
Comparison of the results obtained with English ryegrass and white clover grown
separately or in association strongly suggest that in addition to soil P availability the
uptake of P derived from residual or fresh fertilizers by the plants is driven by the plant
demand for P which itself is controlled by the accumulation of assimilates derived from
the photosynthesis.
Consequently, additional fresh fertilizations could be restricted or even stopped for a
few years on these soils with a high available P level, as it has already been shown in
the first chapter of this thesis.

Seite Leer /
Blank leaf

General conclusions

General conclusions 118
General Conclusions
Limitation of agricultural P losses to the environment has become an important aim in
most industrialized countries (Sibbesen and Sharpley, 1997). This could be achieved by
the implementation of new fertilization practices which would avoid excessive
accumulation of phosphorus in soils, by using the soil P reserves already present in soils
and resulting of past fertilizations. However, if fertilization practices could change, crop
productivity should remain the same. Scientific basis are therefore needed before any
change of fertilization recommendations. This is why the general objective of this work
was to evaluate the long-term effect of previous water soluble fertilizations on soil P
availability and crop production in Switzerland. This has been done by measuring with
different methods the change in P availability in relation to crop production in seven
middle- or long-term field experiments, and by quantifying the contribution of each P
fertilizer source (soil, residual, fresh) to plant nutrition in a pot experiment under
controlled conditions.
Effect offertilization regimes on soilP and crop production
Three fertilization regimes were tested on seven field experiments: OP: no P applied, P:
P applied to cover crop exportations; P>exp: P applications were higher than crop
exportations. Six trials had various field crops rotations (Rümlang, FAL, Ellighausen,
Oensingen, Cadenazzo, Changins), the last one was a permanent grassland (Vaz). P
availability was determined with isotopic exchange kinetics method (Fardeau, 1996) or
four extractions methods: with deionized water, C02-saturated water (Dirks-Scheffer,
1930), sodium bicarbonate (Olsen et al., 1954), ammonium acetate EDTA (Cottenie et
al., 1982) (see Chapter 1 and 2).
Pfertilization omitted during at least nine years
Yield decreases were observed in only one of the seven field experiments studied. The
first decrease was observed on potato on the Rümlang site and corresponded to values
of 0.1 mg P L"1 for Cp and 5 mg P kg"1 soil for Eimin. The corresponding values obtained
with extractions methods were 0.5, 1.0, 34.5 and 37.3 mg P kg"1 soil for P-CO2, P-H2O,
P-AAEDTA and P-Olsen. For the grassland, P uptake and P concentration decreased

General conclusions 119
when resp. Cp and Eimin were resp. lower than 1.2 mg P L"1 and 18 mg P kg"1 soil. The
corresponding values obtained with extractions methods were 5.0, 11.7, 37.3 and 23.2
mg P kg"1 soil for P-C02, P-H20, P-AAEDTA and P-Olsen.
As shown by the negative P balances, P was mobilized from the non fertilized plots.
Total P and inorganic P decreased in the 0-20 cm horizon, and organic P decreased in
two sites. P availability estimated by all methods decreased for all sites. Decreases in
total, mineral and available P measured in the 30-50 cm soil layer in certain sites
showed that subsurface horizon contributed to crops nutrition.
Fertilized treatments P and P>exp
Adding P fertilizers in excess to P off-takes had no effect on crop yield, uptake and
concentration in all field experiments. P balances were positive for the two treatments
showing that even on the P treatment, P applied was higher than the crops exportations.
It was difficult to find a relation between the variations of total P and mineral P and the
P balances, probably due to the high spatial variability of the studied soils and the low
sensitivity of the method used to assess total P, or to the possibility of transfers in the
lower horizons. However, no accumulation of total, inorganic organic or available P
was observed in the 30-50 cm horizon, and in particular for the P>exp treatment. P
availability in the 0-20 cm horizon determined by the isotopic exchange kinetics method
(Fardeau, 1996) decreased for these two fertilized treatments in 5 of the field crops
rotations. Chemical extraction methods gave similar trends. However, this P-availability
decrease had no effect on crop yield and uptake. On these soils, P applications higher
than crop exportations were not sufficient to maintain availability at his initial level.
This availability decrease could be due to slow reactions between soluble P and the
solide phase of the soil (Barrow, 1983), whose importance would increase on soils with
a high available P level (Fardeau, 1991; Oberson, 1993; Mc Collum, 1991).
Contribution ofresidualfertilization to plant nutrition under controlled conditions
Past fertilizations surely contributed to plant nutrition since crops could be cropped
during at least 9 years without fertilization without any yield decrease in almost all field
trials. But there were neither yield nor uptake differences measurable between

General conclusions 120
treatments. It was therefore not possible to estimate the residual effect as differences in
crop yields between fertilized and non-fertilized plots. Consequently, the only way to
measure residual effect of past fertilization on soils with such a non-limiting high P
level is the use of isotopic techniques (Morel, 1988). In the chapter 3, a pot experiment
has been described, where different sources (soil, residual or fresh fertilizers) of
available P where labelled for three of the seven field experiments soils described
above: Cadenazzo, Ellighausen, Changins. Two plants, Lolium perenne and Trifolium
repens were grown either alone or in association on these soils. The measurements of
specific activities (ratio 33P / 31P) of the plants grown on the different treatments allowed
to determine the contribution of the residual fertilizers to plant nutrition. For the three
Swiss agricultural soils studied here, between 14 and 62% of the P taken up by the
plants were derived from residual P fertilizers whereas only between 7 and 28% of it
derived from a fresh addition of DAP. The kinetics of P uptake derived from soil,
residual and fresh fertilizers were the same as the kinetics of dry matter yield production
for all plants, suggesting that the P uptake from different sources was driven by the
accumulation of assimilates from the photosynthesis. Moreover, the proportion of P
derived from residual P was mainly controlled by the total amount of P fertilizers (fresh
and residual) added to the soils, independently of the physico-chemical properties of the
soils, whereas the proportion of P derived from fresh fertilizer was controlled by the
concentration of P in the soil solution. Proportions of P in plants coming from different
P sources are high due to the total exploration of the soils by the roots under these
controlled conditions. Lower values could be expected under natural conditions (Morel,
1988).
Critical levels and specific plant requirements
Critical soil P value corresponds to the soil available P level above which the yields of
different crops grown under different environmental conditions does not increase after
an additional P fertilization and below which P fertilization systematically increases
yield. For instance, Morel et al. (1992) found a Eimin critical level of 3.8 mg P kg"1 soil
corresponding to 95% of winter wheat optimal yield. In our study concerning field
experiments (Chapter 1 and 2), it was not possible to determine a critical P level under

General conclusions 121
which P fertilization would systematically increase yield because response to
fertilization was observed in the only site of Rümlang. However, results obtained on this
site indicated that, for field crops rotations under Swiss conditions, when crops with
high requirements such as potato are grown, values of resp. Eimin, P-CO2, P-H2O, P-
AAEDTA, P-Olsen should remain above resp. 5.0, 0.5, 1.0, 34.5, 37.3 mg P kg"1 soil to
avoid P limitation. Values below which fertilization had an effect on crop uptake and
concentration of grassland were much higher (for example Eimm of 18 mg P kg" soil).
This could be due to the soil type of this specific grassland or to the P requirements of
pasture crops, which are probably very different for pasture plant than for crops. These
different requirements were confirmed under controlled conditions (Chapter 3): the
yield of ryegrass only decreased for the Changins OF soil where Eimm value was below
the critical Eimin value of 3.8 mg P kg"1 soil cited above, showing that the critical level
for ryegrass could be near to that of wheat. Positive yield reactions were observed for
clover in most soils in the presence of residual and fresh fertilizations at soil P levels
higher than the critical Eimin value of 3.8 mg P kg soil"1 showing the higher
requirements of this plant for P, probably due to higher needs related to symbiotic N2
fixation (Mengel, 1994).
Fertilization recommendations
P availability assessed by extraction methods
In Switzerland, results obtained with the P-CO2 and P-AAEDTA methods provide the
basis for making fertilization recommendations (Walter et al. 2001). In the chapter 2, we
have tested these two methods and the water and Olsen extractions for their capability to
assess soil available P in the field experiments described above, using Eimm determined
by the isotopic exchange kinetics method (Fardeau, 1996) as a reference for the
estimation of P totally and immediately available to plants. In the 0-20 cm horizon the
amounts extracted by all methods were significantly correlated to Eimin. The Olsen
method was the best correlated to the cumulated P balances observed in the different
trials, showing that this method could be the more suitable to assess P availability for
these studied systems. However, decisive remains the interpretation of the extraction
methods' results.

General conclusions 122
Interpretation scales ofthe Swiss extraction methods
We have seen in the chapter 2 that the Swiss interpretation scales of the AAEDTA and
C02-saturated water extractions underestimated soil P status. Most of the times, the soil
P level at the beginning of the studied field experiments was estimated by both methods
as medium. P applications recommended for such P levels (0.9-1.0 crop exportations)
were however not necessary, since no yield decreases were observed during 9 years on
the OP treatment. However, an appropriate partition of soil P into different classes of
availability can only be made if crop responses systematically occur. This shows again
the importance of long-term field experiments for the determination of soil available P
critical values relating soil P status to crop yields, and therefore for making appropriate
fertilization recommendations.
Prediction ofchanges in availabilityparameters
Some results obtained in the chapter 1 could be useful in order to make fertilizer
recommendations. Values of CP, Eimjn, n, RAj measured in 1998 were correlated to the
initial values and to the P balance.The decrease in soil P measured by all extraction
methods was highly correlated to the initial amount of P extracted by whatever method
and to selected soil characteristics such as the free iron oxides or the clay contents
(Chapter 2). The decrease in availability can therefore be modeled with time in the
studied systems. Knowing principally the initial soil P status, it is therefore possible to
predict by whatever method when the available soil P level could reach a possible
limiting level for crop production such as Eimi„ = 5 mg P kg"1 soil, if recommendations
consists in omitting P fertilization in similar agro-climatic conditions as those studied
here.
Outlook
Long-term research
The results of this study outlined again the need for long-term agricultural research. In
most long-term field experiments studied in the temperate zone, the long-term changes
in availability parameters measured by different methods were correlated with the P
balances (Morel et al., 2000; Boniface and Trocmé; 1988). However, for 5 of the 6 field

General conclusions 123
crops rotations studied in this thesis, P availability decreased with time whereas P
balances increased. This could be related to the high initial available status of these soils
(Mc Collum, 1991; Oberson, 1996) or to the age of these trials since different
observations have been made on the Changins field experiment started in 1971. This
outlines the need of further long-term research to better understand the mecanisms
causing these availability variations in the evolution of the soil P status under different
fertilization regimes. Then, we have seen that in all trials except one, no yield decreases
were observed when fertilization was omitted. Thus, there is a need to prolongate these
experimentations until yield differences systematically occur, so that critical soil P
levels could be determined for these crops rotations under these agro-climatic
conditions. Finally, monitoring soil P availability in relation to crop yields over a long-
term period is the only way to adequately calibrate soil tests such as extraction methods,
and especially the C02-saturated water and AAEDTA extractions methods used in
Switzerland. The existing calibration has to be refined with additional observations in
long-term field experiments.
Extraction methods
In our study, we have seen that the P-CO2 and P-H2O methods extracted less P than the
P-AAEDTA and P-Olsen, which probably extracted important quantities of unavailable
forms. It was concluded that these last two methods reflected probably more the
quantity factor while P-H2O and P-CO2 reflected more the intensity factor defined by
Beckett and White (1964). But this has to be verified. The ability of chemical
extractions to extract soil P actually available could be tested by using isotopic
techniques as described by Fardeau et al. (1988) and Kato et al. (1995).
Grassland studies
Among the seven long-term field experiments studied here, one was a permanent
grassland. It was shown than the results obtained for this trial could not fit in trends
observed for the other field crops rotations trials started at the same time. Levels where
differences in P uptake occurred were much higher than for field crops rotations. The
different behavior of this grassland trial could be related to its particular soil type, or to

General conclusions 124
the specific grassland ecosystem. Further research is therefore needed on this particular
grassland, and also comparable long-term studies on other grassland trials are necessary
to understand the P dynamics in grassland and the P nutrition of grassland plants.
Integrated research
The major objective of this thesis was to contribute to the limitation of agricultural P
losses to the environment in European over-fertilized soils by the determination of
fertilization practices which would avoid excessive P accumulation in soils, or even
decrease the soil P status, while maintaining an optimum crop production. Limiting
agricultural P losses to environment is however a general objective which nécessites
further integrated research concerning (i) the transport of P by erosion, runoff and
leaching (Sharpley et al, 1994, Leinweber et al. 1999), (ii) the biotic and abiotic
processes involved in the Pi liberation into the soil solution, (iii) the identification of
crop species with high P efficiency, (iv) the development of models of soil P cycling
including the biotic / abiotic processes and soil spatial variability and characteristics
(review of Frossard et al., 2000).

Literature cited

Literature cited 126
Littérature cited
Bailey, J. S., 1991. A re-examination of phosphorus-lime interactions in perennial
ryegrass. Plant and Soil. 135, 185-196.
Barber, S. A., 1995. Soil nutrient bioavailability - A mechanistic approach-2n edition:
New York, John Wiley and Sons, 414 p.
Barberis, E., F. Ajmone Marsan, R. Scalenghe, A. Lammers, U. Schwertmann, A. C.
Edwards, R. Maguire, M.J. Wilson, A. Delgado, and J. Torrent, 1996. European soils
overfertilized with phosphorus: Part 1. basic properties. Fert. Res. 45, 99-207.
Barrow, N. J., 1980. Evaluation and utilization of residual phosphorus in soils, in F. E.
Khasawneh, E. C. Sample, and E. J. Kamprath (eds.), The role of phosphorus in
agriculture, Madison, American Society of Agronomy, Crop Science Society of
America, Soil Science Society of America, 333-359.
Barrow N. J., 1983. Understanding phosphate reaction with soil. Third International
Congress on Phosphorus Compounds, Casablanca, Marocco, 37-51.
Beckett, P. H. T. and R. E. White, 1964. Studies on the phosphate potentials of soils.
Part III: The pool of labile inorganic phosphate. Plant and Soil. XXI (3), 253-282.
Bolland, M. D. A., K. H. M. Siddique, S. P. Loss, and M. J. Baker, 1999. Comparing
responses of grain legumes, wheat and canola to applications of superphosphate. Nutr.
Cycl. Agroecosyst. 53, 157-175.
Boniface, R., J. C. Fardeau, G. Guiraud, and S. Trocmé, 1979. Utilisation du phosphore
et de l'azote appliqués sur blé. Etude à l'aide d'éléments marqués. Agrochimica, 23,165-
178.

Literature cited 127
Boniface, R., and S. Trocmé, 1988. Enseignements fournis par divers essais de longue
durée sur la fumure phosphatée et potassique. 2. Essais sur la fumure phosphatée. In L.
Gachon, (ed.), Phosphore et potassium dans les relations sol-plante: conséquences sur la
fertilisation, Paris, INRA, 279-402.
Caradus, J. R., 1980. Distinguishing between grass and legume species for efficiency of
phosphorus use. N.Z. J. Agric. Res. 23, 75-81.
Caradus, J. R., 1990. The structure and function of white clover root systems. Adv.
Agron. 43, 1-46.
Castillon, P. 1991. Les essais de longue durée sur la fertilisation phosphatée des cultures
annuelles et des prairies, rapport ITCF, 68 p.
Cottenie, A., M. Verlod, L. Kiekens, and R. Camerlynck, 1982. Chemical analysis of
plant and soils, Laboratory of Analytical and Agrochemistry State University Ghent,
Belgium, 63 p.
Dahnke, W.C., and R.A. Olson, 1990. Soil test correlation, calibration and
recommendation. In R.L. Westerman (ed.). Soil testing and plant analysis. 3rd ed. SSSA
Book Ser. 3. SSSA, Madison, WI, 45-71.
Dirks-Scheffer, 1930. Der Kohlensaüre-Bikarbonatauszug und der Wasserauszug als
Grundlage zur Ermittlung der Phosphorsaürebedürftigkeit der Böden. Landwirtschaftl.
Jahrbücher. 71,73-99.
Dunlop, J., and A. L. Hart, 1987. Mineral nutrition. In M. J. Baker, and W. M. Williams
(eds.), White clover, CAB International, 153-183.

Literature cited 128
Ellmer, F., H. Peschke, W. Köhn, F. M. Chmielewski, and M. Baumecker, 2000. Tillage
and fertilizing effects on sandy soils. Review and selected results of long-term
experiments at Humboldt-University Berlin. J. Plant Nutr. Soil Sei. 163, 267-272.
Ersboll, A.K., 1994. On the spatial and temporal correlations in experimentation with
agricultural applications. PhD thesis n° 7. Institute of Mathematical Modelling, Lyngby,
Denmark.
Evans, P. S., 1977. Comparative root morphology of some pasture grasses and clovers,
N.Z. J. Agric. Res. 20, 331-335.
Fardeau, J.C., 1981. Cinétiques de dilution isotopique et phosphore assimilable des sols.
Thèse de doctorat d'état. Université Pierre et Marie Curie, Paris.
Fardeau, J. C, 1996. Dynamics of phosphate in soils: an isotopic outlook. Fert. Res. 45,
91-100.
Fardeau, J. C, and C. Morel, 1985. Cinétique d'échange des ions phosphate dans les
systèmes sol-solution. Vérification expérimentale de l'équation théorique. CR. Acad.
Sc. Paris, t. 300, Série III, n° 8, 371-376.
Fardeau, J. C, C. Morel, and R. Boniface, 1988. Pourquoi choisir la méthode Olsen
pour estimer le phosphore "assimilable" des sols ? Agronomie. 8 (7), 13-21.
Fardeau, J. C, C. Morel, and R. Boniface, 1991. Cinétiques de transfert des ions
phosphate du sol vers la solution du sol: paramètres caractéristiques. Agronomie. 11,
787-797.
Fardeau, J. C, G. Guiraud, and C. Marol, 1996. The role of isotopic techniques on the
evaluation of the agronomic effectiveness of P fertilizers. Fert. Res. 45, 101-109.

Literature cited 129
Föhse, D., N. Claassen, and A. Jungk, 1988. Phosphorus efficiency of plants. I. External
and internal P requirement and P uptake efficiency of different plant species. Plant and
Soil. 110, 101-109.
Fried, M., and L. A. Dean, 1952. A concept concerning the measurement of available
soil nutrients. Soil Sei. 73, 263-271.
Frossard, E., C. Feller, H. Tiessen, J. W. B. Stewart, and J. C. Fardeau, 1993. Can an
isotopic method allow for the determination of the phosphate-fixing capacity of soils ?
Commun. Soil Sei. Plant Anal. 24 (5&6), 367-377.
Frossard, E., M. Brossard, M. J. Hedley and A. Metherell, 1995. Reactions controlling
the cycling of P in the soils. In Tiessen (eds.), Phosphorus in the global environment.
SCOPE, 107-137.
Frossard, E., L. M. Condron, A. Oberson, S. Sinaj, and J. C. Fardeau, 2000. Processes
governing phosphorus availability in temperate soils. J. Environ. Qual. 29, 15-23.
Frossard, E., and S. Sinaj, 1997. The isotope exchange kinetic technique: a method to
describe the availability of inorganic nutrients. Isotopes Environ. Health Stud. 33, 61-
77.
Gächter R., A Mares, C. Stamm, U. Kunze and J. Blum, 1996. Dünger düngt
Sempachersee. Agrarforsch. 3 (7), 329-332.
Gransee, A., and W. Merbach, 2000. Phosphorus dynamics in a long-term P fertilization
trial on Luvic Phaeozem at Halle. J. Plant Nutr. Soil Sei. 163, 353-357.
Greenwood, D. J., T. J. Cleaver, M. K. Turner, J. Hunt, K. B. Niendorf, and S. M. H.
Loquens, 1980. Comparison of the effects of phosphate fertilizer on the yield, phosphate

Literature cited 130
content and quality of 22 different vegetable and agricultural crops. J. Agric. Sei. Camb.
95, 457-469.
Harris, W., 1987. Population dynamics and competition. In M. J. Baker, and T. A.
Williams (eds.), White clover, CAB International, 203-297.
Haynes, R. J., 1980. Competitive aspects of the grass-legume association. Adv. Agron.
33,227-261.
Hooda, P. S., M. Moynagh, I. F. Svoboda, A. C. Edwards, H. A. Anderson, and G. Sym,
1999. Phosphorus loss in drainflow from intensively managed grassland soils. J.
Environ. Qual. 28, 1235-1242.
Jaakkola, A., H. Hartikainen, and R. Lemola, 1997. Effect of fertilization on soil
phosphorus in a long-term field experiment in southern Finland. Agric. Food Sei. Fini.
6,313-322.
Johnston, A.E., P.W. Lane, G.E.G. Mattingly and P.R. Poulton, 1986. Effects of soil
and fertilizer P on yields of potatoes, sugar beet, barley and winter wheat on a sandy
clay loam soil at Saxmundham, Suffolk. J. Agric. Sei. Camb. 106, 155-167.
Jungk, A., N. Claassen, V. Schulz, and J. Wendt, 1993. Pflanzenverfiigbarkeit der
Phosphatvorräte ackerbaulich genutzter Böden. Z. Pflanzenernähr. Bodenk. 156, 397-
406.
Jungk, A., and N. Claassen, 1997. Ion diffusion in the soil-root system. Adv. Agron. 61,
53-110.
Kamprath, E. J., and M. E. Watson, 1980. Conventional soil and tissue tests for
assessing the phosphorus status of soils. In F. E. Khasawneh, E. C. Sample, and E. J.
Kamprath, (eds.), The role of phosphorus in agriculture., Madison, American Society of

Literature cited 131
Agronomy. Crop Science Society of America. Soil Science Society of America, 433-
469.
Kato, N., F. Zapata, and J. C. Fardeau, 1995. The ability of chemical extraction methods
to estimate plant-available soil P and a better understanding of P availability of
fertilized andosol by using isotopic methods. Soil Sei. Plant Nutr. 41 (4), 781-789.
Kenward, M. G., 1987. A method for comparing profiles of repeated measurements.
Appl. Statist. 36 (3), 296-308.
Kessler, M.J., 1989. Liquid scintillation analysis. Science and Technology. Publ. 169-
3052, Revision G. 3-19. Packard Instrument Co., Downers Grove, IL.
Khiari, L., L.E. Parent, A. Pellerin, A.R.A. Alimi, C. Tremblay, R.R. Simard, and J.
Fortin, 2000. An agri-environmental phosphorus saturation index for acid coarse-
textured soils. J. Environ. Qual. 29 (5), 1561-1567.
Larsen, S., 1952. The use of P32 in studies on the uptake of phosphorus by plants. Plant
and Soil. IV(1), 1-10.
Leinweber, P., R. Meissner, K.-U. Eckhardt, and J. Seeger, 1999. Management effects
on forms of phosphorus in soil and leaching losses. Eur. J. Soil Sei. 50, 413-424.
Lookman, R., D. Freese, R. Merckx, K. Vlassak, and W. H. Van Riemsdijk, 1995.
Long-term kinetics of phosphate release from soil. Environ. Sei. & Technol. 29, 1569-
1575.
Mc Collum, R. E., 1991. Buildup and decline in soil phosphorus: 30-year trends on a
typic Umprabuult. Agronomy J. 83, 77-85.

Literature cited 132
Mc Dowell, R. W., and L. M. Condron, 2000. Chemical nature and potential mobility of
phosphorus in fertilized grassland soils. Nutr. Cycl. Agroecosyst. 57, 225-233.
Marschner, H., 1995. Mineral nutrition of higher plants, 2" edition. London: Academic
press.
Mendoza, R. E., 1992. Phosphorus effectiveness in fertilized soils evaluated by
chemical solutions and residual value for wheat growth. Fert. Res. 32, 185-194.
Mengel, K., 1994. Symbiotic dinitrogen fixation - its dependence on plant nutrition and
its ecophysiological impact. Z. Pflanzenernähr. Bodenk. 157, 233-241.
Mercik, S., W. Stepien, and J. Labetowicz, 2000. The fate of nitrogen, phosphorus and
potassium in long-term experiments in Skierniewice. J. Plant Nutr. Soil Sei. 163, 273-
278.
Mollier, A., and S. Pellerin, 1999. Maize root system growth and development as
influenced by phosphorus deficiency. J. Exp. Bot. 50, 487-497.
Morel, C, and J. C. Fardeau, 1989 a. Native soil and fresh fertilizer phosphorus uptake
as affected by rate of application and P fertilizers. Plant and Soil. 115, 123-128.
Morel, C, and J. C. Fardeau, 1989 b. The uptake by crops of fresh and residual
phosphatic fertilizers by simultaneous measurements with 32P and 33P. Appl. Radiât.
Isot. 40 (4), 273-278.
Morel, C, C. Plenchette, and J. C. Fardeau, 1992. La fertilisation phosphatée raisonnée
de la culture du blé. Agronomie. 12, 565-579.

Literature cited 133
Morel, C, H. Tiessen, J. O. Moir, and J. W. B. Stewart, 1994. Phosphorus
transformations and availability under cropping and fertilization assessed by isotopic
exchange. Soil Sei. Soc. Am. J. 58, 1439-1445.
Morel, C, H. Tunney, D. Plénet, and S. Pellerin, 2000. Transfer of phosphate ions
between soil and solution: perspectives in soil testing. J. Environ. Qual. 29, 50-59.
Murphy, J., and J. P. Riley, 1962. A modified single solution method for the
determination of phosphate in natural water. Anal. Chim. Acta. 27, 31-36.
Oberson, A., J. C. Fardeau, J. M. Besson, and H. Sticher, 1993. Soil phosphorus
dynamics in cropping systems managed according to conventional and biological
agricultural methods. Biol. Fert. Soils. 16, 111-117.
Oehl, F., A. Oberson, H. U. Tagmann, J. M. Besson, D. Dubois, P. Mäder, H. R. Roth
and E. Frossard, 2001. Effect of phosphorus budget on phosphorus availability and
movement in soils under organic and conventional farming. Nutr. Cycl. Agroecosyst. In
press
O' Hara, G. W., 2001. Nutritional constraints on root nodule bacteria affecting
symbiotic nitrogen fixation: a review. Aust. J. Exp. Agric. 41, 417-433.
Ohno, T., and L. M. Zibilski, 1991. Determination of low concentrations of phosphorus
in soil extracts using Malachite green. Soil Sei. Soc. Am. J. 55, 892-895.
Olsen, S. R., C. V. Cole, F. S. Watanabe, and L. A. Dean, 1954. Estimation of available
phosphorus in soils by extraction with sodium bicarbonate. USDA, 171-188.
Pellerin, S., A. Mollier, and D. Plénet, 2000. Phosphorus deficiency affects the rate of
emergence and number ofmaize adventitious nodal roots. Agronomy. 92, 690-697.

Literature cited 134
Pierzynski, G. M., 1991. The chemistry and mineralogy of phosphorus in excessively
fertilized soils. Critic. Rev. Environ. Cont. 21, 265-295.
Plénet, D., A. Mollier and S. Pellerin, 2000. Growth analysis of maize field crops under
phosphorus deficiency. II. Radiation-use efficiency, biomass accumulation and yield
components. Plant and Soil. 224, 259-272
Poulton, P. R., 1996. The Rothamsted long-term experiments: are they still relevant ?
Can. J. Plant Sei. 76, 559-571.
Richards, I. R., C. J. Clayton, and A. J. K. Reeve, 1998. Effects of long-term fertilizer
phosphorus applications and crop phosphorus and cadmium contents. J. Agric. Sei.
Camb. 131, 187-195.
Rubaek, G.H., 1999. Soil phosphorus dynamics: Effects of land use, fertilisation and
liming. PhD thesis. Danish Institute of Agricultural Science and Royal Veterinary and
Agricultural University, Copenhagen.
Rubask, G. H., and E. Sibbesen, 2000. Long-term phosphorus fertilisation - Effects on
crop yield and soil phosphorus status, Tjele, Danish Institute of Agricultural Sciences.
43 p.
Salcedo, I. H., F. Bertino, and E. V. S. B. Sampaio, 1991. Reactivity of phosphorus in
northeastern brazilian soils assessed by isotopic dilution. Soil Sei. Soc. Am. J. 55, MO¬
MS.
Sample, E. C, 1980. Reactions of phosphate fertilizers in soils. In F. E. Khasawneh, E.
C. Sample, and E. J. Kamprath (eds.), The role of phosphorus in agriculture. Madison,
American Society of Agronomy, Crop Science Society of America, Soil Sei. Soc. Am.,
263-310.

Literature cited 135
Sanchez, P. A., and G. Uehara, 1980. Management considerations for acid soils with
high phosphorus fixation capacity. In F. E. Khasawneh, E. C. Sample, and E. J.
Kamprath, (eds.), The role of phosphorus in agriculture. Madison, American Society of
agronomy. Crop Science Society of America, Soil Sei. Soc. Am., 471-514.
SAS Institute Inc., Cary, NC (2000). SAS/STAT User's Guide (SAS Institute Inc.,
Version 8)
Saunders, W. M. H., and E. G. Williams, 1955. Observations on the determination of
total organic phosphorus in soils. J. Soil Sei. 6, 247-267.
Sen Tran, T., and M. Giroux, 1985. Comparaison de différentes méthodes d'extraction
du P assimilable en relation avec les propriétés chimiques et physiques des sols du
Québec. Can. J. Soil Sei. 65, 35-46.
Sen Tran, T., J. C. Fardeau, and M. Giroux, 1988. Effects of soil properties on plant-
available phosphorus determined by the isotopic dilution phosphorus-32 method. Soil
Sei. Soc. Am. J. 52, 1383-1390.
Sharpley, A. N., and R. G. Menzel, 1987. The impact of soil and fertilizer phosphorus
on the environment. Adv. Agron. 41, 297-324.
Sharpley, A. N., and P. J. A. Withers, 1994. The environmentally-sound management of
agricultural phosphorus. Fert. Res. 39, 133-146.
Sharpley, A. N., S. C. Chapra, R. Wedepohl, J. T. Sims, T. C. Daniel, and K. R. Reddy,
1994. Managing agricultural phosphorus for protection of surface waters: issues and
options. J. Environ. Qual. 23, 437-451.

Literature cited 136
Sibbesen, E., and A. Runge-Metzger, 1995. Phosphorus balance in European
agriculture. In H.Tiessen (ed.), Phosphorus cycling in terrestrial and aquatic ecosystems:
Global perspective. John Wiley, New York, 43-58.
Sibbesen, E., 1978. An investigation of anion exchange resin method for soil
phosphorus extraction. Plant Soil. 50, 305-321.
Sibbesen, E., and A. N. Sharpley, 1997. Setting and justifying upper critical limits for
phosphorus in soils. In H. Tunney, O. T. Carton, P. C. Brookes, and A. E. Johnston
(eds.), Phosphorus loss from soil to water, 151-176.
Sinaj, S., 1997. Isotopically exchangeable phosphate in size fractionated and
unfractionated soils. Soil Sei. Soc. Am. J. 61, 1413-1417.
Sinaj, S., C. Stamm, G. S. Toor, L. M. Condron, T. Hendry, H. J. Di, K. C. Cameron
and E. Frossard, 2002. Phosphorus exchangeability and leaching losses from two
grassland soils. J. Environ. Qual. in press.
Southwood, T. R. E., 1994. The importance of long-term experimentation. In R.A.
Leigh and A.E. Johnston (eds.), Long-term experiments in agricultural and ecological
sciences. CABI, 3-8.
Spiess, E. and J. M. Besson, 1999. Bilan de l'azote et du phosphore dans l'agriculture
suisse de 1975 à 1995. Rev. Suis. Agric. 31(6), 291-295.
Stamm C, H. Flühler, R. Gächter, J. Leuenberger and H. Wunderli, 1996. Preferential
transport in drained grassland soils. J. Env. Qual. 27, 515-522..
Stumpe, H., J. Garz, and H. Scharf, 1994. Wirkung der Phosphatdüngung in einem 40
jährigen Dauerversuch auf einer Sandlöss-Braunschwarzerde in Halle. Z.
Pflanzenernähr. Bodenk. 157, 105-110.

Literature cited 137
Tunney, H. A., A. Breeuwsma, P. J. A. Withers, and P. A. I. Ehlert, 1997. Phosphorus
fertilizer strategies: Present and future. In H.Tunney et al. (eds.), Phosphorus loss from
soil to water. CABI, Oxon, UK, 177-203.
Truong, B., and J. Pichot, 1976. Influence du phosphore des graines de la plante test sur
la détermination du phosphore isotopiquement diluable (valeur L). Agron. Trop. 31(4),
379-386.
van der Pauw, F., 1971. An effective water extraction method for determination of
plant-available soil phosphorus. Plant Soil. 34, 467-481.
van der Zee, S. E. A. T. M., L. G. J. Fokkink, and W. H. van Riemsdijk, 1987. A new
technique for assessment of reversibly adsorbed phosphate. Soil Sei. Soc. Am. J. 51,
599-604.
Walkers, T. W. and Syers, J. K., 1976. The fate of phosphorus during pedogenesis.
Biogeochem. 13, 61-85.
Walter, U., H. Menzi, J. P. Ryser, R. Flisch, B. Jeangros, W. Kessler, A. Maillard, A.
Siegenthaler and P.Vuilloud, 1994. Grundlagen für die Düngung im Acker- and
Futterbau. Agrarforschung. 1, 3-40.
Walter, U., H. Menzi, J. P. Ryser, R. Flisch, B. Jeangros, W. Kessler, A. Maillard, A.
Siegenthaler and P. Vuilloud 2001. Données de base pour la fumure des grandes
cultures et des herbages. Revue Suisse d'Agriculture, Vol.33, n°3.

Literature cited 138
Webb, J. R., A. P. Mallarino, and A. M. Blackner, 1992. Effects of residual and
annually applied phosphorus on soil test values and yields of corn and soybean. J. Prod.
Agric. 5, 148-152.
Wechsung, G., and H. Pagel, 1993. Akkumulation und Mobilisation von Phosphaten in
einer Shwarzerde im Statischen Dauerversuch Lauchstädt - Betrachtung der P-Bilanz
nach 84 Versuchsjahren. Z. Pflanzenernähr. Bodenk. 156, 301-306.
Whitehead, D. C, 2000. Nutrient elements in grassland: soil-plant-animal relationships,
CABI, 369 p.

List of tables and figures

List of tables and figures 140
List of tables and figures
Tables
Table 1.1. Main characteristics of the seven experimental sites.
Table 1.2. Main physico-chemical characteristics of the surface horizon of the studied
soils.
Table 1.3. Crop rotations for the different experimental stations.
Table 1.4. Mean, minimum and maximum yields obtained in the seven field
experiments over all years and treatments for the main crop components.
Table 1.5. Results of ante-dependance analysis performed for the period 1989-1998 in
all sites for yields of main crop components and total plant P uptake.
Table 1.6. Mean P concentrations determined for the main crop components over all
sites, years and treatments, compared to the reference concentrations given by Walter et
al. (1994).
Table 1.7. Cumulative P balances in mg P kg"1 soil in 1993 and 1998 for all sites and
treatments, calculated as the difference between the cumulative P inputs and the
cumulative P uptake.
Table 1.8. Mineral, Organic and Total P content of the surface horizon of the studied
soils in 1989, 1993 and 1998.
Table 1.9. Mineral, Organic and Total P content of the 30-50 cm horizon of the studied
soils in 1989 and in 1998.

List of tables and figures 141
Table 1.10. Parameters Cp, R/ri and n determined by the isotopic exchange kinetics
method in the surface horizon of the studied soils.
Table 1.11. Correlations established for the parameters R/ri, n, Cp and Eimin for all field
crops rotations.
Table 1.12. Pools Eimin, Eimin_3m and E>3m determined by the isotopic exchange kinetics
method in the surface horizon of the studied soils.
Table 1.13. Parameters Cp, R/ri, n and pools Eimin, Eimin.3m and E>3m determined by the
isotopic exchange kinetics method in the 30-50 cm horizon of the studied soils.
Table 2.1. P-availability determined by four extraction methods and Eimin value in the
surface horizon of the studied soils in 1989, 1993 and 1998.
Table 2.2. Correlations between initial P status (x) and availability decrease (y) in the
0-20 cm horizon between 1989 (1993 for Changins) and 1998 for the three treatments
and all field crops rotations.
Table 2.3. P-availability determined by four extraction methods and Eimin value in the
30-50 cm horizon of the studied soils in 1989 and 1998.
Table 2.4. Correlations between P-quantities extracted by the four studied methods (y)
and P balances (x) measured in 1993 and 1998 for all treatments and each soil.
Table 2.5. Correlations between the different methods of P-availability determination
for the 0-20 cm horizon.
Table 2.6. Classification of P-availability levels of the studied soils for the CO2-
saturated water and AAEDTA extractions for the 0-20 cm horizon.

List of tables and figures 142
Table 3.1. Selected properties of the studied soils.
Table 3.2. Total P, balance, and parameters of the isotopic exchange kinetic experiment
characterising the inorganic P availability in the studied soils.
Table 3.3. Dry matter production of the aerial parts (expressed in g DM kg"1 soil) of
English ryegrass and white clover grown separately or in mixture in three soils as affected
by four phosphorus treatments (OF: no P fertilization; OF+DAP: OF + a fresh addition of
DAP at the rate of 15 mg P kg"1 soil; F: residual P fertilizer; F+DAP: F + a fresh addition
of DAP at the rate of 15 mg P kg"1 soil).
Table 3.4. Dry matter production (expressed in g DM kg"1 soil) of the roots of English
ryegrass and white clover grown separately or in mixture in three soils as affected by 4
phosphorus treatments (OF: no P fertilization; OF+DAP: OF + a fresh addition of DAP at
the rate of 15 mg P kg"1 soil; F: residual P fertilizer; F+DAP: F + a fresh addition ofDAP
at the rate of 15 mg P kg"1 soil).
Table 3.5. Total P uptake (q expressed in mg P kg"1 soil), uptake of P from the soil
(qSOii), uptake of P from the residual fertilisers (qrf) and uptake of P from the fresh
fertiliser (qff), in the aerial parts of English ryegrass and white clover grown separately
or in mixture in three soils as affected by 4 phosphorus treatments (OF: no P
fertilization; OF+DAP: OF + a fresh addition of DAP at the rate of 15 mg P kg"1 soil; F:
residual P fertilizer; F+DAP: F + a fresh addition of DAP at the rate of 15 mg P kg"1
soil).
Table 3.6. P concentration (expressed in mg P g"1 DM) of the aerial parts of English
ryegrass and white clover grown separately or in mixture in three soils as affected by 4
phosphorus treatments (OF: no P fertilization; OF+DAP: OF + a fresh addition of DAP at

List of tables and figures 143
the rate of 15 mg P kg"1 soil; F: residual P fertilizer; F+DAP: F + a fresh addition of
DAP at the rate of 15 mg P kg"1 soil).
Table 3.7. P concentration (expressed in mg P g"1 DM) of the roots of English ryegrass
and white clover grown separately or in mixture in three soils as affected by 4
phosphorus treatments (OF: no P fertilization; OF+DAP: OF + a fresh addition of DAP at
the rate of 15 mg P kg"1 soil; F: residual P fertilizer; F+DAP: F + a fresh addition of
DAP at the rate of 15 mg P kg"1 soil).

List of tables and figures 144
Figures
Figure 1.1. Relative yields for the main crops components expressed as percentage of
the yields obtained on the P treatment in the Cadenazzo site from 1990 to 1998.
Figure 1.2. Relative yields for the main crops components expressed as percentage of
the yields obtained on the P treatment in the Rümlang site from 1990 to 1998.
Figure 1.3. P uptake at Rümlang from 1990 to 1998.
Figure 1.4. P uptake at Vaz from 1990 to 1998.
Figure 1.5. Relationship between n and Cp measured in the 0-20 cm horizon in 1989
(except Changins), 1993 and 1998 for all soils and treatments.
Figure 2.1. Relationships between cumulated P balances and quantities extracted for all
treatments in 1993 and 1998 in the 0-20 cm horizon by the 4 studied methods.
Figure 3.1. Kinetics of aerial parts dry matter production of English ryegrass grown
alone (la), white clover grown alone (lb) and of both plants grown in mixture (lc) in
the Ellighausen soil as affected by 4 P treatments (OF: no P fertilization; OF+DAP: 0F+
a fresh addition of DAP at the rate of 15mg P kg"1 soil; F: residual P fertilizer; F+DAP:
F + a fresh addition ofDAP at the rate of 15 mg P kg"1 soil).
Figure 3.2. Relation between the quantity of P taken up by the plant and derived from
the residual fertilizer (qrf) and the total amount of fertilizer (residual and fresh) added to
the 3 studied soils for English ryegrass and white clover grown separately or in a
mixture.

List of tables and figures 145
Figure 3.3. Relation between the proportion of P taken up by the plant and derived from
the residual fertilizer (PDFrf%) and the total amount of fertilizer (residual and fresh)
added to the 3 studied soils for English ryegrass and white clover grown separately or in
a mixture.
Figure 3.4. Relation between the quantity of P taken up by the plant and derived from
the fresh fertilizer and the concentration of P in the soil solution of the 3 studied soils
for English ryegrass and white clover grown separately or in the mixture.
Figure 3.5. Relation between the proportion of P taken up by the plant and derived from
the fresh fertilizer (PDFff%) and the concentration of P in the soil solution of the 3
studied soils for English ryegrass and white clover grown separately or in a mixture.

Seite Leer /
Blank leaf

Annexes

Annexes.Designs
ofthestudiedfieldexperiments
148
III
III.3
III.1
III.2
IV.2
IV.3
IV.
1
1.3
II.1
1.2
1.1
II.2
II.3
IV
II
I,II,
III,IV:Blocks
1:noP
2:P
(inputs=crops
offtake)3.
5/3P
(inputs>cropsofftake)
plotsurface4x8.25=33
m2
Annexe
1.Experimental
designatFAL
Reckenholz.
For
Rümlang
and
Oensingen,the
blocks'
organisationis
thesamewithanotherrandomizationofthetreatments.Theseareone
factorrandomized
blockdesigns,
with6differentphosphorus
rates.Hereonly
threetreatmentsareconsidered.

Annexes.De
signsofthestudiedfieldex
periments
149
II
III
IV
1.1
II.3
III.
2IV.2
1.2
III.3
IV.
1IV.3
1.3
II.
1II.2
III.
1
I,II,III,
I:Blocks
l:noP
2:P
(inputs=
cropsof
ftak
e)
3.5/3P
(inputs>cropsof
ftak
e)
plot
surface4x
8.25=33m2
Annexe
2.Experiment
alde
sign
atEl
ligh
ause
n.ForCadenazzo,theblocks'organisation
isthesame
withanotherrandomizationofthetreatments.Theseareone
factorrandomizedblockdesigns,
with
6differentphosphorus
rates.Hereon
lythreetreatmentsP
areconsidered.

Annexes.Designs
ofthestudiedfieldexperiments
150
IV
III
II
IV.l
IV.3
IV.2
III.3
III.1III.2
II.3
II.lII.2
1.21.3
1.1
I,II,
III,IV:Blocks
1:noP,noK
2:P,K
(inputs=crops
offtake)3.P+60P,K+200K
(inputs>cropsofftake
plotsurface15x8=120m2
Annexe
3.Experimental
designatChangins.
This
isaonefactorrandomizedblockdesigns,
with5
different
treatments
P-K.
Here
only3
treatmentsP-K
with
different
phosphorus
rates
are
considered.

Annexes.De
signsofthestudiedfieldex
periments
151
IV
IV.l
IV.2
IV.3
III
III.3
111.
2III.
1
II
II.1
II.3
II.2
I1.2
1.1
1.3
I,II,III,
IV:Blocks
1:noP
2:P
(inputs=
cropsof
ftak
e)3.3/2P
(inp
uts>cropsof
ftak
e)
plot
surface2x5=10m2
Annexe
4.Experiment
alde
sign
atVaz.
This
a4
x4
fact
oria
lexperime
ntinvolving
four
phos
phor
usandfourpotassium
rates.Only
3phosphorustreatments
attheconstantrateof216
kgK2O
ha"1
arehereconsidered.

Leer/
nk leaf

Remerciements

Remerciements 154
Remerciements
Je voudrais ici remercier toutes les personnes qui ont contribué au bon déroulement de
ce travail:
Le Professeur Emmanuel Frossard, pour m'avoir donné la possibilité de faire
cette thèse au sein de son laboratoire. Je le remercie pour ses conseils, remarques
et corrections avisés, et surtout pour son enthousiasme scientifique.
Le Dr Sokrat Sinaj, qui m'a directement encadrée et soutenue lors de ce
doctorat, et qui a su être présent dans les moments difficiles.
Le Dr Uli Walter et René Flisch de la Station de Recherches Fédérale Suisse en
Agroécologie (Reckenholz), ainsi que les Dr Pierre Vullioud, Dr Jean-Pierre
Ryser et Dr Jean-Auguste Neyroud de la Station de Recherches Fédérale Suisse
en Productions Végétales (Changins), dont la collaboration a été indispensable et
précieuse dans l'étude des essais de longue durée.
Pour leurs conseils en statistiques, je souhaiterais remercier le Dr A.K. Ersb0ll
(Royal Veterinary and Agricultural University, Copenhagen), et surtout le Dr
Gitte Rubœk (Danish Institute of Agricultural Sciences) qui a été d'une grande
disponibilité lors de mon séjour au Danemark.
Je remercie l'action COST 832, qui a financé ce séjour au Danish Institut of
Agricultural Sciences et qui m'a aussi permis de rencontrer au cours de réunions
de nombreux autres chercheurs européens.
Je remercie le Dr Astrid Oberson, pour les discussions enrichissantes que j'ai pu
avoir avec elle, aussi bien sur le plan scientifique que personnel.

Remerciements 155
Je voudrais également remercier les personnes sans lesquelles je n'aurais pas pu réaliser
tout le travail expérimental nécessaire à cette étude:
Je remercie spécialement Hans-Peter Niklaus, qui m'a considérablement aidée
au début de la thèse.
Merci également à Franziska Stoessel, Renaud Richardet, Mathias Corthay,
Judith Dudler, Barbara Steiner, Marianne Glodé, Gaby El-Hajj pour leur
participation aux analyses de sols et de plantes.
Je tiens à remercier tout le Groupe de Nutrition des Plantes, tous les techniciens et tous
les doctorants, pour leur soutien, leur amitié, et la bonne ambiance qu'ils font régner à
Eschikon.
Enfin, je n'aurais jamais pu terminer ce travail sans le soutien et la compréhension de
ma famille, qui m'a toujours encouragée et "supportée" tout au long de ces presque
quatre ans. Je remercie donc particulièrement mes parents, Rémi et Agnès, François, et
Julien.
Ce travail a été réalisé avec le soutien financier du Fonds National Suisse.

Qpïtp i ppr /
ICil i f\. lUß

Curriculum vitae
157
June 19, 1974 Born in Talence (France)
1980-1985 Primary school in Gradignan (France)
1985-1989 Secondary school in Gradignan
1989-1992 High school graduation (baccalauréat C)
1992-1994 Student in mathematics and biology, Lycée Michel
Montaigne, Bordeaux (France)
1994-1997 Diploma in Agronomy (Plant Sciences), ENSAIA,
Nancy (France)
1998-2001 Scientific collaborator at the Institute of Plant
Sciences, ETH Zürich, Group of Plant Nutrition