
Rift interaction at the Galápagos Triple Junctionand the Eastern Pacific (Easter Island and...
25
Rift interaction at the Galápagos Triple Junction Garrett Mitchell Spring 2009 Advisor: Dr. Laurent G.J. Montési Geology 394H
Transcript of Rift interaction at the Galápagos Triple Junctionand the Eastern Pacific (Easter Island and...

Rift interaction at the Galápagos Triple Junction
Garrett Mitchell Spring 2009
Advisor: Dr. Laurent G.J. Montési Geology 394H

2
Abstract The Galapágos Triple Junction is a complex ridge-ridge-ridge triple junction located 1000
km west of the Galapágos Islands in the eastern equatorial Pacific Ocean. A northern ridge-ridge-ridge triple junction intersects the East Pacific Rise at 2°40’ N while a southern triple ridge-ridge-ridge junction intersects the East Pacific Rise at 1°10’ N. A series of smaller extinct rifts found parallel and to the northeast of the 2°40’ N triple junction suggests that rifts associated with this triple junction, similar to the current Incipient Rift, were at one time an active triple junction at 2°40’ N along the East Pacific Rise but eventually cease to be active and are carried away from the triple junction with the Cocos plate. Numerical models, in which the geometry and locations of various rifts are varied in the general triple junction vicinity, are analyzed to constrain the factors that have led to the consistent location of secondary rift at the northern triple junction. The results indicate that once a rift has become detached from the East Pacific Rise, a zone of reduced tension forms at the rift tip prohibiting reconnection. Instead, two peaks of tensile stress enhancement form along the East Pacific Rise and are offset from the detached rift indicating where a new crack is likely to form. I show that the magnitude of tensile stress enhancement is controlled by the gap between the detached rift and the East Pacific Rise, but the presence of the Cocos-Nazca Rift controls the location of new rift formation along the ridge of the East Pacific Rise. Therefore, I infer that the sequence of ancient rifts at the 2°40’ N triple junction represents the natural consequence of rift disconnection events and their position reflects the history of the gap between the EPR and the Cocos-Nazca Rift.

3
Table of Contents
Abstract ----------------------------------------------------------------------------------------- 2
1. Introduction --------------------------------------------------------------------------------- 5 1.1 Ridge-Ridge-Ridge Triple Junctions ---------------------------------------------------- 5
1.2 Galápagos Triple Junction ---------------------------------------------------------------- 6 1.3 Northern Rifting at 2’40° N -------------------------------------------------------------- 8
1.4 Goals of the Study ------------------------------------------------------------------------10
2. Methods of Analysis ----------------------------------------------------------------------10 2.1 Methods for Model Construction --------------------------------------------------------11
2.2 Presentation of Data ----------------------------------------------------------------------12 2.3 Analysis of Uncertainty ------------------------------------------------------------------12
2.4 Model Series -------------------------------------------------------------------------------13 3. Results ---------------------------------------------------------------------------------------15
3.1 CNR only ----------------------------------------------------------------------------------15 3.2 Attached IR Series ------------------------------------------------------------------------16
3.3 Detached IR Series ------------------------------------------------------------------------17 4. Discussion of Results ---------------------------------------------------------------------19
4.1 History of Rifting at 2°40’ N ------------------------------------------------------------19 4.2 Rift Disconnection ------------------------------------------------------------------------20
4.3 Propagation of the Cocos-Nazca Rift --------------------------------------------------21 4.4 Suggestions for Future Work ------------------------------------------------------------22
5. Summary ------------------------------------------------------------------------------------22 6. Acknowledgments -------------------------------------------------------------------------24 7. References ----------------------------------------------------------------------------------25

4
List of Figures and Tables
Figure 1: Global map of RRR triple junctions ----------------------------------------- 6
Figure 2: Tectonic setting of the Galápagos triple junction ------------------------- 7 Figure 3: Bathymetry of the Galápagos triple junction ------------------------------ 8
Figure 4: A: Bathymetry north of the Cocos-Nazca Rift ---------------------------- 9 B: Interpretation of the seafloor features ----------------------------------- 9
Figure 5: A: Stress enhancement for the simple crack model ---------------------10 B: Contours of stress enhancement overlain on seafloor topography -10
Figure 6: A: Refined mesh without the presence of a secondary rift -------------12 B: Refined mesh with the presence of a secondary rift -----------------12
Figure 7: Graph of the uncertainty analysis ------------------------------------------13 Figure 8: Model design schematics ----------------------------------------------------14
Figure 9: A: Tensile stress enhancement map for CNR only model --------------15 B: Tensile stress enhancement map for Attached IR --------------------15
C: Tensile stress enhancement map for Detached IR --------------------15 Figure 10: Stress profiles along the East Pacific Rise --------------------------------16
Figure 11: Results for the Attached IR model series ---------------------------------17 Figure 12: Results for the Detached IR model series (xIR = 0.2) --------------------18
Figure 13: Results for the Detached IR model series (xIR = 0.1) --------------------19

5
1 Introduction 1.1 Ridge-Ridge-Ridge Triple Junctions
The Earth’s lithospheric plate boundaries evolve through variations in their configurations throughout time and space. This dynamic nature of plate boundary geometry is due to both the continuous formation and destruction of the lithospheric plates. Soon after the acceptance of plate tectonic theory, it was recognized that there must be regions on Earth where three plates meet due of the number of plates and that some of these complex tectonic regions can retain their geometries over time (McKenzie and Parker, 1967; McKenzie and Morgan, 1969). These regions are known as triple junctions and are an intersection on the Earth’s surface where three plates meet at a point.
These triple junctions can be described as either stable or unstable depending on the relative motions of the three plates and the azimuth of their boundaries. Unstable triple junctions can only momentarily exist in geologic terms before evolving geometrically into a more steady-state boundary configuration. If all three plate velocity vectors intersect at a single point, the tectonic junction is said to be stable. The stability of the triple junction is described in its kinematic ability to retain its geometry over time (Patriat and Coutillot, 1984).
Of the sixteen possible types of triple junction combinations presently recognized on Earth (McKenzie & Morgan, 1969), only ridge-ridge-ridge (RRR) triple junctions are described as stable through time. Although kinematically stable on the order of millions of years, it is suggested that these plate boundary intersections require rift propagation in order to sustain this stability (McKenzie and Morgan, 1969). Cronin (1992) suggests that these stable triple junctions are probably unstable most of the time. Modeling and observations of oceanic RRR triple junctions indicate that these junctions are characterized by episodic migration that involve propagating rifts and the formation and accretion of microplates in order to retain their kinematic stability (Bird et al., 1999).
Currently, RRR triple junctions are observed in the North Atlantic (Azores Triple Junction), South Atlantic (Bouvet Triple Junction), Southwest Indian Ocean (Rodriguez Triple Junction), and the Eastern Pacific (Easter Island and Galapagos Triple Junctions) (Figure 1). The Easter Island RRR Triple Junction (intersection of the Pacific, Antarctic, and Nazca plates) and Galápagos RRR Triple Junction (Pacific, Cocos, and Nazca plates) are both observed to contain rotated abyssal hill fabric, microplates, and connection to the fast spreading East Pacific Rise. Both of these RRR triple junctions are considered kinematically stable triple junctions although both have evidence for a history of local instability.

6
Figure 1. The global location of the Earth’s ridge-ridge-ridge triple junctions. 1: Azores triple
junction, North Atlantic. 2: Bouvet triple junction, South Atlantic. 3: Easter Island triple junction, Eastern Pacific. 4: Galápagos triple junction, Eastern Pacific. 5: Rodriguez triple junction, Eastern Pacific.
The Easter Island RRR triple junction retains its stable geometry through a pair of coaxial transform faults (McKenzie and Morgan, 1969), but this triple junction is observed to have jumped repeatedly north due to plate kinematic perturbations and rapid plate boundary reorganization (Bird and Naar, 1994). Farther north along the East Pacific Rise is the Galápagos RRR triple junction (GTJ) separating the Pacific, Nazca, and Cocos plates. Like the Easter Island triple junction, the GTJ triple junction is defined by a partially rotated microplate (Klein et al., 2005) and contains evidence for a jumping triple junction (Schouten et al. 2008).
1.2 Galápagos Triple Junction The large-scale tectonic setting of the GTJ suggests a simple RRR triple junction where the
Cocos Nazca Rift (CNR) intersects the East Pacific Rise (EPR) in the eastern Pacific equatorial ocean. However, the smaller scale tectonic setting reveals a more complicated boundary between the plates where the CNR terminates 50 km to the east of the EPR.
The GTJ forms complex boundaries with its neighboring major plates that bound the Galápagos microplate by a set of secondary rifts that form a pair of active asymmetric RRR triple junctions found at 1°10’ N and 2°40’ N along the EPR (Figure 2). The EPR is a N-S trending oceanic spreading ridge that that defines the eastern edge of the Pacific plate. The fastest spreading rates on Earth of 150 mm/yr occur along the East Pacific Rise, although the rates found at the EPR in the vicinity of the GTJ are 133 mm/yr (Demets et al., 1994).

7
Figure 2: Tectonic setting of the Galápagos Triple Junction. EPR: East Pacific Rise, GMP:
Galápagos microplate, NGMP: North Galápagos microplate, HD: Hess Deep, TJ: Triple Junction. The regional map on the left suggests a simple ridge-ridge-ridge triple junction while the local geologic setting on the right highlights the two triple junctions at 2°40’ N and 1°10’ N along the East Pacific Rise. From Schouten et al., 2008.
The Cocos-Nazca Rift (CNR) is an E-W trending, 3 km high volcanic ridge spreading at a rate of 42 mm/yr that is propagating westward into a 5400 m deep intra-oceanic rift valley located at the tip of the Cocos-Nazca plate boundary (Figure 3). The continuous westward propagation of the CNR has opened up a deep fissure in young oceanic crust called the Hess Deep rift basin that represents the tip of the Cocos-Nazca spreading center. Multibeam bathymetric data indicate that this propagating rift terminating at the Hess Deep (Lonsdale, 1988) divides the Galápagos microplate into two counter-rotating microplates (Klein et al., 2005).
The RRR triple junction located at 1°10’ N along the EPR is defined by its intersection to the Dietz Deep Rift and appears to be the more stable of the two triple junctions. Bathymetry in this region indicates that the morphology of the rift is a volcanically high ridge near the intersection with the EPR that grades into a deep rift valley to the northeast. The relative stability is speculated to be due to the large seamount located in the vicinity of the Dietz Deep Rift (Lonsdale, 1988) or perhaps due to a more robust magma supply along the EPR; however, this region has not been adequately surveyed until December 2008 and little published data on the 1°10’ N triple junction is available.
The Incipient Rift (IR) that forms the northern triple junction at 2°40’ N was recognized by Lonsdale (1988) and Lonsdale et al. (1992) to be a small westward propagating rift opening at 15mm/yr with a V-shaped eastern end. Multibeam mapping to the northeast of the triple junction reveals that the N-S trending abyssal hills are crosscut with a series of multiple extinct ancient rifts with similar orientations to that of the IR (Figure 4A). Thus, it appears that the IR occupying the 2°40’ N triple junction is the smallest and youngest of the set of active ridges found at Galápagos triple junction and is interpreted to be the youngest in the sequence of northern rifts found at the 2°40’ N triple junction (Schouten et al., 2008).

8
Figure 3: Bathymetric map of the Galápagos Triple Junction and the location of the rifts and
plates. Recent surveying reveals the complexity of the tectonics in the region where two RRR triple junctions are located at 1°10’ N where the Dietz Deep Rift connects with the EPR and 2°40’ N where the IR connects to the EPR. The Cocos-Nazca Rift is propagating west without directly connecting with the EPR. While the 1°10’ N triple junction appears to be the more robust and stable of the two, the 2°40’ N triple junction is characterized by a succession of extinct secondary rifts with similar azimuths. Bathymetry data compiled by Hans Schouten and Debbie Smith.
1.3 Northern Rifting at 2°40’ N The succession of transient extinct northern rifts is outlined in detail in Figure 4B. This 250
km long by 50 km wide region northeast of the triple junction is found to contain over 20 secondary SE-trending rifts. Of these secondary rifts, the Extinct Rift (ER) is the largest of these rifts and the IR is the youngest of the rifts that forms the active RRR triple junction at 2°40’ N. All of the extinct secondary rifts found to the northeast of the IR have a similar morphology and trend and are therefore interpreted to have once been a former RRR triple junction found 50-100 km north of the CNR tip along the EPR. Schouten at al. (2008) speculate that these unstable rifts are moving north along the EPR, becoming detached, and are being rafted away with the northeast motion of the Cocos plate.

9
Figure 4. A: Multibeam bathymetry and global seafloor bathymetry north of the Cocos-Nazca
Rift. Red dashed line is the inferred trace of the northern secondary rifts cross-cutting the EPR abyssal hills. B: Interpretation of the seafloor features from the multibeam bathymetry. The dark shading is the outline of excess volcanism and the light gray shading is the Cocos-Nazca Rift. Bold black lines are the rift systems and light black lines are seafloor lineations. From Schouten et al. 2008.
Schouten et al. (2008) developed a numerical model involving a simple crack interaction model to explain the existence and evolution of this sequence of short SE-trending rifts found to the northeast of the current 2°40’ N RRR triple junction (Figure 5A). They modeled the Galapagos triple junction using a 2D elastic rectangular plate and added a thin stress-free ellipse to approximate the CNR that stops at a distance D (50 km) from a stress-free western boundary.
A symmetrical stress enhancement pattern is observed after the plate velocities are imposed on the northern and southern edges of the model. Their crack model suggests a decrease in tensile stress enhancement along the EPR ahead of the CNR tip and an increase of tensile stress enhancement at ± 1.4D, where D = 50 km. This model indicates that the zone of reduced tension is prohibiting the CNR from directly connecting to the EPR. The model also explains the current location of the RRR triple junction at 2°40’ N. Figure 5B shows the contours of the stress field superimposed on the bathymetry and 1.4D in their model translates to 70 km north along the EPR and matches closely to the location of the triple junction. Their study suggests that the location of these short-lived rifts is controlled by stresses along the EPR whose magnitude and orientation are determined by the location of the tip of the CNR.
340 GEOLOGY, May 2008
It has been diffi cult to understand what role Incipient Rift plays in the triple junction kine-matics. Lonsdale (1988) and Lonsdale et al. (1992) concluded that Incipient Rift was a small westward-propagating rift. In contrast, Klein et al. (2005) concluded that the Incipient Rift opens about a pivot at its eastern end. And, what was previously thought to be a single Galapagos microplate could, in fact, be composed of two counterrotating microplates: the northern portion of Lonsdale’s Galapagos microplate (North Galapagos microplate), and the remaining portion of the microplate. Applying the edge-driven microplate model of Schouten et al. (1993) to their proposed dual microplate system, Klein et al. (2005) estimated that the North Galapagos microplate would have been subjected to ~7° of rotation since its initiation ca. 0.5 Ma, an angle considered to be too small to be resolved conclusively from the seafl oor fabric.
Klein et al. (2005) also described Extinct Rift, a trough that trends parallel to the Incipi-ent Rift, ~100 km to the northeast. They inter-preted Extinct Rift to have been a larger version of Incipient Rift and suggested that the GTJ has undergone a long and complex history of plate reorganization with the development and aban-donment of rotating microplates north and south of the Cocos-Nazca Rift.
We present a new interpretation of the evolu-tion of the GTJ. We observe that during the past 4–5 m.y., north-south–trending abyssal hills of the Cocos plate have been cut and volcani-cally overprinted by a succession of short-lived northwest-southeast–trending minor rifts and associated triple junctions, but without signifi cant rotation. We suggest that the rift locations are con-trolled by stresses associated with the dominant Cocos-Nazca Rift, and scaled by the distance of its tip to the East Pacifi c Rise. We speculate that similar short-lived rifting also occurred south of
the Cocos-Nazca Rift and was instrumental in the development of Dietz Deep Rift and the origin of the Galapagos microplate ca. 1.5 Ma.
NORTHERN TRIPLE JUNCTIONSAt the western end of Incipient Rift (Fig. 1B),
a broad volcanic high extends east from its triple junction with the East Pacifi c Rise for ~15 km, where it changes to a narrow graben (~200 m deep, ~4 km wide) extending southeast (Figs. 1B and 2). Excess volcanism blankets East Pacifi c Rise–generated crust to the north and south of the volcanic high (Klein et al., 2005). The overall shape of Extinct Rift is similar to that of Incipient Rift: a volcanic high and fl ows blanketing East Pacifi c Rise–generated abyssal hills changing to a graben trending southeast (Figs. 1C and 2). This suggests that the west-ern end of the volcanism marks the location of the former junction of Extinct Rift with the East Pacifi c Rise. Because Extinct Rift is deeper (to 600 m) and broader (~14 km) than Incipi-ent Rift, we infer that it opened for a longer period of time (>0.5 m.y.) before it was aban-doned ca. 1.5 Ma (inferred from the location of its tip). If Extinct Rift bounded an edge-driven microplate, the lithosphere to its south should have been noticeably rotated. As at the Incipi-ent Rift, however, no evidence of seafl oor fabric rotation is observed, which challenges the model proposed by Klein et al. (2005) of a succession of rotating edge-driven microplates north of the Cocos-Nazca Rift.
Between Incipient and Extinct Rifts and far-ther to the east, we recognize multiple volcanic ridges (Figs. 1B, 1C) that change to graben along their strike. The western edge of volcanism that blankets and abuts the north-south–trending abys-sal hills (Fig. 2) is identifi ed as the trace of many short-lived rifts where they intersected the East Pacifi c Rise. The associated graben have different widths, and thus presumably opened for varying lengths of time. In places where volcanic highs are observed and graben are not well defi ned, we infer that volcanism occurred along an initial crack, which was then quickly abandoned.
Thus it appears that Incipient Rift is just the latest and Extinct Rift perhaps the largest of a sequence of more than 20 southeast-trending rifts or cracks that progressively stepped southward and westward and successively accommodated approximately north-south extension of East Pacifi c Rise–generated crust. At ~101°20!W, the strike of the inferred triple junction trace changes abruptly from westward to southward. At ~101°35!W it changes back to westward. We observe that a more westward trend implies a relatively stationary triple junction, giving rise to more prolonged rifting at a steady location, and that a southward trend implies that rift-ing and triple-junction vol canism rapidly and repeatedly jumped south.
Extinct Rift
102°W 101°W 100°W2°N
3°N
Cocos-Nazca SC HD
EPR
Rift scarps
TJ
Water depth (m) 50 km
A
B
TJ
EPR
–4000 –2000
102°W 101°W 100°W
2°N
3°N
Incipient Rift
Extinct Rift
1 My
Figure 2. A: Multibeam bathymetry and global seafl oor topography (Smith and Sandwell, 1997) north of Cocos-Nazca Rift. Red dashed line—inferred trace of northern triple junctions. B: Interpretation of features from A. Dark shading—outline of excess volcanism. Light gray shading—Cocos-Nazca Rift. Bold black lines—rift systems. Light black lines—lineations. Red dashed line—same as in A. SC—spreading center, HD—Hess Deep, TJ—triple junction, EPR—East Pacifi c Rise.

10
Figure 5. A: Stress enhancement for the simple crack model (Schouten et al. 2008). Warm
colors (red through yellow) are the enhanced tensile stress. Cooler colors (cyan through blue) represent the reduced tensile stress. Stress enhancement is the stress field normalized by the stress expected in the absence of the crack. Contours range from 0 to 0.4 at intervals of 0.02. D = the distance of the crack from the free boundary. Tensile stress maxima occur at ± 1.4D. B: Contours of stress enhancement overlain on seafloor topography. The tip of the crack is positioned over the tip of the Cocos-Nazca Rift and the model is rotated to match the orientation of the spreading center. The Incipient Rift is located at a tensile stress maxima (+ 1.4D) along the East Pacific Rise. TJ: triple junction. From Schouten et al. 2008.
1.4 Goals of the study The aim of this study is to better understand how stresses associated with the location of the
propagating CNR control the location and timing of secondary rift formation at the 2°40’N triple junction. I propose that the location of rift formation along the EPR at the 2°40’ N triple junction is controlled by the magnitude of the gap between the CNR rift tip and the EPR.
2 Methods of Analysis In order to better examine the factors that play a role in the complex history of the 2°40’N
RRR triple junction and to test the research hypothesis, two series of numerical models are designed in map view using the commercial finite element modeling software COMSOL®
Multiphysics and post processed with MATLAB®. The 2D rectangular plate models contain uniform elastic properties with a plane stress approximation that contain a free mesh of triangles refined along the EPR and rift tips.
Rifts are incorporated into the models as thin stress-free ellipses whose locations are varied in order to identify the regions of stress enhancement along the EPR. These maps of stress enhancement patterns determine where zones of maximum tensile strength develop as a function of rift location and therefore where new rifts are likely to initiate along the EPR. Analyses of the calculated patterns of stress enhancement are accomplished by studying the stress profiles of tensile stress enhancement as a function of distance in each of these models. Peak values of stress enhancement are extracted from these graphs to produce graphs of maximum peak position as a function rift location along (Attached IR series) and near (Detached IR series) the EPR.
GEOLOGY, May 2008 341
CRACK INTERACTION MODELWe hypothesize that the cracking at Incipi-
ent Rift and the other extinct rifts relates to the westward propagation of a Cocos-Nazca Rift that never reached the East Pacifi c Rise. We use a simple crack interaction model to understand the controls on the location of the northern triple junctions. An initial numerical model is con-structed in map view with the commercial fi nite element software COMSOL® Multi physics (COMSOL, 2006) (Fig. 3A). The model fol-lows the plane stress approximation appropri-ate for the lithosphere in the absence of surface loads over long time scales (e.g., Turcotte and Schubert , 2002). This approximation differs from the study of stress interactions at Hess Deep by Floyd et al. (2002), who considered an infi nite half space to understand these inter-actions at a time scale of <1000 yr, for which viscous relaxation does not occur.
In our model, the Cocos and Nazca plates are approximated by rectangular areas. Their west-ern boundary, the East Pacifi c Rise, is stress free. The plate is cut along an axis perpendicular to the East Pacifi c Rise, representing the Cocos-Nazca Rift. The cut stops at a distance D from the East Pacifi c Rise. Plate velocities are imposed on the edges of the model to the north and south, and the stress fi eld is examined after an arbitrary time increment. The amplitude of stress scales pro-portionally with time and Young’s modulus, and inversely with plate thickness. The stress pattern, however, remains unchanged. We present this pattern as a map of stress enhancement, which is the stress fi eld normalized by the stress expected in the absence of the Cocos-Nazca Rift.
A similar model has been used to explain the development of graben above non-erupting magmatic dikes (e.g., Mastin and Pollard, 1988; Pollard and Holzhausen, 1979). The diking models assume plane strain and loading caused by the internal pressure of the dike; in contrast, we assume plane stress and loading caused by remote displacement. In both cases off-axis stress maxima develop.
A zone of reduced tension develops ahead of the crack and tensile stress maxima develop along the East Pacifi c Rise ~±1.4D from the rift tip. It is at these locations that the fi rst crack not connected to the propagating Cocos-Nazca Rift is expected to appear. Near the new crack, the stress along the East Pacifi c Rise decreases and the crack propagates to the southeast following the tensile stress maxima. As seen in Figure 3B, the distance 1.4D along the East Pacifi c Rise from the tip of the crack corresponds closely to the location of Incipient Rift with respect to the Cocos-Nazca Rift.
Plate thickness is constant in our model. When we include plate thickening away from the East Pacifi c Rise, it mainly enhances the stress at the East Pacifi c Rise without signifi cantly changing the stress maxima locations. We have also con-sidered a model in which the stress-free bound-ary more closely follows the geometry of the East Pacifi c Rise. This results in even stronger tensile stresses at Incipient Rift because a change in strike of the East Pacifi c Rise there (Fig. 1) (Lonsdale et al., 1992) helps focus and intensify the tensile stresses.
We note that in our numerical model the zone ahead of the Cocos-Nazca Rift tip is one
of reduced tension and perhaps more diffi cult magma extraction. The East Pacifi c Rise in this region does not have the typical fast-spreading axial rise morphology (e.g., Lonsdale, 1977, 1988; Searle and Francheteau, 1986). Instead, it looks more like a slow-spreading ridge with horst and graben terrain. It remains to be determined whether this morphology is a product of the stresses induced by the propa-gating Cocos-Nazca Rift.
DISCUSSIONDirectly north of the large scarps that mark
the propagation of the Cocos-Nazca Rift, a 250-km-long and 50-km-wide band of roughly northwest-southeast–trending cracks with vol-canics at their western ends, crosscuts and blankets East Pacifi c Rise–generated abyssal hills (Fig. 2). This indicates that 50–100 km north of the Cocos-Nazca Rift, East Pacifi c Rise–generated lithosphere has been extended roughly north-south by a succession of minor rifts since at least 4 Ma.
A schematic evolution of the GTJ for the past 2 m.y. is shown in Figure 4 (A–E). Based on the results of our numerical model, we envi-sion that each of the cracks and graben north of the Cocos-Nazca Rift initiates as a crack at the East Pacifi c Rise. As the crack propagates eastward, eruptions build a localized volcanic high and fl ows blanket the seafl oor. Currently, the volcanic high at Incipient Rift is shallower than the adjacent rise crest, suggesting that melt may be diverted preferentially from the East Pacifi c Rise to Incipient Rift. If the tip of the Cocos-Nazca Rift remains at a steady dis-tance D from the East Pacifi c Rise, the loca-tion of the maximum tensile stress stays steady at 1.4D north of the Cocos-Nazca Rift while a stable triple junction moves away from the Cocos-Nazca Rift tip with roughly half the Cocos-Nazca spreading rate. At some point, a stable triple junction will have moved too far north for continued opening and a new crack will initiate to the south (at 1.4D), forming a new RRR triple junction. The abandonment of the triple junction will occur more quickly when the Cocos-Nazca Rift tip moves closer to the East Pacifi c Rise (decreasing D) and the location of maximum tensile stress along the East Pacifi c Rise moves closer to the rift. When, instead, the tip retreats from the East Pacifi c Rise (increasing D), the triple junction remains the optimum geometry for continued opening of the crack, resulting in a graben simi lar in size to Incipient Rift or Extinct Rift. Figure 4F shows the predicted distance of the rift tip to the East Pacifi c Rise for the past 5 m.y. based on the estimated north-south dis-tance of the trace of the northern triple junc-tions from the trace of the Cocos-Nazca Rift tip (rift scarps, Fig. 2).
Incipient Rift
–4000 –2000
1°N
2°N
3°N
Waterdepth (m)
50 km
A B
Dietz Deep Rift
Extinct Rift
100°W101°W102°W
TJ
TJ
Fre
e bo
unda
ryCrack
1.4D
D
Maximum
Maximum
Figure 3. A: Stress enhancement for a simple crack model. Warm colors (red through yellow ) are enhanced tensile stress, and cool colors (cyan through blue violet) are reduced tensile stress. Stress enhancement is the stress fi eld normalized by the stress expected in the absence of the crack. Contours range from 0 to 0.4 at intervals of 0.02. D—distance of tip of the crack from the free boundary. Tensile stress maxima occur at ±1.4D. B: Contours of stress enhancement overlain on topography. The tip of model crack is positioned over tip of Cocos-Nazca Rift, and the model is rotated to match the orientation of the spreading center. Incipient Rift is located at a tensile stress maximum at the East Pacifi c Rise. TJ—triple junction.

11
The time-independent models used in this study have domain dimensions of 6D x 8D with a constant plate thickness of .2D. The western edge of the models is a stress-free boundary representing the EPR. The .002D wide stress-free ellipse representing the CNR splits the model along the center axis and terminates at a distance of D from the EPR. The northern half of the model represents the Cocos plate with the southern half representing the Nazca plate. Relevant plate velocities of 133 mm/yr for the EPR and 42 mm/yr for the CNR (DeMets et al., 1994) are imposed on the northern, southern, and eastern boundaries of the model and the stress field is solved for after an arbitrary period of time. Spreading rates are obtained from Bill Menke’s online plate velocity calculator (http://www.ldeo.columbia.edu/users/menke/plates2.html).
In order to identify the natural scales of this physical problem, the model parameters that were previously dimensional (i.e. the size of the plate, the size and position of the rifts) are defined as non-dimensional variables. Every distance is scaled to the only natural length scale in the model, the distance from the Cocos-Nazca Rift tip to the East Pacific Rise, D = 50,000 m, To convert the dimensional variables to non-dimensional variables, the natural dimensions are divided by 50,000 m. As these models do not contain a natural time scale, the intensity of the stress field is arbitrary but its pattern is not. Therefore, the stress field is scaled by the uniform value expected in the absence of rifts, σ=2E*d/Ly, where E is the Young’s modulus, d is the displacement at the north and the south end of the model, and Ly is length of the model plate in the y direction. For simplicity, the non-dimensional models use E=1, and d=Ly/2, where Ly = 8. All model results presented from now on discuss only the stress enhancement field, which is the result of this scaling activity.
2.1 Methods of model design using COMSOL® Multiphysics The following steps are the procedure used to build the numerical models and test the
research hypothesis that the location of rift formation along the EPR at the 2°40’ N triple junction is controlled by the magnitude of the gap between the CNR tip and the EPR.
1. Models are constructed as 2D finite element models with a plane stress assumption and a plate of uniform elastic properties. The rifts are incorporated into the models as thin stress-free ellipses. The geometry of the numerical models feature the following variables and parameters:
• D = 50,000 m • Plate dimensions: plate thickness h = 0.2, plate length Ly = 8, plate width Lx = 6 • Rift elliptical dimensions: CNR width = .002, CNR length = 5, IR width = .002, IR
length = 0.4 2. Create the mesh of the finite element model. The mesh of the models is composed of
triangular 2nd order mixed-mode elements that are confined to within the body of the model. COMSOL® Multiphysics automatically generates a triangular-based mesh that is refined along the EPR and rift tips in order to increase the accuracy of the results (Figure 6). Maximum mesh size used in the models is 0.06 that is automatically refined at rift tips.

12
Figure 6. Model mesh resolutions used in the study. A: The mesh with a resolution of 0.06 for
the model without the influence of a secondary rift mesh refinement. Uncertainty for this mesh resolution corresponds to the vertical line in Figure 7. B: The mesh with a resolution of 0.06 for the model with the influence of a secondary rift refinement.
2.2 Presentation of Data: Post processing using MATLAB® 1. Stress enhancement maps are constructed for the crack models. These maps highlight areas
of maximum tensile stress enhancement and display the regions where cracking is most likely to occur and the relationship between rifts. The stress enhancement is the calculated stress field that has been normalized by the stress expected in the absence of the Cocos-Nazca Rift.
2. Stress profiles of tensile stress enhancement are derived from the results. These profiles measure the stress enhancement along the EPR and indicate where a new rift is likely to form along the ridge.
3. Extract maximum values from the stress profiles and create graphs of the stress enhancement peak position as a function of rift location along or near the EPR as well as the peak amplitude along or near the EPR.
2.3 Analysis of Uncertainty To characterize the uncertainties and validate the numerical models, I increased the
resolution of the mesh of two example models (Figure 6) and analyzed how the values of the maximum stress enhancement were affected. The first model is the base model that has one rift tip far enough away from the EPR (stress free surface that is being analyzed) and the other contains a detached rift whose refined element mesh has an influence over the EPR. The grid size contained within the script is adjusted along the stress-free EPR in order to increase the resolution of the mesh. Specific values of stress enhancement from these refined element meshes are extracted and compared to the models used in the research to create a calculated uncertainty.
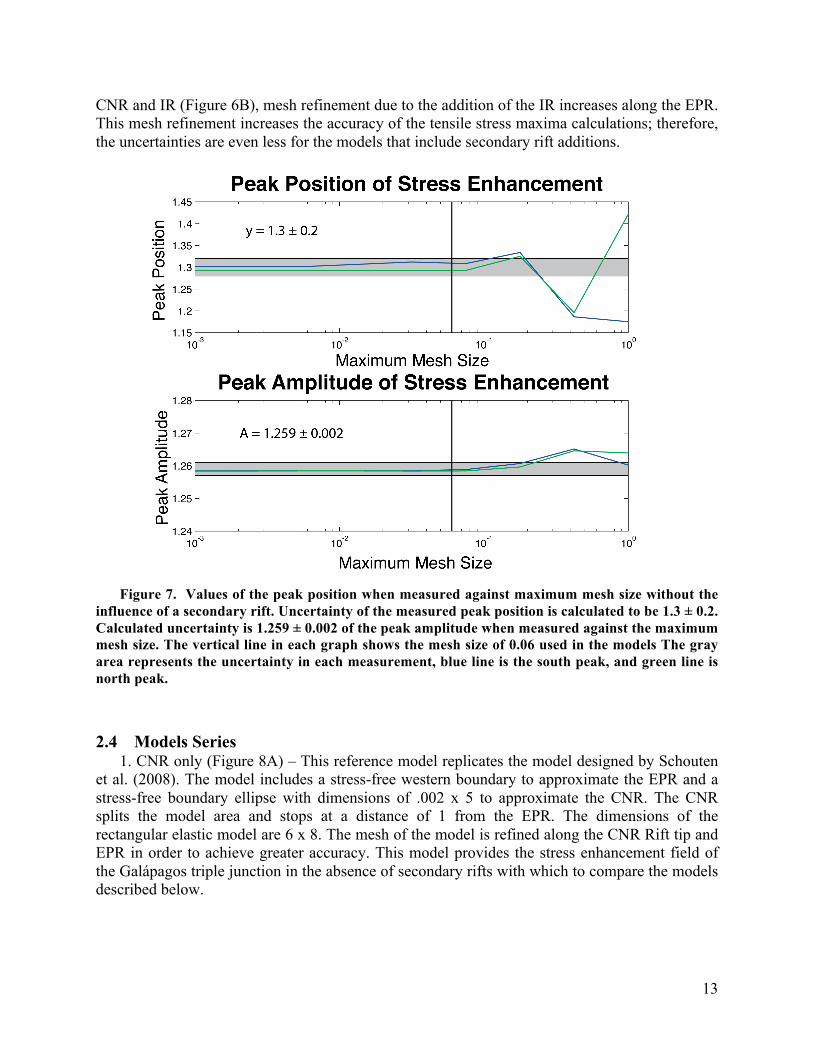
For the model that has only the CNR (Figure 6A), I observe that the peak position has a calculated uncertainty of 1.3 ± 0.2 when it is measured against the maximum mesh size and that the peak amplitude has a calculated uncertainty of 1.259 ± 0.002 when measured against the maximum mesh size (Figure 7). The vertical line in each graph represents the mesh size (0.06) that was chosen for the models and is sufficient for accuracy. For the model that has both the
13
CNR and IR (Figure 6B), mesh refinement due to the addition of the IR increases along the EPR. This mesh refinement increases the accuracy of the tensile stress maxima calculations; therefore, the uncertainties are even less for the models that include secondary rift additions.
Figure 7. Values of the peak position when measured against maximum mesh size without the
influence of a secondary rift. Uncertainty of the measured peak position is calculated to be 1.3 ± 0.2. Calculated uncertainty is 1.259 ± 0.002 of the peak amplitude when measured against the maximum mesh size. The vertical line in each graph shows the mesh size of 0.06 used in the models The gray area represents the uncertainty in each measurement, blue line is the south peak, and green line is north peak.
2.4 Models Series 1. CNR only (Figure 8A) – This reference model replicates the model designed by Schouten
et al. (2008). The model includes a stress-free western boundary to approximate the EPR and a stress-free boundary ellipse with dimensions of .002 x 5 to approximate the CNR. The CNR splits the model area and stops at a distance of 1 from the EPR. The dimensions of the rectangular elastic model are 6 x 8. The mesh of the model is refined along the CNR Rift tip and EPR in order to achieve greater accuracy. This model provides the stress enhancement field of the Galápagos triple junction in the absence of secondary rifts with which to compare the models described below.

14
Figure 8. Schematics of the numerical models used in the study. A: Reference model with only
the presence of the CNR. B: The addition of an IR that is connected to the EPR and moved north along the EPR to provide the tensile stress field for an attached secondary rift. This model best describes the current stress field of the 2°40’ N triple junction where the IR is attached to the EPR at ~ 1.4. C: The model series where the IR is detached by a distance of 0.2 and moved north along the EPR. D: A similar model series in which the distance between the detached IR tip and the EPR is decreased to 0.1.
2. Attached IR Series (Figure 6B) – Similar properties to the reference model, but with the addition of a secondary rift to represent the IR that is attached to the EPR. The dimensions of the stress-free IR ellipse are 0.4 x 0.002. In this series of models, I vary the position of the IR along the EPR from dy = 0.1 to dy = 3.1 in increments of .06. From these results, the tensile stress maximum peak position and amplitude are extracted from the stress profile graph. This series of models provides the tensile stress enhancement fields when the IR is attached to the EPR and represents the present stress field of the 2°40’ N triple junction.
3. Detached IR Series (Figure 6C & 6D) – This model series is similar to the Attached IR Series, but without a connection between the IR and EPR. Instead, the western tip of the IR is

15
displaced northward with a xIR = 0.2 (Figure 6C). Figure 6D is the same model series, but with a xIR value of 0.1. These series of models are used for analysis in the stress field when a secondary rift is detached from the EPR and provides where along the ridge a new rift will likely form as a function of rift position. The value of xIR is varied in order to analyze how the magnitude of the gap between the IR tip and EPR influences the stress enhancement along the ridge.
Both of the Detached IR model series are used to directly test the research hypothesis and investigate the possible relationship between the gap between a detached IR Rift and the EPR coupled with the gap between the CNR Rift tip and EPR. These two models are used to analyze the difference in peak amplitude and location along the EPR as a function of distance.
3 Results The results of the numerical models produce tensile stress enhancement maps and profiles of
the location of stress enhancements along the EPR as a result of varying rift locations (Figures 9 and 10). I assume that the highest peaks of tension enhancement are where new cracks will form along the EPR.
3.1 CNR Only Model A map of the tensile stress enhancement in the presence of the CNR but without a secondary
rift is presented in Figure 9A. The resulting pattern is a symmetrical stress field that is mirrored along the CNR axis. Directly ahead of the CNR tip, a region of reduced tension develops and two symmetric peaks of tensile stress enhancement form at ~ ± 1.35 along the EPR stress-free boundary (Figure 10A) This calculated stress pattern agrees with the previous geodynamic modeling of the Galápagos Triple Junction that suggests that the current geometry of the CNR tip creates a zone of tensile stress maxima at ± 1.4 along the EPR. (Schouten et al., 2008).
Figure 9. Stress enhancement maps of tension enhancement along the East Pacific Rise. A:
Tensile stress field in the presence of the CNR only. When the stress field is calculated without the
16
secondary rift present and the CNR stopping at distance of 1 from the EPR, reduced tension forms directly ahead of the CNR tip on the EPR and off-axis peaks of tensile stress maxima occur at ~ ± 1.35. B: Attached IR at 1.4 along the EPR. When a secondary rift is connected to the EPR, tensile stresses are released along the EPR boundary. C: Detached IR near 1.4 along the EPR. The detachment of a secondary rift creates a zone of reduced tension at the rift tip that prohibits its reconnection with the EPR. Two peaks of tension enhancement develop, offset from the detached rift. The new rift is assumed to form at the higher of the two peaks as a result.
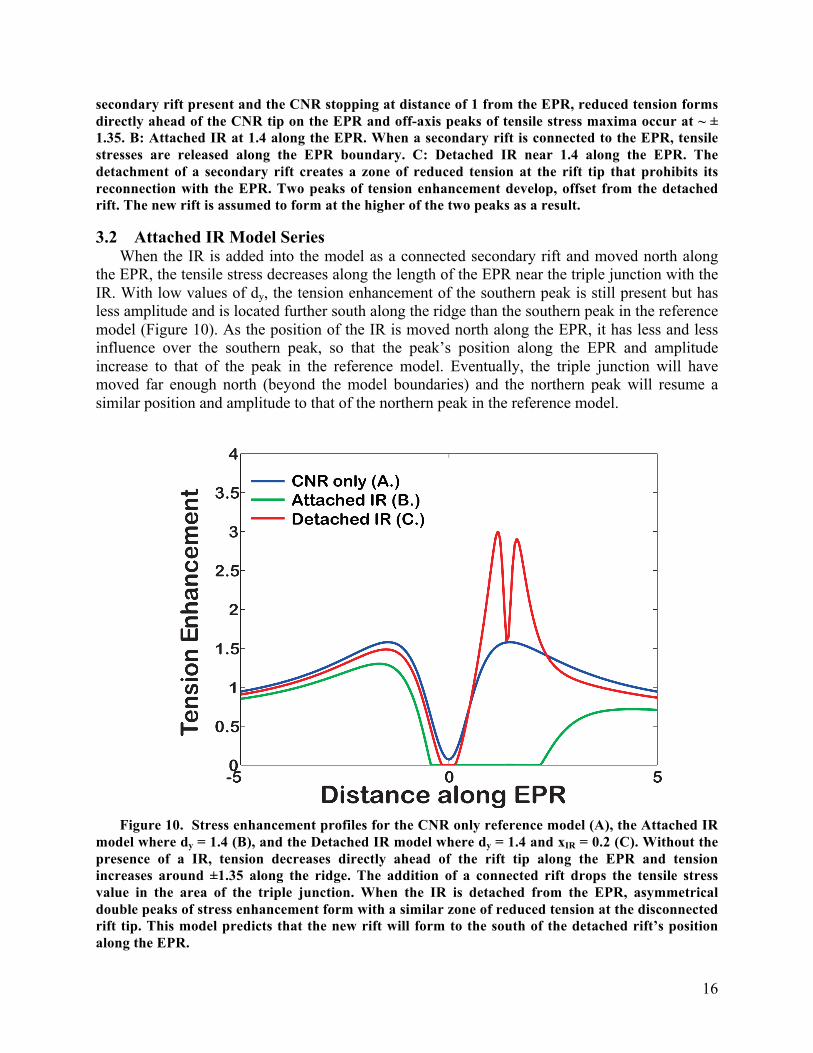
3.2 Attached IR Model Series When the IR is added into the model as a connected secondary rift and moved north along
the EPR, the tensile stress decreases along the length of the EPR near the triple junction with the IR. With low values of dy, the tension enhancement of the southern peak is still present but has less amplitude and is located further south along the ridge than the southern peak in the reference model (Figure 10). As the position of the IR is moved north along the EPR, it has less and less influence over the southern peak, so that the peak’s position along the EPR and amplitude increase to that of the peak in the reference model. Eventually, the triple junction will have moved far enough north (beyond the model boundaries) and the northern peak will resume a similar position and amplitude to that of the northern peak in the reference model.
Figure 10. Stress enhancement profiles for the CNR only reference model (A), the Attached IR
model where dy = 1.4 (B), and the Detached IR model where dy = 1.4 and xIR = 0.2 (C). Without the presence of a IR, tension decreases directly ahead of the rift tip along the EPR and tension increases around ±1.35 along the ridge. The addition of a connected rift drops the tensile stress value in the area of the triple junction. When the IR is detached from the EPR, asymmetrical double peaks of stress enhancement form with a similar zone of reduced tension at the disconnected rift tip. This model predicts that the new rift will form to the south of the detached rift’s position along the EPR.

17
Figure 11. Results from the Attached IR model series. When a secondary rift is added into the model and moved north along the EPR as an active triple junction, tensile stresses in the area of the triple junction are released. Both the position and amplitude of the stresses return along the ridge with values similar to the reference model after the IR has moved too far north to have an influence.
3.3 Detached IR Model Series When this IR is detached from the EPR by a distance 0.2, a double peak of stress
enhancement develops in response to the detachment with a similar zone of stress reduction found in the CNR only model. In Figure 10B, the IR is detached and located at 1.4 along the EPR axis. When the IR is detached at 1.4 along the EPR, an asymmetrical double peak of stress enhancement forms on either side of a zone of reduced tension. In this example where dy = 1.4, the southern peak is slightly greater in amplitude than the northern, which suggests that the new rift will form offset to the south from the detached rift. The zone of reduced tension at the detached rift tip will prohibit its reconnection with the EPR.

18
Figure 12. Results from the Detached IR model series when the gap between the EPR stress-free boundary and the IR is 0.2. A rift detaching before 1.13 near the EPR (orange vertical line), will have a higher northern peak and will be a right-stepping rift. Within 0.22 of either side of 1.13 along the EPR boundary rift amplitude is symmetrical. A detached rift after this transition will be a left-stepping rift due to a higher amplitude southern peak.
The results from the northward migration of the Detached IR are seen in Figure 12. The distance between the two tensile stress enhancement peaks stays constant along the EPR. When the rift ellipse is detached from the EPR stress-free boundary before 1.13, the northern peak has the higher amplitude, predicting a right-stepping rift sequence. At 1.13 ± 0.22 along the EPR, a zone of peak amplitude transition occurs between the peaks. Both amplitude peaks appear symmetrical within the window and north of this transitional region. After the peak transition, the southern peak has the higher amplitude and is predicting that rifts detaching at this position along the ridge will be left-stepping.
When the distance of the gap between the EPR boundary and the IR ellipse tip is decreased to 0.1, a similar result to the previous detached model series is calculated. When xIR = 0.1, the distance between the peak decreases, but stays constant with an increase in dy (Figure 13).

19
Figure 13. Results for the Detached IR model series when the gap between the IR rift tip and
EPR stress-free boundary is decreased to 0.1. A similar pattern to the Detached IR model series when xIR = 0.2 develops. The zone of peak amplitude symmetry occurs at 1.07 ± 0.13.
A similar window of peak amplitude transition occurs along the EPR boundary. At 1.07 ± 0.13 both the northern and southern peak amplitude have symmetrical tensile stress enhancement peaks. This model predicts that a rift detaching before 1.07 will be right-stepping to the north along the EPR and rifts detaching after 1.07 will be left-stepping to the south. When xIR is decreased from 0.2 to 0.1, the magnitude of the peak amplitude increases, suggesting a relationship between the distance between the detached rift with the EPR and the tension magnitude along the ridge.
4 Discussion of Results 4.1 History of rifting at the 2’40°N
I interpret these modeling results in terms of the evolution of rifting at the 2°40’ N triple junction and the resulting succession of ancient rift scars found to the northeast of the IR. The numerical models designed in this study suggest that these secondary rifts form as cracks at the 2°40’ N triple junction due to the symmetrical regional stress field created by the location of the CNR tip.
20
When the CNR is added into the 2D elastic models, a symmetrical stress field develops mirrored around the CNR. A zone of reduced tension forms directly ahead of the CNR tip and double symmetrical peaks of tensile stress maxima develop at ~ ± 1.35. Bathymetry of the region indicates that the IR is an active RRR triple junction found ~ 70 km north along the EPR which corresponds closely to ~ + 1.4 along the EPR and is in close agreement to the results presented by Schouten et al. (2008).
Around 20 NW-SE trending extinct rifts with similar orientations and elevated volcanic western ends are observed to the northeast of the 2°40’ N RRR triple junction. Based on the modeling results and the regional stress field created by the presence of the CNR, I propose that each of these ~20 rifts formed as cracks along the EPR and were each an active RRR triple junction. After a crack forms due to the increase in tensile stress enhancement, there is little or no stress along the EPR and no rift sequence develops, describing the current configuration of the 2°40’ N RRR triple junction.
4.2 Rift disconnection After the active secondary rift propagates eastward, it eventually becomes disconnected from
the EPR, perhaps due to a northward migration along the EPR away from the zone of regional stress enhancement coupled with reduced magmatism or abyssal hill formation that a stress perturbation of reduced tension forms at the IR rift tip which prevents reconnection with the EPR. After this disconnected secondary rift is rafted away from the EPR by the motion of the Pacific and Cocos plates, a double peak of stress enhancement develops along the EPR indicating where a new crack is likely to form offset from the disconnected rift. When the IR is detached at 1.4 from the EPR (Figure 10), the amplitude of the southern peak is greater and is therefore where cracking is most likely to occur along the EPR. This is an example of a left-stepping rift sequence where the younger rift will be offset to the left or south of the detached rift.
The symmetry of these two peaks of stress enhancement appears to be controlled by the regional stress field due to the presence and current geometry of the CNR tip. The numerical modeling suggests that if the CNR tip is distance D from the EPR and the distance from the detached rift and EPR is 0.2 that a zone of peak transition occurs at 1.13 ± 0.22 (Figure 12). This region along the EPR serves as a window of transition between the symmetry of the peaks. When rifts become disconnected within this window of transition, symmetrical peaks of stress enhancement form. This symmetry indicates that rifts detaching will alternate between left and right offsets and will produce little or no long-term secondary rift migration. These modeling results suggest that this zone of peak amplitude transition acts as a window of rift stability along the EPR.
If a secondary rift disconnects before the tensile stress maxima along the EPR, the new rift will form offset to the right from where the disconnected rift was attached to the EPR. Similar long-term disconnection events where the rifts detach south of the stability window create a right-stepping rift sequence where rifts will jump to north. In Figure 9C, the secondary rift is detached at 1.4, north of the window located at 1.13 ± 0.22. This detachment occurs north of the stability window and therefore the southern peak is favored and the new crack will form near 1 along the EPR (Figure 10C).
When the distance between the detached rift and the EPR (xIR) is changed from 0.2 to 0.1, the position of peak transition shifts to 1.07 with a stability window width of ± 0.13 (Figure 13).

21
This indicates that the distance between the detached rift tip and the EPR controls the width of the rift stability window and the magnitude of stress enhancement while the regional stress field, created by presence of the CNR tip, influences the location peak transition occurs along the EPR. This finding supports with my proposed research hypothesis that the location of rift formation at the 2°40’ N triple junction is controlled by the magnitude of the gap between the CNR rift tip and the EPR.
The interpretation by Schouten et al. (2008) along with my analysis of the current bathymetry of the 2°40’ N triple junction suggest that these NW-SE trending rifts have been jumping progressively to the southwest along the EPR. The models designed in this study predict that these rifts are detaching north of the proposed rift stability window and creating the left-stepping rift sequence reflected in the succession of left-stepping extinct secondary rifts (Figure 4). From the number of extinct rifts mapped between the IR and ER and the proposed 2 Ma age of the ER, it can be inferred that these short-lived northern triple junctions are detaching from the EPR roughly every 100,000 years.
4.3 Propagation of the Cocos-Nazca Rift These results of this study suggest that the sequence of extinct ancient rifts found northeast of
the 2°40’ N triple junction have recorded the kinematic history of the propagation of the CNR. In each of the models designed in this study, the presence of the CNR that stops at D or 50 km from the EPR in the modeling directly controls where along the EPR the stress enhancement formed. In the CNR only model, stress enhancements develop at ± 1.35. In both of the detached model series, the symmetry of the dual stress enhancement peak appears to be controlled by the regional stress field created by the CNR at distance D from the EPR. Depending of where a secondary rift detaches from the EPR, the new crack will form near this window of stress enhancement along the EPR. This observation was noted in all of the models and supports the research hypothesis that the magnitude of the gap between the CNR and EPR that controls the location of crack formation along the EPR.
Using both the magnitude and azimuth of these ~20 extinct rifts found to the northeast of the 2°40’ N triple junction, a kinematic evolution of the CNR can be calculated. Previous modeling of this triple junction shows that when the distance D is decreased so that the CNR tip is closer to the EPR, the triple junction becomes more unstable and the rift will be abandoned quicker. When D is increased, the stability of the triple junction is increased, and the crack will mature into a larger rift with a deeper and wider graben such as the large ER. The rifts with poorly defined graben are inferred to be short-lived rifts that were quickly abandoned and detached from the EPR. The azimuths of these detached rifts also appear to be connected with the propagation of the CNR. Schouten et al. (2008) observe that the westward-trending rifts were more stable triple junctions that were active for a longer period of time and southeast-trending rifts were more unstable and short-lived.
Other RRR triple junctions exhibit a similar complexity of seafloor deformation and exhibit histories of instability. The Bouvet triple junction in the southern Atlantic Ocean has retained its stability over the last 10 Ma through changes in triple junction geometry that evolve as stages between RRR, ridge-fault-fault (RFF), and ridge-ridge-fault (RRF) triple junctions (Ligi et al., 1999). The Rodriguez triple junction in the Indian Ocean has been stable for the past 40 Ma (Sclater et al. 1981; Patriat and Segoufin, 1988) and is characterized by the propagation of the Southwest Indian Ridge that creates a zone of focused distributed deformation. The propagation

22
of the ridge, similar to the CNR at the GTJ, is speculated to an influence over the distributed deformation surrounding the triple junction and the northward migration of the triple junction (Sauter et al., 1997). This RRR triple junction is observed to contain a similar area of lineations that cross-cut Central Indian Ridge-generated abyssal hills (Mitchell, 1991). Modeling results from this study might therefore pertain to this RRR triple junction and could be used to better understand the evolution of the Rodriguez triple junction. The kinematic stability of RRR triple junctions appears to be linked to the secondary ridges, transform faults, and microplates found in the vicinity of these triple junctions.
4.4 Suggestions for future work Until January of 2009, there has been little data collected in the vicinity of the 1°10’ N triple
junction and the Dietz Deep Rift. Future research would include an in-depth analysis of the recently collected multibeam bathymetry and magnetic data from the December/January WHOI-sponsored cruise to the 1°10’ N triple junction and the Galápagos microplate. In order to better understand the conditions that have favored the development, stabilization, and growth of the Dietz Deep Rift, further modeling of the stress fields would be needed to evaluate the relationship between stress fields and the distribution of secondary rifts on either side of the triple junction. The addition of the large seamount that is speculated to have stabilized the DDR (Lonsdale, 1988) to the models might provide some insight to determine its role in the tectonic evolution of the region.
It is yet to be determined whether stresses associated with the current location of the CNR tip that appear to be creating the instability of rifts in the north are a factor in the relative stability of the southern triple junction. The CNR only model contains a symmetrical stress field and therefore the model predicts the existence of similar transient extinct rifts near the 1°10’ N triple junction. Analysis of the recent dataset noting offsets between the rifts and their azimuths would be helpful in determining the complex evolution of the Galápagos triple junction.
The question of why the IR-like rifts are disconnecting from the EPR is another question that could be addressed with further research. At some point at the 2°40’ N triple junction, the secondary rift will have migrated north along the EPR and becomes disconnected from the EPR and a new rift will form to the south creating the southward-jumping rift sequence that is currently observed within the seafloor fabric. For a more refined understanding of rift evolution at the 2°40’ N triple junction, spatial analysis of the rift tip position and azimuth should be further analyzed.
5 Summary This study investigates the Galápagos triple junction, a tectonically complex ridge-ridge-
ridge triple junction with asymmetric triple junctions located at 2°40 N and 1°10’ N along the East Pacific Rise. There is a succession of 20+ extinct secondary rifts found to the northeast of 2°40 N triple junction.
I propose that each of these rifts were short-lived RRR triple junctions that were detached from the EPR and then rafted away by the motion of the Pacific and Cocos plates. The models suggest that once a secondary rift becomes disconnected from the EPR, that a decrease in tensile stress develops directly ahead of the detached rift tip and prevents its reconnection with the EPR. Depending on where a rift detaches from the EPR, an asymmetric double peak of stress enhancement develops along the EPR with the location of the regional stress maxima

23
determining the position of the higher peak and a new triple junction will form as a crack at this peak.
I find that the location of the CNR tip creates a stability window of rift migration along the EPR. The stability window is a transition between left-stepping and right-stepping rifts with the position of the window being controlled by the distance between the CNR rift tip and the EPR and the width of the window is controlled by the distance from the detached rift tip and EPR. When a rift disconnects south of this stability window, the new crack will form offset to the right of the disconnected rift. These right-stepping rifts create a northward migration along the EPR. Rifts disconnecting within this stability window show little or no long-term migration. When a rift disconnects north of the stability window, the new rift will form to the south creating a left-stepping rift sequence. Analysis of the bathymetry in the region indicates that there has been a succession of southward jumping rifts suggesting that rifts are disconnecting to the north. I propose that the sequence of extinct rifts found to the northeast of the 2°40’ N triple junction represents a series of rift disconnection events and their position records the kinematic history of the gap between the EPR and the Cocos-Nazca Rift. Ridge-ridge-ridge triple junctions represent rapidly evolving and complex plate boundaries where the local mechanical instability at the triple junction contributes to the long-term kinematic stability.
24
6 Acknowledgments I would like to express a debt of gratitude to my advisor, Laurent Montési, for all of the assistance and guidance he has provided me with throughout this study. I also thank Wenlu Zhu, Hans Schouten, Debbie Smith, and Joe Cann for their help in teaching me how to decipher seafloor morphology, Woods Hole Oceanographic Institution’s Department of Geology & Geophysics for the invitation on the research cruise to the Galápagos triple junction, University of Maryland’s Department of Geology, Phil Candela for insight on scientific writing, and Susannah Parnin for the figures.

25
7 References Bird, R.T. and Naar, D.F., 1994, Intratransform origins of mid-ocean ridge microplates:
Geology, v. 22, p. 987-990.
Bird, R.T., Tebbens, S.F., Kleinrock, M.C., and Naar D.F., 1999, Episodic triple-junction migration by rift propagation and microplates: Geology, v. 27, p. 911-914.
Cronin, V.S., 1992, Types and kinematic stability: Tectonophysics, v. 207, p. 287-301. DeMets, C., Gordon, R.G., Argus, D.F., and Stein, S., 1994, Effect of recent revisions to the
geomagnetic reversal time scale on estimates of current plate motions: Geophysical Research Letters, v. 21, p. 2191-2194.
Klein, E.M., Smith, D.K., Williams, C.M., and Schouten, H., 2005, Counter-rotating microplates at the Galápagos triple junction: Nature, v. 433, p. 855-858.
Ligi, M., Bonatti, E., Bortoluzzi, G., Carrara, G., Fabretti, P. Gilod, D., Peyve, A.A., Skolotnev, S. and Turko, N., 1999, Bouvet Triple Junction in the South Atlantic: Geology and evolution, Journal of Geophysical Researches, v. 104, p. 29,365–29,385.
Lonsdale, P., 1988, Structural patterns of the Galapagos microplate and evolution of the Galapagos triple junction: Journal of Geophysical Research, v. 93, p. 13,551-13,574.
Lonsdale, P., Blum, N., and Puchelt, H., 1992, The RRR triple junction at the southern end of the Pacific-Cocos East Pacific Rise: Earth and Planetary Science Letters, v. 109, p. 73-85.
McKenzie, D.P., and Parker, R.L., 1967, The North Pacific: An example of tectonics of a sphere: Nature, v. 216, p. 1276-1280.
McKenzie, D.P., and Morgan, W.J., 1969, Evolution of triple junctions: Nature, v. 224, p. 125-133.
Menke, William, Plate motion calculator, www.ldeo.columbia.edu/users/menke/plates.html.
Mitchell, N.C., 1991, Distributed extension at the Indian Ocean triple junction: Journal of Geophysical Research, v. 96, p. 8019-8043.
Mitchell, N.C., and Livermore, R.A., 1998, The present configuration of the Bouvet triple junction: Geology, v. 26, p. 267-270.
Patriat, P., and Courtillot, V., 1984, On the stability of triple junctions and its relation to episodicity in spreading: Tectonics, v. 3, p. 317-332.
Patriat P., and Segoufin, J., 1988, Reconstruction of the Central Indian Ocean: Tectono- physics, v. 155, p. 211-234.
Schouten, H., Smith, D.K., Montési, G.J., Zhu, W., and Klein, E.M., 2008, Cracking north of the Galapagos triple junction: Geology, v. 36, no. 5, p. 339-342.
Sclater, J.G., Fisher, R.L., Patriat, P., Tapscott, C., and Parsons, B., 1981, Eocene to recent development of the Southwest Indian Ridge, a consequence of the evolution of the Indian Ocean triple junction: Geophys. J.R. Astr. Soc., v. 64, p. 587-604.