RIDLEY CORPORATION ANNUAL REPORT 2006 · producing high performance animal nutrition products for...
114
RIDLEY CORPORATION ANNUAL REPORT 2006
Transcript of RIDLEY CORPORATION ANNUAL REPORT 2006 · producing high performance animal nutrition products for...

RIDLEYCORPORATION
ANNUAL REPORT2006

CONTENTS 2 FIVE YEAR SUMMARY
4 CHAIRMAN’S REVIEW
5 MANAGING DIRECTOR’S REVIEW
8 SUMMARY OF OPERATIONS
10 FINANCIAL REVIEW
14 REVIEW OF OPERATIONS
20 SUSTAINABILITY REPORT
28 BOARD OF DIRECTORS
30 CORPORATE GOVERNANCE REPORT
34 REMUNERATION REPORT
46 DIRECTORS’ REPORT
50 AUDITOR’S INDEPENDENCE DECLARATION
51 FINANCIAL REPORT
109 INDEPENDENT AUDIT REPORT
110 SHAREHOLDER INFORMATION
112 CORPORATE DIRECTORY
RIDLEY CORPORATION LIMITEDABN 33 006 708 765
2006
PERF
ORM
ANCE
06 05 04 03 02
EBIT $MILLION
77.1
71.3
47.3
53.4
59.7$59.7m
06 05 04 03 02
NET PROFIT BEFORE SIGNIFICANT ITEMS $MILLION
32.2
37.2
20.5
30.7
27.7$27.7m
06 05 04 03 02
DIVIDENDS PER SHARE CENTS
4.50
5.75
5.75
6.50
7.007.00c
THE RESULTS FOR 2005 AND 2006 ARE
REPORTED UNDER AIFRS, WHILE THOSE PRIOR TO 2005 ARE
REPORTED UNDER PREVIOUS ACCOUNTING
STANDARDS.

RIDLEY CORPORATION MANUFACTURES AND MARKETS SALT, STOCKFEED AND ANIMAL FEED SUPPLEMENTS
THE THREE OPERATING DIVISIONS ARE: RIDLEY AGRIPRODUCTS – the largest manufacturer and marketer of stockfeed in Australia, producing high performance animal nutrition products for the beef, dairy, pig, poultry, horse, sheep, pet food and aquaculture industries.
CHEETHAM SALT – Australia’s largest producer and refi ner of salt. It supplies a range of food, industrial and agricultural markets throughout Australia, Asia and the Pacifi c.
RIDLEY INC – one of North America’s leading commercial animal nutrition companies. It manufactures and distributes a full range of animal nutrition products under a number of highly regarded trade names.
2006 FEATURES• Operating earnings before interest, tax and Canadian legal claim costs up 15%• Strong recovery in Canada• Continuing improvement in Australian Feeds• Dry Creek acquisition performing well• Ongoing Canadian legal claim costs• Borrowing costs and tax expense higher• Full year dividend up 8% to seven cents per share
1

5 YE
AR
SUM
MAR
YRI
DLEY
AGR
IPRO
DUCT
SCH
EETH
AM S
ALT
RIDL
EY IN
C
06 05 04 03 02
VOLUME MILLION TONNES
1.51.5
1.4
1.6
1.7
06 05 04 03 02
EBIT $MILLION
16.0
20.2
7.0
15.615.9$15.9m
06 05 04 03 02
VOLUME MILLION TONNES0.
50.6
0.5
0.6
1.2$23.1m 1.2m
06 05 04 03 02
EBIT $MILLION
20.4
21.9
19.6
19.0
23.1
06 05 04 03 02
EBIT $MILLION
45.6
35.8
27.4
27.3
30.5
06 05 04 03 02
VOLUME MILLION TONNES
1.61.6
1.51.51.5
$30.5m
1.5m
THE RESULTS FOR 2005 AND 2006 ARE
REPORTED UNDER AIFRS, WHILE THOSE PRIOR TO 2005 ARE
REPORTED UNDER PREVIOUS ACCOUNTING
STANDARDS.
1.7m
2
$’000 2006 2005 2004 2003 2002
OPERATING RESULTS Sales revenue 1,258,675 1,153,872 1,179,348 1,410,888 1,408,284Other revenue 5,074 4,770 8,714 7,605 14,755Earnings before interest, tax, depreciation and amortisation (EBITDA)* 81,493 72,922 70,776 98,764 105,947Earnings before interest and tax (EBIT)* 59,683 53,361 47,278 71,344 77,062Net borrowing costs 13,867 9,876 10,720 13,046 17,747Operating profi t before tax* 45,816 43,485 36,558 58,298 59,315Tax expense* 12,087 7,776 11,828 14,616 20,720Net profi t before signifi cant items 33,729 35,709 24,730 43,682 38,595Minority interest (MI) 6,040 5,012 4,240 6,449 6,400Net profi t before signifi cant items after MI 27,689 30,697 20,490 37,233 32,195Signifi cant items – net of tax and MI – 9,272 (2,790) (5,935) –Net profi t after tax and signifi cant items 27,689 39,969 17,700 31,298 32,195
FINANCIAL POSITION Ridley shareholders’ funds 338,197 305,461 319,049 317,644 302,931Minority interest 55,873 45,968 49,573 47,574 48,770Total assets 776,909 715,992 657,490 702,775 766,271Total liabilities 382,839 364,563 288,868 337,557 414,570Funds employed 573,542 514,868 467,096 491,510 531,828
KEY RATIOS Net debt/EBITDA (times) 2.1 2.3 1.7 1.5 1.8EBITDA/net interest (times) 6.3 8.0 6.6 7.6 6.0Net debt/shareholders’ equity 43.5% 46.7% 33.4% 41.2% 54.9%Return on shareholders’ funds* 8.6% 10.5% 6.4% 12.0% 11.1%
OTHER INFORMATION Dividends per share (cents) 7.00 6.50 5.75 5.75 4.50EBITDA per share* (cents) 29.4 26.9 26.4 37.1 43.2Net tangible asset backing per share (cents) 100.9 93.5 104.4 103.7 96.3Earnings per share* (cents) 10.0 11.3 7.7 14.0 13.1Number of ordinary shareholders 8,610 9,572 11,075 11,859 13,420Employees 2,115 2,142 2,064 2,109 2,299* Before signifi cant items
3

CHAI
RMAN
’
REVI
EW
Directors have declared an increased fi nal dividend of 3.50 cents, which is 50% franked. This compares to a fi nal dividend of 3.25 cents per share last year, which was also 50% franked. The full year dividend of 7.00 cents per share is up 8% compared to last year’s 6.50 cents per share.
A highlight of the year was the progress made in our safety initiatives across the Company. In both Australia and North America we have been working with DuPont, a multinational company that is recognised as a leading authority in implementing disciplined operating systems, particularly in the area of behavioural safety management. The aim of these initiatives is to heighten employees’ awareness of the importance of working safely and modify behaviour to produce continuous improvement in safety metrics.
I am pleased to report that the involvement of Ridley Corporation in the law suits in Canada is at an end, although the Government of Canada and our 69% owned subsidiary, Ridley Inc, are still defendants to the actions commenced in April 2005. The Managing Director comments more fully on the Canadian law suits in his review.
Shareholders can rest assured that the Board will continue to work closely with managment in the coming year to strike a careful balance between ensuring that Ridley Inc is not distracted by the continuing action against it and that the Board are kept fully informed of developments and costs.
In August 2006 the Board appointed director Rick Lee to the role of deputy chairman. Rick’s wise counsel and deep experience in the fi nance and agricultural industry garnered from 16 years in CSR’s sugar division and his role as former chief executive of NM Rothschild Australia Group, is much appreciated by his fellow directors. We look forward to the direction he will bring in this new role.
We noted with disappointment the collapse of the WTO’s Doha talks and subsequent suspension of negotiations
in late July when the EU, US and G20 failed to agree on cutting farm subsidies and industrial tariffs. At the time of writing, trade ministers are planning to meet in Cairns in September in a fi nal attempt to revive the talks.
Overall, Australia has made little progress in terms of the WTO, especially as regards agriculture. However, we’ve watched with more than passing interest the range of initiatives on alternative fuels globally and the major government encouragement given to biofuel production in North America and Europe which will, at a minimum, fl ow through as an indirect subsidy to agriculture. The biofuels industry internationally will impact demand and prices for grain and oil seed crops, and these effects will fl ow through to the intensive livestock sectors. We are following these developments with interest.
In a year that has not been without its diffi culties, I extend the thanks of all Board members to Matthew Bickford- Smith, his executive team and Ridley staff for their contribution and look forward to being able to put the current challenges behind us, so we can focus on growing what has long been a fundamentally excellent company.
JOHN S KENIRY CHAIRMANOUR RESULTS WERE IN LINE WITH OUR
EXPECTATIONS AND ONCE AGAIN, WERE ACHIEVED AGAINST A BACKGROUND IN THE FEED INDUSTRY OF UNCERTAINTIES ASSOCIATED WITH BIRD FLU, BSE AND COST INFLATION.
In Ridley Inc, we saw a strong recovery in the Canadian Feed Operations. In Australia, our Ridley AgriProducts business continued to improve and our Cheetham Salt business benefi ted from the good performance of the Dry Creek salt fi eld acquired in May 2005. While operating earnings for each of the three divisions improved on last year, the after tax result was impacted by legal costs associated with the Canadian legal claims, increased borrowing costs and increased tax expense.
S
4

cattle farmers who allegedly suffered damage when international bans on the importation of Canadian beef and cattle were introduced after a cow was diagnosed with BSE in Alberta in May 2003.
Although there is now no action against Ridley Corporation Limited, our 69% subsidiary Ridley Inc is still a defendant, and in the spirit of our consistent policy to make deliberate and clear disclosure to shareholders about the Canadian law suits, let me summarise where the actions against Ridley Inc stand.
The actions against Ridley Inc are most active in Ontario and Quebec, but these are still only at a preliminary stage. There will only be a hearing of the merits of the claims after the actions have been certifi ed or authorised as appropriate to proceed to trial as class actions. The plaintiffs must overcome signifi cant legal and factual hurdles to succeed in their claims, which are not readily recognised under Canadian law. The actions fi led in the other two Canadian provinces of Saskatchewan and Alberta are in abeyance.
Later this year, the Ontario Court of Appeal is expected to hear Ridley Inc’s appeal against a decision that refused to strike out the actions against it, together with appeals by the Government of Canada and the plaintiffs against other aspects of the same decision; and in Quebec, the Superior Court of Quebec will consider if the actions should be authorised to proceed as a class action.
MAN
AGIN
DI
RECT
OR’
REVI
EWDESPITE SOME LACK OF EARNINGS VISIBILITY IN THE FIRST FEW MONTHS OF THE YEAR DUE TO SEVERE WEATHER CONDITIONS, RIDLEY’S BOTTOM LINE RESULT WAS IN LINE WITH THE GUIDANCE GIVEN TO THE MARKET OVER THE COURSE OF THE YEAR.
While the result was at the lower end of guidance given at last year’s AGM, it was achieved despite our businesses having to deal with a number of challenges. These included somewhat abnormal seasons, particularly in Australia and the southern parts of the US, and ongoing energy cost increases combined with higher labour costs in some parts of Australia and Canada. A signifi cant proportion of these costs were not unexpected and a focus on cost containment has meant they have been carefully managed and, in the main, absorbed.
Before providing further detail of 2006, I would like to congratulate all the divisions for the considerable gains achieved in safety performance. Our feed businesses in Australia and North America, have to contend with the challenges of multiple sites, an ageing workforce and a signifi cant amount of manual handling. During the year all divisions recorded signifi cant improvements in their safety metrics. Further details are provided in the sustainability report on page 20.
The involvement of Ridley Corporation Limited in the Canadian law suits was brought to an end earlier this year when the actions against it were struck out, or discontinued by agreement in all provinces. Although Ridley Corporation agreed not to claim costs, it did not pay any moneys to the class representatives, their lawyers, or any other third party.
The Government of Canada and Ridley Inc, a 69% owned subsidiary of Ridley Corporation Limited, remain as defendants. The law suits were commenced in four Canadian provinces in April 2005, and seek to certify a class action to include all Canadian
G S
5

MAN
AGIN
DI
RECT
OR’
REVI
EW
[To ensure that Ridley Inc is not distracted from its day-to-day business and delivers results to shareholders, the law suits are carefully managed by segregated senior staff. This year, the legal costs were below our estimate, and will continue to be controlled by disciplined planning and rigorous monitoring.
I would like to congratulate all the divisions for the considerable gains achieved in safety performance. During the year all divisions recorded signifi cant improvements in their safety metrics.
Management changes during the year included the appointment of John Murray, who joined Cheetham Salt as Chief Executive Offi cer in December 2005. John has an extensive background of senior management experience in the food, industrial and agribusiness sectors. He was previously Group General Manager, International Operations with Elders and prior to that Managing Director of the South Australian-based grain business AusBulk. We have ambitious plans for Cheetham and we look forward to working with John over the coming years.
While we have never used climatic conditions as an excuse for poor performance, this year our results were held back by factors outside our control, some climatic and some due to the three hurricanes that devastated parts of the southern US, earlier this year. In Australia, parts of our operations, particularly our Queensland operations, faced labour-related challenges in the course of the year. The Australian commodity boom has drawn people and resources toward the mining sector, creating an intensely competitive labour
market, generating signifi cant employee turnover and, consequently, skills shortages and wage infl ation, specifi cally in Queensland and Western Australia.
As a result, management has been focused on cost control to counter some of the infl ationary pressures, and on expanding market share to position the Company well for the future. In Ridley AgriProducts the acquisitions we made this year, totalling $7million were part of our strategy to selectively expand our presence in the supplementary feed market.
These acquisitions followed on from the decision to substantially upgrade the Ridley Agriproducts feed supplements plant at Wacol, just outside Brisbane, and were combined with a reinvigorated approach to the marketing and branding of our products.
During the year we assessed a number of quite signifi cant projects in Australia and largely as a result of higher valuations placed on these businesses, typically by private equity, we have in most cases decided to step back from the process.
In Cheetham Salt we are part way through a signifi cant supply chain initiative designed to reduce warehousing and distribution costs. The way we go to market in the swimming pool sector has been overhauled with a fresh approach to our marketing strategy and important decisions will soon be made as to how we are going to approach marketing salt into South East Asia for the long term.
In North America opportunities on both sides of the US/Canadian border exist for further rationalisation of the feed industry. This should come as no surprise. The last two years have seen the feed industry having to grapple with various disease outbreaks, the closure of the border, and the resultant distortion to the North American intensive livestock industry.
G S
6

The increase in the price of oil and its impact on the renewable fuels sector, presents Ridley with opportunities as well as some threats. It is an opportunity to the extent that the by-products produced by the biofuels industry can potentially be used in some parts of our business. At the same time, both Ridley and our customers are signifi cant users of these raw materials, such as soy beans for biodiesel, and corn and molasses for ethanol.
For most of the year, the majority of our customers have enjoyed reasonably favourable production economics, relatively cheap key input ingredients and prices at a premium to prior years for the markets they sell their products into.
For most of the year, the majority of our customers have enjoyed reasonably favourable production economics, relatively cheap key input ingredients and prices at a premium to prior years for the markets they sell their products into.
The majority of the key species markets of importance to Ridley AgriProducts have enjoyed what in historical terms would be considered reasonably stable terms of trade. However, there are indications that international dairy markets are easing slightly with the milk/feed price ratio reducing somewhat. The dairy sector has continued to recover from the 2003 drought although milk production has still not reached 2003/04 levels. The Australian pig herd is likely to continue to, at best, remain static. Broiler sales are expected to continue growing at approximately 3%, per annum while the layer sector has struggled with an oversupply of eggs. For the beef industry,
the timing and implications for Australia of North America’s re-entry to the North Asia market is unclear.
In North America, production economics in the cattle, hog and poultry industries have been favourable throughout the year despite grain prices and other inputs trading above long term trends.
Ridley is expecting another positive year. This will be delivered by: a continued and relentless drive towards best practice management of safety; growing market share in specialised, high margin sectors; a continued prudent allocation of capital; and the avoidance of all waste.
To conclude, I would like to thank everyone at Ridley for their efforts during the year and look forward to your continued support and enthusiasm in the coming year.
MATTHEW P BICKFORD-SMITH MANAGING DIRECTOR AND CHIEF EXECUTIVE OFFICER[
UPGRADING THE FEED SUPPLEMENTS PLANT AT WACOL JUST OUTSIDE BRISBANE IS PART OF RIDLEY AGRIPRODUCTS’ STRATEGIC FOCUS TO EXPAND ITS PRESENCE IN THE FEED SUPPLEMENTS MARKET.
IN OUR CANADIAN FEED BUSINESS, THE REOPENING OF THE US/CANADA BORDER TO SOME LIVE CATTLE SHIPMENTS, COMBINED WITH AGGRESSIVE SALES AND MARKETING, PRODUCED AN INCREASE IN SALES VOLUMES.
7

SUM
MAR
Y OF
OP
ERAT
ION
• Operating EBIT increased to $15.9 million, up 9%
• Sales up 11%
• Volumes up 9%
• Gross margin per tonne up 6%
• CCD Animal Health and Nutrition earnings up 20%
• Earnings increased by 22% to $23.1 million
• Dry Creek contributed $5.8 million to earnings improvement
• Sales up 21%
• Volume excluding Dry Creek up 1%
• US Feed Operations
− EBIT up 13%
− Sales up 4%
− Volumes down 1%
− Gross margin per tonne up 4%
• Canadian Feed Operations
− EBIT up 115%
− Sales up 10%
− Volumes up 5%
− Gross margin per tonne up 3%
• Ridley Nutrition Solutions
− EBIT down 13%
− Sales up 11%
− Volumes up 9%
PERFORMANCE SUMMARY
RIDL
EY A
GRIP
RODU
CTS
CHEE
THAM
SAL
TRI
DLEY
INC
S
8

• Growth in dairy and poultry volumes
• Bolt-on acquisitions $7 million
• Specifi c focus on supplements business
• Increasing direct farm purchasing
• Increased capacity utilisation in southern Australia
• Increased labour and energy related costs
• CCD Animal Health and Nutrition improved due to agency arrangements and increased sales volumes
• Signifi cant improvement in safety performance
– LTIFR down 17%
– MTIFR down 37%
– Duration rate down 42%
• Brand rationalisation substantially in place
• Wacol production upgrade scheduled for completion early 2007
• Enhanced biosecurity measures in place, in particular for avian infl uenza
• Streamlined additive purchasing
• Wider range of raw materials used
• Achieve a 24% reduction in LTIFR
• Progress on ERP systems upgrade
• Review asset confi guration
• Complete brand rationalisation
• Construct liquid feeds facility in Queensland
• Complete upgrade of Wacol supplements facility
• Dry Creek, acquired in May 2005, performing in line with expectations
• Labour and energy related cost increases
• Cost recovery/margins improving in second half
• New CEO appointed December 2005
• Lower volumes to Queensland agriculture sector
• LTIFR down from 6.0 to 1.8
• National Customer Service Centre established
• Japanese business moved to profi tability with improved market penetration in retail sector
• Dry Creek acquisition successfully integrated
• Major sites achieved ISO 14001 accreditation
• Maintain LTIFR target at <5.0
• Complete warehouse construction at Price and Bajool
• Further organically grow Japanese and Indonesian businesses
• Implement strategies to increase salt production capacity in line with market demand
• US Feed Operations
− Stable customer environment
− Improved margins
− Cost reduction program benefi ts
• Canadian Feed Operations
− Improved margins and volumes
− Cost reduction program benefi ts
− Border reopened
• Ridley Nutrition Solutions
− Molasses availability/prices
− Transport disruptions
− Energy costs
− New equine mill
• Reduction of 37% in LTIFR, and a 44% reduction in total recordable injury rates
• Ongoing development and implementation of Safety First program
• Acquisition of remaining 49% share in premium equine feed manufacturer McCauley Bros completed
• Strong cash fl ow and disciplined capital spending
• Achieve a further 15% improvement in both LTIFR and total recordable injury rates
• Continue to work towards goal of creating culture that places highest priority on safety of employees and contractors
• Launch biodegradable feed container for low moisture blocks in October 2006
• Increase strategic focus on achieving earnings growth within successful ingredients and block business
• Progress on ERP systems upgrade
FEATURESPROGRESS AGAINSTPRIORITIES
KEY OBJECTIVES THIS YEAR
9

FINA
NCIA
L RE
VIEW
OVERVIEWImproved operating earnings from each of Ridley’s divisions, Ridley AgriProducts, Cheetham Salt and Ridley Inc led to EBIT increasing by 12% over last year. Cash fl ow generation remained strong, with EBITDA also increasing by 12% to $81.5 million. Dividends have been increased by 8% to 7.00 cents per share.
As a result of adopting the Australian equivalents to International Financial Reporting Standards (AIFRS), all of the relevant comparative numbers for last year have been restated.
EARNINGS PERFORMANCEOn an AIFRS basis, net profi t before signifi cant items for the year was $27.7 million. This was 10% down on the adjusted $30.7 million result of last year. The improved operating result was impacted by legal costs associated with the Canadian legal claims, which totalled $1.7 million (net of tax and minority interest), and higher interest costs and income tax expense.
2006 2005 $’000 $’000
Sales revenue 1,258,675 1,153,872EBIT 59,683 53,362Less: Net borrowing costs 13,867 9,876Operating profi t before tax 45,816 43,486Less: Tax expense 12,087 7,777Minority interest 6,040 5,012Net profi t from operations 27,689 30,697Signifi cant item – net – 9,272Net profi t 27,689 39,969
EARNINGS BEFORE INTEREST AND TAX (EBIT)EBIT for the year was $59.7 million, up 12% on last year’s restated $53.4 million. Improved performances from each of our operating divisions contributed to this result.
For Ridley AgriProducts, an increase in volumes was the main factor in the higher earnings of $15.9 million, which was 2% over last year’s restated $15.6 million. (Last year’s result benefi ted from the inclusion of $1.0 million net proceeds received on the establishment of a joint venture. Allowing for this, operating EBIT was up by 9%.) Feed volumes overall increased by 9% with improvements in sales to the dairy and poultry sectors, only partly offset by lower beef volumes refl ecting good pasture conditions particularlyin Queensland.
Salt Division earnings increased by 22% to $23.1 million compared to last year’s restated $19.0 million. The earnings improvement was driven by the contribution from the Dry Creek salt fi eld, which was acquired in May 2005. This increased current year’s earnings by $5.8 million over last year. Lower volumes to the Queensland stockfeed sector and exports, together with increased freight and energy costs, held back earnings in other parts of the business compared to last year. Equity profi ts from Ridley’s joint venture operations (principally the Salpak salt marketing business in Australia and Dominion Salt in New Zealand) were virtually unchanged from last year at $5.9 million.
10

US Feed Operations earnings grew 13% to $17.1 million over the restated $15.2 million of last year (in US dollars, EBIT was US$12.7million, up 12%). Although volumes were slightly down on last year (1%) due to the mild winter and a warm and dry spring, improved margins overall and ongoing cost control programs implemented last year were able to keep 2006 expenses below prior year levels, despite increasing labour and energy costs. Last year’s result was positively impacted by $3.3 million relating to the settlement of claims made against ingredient suppliers in earlier periods.
Dividends were increased to 7.00 cents per share, 50% franked. This is up from 6.50 cents per share (50% franked) last year.
In Canada, earnings more than doubled to $10.0 million compared to a restated $4.7 million last year (in Canadian dollars, EBIT was C$8.7 million, compared to C$4.3 million last year). The improvements followed the reopening of the US/Canadian border to some live cattle shipments, and the resolution of issues surrounding countervailing duties for hogs into the US. Volumes increased by 5% and margins improved, refl ecting improved customer economics, particularly in the beef and pork sectors. Bad debt provisions were $1.6 million lower this year compared to last, and the business experienced more stable ingredient markets with the benefi ts of the cost reduction program which was implemented last year.
Our Ridley Nutrition Solutions business had earnings of $9.6 million, which were down 13% on last year’s restated $11.0 million. Molasses supply problems and transport disruptions, due to hurricanes in the fi rst half of the year,
resulted in reduced margins and higher operating costs for the Sweetlix business. Start-up costs associated with a new equine mill adversely affected the Equine Nutrition business. These were somewhat offset by more stable conditions in the second half of the year and improved volumes (up 7%) in the traditional low moisture block operation.
Unallocated costs, which include corporate offi ce costs in Australia and North America, as well as the costs associated with the Board, stock exchange listings and compliance costs increased from a restated $12.1 million to $16.1 million. Legal costs incurred in defending the Canadian law suits increased by $1.9 million to $3.0 million while a number of one-off expenses including redundancies, increased audit fees (due to AIFRS and Sarbanes-Oxley compliance), and tax consulting charges increased costs by approximately $1.0 million.
In 2005, our entry into the Tax Consolidation System produced a one-off tax benefi t of $9.3 million. This was recorded as a signifi cant item in that year.
FINANCE COSTSFinance costs for the year were higher than in 2005 due to the acquisition of the Dry Creek salt fi eld in May 2005 and resulting higher debt levels. Net interest expense (including borrowing costs) for the year was $13.9 million, $4.0 million higher than last year, with borrowing costs for the year averaging 6.7%, in line with last year.
DIVIDENDSDividends were increased to 7.0 cents per share, 50% franked. This is up from 6.5 cents per share (50% franked) last year.
INCOME TAXIncome tax expense for the year was higher than last year (excluding the signifi cant item), partly due to the higher overseas earnings, which are taxed at higher rates than in Australia. Total income tax of $12.1 million averaged 30% of pre-tax earnings (excluding associate income) compared to $7.8 million and 21% last year.
CASH FLOWBefore working capital movements and acquisition spending, we generated $29.4 million of cash fl ow for the year. Working capital increased by $22.8 million as it returned to more normal levels compared to last year. This overall increase was aided by higher earnings and lower tax payments, partly offset by increases in capital expenditure (up from $22.9 million last year to $26.3 million) and interest payments, which were $3.1 million higher than last year.
This year we spent $10.2 million on some minor bolt-on acquisitions, notably the assets of Teangi Stockfeed in Victoria, Primix in North Queensland and the remaining 49% of McCauley Bros in Kentucky.
Net debt levels increased by $7.4 million during the year. Acquisition funding of $10.2 million and unfavourable currency movements of $3.8 million on the translation of US and Canadian denominated debt to Australian dollars was partly offset by cash debt repayments of $6.6 million.
The collection and control of receivables remains a key focus for us. Days sales of receivables outstanding at year-end were 29 days, the same as last year. One day’s sales represents approximately $3.4 million in revenue.
[
11

BALANCE SHEET AND KEY RATIOS 2006 2005 $’000 $’000
Gross bank and other debt 178,862 175,097Less: Cash 7,400 10,987Net debt 171,462 164,110Total liabilities/total tangible assets 54.0% 55.8%Net debt/shareholders’ equity 43.5% 46.7%Net debt/EBITDA (times) 2.1 2.3EBITDA/net interest (times) 6.3 8.0Return on Shareholders’ funds* 8.6% 10.5%Return on funds employed* 10.1% 9.8%Earnings per share* (cents) 10.0 11.3
* Before signifi cant items.
EXCHANGE RATEOverseas earnings are translated into Australian Dollars at average exchange rates for the year.
The balance sheet is translated at the year-end rate. Major exchange rates applicable were as follows:
2006 2005
Average rates US$ : A$ 0.7434 0.7495 C$ : A$ 0.8630 0.9398Year-end rates US$ : A$ 0.7421 0.7640
C$ : A$ 0.8270 0.9495
ISSUED CAPITAL MOVEMENTSDuring the year, 8.1 million shares were issued for a consideration of $9.6 million under the Dividend Reinvestment Plan, Employee Share Scheme and the Incentive Option Plan.
FINA
NCIA
L RE
VIEW
12
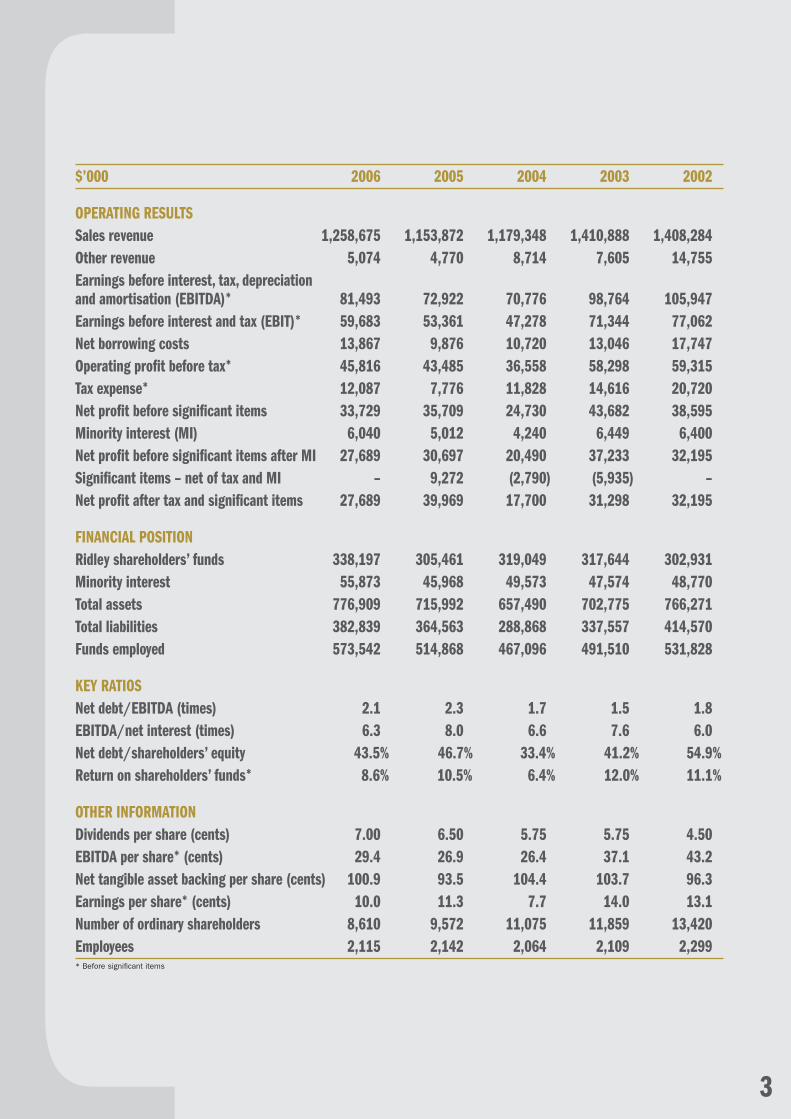
GLOBAL BANKING FACILITYLate in the year, we began negotiations with our banking partners to restructure our global banking facilities. These were concluded in July 2006. As a result, a number of key features of the facilities have changed. They are:
• The term of the facility has been extended from October 2007 until July 2009.
• Funds available have been increased to approximately $335 million from $270 million.
• Interest margins have been reduced, and covenants have been improved.
Global banking facility• The term of the facility has been extended from October 2007 until July 2009.
• Funds available have been increased to approximately $335 million from $270 million.
• Interest margins have been reduced, and covenants have been improved.
FINANCIAL RISK MANAGEMENTThe Board of directors, through management, seeks to minimise risk to our earnings and assets in the following ways:
• Interest Rate Risk: At 30 June 2006, approximately $126.6 million of gross debt was subject to fi xed rates of interest for periods up to two years. The level of cover is reviewed with the aim of maintaining a spread of interest rate maturity periods.
• Currency Risk: Wherever possible, we borrow in the currencies of the countries in which we operate.
Exposure is thereby limited to the net asset investment in any particular country. Ridley has borrowings in Australian, US and Canadian dollars. Movements in currency, as they affect the translation of the overseas net assets, are transferred to the Foreign Currency Translation Reserve. Major transactional exposures are covered at the time a commitment is made or when the liability occurs.
• Commodity Risk: Ridley purchases a range of raw materials on a global and domestic basis. Approval levels and the forward purchasing of raw materials are monitored and restrictions placed on the length and amount of forward purchases.
INSURANCEOur continuing focus on risk management has helped contain insurance costs in recent years. For the coming year this focus, together with the softer insurance market in Australia, has led to a reduction in premiums of 13%. This is despite an increase in the underlying asset base due to the newly acquired businesses. Insurance terms and conditions remain unchanged or improved.
IAN WILTON CHIEF FINANCIAL OFFICER
[
13

RIDL
EYAG
RIPR
ODUC
TSTo alleviate these capacity issues, some volume was pushed out to remote mills, resulting in excess transport costs. These freight costs are expected to diminish as investments designed to boost the effi ciency and production capacity of these sites are brought online.
In contrast, our mills in northern Australia experienced a decline in utilisation – largely a consequence of lighter demand for beef feeds. Due to the abundance of natural pastures, farmers were less reliant on manufactured feed and supplements.
In the supplements business unit, two major projects have been undertaken. The facility at Wacol, Queensland is being signifi cantly upgraded and will be completely operational early in calendar year 2007. This upgrade will lift production capacity and, with mechanisation and automation, produce signifi cant effi ciency improvements in the manufacture of supplements. As well, Primix Nutrition, a Townsville-based block and loose mix supplements manufacturing operation, was acquired from Elders. While integration has been somewhat protracted, once this acquisition is fully incorporated into the business, it will greatly improve Ridley AgriProducts’ ability to service the market.
In addition to the Primix acquisition, Teangi Stock Feeds, a pelletised stockfeed producer with mills at Colac and Gunbower in Victoria, was purchased. Integration of the Teangi business into our wider operation is almost complete. These new sites, in addition to ongoing investment in our existing facilities, will allow us to better balance milling capacities with sales demand.
The dairy sector has enjoyed strong demand and high levels of plant utilisation, with feed sales volumes increasing by over 13% against last year (excluding Teangi). Our dairy customers’ terms of trade have been favourable, with a strong milk price/feed price ratio encouraging more intensive feeding.
Pig feed sales volume was up 2%, despite a contracting national herd and a pork industry under increasing pressure from foreign imports and a strong Australian dollar.
We enjoyed a 6% lift in our poultry sales volume, which was largely driven by improvements in feed performance. This sector now represents approximately 37% of total sales volume.
GROWTH IN MARKET SHARE AND, TO A LESSER EXTENT, ACQUISITIONS WERE THE MAIN FACTORS BEHIND THE 9% INCREASE IN OPERATING EARNINGS TO $15.9 MILLION.
Volumes increased by 9% with improvements in sales to the dairy and poultry sectors, partly offset by lower beef volumes, refl ecting abundant pasture conditions in Queensland.
A signifi cant improvement in safety performance this year has seen the lost time injury frequency rate decrease by 17% and the duration rate decrease by 42%. More detail is provided in the sustainability report on page 20.
The increase in market share was most prominent in Australia’s southern states, where dairy and poultry sales volumes in particular have stretched the production capacities of some of our mills.
Sales volumes for the liquid supplements business, primarily conducted through Champion Liquid Feeds Joint Venture (CLF), fi nished slightly down on last year’s result. Rationing supply of molasses was necessary due to shipping delays and storage capacity limitations in Victoria. These issues are being overcome with new shipping arrangements, and plans for new liquid feeds facilities in Victoria and at Mackay Sugar’s Marian mill in Queensland.
In the purchasing arm of the business, our percentage of direct (off farm) grain sourcing has lifted by 5% to 37% nationally, giving greater fl exibility and generating supply chain effi ciencies. Grain markets were relatively stable during the year.
Our Aqua-Feeds plant enjoyed high levels of utilisation, with sales volume up 16% and a more balanced sales profi le across salmon, prawn, barramundi and other native fi sh species. New technical resources engaged in the course of the year are enabling us to better service the requirements of our customers and ensure the products we offer are the best performing for their needs.
We have continued to develop the new agency arrangements for CCD Animal Health and Nutrition, our stockfeed additives business, which were in place at the start of the year. This, combined with the benefi t derived from increased feed sales, lifted profi tability by 20%.
The Packaged Products unit has implemented a rationalisation of brands, product range and bag size, consolidating a number of labels into the three key brands, Barastoc, Rumevite and Cobber. The rollout of the new improved branding, packaging materials and bag sizes continued throughout 2006 and will be further progressed in 2007.
In 2007, Ridley AgriProducts will be focused on: continuing to invest in our mills to improve safety, capacity and effi ciency; driving volumes through better relationships with our customers; and the stringent control of costs to deliver sustainable improvements in earnings.
REVI
EW
OF O
PERA
TION
S
14

AUSTRALIA FEEDS ’000 TONNES0506 0506 0506 0506 0506060506 05
285.
632
2.3
599.
163
4.7
367.
537
3.3
134.
520
6.0
31.9
31.8
108.
810
3.7
30.2
22.9
KEYMANUFACTURING & DISTRIBUTIONDISTRIBUTION ONLY
1 ATHERTON 2 TOWNSVILLE 3 ROCKHAMPTON 4 WONDAI 5 DALBY 6 NARANGBA 7 TOOWOOMBA 8 WACOL 9 CLIFTON10 TAMWORTH11 TAREE12 WETHERILL PARK13 WAGGA WAGGA14 COROWA15 MOOROOPNA 16 MAFFRA17 PAKENHAM18 DANDENONG
19 COHUNA20 GUNBOWER21 ST ARNAUD22 BENDIGO23 TERANG24 COLAC25 MURRAY BRIDGE26 WASLEYS27 KEWDALE28 NORTHAM
A BARASTOC BRANDED TRUCK DELIVERS BULK STOCKFEED. RIDLEY AGRIPRODUCTS NOW HAS THREE KEY BRANDS: BARASTOC, RUMEVITE AND COBBER.
DAIRYBEEFSUPPLEMENTSPOULTRYSWINEOTHEREQUINE
15

REVI
EW
OF O
PERA
TION
S
EARNINGS INCREASED 22% OVER THE PREVIOUS YEAR TO $23.1 MILLION, LARGELY DUE TO THE CONTRIBUTION FROM THE DRY CREEK SALT FIELD, ACQUIRED IN MAY 2005.
Increases in energy, labour, transport and packaging costs held back earnings in some parts of the business. The duration of major sales contracts meant these increased costs could not begin to be recovered until late in the fi nancial year.
Sales volumes to the Australian stockfeed industry were down 15% on last year as a result of a contracted Queensland market. This was due to abundant pastoral feed conditions reducing demand for manufactured feed and supplements.
As always, Occupational Health and Safety has remained a key focus for the business. This year, a lost time injury frequency rate of 1.8 was achieved.
This is a 70% improvement on last year and represents one lost time injury for the year. Details are provided in the sustainability report on page 20.
Another signifi cant achievement was the successful integration of the Dry Creek salt fi eld into existing operations. It is the largest solar salt operation in eastern Australia, producing an average of 630,000 tonnes per annum, the majority of which is supplied to Penrice Soda Holdings Limited via a brine pipeline, under a 14-year “take or pay” contract. Penrice is the sole domestic manufacturer of soda ash and sodium bicarbonate – core ingredients in glass, detergents and stockfeed.
Following a re-evaluation of our approach to the swimming pool sector, we have introduced a new product, Mermaid Finest Swimming Pool Salt. The launch involved a complete branding exercise and a major advertising and promotional campaign that emphasised the product’s purity and ease of use. As a totally natural product obtained by solar evaporation of seawater, its fast-dissolving crystals make it ideal for use with salt-water pool chlorinators.
Improved results from our overseas operations were driven largely by Indonesia where, following a year of record profi tability, we continue to build a solid base in the country’s expanding food sector. Japan has continued its steady growth, turning a profi t for the fi rst time this year.
Upgrading plant and equipment to ensure a safer and more effi cient working environment continued in 2006. A major program of research and development culminated during the year with the construction and commissioning of a new salt harvester. This new harvester, designed by Cheetham and built around the biggest track-based Caterpillar tractor available, recently fi nished its fi rst harvest at Sea Lake and is operating in line with expectations. The introduction of the new harvester, which operates at 1,000 tonnes per hour, will generate signifi cant effi ciencies in harvest operations by replacing two harvesters, each with 300 tonnes per hour capacity.
Following the appointment of John Murray as Chief Executive Offi cer – Cheetham Salt in December 2005, a restructure of the organisation was undertaken to improve effi ciency and place greater emphasis on
developing people for the future and to enable Cheetham to capitalise on growth opportunities.
Last year, we reported on the success we had achieved in the area of salinity where, through the use of novel crystallisation and processing techniques, the Wakool operation was producing saleable salt for the fi rst time in more than 20 years of operation. We continue to review the area of salinity and are in ongoing negotiations with government agencies and other parties about the possible development of salt production facilities. In addition, there are a number of desalination projects that remain of interest and we are well positioned to take advantage of any developments that may occur.
Our Price and Bowen salt fi elds continue to profi t from the recovery of waste brine. This brine is concentrated magnesium with most of the sodium chloride crystallised out. Normally this is returned to the sea, but it has growing potential for Cheetham. A viable export market for magnesium brine is developing in Japan, where it is used as a food additive, and to make tofu.
Equity profi ts from Cheetham’s joint venture operations were virtually unchanged from last year at $5.9 million. Returns from the Australian retail operation, Salpak, were in line with last year, while New Zealand investments were up, thanks largely to an improved performance by Cerebos-Skellerup, although Dominion Salt was below last year, mainly due to adverse conditions in the agricultural sector. Western Salt Refi nery in Western Australia more than doubled last year’s result. This is due to improved volumes and growth in exports, mainly to Japan.
Cheetham will complete implementation of a range of supply chain initiatives during 2007, resulting in cost savings in warehousing and distribution. This includes the construction of warehouses at Price and Bajool, and the introduction of streamlined delivery systems.
CHEE
THAM
SAL
T
16

SALT 05 06 05 06 05 06 05 06 05 06 06 05 06 05
28.0
28
.4
138.
9 11
0.1
263.
0 24
7.5
73.9
62
6.1
15.6
22
.330.9
26.3
91.1
140.
3
1 BOWEN 2 BAJOOL 3 PORT ALMA 4 BRISBANE 5 SYDNEY 6 WAKOOL 7 CORIO, LARA & MOOLAP 8 SEA LAKE 9 DRY CREEK10 PRICE11 LOCHIEL12 KEVIN13 ESPERANCE14 FREMANTLE
15 CILEGON16 MOUNT MAUNGANUI17 LAKE GRASSMERE 18 TOKYO
1
2,3
11
4
56
7
8
910
12
1314
15
16
17
18
THE NEW CHEETHAM DESIGNED AND BUILT SALT HARVESTER, WHICH OPERATES AT 1,000 TONNES PER HOUR, WILL GENERATE SIGNIFICANT EFFICIENCIES IN HARVEST OPERATIONS.
HIDESTOCKFEEDWASHEDREFINEDBULKDRY CREEKOTHER
KEYPRODUCTION & REFINERYREFINERY SALES OFFICEPRODUCTION
’000 TONNES
17

Our US Feed Operations had a solid year, and although volumes were slightly down on last year (1%) due to the mild winter and a warm and dry spring, a more stable ingredient market resulted in improved margins. Ongoing cost control programs implemented at the beginning of last year kept 2006 expenses below prior year levels, despite increasing labour and energy costs. Ridley Feed Ingredients recorded another year of sales volume growth in all customer segments, but higher trace mineral and energy costs impacted earnings.
Earnings for our Canadian Feed Operations increased substantially over last year following the reopening of the US/Canadian border to some live cattle shipments and the resolution of issues surrounding countervailing duties for hogs into the US. Increased volumes also refl ected improved customer economics, particularly, in the beef and pork sectors, but were also the result of an aggressive sales and marketing program. Like the US operation, the business experienced more stable ingredient markets and the benefi ts of the cost reduction program. In addition to these factors, the generally favourable environment for livestock production, and diligent management of credit risk, reduced bad debt expense signifi cantly.
Earnings for Ridley Nutrition Solutions were down on last year’s result. Despite an increase in sales volumes led by improved volumes in the block and equine operations and the full period impact of Sweetlix, a number of issues impacted earnings.
Hurricanes in the south eastern US, while not causing any physical damage to Ridley plants, caused major disruptions to transportation infrastructure, molasses production and customer demand. This was compounded by beet molasses shortages last summer, and much higher energy costs throughout the business. To ensure continued supply to customers, production was temporarily redistributed, incurring higher transportation costs. These cost increases could not be fully recovered from customers. Also, severe drought in the south west reduced winter wheat pasture for cattle and curtailed sales opportunities for Sweetlix feed supplements.
In addition to these issues, results were also impacted by an increase in operating expenses, primarily attributable to
IN ADDITION TO AN INCREASE IN EARNINGS FOR THE THIRD CONSECUTIVE YEAR, OUR NORTH AMERICAN BUSINESSES HAVE RECORDED GOOD VOLUMES GROWTH, STRONG CASH FLOWS, SIGNIFICANT DEBT REDUCTION, AND THE REALISATION OF THE BENEFITS OF THE COST REDUCTION PROGRAM IMPLEMENTED AT THE BEGINNING OF LAST YEAR.
However, freight and energy costs, and disruptions caused by weather – including three hurricanes – have had some impact on the bottom line.
A highlight of the year was the progress we made in our “Safety First” initiative, which saw us achieving 44% and 37% reductions in total recordable rates and lost time injury frequency rates respectively. This is well ahead of our targeted 20% reduction in both. More detail is provided in the sustainability report on page 20.
start-up costs for the new equine centre in Pennsylvania, which opened in May 2005.
As part of Ridley’s equine strategy, the remaining 49% of McCauley Bros Inc (Ridley already owned 51%) was purchased in August 2005. McCauley Bros are based in Versailles, Kentucky and manufacture premium quality feeds and nutritional supplements for the equine market.
Although steadily weaker throughout the year, the production economics environment for meat, milk and egg production was generally positive. Cattle operators in the US saw a gradual decline in prices from the peaks in 2004/05, while Canadian producers struggled with contracting margins. This was a product of the stronger Canadian dollar and the surplus of older cows due to the ongoing closure of the US border to animals over 30 months of age.
US swine producers have benefi ted from strong market prices and good profi tability this year. However, gradually increasing inventories and stable demand led to declining returns towards the end of the year. Canadian swine producers experienced lower returns, largely as a result of higher feed costs and a strengthening of the Canadian dollar, which impacted exports to the US.
US dairy producers are seeing milk prices continue to decrease from the peaks in 2004, largely as a result of increasing cow productivity. The Canadian market is quota-managed and therefore producers are insulated from the full extent of market fl uctuations.
Notwithstanding this challenging environment and higher energy costs, the focus for the coming year will be on organic growth. We have a number of new capital projects in the pipeline. These include some plant automation, signifi cant enhancements to our safety initiatives, a new planning system, as well as plant expansion in some of our key operations.
REVI
EW
OF O
PERA
TION
S
RIDL
EY IN
C
18

DAIRYBEEFSWINESUPPLEMENTS/FEED INGREDIENTSOTHER
BLOCK OPERATIONSSWEETLIXEQUINE
DAIRYBEEFPOULTRYSWINESUPPLEMENTS/FEED INGREDIENTSOTHER
US FEEDS 05 06 05 05 06 05 06 05
157.
3 15
1.6
209.
5
06
202.
1
108.
0 11
2.6
250.
425
2.3
83.8
06
78.9
CANADA FEEDS ’000 TONNES0506 0506 0506 0506060506 05
41.446
.7
158.
6176.
0
60.9
57.0
18.1
14.3
65.6
68.3
98.2
102.
4
NUTRITION SOLUTIONS ’000 TONNES0506 060506 05
102.
3109.
2
83.985.5
16.4
19.5
1 ROCKY MOUNTAIN HOUSE, ALBERTA 2 LACOMBE, ALBERTA 3 LINDEN, ALBERTA 4 FORT MACLEOD,
ALBERTA 5 LETHBRIDGE, ALBERTA 6 SASKATOON, SASKATCHEWAN 7 HUMBOLDT, SASKATCHEWAN 8 BRANDON, MANITOBA 9 MANITOU, MANITOBA10 ARBORG, MANITOBA11 WINNIPEG, MANITOBA12 GRUNTHAL, MANITOBA13 MITCHELL, ONTARIO14 BISMARCK, NORTH DAKOTA15 GRANDIN, NORTH
DAKOTA16 RAPID CITY, SOUTH DAKOTA17 HURON, SOUTH
DAKOTA18 WATERTOWN, SOUTH DAKOTA19 WORTHINGTON, MINNESOTA 20 ALEXANDRIA,
MINNESOTA
21 MANKATO, MINNESOTA22 BELOIT, KANSAS23 COLUMBUS, NEBRASKA24 SIOUX CITY, IOWA25 STORM LAKE, IOWA26 ATLANTIC, IOWA27 IOWA CITY, IOWA28 BUSHNELL, ILLINOIS29 APPLETON, WISCONSIN30 HOPKINSVILLE,
KENTUCKY31 CASTLETON, INDIANA32 SHIPSHEWANA, INDIANA33 BOTKINS, OHIO34 LANCASTER, PENNSYLVANIA35 SELMA, NORTH
CAROLINA36 MENDOTA, ILLINOIS37 VERSAILLES, KENTUCKY38 CHAMBERSBURG, PENNSYLVANIA39 STOCKTON, CALIFORNIA40 WHITEWOOD, SOUTH DAKOTA41 WORTHINGTON,
MINNESOTA42 BUFFALO, TEXAS43 FORT WORTH, TEXAS44 SYRACUSE, INDIANA45 MONTGOMERY, ALABAMA
KEYPRIMARY FEED PLANTSMACRO PREMIX PLANTSRETAIL STORE ONLYMICRO PREMIX, MACRO PREMIX, PRIMARY FEED PLANT, RETAIL STORERIDLEY FEED INGREDIENTSSWEETLIXMCCAULEY BROS INC,RIDLEY EQUINE CENTERRIDLEY BLOCK OPERATIONS
AS PART OF THE “SAFETY FIRST” INITIATIVE, AUTOMATED PALLETISERS HAVE BEEN INSTALLED AT THE RIDLEY FEED INGREDIENTS MILL IN MENDOTA, ILLINOIS.
’000 TONNES
19

SUST
AINA
BILI
TY
REPO
RT
towards improving safety management at all sites.
Cheetham Salt had a similarly strong safety performance, achieving a 70% improvement in the LTIFR during the year and recording only one lost time injury. Cheetham also received two Outstanding Achievement awards at the National Safety Council of Australia/Telstra National Safety Awards of Excellence for achieving fi ve-star ratings at its Sea Lake (VIC) and Corio (VIC) sites. This was the second time this award has been presented to Corio (VIC), where almost four years have passed without a lost time injury.
Ridley AgriProducts also achieved signifi cant improvements in the medically treated injury frequency rate (MTIFR) of 37% and 42% in the duration rate of lost time for incidents. The LTIFR improved by 17%, but the internally set LTIFR target was not achieved this year. The LTIFR was 21 compared with a target of 18.
SystemsRidley Inc’s safety activity revolved around the development of its 2006 Safety First program, which includes the implementation of a behavioural change module and an observation audit plan. To facilitate the implementation of the program and to provide expert advice and assistance to the management team and employees, a Director of Safety was appointed in June 2006.
Ridley AgriProducts spent 2006 continuing to improve its safety management system. The business undertook a benchmarking exercise of its safety management systems against those of DuPont Safety Resources – a company that is recognised as a leading authority in implementing disciplined operating systems aimed at preventing workplace incidents and injuries. The results identifi ed areas for improvement including updating of programs and procedures for best practice incident investigation, materials handling and job safety analysis. The review also identifi ed areas where safety and environment
RIDLEY’S SUSTAINABILITY FOCUS AIMS TO POSITION THE COMPANY SO THAT IT OPERATES SUCCESSFULLY AND PROTECTS THE SAFETY AND HEALTH OF OUR PEOPLE WHILE AT THE SAME TIME REDUCING OUR IMPACT ON THE ENVIRONMENT.
The sustainability plan prepared for Ridley’s Australian operations last year set specifi c targets in waste management, recycling, energy, water, emissions and employee development. The progress we’ve made to reduce our impact on the environment has, for the most part, been encouraging. Our operations continue to embrace sustainable practices and across both our Australian and North American businesses we have implemented a range of new health and safety, environmental and business-based initiatives.
HEALTH AND SAFETYPerformance We continue to develop a culture that supports Ridley’s health and safety values by encouraging behaviour and implementing processes that safeguard employees, contractors, visitors and the community from incidents and occupational hazards.
A continued focus on safety has helped steadily reduce Ridley’s lost time injury frequency rate (LTIFR) over the last four years. This year we achieved our lowest LTIFR since we began using the measure in 1997, which is a signifi cant achievement. However, the focus for 2007 will be to further reduce our workplace injuries.
Ridley Inc’s safety performance is a highlight of the year. The business achieved a 44% improvement in total recordable rates of injury (lost time incidents, as well as those that require medical aid) and a 37% improvement in the LTIFR. Each of those was well ahead of our internal target. This improvement is a result of the Safety First program implemented in 2006 and also the commitment by our employees and the management team to actively work
20

procedures could be integrated. Overall the review identifi ed that in many areas Ridley AgriProducts safety management system met DuPont expectations and standards. The year also saw the establishment of the AgriTrack incident management and recording system. This system allows managers to report on incidents as they occur, communicate the incident to relevant managers within the Company and monitor progress with corrective actions.
Cheetham Salt continues to enhance its integrated Quality, Safety & Environment management system. The procedures that support the system are available to all staff via the division’s intranet – SaltNet.
We continue to develop a culture that supports Ridley’s health and safety values by encouraging behaviour and implementing processes that safeguard employees, contractors, visitors and the community from incidents and occupational hazards.
ENVIRONMENTRidley’s operations are intrinsically eco-friendly, with the majority of the inputs to production being natural raw materials. Consequently, the business has a low impact on the environment. Compliance with environmental licences and regulations is mandatory for all Ridley businesses. However, Ridley’s commitment to the environment goes beyond just complying with the law. Rather, our businesses take a proactive approach to identifying areas where impacts on the environment can be reduced or managed more effectively.
Environmental management system Ridley AgriProducts continued to bring its entire network of mills in line with ISO 14001 environment management standards, but will not be seeking certifi cation. The business has made signifi cant progress in implementing the environmental management system and by June 2006 had all of its sites audited against the ISO 14001 standard. In 2007 the focus will be to continue to strengthen the environmental management systems at each site.
Vegetation management is an important aspect of Cheetham Salt’s operations. Plans are in place at sites to monitor and, where possible, enhance the local vegetation. For example, a samphire rehabilitation project has been established at Price, South Australia. Samphires are important plants in the estuarine ecosystem. They absorb nutrients that wash from the land and provide food and shelter for many small animals, which in turn feed birds, fi sh and crabs. Both Price and Dry Creek, both located in South Australia, are working constructively with samphire coast community conservation groups.
In July 2006, Cheetham’s Bajool (Qld) site joined Price (SA) and Corio (Vic) in obtaining approval for certifi cation to ISO 14001 for its environmental
management system. This is a major achievement for the site and refl ects the dedication by the management team and our people to upgrade the environment management systems and practices. The remaining Cheetham sites have continued to develop their systems consistent with the standard and improve their environmental management practices.
At Sea Lake (Vic), disused roads have been closed off to allow rehabilitation, while at Port Alma (Qld) and Bajool (Qld), photographic mangrove monitoring is in place.
Waste and recyclingBoth Ridley AgriProducts and Cheetham Salt continue to identify areas where reduction in waste and increased recycling of wastes can be achieved.
As of 1 March 2006, all Ridley AgriProducts sites are now weighing and recording their waste, with the results providing a recording system to track progress and shifts in levels of waste disposal. Balers, which compress waste material to enable the more effi cient management of waste, are progressively being acquired in line with site needs and have recently been installed atthe Wasleys (SA) and Murray Bridge (SA) mills.
RIDLEY NUTRITION SOLUTIONS IS IN THE FINAL PHASE OF LAUNCHING A BIODEGRADABLE FEED CONTAINER FOR THE MOLASSES-BASED LOW MOISTURE BLOCK USED IN THE UNITED STATES.
DURING PRODUCT DEVELOPMENT OF THE BIOBARREL, OVER 1,000 CONTAINERS WERE FIELD TESTED ACROSS THE US IN A VARIETY OF CLIMATES, ENVIRONMENTS, LIVESTOCK SPECIES, MANAGEMENT AND PRODUCTION SYSTEMS.
[
21

SUST
AINA
BILI
TYRE
PORT Both Ridley AgriProducts and Cheetham
Salt are signatories to the National Packaging Covenant, which commits the business to recycling initiatives.
Ridley AgriProducts continues to replace the polypropylene packaging with fully recyclable low-density polyethylene bags. Cheetham is also using polyethylene bags for its Mermaid Finest products.
In November 2005, Cheetham Salt won the Victorian Premier’s 2005 Business Sustainability Award in the Large Business Category for its work in developing the Waste Hide Salt Recycling program at Corio.
At Cheetham, external waste management companies conducted waste management audits at the major sites. Cheetham also met the target of reducing solid waste and in 2007 the division will develop state-based management plans aimed at reducing the volume/mass of solid waste to landfi ll. In addition to these initiatives, all Cheetham sites have recycling initiatives in place for oil, paper and cardboard. These initiatives will continue and will be included in the state-based waste management plans.
Cheetham increased the recycling of saline through a third party recycling project, the Wakool (NSW) saline management project, and hide salt recycling. Overall, 22,404 tonnes of salt were recovered – well ahead of last year’s fi gure of around 11,900 tonnes. The third party recycling project recovered 6,854 tonnes of salt; the Wakool (NSW) project harvested 13,550 tonnes of intercepted salt; and the hide salt recycling plant recovered around 2,000 tonnes of waste salt and sold 1,433 tonnes of “Envioedge” recycled salt back to the hide industry.
In November 2005, Cheetham Salt won the Victorian Premier’s 2005 Business Sustainability Award in the Large Business Category for its work in developing the Waste Hide Salt Recycling program at Corio (VIC). The recycling program prevents waste hide salt, which is used to cure animal hides, from being disposed of in landfi ll. Cheetham worked with CSIRO to develop a process that reduces salt to landfi ll, and allows the majority of the hide salt to be reused and sold back to the industry.
BioBarrelRidley Nutrition Solutions is in the fi nal phase of launching the BioBarrel in the United States, a biodegradable feed container for the molasses-based low moisture block. The BioBarrel will replace the steel and plastic barrels that are currently used. These barrels are returned to Ridley sites where they are reconditioned, restocked and then redistributed to customers. The BioBarrel will eliminate this process and will reduce on-farm handling.
During product development of the BioBarrel, over 1,000 containers were fi eld tested across the US in a variety of climates, environments, livestock species, management and production systems.
The progressive rollout of the BioBarrel to Ridley Inc customers will commence in October 2006.
In preparation of the BioBarrel launch, selected locations have held, and are scheduled to hold, fi eld demonstrations with key sales personnel prior to receiving the BioBarrel in their area. These demonstrations are designed to better prepare sales staff and their customers for container positioning, application, handling and performance under fi eld conditions. There are over 40 of these demonstrations planned during the launch period.
[
22

Water and energyThis year, Cheetham Salt conducted energy audits at its major sites to identify areas where energy effi ciencies could be gained to reduce its energy consumption. Overall electrical energy usage per tonne for Cheetham was down considerably in 2006, however, this was mainly due to the timing of salt harvests and the impact of Dry Creek (SA), which was purchased in May 2005. In 2007 Cheetham will develop state-based energy management plans that will incorporate initiatives identifi ed from the energy audits and any others that are identifi ed to improve energy effi ciency at all sites.
At the Ridley AgriProducts sites, good results have been achieved on improving the effi ciency of mills through changes in product mixes that have led to longer production runs and gains in energy effi ciencies. In 2006, the internally set target of reducing electrical energy usage per tonne by 1% was not met due to the acquisition of three new sites. Ineffi ciencies within these sites has resulted in a considerable imbalance in the energy usage per tonne. In addition, these three sites did not have accurate data recording systems in place. In 2007 Ridley AgriProducts will continue to identify and implement effi ciency improvements at all sites, particularly the recently acquired sites. Data recording for these sites will also be developed to ensure accurate monitoring of energy usage and to allow identifi cation of reductions achieved.
Energy audits, carried out at each Ridley Inc location by manufacturing managers, identifi ed a range of energy saving opportunities, such as boiler effi ciency training and improved maintenance.
Emission control In Ridley AgriProducts, a bio-fi lter was installed at Pakenham (Vic) in June 2006 and commissioned in September 2006.
All Ridley AgriProducts mills handle grains which, if not properly managed, can create dust. To assist in the management of dust creation and consequential
risks such as dust explosions, an electronic control system, called the WatchDog System, was trialled at Ridley AgriProducts’ Dalby (QLD) site. This system monitors the operation of grain elevators to reduce the potential for a dust explosion. The results of the trial were satisfactory and the system will be progressively installed at sites as required.
Biosecurity risksWe remain focused on the range of biosecurity risks that potentially confront the business, the most notable of which is avian infl uenza. Over the year, we have engaged in a range of activities to improve awareness of avian infl uenza and increase the existing controls to prevent or mitigate the impacts to the business of an outbreak.
Supply chainRidley AgriProducts commenced a project targeted at improving premix addition assurance in all mills. This was part of a supply chain project and included development of a best practice standard. The standard outlines the requirements in areas such as dust control, manual handling, layout, quality control and environment and appearance. Audits against the standard were conducted at
all sites. The fi ndings were evaluated and prioritised and action plans have been developed for all sites to meet 80% of the requirements in the standard. All actions are to be completed by the end of 2007.
Training and development Following the completion of the necessary training, Ridley AgriProducts’ Occupational Health, Safety and Environment Managers are now accredited AS/NZS 4801 Auditors. AS/NZ 4801 auditing standards incorporate legislative compliance as a base level of safety management systems.
In Ridley AgriProducts, training completion rates are now tracked and reported on as operational KPIs. Certifi cation options now include Certifi cates II and III in Food Processing, and Certifi cate III in Customer Contact. Sixty employees received Certifi cate II in Food Processing.
A restructure of Cheetham is underway to improve effi ciency and place greater emphasis on developing people for the future. A Human Resources Manager was employed to assist the business in achieving this goal.
A BIO-FILTER WAS INSTALLED AND COMMISSIONED AT RIDLEY AGRIPRODUCTS’ PAKENHAM SITE.
VEGETATION MANAGEMENT IS AN IMPORTANT ASPECT OF CHEETHAM SALT’S OPERATIONS. PLANS ARE IN PLACE AT SITES TO MONITOR, AND WHERE POSSIBLE, ENHANCE THE LOCAL VEGETATION.
23

SUST
AINA
BILI
TYRE
PORT 2006 REPORT CARD
Division Subject TargetRidley AgriProducts Waste management Develop process to determine correct
practices so improvements canbe achieved.
Continue to roll out balers.(Balers compress waste material to enable the more effi cient managementof waste.)
Find contractors to remove wastefor recycling.
Cheetham Salt Waste management Undertake waste management auditsat all locations.
Reduce solid waste/tonne by 5%.
Ridley AgriProducts and Cheetham Salt
Recycling Complete investigations into suitability of polyethylene bags throughout the business.
Cheetham Salt Recycling Increase recycling of saline by 10% per tonne from a third party recycling project, Wakool salinemanagement project and hide salt recycling.
Progress the Lake Tyrell project, which involves treatment of saline from the Kerang region.
Reduce bitterns (the remaining solution after salt is crystallised out of seawater) discharge at salt production sites through the implementation of improvement projects.
24

Progress as at 30 June 2006 Priority for 2007As of 1 March 2006, all sites now weigh waste and record results, allowing the monitoring of levels of waste disposal and the targeting of those sites with high levels for improvement.
Balers are progressively being acquired in line with site needs and have recently been installed at the Wasleys and Murray Bridge mills.
Efforts to fi nd a suitable national contractor to coordinate our recycling and waste management activities proved unsuccessful due to the geographic range of our sites.
Develop an effective base-line pattern of waste produced over a full 12 month period to enable proper improvement targets to be established. Taking into account the continuing move to 20Kg bags, a reduction target of 2% in 2007 is projected.
Continue to roll out balers on an as-needs basis in line with the development of streamlined packaged product facilities.
Pursue and establish regional and site-based solutions.
External parties have conducted waste audits at major sites.
Solid waste per tonne was considerably lower in 2006, due to initiatives implemented at most sites. All sites have ongoing recycling initiatives in place for oil, paper and cardboard.
Continue to collect data at each site using the systems developed in 2006.
Develop a waste management plan for each state to identify keyinitiatives to reduce volume of solid waste to landfi ll.
Comply with undertakings of the National Packaging Covenant.
In Ridley AgriProducts, polyethylene bags are being progressively introduced.
At Cheetham, polyethylene bags have been introduced for the new swimming pool product, Mermaid Finest Swimming Pool Salt.
AgriProducts and Cheetham Salt are signatories to the National Packaging Covenant. Their revised plans have been completed, signed and submitted. These commit the businesses to recycling initiatives.
Continue to introduce polyethylene bags where appropriate.
Compliance with undertakings of the National Packaging Covenant will include recycling opportunities.
The third party recycling project recovered 6,854 tonnes of salt; the Wakool project harvested 13,550 tonnes of intercepted salt; and the hide salt recycling plant sold 1,433 tonnes of “Envioedge” recycled salt back to the hide industry.
Awaiting government approval for the Lake Tyrell project.
At Bajool, a bitterns recovery system is fully installed. A bitterns concentrating pond has also been implemented at Bowen. This equates to a bitterns reduction of some 8,000 tonnes.
Continue to operate recycling facilities that recover saline wastes at Wakool, Moolap and Corio. Expand the hide salt recyclingoperations at Corio to increase sales of “Envioedge” recycled salt back to the hide industry.
Bitterns management plans to be developed for each salt fi eld. This is aimed at further discharge reductions and enhanced control.
Undertake magnesium brine production trials at Bajool, Lara and Bowen.
25

Division Subject TargetRidley AgriProducts Energy Electrical energy reduction of
1% per tonne of product made.
Cheetham Salt Energy Electrical energy reduction of 2% per tonne of product made.
Cheetham Salt Fresh water Explore other methods for using sea water to replace weir water at Bajool.
Ridley AgriProducts Emissions – odour/dusts
Complete installation of bio-fi lter at Pakenham and odour emission controls at Narangba.
Trial WatchDog System for elevator legs to reduce nuisance dust emissions at the top of mills (which has signifi cant safety benefi ts).
Cheetham Salt Biodiversity management
Establish vegetation monitoring at each site.
Ridley AgriProducts Employee development
Complete the rollout of workbooks (a knowledge and skills trainingprogram) to all plants.
Corporate Performance measurement
Defi ne measurable targets and agree on how to measure and report them.
SUST
AINA
BILI
TYRE
PORT 2006 REPORT CARD (CONTINUED)
26

Progress as at 30 June 2006 Priority for 2007Due to the acquisition of additional sites at Gunbower, Colac and Townsville, the target was not met. Ineffi ciencies within these sites have resulted in a considerable imbalance in energy per tonne.
Further work will be conducted in 2007 to review strategies and improve all sites to meet the 1% per tonne target.
Overall electrical energy usage per tonne for Cheetham was down considerably in 2006. However, this was mainly due to the timing of salt harvests and the impact of Dry Creek which was purchased in May 2005.
Energy audits were conducted at each site to identify areasfor reduction in electricity usage.
In 2007 each state will develop and implement an energy management plan to continue to reduce electrical energy consumption. Outcomes of the energy audits will be used as an input to these plans.
Not completed. Options were investigated, but may not deliver expected outcomes.
Storm water collection systems were installed as part of the refi nery building upgrade at Bajool.
Continue to collect data at each site using the systems developed in 2006.
Seek opportunities to reduce water consumption at Sea Lake, Bajool and Bowen.
Installation complete at Pakenham. Commissioned in September 2006. Monitoring at Narangba was conducted. Odour readings are currently within EPA guidelines.
The system was trialled at Dalby and has proved satisfactory.
Monitor odour emissions from Narangba site to ensure site requirements are maintained.
WatchDog System to be progressively installed at sites as needed.
Samphire rehabilitation project established at Price. Both Price and Dry Creek are working with samphire coast community conservation groups.
At Sea Lake, disused roads have been closed off to allow rehabilitation, while at Port Alma and Bajool, photographic mangrove monitoring is in place.
Vegetation management is a key aspect of Cheetham Salt’s operations. Plans are in place at sites to monitor and, where possible, enhance the local vegetation. This will be continued in 2007.
Completed, with ongoing review processes in place at all sites to ensure that the program remains up-to-date.
60 employees received Certifi cate II in Food Processing. Certifi cation options now include Certifi cates II and Certifi cates III in Food Processing, and Certifi cate III in Customer Contact.
Fulfi ll current training plans that will enable a further 160 employeesto complete these certifi cated courses within 18 months.
Some systems have been established for data collection in 2006.
Review overall sustainability strategy and targets for Ridley Corporation, including Corporate and Ridley Inc, which have not been included in the strategy to date.
27

1. JOHN S KENIRY AM BSc PhD FTSE FRACI FAICD
Independent Chairman, Age 63 A director of the Company since 1990 and Chairman since March 1994, John formerly held executive positions with CSR Limited and Goodman Fielder Limited. He is presently Chairman of First Opportunity Fund Limited, the Australian Biodiesel Group Limited and a director of NSW EPA, as well as a number of other corporations and statutory bodies. He is a Past-President of the Australian Chamber of Commerce and Industry.
Other current listed company directorshipsFirst Opportunity Fund Ltd from 1998Mikoh Corporation Ltd from 1994Biosignal Limited from 2004 Australian Biodiesel Group Limited from 2005
Former listed company directorships in the last three yearsLatrobe Magnesium Ltd from 2003 to 2005
2. RICHARD J LEE BEng (Chem) (Hons) MA (Oxon) FAICD
Independent Deputy Chairman,Age 56A director since 2001, Rick is Chairman of Salmat and Inteq, a Director of CSR, Cash Services Australia and Australian Rugby Union and a member of Graincorp’s Trading Risk Management Committee. He is also a member of the NSW Council of the Australian Institute of Company Directors. He was formerly Chief Executive of NM Rothschild Australia Group and prior to that spent 16 years in the CSR sugar division.
Other current listed company directorshipsSalmat Limited from 2002CSR Limited from 2005
BOAR
D OF
DIRE
CTOR
1 2
S
28

3. ELIZABETH B BRYAN BA MA (Econ) FAICD
Independent Non-Executive Director, Age 59 A director since 2001, Elizabeth has more than 20 years’ executive experience in the fi nancial services industry and on the boards of companies and statutory bodies. She is a director of Caltex Australia Limited, UniSuper Limited and Australasian Medical Insurance Limited. Elizabeth is President of the NSW Council of the Australian Institute of Company Directors and on the National Board of the Institute.
Other current listed company directorshipsCaltex Australia Ltd from 2002
4. MATTHEW P BICKFORD-SMITH Chief Executive Offi cer and Managing Director, Age 46 Matthew joined Ridley Corporation in November 2000. His previous responsibilities included overseeing the Man Group’s interests in the Australian refi ned sugar industry, managing the Group’s sugar businesses within the Asian region and working in soft commodities, particularly in proprietary trading, structured fi nancing and marketing.
5. ROBERT J LOTZEFCA MAICD
Independent Non-Executive Director, Age 65 A director since 1998, Robert is a former partner of Coopers & Lybrand and has a background in accounting, auditing, fi nancial analysis and corporate governance. He is Chairman of the Audit Committee and a policy committee member of the Ridley Superannuation Plan.
6. ASSOCIATE PROFESSOR ANDREW L VIZARD BVSc (Hons) MPVM
Independent Non-Executive Director, Age 48 A director since 2001, Andrew is a senior consultant and former director of the Mackinnon Project at the University of Melbourne. He is Chairman of Phosphagenics Ltd, a board member of the Zoological Parks and Gardens of Victoria, Animal Health Australia Ltd, Australian Poultry CRC and PrimeSafe, the statutory authority responsible for administering the Victorian Meat Industry Act and the Victorian Seafood Act. He also sits on scientifi c advisory boards for The Hermon Slade Foundations and is a
trustee of the Australian Wool Education Trust.
Other current listed company directorshipsPhosphagenics Limited from 1999
G P (PADDY) WATTSBComm
Company Secretary, Age 48Since joining Ridley in 1994 Paddy has held a number of senior fi nance positions. He was appointed Company Secretary in April 2004.
3 4 5 6
29

CORP
ORAT
E GO
VERN
ANCE
REPO
R RIDLEY CORPORATION AND THE BOARD ARE COMMITTED TO ACHIEVING THE HIGHEST STANDARDS OF CORPORATE GOVERNANCE.
BOARD RESPONSIBILITIESThe Board is responsible for the overall governance of the Company, including setting the strategic direction, establishing goals for management and monitoring the achievement of these goals. Directors are accountable to shareholders for the Company’s performance. The management of the business is delegated to the Managing Director, as designated by the Board, which has defi ned the limits of management responsibility. The Board is responsible for appointing and reviewing the performance of the Managing Director. The Board has established an Audit Committee, a Remuneration and Nomination Committee and a Risk Review Committee to assist in the execution of its responsibilities. The roles of all Board committees are documented in a Corporate Policy, which is approved by the Board of Directors. The Board has also established a framework for the management of the Company including a system of internal control, a business risk management process and the establishment of appropriate ethical standards.
The Board and committee charters are available on the Company’s website www.ridley.com.au
COMPOSITION OF THE BOARDThe names, profi les, qualifi cations and experience of the directors in offi ce at the date of this statement are set out on pages 28 and 29.
The composition of the Board is determined using the following principles:
• The Board should comprise directors with a broad range of expertise both nationally and internationally.
• The Board should comprise a minimum of six directors. This number may be increased where it is felt that additional expertise is required in specifi c areas.
• The Chairman of the Board will be an independent non-executive director.
• The Board will comprise a majority of independent non-executive directors. Currently, the only non-independent director is the Managing Director.
In November 2005, the Remuneration Committee was renamed the Remuneration and Nomination Committee and its role expanded to include responsibility for evaluating Board performance, recommending director nominations and reviewing the size and composition of the Board. Previously, the whole Board acted as a nomination committee.
REMUNERATION OF DIRECTORS Non-executive directors’ fees are determined by the full Board within the aggregate of $700,000 approved by the shareholders at the AGM in 2003. Non-executive directors are not entitled to share options, nor do they receive incentive payments. However, they may participate in the Employee Share Acquisition Plan by salary sacrifi ce of their fees. In accordance with current corporate governance guidance, the directors’ retirement scheme was terminated at the October 2003 AGM. Directors’ accrued entitlements at that date will be paid when they retire. Details of the remuneration of directors during the year are set out in the remuneration report.
BOARD MEETINGSBoard and committee agendas are structured throughout the year to review Company strategy and to give the Board a detailed overview of the performance and signifi cant issues confronting each business unit and to identify major risk elements. The number of meetings held and the attendance details are set out in the directors’ report (page 46).
T
30

Directors receive detailed fi nancial and operational reports from senior management during the year and management is available to discuss the reports and business issues with the Board. The Board also visits and holds some meetings at the Company’s principal operating sites to enable directors to meet with employees and customers.
INDEPENDENT PROFESSIONAL ADVICEEach director has the right to seek independent professional advice relating to their duties and obligations as directors at the Company’s expense. However, prior approval of the Chairman is required, which is not unreasonably withheld.
REMUNERATION AND NOMINATION COMMITTEEThe role of the Remuneration and Nomination Committee is to review and make recommendations to the Board on remuneration packages and policies applicable to the Managing Director, senior executives and directors themselves. This role also includes responsibility for share option schemes, Employee Share Scheme, Employee Share Acquisition Plan, incentive performance packages, superannuation entitlements, retirement and termination entitlements and fringe benefi ts policies.
The committee is also responsible for evaluating the Board’s performance; reviewing the size and composition of the Board; assessing the necessary and desirable competencies of directors; reviewing Board succession plans, senior management succession plans and candidates to fi ll vacancies; and recommending their evaluations to the Board for approval.
The Remuneration and Nomination Committee meets twice a year and as required.
Effective November 2005, all members of the committee must be independent non-executive directors. Prior to November
2005, the Managing Director was a member of the Remuneration Committee.
The members of the Remuneration and Nomination Committee during the year were:
J S Keniry Independent – Chairman
E B Bryan Independent Director (appointed 28 November 2005)
R J Lee Independent Director
M P Bickford-Smith Managing Director (resigned 28 November 2005).
Details of the Remuneration and Nomination Committee members’ experience and technical expertise are set out in the directors’ biographies on pages 28 and 29.
AUDIT COMMITTEEBoard policy states that all members of the Audit Committee must be independent non-executive directors. The role of the committee is to advise on the establishment and maintenance of a framework of internal control and appropriate ethical standards for the management of the Company and to review the performance and work of the external auditor.
The committee makes recommendations to the Board on the appointment and remuneration of the external auditors, including an annual review of its work and performance. The current auditor of the Company is PricewaterhouseCoopers. Details of the amounts paid for audit and other services are set out in note 25 of the Financial Report. The committee meets with the external auditor four times a year to discuss matters relevant to its terms of engagement and review any signifi cant disagreements between management and the auditor. In addition, the committee meets with the auditor at least annually without the presence of management.
The committee reviews the level of non-audit services provided by the external auditor and ensures it does not adversely impact on the auditor’s independence. The auditor also provides
the committee with written confi rmation of its professional independence. The audit partner or senior representative also attends all AGMs and is available to answer any relevant shareholder questions. The Company requires the audit partner be changed at least every fi ve years.
The committee is responsible for the Australian independent whistleblower service that is available to employees.
The committee is responsible for the internal audit program of the Company, which is carried out by Ernst & Young in Australia and is totally independent of the external audit function, though it is designed to complement it. The committee sets and agrees the internal audit program, receives and reviews all internal audit reports and meets with the internal auditor twice a year.
The committee also gives the Board additional assurance regarding the quality and reliability of fi nancial information prepared for use by the Board in determining policies or for inclusion in the fi nancial statements.
The members of the Audit Committee during the year were:
R J Lotze Independent Director – Chairman
E B Bryan Independent Director
R J Lee Independent Director.
Details of the Audit Committee members’ experience and technical expertise are set out in the directors’ biographies on pages 28 and 29.
RISK REVIEW COMMITTEEThe Risk Review Committee was formed to undertake an ongoing, high level and wide ranging review of the major risk factors facing Ridley as a business and to ensure that responsibility for addressing and mitigating the potential impact of such risks was appropriately assigned and actioned.
The committee meets quarterly and as required.
31

The key responsibilities of the Risk Review Committee are to:
• ensure major business risks are identifi ed and managed appropriately
• review and recommend for approval the annual risk management plan
• enhance the understanding and management of risk in Ridley.
The members of the Risk Review Committee during the year were:
A L Vizard Independent Director – Chairman
M P Bickford-Smith Managing Director
I Wilton Chief Financial Offi cer.
RISK MANAGEMENTThe Company has in place a number of arrangements intended to identify and manage areas of signifi cant business risk. These include the maintenance of Board committees, detailed and regular budgetary, fi nancial and management reporting, established organisational structures, procedures, manuals and policies, audits (including internal and external, fi nancial, environmental, safety and risk management audits), comprehensive insurance programs and the retention of specialised staff and external advisors. The Company also has in place detailed policies and review processes covering commodities hedging, interest rate risk management and foreign exchange.
THE ENVIRONMENTThe Company aims to ensure that the highest standard of environmental care is achieved and has in place various policies and procedures to ensure the Company is aware of and is in compliance with all relevant environmental legislation.
DIRECTORS’ INDEMNITYThe Company has entered into a Deed of Indemnity Insurance and Access (as approved at the 1998 AGM) with all directors of Ridley Corporation Limited and with all executives appointed as directors of controlled entities.
The Company also has in place a Directors and Offi cers Insurance policy, covering all directors and offi cers of the Company.
The liabilities insured against include costs and expenses that may be incurred in defending civil or criminal proceedings, that may be brought against the directors and offi cers while working in such capacity for the Company.
ETHICAL STANDARDSIn pursuance of the promotion of high standards of corporate governance, the Company has adopted various internal standards and policies, which extend beyond requirements prescribed by law and include additional disclosure of interests by directors and guidelines relating to the dealing in securities by directors and managers. The Company also has in place a Code of Conduct for directors and employees. During the year, the Code of Conduct was reviewed and expanded. A copy is available on the Ridley website www.ridley.com.au
The Code of Conduct refl ects the standards of behaviour and professionalism required to maintain confi dence in the Group’s integrity.
The Code requires the disclosure of confl icts of interest and, if possible, their elimination. If this is not possible, directors are required to abstain from participation in and not be present during any discussion or decision making process in relation to the subject matter of the confl ict. Each director is personally responsible for the full and proper disclosure to the Board of all related party transactions.
SECURITIES TRADINGEffective August 2006, all directors and offi cers are prohibited from buying or selling Ridley securities other than in the one month commencing two days after the annual general meeting and the announcement by the Company of its full year and half year results and any
CORP
ORAT
E GO
VERN
ANCE
REPO
R T
32

time the individual is in possession of price sensitive information. Previously directors and offi cers were prohibited from buying or selling Ridley securities from the last day in each fi nancial year and half year until two days after the release to the Australian Stock Exchange (ASX) announcement of the full year and half year results. A copy of the securities trading policy is available on the Ridley website www.ridley.com.au
HEDGING OF RIDLEY SECURITIESEffective August 2006, directors and senior executives are not permitted to hedge their exposure to Ridley securities.
CONTINUOUS DISCLOSURE AND SHAREHOLDER COMMUNICATIONRidley makes timely and balanced disclosures of all material matters regarding the Company. All price sensitive information disclosed to the ASX is posted on the Company’s website www.ridley.com.au as soon as it is disclosed to the ASX. Presentation material used in analysts’ briefi ngs is released to the ASX and posted on the Company’s website.
All shareholders receive a copy, unless requested otherwise, of the Company’s annual and half year reports, as well as the Chairman’s address at the AGM. The website contains the past fi ve years’ annual reports and press releases.
Continuous disclosure is a standing agenda item for all Board meetings.
CORPORATE REPORTINGThe Chief Executive Offi cer and the Chief Financial Offi cer provide the Board with an Integrity of the Financial Accounts Declaration in accordance with the Best Practice Recommendations of Principles 4 and 7 of the ASX Corporate Governance Guidelines as follows:
• that the company’s fi nancial reports are complete and present a true and fair view in all material respects of the fi nancial position and performance of the company and consolidated entity
and are in accordance with relevant accounting standards
• that the above statement is founded on a sound system of risk management and internal compliance and controls designed to provide reasonable assurance and which, in all material respects, implements the applicable policies adopted by the Board
• that the risk management and internal compliance and control systems of the company relating to fi nancial reporting objectives are operating effi ciently and effectively in all material respects.
The basis for the Integrity of the Financial Accounts Declaration is a comparison of Ridley’s risk management framework with the recommendations of the report Internal Control – Integrated Framework Organisations (COSO) of the Treadway Commission. Ernst & Young prepared this comparison for Ridley in August 2004.
Compliance with Ridley’s risk management and internal control systems is tested on an ongoing basis by a formalised internal audit program, overseen by the Audit Committee, and supported by reviews of divisional compliance performed by Corporate Finance staff. Divisional management also attest to such compliance.
33

REM
UNER
ATIO
RE
PORT
The overall level of executive reward takes into account the performance of the Group over a number of years, with greater emphasis given to the current year. Since 2001, the consolidated entity’s profi t from ordinary activities after income tax and signifi cant items has grown by 129%. Shareholder wealth has grown by 124% since 2001. Shareholder wealth is defi ned as dividends paid and the increase in share price. Since 2002, when the current remuneration structure was fully implemented, incentive payments have fl uctuated in line with business performance.
Non-executive directorsDirectors’ feesDirectors’ fees were last reviewed with effect from 1 November 2003. The Chairman’s remuneration is inclusive of committee fees while the Chairman of the Audit Committee and non-executive directors who sit on more than one committee receive additional fees.
The Chairman is also provided with an offi ce at the Sydney Corporate Offi ce and secretarial support.
Directors’ fees are determined within an aggregate directors’ fee pool limit, which is periodically recommended to shareholders for approval. The maximum currently stands at $700,000 as approved at the 2003 Annual General Meeting.
Retirement allowances for directorsAt the 2003 Annual General Meeting, shareholders approved the termination of the retirement allowance scheme. Directors accrued entitlement at 31 October 2003 will be paid when they retire.
THIS REPORT FORMS PART OF THE DIRECTORS’ REPORT FOR THE YEAR ENDED 30 JUNE 2006. ALL DISCLOSURES REQUIRED BY AASB 124 RELATED PARTIES HAVE BEEN AUDITED.
REMUNERATION AND NOMINATION COMMITTEEThe Remuneration and Nomination Committee (the “Committee”), consisting of three independent non-executive directors, advises the Board on remuneration policies and practices generally, and makes specifi c recommendations on remuneration packages and other terms of employment for executive directors, other senior executives and non-executive directors. The Committee is also responsible for evaluating the Board’s performance, reviewing Board size and composition, criteria for membership and candidates to fi ll vacancies.
Executive remuneration and other terms of employment are reviewed annually by the Committee, having regard to performance against goals set at the start of the year, relevant comparative information and independent expert advice.
Prior to November 2005, the Committee was named the Remuneration Committee and consisted of two independent non-executive directors and the Managing Director.
REMUNERATION OF DIRECTORS AND EXECUTIVESPrinciples used to determine the nature and amount of remunerationRemuneration packages are set at levels that are intended to attract and retain directors and executives capable of directing and managing the consolidated entity’s diverse operations and achieving the Company’s strategic objectives.
Executive remuneration is structured to align reward with the achievement of annual objectives, successful business strategy implementation and shareholder returns.
N
34

ExecutivesThe executive pay and reward framework has three components:
• base pay and benefi ts
• short-term performance incentives
• long-term incentives.
The combination of these comprises the executive’s total remuneration.
BASE PAY AND BENEFITSAustralian executives receive a total employment cost package, which may be delivered as a mix of cash and prescribed non-fi nancial benefi ts including superannuation, at the executive’s discretion. North American executives are paid a base salary plus benefi ts including motor vehicle, pension and health benefi ts.
External consultants provide analysis and advice to ensure base pay and benefi ts are set to refl ect the market for a comparable role. Base pay for senior executives is reviewed periodically to ensure the executive’s pay is competitive with the market. An executive’s pay may also be reviewed on promotion.
Ridley Corporation Limited and its controlled entities participate in a number of superannuation and pension funds in Australia and North America. The funds provide benefi ts either on a defi ned benefi t or defi ned contribution basis for employees or their dependants on retirement, resignation, total and permanent disability, death and, in some cases, on temporary disablement.
SHORT-TERM INCENTIVESExecutives are eligible for short-term incentive (STI) payments based on two components, being the fi nancial performance and individual key performance indicators (KPIs). The STI is payable in cash after the release of the full year fi nancial results.
Each year, appropriate fi nancial targets and KPIs are set to link the STI plan to the priorities of the Company.
This includes setting any target and maximum payout under the STI plan, and minimum levels of performance to trigger payment of an STI.
The fi nancial performance component of the STI is earned based on the performance against profi t targets set at the commencement of the year. Profi t was selected as the appropriate performance measure for the fi nancial performance component of the STI, as profi t is the key indicator of the success of the Company over the short term.
The KPI component of the STI is earned based on each executive’s performance against their individual KPIs for the year.
For the year ended 30 June 2006, the KPIs were based on group, individual business unit and personal objectives. The KPIs required performance in reducing operating costs and achieving specifi c targets in relation to return on assets as well as other key, strategic non-fi nancial measures, such as safety of operations.
Following the end of the fi nancial year, fi nancial results and each executive’s performance against KPI’s is reviewed to determine STI payments for each executive.
LONG-TERM INCENTIVESIn the fi nancial year ended 30 June 2006, executives’ and employees’ long-term incentives were by participation in the Ridley Corporation Incentive Option Plan, the Ridley Inc Long Term Incentive Program, Ridley Employee Share Scheme and one-off retention plans. These long-term incentive programs align the interests of executives more closely with those of Ridley shareholders and reward sustained superior performance. In addition to the above plans, there remained outstanding awards under the legacy Ridley Inc Stock Option Plan. No grants were made under this legacy plan during the year.
Following a review of the Ridley Corporation Incentive Option Plan
(discussed further below), this plan will be replaced by the new Ridley Corporation Long-Term Incentive Plan. No further grants will be made under the Ridley Corporation Incentive Option Plan.
Directors and senior executives are not permitted to enter into any transaction that is designed or intended to hedge their exposure to Ridley securities. This policy was introduced in August 2006.
CURRENT LONG-TERM INCENTIVE PLANSRidley Corporation Incentive Option Plan The Ridley Corporation Incentive Option Plan was approved by shareholders at the 1993 Annual General Meeting, amended at the 1996 Annual General Meeting, and subsequently amended by the Board in January 2002. Under the Incentive Option Plan, certain employees and the Managing Director of the consolidated entity were offered a number of options, each of which represented a right to acquire one fully paid ordinary share in the capital of the Company for an exercise price determined at grant. The purpose of the Incentive Option Plan was to advance the interests of the Company by affording such persons the opportunity of benefi ting from increases in shareholder value, thereby more closely aligning their interests with those of shareholders. Options were granted under the plan for no consideration.
Offers made under the plan are subject to certain performance criteria being satisfi ed as set out below. If these criteria are not satisfi ed, the options lapse. No money is paid to the Company until the option is exercised. The options have a maximum duration of fi ve years and lapse if not exercised within fi ve years from the date of grant, or within one year of leaving the consolidated entity. The options can only be exercised after a minimum of two years from the date of grant with certain minor exceptions.
The exercise price for options issued from February 2002 onwards is the weighted average price over the fi ve
35

trading days on the ASX prior to the date of grant, multiplied by 5% annual compound growth at the second, third and fourth anniversary of the date of issue. The movement in the share price constitutes the performance criterion for these options to be exercised. The performance criterion was designed to focus executives on growing the share price and delivering value to shareholders.
If Ridley is subject to a change of control during the applicable vesting period, the options will vest to participants at that time and can be exercised.
If a participant ceases employment due to retirement, redundancy, death or permanent disability or sale of a subsidiary, any outstanding options must be exercised within 12 months. If due to resignation or dismissal, options must be exercised within one month.
During the year ended 30 June 2006 1,200,000 (2005: 225,000) ordinary shares were issued on the exercise of options granted under the plan for $813,000 (2005: $192,000). The market value of shares issued during the year was $1,599,000 (2005: $315,000).
No further grants will be made under this plan. The plan will be replaced by the Ridley Corporation Long-Term Incentive Plan discussed on the following page.
Ridley Inc Long Term Incentive ProgramEffective 1 July 2003, Ridley Inc adopted an incentive plan for certain eligible executives known as the Ridley Inc Long Term Incentive Program (the “Program”). The purpose of the Program is to advance the long-term interests of Ridley Inc by attracting and retaining key employees and by stimulating the efforts of such employees to contribute to the continued long-term success and growth of the business.
The President and Chief Executive Offi cer of Ridley Inc is responsible, in his sole discretion, for selecting those executives and employees eligible to participate in
the Program and for administering the Program and determining payments.
Effective 15 September 2005, the Program was amended. Performance units are awarded to the executives annually. The performance units are valued at the end of each fi scal year based on the most recent three-year average return on funds employed (other than the 2006 performance units, which are valued on the fi scal year 2006 return on funds employed, and the 2007 performance units, which will be valued on the fi scal year 2006 and the fi scal year 2007 average return on funds employed). Ridley Inc will redeem performance units three years after their issuance based on such value for cash, subject to certain conditions, such as continuous employment through the Program term, provided a threshold return on funds employed is reached. There was no value attributed to the 2006 performance units.
A participant will be entitled to a pro rata incentive payment should their employment be terminated prior to the date payment is made by reason of death, retirement or disability or if their employment is involuntarily terminated by reason of a redundancy.
Ridley Employee Share SchemeAt the 1999 Annual General Meeting, shareholders approved the introduction of the Ridley Employee Share Scheme. Under the scheme, shares are offered to all permanent Australian employees with a minimum of 12 months’ service, at a discount of up to 50%, fi nanced by an interest-free loan secured against the shares. The maximum discount per employee is limited to $1,000 annually in accordance with relevant Australian taxation legislation. Dividends on the shares are allocated against the loan. The amount of the discount and number of shares allocated is at the discretion of the directors. The purpose of the scheme is to align employee and shareholder interests. 545,444 (2005: 558,540) shares were issued under this scheme
REM
UNER
ATIO
REPO
RTN
36

during the year for $360,000 (2005: $428,000). The market value of the shares issued was $698,000 (2005: $810,000). The total loan amount outstanding at 30 June 2006 was $1,233,000 (2005: $1,094,000).
Retention paymentsIn light of the Canadian legal claims, the Board determined there is a heightened need for consistency and continuity of senior management. To facilitate retention, the Managing Director and the Chief Financial Offi cer are each entitled to receive two payments equal to 50% of base pay if they remain employed by Ridley on 1 June 2007 and 1 June 2009 respectively.
LONG-TERM INCENTIVE PLAN TO BE IMPLEMENTED IN FINANCIAL YEAR ENDING 30 JUNE 2007Ridley Corporation Long-Term Incentive PlanDuring the fi nancial year ended 30 June 2006, a review of the Ridley Corporation Incentive Option Plan was undertaken. The plan was reviewed with respect to commercial need, motivational impact on executives, market practice and corporate governance considerations. The review found that the current plan no longer met the commercial needs of the business nor was in line with current and emerging market practice. The Company resolved to replace the plan with the new Ridley Corporation Long-Term Incentive Plan.
The purpose of the new Ridley Corporation Long-Term Incentive Plan is to provide long-term awards that are linked to shareholder returns.
Under the Ridley Corporation Long-Term Incentive Plan, selected Australian-based executives and the Managing Director may be offered a number of performance rights (“right”). Each right provides the entitlement to acquire one Ridley share at nil cost.
Rights vest subject to Total Shareholder Return (TSR) performance relative to the companies in the ASX 100 to
300 (defi ned at the date of grant). TSR was selected as the performance measure for the plan due to its alignment with the value created for shareholders. Performance is measured over the three-year period from the date of grant. Fifty percent (50%) vests if Ridley ranks at the 51st percentile, 100% vests if Ridley ranks at the 75th percentile or above. There is straight-line vesting between the 51st percentile and 75th percentile. The TSR of Ridley and the comparator companies is measured at the end of the performance period by an independent provider. Results are provided to the Committee for determination of vesting. To the extent that the performance criteria are met, the rights are automatically exercised to acquire shares. If the performance criteria are not satisfi ed, the rights lapse.
If Ridley is subject to a change of control during the vesting period, the rights will vest to participants at that time, subject to performance testing.
If a participant ceases employment prior to the end of the vesting period due to retirement, redundancy, permanent disability or death, any unvested rights will vest to participants, subject to performance testing. If a participant ceases employment prior to the end of the vesting period due to resignation, dismissal or any other reason that makes them no longer eligible for the plan under the rules of the plan, any unvested rights will lapse.
The shares to satisfy awards under the plan may be newly issued or purchased on market.
It is anticipated that the fi rst grants under the new plan will be made in the 2007 fi nancial year. It is intended that grants will then be made on an annual basis.
LEGACY PLANSRidley Inc Stock Option Plan Under the Ridley Inc Stock Option Plan, options to purchase common shares of Ridley Inc could be granted to employees, directors and service
providers of Ridley Inc and its controlled entities and affi liates. The purpose of the Ridley Inc Stock Option Plan was to advance the interests of Ridley Inc by providing participants the opportunity of benefi ting from increases in shareholder value, thereby more closely aligning their interests with those of the shareholders of Ridley Inc.
Options granted under the plan have an exercise price of not less than the market price of the common shares of Ridley Inc at the time of grant based on the closing sale price of common shares on the business day immediately prior to grant. The exercise price of outstanding options under the plan was set a 15% premium to the market price at the time of issue. Options are exercisable over a maximum of 10 years with a minimum two year vesting period. If the options holder ceases to be an employee, director or service provider any vested options must be exercised within 30 days, except in the event of death, redundancy or retirement where the options must be exercised within one year.
During the year ended 30 June 2006, 52,000 shares (2005: 45,000) were issued on the exercise of options granted under the plan for $324,000 (2005: $295,000). The market value of the shares issued was $571,000 (2005: $505,000).
During the year, the plan was amended to provide option holders with a cash settlement alternative when exercising stock options. Under this amendment, option holders exercising options before the close of business on 30 November 2005 could elect to receive cash from Ridley Inc rather than acquiring shares and selling them on the open market. $75,000 was paid to settle 12,000 options during the year.
In August 2006, the plan was amended to provide option holders with a cash settlement alternative until the options expire on 6 November 2006.
37

The Ridley Inc Long Term Incentive Program has replaced this plan and no further grants will be made under this plan.
The following persons were the directors and executives with the greatest authority for the strategic direction and management of the consolidated entity (“key management personnel”) during the fi nancial year and include the fi ve highest paid executives within the Group:
NAME POSITION
2006DIRECTORS J S Keniry ChairmanM P Bickford-Smith Managing DirectorE B Bryan DirectorR J Lee DirectorR J Lotze DirectorA L Vizard Director
EXECUTIVESR E Frost Executive Vice President – Ridley Inc and President – Ridley Nutrition SolutionsM S Mitchell Chief Financial Offi cer – Ridley IncA D Murdoch Chief Executive Offi cer – Ridley AgriProductsJ Murray* Chief Executive Offi cer – Cheetham SaltW J Poynton** Chief Executive Offi cer – Cheetham SaltS J VanRoekel President and Chief Executive Offi cer – Ridley IncI Wilton Chief Financial Offi cer – Ridley Corporation
* Commenced 8 December 2005.** Ceased employment 16 December 2005.
2005DIRECTORSJ S Keniry ChairmanM P Bickford-Smith Managing DirectorE B Bryan DirectorR J Lee DirectorR J Lotze DirectorD G McGauchie* DirectorA L Vizard Director
* Resigned 11 October 2004.
EXECUTIVESR E Frost Executive Vice President – Ridley Inc and President – Ridley Nutrition SolutionsR B Gallaway* Chief Executive Offi cer – Ridley IncM S Mitchell Chief Financial Offi cer – Ridley IncA D Murdoch Chief Executive Offi cer – Ridley AgriProductsW J Poynton** Chief Executive Offi cer – Cheetham SaltS J VanRoekel President and Chief Executive Offi cer – Ridley IncI Wilton Chief Financial Offi cer – Ridley Corporation
* Ceased employment 31 August 2005.** Ceased employment 16 December 2005.
REM
UNER
ATIO
REPO
RTN
38

Service agreementsRemuneration and other terms of employment for the Managing Director, and the Chief Executive Offi cer of Ridley Inc are formalised in service agreements. Each of these agreements provides for the provision of performance-related bonuses, and other benefi ts, and participation, when eligible, in the Ridley Corporation Incentive Option Plan, the Ridley Inc Stock Option Plan and the Ridley Inc Long Term Incentive Program. Other major provisions of the agreements relating to remuneration are set out below:
M P Bickford-Smith, Managing Director, Ridley Corporation Limited
• term of agreement – fi ve years ending November 2007
• base remuneration, inclusive of superannuation, for the year ended 30 June 2006 of $552,426 to be reviewed annually by the Remuneration and Nomination Committee, with base salary increasing by the greater of the percentage increase in CPI and the amount agreed as a result of an independent review
• payment of termination benefi t on early termination by the employer, other than for cause, of $1,000,000
• entitlement to 500,000 options under the Ridley Corporation Incentive Option Plan annually subject to shareholder approval
• incentive bonuses up to 100% of base salary based on the achievement of certain agreed KPIs as approved by the Board
• Mr Bickford-Smith will be entitled to receive two additional payments, each equal to 50% of base remuneration if he remains employed by Ridley on 1 June 2007 and again on 1 June 2009. If Mr Bickford-Smith resigns or has his employment terminated for cause prior to these dates, he will lose his entitlements to these payments. If his employment is terminated by Ridley, without cause, Mr Bickford-Smith will be entitled to these payments in full.
S J VanRoekel, President and Chief Executive Offi cer, Ridley Inc
• base salary US$290,000 per annum to be reviewed annually by the Ridley Inc Board of Directors
• agreement ends 30 June 2009
• incentive bonus of up to 75% of salary based on the achievement of certain agreed KPIs as approved by the Ridley Inc Board of Directors
• motor vehicle allowance, pension and medical benefi ts
• payment of termination benefi ts on early termination by the employer, other than for cause, of two years’ salary.
I Wilton, Chief Financial Offi cer Ridley Corporation LimitedMr Wilton does not have a service agreement, but will be entitled to receive two additional payments, each equal to 50% of base remuneration, if he remains employed by Ridley on 1 June 2007 and again on 1 June 2009. If Mr Wilton resigns or has his employment terminated for cause prior to these dates, he will lose his entitlements to the payments. If employment is terminated by Ridley, without cause, Mr Wilton will be entitled to these payments in full.
Other senior executives are not subject to service agreements and have no fi xed term of employment.
39

DETAILS OF REMUNERATIONDetails of the remuneration of each director of Ridley Corporation Limited and each of the other seven key management personnel of the consolidated entity, including their personally-related entities, are set out in the following tables.
Directors of Ridley Corporation Limited POST- SHARE- EMPLOYMENT BASED 2006 SHORT-TERM BENEFITS BENEFITS PAYMENTS DIRECTORS’ FEES MOVEMENT AND CASH IN LEAVE SUPER- SALARY BONUS PROVISIONS+ ANNUATION OPTIONS TOTALNAME $ $ $ $ $ $
J S Keniry – Chairman 149,540 – – 13,460 – 163,000M P Bickford-Smith – Managing Director 552,426 355,000 3,138 – 122,833 1,033,397E B Bryan 76,958 – – – – 76,958R J Lee 65,064 – 13,936 – 79,000R J Lotze 77,064 – – 6,936 – 84,000A L Vizard 67,890 – – 6,110 – 74,000
POST- SHARE- EMPLOYMENT BASED 2005 SHORT-TERM BENEFITS BENEFITS PAYMENTS DIRECTORS FEES MOVEMENT AND CASH IN LEAVE SUPER- SALARY BONUS PROVISIONS+ ANNUATION OPTIONS TOTALNAME $ $ $ $ $ $
J S Keniry – Chairman 149,540 – – 13,460 – 163,000M P Bickford-Smith – Managing Director 540,534 432,427 27,546 – 121,167 1,121,674E B Bryan 74,000 – – – 74,000R J Lee 71,034 – – 6,393 – 77,427R J Lotze 77,064 – – 6,936 – 84,000D G McGauchie* 29,770 – – 2,679 – 32,449A L Vizard 67,890 – – 6,110 – 74,000
* Resigned 11 October 2004.+ Movement in annual leave and long service leave provisions.
REM
UNER
ATIO
REPO
RTN
40

Other key management personnel of the consolidated entity POST- SHARE- EMPLOYMENT BASED 2006 SHORT-TERM BENEFITS OTHER BENEFITS PAYMENTS MOVEMENT SALARY MOTOR IN LEAVE PACKAGE BONUS VEHICLE PROVISIONS+ OTHER TERMINATION PENSION OPTIONS TOTALNAME $ $ $ $ $ $ $ $ $
R E Frost 290,960 93,949 6,112 – 25,060 – 36,238 – 452,319M S Mitchell 263,250 116,414 8,433 – 24,096 – 35,529 – 447,722A D Murdoch 395,134 159,650 – 18,274 999 – – – 574,057J Murray* 225,806 60,000 – 12,588 – – – – 298,394W J Poynton** 159,183 – – – – 472,046 – – 631,229S J VanRoekel 390,093 282,822 7,511 – 19,839 – 7,066 – 707,331I Wilton 432,408 170,000 – 31,355 999 – – – 634,762
+ Movement in annual leave and long service leave provisions.* Commenced 8 December 2005.** Ceased employment 16 December 2005. POST- SHARE- EMPLOYMENT BASED 2005 SHORT-TERM BENEFITS OTHER BENEFITS PAYMENTS MOVEMENT SALARY MOTOR IN LEAVE PACKAGE BONUS VEHICLE PROVISIONS+ OTHER TERMINATION PENSION OPTIONS TOTALNAME $ $ $ $ $ $ $ $ $
R E Frost 280,186 38,025 6,308 – 22,707 – 30,411 – 377,637R B Gallaway* 441,636 88,325 8,845 – 23,655 – 53,449 – 615,910M S Mitchell 253,502 38,025 8,874 – 23,271 – 30,121 – 353,793A D Murdoch 379,313 149,613 – 23,896 999 – – – 553,821W J Poynton** 380,223 50,000 – (1,769) 999 – – – 429,453S J VanRoekel 333,564 58,039 6,775 – 18,038 – 6,483 – 422,899I Wilton 400,266 170,022 – 12,673 999 – – – 583,960
+ Movement in annual and long service provisions.* Ceased employment 31 August 2005.** Ceased employment 16 December 2005.
Executives of Ridley Corporation Limited SHARE- BASED 2006 SHORT-TERM BENEFITS OTHER PAYMENTS MOVEMENT SALARY OTHER IN LEAVE PACKAGE BONUS BENEFITS PROVISIONS+ TERMINATION OPTIONS TOTALNAME $ $ $ $ $ $ $
M D MacKayBusiness Development Manager 263,900 80,000 999 12,611 – – 357,510A D MurdochCEO Ridley AgriProducts 395,134 159,650 999 18,274 – – 574,057W J Poynton*
CEO Cheetham Salt 159,183 – – – 472,046 – 631,229G P WattsGM Finance & Company Secretary 257,650 66,000 999 (7,924) – – 316,725I WiltonChief Financial Offi cer 432,408 170,000 999 31,355 – – 634,762
+ Movement in annual and long service leave provisions.* Ceased employment 16 December 2005.
The above table includes the fi ve highest paid executives, excluding the Managing Director of Ridley Corporation Limited.
41
For each cash bonus and grant of options included in the above tables, the percentage of the available bonus or grant that was paid, or that vested, in the fi nancial year, and the percentage that was forfeited because the person did not meet the service and performance criteria is set out below. No part of the bonuses or grants of options is payable in future years.
CASH BONUS PAID FORFEITEDNAME % %
R E Frost 31 69M S Mitchell 80 20A D Murdoch 79 21J Murray* 45 55S J VanRoekel 97 3I Wilton 74 26
* Commenced 8 December 2005
Share-based compensation – optionsThe terms and conditions of each grant of options during the year to directors and other key management personnel in this reporting periods are as follows:
VALUE PER EXPIRY EXERCISE OPTION AT DATEGRANT DATE DATE NUMBER PRICE GRANT DATE EXERCISABLE
31 Oct 31 Oct 166,667 $1.51 $0.271 31 Oct2005 2010 200731 Oct 31 Oct 166,667 $1.58 $0.246 31 Oct2005 2010 200831 Oct 31 Oct 166,666 $1.66 $0.220 31 Oct2005 2010 2009
Details of the operation and purpose of the option plan are set out in note 26 in the fi nancial report.
REM
UNER
ATIO
REPO
RTN
42

EQUITY INSTRUMENT DISCLOSURES RELATING TO DIRECTORS AND EXECUTIVESOptions provided as remunerationDetails of options over ordinary shares in the Company provided as remuneration to each director of Ridley Corporation Limited and each of the other key management personnel of the consolidated entity are set out below. When exercisable, each option is convertible into one ordinary share of Ridley Corporation Limited. A B C D CURRENT YEAR VALUE AT VALUE AT VALUE AT REMUNERATION CONSISTING GRANT EXERCISE LAPSE OF OPTIONS DATE DATE DATENAME % $ $ $
M P Bickford-Smith 11.9 122,833 405,000 –I Wilton – – 53,000 –
A = the percentage of the value of remuneration consisting of options, based on the value at grant date set out in column B.B = the value at grant date of options granted during the year as part of remuneration calculated in accordance with AASB 2 Share-based Payment by Disclosing Entities.C = the value at exercise date of options that were granted in prior years as part of remuneration and were exercised during the year.D = the value at lapse date of options that were granted in prior years as part of remuneration and that lapsed during the year.
NUMBER OF OPTIONS NUMBER OF OPTIONSNAME GRANTED DURING THE YEAR VESTED DURING THE YEAR
Directors of Ridley Corporation LimitedM P Bickford-Smith 500,000 333,334Other key management personnel of the consolidated entityI Wilton – 266,666W J Poynton* – 149,999A D Murdoch – 199,999
* Ceased employment 16 December 2005.
Shares provided on exercise of optionsDetails of ordinary shares in the Company provided as a result of the exercise of options to each director of Ridley Corporation Limited and each of the other key management personnel of the consolidated entity are set out below:
NUMBER OF ORDINARY SHARES EXERCISE PRICE DATE OF EXERCISE ISSUED ON EXERCISE OF NAME OF OPTIONS OF OPTIONS OPTIONS DURING THE YEAR
Directors of Ridley Corporation LimitedM P Bickford-Smith 0.59 16 Sep 2005 500,000Other key management personnel of the consolidated entityI Wilton 0.72 16 Feb 2006 100,000
No amounts are unpaid on any shares issued on the exercise of options
43

Option holdingsThe numbers of options over ordinary shares in the Company held during the fi nancial year by each director of Ridley Corporation Limited and each of the other key management personnel of the consolidated entity, including their personally-related entities, are set out below:
GRANTED VESTED AND BALANCE AT DURING THE EXERCISED BALANCE AT EXERCISABLE THE START OF YEAR AS DURING THE THE END OF AT THE END OFNAME THE YEAR REMUNERATION YEAR THE YEAR THE YEAR
Directors of Ridley Corporation LimitedM P Bickford-Smith 2,500,000 500,000 500,000 2,500,000 1,000,000Other key management personnel of the consolidated entityI Wilton 900,000 – 100,000 800,000 400,000W J Poynton* 700,000 – – 700,000 483,333A D Murdoch 600,000 – – 600,000 283,332
* Ceased employment 16 December 2005.
No options are vested and unexercisable at the end of the year
Ridley Inc option holdings GRANTED VESTED AND BALANCE AT DURING THE EXERCISED EXPIRED BALANCE AT EXERCISABLE THE START OF YEAR AS DURING THE DURING THE THE END OF AT THE END OFNAME THE YEAR REMUNERATION YEAR YEAR THE YEAR THE YEAR
Directors of Ridley Corporation LimitedJ S Keniry 28,000 – – 14,000 14,000 14,000Other key management personnel of the consolidated entityS J VanRoekel 20,000 – – 10,000 10,000 10,000R E Frost 20,000 – – 10,000 10,000 10,000M S Mitchell 15,000 – 10,000 5,000 – –
REM
UNER
ATIO
REPO
RTN
44

LOANS TO DIRECTORS AND EXECUTIVESAggregate of loans made to directors of Ridley Corporation Limited and the other key management personnel of the consolidated entity including their personally-related entities, are set out below:
BALANCE AT THE BALANCE AT THE NUMBER IN GROUP START OF THE YEAR END OF THE YEAR AT THE END OF THE YEAR2006 $ $
Directors of Ridley Corporation Limited Nil Nil NilOther key management personnel of the consolidated entity 12,405 5,279 2
BALANCE AT THE BALANCE AT THE NUMBER IN GROUP START OF THE YEAR END OF THE YEAR AT THE END OF THE YEAR2005 $ $
Directors of Ridley Corporation Limited Nil Nil NilOther key management personnel of the consolidated entity 9,760 12,405 4
The loans are interest-free and secured against shares issued under the Ridley Employee Share Scheme
45

The directors submit the income statements at 30 June 2006, balance sheets, statements of recognised income and expense and statements of cash fl ows for the year ended on that date for the Company and the consolidated entity and report as follows:
1. DIRECTORSThe directors of Ridley Corporation Limited at any time during or since the fi nancial year are as follows:
J S Keniry
M P Bickford-Smith
E B Bryan
R J Lee
R J Lotze
A L Vizard.
2. PRINCIPAL ACTIVITIESThe principal continuing activities of the consolidated entity during the year were production and marketing of stockfeed and animal feed supplements and the production of crude salt, salt refi ning and marketing.
3. RESULTS 2006 2005 $’000 $’000
Profi t from continuing operations before income tax expense 45,571 43,316
Income tax expense 11,917 (1,856)
Profi t from continuing operations after income tax expense 33,654 45,172
Profi t/(loss) from discontinued operations 75 (191)
Profi t attributable to minority interest 6,040 5,012
Profi t attributable to members of Ridley Corporation Limited 27,689 39,969
An increase in the deferred income tax benefi t of $12,014,000 ($9,272,000 of which was recorded as a signifi cant item) was recognised in the prior year from resetting tax values of certain assets in 100% Australian-owned entities that entered into the Australian tax consolidated group.
Comparative information for the year ended 30 June 2005 has been restated in accordance with the Australian equivalents to International Financial Reporting Standards (AIFRS).
4. REVIEW OF OPERATIONS/SIGNIFICANT CHANGES IN THE STATE OF AFFAIRSA review of:
i) operations and fi nancial matters including signifi cant changes in the state of affairs;
ii) the results of those operations; and
iii) likely developments
is set out on pages 1 to 27 in the Annual Report.
DIRE
CTOR
S’RE
PORT
FOR
THE
YEAR
END
ED 3
0 JU
NE 2
006
46

5. DIVIDENDSDividends paid to members during the fi nancial year were as follows:
2006 2005 $’000 $’000
Final dividend for the year ended 30 June 2005 of 3.25 cents (2004: 3.25 cents) per share paid on 7 October 2005 8,894 8,769
Interim dividend for the year ended 30 June 2006 of 3.50 cents (2005: 3.25 cents) per share paid on 31 March 2006 9,703 8,824
18,597 17,593
Dividend franking amounts are disclosed in note 6 of the fi nancial report.
In addition to the above, directors have declared a fi nal dividend of 3.50 cents per share (50% franked) with $9,862,000 to be paid on 10 October 2006 out of retained profi ts at 30 June 2006.
6. ENVIRONMENTAL REGULATIONRidley has environmental and risk management reporting processes, which provide senior management and the directors with monthly reports on environmental matters, including rectifi cation actions for any issues as discovered. The directors are not aware of any environmental matters likely to have a material fi nancial impact.
In accordance with its environmental procedures, Ridley monitors environmental compliance of all of its operations on an ongoing basis.
7. DIRECTORS’ AND EXECUTIVES’ REMUNERATION Refer to remuneration report.
8. SHARE OPTIONSUnissued ordinary shares of Ridley Corporation Limited and controlled entities under option at the date of this report are as follows:
NUMBER EXPIRY DATE
Ridley Corporation Limited – Incentive Option Plan 8,175,000 Various
Ridley Inc – Stock Option Plan 92,500 6 Nov 2006
No option holder has any right under the options to participate in any other share issue of the Company or of any other controlled entity. The entity will issue shares when the options are exercised.
The names of all persons who currently hold options granted under the option plans are entered in the register kept by the Company, pursuant to section 215 of the Corporations Act 2001. The register is available for inspection at the Company’s registered offi ce.
9. INFORMATION ON DIRECTORS The profi le of the directors together with the particulars of shares and options held by directors in the Company are set out on pages 28, 29 and note 28 in the fi nancial report.
47

10. MEETINGS OF DIRECTORS AUDIT REMUNERATION & RISK REVIEW BOARD COMMITTEE NOMINATION COMMITTEE COMMITTEE
MEETINGS MEETINGS MEETINGS MEETINGS HELD HELD HELD HELD WHILE A MEETINGS WHILE A MEETINGS WHILE A MEETINGS WHILE A MEETINGSDIRECTORS DIRECTOR ATTENDED MEMBER ATTENDED MEMBER ATTENDED MEMBER ATTENDED
J S Keniry 14 14 – – 2 2 – –
M P Bickford-Smith 14 14 – – 1 1 3 3
E B Bryan 14 13 4 4 1 1 – –
R J Lee 14 13 4 4 2 2 – –
R J Lotze 14 14 4 4 – – – –
A L Vizard 14 12 – – – – 3 3
11. POST BALANCE DATE EVENTSNo matters or circumstances have arisen since 30 June 2006 that have signifi cantly affected, or may signifi cantly affect:
i) the consolidated entity’s operations in future fi nancial years; or
ii) the results of those operations in future fi nancial years; or
iii) the consolidated entity’s state of affairs in future fi nancial years.
12. INSURANCERegulation 113 of the Company’s Constitution indemnifi es offi cers to the extent now permitted by law.
A Deed of Indemnity was approved by shareholders at the 1998 Annual General Meeting. Subsequent to this approval, the Company has entered into the Deed of Indemnity with all the directors and secretary of the Company and the directors of all the subsidiaries.
The deed requires the Company to maintain insurance to cover the directors in relation to liabilities incurred while acting as a director of the Company or a subsidiary and costs involved in defending proceedings.
During the year, the Company paid a premium in respect of such insurance covering the following directors and secretary of Ridley Corporation Limited: J S Keniry, M P Bickford-Smith, E B Bryan, R J Lee, R J Lotze, A L Vizard and G P Watts.
13. NON-AUDIT SERVICESThe Company may decide to employ the auditor (PricewaterhouseCoopers) on assignments additional to its statutory audit duties where the auditor’s expertise and experience with the Company and/or the consolidated entity are important.
Details of the amounts paid or payable to the auditor for non-audit services provided during the year are set out on the following page.
The Board has considered the position and, in accordance with the advice received from the Audit Committee, is satisfi ed that the provision of the non-audit services is compatible with the general standard of independence for auditors imposed by the Corporations Act 2001. The directors are satisfi ed that the provision of non-audit services by the auditor, as set out on the following page, did not compromise the auditor independence requirements of the Corporations Act 2001 for the following reasons:
DIRE
CTOR
S’RE
PORT
FOR
THE
YEAR
END
ED 3
0 JU
NE 2
006
48
• All non-audit services have been reviewed by the Audit Committee to ensure they do not impact the impartiality and objectivity of the auditor.
• None of the services undermine the general principles relating to auditor independence as set out in Professional Statement F1, including reviewing or auditing the auditor’s own work, acting in a management or a decision-making capacity for the Company, acting as advocate for the Company or jointly sharing economic risk and rewards.
A copy of the auditor’s independence declaration as required under section 307C of the Corporations Act 2001 is set out on page 50.
During the year, the following fees were paid or payable for services provided by the auditor of the parent entity, its related practices and non-related audit fi rms:
Tax compliance service $731,861
Taxation and other advice on corporate restructuring $260,000
Assurance-related services $145,000
14. ROUNDING OF AMOUNTS TO NEAREST THOUSAND DOLLARSThe Company is of a kind referred to in Class Order 98/0100 issued by the Australian Securities and Investments Commission relating to the “rounding off” of amounts in the directors’ report and fi nancial report. Amounts in the directors’ report and the fi nancial report have been rounded off to the nearest thousand dollars in accordance with that Class Order or in certain cases to the nearest dollar.
15. AUDITORPricewaterhouseCoopers continues in offi ce in accordance with section 327 of the Corporations Act 2001.
Signed in Sydney this 21st day of August 2006 in accordance with a resolution of the directors.
J S KENIRY DIRECTOR
R J LOTZEDIRECTOR
49

AUDI
TOR’
SIN
DEPE
NDEN
CEDE
CLAR
ATIO
As lead auditor for the audit of Ridley Corporation Limited for the year ended 30 June 2006, I declare that to the best of my knowledge and belief, there have been:
(a) no contraventions of the auditor independence requirements of the Corporations Act 2001 in relation to the audit; and
(b) no contraventions of any applicable code of professional conduct in relation to the audit.
This declaration is in respect of Ridley Corporation Limited and its controlled entities during the year.
S J BOURKEPARTNERPricewaterhouseCoopers
Sydney
21 August 2006
N
50

FINA
NCIA
L RE
PORT
FOR
THE
YEAR
END
ED 3
0 JU
NE 2
006
52 INCOME STATEMENTS 53 BALANCE SHEETS 54 STATEMENTS OF RECOGNISED
INCOME AND EXPENSE 55 STATEMENTS OF CASH FLOWS
56 NOTES TO THE FINANCIAL STATEMENTS 56 Note 1. Summary of signifi cant
accounting policies63 Note 2. Revenue63 Note 3. Other income63 Note 4. Expenses64 Note 5. Income tax65 Note 6. Dividends66 Note 7. Receivables66 Note 8. Inventories66 Note 9. Other67 Note 10. Property, plant
and equipment68 Note 11. Intangible assets69 Note 12. Deferred tax assets70 Note 13. Payables70 Note 14. Interest bearing liabilities71 Note 15. Tax liabilities71 Note 16. Provisions72 Note 17. Contributed equity73 Note 18. Reserves and
retained profi ts74 Note 19. Minority interest74 Note 20. Equity74 Note 21. Financial risk management75 Note 22. Derivative fi nancial
instruments77 Note 23. Commitments
for expenditure78 Note 24. Contingent liabilities78 Note 25. Remuneration of auditors
79 Note 26. Employee entitlements 85 Note 27. Related party disclosures 86 Note 28. Directors and key
management personnel disclosures 90 Note 29. Business and
geographical data 91 Note 30(i). Reconciliation of net
cash infl ow from operating activities to profi t after income tax
92 Note 30(ii). Reconciliation of cash 92 Note 31. Non-cash fi nancing and
investing activities 92 Note 32. Finance facilities 93 Note 33. Earnings per share 94 Note 34. Investments in
controlled entities 97 Note 35. Deed of cross guarantee 99 Note 36. Investments in associates100 Note 37. Interests in joint ventures101 Note 38. Explanation of transition
to AIFRS107 Note 39. Post balance date events
108 DIRECTORS’ DECLARATION 109 INDEPENDENT AUDIT REPORT 110 SHAREHOLDER INFORMATION 112 CORPORATE DIRECTORY

52
CONSOLIDATED PARENT ENTITY
2006 2005 2006 2005 NOTE $’000 $’000 $’000 $’000
Sales revenue from continuing operations 2 1,258,675 1,153,099 – –Cost of sales 1,079,380 986,089 – –
GROSS PROFIT 179,295 167,010 – –
Other revenues from continuing operations 2 4,224 5,712 37,688 30,973Other income 3 2,152 377 520 –Other expenses from continuing operations
Selling and distribution (59,198) (55,736) – –General and administrative (65,618) (68,074) (10,290) (9,258)Finance costs 4 (15,169) (11,195) (11,695) (6,740)Other (6,061) (857) (1,665) (763)
Share of net profi ts from associates 36 5,946 6,079 – –
PROFIT FROM CONTINUING OPERATIONS BEFORE INCOME TAX EXPENSE 45,571 43,316 14,558 14,212
Income tax expense/(benefi t) 5 11,917 (1,856) 237 (9,556)
PROFIT FROM CONTINUING OPERATIONS AFTERINCOME TAX EXPENSE 33,654 45,172 14,321 23,768
Profi t/(loss) from discontinued operations 34 75 (191) – –
PROFIT FOR THE YEAR 33,729 44,981 14,321 23,768
Profi t attributable to minority interest 6,040 5,012 – –
NET PROFIT AFTER TAX ATTRIBUTABLE TO MEMBERS OF RIDLEY CORPORATION LIMITED 27,689 39,969 14,321 23,768
Basic earnings per share from continuing operations 33 10.0c 14.8c Basic earnings per share 33 10.0c 14.7c Diluted earnings per share from continuing operations 33 10.0c 14.7c Diluted earnings per share 33 10.0c 14.7c
The above income statements should be read in conjunction with the accompanying notes.
INCO
ME
STAT
EMEN
TS
FOR
THE
YEAR
END
ED 3
0 JU
NE 2
006

53
CONSOLIDATED PARENT ENTITY
2006 2005 2006 2005 NOTE $’000 $’000 $’000 $’000
CURRENT ASSETS Cash and cash equivalents 30(ii) 7,400 10,987 3,210 2Receivables 7 120,102 109,023 649 2,192Inventories 8 128,293 110,444 – –Other current assets 9 176 182 – –Derivative fi nancial instruments 22 621 – 393 –TOTAL CURRENT ASSETS 256,592 230,636 4,252 2,194
NON-CURRENT ASSETS Receivables 7 2,719 5,492 273,875 266,279Investments accounted for using the equity method 36 44,074 44,083 – –Property, plant and equipment 10 404,674 370,938 4,478 4,263Deferred tax assets 12 – – 366 375Intangible assets 11 68,337 62,621 – 4Retirement benefi t assets 26 135 – – –Other non-current assets 9 378 2,222 108,453 109,348TOTAL NON-CURRENT ASSETS 520,317 485,356 387,172 380,269
TOTAL ASSETS 776,909 715,992 391,424 382,463
CURRENT LIABILITIES Payables 13 136,850 131,653 2,998 2,312Interest bearing liabilities 14 6,125 11,681 – 20,098Current tax liabilities 15 – 2,551 – 795Provisions 16 13,370 11,889 515 580TOTAL CURRENT LIABILITIES 156,345 157,774 3,513 23,785
NON-CURRENT LIABILITIES Interest bearing liabilities 14 172,737 163,416 144,500 121,500Deferred tax liabilities 15 39,386 27,648 – –Provisions 16 2,180 3,181 654 782Retirement benefi t obligations 26 12,191 12,544 – –TOTAL NON-CURRENT LIABILITIES 226,494 206,789 145,154 122,282
TOTAL LIABILITIES 382,839 364,563 148,667 146,067
NET ASSETS 394,070 351,429 242,757 236,396
EQUITY Contributed equity 17 210,633 201,009 210,633 201,009Reserves 18 85,938 69,960 16,395 15,376Retained profi ts 18 41,626 34,492 15,729 20,011
PARENT ENTITY INTEREST 338,197 305,461 242,757 236,396
Minority interest 19 55,873 45,968 – –
TOTAL EQUITY 394,070 351,429 242,757 236,396
The above balance sheets should be read in conjunction with the accompanying notes.
BALA
NCE
SHEE
TS
AT 3
0 JU
NE 2
006

54
CONSOLIDATED PARENT ENTITY 2006 2005 2006 2005 NOTE $’000 $’000 $’000 $’000
INCOME AND EXPENSES RECOGNISED DIRECTLY IN EQUITY Adjustment on the adoption of new accounting standards for fi nancial instruments (note 1) 18 (457) – (89) –
Gain/(loss) on revaluation of land and buildings 18 15,069 (1,192) 370 –Deferred tax recognised on revaluation of land and buildings (5,183) 6,803 (111) –Actuarial losses on defi ned benefi t superannuation and pension plans, net of tax 18 (2,172) (2,440) – –Exchange differences on translation of foreign operations 18 10,000 (11,319) – –
NET INCOME/(EXPENSE) RECOGNISED DIRECTLY IN EQUITY 17,257 (8,148) 170 –PROFIT FOR THE YEAR 20 33,729 44,981 14,321 23,768TOTAL RECOGNISED INCOME AND EXPENSE FOR THE YEAR 50,986 36,833 14,491 23,768
Total recognised income and expense for the year is attributable to: Ridley Corporation Limited 41,081 36,024 14,491 23,768Minority interest 9,905 809 – – 50,986 36,833 14,491 23,768
The above statements of recognised income and expense should be read in conjunction with the accompanying notes.STAT
EMEN
TS O
F RE
COGN
ISED
INCO
ME
AND
EXPE
NSE
FOR
THE
YEAR
END
ED 3
0 JU
NE 2
006

55
CONSOLIDATED PARENT ENTITY 2006 2005 2006 2005 NOTE $’000 $’000 $’000 $’000
CASH FLOWS FROM OPERATING ACTIVITIES Receipts from customers 1,325,125 1,189,108 7,910 5,321Payments to suppliers and employees (1,271,873) (1,104,870) (11,416) (8,889)Dividends received 5,935 6,035 12,525 10,600Interest received 1,074 1,346 20,055 15,052Interest and other costs of fi nance paid (13,445) (10,326) (11,191) (6,173)Income taxes paid (7,280) (14,022) (1,032) (865)NET CASH INFLOW FROM OPERATING ACTIVITIES 30(i) 39,536 67,271 16,851 15,046
CASH FLOWS FROM INVESTING ACTIVITIES Payments for acquisition of businesses and controlled entities net of cash acquired 34 (10,154) (79,444) – –Payments for property, plant and equipment (24,952) (22,460) (70) (3)Payments for intangibles (1,302) (403) – –Deferred expenditure (157) (8) – (8)Proceeds from sale of non-current assets 927 2,527 – –Repayment of customer loans 3,545 2,972 – –Issue of customer loans (1,450) (921) – –Loans to controlled entities – – (7,597) (70,974)NET CASH OUTFLOW FROM INVESTING ACTIVITIES (33,543) (97,737) (7,667) (70,985)
CASH FLOWS FROM FINANCING ACTIVITIES Proceeds from issue of shares: Employee options exercised 813 193 813 193 Employee in-substance options 79 104 79 104 Ridley Inc employees’ options exercised 328 292 – –Shares repurchased – (856) – (856)Proceeds from borrowings 152,385 143,801 128,500 96,500Repayment of borrowings (156,041) (100,798) (105,500) (50,000)Dividends paid (9,770) (12,128) (9,770) (12,128)Net cash infl ow/(outfl ow) from fi nancing activities (12,206) 30,608 14,122 33,813NET INCREASE/(DECREASE) IN CASH HELD (6,213) 142 23,306 (22,126)
CASH AT THE BEGINNING OF THE FINANCIAL YEAR 7,496 7,900 (20,096) 2,030EFFECTS OF EXCHANGE RATE VARIATIONS ON CASH 239 (546) – –CASH AT THE END OF THE FINANCIAL YEAR 30(ii) 1,522 7,496 3,210 (20,096)
Non-cash fi nancing and investing activities 31
The above statements of cash fl ows should be read in conjunction with the accompanying notes.
STAT
EMEN
TS O
F CA
SH F
LOW
S FO
R TH
E YE
AR E
NDED
30
JUNE
200
6

56
NOTE
S TO
THE
FINA
NCIA
L ST
ATEM
ENTS
30
JUNE
200
6
NOTE 1. SUMMARY OF SIGNIFICANT ACCOUNTING POLICIESBASIS OF PREPARATION This general purpose fi nancial report has been prepared in accordance with Australian equivalents to International Financial Reporting Standards (AIFRS), other authoritative pronouncements of the Australian Accounting Standards Board, Urgent Issues Group (UIG) Interpretations and the Corporations Act 2001.
COMPLIANCE WITH INTERNATIONAL FINANCIAL REPORTING STANDARDSAustralian Accounting Standards include AIFRS. Compliance with AIFRS ensures that the consolidated fi nancial statements and notes of Ridley Corporation Limited comply with International Financial Reporting Standards (IFRS).
APPLICATION OF AASB 1 FIRST-TIME ADOPTION OF AUSTRALIAN EQUIVALENTS TO INTERNATIONAL FINANCIAL REPORTING STANDARDSThese fi nancial statements are the fi rst full year Ridley Corporation Limited fi nancial statements to be prepared in accordance with AIFRS. AASB 1 First-time Adoption of Australian Equivalents to International Financial Reporting Standards has been applied in preparing these fi nancial statements. Financial statements of Ridley Corporation Limited until 30 June 2005 had been prepared in accordance with previous Australian Generally Accepted Accounting Principles (AGAAP). AGAAP differ in certain respects from AIFRS. When preparing Ridley Corporation Limited 2006 fi nancial statements, management has amended certain accounting, valuation and consolidation methods applied in the AGAAP fi nancial statements to comply with AIFRS. With the exception of fi nancial instruments, the comparative fi gures in respect of 2005 were restated to refl ect these adjustments. The Group has taken the exemption available under AASB 1 to only apply AASB 132 Financial Instruments: Disclosure and Presentation and AASB 139 Financial Instruments: Recognition and Measurement from 1 July 2005, and not restate comparative information for these standards. Reconciliations and descriptions of the effect of transition from previous AGAAP to AIFRS on the Group’s equity and its net income are given in note 38.
EARLY ADOPTION OF STANDARDSThe Group has elected to apply AASB 119 Employee Benefi ts (issued in December 2004). This includes applying the standard to the comparatives in accordance with AASB 1 First-time Adoption of AIFRS.
HISTORICAL COST CONVENTIONThese fi nancial statements have been prepared under the historical cost convention, as modifi ed by the revaluation of fi nancial assets and liabilities, including derivative instruments at fair value through profi t or loss, and certain classes of property, plant and equipment.
PRINCIPLES OF CONSOLIDATION(i) SubsidiariesThe consolidated fi nancial statements incorporate the assets and liabilities of all subsidiaries of Ridley Corporation Limited the “parent entity” as at 30 June 2006 and the results of all subsidiaries for the year then ended. Ridley Corporation Limited and its subsidiaries together are referred to in this fi nancial report as “the Group” or “the consolidated entity”.
Subsidiaries are all those entities, including special purpose entities, over which the consolidated entity has the power to govern the fi nancial and operating policies, generally accompanying a shareholding of more than one half of the voting rights. The existence and effect of potential voting rights that are currently exercisable or convertible are considered when assessing whether the consolidated entity controls another entity.
Subsidiaries are fully consolidated from the date on which control is transferred to the Group. They are deconsolidated from the date that control ceases.
Intercompany transactions, balances and unrealised gains and losses on transactions between Group companies are eliminated. Accounting policies of subsidiaries have been changed where necessary to ensure consistency with the policies adopted by the Group.
Minority interest in the results and equity of subsidiaries is shown separately in the consolidated income statement and balance sheet respectively.
Investments in subsidiaries are accounted for at cost in the parent entity.
(ii) AssociatesAssociates are all entities over which the Group has signifi cant infl uence but not control, generally accompanying a shareholding of between 20% and 50% of the voting rights. Investments in associates are accounted for at cost within the parent entity’s fi nancial statement and in the consolidated fi nancial statements using the equity method of accounting, after initially being recognised at cost. The Group’s investment in associates includes intangibles identifi ed on acquisition.
The Group’s share of its associates’ post acquisition profi ts or losses is recognised in the income statement, and its share of post acquisition movements in reserves is recognised in reserves. The cumulative post acquisition movements are adjusted against the carrying amount of the investment. Dividends receivable from associates reduce the carrying amount of the investment.
Unrealised gains on transactions between the Group and its associates are eliminated to the extent of the Group’s interests in the associates. Accounting policies of associates have been changed where necessary to ensure consistency with the policies adopted by the Group.

57
NOTE 1. SUMMARY OF SIGNIFICANT ACCOUNTING POLICIES (CONTINUED)PRINCIPLES OF CONSOLIDATION (CONTINUED)(iii) Jointly controlled assetsThe proportionate interests in the assets, liabilities and expenses of joint venture activities have been incorporated within the fi nancial statements under the appropriate headings.
SEGMENTAL REPORTINGThe Group operates in a number of business and geographic segments. A segment is identifi ed as a group of assets and operations engaged in providing products where the risks and returns are different to those of the other segments.
FOREIGN CURRENCY TRANSLATION(i) Functional and presentation currencyItems included in the fi nancial statements of each of the Group’s entities are measured using the currency of the primary economic environment in which the entity operates (the functional currency). The consolidated fi nancial statements are presented in Australian dollars, which is the Group’s functional and presentation currency.
(ii) Transactions and balancesForeign currency transactions are translated into the functional currency using the exchange rates prevailing at the dates of the transactions. Foreign exchange gains and losses resulting from the settlement of such transactions and from the translation at year-end exchange rates of monetary assets and liabilities denominated in foreign currencies are recognised in the income statement, except when deferred in equity as qualifying cash fl ow hedges.
(iii) Group companiesThe results and fi nancial position of all the Group entities that have a functional currency different from the presentation currency are translated into the presentation currency as follows:• assets and liabilities for each balance sheet presented are translated at the closing rate at the date of that
balance sheet• income and expenses for each income statement are translated at average exchange rates and,• all resulting exchange differences are recognised as a separate component of equity.
On consolidation, exchange differences arising from the translation of any net investment in foreign entities, and of borrowings and other currency instruments designated as hedges of such investments, are taken to shareholders’ equity. Goodwill and fair value adjustments arising on the acquisition of a foreign entity are treated as assets and liabilities of the foreign entity and translated at the closing rate.
The exchange rates used to convert foreign Group entities are as follows:
2006 2005
One Australian dollar equivalentBalance Sheet (year-end rate) United States dollar 0.7421 0.7640 Canadian dollar 0.8270 0.9495Income Statement (average rate) United States dollar 0.7434 0.7495 Canadian dollar 0.8630 0.9398
PROPERTY, PLANT AND EQUIPMENTLand and buildings, and salt fi elds are shown at fair value, based on periodic, but at least triennial, valuations by external independent valuers, less subsequent depreciation for buildings. Any accumulated depreciation at the date of revaluation is eliminated against the gross carrying amount of the asset and the net amount is restated to the revalued amount of the asset. All other property, plant and equipment is stated at historical cost less depreciation. Historical cost includes expenditure that is directly attributable to the acquisition of the items.
Subsequent costs are included in the asset’s carrying amount or recognised as a separate asset, as appropriate, only when it is probable that future economic benefi ts associated with the item will fl ow to the Group and the cost of the item can be measured reliably. All repairs and maintenance are charged to the income statement during the fi nancial period in which they are incurred.
Increases in the carrying amounts arising on revaluation of land and buildings and salt fi elds are credited (net of tax) to the property, plant and equipment revaluation reserve in shareholders’ equity. To the extent that the increase reverses a decrease previously recognised in profi t or loss, the increase is fi rst recognised in profi t and loss. Decreases that reverse previous increases of the same asset are fi rst charged against revaluation reserves directly in equity to the extent of the remaining reserve attributable to the asset; all other decreases are charged to the income statement. Land and salt fi elds are not depreciated. Depreciation of other assets is calculated using the straight-line method to allocate their cost or revalued amounts, net of their residual values, over their estimated useful lives, as follows:
• Buildings 40 years• Plant and equipment 3–30 years.
The assets’ residual values and useful lives are reviewed and adjusted, if appropriate, at each balance sheet date.Gains and losses on disposals are determined by comparing proceeds with carrying amount. These are included in the income statement.

58
NOTE
S TO
THE
FINA
NCIA
L ST
ATEM
ENTS
30
JUNE
200
6
NOTE 1. SUMMARY OF SIGNIFICANT ACCOUNTING POLICIES (CONTINUED)INCOME TAXThe income tax expense for the period is the tax payable on the current period’s taxable income based on the income tax rate for each jurisdiction adjusted by changes in deferred tax assets and liabilities attributable to temporary differences between the tax bases of assets and liabilities and their carrying amounts in the fi nancial statements, and to unused tax losses.
Deferred tax assets and liabilities are recognised for temporary differences at the tax rates expected to apply when the assets are recovered or liabilities are settled, based on those tax rates which are enacted or substantively enacted for each jurisdiction. The relevant tax rates are applied to the cumulative amounts of deductible and taxable temporary differences to measure the deferred tax asset or liability. An exception is made for certain temporary differences arising from the initial recognition of an asset or a liability. No deferred tax asset or liability is recognised in relation to these temporary differences if they arose in a transaction, other than a business combination, that at the time of the transaction did not affect either accounting profi t or taxable profi t or loss.
Deferred tax assets are recognised for deductible temporary differences and unused tax losses only if it is probable that future taxable amounts will be available to utilise those temporary differences and losses.
Deferred tax liabilities and assets are not recognised for temporary differences between the carrying amount and tax bases of investments in controlled entities where the parent entity is able to control the timing of the reversal of the temporary differences and it is probable that the differences will not reverse in the foreseeable future.
Deferred tax assets and liabilities are offset when there is a legally enforceable right to offset current tax assets and liabilities and when the deferred tax balances relate to the same taxation authority. Current tax assets and tax liabilities are offset where the entity has a legally enforceable right to offset and intends either to settle on a net basis, or to realise the asset and settle the liability simultaneously.
Current and deferred tax balances attributable to amounts recognised directly in equity are also recognised directly in equity.
TAX CONSOLIDATION Ridley Corporation Limited and its wholly-owned Australian controlled entities have implemented the tax consolidation legislation as of 1 July 2003.
The head entity, Ridley Corporation Limited, and the controlled entities in the tax consolidated group continue to account for their own current and deferred tax amounts. These tax amounts are measured using a stand alone taxpayer method of allocation as outlined in the Group’s tax sharing agreement.
In addition to its own current and deferred tax amounts, Ridley Corporation Limited also recognises the current tax liabilities (or assets) and the deferred tax assets arising from unused tax losses and unused tax credits assumed from controlled entities in the tax consolidated group. Assets or liabilities arising under tax funding arrangements with the tax consolidated entities are recognised as amounts receivable from or payable to other entities in the Group and settled through the intercompany accounts.
Any difference between the amounts assumed and amounts receivable or payable under the tax funding agreement are recognised as a contribution to, or distribution from, wholly-owned tax consolidated entities.
BUSINESS COMBINATIONSThe purchase method of accounting is used to account for all acquisitions of assets, including business combinations, regardless of whether equity instruments or other assets are acquired. Cost is measured as the fair value of the assets given, shares issued or liabilities incurred or assumed at the date of exchange plus costs directly attributable to the acquisition.
Identifi able assets acquired and liabilities and contingent liabilities assumed in a business combination are measured initially at their fair values at the acquisition date, irrespective of the extent of any minority interest. The excess of the cost of acquisition over the fair value of the Group’s share of the identifi able net assets acquired is recorded as goodwill. If the cost of acquisition is less than the fair value of the identifi able net assets of the subsidiary acquired, the difference is recognised directly in the income statement, only after a reassessment of the identifi cation and measurement of the net assets acquired.
Ridley Corporation Limited has taken the exemption available under AASB 1 to apply AASB 3 Business Combinations only to business combinations after 1 July 2004.
Where settlement of any part of cash consideration is deferred, the amounts payable in the future are discounted to their present value as at the date of exchange. The discount rate used is the entity’s incremental borrowing rate, being the rate at which a similar borrowing could be obtained from an independent fi nancier under comparable terms and conditions.

59
NOTE 1. SUMMARY OF SIGNIFICANT ACCOUNTING POLICIES (CONTINUED)FINANCIAL INSTRUMENTSFrom 1 July 2004 to 30 June 2005The Group has taken the exemption available under AASB 1 to apply AASB 132 and AASB 139 only from 1 July 2005. The Group has applied previous AGAAP in the comparative information on fi nancial instruments within the scope of AASB 132 and AASB 139. Financial instruments, mainly interest rate swaps, were not measured at basis value as at 30 June 2005.
Adjustments on transition date: 1 July 2005The nature of the main adjustments to make this information comply with AASB 132 and AASB 139 are that derivatives are measured on a fair value basis. Changes in fair value are either taken to the income statement or an equity reserve. At the date of transition, 1 July 2005, changes in the carrying amounts of derivatives are taken to retained earnings or reserves, depending on whether the criteria for hedge accounting are satisfi ed at the transition date. Details of adjustments recorded as at 1 July 2005 on adoption of AASB 132 and AASB 139 are set out in note 22.
From 1 July 2005Derivatives are initially recognised at fair value on the date a derivative contract is entered into and are subsequently remeasured to their fair value at each reporting date. The resulting gain or loss is recognised in the income statement unless the derivative is designated as a hedging instrument in an effective cash fl ow hedge where the gain or loss is deferred within equity until the underlying hedged item is settled.
The Group documents, at the inception of the transaction, the relationship between hedging instruments and hedged items, as well as its risk management objective and strategy for undertaking various hedge transactions. The Group also documents its assessment, both at hedge inception and on an ongoing basis, of whether the derivatives that are used in hedging transactions have been and will continue to be highly effective in offsetting changes in fair values or cash fl ows of hedged items.
(i) Cash fl ow hedgesThe Group enters into interest rate swaps to mitigate the risk associated with changes in the value of future cash fl ows in relation to variable rate debt due to fl uctuations in the interest rate. The effective portion of changes in the fair value of the interest rate swaps that are designated and qualify as cash fl ow hedges are recognised in equity in the hedging reserve. The gain or loss relating to the ineffective portion is recognised immediately in the income statement within other income or other expenses.
Amounts accumulated in equity are recycled in the income statement within fi nance costs in the periods when the hedged item will affect profi t or loss.
When a hedging instrument expires or is terminated, or when a hedge no longer meets the criteria for hedge accounting, any cumulative gain or loss existing in equity at that time remains in equity and is recognised when the hedged item is ultimately recognised in the income statement.
(ii) Derivatives that do not qualify for hedge accountingCertain derivative instruments, including foreign exchange contracts and interest rate swaps, may not qualify for hedge accounting. Changes in the fair value of any derivative instrument that do not qualify for hedge accounting are recognised immediately in the income statement within other income or other expenses.
FAIR VALUE ESTIMATIONThe fair value of interest rate swaps is calculated as the present value of the estimated future cash fl ows. The fair value of forward exchange contracts is determined using forward exchange market rates at the balance date.
INVESTMENTS AND OTHER FINANCIAL ASSETSFrom 1 July 2004 to 30 June 2005The Group has applied previous AGAAP to the comparative information on fi nancial instruments within the scope of AASB 132 and AASB 139. Under previous AGAAP, interests in listed and unlisted securities, other than subsidiaries and associates, are brought to account at cost and dividend income is recognised in the income statement when receivable.
Adjustments on transition date: 1 July 2005The nature of the main adjustments to make this information comply with AASB 132 and AASB 139 are that, with the exception of loans and receivables that are measured at amortised cost, fair value is the measurement basis. Fair value is inclusive of transaction costs. Changes in fair value are either taken to the income statement or an equity reserve. At the date of transition, 1 July 2005, changes to carrying amounts are taken to retained earnings or reserves.
From 1 July 2005The Group classifi es its investments in the following categories: fi nancial assets at fair value through profi t or loss, loans and receivables, held-to-maturity investments, and available-for-sale fi nancial assets. The classifi cation depends on the purpose for which the investments were acquired. Management determines the classifi cation of its investments at initial recognition and re-evaluates this designation at each reporting date.
(i) Financial assets at fair value through profi t or lossThis category has two sub-categories: fi nancial assets held for trading, and those designated at fair value through profi t or loss on initial recognition. A fi nancial asset is classifi ed in this category if acquired principally for the purpose of selling in the short term or if so designated by management. The policy of management is to designate a fi nancial asset if there exists the possibility it will be sold in the short term and the asset is subject to frequent changes in fair value. Derivatives are also categorised as held for trading unless they are designated as hedges. Assets in this category are classifi ed as current assets if they are either held for trading or are expected to be realised within 12 months of the balance sheet date.

60
NOTE
S TO
THE
FINA
NCIA
L ST
ATEM
ENTS
30
JUNE
200
6
NOTE 1. SUMMARY OF SIGNIFICANT ACCOUNTING POLICIES (CONTINUED)INVESTMENTS AND OTHER FINANCIAL ASSETS (CONTINUED)(ii) Loans and receivablesLoans and receivables are non-derivative fi nancial assets with fi xed or determinable payments that are not quoted in an active market. They arise when the Group provides money, goods or services directly to a debtor with no intention of selling the receivable. They are included in current assets, except for those with maturities greater than 12 months after the balance sheet date that are classifi ed as non-current assets.
INTANGIBLE ASSETS(i) GoodwillGoodwill represents the excess of the cost of an acquisition over the fair value of the Group’s share of the net identifi able assets of the acquired subsidiary or associate at the date of acquisition. Goodwill on acquisitions of subsidiaries is included in intangible assets. Goodwill on acquisitions of associates is included in investments in associates. Goodwill acquired in business combinations is not amortised. Instead, goodwill is tested for impairment annually, or more frequently if events or changes in circumstances indicate that it might be impaired, and is carried at cost less accumulated impairment losses. Gains and losses on the disposal of an entity include the carrying amount of goodwill relating to the entity sold. Goodwill is allocated to cash generating units for the purpose of impairment testing.
(ii) Trademarks and licencesTrademarks and licences have a fi nite useful life and are carried at cost less accumulated amortisation and impaired losses. Amortisation is calculated using the straight-line method to allocate the cost of trademarks and licences over their estimated useful lives being 15 years.
(iii) SoftwareThe cost of system development including purchased software is deferred and amortised over the estimated useful life, being three to eight years.
IMPAIRMENT OF ASSETSAssets that have an indefi nite useful life are not subject to amortisation and are tested annually for impairment, or more frequently if events or changes in circumstances indicate that they might be impaired. Assets that are subject to amortisation are reviewed for impairment whenever events or changes in circumstances indicate that the carrying amount may not be recoverable. An impairment loss is recognised for the amount by which the asset’s carrying amount exceeds its recoverable amount. The recoverable amount is the higher of an asset’s fair value less costs to sell and value in use. For the purposes of assessing impairment, assets are grouped at the lowest levels for which there are separately identifi able cash fl ows, which are largely independent of the cash infl ows from other assets or groups of assets (cash generating units). Non-fi nancial assets other than goodwill that suffered an impairment are reviewed for possible reversal of the impairment at each reporting date.
EMPLOYEE BENEFITS(i) Defined benefit superannuation funds and pension plansA liability or asset in respect of defi ned benefi t superannuation funds and pension plans is recognised in the balance sheet, and is measured as the present value of the defi ned benefi t obligation at the reporting date plus unrecognised actuarial gains (less unrecognised actuarial losses) less the fair value of the fund’s or plan’s assets at that date and any unrecognised past service cost. The present value of the defi ned benefi t obligation is based on expected future payments which arise from membership of the funds or plans to the reporting date, calculated by independent actuaries. Consideration is given to expected future wage and salary levels, experience of employee departures and periods of service.
Expected future payments are discounted using market yields at the reporting date on national government bonds or corporate bonds with terms to maturity and currency that match, as closely as possible, the estimated future cash outfl ows. Actuarial gains and losses arising from experience adjustments and changes in actuarial assumptions are charged or credited to retained earnings via the statement of recognised income and expense.
Past service costs are recognised immediately in income, unless the changes are conditional on the employees remaining in service for a specifi ed period of time (the vesting period). In this case, the past service costs are amortised on a straight-line basis over the vesting period.
Future taxes, such as taxes on investment income and employer contributions, are taken into account in the actuarial assumptions used to determine the relevant components of the employer’s defi ned benefi t liability or asset.
(ii) Defined contribution plansContributions to the defi ned contribution fund are recognised as an expense as they become payable. Prepaid contributions are recognised as an asset to the extent that a cash refund or a reduction in the future payments is available.
(iii) Health plansA controlled entity provides health care benefi ts for eligible employees, retired employees and their covered dependants. The cost of providing these benefi ts is accrued over the period in which employees provide service to the date of their last eligibility for such benefi ts. The amount of the obligation is based on an independent actuarial valuation.

61
NOTE 1. SUMMARY OF SIGNIFICANT ACCOUNTING POLICIES (CONTINUED)EMPLOYEE BENEFITS (CONTINUED)(iv) Share-based paymentsShare-based compensation benefi ts are provided to employees via the Ridley Corporation Incentive Option Plan, Ridley Employee Share Scheme, and the Ridley Inc Stock Option Plan.
For shares and options granted before 7 November 2002 and/or vested before 1 January 2005, no expense is recognised. The shares are recognised when the options are exercised and the proceeds received allocated to contributed equity.
The fair value of options granted after 7 November 2002 and vested after 1 January 2005 is recognised as an employee benefi t expense with a corresponding increase in equity. The fair value is measured at grant date and recognised over the vesting period during which the employees become unconditionally entitled to the options.
The fair value at grant date is independently determined using a binomial option pricing model that takes into account the exercise price, the term of the option, the vesting and performance criteria, the impact of dilution, the non-tradeable nature of the option, the share price at grant date and expected price volatility of the underlying share, the expected dividend yield and the risk-free interest rate for the term of the option.
Shares issued to employees under the Ridley Employee Share Scheme vest immediately on grant date. Employees can elect to receive an interest-free loan to fund the purchase of the shares. The shares issued are accounted for as in-substance options which vest immediately. The fair value of these in-substance options is recognised as an employee benefi t expense with a corresponding increase in equity. The fair value at grant date is independently determined using a binomial option pricing model.
(v) Wages and salaries, bonuses, annual leave and sick leaveLiabilities for wages and salaries, including non-monetary benefi ts, bonuses, annual leave and accumulating sick leave expected to be settled within 12 months of the reporting date are recognised in accruals and provisions for employee entitlements in respect of employees’ services up to the reporting date and are measured at the amounts expected to be paid when the liabilities are settled. Liabilities for non-accumulating sick leave are recognised when the leave is taken and measured at the rates paid or payable.
(vi) Long service leaveThe liability for long service leave expected to be settled within 12 months of the reporting date is recognised in the provision for employee benefi ts and is measured in accordance with (v) above. The liability for long service leave expected to be settled more than 12 months from the reporting date is recognised in the provision for employee entitlements and measured as the present value of expected future payments to be made in respect of services provided by employees up to the reporting date. Consideration is given to expected future wage and salary levels, experience of employee departures and periods of service. Expected future payments are discounted using market yields at the reporting date on national government bonds with terms to maturity and currency that match, as closely as possible, the estimated future cash outfl ows.
(vii) Employee benefit on-costsEmployee benefi t on-costs, including payroll tax, are recognised and included in both employee benefi t liabilities and costs.
FINANCIAL INSTRUMENTS TRANSACTION COSTSPrior to 1 July 2005, costs incurred in establishing fi nance facilities were deferred to future periods to the extent that future benefi ts were expected to arise. Deferred costs were amortised on a straight-line basis over the period of the expected benefi t, being not more than six years. After 1 July 2005, these costs are refl ected in the carrying value of the debt instrument and amortised over the term of the facilities.
RESEARCH AND DEVELOPMENT EXPENDITUREResearch and development costs are charged to expense as incurred, unless development costs relate to a project whose success is probable considering its commercial and technical feasibility and where such costs can be measured reliably, in which case such costs are recognised as intangible assets.
INVENTORIESInventories are valued at the lower of cost and net realisable value. Costs are determined on the fi rst in, fi rst out and weighted average cost methods. Where appropriate, the cost of fi nished goods includes applicable fi xed and variable overheads.
DIVIDENDSProvision is made for the amount of any dividend declared, determined or publicly recommended by the directors on or before the end of the fi nancial period but not distributed at balance date.
REVENUE RECOGNITIONRevenue is measured at the fair value of the consideration received or receivable. Amounts disclosed as revenue are net of returns, trade allowances and duties and taxes paid. Sales revenue is recognised when the signifi cant risks and rewards of ownership have been transferred to the customer.

62
NOTE
S TO
THE
FINA
NCIA
L ST
ATEM
ENTS
30
JUNE
200
6
NOTE 1. SUMMARY OF SIGNIFICANT ACCOUNTING POLICIES (CONTINUED)CASHFor cash fl ow statement presentation purposes, cash and cash equivalents includes cash on hand, deposits at call and other short term, highly liquid investments with original maturities of less than three months which are readily convertible to cash and are subject to insignifi cant risk of changes in value, and bank overdrafts, which are included within borrowings in current liabilities in the balance sheet.
TRADE RECEIVABLESTrade receivables are recognised initially at fair value and subsequently measured at amortised cost, less provision for doubtful debts. Collectibility of trade receivables is reviewed on an ongoing basis. Debts which are known to be uncollectible are written off. A provision for doubtful receivables is established when there is objective evidence that the Group will not be able to collect all amounts due according to the original terms of receivables. The amount of the provision is the difference between the asset’s carrying amount and the present value of estimated future cash fl ows, discounted at the effective interest rate, and is recognised in the income statement.
LEASED ASSETSA distinction is made between fi nance leases, which effectively transfer from the lessor to the lessee substantially all the risks and benefi ts to ownership of leased non-current assets, and operating leases, under which the lessor effectively retains substantially all such risks and benefi ts.
Finance leases are capitalised. A lease asset and liability are established at the lower of the fair value of the leased property and the present value of minimum lease payments. Lease payments are allocated between the principal component of the lease liability and the fi nance costs. The lease asset is amortised over the shorter of the term of the lease and the life of the asset. Lease assets held at reporting date are being amortised over periods ranging from three to twenty years.
Payments made under operating leases (net of any incentives received from the lessor) are charged to the income statement on a straight-line basis over the period of the lease.
PAYABLESThese amounts represent goods and services provided to the Group prior to the end of the fi nancial year that are unpaid. The amounts are unsecured.
BORROWINGSBorrowings are initially recognised at their fair value, which approximates to the present value of future cash fl ows associated with servicing the debt, net of transaction costs incurred. Borrowings are subsequently measured at amortised cost. Borrowings are classifi ed as current liabilities unless the Group has an unconditional right to defer settlement of the liability for at least 12 months after the balance sheet date.
CONTRIBUTED EQUITYOrdinary shares are classifi ed as equity. Incremental costs directly attributable to the issue of new shares or options are shown in equity as a deduction, net of tax, from the proceeds.
EARNINGS PER SHARE(i) Basic earnings per shareBasic earnings per share is calculated by dividing the profi t attributable to equity holders of the Company, excluding any costs of servicing equity other than ordinary shares, by the weighted average number of ordinary shares outstanding during the fi nancial year.
(ii) Diluted earnings per shareDiluted earnings per share adjusts the fi gures used in the determination of basic earnings per share to take into account the after income tax effect of interest and other fi nancing costs associated with dilutive potential ordinary shares and the weighted average number of shares assumed to have been issued for no consideration in relation to dilutive potential ordinary shares.
NEW ACCOUNTING STANDARDS AND UIG INTERPRETATIONSCertain new accounting standards and UIG interpretations have been published that are not mandatory for 30 June 2006 reporting periods. The Group has not made an assessment of the impact of these new standards and interpretations as yet. The new accounting standards and UIG interpretations are as follows:AASB 7 Financial Instruments: DisclosuresAASB 121 The Effects of Changes in Forex Rates – Compiled versionAASB 132 Financial Instruments: Presentation – Compiled versionAASB 139 Financial Instruments – Recognition and Measurement – Compiled versionAASB 119 Employee Benefi ts: Accounting for Actuarial Gains and Losses and Group PlansUIG 5 Rights to Interests Arising from Decommissioning, Restoration and Environmental Rehabilitation FundsAASB 2005–6 Amendments to Australian Accounting Standards [AASB 3]: Business combinations involving entities under common controlAASB 2006–1 Amendments to Australian Accounting Standards [AASB 121]: Clarifi cation regarding monetary items forming part of the net investment in a foreign operation

63
NOTE 1. SUMMARY OF SIGNIFICANT ACCOUNTING POLICIES (CONTINUED)CRITICAL ACCOUNTING ESTIMATES AND JUDGEMENTSEstimates and judgements are continuously evaluated and are based on historical experience and other factors, including expectations of future events that may have a fi nancial impact on the Group, that are believed to be reasonable under the circumstances.
(i) Estimated impairment of goodwill The Group tests annually whether goodwill has suffered any impairment in accordance with the accounting policy set out above. The recoverable amounts of cash generating units (CGUs) have been determined by value in use calculations. These calculations require the use of key assumptions that are disclosed in note 11.
(ii) Defined benefit superannuation and health plansThe Group has obligations for defi ned benefi t superannuation and pension schemes and health plans. The value of the obligation is based on independent actuarial valuations for which the key assumptions have been stated in note 26.
(iii) Salt field valuationsSalt fi elds are valued on a value in use basis by external independent valuers. These valuations require the use of key assumptions, being the future cash fl ows, discount rates and growth rates for the use as salt fi elds.
ROUNDING OF AMOUNTS The Company is of a kind referred to in Class Order 98/0100, issued by the Australian Securities and Investments Commission, relating to the “rounding off” of amounts in the fi nancial report. Amounts in the fi nancial report have been rounded off in accordance with that Class Order to the nearest thousand dollars or, in certain cases, to the nearest dollar.
CONSOLIDATED PARENT ENTITY 2006 2005 2006 2005 $’000 $’000 $’000 $’000
NOTE 2. REVENUERevenue from continuing operations Sale of goods 1,258,675 1,153,099 – –
Other revenue from continuing operations Interest 1,302 1,319 19,818 15,052 Rent received 351 229 – – Dividends received/receivable from related entities – – 12,525 10,600 Management fees – related entities – – 5,306 5,321 Other 2,571 4,164 39 – 4,224 5,712 37,688 30,973
Revenue from discontinuing operations Livestock income – Increase in net market value of livestock – 773 – –
NOTE 3. OTHER INCOMEProfi t on sale of property, plant and equipment 383 377 – – Foreign exchange gains – net 402 – – – Changes in the fair value of interest rate swaps 1,367 – 520 – 2,152 377 520 –
NOTE 4. EXPENSESProfi t before income tax is arrived at after charging the following items:Depreciation and amortisation Land and buildings 3,273 2,925 15 50 Plant and equipment 17,478 15,591 140 188 Leased assets 133 136 – – Software 762 662 4 12 Trademarks, patents and other rights 164 247 – – 21,810 19,561 159 250
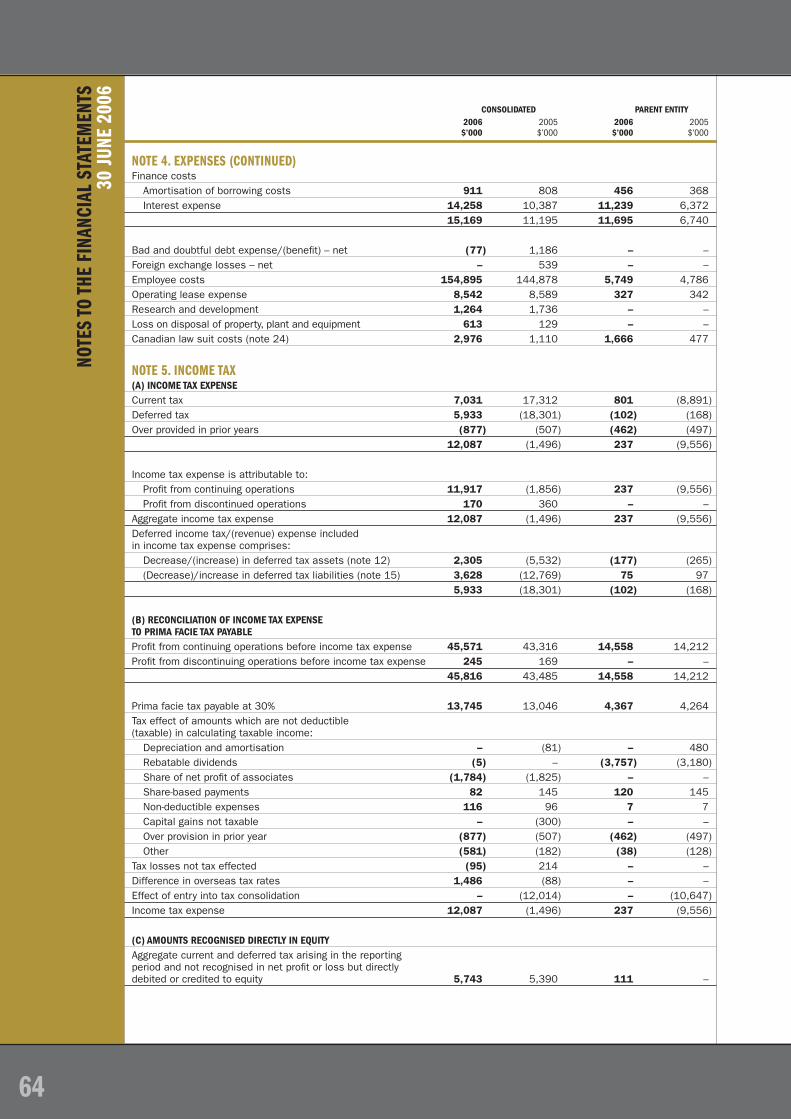
CONSOLIDATED PARENT ENTITY 2006 2005 2006 2005 $’000 $’000 $’000 $’000
NOTE 4. EXPENSES (CONTINUED)Finance costs Amortisation of borrowing costs 911 808 456 368 Interest expense 14,258 10,387 11,239 6,372 15,169 11,195 11,695 6,740
Bad and doubtful debt expense/(benefi t) – net (77) 1,186 – –Foreign exchange losses – net – 539 – –Employee costs 154,895 144,878 5,749 4,786Operating lease expense 8,542 8,589 327 342Research and development 1,264 1,736 – –Loss on disposal of property, plant and equipment 613 129 – –Canadian law suit costs (note 24) 2,976 1,110 1,666 477
NOTE 5. INCOME TAX(A) INCOME TAX EXPENSE Current tax 7,031 17,312 801 (8,891)Deferred tax 5,933 (18,301) (102) (168)Over provided in prior years (877) (507) (462) (497) 12,087 (1,496) 237 (9,556)
Income tax expense is attributable to: Profi t from continuing operations 11,917 (1,856) 237 (9,556) Profi t from discontinued operations 170 360 – –Aggregate income tax expense 12,087 (1,496) 237 (9,556)Deferred income tax/(revenue) expense included in income tax expense comprises: Decrease/(increase) in deferred tax assets (note 12) 2,305 (5,532) (177) (265) (Decrease)/increase in deferred tax liabilities (note 15) 3,628 (12,769) 75 97 5,933 (18,301) (102) (168)
(B) RECONCILIATION OF INCOME TAX EXPENSE TO PRIMA FACIE TAX PAYABLE Profi t from continuing operations before income tax expense 45,571 43,316 14,558 14,212Profi t from discontinuing operations before income tax expense 245 169 – – 45,816 43,485 14,558 14,212
Prima facie tax payable at 30% 13,745 13,046 4,367 4,264Tax effect of amounts which are not deductible (taxable) in calculating taxable income: Depreciation and amortisation – (81) – 480 Rebatable dividends (5) – (3,757) (3,180) Share of net profi t of associates (1,784) (1,825) – – Share-based payments 82 145 120 145 Non-deductible expenses 116 96 7 7 Capital gains not taxable – (300) – – Over provision in prior year (877) (507) (462) (497) Other (581) (182) (38) (128)Tax losses not tax effected (95) 214 – –Difference in overseas tax rates 1,486 (88) – –Effect of entry into tax consolidation – (12,014) – (10,647)Income tax expense 12,087 (1,496) 237 (9,556)
(C) AMOUNTS RECOGNISED DIRECTLY IN EQUITY Aggregate current and deferred tax arising in the reporting period and not recognised in net profi t or loss but directly debited or credited to equity 5,743 5,390 111 –
64
NOTE
S TO
THE
FINA
NCIA
L ST
ATEM
ENTS
30
JUNE
200
6

NOTE 5. INCOME TAX (CONTINUED)(C) AMOUNTS RECOGNISED DIRECTLY IN EQUITY (CONTINUED)An increase in the future income tax benefi t of $12,014,000 ($9,272,000 of which was recorded as a signifi cant item) was recognised in the prior year from resetting tax values of certain assets in 100% Australian-owned entities that entered into the Australian tax consolidated group. The decision to reset these values was made in the prior year. The consolidated entity has formally notifi ed the Australian Taxation Offi ce of its adoption of the tax consolidation regime.
TAX CONSOLIDATIONRidley Corporation Limited and its wholly-owned Australian controlled entities have implemented the tax consolidation legislation as of 1 July 2003. The accounting policy in relation to this legislation is set out in note 1.
On adoption of the tax consolidation legislation, the entities in the tax consolidated group entered into a tax sharing agreement which, in the opinion of the directors, limits the joint and several liability of the wholly-owned entities in the case of a default by the head entity, Ridley Corporation Limited. The agreement provides for the allocation of income tax liabilities between the entities should Ridley Corporation Limited default on its payment obligations. At balance date, the possibility of default is considered to be remote.
The entities have also entered into a tax funding agreement under which the wholly-owned entities fully compensate Ridley Corporation Limited for any current tax payable assumed and are compensated by Ridley Corporation Limited for any current tax receivable and deferred tax assets relating to unused tax losses or unused tax credits that are transferred to Ridley Corporation Limited under the tax consolidation legislation. The funding amounts are determined by reference to the amounts recognised in the wholly-owned entities’ fi nancial statements. Amounts payable and receivable between Ridley Corporation Limited and the wholly-owned entities are settled through the inter company accounts.
The tax funding agreement was revised in the current reporting period to permit the entities in the tax consolidated group to apply the transitional provisions in UIG 1052 paragraph 65. Until 30 June 2005, it also required compensation for any deferred tax balances relating to timing differences that had to be recognised by Ridley Corporation Limited under the AGAAP version of UIG 1052 (UIG 52). For further information on transitional adjustments required as a result of the adoption of AIFRS, refer to the commentary in note 38 (e).
CONSOLIDATED PARENT ENTITY 2006 2005 2006 2005 $’000 $’000 $’000 $’000
NOTE 6. DIVIDENDSORDINARYFinal dividend paid on 7 October 2005 (27 October 2004) 50% franked – 3.25 (2005: 3.25 fully franked) cents per share 8,894 8,769 8,894 8,769Interim dividend paid on 31 March 2006 (31 March 2005) 50% franked – 3.50 (2005: 3.25 unfranked) cents per share 9,703 8,824 9,703 8,824Total dividends paid 18,597 17,593 18,597 17,593
DIVIDENDS NOT RECOGNISED AT YEAR-ENDIn addition to the above dividends, since year-end the directors have approved payment of a fi nal dividend of 3.50 cents, 50% franked (2005: 3.25 cents 50% franked) per fully paid share, payable on 10 October 2006 (2005: 7 October 2005) based on tax paid at 30%. The aggregate amount of the proposed dividend expected to be paid out of retained profi ts at 30 June 2006, but not recognised as a liability at year-end: 9,862 8,894 9,862 8,894
The proposed dividends will be franked out of existing franking credits calculated at 30% and out of franking credits arising from the payment of income tax in the year ending 30 June 2007 and from fully franked dividends receivable.
The estimated amount that could be distributed as dividends and be franked at 30% out of existing franking credits and out of franking credits arising from the payment of income tax provided for in the fi nancial statements and from dividends receivable after deducting franking credits applicable to proposed dividends at balance date: Nil Nil Nil Nil
65

66
NOTE
S TO
THE
FINA
NCIA
L ST
ATEM
ENTS
30
JUNE
200
6
NOTE 7. RECEIVABLESCURRENTTrade debtors 108,335 96,088 – –Less: Provision for doubtful debts (2,985) (3,669) – – 105,350 92,419 – –
Customer loans and advances(a) 2,783 3,242 – –Less: Provision for doubtful debts (18) (72) – – 2,765 3,170 – –
Prepayments 2,264 2,421 47 63Other debtors 9,723 11,013 602 2,129 120,102 109,023 649 2,192
NON-CURRENTCustomer loans and advances(a) 3,609 7,805 – –Less: Provision for doubtful debts (1,094) (3,526) – – 2,515 4,279 – –Other debtors 204 1,213 – 33Amounts owing by related entities – – 273,875 266,246 2,719 5,492 273,875 266,279
(a) In line with US and Canadian feed industry practice, controlled entities have entered into certain loans and collateral agreements with third parties to facilitate growth and strengthen long-term relationships with key customers. The loans generally bear interest at rates between 4.75% and 9.75%, with average terms of four years. The practice of granting such loans has been substantially curtailed in recent years. In 2006 the total new loans advanced was $1,450,000 (2005: $921,000) and repayments of existing loans totalled $3,545,000 (2005: $2,972,000).
NOTE 8. INVENTORIESCURRENTRaw materials and stores – at cost 67,142 65,250 – –Work in progress – at cost 13,518 7,954 – –Finished goods – at cost 47,633 37,240 – – 128,293 110,444 – –
NOTE 9. OTHERCURRENT Other 176 182 – – 176 182 – –
NON-CURRENTDeferred expenditure 217 6,613 – 2,669Less: Accumulated amortisation (20) (4,574) – (1,774) 197 2,039 – 895
Shares in controlled entities – at cost – – 7,274 7,274Shares in controlled entities – at deemed cost – – 101,179 101,179Shares in other corporations 181 183 – – 181 183 108,453 108,453 378 2,222 108,453 109,348
CONSOLIDATED PARENT ENTITY 2006 2005 2006 2005 $’000 $’000 $’000 $’000

67
NOTE 10. PROPERTY, PLANT AND EQUIPMENTNON-CURRENTLand and buildingsAt cost 7,892 19,607 70 70Less: Accumulated depreciation (55) (546) (30) (15)At independent valuation 2006 (2005: 2003) 135,929 110,737 4,300 4,000Less: Accumulated depreciation – (13,179) – (70)Total land and buildings 143,766 116,619 4,340 3,985
Salt fi eldsAt cost 36,512 37,267 – –At independent valuation 2006 (2005: 2003) 74,157 76,500 – –Total salt fi elds 110,669 113,767 – –
Plant and equipmentAt cost 280,512 251,791 3,800 3,415Less: Accumulated depreciation (147,886) (129,686) (3,662) (3,137)Plant and equipment under construction 16,970 17,757 – –Under fi nance lease 1,116 1,032 – –Less: Accumulated amortisation (473) (342) – –Total plant and equipment 150,239 140,552 138 278
SummaryProperty, plant and equipment: At cost 324,916 308,665 3,870 3,485 Under fi nance lease 1,116 1,032 – – At independent valuation 2006 (2005: 2003) 210,086 187,237 4,300 4,000 Under construction 16,970 17,757 – –Less: Accumulated depreciation (148,414) (143,753) (3,692) (3,222) 404,674 370,938 4,478 4,263
BASIS OF VALUATIONThe basis of valuation of land and buildings, and salt fi elds is fair market value based on existing use. The independent valuation in 2006 was carried out by qualifi ed valuers in Australia and North America.
RECONCILIATIONSReconciliations of the carrying amounts of each class of property, plant and equipment at the beginning and end of the current fi nancial year are set out below:
CONSOLIDATED PARENT ENTITY LAND AND PLANT AND SALT LAND AND PLANT AND BUILDINGS EQUIPMENT FIELDS TOTAL BUILDINGS EQUIPMENT TOTAL $’000 $’000 $’000 $’000 $’000 $’000 $’000
YEAR ENDED 30 JUNE 2005At 1 July 2004Cost or fair value 121,839 245,948 77,005 444,792 4,070 3,415 7,485Accumulated depreciation (10,850) (114,547) – (125,397) (35) (2,949) (2,984)Carrying amount at 1 July 110,989 131,401 77,005 319,395 4,035 466 4,501Acquisitions 13,326 12,461 36,512 62,299 – – –Additions 2,023 19,821 250 22,094 – – –Disposals (2,295) (361) – (2,656) – – –Transfer 451 (451) – – – – –Revaluation (1,192) – – (1,192) – – –Foreign currency exchange differences (3,758) (6,592) – (10,350) – – –Depreciation (note 4) (2,925) (15,727) – (18,652) (50) (188) (238)Carrying amount at 30 June 116,619 140,552 113,767 370,938 3,985 278 4,263
CONSOLIDATED PARENT ENTITY 2006 2005 2006 2005 $’000 $’000 $’000 $’000

68
NOTE
S TO
THE
FINA
NCIA
L ST
ATEM
ENTS
30
JUNE
200
6 CONSOLIDATED PARENT ENTITY LAND AND PLANT AND SALT LAND AND PLANT AND BUILDINGS EQUIPMENT FIELDS TOTAL BUILDINGS EQUIPMENT TOTAL $’000 $’000 $’000 $’000 $’000 $’000 $’000
NOTE 10. PROPERTY, PLANT AND EQUIPMENT (CONTINUED)RECONCILIATIONS (CONTINUED)YEAR ENDED 30 JUNE 2006At 30 June 2005Cost or fair value 130,343 270,580 113,767 514,690 4,070 3,415 7,485Accumulated depreciation (13,724) (130,028) – (143,752) (85) (3,137) (3,222)Carrying amount at 1 July 116,619 140,552 113,767 370,938 3,985 278 4,263Acquisitions 1,160 3,294 – 4,454 – – –Additions 4,924 20,740 231 25,895 – – –Disposals (70) (795) – (865) – – –Transfer – – – – – – –Revaluation 18,398 – (3,329) 15,069 370 – 370Foreign currency exchange differences 6,008 4,059 – 10,067 – – –Depreciation (note 4) (3,273) (17,611) – (20,884) (15) (140) (155)Carrying amount at 30 June 143,766 150,239 110,669 404,674 4,340 138 4,478At 30 June 2006 Cost or fair value 143,822 298,598 110,669 553,089 4,370 3,800 8,170Accumulated depreciation (56) (148,359) – (148,415) (30) (3,662) (3,692)Carrying amount at 30 June 143,766 150,239 110,669 404,674 4,340 138 4,478
PATENTS, TRADEMARKS AND SOFTWARE GOODWILL OTHER RIGHTS TOTALCONSOLIDATED $’000 $’000 $’000 $’000
NOTE 11. INTANGIBLE ASSETSYEAR ENDED 30 JUNE 2005At 1 July 2004Cost 3,337 80,785 95 84,217Accumulated amortisation (2,287) (30,463) (17) (32,767)Carrying amount 1 July 1,050 50,322 78 51,450Acquisitions/additions 763 9,564 5,432 15,759Amortisation charge (662) – (247) (909)Foreign currency exchange differences – (3,545) (134) (3,679)Closing balance 1,151 56,341 5,129 62,621At 30 June 2005 Cost 3,987 85,231 5,387 94,605Accumulated amortisation (2,836) (28,890) (258) (31,984)Carrying amount at 30 June 1,151 56,341 5,129 62,621
YEAR ENDED 30 JUNE 2006 Opening balance 1,151 56,341 5,129 62,621Acquisitions/additions 734 3,429 – 4,163Amortisation charge (762) – (164) (926)Foreign currency exchange differences 19 2,307 153 2,479Carrying amount at 30 June 1,142 62,077 5,118 68,337At 30 June 2006 Cost 4,740 90,967 5,540 101,247Accumulated amortisation (3,598) (28,890) (422) (32,910)Carrying amount at 30 June 1,142 62,077 5,118 68,337

69
NOTE 11. INTANGIBLE ASSETS (CONTINUED)At 1 July Cost 386 386Accumulated depreciation (382) (370)Carrying amount at 1 July 4 16Amortisation charge (4) (12)Carrying amount at 30 June – 4
At 30 June Cost 386 386Accumulated amortisation (386) (382)Carrying amount at 30 June – 4
IMPAIRMENT TESTING FOR GOODWILLGoodwill is allocated to the Group’s cash generating units (CGUs) identifi ed according to business segment as follows:
AUSTRALIA CANADA US US NUTRITION SALT FEED FEED FEED SOLUTIONS TOTALCONSOLIDATED $’000 $’000 $’000 $’000 $’000 $’000
2006 5,017 10,898 11,764 11,329 23,069 62,0772005 4,523 9,311 11,459 10,101 20,947 56,341
The recoverable amount of a CGU is based on value in use calculations. The following describes each key assumption on which management has based its cash fl ow projections to undertake impairment testing of goodwill.(i) Cash fl ow forecasts are based on fi ve-year business plans presented to the Board.(ii) Forecast growth rates are based on management’s expectations of future performances. The Group has adopted a zero
growth rate for forecast cash fl ows after fi ve years.(iii) Discount rates used are the weighted average cost of capital (pre-tax) for the Group, risk adjusted where applicable for
each business segment and country.
These assumptions have been used for the analysis of each CGU within the business segment.
CONSOLIDATED PARENT ENTITY 2006 2005 2006 2005 $’000 $’000 $’000 $’000
NOTE 12. DEFERRED TAX ASSETSNON-CURRENTDeferred tax asset – – 366 375 – – 366 375
2006 2005 SOFTWARE SOFTWAREPARENT ENTITY $’000 $’000

70
NOTE
S TO
THE
FINA
NCIA
L ST
ATEM
ENTS
30
JUNE
200
6
NOTE 12. DEFERRED TAX ASSETS (CONTINUED)THE BALANCE COMPRISES TEMPORARY DIFFERENCES ATTRIBUTABLE TO:Amounts recognised in profi t or lossDoubtful debts 1,093 1,809 – –Employee benefi ts 5,415 4,622 691 715Retirement benefi t obligations 1,423 3,038 – –Product liability 78 63 – –Finance leases 117 – – –Rehabilitation 129 179 – –Other 1,135 517 241 40Tax losses 4,506 5,380 – – 13,896 15,608 932 755
Amounts recognised directly in equityRetirement benefi t obligations 2,827 1,523 – – 16,723 17,131 932 755
Set-off of deferred tax assets of parent entity pursuant to set-off provisions (note 15) (16,723) (17,131) (566) (380)Net deferred tax asset – – 366 375
MOVEMENTS:Opening balance at 1 July 17,131 9,123 755 490Foreign currency exchange differences 554 (751) – –Credited/(charged) to the income statement (2,305) 5,532 177 265Credited/(charged) to equity (191) 1,408 – –Charged to retained earnings 1,495 1,523 – –Acquisition of subsidiary 39 296 – –Closing balance at 30 June 16,723 17,131 932 755
Deferred tax assets include the benefi t of tax losses in controlled entities of $4,506,000 (2005: $5,380,000). The deferred tax asset at 30 June 2006 in respect of tax losses not brought to account is nil (2005: $740,000).
This benefi t for tax losses will only be obtained if:(i) the consolidated entity derives future assessable income of a nature and of an amount suffi cient to enable the benefi t
from the deductions for the losses to be realised; or(ii) the losses are transferred to an eligible entity in the consolidated entity; and(iii) the consolidated entity continues to comply with the conditions for deductibility imposed by tax legislation; and(iv) no changes in tax legislation adversely affect the consolidated entity in realising the benefi t from the deductions for
the losses.
NOTE 13. PAYABLESCURRENT Trade creditors and accruals 136,850 131,653 2,998 2,312 136,850 131,653 2,998 2,312
NOTE 14. INTEREST BEARING LIABILITIESCURRENTSecuredBank overdraft and loans (note 32)(a) 5,878 8,722 – 20,098Lease liabilities 247 193 – –Unsecured Other loans – 2,766 – – 6,125 11,681 – 20,098
NON-CURRENT Secured Bank loans (note 32)(a) 170,490 163,104 144,500 121,500Unsecured loans 2,120 – – –Lease liabilities 127 312 – – 172,737 163,416 144,500 121,500
(a) Cash and bank overdrafts are netted where the bank accounts are with the same fi nancial institution and where right of set-off exists. Bank overdrafts and loans are secured by a fi xed and fl oating charge over certain assets of the consolidated entity.
CONSOLIDATED PARENT ENTITY 2006 2005 2006 2005 $’000 $’000 $’000 $’000

71
NOTE 15. TAX LIABILITIESCURRENTIncome tax – 2,551 – 795 – 2,551 – 795
NON-CURRENT Deferred income tax 39,386 27,648 – – 39,386 27,648 – –
THE BALANCE COMPRISES TEMPORARY DIFFERENCES ATTRIBUTABLE TO: Amounts recognised in profi t or loss Inventories 432 393 – –Intangibles and goodwill 7,043 5,441 – –Fair value of interest rate swaps 118 – 118 –Other 993 917 110 163Property, plant and equipment 37,751 33,899 227 217 46,337 40,650 455 380
Amounts recognised directly in equity Revaluation of property, plant and equipment 9,772 4,129 111 – 56,109 44,779 566 380
Set-off of deferred tax liabilities of parent entity pursuant to set-off provisions (note 12) (16,723) (17,131) (566) (380)Net deferred tax liabilities 39,386 27,648 – –
MOVEMENTS: Opening balance at 1 July 44,779 60,758 380 283Foreign currency exchange differences 1,958 (3,701) – –Charged/(credited) to the income statement 3,628 (12,769) 75 97Charged/(credited) to equity 5,643 491 111 –Acquisition of subsidiary 101 – – –Closing balance at 30 June 56,109 44,779 566 380
NOTE 16. PROVISIONSCURRENTEmployee entitlements (note 26) 13,331 11,684 515 580Remediation 39 205 – – 13,370 11,889 515 580
NON-CURRENTEmployee entitlements (note 26) 1,712 2,717 576 708Remediation 468 464 78 74 2,180 3,181 654 782
CONSOLIDATED PARENT ENTITY REMEDIATION REMEDIATION $’000 $’000
Movements in each class of provision during the fi nancial year, other than employee benefi ts, are as follows:CURRENT Balance 1 July 205 –Provision used (166) –Balance 30 June 39 –
NON-CURRENT Balance 1 July 464 74Additional provision recognised 4 4Balance 30 June 468 78
CONSOLIDATED PARENT ENTITY 2006 2005 2006 2005 $’000 $’000 $’000 $’000

72
NOTE
S TO
THE
FINA
NCIA
L ST
ATEM
ENTS
30
JUNE
200
6
NOTE 17. CONTRIBUTED EQUITYFully paid up capital – 281,763,824 (2005: 273,670,824) ordinary shares no par value 210,633 201,009
(a) Movements in issued and paid up ordinary share capital of the Company during the past two years were as follows:
NUMBER OF ISSUE PRICEDATE DETAILS SHARES $/SHARE $’000
Jun 2004 Opening balance 269,646,724 196,194Oct 2004 Dividend Reinvestment Plan 1,623,472 1.3317 2,162Mar 2005 Dividend Reinvestment Plan 2,175,628 1.4807 3,222Apr 2005 Employee Share Scheme** 558,540 – 95 Shares repurchased (558,540) 1.5326* (856)Various Exercise of employee options 225,000 0.8555* 192June 2005 Balance 273,670,824 201,009
Oct 2005 Dividend Reinvestment Plan 2,363,596 1.3864 3,276Mar 2006 Dividend Reinvestment Plan 3,983,960 1.3641 5,435Apr 2006 Employee Share Scheme** 545,444 – 100Various Exercise of employee options 1,200,000 0.6775* 813June 2006 Balance 281,763,824 210,633
* Weighted average price.** The Group’s accounting policy is to treat these shares as “in-substance options”. Accordingly the Group recognises an increase in share capital only when it
receives cash consideration from an employee.
2,183,687 shares issued under the Ridley Employee Share Scheme have been accounted for as in-substance options as at 30 June 2006.
The Company has established a dividend reinvestment plan under which holders of ordinary shares may elect to have all or part of their dividend entitlements satisfi ed by the issue of ordinary shares.
Details of the Company’s option plan and share scheme are disclosed in note 26.
Ordinary shares entitle the holder to receive dividends and the proceeds on winding up the interest in proportion to the number of shares held. On a show of hands, every shareholder present at a meeting, in person or by proxy, is entitled to one vote, and upon a poll each share is entitled to one vote.
(b) At 30 June 2006, 8,175,000 (2005: 8,975,000) options were on issue. The options are exercisable at various dates up to 31 October 2010. Details of existing options are disclosed in note 26.
PARENT ENTITY 2006 2005 $’000 $’000

73
NOTE 18. RESERVES AND RETAINED PROFITS(A) RESERVES Property, plant and equipment revaluation reserve 56,814 47,690 14,181 13,922Share-based payments reserve 2,214 1,454 2,214 1,454Capital reserve 28,487 28,487 – –Foreign currency translation reserve (1,577) (7,671) – – 85,938 69,960 16,395 15,376
Movements: Property, plant and equipment revaluation reserve Balance at 1 July 47,690 42,080 13,922 13,922Revaluation – gross (note 10) 13,851 (1,192) 370 –Transfer to outside equity interests due to the issue of shares by a controlled entity (7) (1) – –Deferred tax (note 12) (4,720) 6,803 (111) –Balance at 30 June 56,814 47,690 14,181 13,922
Share-based payments reserve Balance at 1 July 1,454 501 1,454 501Option expense 760 953 760 953Balance at 30 June 2,214 1,454 2,214 1,454
Foreign currency translation reserve Balance at 1 July (7,671) – – –Currency translation differences arising during the year 6,082 (7,704) – –Transfer to outside equity interests due to the issue of shares by a controlled entity 12 33 – –Balance at 30 June (1,577) (7,671) – –
(B) RETAINED PROFITS Movements in retained profi ts were as follows: Balance at 1 July 34,492 14,052 20,011 13,745Adjustment on adoption of AASB 132 and 139 – net of tax (note 22) (343) – (89) –Actuarial losses on defi ned benefi t superannuation and pension plans – net of tax (1,478) (1,852) – –Net profi t for the year 27,689 39,969 14,321 23,768Dividends paid (18,597) (17,593) (18,597) (17,593)Less: Non cash dividends paid on employee in-substance options 99 91 99 91Transfer to outside equity interests due to the issue of shares by a controlled entity (236) (175) – –Other – – (16) –Balance at 30 June 41,626 34,492 15,729 20,011
(C) NATURE AND PURPOSE OF RESERVES(i) Property, plant and equipment revaluation reserveThe property, plant and equipment revaluation reserve is used to record increments and decrements on the revaluation of non-current assets. The balance standing to the credit of the reserve may be used to satisfy the distribution of bonus shares to shareholders and is only available for the payment of cash dividends in limited circumstances as permitted by law.
(ii) Share-based payments reserveThe share-based payments reserve is used to recognise the fair value of options issued but not exercised.
(iii) Foreign currency translation reserveExchange differences arising on translation of the foreign controlled entity are taken to the foreign currency translation reserve. The reserve is recognised in profi t and loss when the net investment is disposed of.
(iv) Capital reserveThe reserve represents the excess over book value of the parent entity’s interest in the net assets of Ridley Inc after it was partially fl oated on the Toronto Stock Exchange in 1997.
CONSOLIDATED PARENT ENTITY 2006 2005 2006 2005 $’000 $’000 $’000 $’000

74
NOTE
S TO
THE
FINA
NCIA
L ST
ATEM
ENTS
30
JUNE
200
6
NOTE 19. MINORITY INTERESTInterest in: Share capital 26,195 25,932 – – Reserves 128 (4,241) – – Retained profi ts 29,550 24,277 – – 55,873 45,968 – –
NOTE 20. EQUITY Total equity at the beginning of the fi nancial year 351,429 326,474 236,396 224,363Total changes in equity recognised in the income statement 33,729 44,981 14,321 23,768Total changes recognised directly in equity 17,257 (8,148) 170 –Transfer to minority interest due to the issue of shares by a controlled entity (232) (143) – –Transactions with owners as owners Contributions of equity 9,624 4,815 9,624 4,815 Dividends paid (18,497) (17,503) (18,497) (17,503) Employee share options 760 953 760 953Other – – (17) –Total equity at the end of the fi nancial year 394,070 351,429 242,757 236,396
NOTE 21. FINANCIAL RISK MANAGEMENTThe Group’s activities expose it to a variety of fi nancial risks; market risk (including currency, fair value interest rate and price), credit, liquidity and cash fl ow interest rate risk. The Group’s overall fi nancial risk management policy focuses on the unpredictability of fi nancial markets and seeks to minimise potential adverse effects on the fi nancial performance of the Group. The Group uses derivative fi nancial instruments such as foreign exchange contracts and interest rate swaps to hedge certain risk exposures.
Risk management is carried out by management under policies approved by the Board of Directors. Management evaluates and hedges fi nancial risks. The Board provides written principles for overall risk management, as well as written policies covering specifi c areas, such as mitigating foreign exchange interest rate and credit risks (use of derivative fi nancial instruments) and investing excess liquidity.
(A) MARKET RISK(i) Foreign exchange riskForeign exchange risk arises when future commercial transactions and recognised assets and liabilities are denominated in a currency that is not the entity’s functional currency. The Group operates internationally and is exposed to foreign exchange risk.
Forward contracts are used to manage foreign exchange risk. Management is responsible for managing exposures in each foreign currency by using external forward currency contracts. Where possible, borrowings are made in the currencies in which the assets are held to reduce foreign currency translation risk.
For segment reporting purposes, management designates contracts as fair value hedges or cash fl ow hedges, as appropriate. External foreign exchange contracts are designated at Group level as hedges of foreign exchange risk on specifi c assets, liabilities or future transactions on a gross basis.
(ii) Price riskThe Group is exposed to commodity price risk. A range of raw materials are purchased on a global and domestic basis. Approval levels and the forward purchasing of raw materials are monitored and restrictions are placed on the length and amount of forward purchases.
(iii) Fair value interest rate riskRefer to (d) on the following page.
(B) CREDIT RISKThe Group has no signifi cant concentrations of credit risk. The Group has policies in place to ensure that sales of products and services are made to customers with an appropriate credit history. Derivative counterparties and cash transactions are limited to high credit quality fi nancial institutions. The Group has policies that limit the amount of credit exposure to any one fi nancial institution.
(C) LIQUIDITY RISKPrudent liquidity risk management implies maintaining suffi cient cash and marketable securities, the availability of funding through an adequate amount of committed credit facilities and the ability to close out market positions. Due to the dynamic nature of the underlying businesses, management aims at maintaining fl exibility in funding by keeping committed credit lines available.
CONSOLIDATED PARENT ENTITY 2006 2005 2006 2005 $’000 $’000 $’000 $’000

75
NOTE 21. FINANCIAL RISK MANAGEMENT (CONTINUED)(D) CASH FLOW AND FAIR VALUE INTEREST RATE RISKAs the Group has no signifi cant interest bearing assets, the Group’s income and operating cash fl ows are substantially independent of changes in market interest rates.
The Group’s interest rate risk arises from long-term borrowings. Borrowings issued at variable rates expose the Group to cash fl ow interest rate risk. Borrowings issued at fi xed rates expose the Group to fair value interest rate risk. Group policy is to maintain approximately 50% to 85% of its borrowings in fi xed rate instruments.
The Group manages its cash fl ow interest rate risk by using fl oating to fi xed interest rate swaps. Such interest rate swaps have the economic effect of converting borrowings from fl oating rates to fi xed rates. Generally, the Group raises long term borrowings at fl oating rates and swaps them into fi xed rates. Under the interest rate swaps, the Group agrees with other parties to exchange, at specifi ed intervals (mainly quarterly), the difference between fi xed contract rates and fl oating rate interest amounts calculated by reference to the agreed notional principal amounts.
NOTE 22. DERIVATIVE FINANCIAL INSTRUMENTS(A) TRANSITION TO AASB 132 AND AASB 139The Group has taken the exemption available under AASB 1 to apply AASB 132 Financial Instruments: Disclosure and Presentation and AASB 139 Financial Instruments: Recognition and Measurement from 1 July 2005. At the date of transition to these standards of 1 July 2005:
• For the Group a pre tax net adjustment of a $745,000 decrease in net assets was recognised, representing the measurement to the fair value of interest rate swaps, with the resulting loss of $745,000 charged against retained earnings.
• For the parent entity a pre tax net adjustment of a $127,000 decrease in net assets was recognised, representing the measurement to fair value of interest rate swaps, with the resulting loss of $127,000 charged against retained earnings.
(B) INSTRUMENTS USED BY THE GROUPThe Group is party to derivative fi nancial instruments in the normal course of business in order to hedge exposure to fl uctuations in interest and foreign exchange rates in accordance with the Group’s fi nancial risk management policies.
(i) Interest rate swap contractsAt balance date, bank loans of the Group incur an average variable interest rate of 6.73% (2005: 6.12%). It is Group policy to protect part of the loans from exposure to increasing interest rates. Accordingly, the Group has entered into interest rate swap contracts under which it effectively fi xes the interest rate payable.
Swaps currently in place cover approximately 72% (2005: 82%) of the loan principal outstanding and are timed to expire when the interest is payable on the outstanding debt. The average fi xed interest rate on the swaps, including margins, is 6.53% (2005: 6.12%).
At 30 June 2006, the notional principal amounts and periods of expiry of the interest rate swap contracts are as follows:
2006 2005 $’000 $’000
Less than 1 year 79,521 66,8581–2 years 47,092 39,9992–3 years – 35,680 126,613 142,537
The contracts require settlement of net interest receivable or payable each 90 days. The settlement dates coincide with the date on which interest is payable on the underlying debt. The contracts are settled on a net basis.
The fair value of interest rate swaps stated on the consolidated balance sheet as a net asset at 30 June 2006 was $621,000.
(ii) Forward exchange contractsForward foreign exchange contracts have been entered into in order to fi x the cost of purchases and sales denominated in foreign currencies. The Group classifi es forward foreign exchange contracts as cash fl ow hedges and measures them at fair value. If they do not qualify as cash fl ow hedges, they are charged to the income statement. At balance date $6,000 is payable by the Group.
At balance date, controlled entities have external contracts to hedge future purchases and sales denominated in foreign currencies and to hedge intercompany loans denominated in foreign currencies. The terms of the contracts are for less than one year. At 30 June 2006, the controlled entities have contracted to sell US$100,000 for A$134,000, JPY16,994,000 for A$200,000, buy NZ$188,000 for A$162,000 and US$124,000 for A$163,000 (2005: sell US$420,000 for A$553,000, NZ$1,800,000 for A$1,675,000, JPY17,082,000 for A$206,000, buy US$152,000 for A$201,000 and A$57,000 for JPY4,250,000).
The portion of the gain or loss on the hedging instrument that is determined to be an effective hedge is recognised directly in equity. When the cash fl ows occur, the Group adjusts the initial measurement of the component recognised in the balance sheet by the related amount deferred in equity.
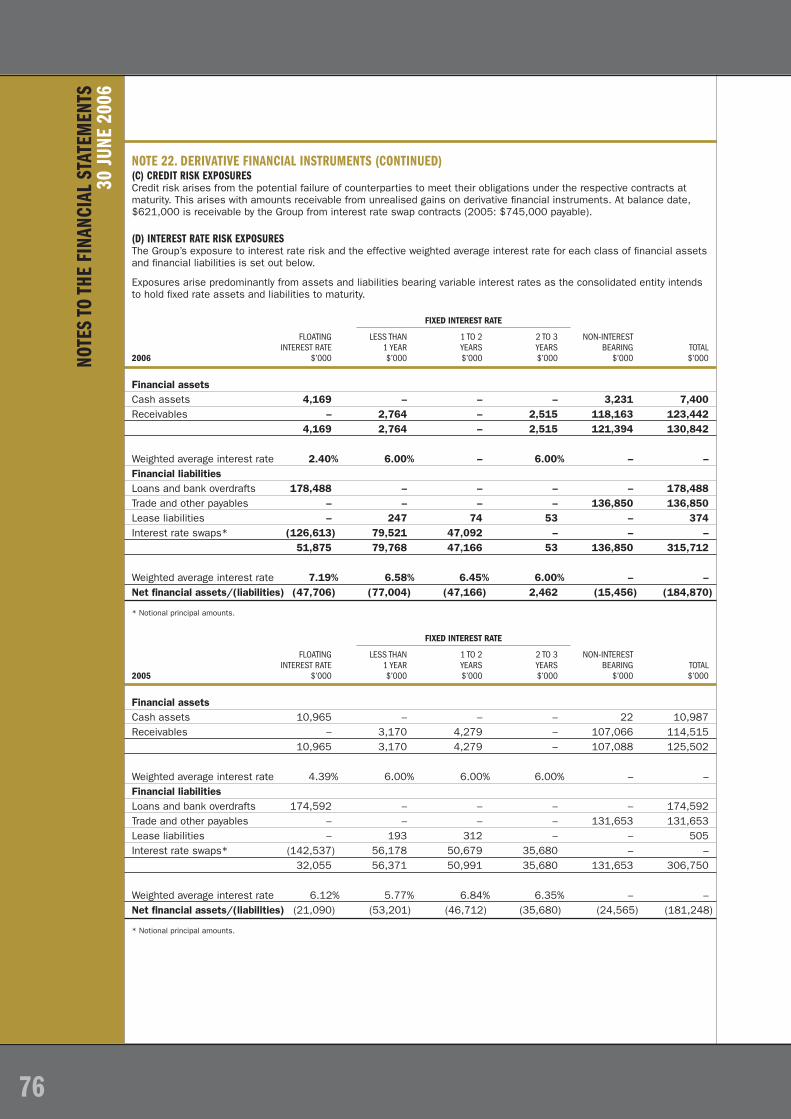
76
NOTE 22. DERIVATIVE FINANCIAL INSTRUMENTS (CONTINUED)(C) CREDIT RISK EXPOSURESCredit risk arises from the potential failure of counterparties to meet their obligations under the respective contracts at maturity. This arises with amounts receivable from unrealised gains on derivative fi nancial instruments. At balance date, $621,000 is receivable by the Group from interest rate swap contracts (2005: $745,000 payable).
(D) INTEREST RATE RISK EXPOSURESThe Group’s exposure to interest rate risk and the effective weighted average interest rate for each class of fi nancial assets and fi nancial liabilities is set out below.
Exposures arise predominantly from assets and liabilities bearing variable interest rates as the consolidated entity intends to hold fi xed rate assets and liabilities to maturity.
FIXED INTEREST RATE
FLOATING LESS THAN 1 TO 2 2 TO 3 NON-INTEREST INTEREST RATE 1 YEAR YEARS YEARS BEARING TOTAL2006 $’000 $’000 $’000 $’000 $’000 $’000
Financial assets Cash assets 4,169 – – – 3,231 7,400Receivables – 2,764 – 2,515 118,163 123,442 4,169 2,764 – 2,515 121,394 130,842
Weighted average interest rate 2.40% 6.00% – 6.00% – –Financial liabilities Loans and bank overdrafts 178,488 – – – – 178,488Trade and other payables – – – – 136,850 136,850Lease liabilities – 247 74 53 – 374Interest rate swaps* (126,613) 79,521 47,092 – – – 51,875 79,768 47,166 53 136,850 315,712
Weighted average interest rate 7.19% 6.58% 6.45% 6.00% – –Net fi nancial assets/(liabilities) (47,706) (77,004) (47,166) 2,462 (15,456) (184,870)
* Notional principal amounts.
FIXED INTEREST RATE
FLOATING LESS THAN 1 TO 2 2 TO 3 NON-INTEREST INTEREST RATE 1 YEAR YEARS YEARS BEARING TOTAL2005 $’000 $’000 $’000 $’000 $’000 $’000
Financial assets Cash assets 10,965 – – – 22 10,987Receivables – 3,170 4,279 – 107,066 114,515 10,965 3,170 4,279 – 107,088 125,502
Weighted average interest rate 4.39% 6.00% 6.00% 6.00% – –Financial liabilities Loans and bank overdrafts 174,592 – – – – 174,592Trade and other payables – – – – 131,653 131,653Lease liabilities – 193 312 – – 505Interest rate swaps* (142,537) 56,178 50,679 35,680 – – 32,055 56,371 50,991 35,680 131,653 306,750
Weighted average interest rate 6.12% 5.77% 6.84% 6.35% – –Net fi nancial assets/(liabilities) (21,090) (53,201) (46,712) (35,680) (24,565) (181,248)
* Notional principal amounts.
NOTE
S TO
THE
FINA
NCIA
L ST
ATEM
ENTS
30
JUNE
200
6

77
NOTE 22. DERIVATIVE FINANCIAL INSTRUMENTS (CONTINUED)(E) NET FAIR VALUEThe net fair value of cash and non-interest bearing monetary fi nancial assets and liabilities of the Group approximates their carrying amounts.
The fair value of forward exchange contracts is estimated using listed market prices or by discounting the contractual cash fl ows at their forward price and deducting the current spot rate. For interest rate swaps, discounted cash fl ow techniques are used. These are checked back to counterparty valuation confi rmations.
The net fair value of other monetary fi nancial assets and fi nancial liabilities is based upon market prices where a market exists or by discounting the expected future cash fl ows by the current interest rates for assets and liabilities with similar risk profi les.
2006 2005 CARRYING CARRYING AMOUNT FAIR VALUE AMOUNT FAIR VALUE $’000 $’000 $’000 $’000
On balance sheet fi nancial instrumentsFinancial assetsCash and deposits 7,400 7,400 10,987 10,987Trade debtors 105,350 105,350 92,419 92,419Other debtors 17,471 17,471 22,096 22,096Other fi nancial assets 181 181 183 183Interest rate swaps 621 621 – –Forward exchange contracts 6 6 – –Financial liabilitiesTrade and other creditors 136,850 136,850 131,653 131,653Loans and bank overdrafts 178,488 178,488 174,592 174,592Lease liabilities 374 374 505 505Interest rate swaps* – – – 745
* Under previous AGAAP standards.
CONSOLIDATED PARENT ENTITY 2006 2005 2006 2005 $’000 $’000 $’000 $’000
NOTE 23. COMMITMENTS FOR EXPENDITURECapital expenditure contracted for plant and equipment not later than one year 16,579 15,667 – –
Commitments for non-cancellable operating leases: Due within 1 year 7,337 6,334 385 377 Due within 1–2 years 5,385 4,109 364 76 Due within 2–5 years 6,187 4,797 289 89 Due after 5 years 5,388 3,606 – – 24,297 18,846 1,038 542
Finance leases contracted for as follows: Due within 1 year 262 207 – – Due within 1–2 years 79 337 – – Due within 2–5 years 56 – – –Minimum lease payments 397 544 – –
Deduct: Future fi nance charges 23 39 – –Lease liabilities 374 505 – –
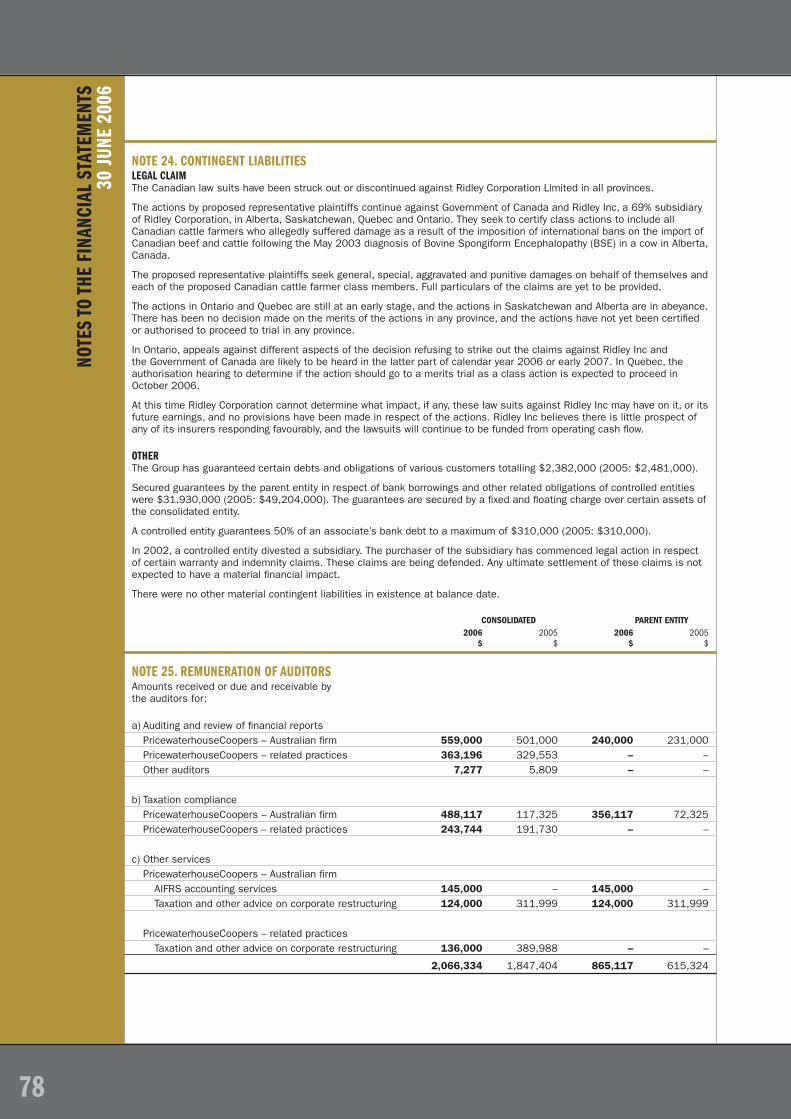
NOTE
S TO
THE
FINA
NCIA
L ST
ATEM
ENTS
30
JUNE
200
6
NOTE 24. CONTINGENT LIABILITIESLEGAL CLAIMThe Canadian law suits have been struck out or discontinued against Ridley Corporation Limited in all provinces.
The actions by proposed representative plaintiffs continue against Government of Canada and Ridley Inc, a 69% subsidiary of Ridley Corporation, in Alberta, Saskatchewan, Quebec and Ontario. They seek to certify class actions to include all Canadian cattle farmers who allegedly suffered damage as a result of the imposition of international bans on the import of Canadian beef and cattle following the May 2003 diagnosis of Bovine Spongiform Encephalopathy (BSE) in a cow in Alberta, Canada.
The proposed representative plaintiffs seek general, special, aggravated and punitive damages on behalf of themselves and each of the proposed Canadian cattle farmer class members. Full particulars of the claims are yet to be provided.
The actions in Ontario and Quebec are still at an early stage, and the actions in Saskatchewan and Alberta are in abeyance. There has been no decision made on the merits of the actions in any province, and the actions have not yet been certifi ed or authorised to proceed to trial in any province.
In Ontario, appeals against different aspects of the decision refusing to strike out the claims against Ridley Inc and the Government of Canada are likely to be heard in the latter part of calendar year 2006 or early 2007. In Quebec, the authorisation hearing to determine if the action should go to a merits trial as a class action is expected to proceed in October 2006.
At this time Ridley Corporation cannot determine what impact, if any, these law suits against Ridley Inc may have on it, or its future earnings, and no provisions have been made in respect of the actions. Ridley Inc believes there is little prospect of any of its insurers responding favourably, and the lawsuits will continue to be funded from operating cash fl ow.
OTHERThe Group has guaranteed certain debts and obligations of various customers totalling $2,382,000 (2005: $2,481,000).
Secured guarantees by the parent entity in respect of bank borrowings and other related obligations of controlled entities were $31,930,000 (2005: $49,204,000). The guarantees are secured by a fi xed and fl oating charge over certain assets of the consolidated entity.
A controlled entity guarantees 50% of an associate’s bank debt to a maximum of $310,000 (2005: $310,000).
In 2002, a controlled entity divested a subsidiary. The purchaser of the subsidiary has commenced legal action in respect of certain warranty and indemnity claims. These claims are being defended. Any ultimate settlement of these claims is not expected to have a material fi nancial impact.
There were no other material contingent liabilities in existence at balance date.
CONSOLIDATED PARENT ENTITY 2006 2005 2006 2005 $ $ $ $
NOTE 25. REMUNERATION OF AUDITORSAmounts received or due and receivable by the auditors for:
a) Auditing and review of fi nancial reports PricewaterhouseCoopers – Australian fi rm 559,000 501,000 240,000 231,000 PricewaterhouseCoopers – related practices 363,196 329,553 – – Other auditors 7,277 5,809 – –
b) Taxation compliance PricewaterhouseCoopers – Australian fi rm 488,117 117,325 356,117 72,325 PricewaterhouseCoopers – related practices 243,744 191,730 – –
c) Other services PricewaterhouseCoopers – Australian fi rm AIFRS accounting services 145,000 – 145,000 – Taxation and other advice on corporate restructuring 124,000 311,999 124,000 311,999
PricewaterhouseCoopers – related practices Taxation and other advice on corporate restructuring 136,000 389,988 – –
2,066,334 1,847,404 865,117 615,324
78

79
NOTE 26. EMPLOYEE ENTITLEMENTSAggregate employee entitlements including on-costs Current (note 16) 13,331 11,684 515 580 Non-current (note 16) 1,712 2,717 576 708 15,043 14,401 1,091 1,288
EQUITY PLANS(i) Incentive Option PlanThe Ridley Corporation Incentive Option Plan was approved by shareholders at the 1993 Annual General Meeting, amended at the 1996 Annual General Meeting, and subsequently amended by the Board in January 2002. Under the Incentive Option Plan, certain employees and executive directors of the consolidated entity may be offered a number of options, each of which will represent a right to acquire one fully paid ordinary share in the capital of the Company. The purpose of the Incentive Option Plan is to advance the interests of the Company by affording such persons the opportunity of benefi ting from increases in shareholder value, thereby more closely aligning their interests with those of shareholders. Options are granted under the plan for no consideration. The options have a maximum duration of fi ve years and lapse if not exercised within fi ve years from the date of grant or within one month of leaving the Group. The options are vested and can only be exercised after a minimum of two years from the date of grant, with certain minor exceptions. The exercise price is the weighted average price over the fi ve trading days on the Australian Stock Exchange, prior to the date of grant, increased each anniversary of issue date by 5% compound.
Details of options outstanding under the plan at balance date are as follows:
Consolidated Group and parent entity 2006
BALANCE GRANTED EXERCISED CANCELLED BALANCE EXERCISABLE EXERCISE AT START OF DURING DURING DURING AT END OF AT END OFGRANT DATE EXPIRY DATE PRICE THE YEAR THE YEAR THE YEAR THE YEAR THE YEAR THE YEAR
1 Nov 2000* 1 Nov 2005 $0.59 500,000 – 500,000 – – –12 Feb 2001* 12 Feb 2006 $0.79 200,000 – 200,000 – – –9 Jul 2001* 9 Jul 2006 $0.72 500,000 – 500,000 – – –27 Sep 2001* 26 Sep 2006 $0.89 250,000 – – – 250,000 250,00029 Oct 2001* 29 Oct 2006 $0.96 500,000 – – – 500,000 500,00026 Feb 2002* 26 Feb 2007 $1.33 250,000 – – – 250,000 250,00026 Feb 2002* 26 Feb 2007 $1.40 300,000 – – 50,000 250,000 250,00026 Feb 2002* 26 Feb 2007 $1.47 300,000 – – 50,000 250,000 250,00028 Nov 2002* 28 Nov 2007 $1.50 166,667 – – – 166,667 166,66728 Nov 2002 28 Nov 2007 $1.57 166,667 – – – 166,667 166,66728 Nov 2002 28 Nov 2007 $1.65 166,666 – – – 166,666 –6 Jan 2003 6 Jan 2008 $1.70 83,333 – – – 83,333 83,3336 Jan 2003 6 Jan 2008 $1.79 83,333 – – – 83,333 83,3336 Jan 2003 6 Jan 2008 $1.87 83,334 – – – 83,334 –31 Jan 2003 31 Jan 2008 $1.63 658,338 – – – 658,338 658,33831 Jan 2003 31 Jan 2008 $1.71 658,331 – – – 658,331 658,33131 Jan 2003 31 Jan 2008 $1.80 658,331 – – – 658,331 –27 Oct 2003 27 Oct 2008 $1.54 166,667 – – – 166,667 166,66727 Oct 2003 27 Oct 2008 $1.61 166,667 – – – 166,667 –27 Oct 2003 27 Oct 2008 $1.69 166,666 – – – 166,666 –12 Jan 2004 12 Jan 2009 $1.36 816,663 – – – 816,663 816,66312 Jan 2004 12 Jan 2009 $1.42 816,667 – – – 816,667 –12 Jan 2004 12 Jan 2009 $1.50 816,670 – – – 816,670 –25 Oct 2004 25 Oct 2009 $1.48 166,667 – – – 166,667 –25 Oct 2004 25 Oct 2009 $1.56 166,667 – – – 166,667 –25 Oct 2004 25 Oct 2009 $1.64 166,666 – – – 166,666 –31 Oct 2005 31 Oct 2010 $1.51 – 166,667 – – 166,667 –31 Oct 2005 31 Oct 2010 $1.58 – 166,667 – – 166,667 –31 Oct 2005 31 Oct 2010 $1.66 – 166,666 – – 166,666 – 8,975,000 500,000 1,200,000 100,000 8,175,000 4,299,999Weighted average exercise price $1.61 $1.58 $0.68 $1.40 $1.50 $1.42
* Options granted before 7 November 2002 and vested before 1 January 2005 are not recognised as an expense.
CONSOLIDATED PARENT ENTITY 2006 2005 2006 2005 $’000 $’000 $’000 $’000

80
NOTE
S TO
THE
FINA
NCIA
L ST
ATEM
ENTS
30
JUNE
200
6
NOTE 26. EMPLOYEE ENTITLEMENTS (CONTINUED)EQUITY PLANS (CONTINUED)Consolidated Group and parent entity 2005
BALANCE GRANTED EXERCISED CANCELLED BALANCE EXERCISABLE EXERCISE AT START OF DURING DURING DURING AT END OF AT END OFGRANT DATE EXPIRY DATE PRICE THE YEAR THE YEAR THE YEAR THE YEAR THE YEAR THE YEAR
1 Nov 2000* 1 Nov 2005 $0.59 500,000 – – – 500,000 500,00012 Feb 2001* 12 Feb 2006 $0.79 200,000 – – – 200,000 200,0009 Jul 2001* 9 Jul 2006 $0.72 675,000 – 175,000 – 500,000 500,00027 Sep 2001* 26 Sep 2006 $0.89 250,000 – – – 250,000 250,00029 Oct 2001* 29 Oct 2006 $0.96 500,000 – – – 500,000 500,00026 Feb 2002* 26 Feb 2007 $1.33 466,667 – 50,000 166,667 250,000 250,00026 Feb 2002* 26 Feb 2007 $1.40 466,667 – – 166,667 300,000 300,00026 Feb 2002* 26 Feb 2007 $1.47 466,666 – – 166,666 300,000 –28 Nov 2002* 28 Nov 2007 $1.50 166,667 – – – 166,667 166,66728 Nov 2002 28 Nov 2007 $1.57 166,667 – – – 166,667 –28 Nov 2002 28 Nov 2007 $1.65 166,666 – – – 166,666 –6 Jan 2003 6 Jan 2008 $1.70 83,333 – – – 83,333 83,3336 Jan 2003 6 Jan 2008 $1.79 83,333 – – – 83,333 –6 Jan 2003 6 Jan 2008 $1.87 83,334 – – – 83,334 –31 Jan 2003 31 Jan 2008 $1.63 775,006 – – 116,668 658,338 658,33831 Jan 2003 31 Jan 2008 $1.71 774,997 – – 116,666 658,331 –31 Jan 2003 31 Jan 2008 $1.80 774,997 – – 116,666 658,331 –27 Oct 2003 27 Oct 2008 $1.54 166,667 – – – 166,667 –27 Oct 2003 27 Oct 2008 $1.61 166,667 – – – 166,667 –27 Oct 2003 27 Oct 2008 $1.69 166,666 – – – 166,666 –12 Jan 2004 12 Jan 2009 $1.36 849,996 – – 33,333 816,663 –12 Jan 2004 12 Jan 2009 $1.42 850,000 – – 33,333 816,667 –12 Jan 2004 12 Jan 2009 $1.50 850,004 – – 33,334 816,670 –25 Oct 2005 25 Oct 2009 $1.48 – 166,667 – – 166,667 –25 Oct 2005 25 Oct 2009 $1.56 – 166,667 – – 166,667 –25 Oct 2005 25 Oct 2009 $1.64 – 166,666 – – 166,666 – 9,650,000 500,000 225,000 950,000 8,975,000 3,408,338Weighted average exercise price $1.41 $1.56 $0.86 $1.52 $1.38 $1.11
* Options granted before 7 November 2002 and vested before 1 January 2005 are not recognised as an expense.
The share prices at the date of exercise of options exercised during the year ended 30 June 2006 were 500,000 at $1.40, 400,000 at $1.31 and 300,000 at $1.25 (2005: 175,000 at $1.37, 34,000 at $1.50 and 16,000 at $1.49).
The weighted average contractual life remaining of options outstanding at the end of the year is 1.98 years (2005: 2.70 years).
The assessed fair value at grant date of options during the year ended 30 June 2006 and 30 June 2005 are as follows:
2006 2005 EXERCISE PRICE FAIR VALUE EXERCISE PRICE FAIR VALUE $ $ $ $
1.51 0.271 1.48 0.266 1.58 0.246 1.56 0.242 1.66 0.220 1.64 0.219
The fair value at grant date is independently determined using a binomial option pricing model that takes into account the exercise price, the term of the option, the vesting and performance criteria, the impact of dilution, the non-tradeable nature of the option, the share price at grant date and expected price volatility of the underlying share, the expected dividend yield and the risk-free interest rate for the term of the option.

81
NOTE 26. EMPLOYEE ENTITLEMENTS (CONTINUED)EQUITY PLANS (CONTINUED)The model inputs for options granted during the year ended 30 June 2006 included:
2006 2005
Grant date 31 October 2005 25 October 2004Exercise prices $1.51, $1.58, $1.66 $1.48, $1.56, $1.64Expiry date 31 October 2010 25 October 2009Share price at grant date $1.38 $1.33Expected price volatility of the Company’s shares 31% 31%Expected dividend yield 5.58% 4.89%Risk-free interest rate 5.41% 5.18%
The expected price volatility is based on the historic volatility (based on the remaining life of the options), adjusted for any expected changes to future volatility due to publicly available information.
(ii) Ridley Employee Share SchemeAt the 1999 Annual General Meeting shareholders approved the introduction of the Ridley Employee Share Scheme. The purpose of the scheme is to align employee and shareholder interests. Under the scheme, shares are issued to qualifying Australian employees at a discount of up to 50%, which may be fi nanced by an interest-free loan secured against the shares. The maximum discount per employee is limited to $1,000, in accordance with relevant Australian taxation legislation. Dividends on the shares are allocated against the loan. The amount of the discount and number of shares allocated is at the discretion of the directors. Shares issued under the scheme may not be sold until the earlier of three years after grant or cessation of employment from the Group. 545,444 (2005: 558,540) shares were issued under this scheme during the year for $360,000 (2005: $428,000). The market value of the shares issued was $698,000 (2005: $810,000). The total loan amount outstanding at 30 June 2006 was $1,233,000 (2005: $1,094,000).
(iii) Ridley Inc Stock Option PlanUnder the Ridley Inc Stock Option Plan, options to purchase common shares of Ridley Inc could be granted to employees, directors and service providers of Ridley Inc and its controlled entities and affi liates. The purpose of the Stock Option Plan was to advance the interests of Ridley Inc by affording such persons the opportunity to benefi t from increases in shareholder value, thereby more closely aligning their interests with those of the shareholders of Ridley Inc.
Options granted under the plan have an exercise price of not less than the market price of the common shares of Ridley Inc at the time of grant based on the closing sale price of common shares on the business day immediately prior and are exercisable over a maximum of 10 years. During the year ended 30 June, 2006 52,000 shares (2005: 45,000) were issued on the exercise of options granted under the plan for $280,000 (2005: $295,000). The market value of the shares issued was $493,000 (2005: $505,000).
This plan has been suspended and replaced by the Ridley Inc Long Term Incentive Program.
No options were granted under the plan during the year (2005: Nil). Options outstanding under the plan at balance date are as follows:
BALANCE GRANTED EXERCISED CANCELLED BALANCE EXERCISABLE EXERCISE AT START OF DURING DURING DURING AT END OF AT END OFGRANT DATE EXPIRY DATE PRICE THE YEAR THE YEAR THE YEAR* THE YEAR THE YEAR THE YEAR
20061 Dec 1999 1 Dec 2005 C$6.50 94,100 – 28,000 66,100 – –6 Nov 2000 6 Nov 2006 C$5.38 162,500 – 64,000 – 92,500 92,500 256,600 – 92,000 66,100 92,500 92,500Weighted average exercise price C$5.79 – C$5.72 C$6.50 C$5.38 C$5.38
* This includes options that were also converted to cash.
BALANCE GRANTED EXERCISED CANCELLED BALANCE EXERCISABLE EXERCISE AT START OF DURING DURING DURING AT END OF AT END OFGRANT DATE EXPIRY DATE PRICE THE YEAR THE YEAR THE YEAR THE YEAR THE YEAR THE YEAR
20053 Sep 1998 3 Sep 2004 C$10.65 127,500 – – 127,500 – –1 Dec 1999 1 Dec 2005 C$6.50 125,600 – 31,500 – 94,100 94,1006 Nov 2000 6 Nov 2006 C$5.38 176,000 – 13,500 – 162,500 162,500 429,100 – 45,000 127,500 256,600 256,600Weighted average exercise price C$7.27 – C$6.16 C$10.65 C$5.79 C$5.79

82
NOTE
S TO
THE
FINA
NCIA
L ST
ATEM
ENTS
30
JUNE
200
6
NOTE 26. EMPLOYEE ENTITLEMENTS (CONTINUED)EQUITY PLANS (CONTINUED)Total expenses arising from share-based payment transactionsTotal expenses arising from share-based payment transactions recognised during the period as part of employee benefi t expense were as follows:
CONSOLIDATED PARENT ENTITY 2006 2005 2006 2005 $’000 $’000 $’000 $’000
Options issued under employee option plan 356 484 356 484Shares issued under employee share scheme 404 469 404 469 760 953 760 953
SUPERANNUATION FUNDSRidley Corporation Limited and its controlled entities participate in a number of superannuation funds in Australia. The funds provide benefi ts either on a defi ned benefi t or defi ned contribution basis for employees or their dependants on retirement, resignation, total and permanent disability, death and, in some cases, on temporary disablement.
The members and the Group make contributions as specifi ed in the rules of the respective funds.
Group contributions in terms of awards and agreements are legally enforceable and, in addition, contributions for all employees have to be made at minimum levels for the Group to comply with its obligations. Other contributions are in the main not legally enforceable, with the right to terminate, reduce or suspend these contributions upon giving written notice to the trustees. The level of contributions to the defi ned benefi t funds in the future will be reviewed on the advice of each fund’s actuary from time to time and at the time of the triennial or annual valuations. The basis of contributions to the various plans is determined as a percentage of members’ salaries or as required by the actuarial valuation.
PENSION PLANSA controlled entity has non-contributory defi ned benefi t pension plans covering substantially all of its US employees. The benefi ts for salaried employees are based on years of service and the employees’ level of compensation during specifi ed periods of employment. The plan covering hourly employees generally provides benefi ts of stated amounts for each year of service. The controlled entity’s funding policy is consistent with US statutory regulations and equals the amount deducted for income tax purposes. A controlled entity has a defi ned contribution pension plan for covering substantially all of its Canadian employees.
POST RETIREMENT HEALTH CARE BENEFITSA controlled entity provides post retirement health care benefi ts for US employees. These benefi ts are supplemental to statutory provided health care benefi ts. Post retirement life insurance benefi ts are provided for a limited period of time. The costs of post retirement health care and life insurance benefi ts are determined under the per capita claims cost method. Under this method, the controlled entity’s obligations are fully accrued by the date the employees attain full eligibility for such benefi ts. These plans are unfunded.
DEFINED BENEFIT PLANS(i) Balance sheet amountsThe amounts recognised in the balance sheet are determined as follows:
SUPERANNUATION POST EMPLOYMENT PLANS PENSION PLANS MEDICAL BENEFITS* AUSTRALIA US US 2006 2005 2006 2005 2006 2005CONSOLIDATED $’000 $’000 $’000 $’000 $’000 $’000
Present value of benefi t obligation 5,021 6,227 29,149 25,947 3,176 4,774Fair value of the benefi t plan assets (5,156) (6,140) (23,627) (18,264) – – (135) 87 5,522 7,683 3,176 4,774Unrecognised past service costs – – – – 3,493 –Net liability/(asset) in the balance sheet (135) 87 5,522 7,683 6,669 4,774
* Post employment medical benefi ts are unfunded.
The Group has no legal obligation to settle these liabilities with immediate or additional one-off contributions.

83
NOTE 26. EMPLOYEE ENTITLEMENTS (CONTINUED) DEFINED BENEFIT PLANS (CONTINUED)(ii) Categories of plan assetsThe major categories of plan assets are as follows:
SUPERANNUATION PLANS PENSION PLANS AUSTRALIA US
CONSOLIDATED 2006 2005 2006 2005
Cash 9% 14% 10% –Equity instruments 64% 62% 39% 41%Debt instruments 20% 17% 51% 59%Property 7% 7% – –
Asset allocation as at 30 April 2006 for US pension plans and 30 June 2006 for the Australian superannuation plans.
(iii) Reconciliations
POST EMPLOYMENT SUPERANNUATION PLANS PENSION PLANS MEDICAL BENEFITS* AUSTRALIA US US 2006 2005 2006 2005 2006 2005CONSOLIDATED $’000 $’000 $’000 $’000 $’000 $’000
Reconciliation of the present value of the defi ned benefi t obligation:Balance at the beginning of the year 6,227 5,895 25,947 23,094 4,773 4,592Current service cost 271 201 1,680 1,444 641 478Interest cost 247 284 1,518 1,364 303 271Actuarial gains and losses 289 976 (213) 2,817 2,954 –Effects of curtailment – – – – (5,496) –Benefi ts paid (2,162) (1,261) (587) (406) (132) (104)Past service cost – – 44 – – –Contributions by plan participants 149 132 – – – –Foreign exchange movement – – 760 (2,366) 133 (464)Balance at the end of the year 5,021 6,227 29,149 25,947 3,176 4,773
Reconciliation of the fair value of plan assets:Balance at the beginning of the year 6,140 6,364 18,264 16,519 – –Expected return on plan assets 380 407 1,848 1,472 – –Actuarial gains and losses 384 198 (1,021) (368) – –Employer contributions 265 300 4,575 2,735 – –Contributions by plan participants 149 132 – – – –Benefi ts paid (2,162) (1,261) (587) (406) – –Foreign exchange movement – – 548 (1,688) – –Balance at the end of the year 5,156 6,140 23,627 18,264 – –
(iv) Amounts recognised in income statementThe amounts recognised in the income statement are as follows:
Current service cost 271 201 1,680 1,444 641 478Interest cost 247 284 1,518 1,363 303 272Expected return on plan assets (380) (407) (1,848) (1,472) –Past service cost – – 42 – (2,009) –Total included in employee benefi ts expense 138 78 1,392 1,335 (1,065) 750Actual return on plan assets 764 605 827 1,103 – –
* Post employment medical benefi ts are unfunded.

84
NOTE
S TO
THE
FINA
NCIA
L ST
ATEM
ENTS
30
JUNE
200
6
NOTE 26. EMPLOYEE ENTITLEMENTS (CONTINUED)DEFINED BENEFIT PLANS (CONTINUED)(v) Principal actuarial assumptionsThe principal actuarial assumptions used (expressed as weighted averages) were as follows:
POST EMPLOYMENT SUPERANNUATION PLANS PENSION PLANS MEDICAL BENEFITS*
AUSTRALIA US USCONSOLIDATED 2006 2005 2006 2005 2006 2005
Discount rate 4.90% 4.30% 6.00% 5.75% 6.00% 6.50%Future salary increases 4.00% 4.00% 3.00% 3.00% – –Expected return on plan assets 6.50% 6.50% 9.00% 9.00% – –Health care trend rate – – – – 4.50% 4.50%
(vi) Employer contributions(a) Australian superannuation plans – defi ned benefi t planEmployer contributions to the plan are based on recommendations by the plan’s actuaries. Actuarial assessments are made at no more than three yearly intervals, and the last such assessment was made as at 1 July 2005.
The objective of funding is to ensure that the benefi t entitlements of members and other benefi ciaries are fully funded by the time they become payable. To achieve this objective, the actuaries have adopted a method of funding benefi ts known as the aggregate funding method. This funding method seeks to have benefi ts funded by means of a total contribution which is expected to be a constant percentage of members’ salaries over their working lifetimes.
Using the funding method described above and particular actuarial assumptions as to the plan’s future experience, the actuaries recommended in the actuarial review as at 1 July 2005, the payment of employer contributions to the fund of 10% of salaries for employees who are members of the defi ned benefi t section. These contribution rates have been adopted by the Group from 31 December 2005 and represent a decrease of 5% of salaries in the Group’s contributions from that previously used. Total employer contributions expected to be paid by Group companies for the year ending 30 June 2007 are $188,000. The economic assumptions used by the actuary to make the funding recommendations were a long-term investment earning rate, salary increases together with an age-related promotional scale, and an infl ation rate.
(b) US pension plansEmployer contributions to the plans are based on recommendation by the plans’ actuaries. Actuarial assessments are made annually, with the last assessment made as at 30 April 2006.
The objective of funding is to ensure that the benefi t entitlements of members and other benefi ciaries are fully funded by the time they become payable. The required annual funding is calculated by the actuary based on plan assets and accrued actuarial liability. Funding requirements for the year ending 30 June 2007 have not been calculated at present but are expected to be approximately $2,000,000.
(vii) Net financial position of Australian planIn accordance with AAS 25 Financial Reporting by Superannuation Plans, the Australian plan’s net fi nancial position is determined as the difference between the present value of the accrued benefi ts and the net market value of plan assets. This has been determined as at the date of the most recent fi nancial report of the superannuation fund (30 June 2005), and a surplus of $231,000 was reported. The surplus at 30 June 2005, under AAS 25, differs from the net liability of $87,000 recognised in the balance sheet as at 30 June 2006 due to different measurement rules in the relevant accounting standards AAS 25 and AASB 119 Employee Benefi ts.
(viii) Historic summary
POST EMPLOYMENT SUPERANNUATION PLANS PENSION PLANS MEDICAL BENEFITS*
AUSTRALIA US US 2006 2005 2006 2005 2006 2005CONSOLIDATED $’000 $’000 $’000 $’000 $’000 $’000
Present value of defi ned benefi t obligation 5,021 6,227 29,149 25,947 3,176 4,774Fair value of plan assets (5,156) (6,140) (23,627) (18,264) – –(Surplus)/defi cit (135) 87 5,522 7,683 3,176 4,774Experience adjustments (gain)/loss plan liabilities 369 825 213 2,512 2,954 (1,079)Experience adjustments (gain)/loss plan assets (384) (198) 1,021 368 – –
* Post employment medical benefi ts are unfunded.
DEFINED CONTRIBUTION PLANSActuarial assessments are not applicable to these types of funds, as benefi ts are based on an accumulation of defi ned contributions. The Group sponsors the following plans:
Ridley Superannuation Plan – Australia Staff Pension Plan for all Employees of Ridley Inc and Associated Companies – Canada.

85
NOTE 27. RELATED PARTY DISCLOSURESThe ultimate parent entity and controlling party is Ridley Corporation Limited.
DIRECTORSInformation on directors is disclosed in note 28.
OTHER RELATED PARTIESSalpak Pty Ltd, Western Salt Refi nery Pty Ltd, Dominion Salt Limited, Dominion Salt (N.I.) Limited and Cerebos-Skellerup Limited are associated entities due to the shareholding and representation by Ridley Corporation Limited or its subsidiaries on the board of directors. Information relating to material interests in associated entities is set out in note 36.
TRANSACTIONS WITH RELATED PARTIESTransactions with each class of other related parties were as follows:
CONSOLIDATED PARENT ENTITY 2006 2005 2006 2005 $’000 $’000 $’000 $’000
Interest revenue – subsidaries – – 19,650 14,988Dividend revenue – subsidaries – – 12,525 10,600Management and directors’ fees: Management charges – – 5,306 5,32 Associated entities 103 105 – –Sales of products to associated entites 8,135 8,625 – –Purchases of products from associated entities 1,779 1,462 – –Rental charges – – – 2Current tax payable assumed from wholly-owned tax consolidated entities – – 1,475 2,967Outstanding balances Current receivables (tax funding agreement) Wholly-owned tax consolidated entities – – 1,623 2,967Current payables (tax funding agreement) Wholly-owned tax consolidated entities – – 147 –Current receivables – associated entities 564 493 – –Non-current receivables – subsidiaries – – 273,875 266,246

86
NOTE
S TO
THE
FINA
NCIA
L ST
ATEM
ENTS
30
JUNE
200
6
NOTE 28. DIRECTORS AND KEY MANAGEMENT PERSONNEL DISCLOSURESDIRECTORSThe following persons were directors of Ridley Corporation Limited during the fi nancial year:
Chairman – non-executiveJ S Keniry
Executive director – Managing DirectorM P Bickford-Smith
Non-executive directorsE B BryanR J LeeR J LotzeA L Vizard
OTHER KEY MANAGEMENT PERSONNEL
2006Name PositionR E Frost Executive Vice President – Ridley Inc and President – Ridley Nutrition SolutionsM S Mitchell Chief Financial Offi cer – Ridley IncA D Murdoch Chief Executive Offi cer – Ridley AgriProductsJ Murray* Chief Executive Offi cer – Cheetham SaltW J Poynton** Chief Executive Offi cer – Cheetham SaltS J VanRoekel President and Chief Executive Offi cer – Ridley IncI Wilton Chief Financial Offi cer – Ridley Corporation
* Commenced 8 December 2005.
** Ceased employment 16 December 2005.
2005Name PositionR E Frost Executive Vice President – Ridley Inc and President – Ridley Nutrition SolutionsR B Gallaway* Chief Executive Offi cer – Ridley IncM S Mitchell Chief Financial Offi cer – Ridley IncA D Murdoch Chief Executive Offi cer – Ridley AgriProductsW J Poynton** Chief Executive Offi cer – Cheetham SaltS J VanRoekel President and Chief Executive Offi cer – Ridley IncI Wilton Chief Financial Offi cer – Ridley Corporation
* Ceased employment 31 August 2005.** Ceased employment 16 December 2005.
REMUNERATIONDetails of key management personnel remuneration are set out in the remuneration report, page 34. The Company has taken advantage of the relief provided by Corporations Regulation CR2M.6.04 and has transferred the detailed remuneration disclosures required by both AASB 124 and Section 300A of the Corporations Act 2001 to the directors’ report.
Share holdings The numbers of shares in the parent entity held during the fi nancial year by each director of Ridley Corporation Limited and each of the seven key management personnel of the consolidated entity, including their personally-related entities, are set out opposite:

87
NOTE 28. DIRECTORS AND KEY MANAGEMENT PERSONNEL DISCLOSURES (CONTINUED)REMUNERATION (CONTINUED)2006Directors of Ridley Corporation LimitedJ S Keniry 550,248 – 27,375 577,623M P Bickford-Smith 80,863 500,000 7,453 588,316E B Bryan 26,158 – 5,915 32,073R J Lee 61,912 – 7,454 69,366R J Lotze 100,365 – 10,000 110,365A L Vizard 15,431 – 3,727 19,158Other key management personnel of the consolidated entityI Wilton 78,047 100,000 (75,637) 102,410W J Poynton* 26,610 – 1,189 27,799A D Murdoch 5,469 – 1,516 6,985
* Ceased employment 16 December 2005.
2005 Directors of Ridley Corporation LimitedJ S Keniry 504,033 – 46,215 550,248M P Bickford-Smith 71,983 – 8,880 80,863D G McGauchie* 170,000 – – 170,000E B Bryan 17,279 – 8,879 26,158R J Lee 53,033 – 8,879 61,912R J Lotze 100,365 – – 100,365A L Vizard 10,991 – 4,440 15,431Other key management personnel of the consolidated entityI Wilton 62,950 175,000 (159,903) 78,047W J Poynton** 25,305 – 1,305 26,610A D Murdoch 4,164 – 1,305 5,469R B Gallaway*** 10,000 – – 10,000
* Resigned 11 October 2004.** Ceased employment 16 December 2005.*** Ceased employment 31 August 2005.
Ridley Inc share holdings RECEIVED BALANCE DURING THE YEAR OTHER BALANCE AT THE START OF ON THE EXERCISE CHANGES AT THE ENDNAME THE YEAR OF OPTIONS DURING THE YEAR OF THE YEAR
2006Directors of Ridley Corporation LimitedJ S Keniry 800 – – 800Other key management personnel of the consolidated entityM S Mitchell 500 10,000 (10,000) 500
2005Directors of Ridley Corporation LimitedJ S Keniry 800 – – 800Other key management personnel of the consolidated entityR B Gallaway* 10,000 – – 10,000M S Mitchell 500 – – 500
* Ceased employment 31 August 2005.
RECEIVED BALANCE DURING THE YEAR OTHER BALANCE AT THE START OF ON THE EXERCISE CHANGES AT THE ENDNAME THE YEAR OF OPTIONS DURING THE YEAR OF THE YEAR

88
NOTE
S TO
THE
FINA
NCIA
L ST
ATEM
ENTS
30
JUNE
200
6
NOTE 28. DIRECTORS AND KEY MANAGEMENT PERSONNEL DISCLOSURES (CONTINUED)OTHER TRANSACTIONS WITH DIRECTORSDirectors of Ridley Corporation LimitedMr D G McGauchie, a previous director, purchased stockfeed on terms and conditions no more favourable than other comparable customers. A total of $67,354 was purchased up to 11 October 2004.
Options granted and vested NUMBER OF OPTIONS GRANTED NUMBER OF OPTIONS NAME DURING THE YEAR VESTED DURING THE YEAR
Directors of Ridley Corporation LimitedM P Bickford-Smith 500,000 333,334Other key management personnel of the consolidated entityI Wilton – 266,666W J Poynton* – 149,999A D Murdoch – 199,999
* Ceased employment 16 December 2005.
Shares provided on exercise of remuneration optionsDetails of ordinary shares in the Company provided as a result of the exercise of remuneration options to each director of Ridley Corporation Limited and each of the other key management personnel of the consolidated entity are set out below:
NUMBER OF ORDINARY SHARES ISSUED ON EXERCISE PRICE OF DATE OF EXERCISE EXERCISE OF OPTIONS NAME OPTIONS OF OPTIONS DURING THE YEAR
Directors of Ridley Corporation LimitedM P Bickford-Smith 0.59 16 September 2005 500,000Other key management personnel of the consolidated entityI Wilton 0.72 16 February 2006 100,000
No amounts are unpaid on any shares issued on the exercise of options.
Option holdingsThe numbers of options over ordinary shares in the Company held during the fi nancial year by each director of Ridley Corporation Limited and each of the other key management personnel of the consolidated entity, including their personally-related entities, are set out below:
BALANCE AT GRANTED DURING VESTED AND THE START OF THE YEAR AS EXERCISED BALANCE AT THE EXERCISABLE ATNAME THE YEAR REMUNERATION DURING THE YEAR END OF THE YEAR THE END OF THE YEAR
Directors of Ridley Corporation LimitedM P Bickford-Smith 2,500,000 500,000 500,000 2,500,000 1,000,000Other key management personnel of the consolidated entityI Wilton 900,000 – 100,000 800,000 400,000W J Poynton* 700,000 – – 700,000 483,333A D Murdoch 600,000 – – 600,000 283,332
* Ceased employment 16 December 2005.
No options are vested and unexercisable at the end of the year.

89
NOTE 28. DIRECTORS AND KEY MANAGEMENT PERSONNEL DISCLOSURES (CONTINUED)OTHER TRANSACTIONS WITH DIRECTORS (CONTINUED)Ridley Inc option holdings
Directors of Ridley Corporation LimitedJ S Keniry 28,000 – – 14,000 14,000 14,000Other key management personnel of the consolidated entityS J VanRoekel 20,000 – – 10,000 10,000 10,000R E Frost 20,000 – – 10,000 10,000 10,000M S Mitchell 15,000 – 10,000 5,000 – –
Loans to directors and executivesAggregate of loans made to directors of Ridley Corporation Limited and other key management personnel of the consolidated entity including their personally-related entities, are set out below:
BALANCE AT THE START BALANCE AT THE END OF NUMBER IN GROUP AT OF THE YEAR THE YEAR THE END OF THE YEAR2006 $ $
Directors of Ridley Corporation Limited Nil Nil NilOther key management personnel of the consolidated entity 12,405 5,279 2
2005
Directors of Ridley Corporation Limited Nil Nil NilOther key management personnel of the consolidated entity 9,760 12,405 4
The loans are interest-free and secured against shares issued under the Ridley Employee Share Scheme.
BALANCE AT GRANTED DURING VESTED AND THE START OF THE YEAR AS EXERCISED EXPIRED BALANCE AT THE EXERCISABLE ATNAME THE YEAR REMUNERATION DURING THE YEAR DURING THE YEAR END OF THE YEAR THE END OF THE YEAR

90
NOTE
S TO
THE
FINA
NCIA
L ST
ATEM
ENTS
30
JUNE
200
6
NOTE 29. BUSINESS AND GEOGRAPHICAL DATA BUSINESS SEGMENT DATA – 2006 Sales – external 86,739 491,868 175,617 394,741 109,710 – – 1,258,675 – 1,258,675Sales – internal – – – 27,435 11,045 – (38,480) – – –Total sales revenue 86,739 491,868 175,617 422,176 120,755 – (38,480) 1,258,675 – 1,258,675Share of profi t of associates 5,946 – – – – – – 5,946 – 5,946Other revenue 504 710 602 1,698 49 1,080 – 4,643 431 5,074Total revenue 93,189 492,578 176,219 423,874 120,804 1,080 (38,480) 1,269,264 431 1,269,695Result from operations 23,131 15,903 10,028 17,149 9,561 (16,334) – 59,438 245 59,683Net fi nance costs (13,867) – (13,867)Profi t from continuing operations before income tax 45,571 245 45,816Income tax expense (11,917) (170) (12,087)Net profi t 33,654 75 33,729Segment assets 258,845 206,389 94,338 134,927 74,719 6,585 – 775,803 1,106 776,909Segment liabilities 9,234 80,560 19,008 37,090 5,292 230,867 – 382,051 788 382,839Investment in associates 44,074 – – – – – – 44,074 – 44,074Acquisitions of property, plant and equipment, intangibles and other non-current segment assets 5,338 18,422 2,333 4,506 3,397 324 – 34,320 – 34,320Depreciation and amortisation expense 3,437 6,557 2,641 6,019 2,551 1,516 – 22,721 – 22,721
BUSINESS SEGMENT DATA – 2005Sales – external 71,539 443,088 158,931 380,259 99,282 – – 1,153,099 773 1,153,872Sales – internal – – – 27,629 7,553 – (35,182) – – –Total sales revenue 71,539 443,088 158,931 407,888 106,835 – (35,182) 1,153,099 773 1,153,872Share of profi t of associates 6,079 – – – – – – 6,079 – 6,079Other revenue 182 651 39 3,842 56 – – 4,770 – 4,770Total revenue 77,800 443,739 158,970 411,730 106,891 – (35,182) 1,163,948 773 1,164,271Result from operations 19,018 15,562 4,663 15,168 11,047 (12,251) – 53,207 154 53,361Net fi nance costs (9,891) 15 (9,876)Profi t from continuing operations before income tax 43,316 169 43,485Income tax benefi t (expense) 1,856 (360) 1,496Net profi t 45,172 (191) 44,981Segment assets 259,549 161,959 81,613 132,322 69,279 10,228 – 714,950 1,042 715,992Segment liabilities 15,009 78,842 16,094 35,987 8,546 209,083 – 363,561 1,002 364,563Investment in associates 44,083 – – – – – – 44,083 – 44,083Acquisitions of property, plant and equipment, intangibles and other non-current segment assets 60,671 6,593 1,909 4,350 26,988 3 – 100,514 – 100,514Depreciation and amortisation expense 2,873 5,991 2,695 5,959 2,083 768 – 20,369 – 20,369
STOCKFEED AND FEED SUPPLEMENTS
US DIS– AUSTRALIA CANADA US NUTRITION CONTINUING CONTINUED BUSINESS SALT FEEDS FEEDS FEEDS SOLUTIONS UNALLOCATED ELIMINATIONS OPERATIONS OPERATIONS TOTALSEGMENTS $’000 $’000 $’000 $’000 $’000 $’000 $’000 $’000 $’000 $’000

91
NOTE 29. BUSINESS AND GEOGRAPHICAL DATA (CONTINUED)GEOGRAPHIC SEGMENTSThe consolidated entity operates in Australasia, North America and the European Union.
AUSTRALASIA NORTH AMERICA EUROPEAN UNION ELIMINATION CONSOLIDATEDGEOGRAPHIC 2006 2005 2006 2005 2006 2005 2006 2005 2006 2005SEGMENTS $’000 $’000 $’000 $’000 $’000 $’000 $’000 $’000 $’000 $’000
External sales 578,607 514,627 680,068 639,245 – – – – 1,258,675 1,153,872Acquisitions of fi xed assets, intangibles and other non- current assets 23,830 67,267 10,490 33,247 – – – – 34,320 100,514Segment assets 519,239 461,953 291,354 287,787 1,106 1,042 (34,790) (34,790) 776,909 715,992
BUSINESS SEGMENTS The consolidated entity is organised into the following divisions by product type:
Stockfeed and Produces and markets stock and poultry feeds, aquafeeds, vitamins, mineral supplementsfeed supplements and rural merchandise.
Salt Produces, refi nes and markets salt and has investments in associated companies.
Discontinued operations Swine genetics.
The basis of intersegmental transfers is market pricing.
Results are calculated on a before net borrowing costs and tax expense basis. Segment assets exclude deferred tax assets and cash, which have been included as unallocated assets.
CONSOLIDATED PARENT ENTITY 2006 2005 2006 2005 $’000 $’000 $’000 $’000
NOTE 30(i). RECONCILIATION OF NET CASH INFLOW FROM OPERATING ACTIVITIES TO PROFIT AFTER INCOME TAX
Net cash infl ow from operating activities 39,536 67,271 16,851 15,046Depreciation and amortisation (22,854) (20,687) (615) (618)Net profi t/(loss) on sale of non-current assets (230) 248 – –Other 7 5 10 116Dividends in excess of equity profi ts 9 (898) – –Non-cash share-based payments (760) (953) (760) (953)Non-cash retirement benefi t expense (465) (2,163) – –Contributions to retirement benefi ts 4,840 3,035 – –
Change in operating assets and liabilities, net of effects from purchase and sale of controlled entities and business:
Increase/(decrease) in trade debtors and doubtful debt provision 12,931 (993) – –Increase in inventories 17,849 4,391 – –Increase/(decrease) in deferred tax assets – 9,199 (9) 8,562Increase/(decrease) in other debtors (5,562) 1,412 (1,150) 78Decrease in prepayments (157) (739) – (28)Decrease in deferred expenditure (964) – – –Increase in trade creditors (5,967) (17,773) (1,105) (1,505)(Increase)/decrease in employee provisions (642) (1,182) 193 (112)Decrease in other provisions 162 68 – 68(Increase)/decrease in provision for income tax payable 3,487 767 795 (795)(Increase)/decrease in provision for income tax (936) 766 – 667(Increase)/decrease in provision for deferred income tax (6,555) 3,207 111 3,242Profi t for the year 33,729 44,981 14,321 23,768

92
NOTE
S TO
THE
FINA
NCIA
L ST
ATEM
ENTS
30
JUNE
200
6
NOTE 30(ii). RECONCILIATION OF CASHCash at the end of the fi nancial year as shown in the statements of cash fl ows is reconciled to the related items in the balance sheets as follows:
Cash 6,838 10,715 3,210 2Short-term deposits 562 272 – – 7,400 10,987 3,210 2Bank overdraft (5,878) (3,491) – (20,098)Total cash 1,522 7,496 3,210 (20,096)
NOTE 31. NON-CASH FINANCING AND INVESTING ACTIVITIESDuring the year, dividends of $8,711,000 (2005: $5,384,000) were satisfi ed by the issue of 6,347,556 (2005: 3,799,100) shares under the Dividend Reinvestment Plan.
NOTE 32. FINANCE FACILITIESTERM LOAN FACILITIESGlobal finance facilityIn October 2001, the consolidated entity entered into a four-year global facility agreement with a consortium of Australian and international banks. In 2004, the facility was extended for two years to October 2007. Subsequent to year-end, the terms of the facility were amended with an expiry date of 31 July 2009. The new facility limits are A$215,000,000, US$67,000,000 and C$26,000,000. A$26,700,000 and US$20,000,000 of the facility limits are subject to annual review, with the balance expiring on 31 July 2009. The key covenant ratios under the facility are interest cover, debt cover, gearing and consolidated net worth. The facility is secured by fi xed and fl oating charges over Group assets.
The facility consists of revolving and non-revolving cash advances.
Limits to cash advances
CURRENCY REVOLVING LIMIT UTILISED NON-REVOLVING LIMIT UTILISED TOTAL LIMIT TOTAL UTILISED
2006Australian dollars A$100m A$95m A$50m A$50m A$150m A$145mUnited States dollars US$23m US$9m – – US$23m US$9mCanadian dollars C$26m C$12m – – C$26m C$12m
2005Australian dollars A$100m A$72m A$50m A$50m A$150m A$122mUnited States dollars US$23m US$9m US$4m US$4m US$27m US$13mCanadian dollars C$26m C$19m C$2m C$2m C$28m C$21m
CURRENCY REVOLVING NON-REVOLVING
Repayments Australian dollars October 2007 October 2007United States dollars October 2007 October 2005(a)
Canadian dollars October 2007 October 2005(a)
(a) The US and Canadian non-revolving facilities are repayable in equal quarterly instalments of US$2 million and C$1 million respectively, with the fi nal repayment paid in October 2005.
CONSOLIDATED PARENT ENTITY 2006 2005 2006 2005 $’000 $’000 $’000 $’000

93
NOTE 32. FINANCE FACILITIES (CONTINUED)SHORT-TERM CREDIT FACILITIESAustralian dollar facilityThe consolidated entity has a $6.5 million (2005: $6.5 million) net overdraft facility, subject to annual review. At 30 June 2006 and 2005, this facility was unutilised.
The consolidated entity has standby facilities totalling $55.0 million, subject to annual review these facilities expire on 31 July 2006. As at 30 June 2006, these facilities were unutilised. Subsequent to year-end, these facilities were amalgamated into the global fi nance facility.
United States dollar facilitiesThe consolidated entity has a US$1.1 million (2005: US$1.1 million) loan facility subject to annual review. At 30 June 2006, US$0.9 million (2005: US$0.7 million) of this was utilised.
The consolidated entity has a US$4.0 million (2005: US$4.0 million) open line of credit subject to annual review. At 30 June 2006, US$2.0 million (2005: US$2.1 million) of this facility was utilised.
Canadian dollar facilityThe consolidated entity has a C$5.0 million (2005: C$5.0 million) overdraft facility, subject to annual review. At 30 June 2006, C$1.4 million of this facility was utilised (2005: unutilised).
CONSOLIDATED 2006 2005
NOTE 33. EARNINGS PER SHAREBasic earnings per share from continuing operations 10.0c 14.8cBasic earnings per share 10.0c 14.7cDiluted earnings per share from continuing operations 10.0c 14.7cDiluted earnings per share 10.0c 14.7c
2006 2005 EARNINGS PER SHARE EARNINGS PER SHARE BASIC DILUTED BASIC DILUTED $’000 $’000 $’000 $’000
Profi t from continuing operations after income tax 33,654 33,654 45,172 45,172Profi t/(loss) from discontinued operations 75 75 (191) (191)Net profi t attributable to minority interest 6,040 6,040 5,012 5,012Profi t attributable to members and earnings used in calculating earnings per share 27,689 27,689 39,969 39,969
BASIC DILUTED BASIC DILUTED
Weighted average number of shares used as the denominatorWeighted average number of shares on issue 277,220,791 277,220,791 271,433,818 271,433,818Plus dilutive options below share price – 225,327 – 852,310Weighted average number of shares used as the denominator in calculating basic and diluted earnings per share 277,220,791 277,446,118 271,433,818 272,286,128
2,183,687 shares issued under the Ridley Employee Share Scheme have been accounted for as in-substance options.
OptionsOptions granted to employees under the Ridley Incentive Option Plan are considered to be potential ordinary shares and have been included in the determination of diluted earnings per share. 7,175,000 (2005: 6,775,000) options have not been included in the determination of diluted earnings per share. Details relating to the options are set out in note 26.

94
NOTE
S TO
THE
FINA
NCIA
L ST
ATEM
ENTS
30
JUNE
200
6
NOTE 34. INVESTMENT IN CONTROLLED ENTITIESBUSINESSES AND CONTROLLED ENTITIES ACQUIRED2006The Group acquired the business and assets of Teangi Stockfeeds, a stockfeed business, on 28 July 2005 and the business and assets of Primix, a feed supplements business, on 22 November 2005. On 12 August 2005, the Group purchased the remaining 49% share of McCauley Bros Inc, a horse feed producer.
2005The Group acquired the Dry Creek salt fi eld and associated plant and equipment on 19 May 2005 and the business and assets of Sweetlix LLC, a livestock feed supplement business, on 30 July 2004.
FAIR VALUE OF ASSETS ACQUIRED 2006 2005 $’000 $’000
Current assetsReceivables – 3,124Inventories 1,319 6,724Other 18 95
Non-current assetsProperty, plant and equipment 4,454 62,298Deferred tax asset 39 296Other – 63
Current liabilitiesPayables (47) (2,138)Provisions (96) (417)
Non-current liabilitiesProvisions (35) (570)Deferred tax liabilities (101) –Fair value of net identifi able assets acquired 5,551 69,475Minority interest 545 – 6,096 69,475Goodwill acquired 2,911 15,356Consideration 9,007 84,831Less: Amounts deferred 2,166 5,387Outfl ow of cash to acquire businesses and controlled entities net of cash acquired 6,841 79,444
Stamp duty and other associated costs relating to the Dry Creek acquisition in 2005 of $3,313,000 were paid in 2006. Goodwill was increased by $518,000.
BUSINESSES AND CONTROLLED ENTITIES DISPOSEDAt 30 June 2003, all of the operations of the Cotswold Swine Genetics business in North America were written down to recoverable value. On 23 September 2003, a controlled entity sold the major assets of that business.
On 10 May 2002, the consolidated entity sold the Cotswold International – Europe swine genetics business. Settlement of residual assets and liabilities is expected no later than May 2008.
Financial information relating to the discontinued operations is set out opposite. Further information is disclosed in note 29, Business and Geographical Data.

95
NOTE 34. INVESTMENT IN CONTROLLED ENTITIES (CONTINUED)BUSINESSES AND CONTROLLED ENTITIES DISPOSED (CONTINUED)
Revenue from discontinued operations 431 773Total revenue from discontinued operations 431 773
Expenses from discontinued operations 186 604Total expenses from discontinued operations 186 604
Profi t from discontinued operations before income tax 245 169Income tax expense (170) (360)Net profi t/(loss) 75 (191)
Carrying amount of assets and liabilities
Deferred receivable 1,106 1,042Receivables – –Total assets 1,106 1,042
Payables and accrued liabilities 81 1,002Total liabilities 81 1,002
Net assets 1,025 40
CASH FLOW INFORMATIONNet cash infl ow/(outfl ow) from ordinary activities 75 (191)Net cash infl ow from fi nancing activities – 191Net cash infl ow 75 –
CONSOLIDATED 2006 2005 $’000 $’000

96
NOTE
S TO
THE
FINA
NCIA
L ST
ATEM
ENTS
30
JUNE
200
6
NOTE 34. INVESTMENT IN CONTROLLED ENTITIES (CONTINUED)
Ridley AgriProducts Pty Ltd and its controlled entities Australia Ordinary 100% 100% AgriProducts Pty Ltd Australia Ordinary 100% 100% Farmstock Pty Limited and its controlled entity Australia Ordinary 100% 100% Farmstock Milling Pty Ltd Australia Ordinary 100% 100% Noske Flour Mills Pty Ltd Australia Ordinary 100% 100% Ridley Australia Pty Ltd Australia Ordinary 100% 100% Ridley AgriProducts (Aust.) Pty Ltd. Australia Ordinary 100% 100% Ridley Liquids JV Pty Limited Australia Ordinary 100% 100% Ridley AgriProducts (NZ) Pty Ltd New Zealand Ordinary 100% 100%Barastoc Stockfeeds Pty Ltd and its controlled entities Australia Ordinary 100% 100% Fosforlic Feed Supplements Pty Ltd Australia Ordinary 100% 100% Rumevite Pty Ltd Australia Ordinary 100% 100%Cheetham Salt Limited and its controlled entities Australia Ordinary 100% 100% CSL (No.3) Pty Limited Australia Ordinary 100% 100% Salt Australia Pty Ltd Australia Ordinary 100% 100% Ocsalt Pty Ltd Australia Australia Ordinary 100% 100% Queensland Salt Pty Ltd Australia Ordinary 100% 100% PT Cheetham Garam and its controlled entity Indonesia Ordinary 100% 100% PT Cheetham International Trading Indonesia Ordinary 100% 100% Sea Lake Salt Pty Ltd Australia Ordinary 100% 100% Mastersalt Pty Ltd Australia Ordinary 100% 100% Cheetham Salt (Dry Creek) Pty Ltd Australia Ordinary 100% 100%Diamond Salt Pty Limited Australia Ordinary 100% 100%RCL Investments Pty Limited Australia Ordinary 100% 100%RCL Retirement Pty Limited Australia Ordinary 100% 100%Ridley Research & Development Corporation Pty Limited Australia Ordinary 100% 100%RCL Nominees Pty Ltd Australia Ordinary 100% 100%Ridley M I Pty Limited Australia Ordinary 100% 100%Ridley Argentina S.A. Argentina Ordinary 100% 100%Ridley Inc and its controlled entities Canada Ordinary 69% 69% Ridley Manitoba Limited Canada Ordinary 69% 69% Ridley Limited Partnership and its controlled entity Canada Ordinary 69% 69% Ridley Nova Scotia LLC and its controlled entity USA Ordinary 69% 69% HFI Finance LLC USA Ordinary 69% 69% Cotswold Holdings ULC and its controlled entity USA Ordinary 69% 69% Ridley UK Holdings Limited UK Ordinary 69% 69% Ridley US Holding Inc. and its controlled entities USA Ordinary 69% 69% Hubbard Feeds Inc. and its controlled entities USA Ordinary 69% 69% Hubbard Feeds Management Company USA Ordinary 69% 69% PBH Transportation Company* USA Ordinary – 69% Ridley Block Operations Inc USA Ordinary 69% 69% Sweetlix Inc. USA Ordinary 69% 69% McCauley Bros. Inc. USA Ordinary 69% 35%
* Disolved 1 June 2006
EQUITY OF COUNTRY OF CLASS PARENT ENTITYNAME OF ENTITY INCORPORATION OF SHARES 2006 2005
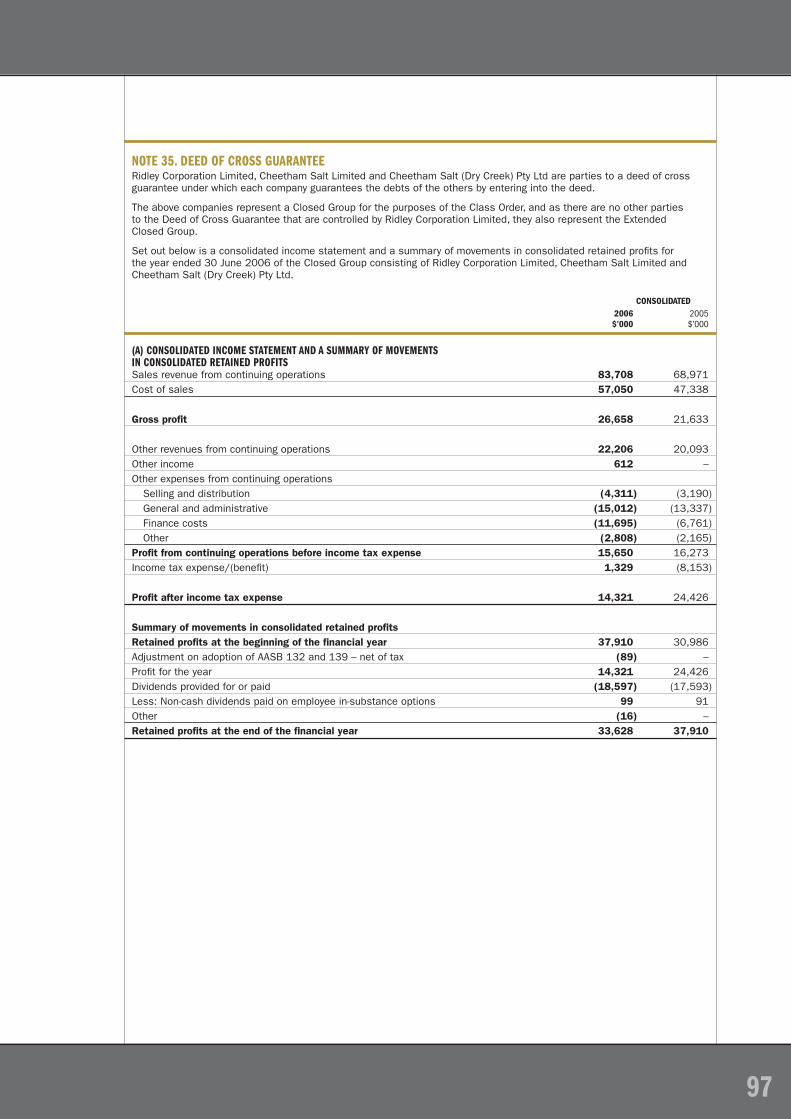
97
NOTE 35. DEED OF CROSS GUARANTEERidley Corporation Limited, Cheetham Salt Limited and Cheetham Salt (Dry Creek) Pty Ltd are parties to a deed of cross guarantee under which each company guarantees the debts of the others by entering into the deed.
The above companies represent a Closed Group for the purposes of the Class Order, and as there are no other parties to the Deed of Cross Guarantee that are controlled by Ridley Corporation Limited, they also represent the Extended Closed Group.
Set out below is a consolidated income statement and a summary of movements in consolidated retained profi ts for the year ended 30 June 2006 of the Closed Group consisting of Ridley Corporation Limited, Cheetham Salt Limited and Cheetham Salt (Dry Creek) Pty Ltd.
CONSOLIDATED 2006 2005 $’000 $’000
(A) CONSOLIDATED INCOME STATEMENT AND A SUMMARY OF MOVEMENTS IN CONSOLIDATED RETAINED PROFITSSales revenue from continuing operations 83,708 68,971Cost of sales 57,050 47,338
Gross profi t 26,658 21,633
Other revenues from continuing operations 22,206 20,093Other income 612 –Other expenses from continuing operations Selling and distribution (4,311) (3,190) General and administrative (15,012) (13,337) Finance costs (11,695) (6,761) Other (2,808) (2,165)Profi t from continuing operations before income tax expense 15,650 16,273Income tax expense/(benefi t) 1,329 (8,153)
Profi t after income tax expense 14,321 24,426
Summary of movements in consolidated retained profi ts Retained profi ts at the beginning of the fi nancial year 37,910 30,986Adjustment on adoption of AASB 132 and 139 – net of tax (89) –Profi t for the year 14,321 24,426Dividends provided for or paid (18,597) (17,593)Less: Non-cash dividends paid on employee in-substance options 99 91Other (16) –Retained profi ts at the end of the fi nancial year 33,628 37,910

98
NOTE
S TO
THE
FINA
NCIA
L ST
ATEM
ENTS
30
JUNE
200
6
NOTE 35. DEED OF CROSS GUARANTEE (CONTINUED)(B) BALANCE SHEETCurrent assets Cash and cash equivalents 5,230 8Receivables 14,396 14,891Inventories 30,127 27,657Total current assets 49,753 42,556
Non-current assetsReceivables 113,427 95,650Property, plant and equipment 147,331 151,646Deferred tax assets 366 637Intangible assets 5,017 4,537Other non-current assets 176,609 158,956Total non-current assets 442,750 411,426
Total assets 492,503 453,982
Current liabilities Payables 8,306 12,298Interest bearing liabilities – 14,047Current tax liabilities – 795Provisions 3,325 2,455Total current liabilities 11,631 29,595
Non-current liabilitiesInterest bearing liabilities 144,500 121,500Deferred tax liabilities 14,377 –Provisions 1,359 2,569Total non-current liabilities 160,236 124,069
Total liabilities 171,867 153,664
Net assets 320,636 300,318
EquityContributed equity 210,633 201,009Reserves 76,375 61,399Retained profi ts 33,628 37,910
Total equity 320,636 300,318
CONSOLIDATED 2006 2005 $’000 $’000

99
NOTE 36. INVESTMENTS IN ASSOCIATESCONSOLIDATEDSalpak Pty Ltd Salt Marketing Australia 49% 49% 14,066 14,064Western Salt Refi nery Salt Production Pty Ltd and Distribution Australia 50% 50% 1,271 1,282Dominion Salt Limitedand Dominion Salt Salt Production (N.I.) Limited and Distribution New Zealand 50% 50% 26,409 26,409Cerebos-Skellerup Limited Salt Marketing New Zealand 49% 49% 2,328 2,328Total 44,074 44,083
The above comprise interests in the ordinary share capital of the associates. The balance date of Salpak Pty Ltd and Cerebos-Skellerup Limited is 30 September, and 30 June for Western Salt Refi nery Pty Ltd, Dominion Salt Limited and Dominion Salt (N.I.) Limited.
MOVEMENTS IN CARRYING AMOUNTS OF INVESTMENTS IN ASSOCIATESSummary of the performance and fi nancial position of the associates is as follows:
2006 2005 $’000 $’000
Carrying amount at the beginning of the fi nancial year 44,083 44,084
Share of operating profi ts after income tax 5,946 6,079Dividends received/receivable (5,955) (6,080)
Carrying amount at the end of the fi nancial year 44,074 44,083
Operating profi ts before income tax 8,791 9,095Income tax expense 2,845 3,016
Operating profi ts after income tax 5,946 6,079Less: dividends received/receivable 5,955 6,080 (9) (1)
Accumulated losses attributable to associates at the beginning of the fi nancial year (9,393) (9,392)Accumulated losses attributable to associates at the end of the fi nancial year (9,402) (9,393)
Consolidated entity’s share:
Assets 44,164 43,808Liabilities 6,508 6,420Contingent liabilities 31 43Operating lease commitments 97 55Capital expenditure commitment – 47
There are no material reserves of the associated companies.
OWNERSHIP INTEREST CARRYING AMOUNT PRINCIPAL COUNTRY OF 2006 2005 2006 2005 NAME OF COMPANY ACTIVITY INCORPORATION $’000 $’000

100
NOTE
S TO
THE
FINA
NCIA
L ST
ATEM
ENTS
30
JUNE
200
6
NOTE 37. INTERESTS IN JOINT VENTURESJOINT VENTURE OPERATIONSControlled entities have a 50% participating interest in two joint venture operations Champion Liquid Feeds Joint Venture and Ridley TSS Joint Venture. These joint ventures produce and market stockfeed. The consolidated entity is entitled to 50% of the output of the joint ventures. The consolidated entity’s interests in the assets employed in these joint ventures are included in the consolidated statements of fi nancial position.
CONSOLIDATED PARENT ENTITY 2006 2005 2006 2005 $’000 $’000 $’000 $’000
Current assetsCash – 392 – –Receivables 2,729 1,791 – –Inventories 748 654 – –Other 16 7 – –Total current assets 3,493 2,844 – –
Non-current assetsPlant and equipment – at cost 238 143 – –Less: Accumulated depreciation 97 88 – –Total non-current assets 141 55 – –
Share of assets employed in joint venture 3,634 2,899 – –
The consolidated entity’s share of operating lease commitments is $90,000 (2005: $70,000).
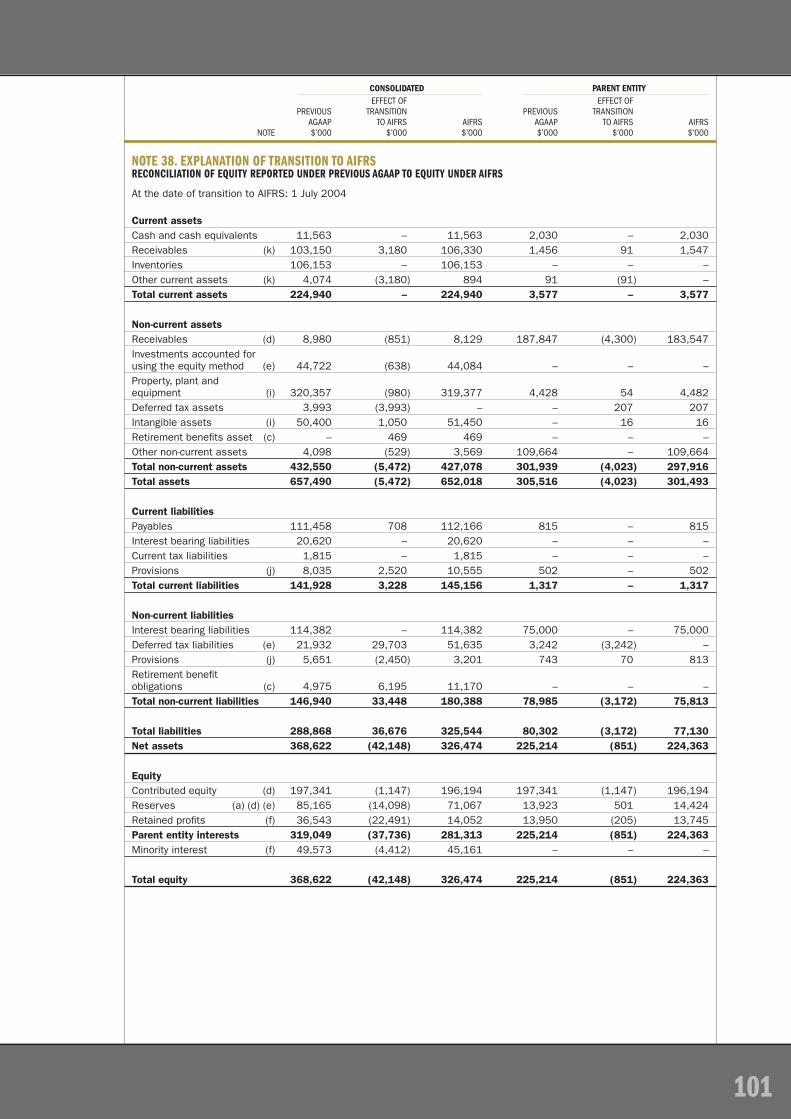
101
NOTE 38. EXPLANATION OF TRANSITION TO AIFRSRECONCILIATION OF EQUITY REPORTED UNDER PREVIOUS AGAAP TO EQUITY UNDER AIFRS
At the date of transition to AIFRS: 1 July 2004
Current assetsCash and cash equivalents 11,563 – 11,563 2,030 – 2,030Receivables (k) 103,150 3,180 106,330 1,456 91 1,547Inventories 106,153 – 106,153 – – –Other current assets (k) 4,074 (3,180) 894 91 (91) –Total current assets 224,940 – 224,940 3,577 – 3,577
Non-current assetsReceivables (d) 8,980 (851) 8,129 187,847 (4,300) 183,547Investments accounted for using the equity method (e) 44,722 (638) 44,084 – – –Property, plant and equipment (i) 320,357 (980) 319,377 4,428 54 4,482Deferred tax assets 3,993 (3,993) – – 207 207Intangible assets (i) 50,400 1,050 51,450 – 16 16Retirement benefi ts asset (c) – 469 469 – – –Other non-current assets 4,098 (529) 3,569 109,664 – 109,664Total non-current assets 432,550 (5,472) 427,078 301,939 (4,023) 297,916Total assets 657,490 (5,472) 652,018 305,516 (4,023) 301,493
Current liabilitiesPayables 111,458 708 112,166 815 – 815Interest bearing liabilities 20,620 – 20,620 – – –Current tax liabilities 1,815 – 1,815 – – –Provisions (j) 8,035 2,520 10,555 502 – 502Total current liabilities 141,928 3,228 145,156 1,317 – 1,317
Non-current liabilitiesInterest bearing liabilities 114,382 – 114,382 75,000 – 75,000Deferred tax liabilities (e) 21,932 29,703 51,635 3,242 (3,242) –Provisions (j) 5,651 (2,450) 3,201 743 70 813Retirement benefi t obligations (c) 4,975 6,195 11,170 – – –Total non-current liabilities 146,940 33,448 180,388 78,985 (3,172) 75,813
Total liabilities 288,868 36,676 325,544 80,302 (3,172) 77,130Net assets 368,622 (42,148) 326,474 225,214 (851) 224,363
EquityContributed equity (d) 197,341 (1,147) 196,194 197,341 (1,147) 196,194Reserves (a) (d) (e) 85,165 (14,098) 71,067 13,923 501 14,424Retained profi ts (f) 36,543 (22,491) 14,052 13,950 (205) 13,745Parent entity interests 319,049 (37,736) 281,313 225,214 (851) 224,363Minority interest (f) 49,573 (4,412) 45,161 – – –
Total equity 368,622 (42,148) 326,474 225,214 (851) 224,363
CONSOLIDATED PARENT ENTITY EFFECT OF EFFECT OF PREVIOUS TRANSITION PREVIOUS TRANSITION AGAAP TO AIFRS AIFRS AGAAP TO AIFRS AIFRS NOTE $’000 $’000 $’000 $’000 $’000 $’000

102
NOTE
S TO
THE
FINA
NCIA
L ST
ATEM
ENTS
30
JUNE
200
6
NOTE 38. EXPLANATION OF TRANSITION TO AIFRS (CONTINUED)RECONCILIATION OF EQUITY REPORTED UNDER PREVIOUS AGAAP TO EQUITY UNDER AIFRS (CONTINUED)At the end of the last reporting period under previous AGAAP: 30 June 2005
Current assetsCash and cash equivalents 10,987 – 10,987 2 – 2Receivables (k) 106,602 2,421 109,023 2,129 63 2,192Inventories 110,444 – 110,444 – – –Other current assets (k) 2,603 (2,421) 182 63 (63) –Total current assets 230,636 – 230,636 2,194 – 2,194
Non-current assetsReceivables (d) 6,586 (1,094) 5,492 259,186 7,093 266,279Investments accounted for using the equity method (b) (e) 43,824 259 44,083 – – –Property, plant and equipment (i) 372,033 (1,095) 370,938 4,212 51 4,263Deferred tax assets 14,287 (14,287) – 8,416 (8,041) 375Intangible assets (b) (i) 57,323 5,298 62,621 – 4 4Retirement benefi t assets (c) 1,459 (1,459) – – – –Other non-current assets 2,750 (528) 2,222 109,348 – 109,348Total non-current assets 498,262 (12,906) 485,356 381,162 (893) 380,269Total assets 728,898 (12,906) 715,992 383,356 (893) 382,463
Current liabilitiesPayables 130,946 707 131,653 2,312 – 2,312Interest bearing liabilities 11,681 – 11,681 20,098 – 20,098Current tax liabilities 2,551 – 2,551 795 – 795Provisions (j) 8,552 3,337 11,889 580 – 580Total current liabilities 153,730 4,044 157,774 23,785 – 23,785
Non-current liabilitiesInterest bearing liabilities 163,416 – 163,416 121,500 – 121,500Deferred tax liabilities (e) 18,076 9,572 27,648 – – –Provisions (j) 6,444 (3,263) 3,181 708 74 782Retirement benefi t obligations (c) 5,284 7,260 12,544 – – –Total non-current liabilities 193,220 13,569 206,789 122,208 74 122,282
Total liabilities 346,950 17,613 364,563 145,993 74 146,067Net assets 381,948 (30,519) 351,429 237,363 (967) 236,396
Equity Contributed equity (d) 202,489 (1,480) 201,009 202,489 (1,480) 201,009Reserves (a) (d) (e) 75,879 (5,919) 69,960 13,923 1,453 15,376Retained profi ts (f) 53,361 (18,869) 34,492 20,951 (940) 20,011Parent entity interests 331,729 (26,268) 305,461 237,363 (967) 236,396Minority interest (f) 50,219 (4,251) 45,968 – – –
Total equity 381,948 (30,519) 351,429 237,363 (967) 236,396
CONSOLIDATED PARENT ENTITY EFFECT OF EFFECT OF PREVIOUS TRANSITION PREVIOUS TRANSITION AGAAP TO AIFRS AIFRS AGAAP TO AIFRS AIFRS NOTE $’000 $’000 $’000 $’000 $’000 $’000
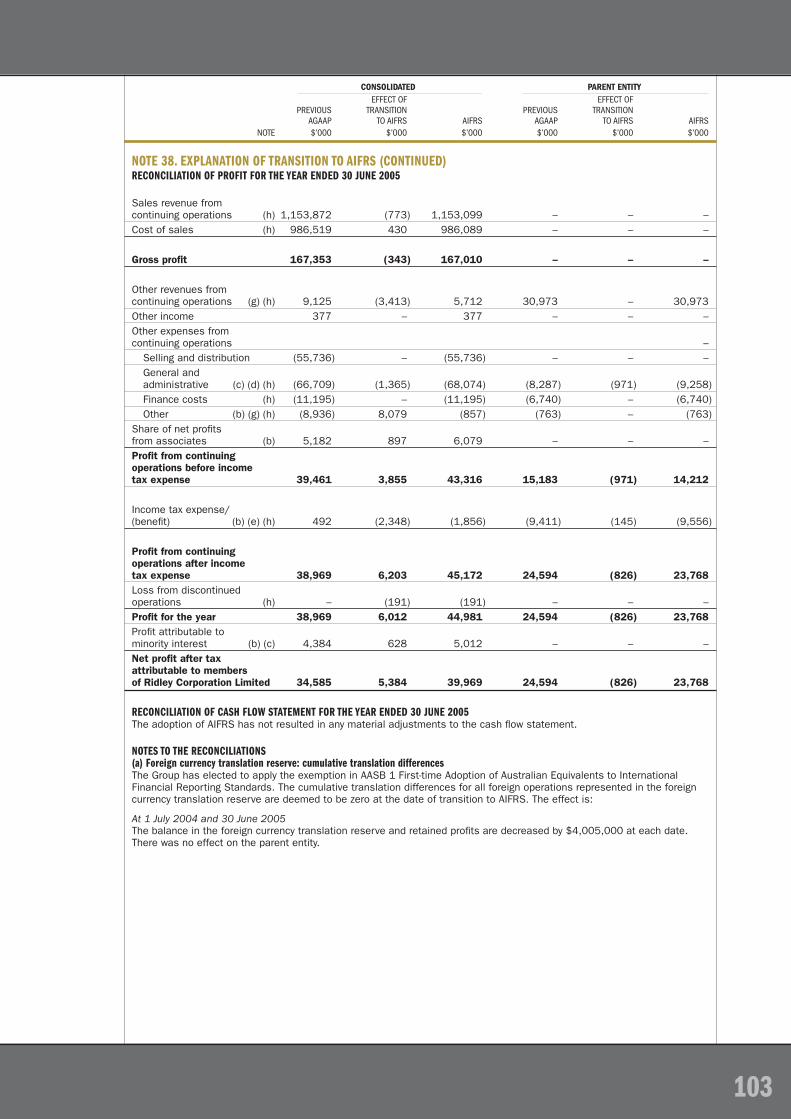
103
NOTE 38. EXPLANATION OF TRANSITION TO AIFRS (CONTINUED)RECONCILIATION OF PROFIT FOR THE YEAR ENDED 30 JUNE 2005
Sales revenue from continuing operations (h) 1,153,872 (773) 1,153,099 – – –Cost of sales (h) 986,519 430 986,089 – – –
Gross profi t 167,353 (343) 167,010 – – –
Other revenues from continuing operations (g) (h) 9,125 (3,413) 5,712 30,973 – 30,973Other income 377 – 377 – – –Other expenses from continuing operations – Selling and distribution (55,736) – (55,736) – – – General and administrative (c) (d) (h) (66,709) (1,365) (68,074) (8,287) (971) (9,258) Finance costs (h) (11,195) – (11,195) (6,740) – (6,740) Other (b) (g) (h) (8,936) 8,079 (857) (763) – (763)Share of net profi ts from associates (b) 5,182 897 6,079 – – –Profi t from continuing operations before income tax expense 39,461 3,855 43,316 15,183 (971) 14,212
Income tax expense/(benefi t) (b) (e) (h) 492 (2,348) (1,856) (9,411) (145) (9,556)
Profi t from continuing operations after income tax expense 38,969 6,203 45,172 24,594 (826) 23,768Loss from discontinued operations (h) – (191) (191) – – –Profi t for the year 38,969 6,012 44,981 24,594 (826) 23,768Profi t attributable to minority interest (b) (c) 4,384 628 5,012 – – –Net profi t after tax attributable to members of Ridley Corporation Limited 34,585 5,384 39,969 24,594 (826) 23,768
RECONCILIATION OF CASH FLOW STATEMENT FOR THE YEAR ENDED 30 JUNE 2005The adoption of AIFRS has not resulted in any material adjustments to the cash fl ow statement.
NOTES TO THE RECONCILIATIONS(a) Foreign currency translation reserve: cumulative translation differencesThe Group has elected to apply the exemption in AASB 1 First-time Adoption of Australian Equivalents to International Financial Reporting Standards. The cumulative translation differences for all foreign operations represented in the foreign currency translation reserve are deemed to be zero at the date of transition to AIFRS. The effect is:
At 1 July 2004 and 30 June 2005The balance in the foreign currency translation reserve and retained profi ts are decreased by $4,005,000 at each date. There was no effect on the parent entity.
CONSOLIDATED PARENT ENTITY EFFECT OF EFFECT OF PREVIOUS TRANSITION PREVIOUS TRANSITION AGAAP TO AIFRS AIFRS AGAAP TO AIFRS AIFRS NOTE $’000 $’000 $’000 $’000 $’000 $’000
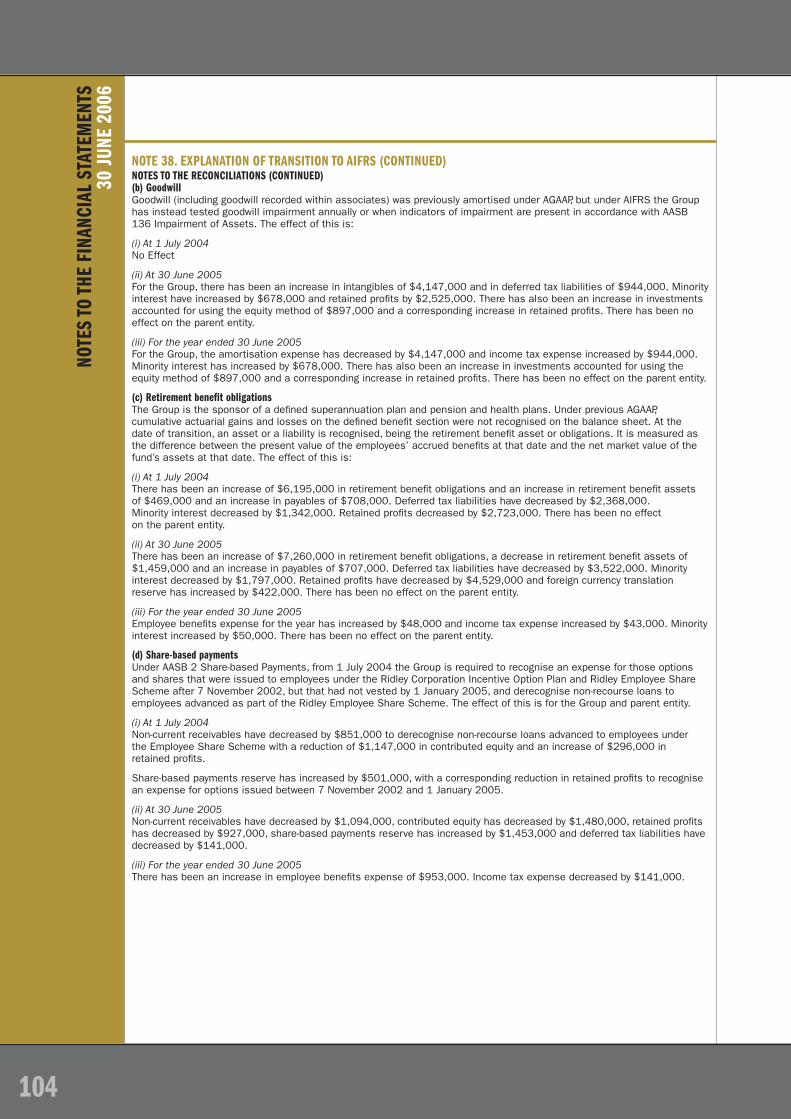
104
NOTE
S TO
THE
FINA
NCIA
L ST
ATEM
ENTS
30
JUNE
200
6
NOTE 38. EXPLANATION OF TRANSITION TO AIFRS (CONTINUED)NOTES TO THE RECONCILIATIONS (CONTINUED)(b) GoodwillGoodwill (including goodwill recorded within associates) was previously amortised under AGAAP, but under AIFRS the Group has instead tested goodwill impairment annually or when indicators of impairment are present in accordance with AASB 136 Impairment of Assets. The effect of this is:
(i) At 1 July 2004No Effect
(ii) At 30 June 2005For the Group, there has been an increase in intangibles of $4,147,000 and in deferred tax liabilities of $944,000. Minority interest have increased by $678,000 and retained profi ts by $2,525,000. There has also been an increase in investments accounted for using the equity method of $897,000 and a corresponding increase in retained profi ts. There has been no effect on the parent entity.
(iii) For the year ended 30 June 2005For the Group, the amortisation expense has decreased by $4,147,000 and income tax expense increased by $944,000. Minority interest has increased by $678,000. There has also been an increase in investments accounted for using the equity method of $897,000 and a corresponding increase in retained profi ts. There has been no effect on the parent entity.
(c) Retirement benefit obligationsThe Group is the sponsor of a defi ned superannuation plan and pension and health plans. Under previous AGAAP, cumulative actuarial gains and losses on the defi ned benefi t section were not recognised on the balance sheet. At the date of transition, an asset or a liability is recognised, being the retirement benefi t asset or obligations. It is measured as the difference between the present value of the employees’ accrued benefi ts at that date and the net market value of the fund’s assets at that date. The effect of this is:
(i) At 1 July 2004There has been an increase of $6,195,000 in retirement benefi t obligations and an increase in retirement benefi t assets of $469,000 and an increase in payables of $708,000. Deferred tax liabilities have decreased by $2,368,000. Minority interest decreased by $1,342,000. Retained profi ts decreased by $2,723,000. There has been no effect on the parent entity.
(ii) At 30 June 2005There has been an increase of $7,260,000 in retirement benefi t obligations, a decrease in retirement benefi t assets of $1,459,000 and an increase in payables of $707,000. Deferred tax liabilities have decreased by $3,522,000. Minority interest decreased by $1,797,000. Retained profi ts have decreased by $4,529,000 and foreign currency translation reserve has increased by $422,000. There has been no effect on the parent entity.
(iii) For the year ended 30 June 2005Employee benefi ts expense for the year has increased by $48,000 and income tax expense increased by $43,000. Minority interest increased by $50,000. There has been no effect on the parent entity.
(d) Share-based paymentsUnder AASB 2 Share-based Payments, from 1 July 2004 the Group is required to recognise an expense for those options and shares that were issued to employees under the Ridley Corporation Incentive Option Plan and Ridley Employee Share Scheme after 7 November 2002, but that had not vested by 1 January 2005, and derecognise non-recourse loans to employees advanced as part of the Ridley Employee Share Scheme. The effect of this is for the Group and parent entity.
(i) At 1 July 2004Non-current receivables have decreased by $851,000 to derecognise non-recourse loans advanced to employees under the Employee Share Scheme with a reduction of $1,147,000 in contributed equity and an increase of $296,000 in retained profi ts.
Share-based payments reserve has increased by $501,000, with a corresponding reduction in retained profi ts to recognise an expense for options issued between 7 November 2002 and 1 January 2005.
(ii) At 30 June 2005Non-current receivables have decreased by $1,094,000, contributed equity has decreased by $1,480,000, retained profi ts has decreased by $927,000, share-based payments reserve has increased by $1,453,000 and deferred tax liabilities have decreased by $141,000.
(iii) For the year ended 30 June 2005There has been an increase in employee benefi ts expense of $953,000. Income tax expense decreased by $141,000.

105
NOTE 38. EXPLANATION OF TRANSITION TO AIFRS (CONTINUED)NOTES TO THE RECONCILIATIONS (CONTINUED)(e) Deferred tax liabilityUnder previous AGAAP, income tax expense was calculated by reference to the accounting profi t after allowing for permanent differences. Deferred tax was not recognised in relation to differences between tax bases and carrying amounts of revalued assets, including certain assets such as land and salt fi elds with indefi nite useful lives. The adoption of AIFRS has resulted in a change in accounting policy. The application of AASB 112 Income Taxes has resulted in the recognition of deferred tax liabilities on these assets as shown in table below. This change also resulted in the recognition of additional deferred tax liabilities in associates decreasing investments accounted for using the equity method and retained profi ts by $638,000 at both 1 July 2004 and 30 June 2005. The effects are as follows:
(i) At 1 July 2004 and at 30 June 2005The effects on the deferred tax liability of the adoption of AIFRS are as follows:
CONSOLIDATED PARENT ENTITY 30 JUNE 2005 1 JULY 2004 30 JUNE 2005 1 JULY 2004 NOTE $’000 $’000 $’000 $’000
Adjustments arising from adoption of AASB 112Retained earnings 11,862 14,604 – –Asset revaluation reserve 11,800 18,602 – –Minority interest 3,132 3,069 – – 26,794 36,275 – –
Application of AASB 112 to adjustments arising from adoption of other AASBsShare-based payments (d) (141) – (141) –Goodwill (b) 944 – – –Retirement benefi ts obligations (c) (3,521) (2,368) – –Other (217) (211) (6) –Adjustments relating to the accounting for the tax consolidation legislation (e) – – 8,188 (3,449)Increase in deferred tax liability 23,859 33,696 8,041 (3,449)Set-off of deferral tax assets 14,287 (3,993) (8,041) 207 9,572 29,703 – (3,242)
(ii) For the year ended 30 June 2005The impact of AASB 112 has decreased income tax expense by $2,348,000.
Impact of revised tax consolidation legislationRidley Corporation Limited and its wholly-owned Australian controlled entities implemented the tax consolidation legislation as of 1 July 2003. Under previous AGAAP, Ridley Corporation Limited recognised current and deferred tax amounts relating to transactions, events and balances of the tax consolidated entities as if those transactions, events and balances were its own.
Under AIFRS, the parent entity only recognises the current tax payable and deferred tax assets arising from unused tax losses and unused tax credits assumed from controlled entities in the tax consolidated group. Under these rules, Ridley Corporation Limited has reclassifi ed the deferred tax balances (with the exception of those arising from unused tax losses and unused tax credits) relating to tax consolidated entities into the relevant intercompany account on the date of transition to AIFRS.
(i) At 1 July 2004There is no effect on the Group. For the parent entity, deferred tax liabilities decreased by $3,449,000, with a corresponding decrease in receivables from subsidiaries.
(ii) At 30 June 2005There is no effect on the Group. For the parent entity, deferred tax liabilities decreased by $8,188,000, with a corresponding decrease in receivables from subsidiaries.
(iii) For the year ended 30 June 2005There is no effect on the Group or parent entity results.

106
NOTE 38. EXPLANATION OF TRANSITION TO AIFRS (CONTINUED)NOTES TO THE RECONCILIATIONS (CONTINUED)(f) Retained profitsThe effect on retained profi ts of the changes set out above is as follows:
CONSOLIDATED PARENT ENTITY 30 JUNE 2005 1 JULY 2004 30 JUNE 2005 1 JULY 2004 NOTE $’000 $’000 $’000 $’000
Retained profi tsForeign currency translation reserve (a) (4,005) (4,005) – –Goodwill (b) 3,422 – – –Retirement benefi t obligations (c) (4,529) (2,723) – –Share-based payments (d) (927) (205) (927) (205)Other (330) (317) (13) –Deferred tax (e) (12,500) (15,242) – – (18,869) (22,492) (940) (205)
Minority interestGoodwill (b) 678 – – –Retirement benefi t obligations (c) (1,797) (1,343) – –Deferred tax (e) (3,132) (3,069) – – (4,251) (4,412) – –
(g) RevenueUnder the previous AGAAP, proceeds received from the sale of non-current assets was reported as revenue. Under AIFRS, these amounts have been offset against the corresponding expenses in the income statement and the gain on disposal is recognised in other income. The effect of this is:
For the year ended 30 June 2005For the Group, other revenues have decreased by $3,149,000 and other expenses have decreased by $3,149,000. There has been no effect on the parent entity.
(h) Discontinued operationsUnder AIFRS, revenues and expenses of discontinued operations have been removed from individual items of revenue and expense and disclosed in aggregate as “profi t/(loss) from discontinued operations” in the income statement.
(i) Capitalised SoftwareUnder the previous AGAAP, capitalised software was classifi ed as property, plant and equipment. Under AIFRS, capitalised software has been reclassifi ed as intangible assets. The effect of this is as follows:
(i) At 1 July 2004For the Group, there has been an increase in intangible assets of $1,050,000 and a corresponding decrease in property, plant and equipment. There has been an increase in intangible assets of $16,000 and a corresponding decrease in property, plant and equipment for the parent entity.
(ii) At 30 June 2005For the Group, there has been an increase in intangible assets of $1,151,000 and a corresponding decrease in property, plant and equipment. There has been an increase in intangible assets of $4,000 and a corresponding decrease in property, plant and equipment for the parent entity.
(j) Leave entitlementsLiabilities relating to long service leave, which employees are entitled to take within 12 months, were classifi ed as non-current under AGAAP, and have been reclassifi ed to current under AIFRS. There has been no effect on the parent entity.
(i) At 1 July 2004For the Group, there has been an increase in current provisions of $2,520,000 and a corresponding decrease in non-current provisions.
(ii) At 30 June 2005For the Group, there has been an increase in current provisions of $3,337,000 and a corresponding decrease in non-current provisions.
NOTE
S TO
THE
FINA
NCIA
L ST
ATEM
ENTS
30
JUNE
200
6

107
NOTE 38. EXPLANATION OF TRANSITION TO AIFRS (CONTINUED)NOTES TO THE RECONCILIATIONS (CONTINUED)(k) PrepaymentsPrepayments have been re-classifi ed as receivables.
(i) At 1 July 2004For the Group, there has been an increase in current receivables of $3,180,000 and a corresponding decrease in other current assets. There has been an increase in current receivables of $91,000 and a corresponding decrease in other current assets for the parent entity.
(ii) At 30 June 2005For the Group, there has been an increase in current receivables of $2,421,000 and a corresponding decrease in other current assets. There has been an increase in current receivables of $63,000 and a corresponding decrease in other current assets for the parent entity.
NOTE 39. POST BALANCE DATE EVENTSNo other matters or circumstances have arisen since 30 June 2006 that have signifi cantly affected, or may signifi cantly affect:(i) the consolidated entity’s operations in future fi nancial years; or(ii) the results of those operations in future fi nancial years; or(iii) the consolidated entity’s state of affairs in future fi nancial years.

108
DIRE
CTOR
S’DE
CLAR
ATIO
N
DIRECTORS’ DECLARATIONIn the directors’ opinion:
(a) The fi nancial statements and notes set out on pages 51 to 107 and the remuneration report on pages 34 to 45 are in accordance with the Corporations Act 2001, including:
(i) Complying with Accounting Standards, the Corporations Regulations 2001 and other mandatory professional reporting requirements; and
(ii) Giving a true and fair view of the Company’s and consolidated entity’s fi nancial position as at 30 June 2006 and of their performance, as represented by the results of their operations and their cash fl ows, for the fi nancial year ended on that date; and
(b) There are reasonable grounds to believe that the Company will be able to pay its debts as and when they become due and payable; and
(c) The audited remuneration disclosures set out on pages 34 to 45 of the Annual Report comply with AASB 124 Related Party Disclosures and the Corporation Regulations 2001.
The directors have been given the declarations by the Chief Executive Offi cer and Chief Financial Offi cer required by section 295A of the Corporations Act 2001.
This declaration is made in accordance with a resolution of the directors.
J S KENIRYDIRECTOR
R J LOTZEDIRECTOR
Sydney 21 August 2006

109
AUDIT OPINIONIn our opinion:
1. the fi nancial report of Ridley Corporation Limited:• gives a true and fair view, as required by the Corporations Act 2001 in Australia, of the fi nancial position of Ridley
Corporation Limited and the Ridley Corporation Group (defi ned below) as at 30 June 2006, and of their performance for the year ended on that date; and
• is presented in accordance with the Corporations Act 2001, Accounting Standards and other mandatory fi nancial reporting requirements in Australia, and the Corporations Regulations 2001; and
2. the remunerations disclosures that are contained in the remuneration report comply with Accounting Standard AASB 124 Related Party Disclosures (AASB 124) and the Corporations Regulations 2001.
This opinion must be read in conjunction with the rest of our audit report.
SCOPE THE FINANCIAL REPORT, REMUNERATIONS DISCLOSURES AND DIRECTORS’ RESPONSIBILITYThe fi nancial report comprises the balance sheet, income statements, cash fl ow statements, statements of recognised income and expense, accompanying notes to the fi nancial statements, and the directors’ declaration for both Ridley Corporation Limited (the Company) and the Ridley Corporation Group (the consolidated entity), for the year ended 30 June 2006. The consolidated entity comprises both the Company and the entities it controlled during that year.
The Company has disclosed information about the remuneration of directors and executives (remuneration disclosures) as required by AASB 124, under the heading “remuneration report” in the Annual Report, as permitted by the Corporations Regulations 2001.
The directors of the Company are responsible for the preparation and true and fair presentation of the fi nancial report in accordance with the Corporations Act 2001. This includes responsibility for the maintenance of adequate accounting records and internal controls that are designed to prevent and detect fraud and error, and for the accounting policies and accounting estimates inherent in the fi nancial report. The directors are also responsible for the remuneration disclosures contained in the directors’ report.
AUDIT APPROACHWe conducted an independent audit in order to express an opinion to the members of the Company. Our audit was conducted in accordance with Australian Auditing Standards, in order to provide reasonable assurance as to whether the fi nancial report is free of material misstatement and the remuneration disclosures comply with AASB 124 and the Corporations Regulations 2001. The nature of an audit is infl uenced by factors such as the use of professional judgement, selective testing, the inherent limitations of internal control, and the availability of persuasive rather than conclusive evidence. Therefore, an audit cannot guarantee that all material misstatements have been detected. For further explanation of an audit, visit our website http://www.pwc.com/au/fi nancialstatementaudit.
We performed procedures to assess whether in all material respects the fi nancial report presents fairly, in accordance with the Corporations Act 2001, Accounting Standards and other mandatory fi nancial reporting requirements in Australia, a view which is consistent with our understanding of the Company’s and the consolidated entity’s fi nancial position, and of their performance as represented by the results of their operations, changes in equity and cash fl ows. We also performed procedures to assess whether the remuneration disclosures comply with AASB 124 and the Corporations Regulations 2001.
We formed our audit opinion on the basis of these procedures, which included:• examining, on a test basis, information to provide evidence supporting the amounts and disclosures in the fi nancial report
and remuneration disclosures; and• assessing the appropriateness of the accounting policies and disclosures used and the reasonableness of signifi cant
accounting estimates made by the directors.
Our procedures include reading the other information in the Annual Report to determine whether it contains any material inconsistencies with the fi nancial report.
While we considered the effectiveness of management’s internal controls over fi nancial reporting when determining the nature and extent of our procedures, our audit was not designed to provide assurance on internal controls.
Our audit did not involve an analysis of the prudence of business decisions made by directors or management.
INDEPENDENCEIn conducting our audit, we followed applicable independence requirements of Australian professional ethical pronouncements and the Corporations Act 2001.
S J BOURKEPARTNER
PricewaterhouseCoopers
Sydney21 August 2006
INDE
PEND
ENT A
UDIT
REP
ORT
TO TH
E M
EMBE
RS O
F RI
DLEY
COR
PORA
TION
LIM
ITED

110
HOLDINGS OF SECURITIES – ORDINARY SHARESEach fully paid 8,511 281,763,824 71.33
NUMBER OF NUMBER OF ORDINARY ORDINARY SHAREHOLDERS SHARES
DISTRIBUTION OF HOLDINGS – ORDINARY SHARES1 to 1,000* 1,418 615,1071,001 to 5,000 3,479 10,143,5215,001 to 10,000 1,807 13,030,26910,001 to 100,000 1,719 39,870,447100,001 and over 88 218,104,480
* There are 428 holders of less than a marketable parcel of shares.
NUMBER OF FULLY % OF FULLY PAID ORDINARY PAID ORDINARYNAME OF SHAREHOLDERS SHARES SHARES
TWENTY LARGEST FULLY PAID SHAREHOLDERSNational Nominees Ltd 42,283,136 15.01RBC Dexia Investor Services Aust Nominees (BKCUST A/c) 37,027,171 13.14Westpac Custodian Nominees Ltd 31,419,012 11.15J P Morgan Aust Nominees Ltd 29,688,795 10.54Citicorp Nominees Pty Ltd 21,848,206 7.75Cogent Nominees Pty Ltd 7,335,408 2.60Queensland Investment Corporation 5,071,931 1.80RBC Dexia Investor Services Aust Nominees (PIIC A/c) 3,585,471 1.27Sandhurst Trustees Ltd (SISF A/c) 3,324,549 1.18AMP Life Ltd 3,023,393 1.07RBC Dexia Investor Services Aust Nominees (Pipooled A/c) 2,970,095 1.05Triguboff Management Pty Ltd 2,456,356 0.87Victorian Workcover Authority 1,697,445 0.60Citicorp Nominees P/L (CFSIL Cwlth Shares 18 A/c) 1,640,382 0.58Citicorp Nominees P/L (CFSIL Cwlth Shares 14 A/c) 1,534,000 0.54ANZ Nominees Ltd 1,533,088 0.54Merrill Lynch Aust Nominees (BPB A/c) 1,403,268 0.50Fortis Clearing Nominees (Settlement A/c) 1,092,636 0.39Transport Accident Commission 1,082,265 0.38ANZ Nominees Ltd (Income Reinvestment Plan) 1,047,270 0.37 201,063,877 71.33
SUBSTANTIAL SHAREHOLDERSThe following shareholders are registered by the Company as a substantial shareholder, having declared a relevant interest in accordance with the Corporations Law in the percentage of voting shares shown below:
Investors Mutual Limited 16.58%Perennial Value Management Ltd / IOOF 11.43%Lazard Asset Management 9.05%National Australia Bank 5.28%
% HELD BY NUMBER OF NUMBER OF 20 LARGEST HOLDERS SECURITIES HOLDERS
SHAR
EHOL
DER
INFO
RMAT
ION
AS A
T 21
AUG
UST
2006

111
SHAREHOLDER INFORMATION AS AT 21 AUGUST 2006 (CONTINUED)DIRECTORS’ HOLDINGSOn 21 August 2006, the directors of Ridley Corporation Limited had an interest in the following shares and employee options of the Company.
FULLY PAID RIDLEY RIDLEY INC ORDINARY EMPLOYEE RIDLEY INC EMPLOYEE SHARES OPTIONS SHARES OPTIONS
J S Keniry 577,623 – 800 14,000M P Bickford-Smith 588,316 2,500,000 – –E B Bryan 32,073 – – –R J Lee 69,366 – – –R J Lotze 110,365 – – –A L Vizard 19,158 – – –
VOTING RIGHTSAs at 21 August 2006, the number of holders of fully paid ordinary shares with full voting rights was 8,511. On a show of hands, every person present who is a member or a representative of a member has one vote. On a poll, each shareholder is entitled to one vote for each fully paid share held. A shareholder may appoint a maximum of two proxies to represent them at general meetings.
AUSTRALIAN STOCK EXCHANGEThe ordinary shares of the Company are listed on the Australian Stock Exchange and trade under RIC.
TORONTO STOCK EXCHANGERidley Inc (69% owned by Ridley Corporation Limited) is listed on the Toronto Stock Exchange and trades under RCL.
RIDLEY WEBSITE – WWW.RIDLEY.COM.AUThe website provides access to announcements issued to the Australian Stock Exchange, copies of annual reports, corporate governance information and shareholder information.
SHARE REGISTRYComputershare Investor Services Pty Limited Level 3 60 Carrington Street SYDNEY NSW 2000
All correspondence to: GPO Box 2975 MELBOURNE VIC 3001 AUSTRALIA
Telephone: (within Australia) 1300 85 5080Facsimile: (within Australia) 03 9473 2500
Telephone: (outside Australia) +61 3 9415 4000 Facsimile: (outside Australia) +61 3 9473 2500
Website: www.computershare.com [email protected]

RIDLEY CORPORATION LIMITEDABN 33 006 708 765
CORPORATE OFFICE AND REGISTERED OFFICELevel 10, 12 Castlereagh Street Sydney NSW 2000 Australia Telephone 02 8227 6100 Facsimile 02 8227 6002 Email [email protected]
RIDLEY AGRIPRODUCTS PTY LIMITEDABN 94 006 544 145
HEAD OFFICE70 – 80 Bald Hill Road Pakenham VIC 3810 Australia Telephone 03 5941 1633 Facsimile 03 5941 3459
Chief Executive OfficerA D Murdoch
CHEETHAM SALT LIMITEDABN 81 006 926 487
HEAD OFFICE35 Lowe Street Corio VIC 3214 Australia Telephone 03 5275 8000 Facsimile 03 5274 1213
Chief Executive OfficerJ Murray
RIDLEY INC REGISTERED OFFICE34 Terracon Place Winnipeg Manitoba CANADA R2J4G7 Telephone 1 (204) 956 1717 Facsimile 1 (204) 231 2402
RIDLEY INC OPERATIONS424 North Riverfront Drive Mankato MN 56002-8500 USA Telephone 1 (507) 388 9400 Facsimile 1 (507) 388 9415
President and Chief Executive OfficerS J VanRoekel
CORP
ORAT
E DI
RECT
ORY
112