Rideau Lakes Subwatershed Report 2014 UPPER RIDEAU LAKE ... · settlem en t a rea s in the R idea u...
26
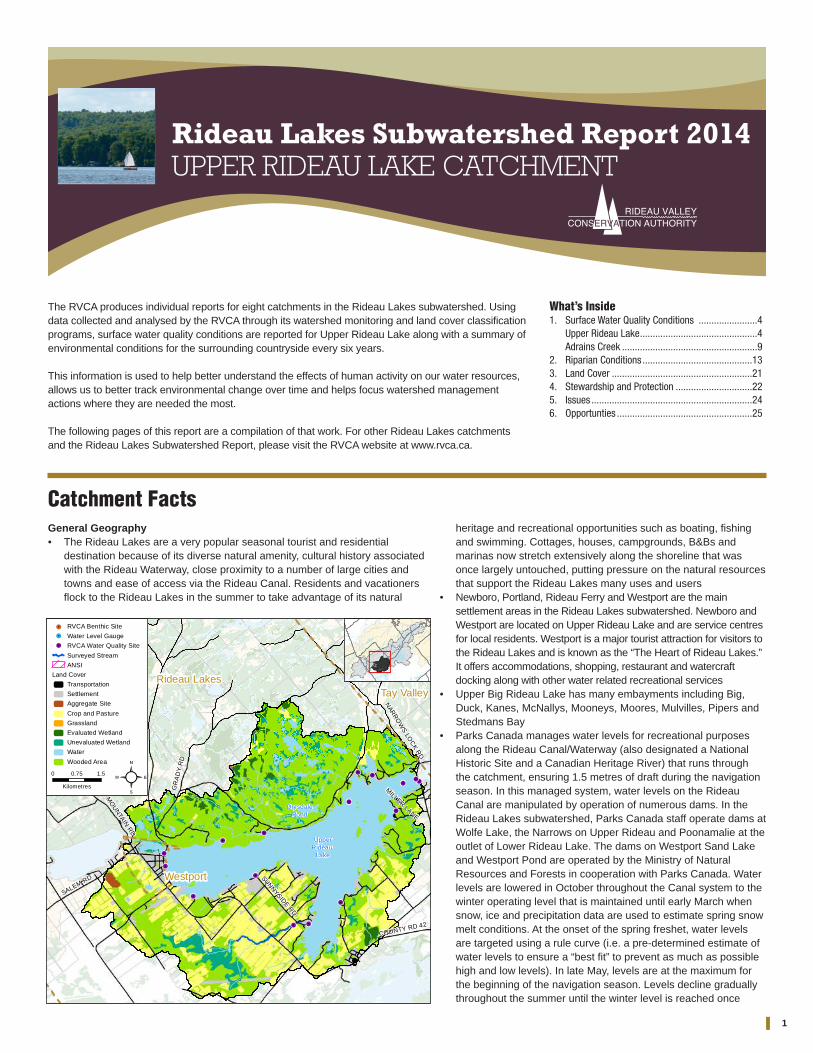
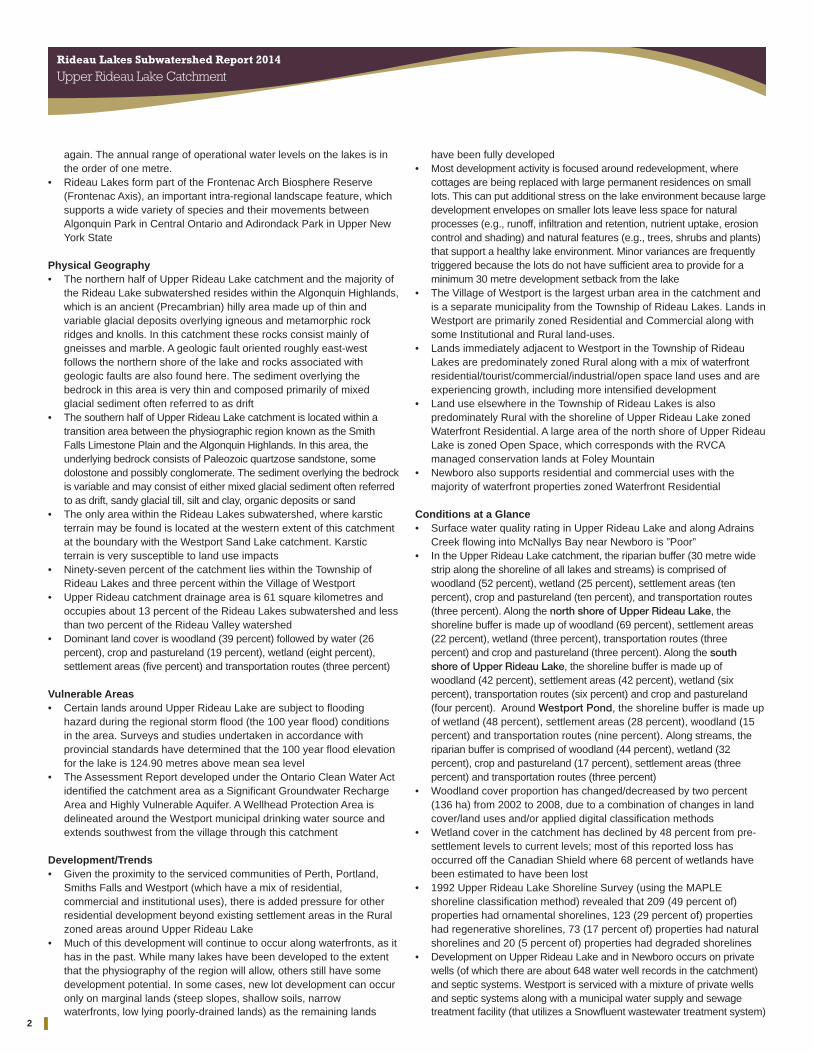
General Geography • The Rideau Lakes are a very popular seasonal tourist and residential destination because of its diverse natural amenity, cultural history associated with the Rideau Waterway, close proximity to a number of large cities and towns and ease of access via the Rideau Canal. Residents and vacationers flock to the Rideau Lakes in the summer to take advantage of its natural Rideau Lakes Subwatershed Report 2014 UPPER RIDEAU LAKE CATCHMENT 1 ! ! . ! ! . ! ! . ! ! . ! ! . ! ! . ! ! . ! ! . ! ! . ! ! . ! ! . ! ! . ! ! . ! ! . ! ! . ! ! . ! ! . ! ! . ! GRADY RD MOUNTAIN RD NARROWS LOCK RD SALEM RD SUNNYSIDE RD COUNTY RD 42 MILLER LANE ! ! . RVCA Benthic Site ! ! . Water Level Gauge ! ! . RVCA Water Quality Site Surveyed Stream ANSI Land Cover Transportation Settlement Aggregate Site Crop and Pasture Grassland Evaluated Wetland Unevaluated Wetland Water Wooded Area 0 1.5 0.75 Kilometres ² Rideau Lakes Tay Valley Westport Upper Rideau Lake Drysdale Pond The RVCA produces individual reports for eight catchments in the Rideau Lakes subwatershed. Using data collected and analysed by the RVCA through its watershed monitoring and land cover classification programs, surface water quality conditions are reported for Upper Rideau Lake along with a summary of environmental conditions for the surrounding countryside every six years. This information is used to help better understand the effects of human activity on our water resources, allows us to better track environmental change over time and helps focus watershed management actions where they are needed the most. The following pages of this report are a compilation of that work. For other Rideau Lakes catchments and the Rideau Lakes Subwatershed Report, please visit the RVCA website at www.rvca.ca. Catchment Facts What’s Inside 1. Surface Water Quality Conditions .......................4 Upper Rideau Lake..............................................4 Adrains Creek .....................................................9 2. Riparian Conditions ...........................................13 3. Land Cover .......................................................21 4. Stewardship and Protection ..............................22 5. Issues ...............................................................24 6. Opportunties .....................................................25 heritage and recreational opportunities such as boating, fishing and swimming. Cottages, houses, campgrounds, B&Bs and marinas now stretch extensively along the shoreline that was once largely untouched, putting pressure on the natural resources that support the Rideau Lakes many uses and users • Newboro, Portland, Rideau Ferry and Westport are the main settlement areas in the Rideau Lakes subwatershed. Newboro and Westport are located on Upper Rideau Lake and are service centres for local residents. Westport is a major tourist attraction for visitors to the Rideau Lakes and is known as the “The Heart of Rideau Lakes.” It offers accommodations, shopping, restaurant and watercraft docking along with other water related recreational services • Upper Big Rideau Lake has many embayments including Big, Duck, Kanes, McNallys, Mooneys, Moores, Mulvilles, Pipers and Stedmans Bay • Parks Canada manages water levels for recreational purposes along the Rideau Canal/Waterway (also designated a National Historic Site and a Canadian Heritage River) that runs through the catchment, ensuring 1.5 metres of draft during the navigation season. In this managed system, water levels on the Rideau Canal are manipulated by operation of numerous dams. In the Rideau Lakes subwatershed, Parks Canada staff operate dams at Wolfe Lake, the Narrows on Upper Rideau and Poonamalie at the outlet of Lower Rideau Lake. The dams on Westport Sand Lake and Westport Pond are operated by the Ministry of Natural Resources and Forests in cooperation with Parks Canada. Water levels are lowered in October throughout the Canal system to the winter operating level that is maintained until early March when snow, ice and precipitation data are used to estimate spring snow melt conditions. At the onset of the spring freshet, water levels are targeted using a rule curve (i.e. a pre-determined estimate of water levels to ensure a “best fit” to prevent as much as possible high and low levels). In late May, levels are at the maximum for the beginning of the navigation season. Levels decline gradually throughout the summer until the winter level is reached once
Transcript of Rideau Lakes Subwatershed Report 2014 UPPER RIDEAU LAKE ... · settlem en t a rea s in the R idea u...
General�Geography• The Rideau Lakes are a very popular seasonal tourist and residential
destination because of its diverse natural amenity, cultural history associatedwith the Rideau Waterway, close proximity to a number of large cities andtowns and ease of access via the Rideau Canal. Residents and vacationersflock to the Rideau Lakes in the summer to take advantage of its natural
Rideau Lakes Subwatershed Report 2014UPPER RIDEAU LAKE CATCHMENT
1
!!. !!.
!!.!!.
!!.!!.
!!.
!!.!!.
!!.!!.!!.
!!.!!. !!.!!.!!.!!.
!
GR
AD
Y R
D
MO
UN
TAIN R
D
NAR
RO
WS
LOC
K RD
SALEM RD SUNNYSIDE RD
COUNTY RD 42
MILLER LANE
!!. RVCA Benthic Site
!!. Water Level Gauge
!!. RVCA Water Quality Site
Surveyed Stream
ANSI
Land Cover
Transportation
Settlement
Aggregate Site
Crop and Pasture
Grassland
Evaluated Wetland
Unevaluated Wetland
Water
Wooded Area
0 1.50.75
Kilometres ²
Rideau LakesTay Valley
Westport
UpperRideau
Lake
DrysdalePond
The RVCA produces individual reports for eight catchments in the Rideau Lakes subwatershed. Usingdata collected and analysed by the RVCA through its watershed monitoring and land cover classificationprograms, surface water quality conditions are reported for Upper Rideau Lake along with a summary ofenvironmental conditions for the surrounding countryside every six years.
This information is used to help better understand the effects of human activity on our water resources,allows us to better track environmental change over time and helps focus watershed managementactions where they are needed the most.
The following pages of this report are a compilation of that work. For other Rideau Lakes catchmentsand the Rideau Lakes Subwatershed Report, please visit the RVCA website at www.rvca.ca.
Catchment Facts
What’s Inside1. Surface Water Quality Conditions .......................4
Upper Rideau Lake..............................................4Adrains Creek .....................................................9
2. Riparian Conditions...........................................133. Land Cover .......................................................214. Stewardship and Protection ..............................225. Issues ...............................................................246. Opportunties .....................................................25
heritage and recreational opportunities such as boating, fishingand swimming. Cottages, houses, campgrounds, B&Bs andmarinas now stretch extensively along the shoreline that wasonce largely untouched, putting pressure on the natural resourcesthat support the Rideau Lakes many uses and users
• Newboro, Portland, Rideau Ferry and Westport are the mainsettlement areas in the Rideau Lakes subwatershed. Newboro andWestport are located on Upper Rideau Lake and are service centresfor local residents. Westport is a major tourist attraction for visitors tothe Rideau Lakes and is known as the “The Heart of Rideau Lakes.”It offers accommodations, shopping, restaurant and watercraftdocking along with other water related recreational services
• Upper Big Rideau Lake has many embayments including Big,Duck, Kanes, McNallys, Mooneys, Moores, Mulvilles, Pipers andStedmans Bay
• Parks Canada manages water levels for recreational purposesalong the Rideau Canal/Waterway (also designated a NationalHistoric Site and a Canadian Heritage River) that runs throughthe catchment, ensuring 1.5 metres of draft during the navigationseason. In this managed system, water levels on the RideauCanal are manipulated by operation of numerous dams. In theRideau Lakes subwatershed, Parks Canada staff operate dams atWolfe Lake, the Narrows on Upper Rideau and Poonamalie at theoutlet of Lower Rideau Lake. The dams on Westport Sand Lakeand Westport Pond are operated by the Ministry of NaturalResources and Forests in cooperation with Parks Canada. Waterlevels are lowered in October throughout the Canal system to thewinter operating level that is maintained until early March whensnow, ice and precipitation data are used to estimate spring snowmelt conditions. At the onset of the spring freshet, water levelsare targeted using a rule curve (i.e. a pre-determined estimate ofwater levels to ensure a “best fit” to prevent as much as possiblehigh and low levels). In late May, levels are at the maximum forthe beginning of the navigation season. Levels decline graduallythroughout the summer until the winter level is reached once
Rideau Lakes Subwatershed Report 2014
Upper Rideau Lake Catchment
2
again. The annual range of operational water levels on the lakes is inthe order of one metre.
• Rideau Lakes form part of the Frontenac Arch Biosphere Reserve(Frontenac Axis), an important intra-regional landscape feature, whichsupports a wide variety of species and their movements betweenAlgonquin Park in Central Ontario and Adirondack Park in Upper NewYork State
Physical�Geography• The northern half of Upper Rideau Lake catchment and the majority of
the Rideau Lake subwatershed resides within the Algonquin Highlands,which is an ancient (Precambrian) hilly area made up of thin andvariable glacial deposits overlying igneous and metamorphic rockridges and knolls. In this catchment these rocks consist mainly ofgneisses and marble. A geologic fault oriented roughly east-westfollows the northern shore of the lake and rocks associated withgeologic faults are also found here. The sediment overlying thebedrock in this area is very thin and composed primarily of mixedglacial sediment often referred to as drift
• The southern half of Upper Rideau Lake catchment is located within atransition area between the physiographic region known as the SmithFalls Limestone Plain and the Algonquin Highlands. In this area, theunderlying bedrock consists of Paleozoic quartzose sandstone, somedolostone and possibly conglomerate. The sediment overlying the bedrockis variable and may consist of either mixed glacial sediment often referredto as drift, sandy glacial till, silt and clay, organic deposits or sand
• The only area within the Rideau Lakes subwatershed, where karsticterrain may be found is located at the western extent of this catchmentat the boundary with the Westport Sand Lake catchment. Karsticterrain is very susceptible to land use impacts
• Ninety-seven percent of the catchment lies within the Township ofRideau Lakes and three percent within the Village of Westport
• Upper Rideau catchment drainage area is 61 square kilometres andoccupies about 13 percent of the Rideau Lakes subwatershed and lessthan two percent of the Rideau Valley watershed
• Dominant land cover is woodland (39 percent) followed by water (26percent), crop and pastureland (19 percent), wetland (eight percent),settlement areas (five percent) and transportation routes (three percent)
Vulnerable�Areas• Certain lands around Upper Rideau Lake are subject to flooding
hazard during the regional storm flood (the 100 year flood) conditionsin the area. Surveys and studies undertaken in accordance withprovincial standards have determined that the 100 year flood elevationfor the lake is 124.90 metres above mean sea level
• The Assessment Report developed under the Ontario Clean�Water�Actidentified the catchment area as a Significant Groundwater RechargeArea and Highly Vulnerable Aquifer. A Wellhead Protection Area isdelineated around the Westport municipal drinking water source andextends southwest from the village through this catchment
Development/Trends• Given the proximity to the serviced communities of Perth, Portland,
Smiths Falls and Westport (which have a mix of residential,commercial and institutional uses), there is added pressure for otherresidential development beyond existing settlement areas in the Ruralzoned areas around Upper Rideau Lake
• Much of this development will continue to occur along waterfronts, as ithas in the past. While many lakes have been developed to the extentthat the physiography of the region will allow, others still have somedevelopment potential. In some cases, new lot development can occuronly on marginal lands (steep slopes, shallow soils, narrowwaterfronts, low lying poorly-drained lands) as the remaining lands
have been fully developed• Most development activity is focused around redevelopment, where
cottages are being replaced with large permanent residences on smalllots. This can put additional stress on the lake environment because largedevelopment envelopes on smaller lots leave less space for naturalprocesses (e.g., runoff, infiltration and retention, nutrient uptake, erosioncontrol and shading) and natural features (e.g., trees, shrubs and plants)that support a healthy lake environment. Minor variances are frequentlytriggered because the lots do not have sufficient area to provide for aminimum 30 metre development setback from the lake
• The Village of Westport is the largest urban area in the catchment andis a separate municipality from the Township of Rideau Lakes. Lands inWestport are primarily zoned Residential and Commercial along withsome Institutional and Rural land-uses.
• Lands immediately adjacent to Westport in the Township of RideauLakes are predominately zoned Rural along with a mix of waterfrontresidential/tourist/commercial/industrial/open space land uses and areexperiencing growth, including more intensified development
• Land use elsewhere in the Township of Rideau Lakes is alsopredominately Rural with the shoreline of Upper Rideau Lake zonedWaterfront Residential. A large area of the north shore of Upper RideauLake is zoned Open Space, which corresponds with the RVCAmanaged conservation lands at Foley Mountain
• Newboro also supports residential and commercial uses with themajority of waterfront properties zoned Waterfront Residential
Conditions�at�a�Glance• Surface water quality rating in Upper Rideau Lake and along Adrains
Creek flowing into McNallys Bay near Newboro is ”Poor” • In the Upper Rideau Lake catchment, the riparian buffer (30 metre wide
strip along the shoreline of all lakes and streams) is comprised ofwoodland (52 percent), wetland (25 percent), settlement areas (tenpercent), crop and pastureland (ten percent), and transportation routes(three percent). Along the north shore of Upper Rideau Lake, theshoreline buffer is made up of woodland (69 percent), settlement areas(22 percent), wetland (three percent), transportation routes (threepercent) and crop and pastureland (three percent). Along the southshore of Upper Rideau Lake, the shoreline buffer is made up ofwoodland (42 percent), settlement areas (42 percent), wetland (sixpercent), transportation routes (six percent) and crop and pastureland(four percent). Around Westport Pond, the shoreline buffer is made upof wetland (48 percent), settlement areas (28 percent), woodland (15percent) and transportation routes (nine percent). Along streams, theriparian buffer is comprised of woodland (44 percent), wetland (32percent), crop and pastureland (17 percent), settlement areas (threepercent) and transportation routes (three percent)
• Woodland cover proportion has changed/decreased by two percent(136 ha) from 2002 to 2008, due to a combination of changes in landcover/land uses and/or applied digital classification methods
• Wetland cover in the catchment has declined by 48 percent from pre-settlement levels to current levels; most of this reported loss hasoccurred off the Canadian Shield where 68 percent of wetlands havebeen estimated to have been lost
• 1992 Upper Rideau Lake Shoreline Survey (using the MAPLEshoreline classification method) revealed that 209 (49 percent of)properties had ornamental shorelines, 123 (29 percent of) propertieshad regenerative shorelines, 73 (17 percent of) properties had naturalshorelines and 20 (5 percent of) properties had degraded shorelines
• Development on Upper Rideau Lake and in Newboro occurs on privatewells (of which there are about 648 water well records in the catchment)and septic systems. Westport is serviced with a mixture of private wellsand septic systems along with a municipal water supply and sewagetreatment facility (that utilizes a Snowfluent wastewater treatment system)
Rideau Lakes Subwatershed Report 2014
Upper Rideau Lake Catchment
3
• The only remaining Rideau Lakes stocking takes place on WestportSand Lake where walleye is stocked annually by the Westport AreaOutdoors Association
• Commercial fishery quotas and conditions for the last several years onUpper, Big and Lower Rideau Lakes have remained the same with oneexception on Upper Rideau where MNR has increased the yellow perchquota based on the 2013 assessment. MNR fisheries researchspecialists confirm that inland commercial fishery quotas on the RideauLakes are sustainable
Catchment�Care• Since 2000, RVCA monitors Upper Rideau Lake surface water quality
through its Watershed Watch Program. In 2006, the program was alteredto gain consistent, year to year data for the set of lakes being monitored.In response to the 2009 Rideau Lakes Watershed Plan action to “Developa more intensive and coordinated water quality monitoring program for theRideau Lakes,” RVCA monitors surface water quality four times of the yearat two deep point sites and twice a year at 11 sites on Upper Rideau Lake.Three of the shoreline sites are monitored every year while the other eightsites are monitored every fifth year
• RVCA has been providing septic system re-inspection at the request ofthe Township of Rideau Lakes since 2007
• Township of Rideau Lakes septic system voluntary re-inspections wereundertaken on 63 Upper Rideau Lake properties in the catchment by theMississippi Rideau Septic System Office. Remedial/maintenance workwas advocated for 28 of those properties, septic system replacements atanother three properties with more information supplied to two otherlandowners with identified septic system concerns
• Thirty-one stewardship projects have been completed through RVCA’sPrivate Land Forestry, Rural Clean Water, Shoreline Naturalization andOntario Drinking Water Stewardship Programs (see Section 4 of thisreport for details)
• RVCA completed littoral zone mapping around Upper Rideau Lake in2013, identifying substrate type, vegetation and habitat features alongwith opportunities for shoreline enhancements
• Upper Rideau Lake Association was founded in 1989 and is committed toprotecting and improving the lake environment to ensure that it is safe forswimming, boating and fishing and that it is a healthy habitat for fish andother wildlife. Its mission is to promote a quality of social and ecologicalenvironment for property owners, residents and users within the UpperRideau Lake and environs by identifying and facilitating the resolution ofissues and undertaking initiatives for the common good. Areas ofemphasis are water quality and use, lakeshore property, advocacy, liaisonand public awareness (visit Upper Rideau Lake Association formore information)
• Upper Rideau Lake Association has been actively promoting shorelinenaturalization for 25 years through their annual native plant giveawaysto the lake community. Initially working with MAPLE, who providedURLA with thousands of plants, URLA now works with RVCA’sShoreline Naturalization Program to distribute native trees and shrubseach spring. Since 2010, they have handed out 3,450 native plantseedlings free of charge to the lake residents
• Three Permits to Take Water (PTTW) have been issued for themunicipal drinking water supply wells in Westport, for a wetlandconservation project and for golf course irrigation and water supply
• A watershed model developed by the RVCA in 2009 was used to studythe hydrologic function of wetlands in the Rideau Valley watershed,including those found in the Upper Rideau Lake catchment
• RVCA provides flood forecasting and warning services throughout theRideau Valley watershed. In the Upper Rideau subwatershed, onlygeneral flooding information has been made available historically for thelakes area. In 2014, lake levels were higher than most years and more
attention was required from RVCA and municipal staff, resulting in thedecision to review what the flood forecasting and warning programprovides to the Upper Rideau Valley
• The Village of Westport and Rideau Lakes Township have land useplanning policies and zoning provisions (on lake capacity, watersetbacks, frontage and naturalized shorelines and wetland protection)and use site plan control to implement these policies and provisions.Together with RVCA and Parks Canada, they work with landowners ona case by case basis to achieve net environmental gains (particularlywith respect to shoreline vegetation protection and rehabilitation)through the use of shoreline best management practices. Collectively,the Village and Township and the agencies request conditions onplanning approvals to ensure that development and redevelopment isappropriate for the property, impacts on neighbours are minimized(particularly on very small lots) and development setbacks for theshoreline are maximized.
• Development in and adjacent to Provincially Significant Wetlands andsome locally significant wetlands is subject to Ontario Regulation174-06 (entitled “Development, Interference with Wetlands andAlterations to Shorelines and Watercourses”) that protects thehydrologic function of the wetland and also protects landowners andtheir property from natural hazards (flooding, fluctuating water table,unstable soils) associated with them
• Rideau�Lakes�Basin�Carrying�Capacity�Study� (1992) evaluated thecapacity of the Rideau Lakes to support development with respect tolake trophic state (level of phosphorus and chlorophyll a) and shorelinedevelopment. Results have been used to provide land-use planningpolicy direction and guidance (in the form of a site evaluation guideline)to the municipalities of Rideau Lakes and the Village of Westport andthe Conservation Authority. Using phosphorus as the determinant forlake capacity, the study attempted to identify how much developmentwas permissible to retain the “no net loss” in water quality principle (i.e.,no net increase in phosphorus loading). Recommendations from itincluded the need to set water quality targets for each lake of concern,requiring buildings to be set no closer than 30 metres from water (withgreater widths being recommended in areas with poor phosphorusretention based on soil type, slope and geological conditions),minimizing disturbance to shoreline vegetation and no alteration to thesoil mantle within the protective setback area. An update to theabovementioned site evaluation guide is currently underway and is tobe made available in 2015
• Parks Canada attempts to incorporate the breeding and habitat needsof fish and wildlife when determining water levels, flows and timing ofdrawdowns in the Rideau Lakes. For more information, please refer tothe “Operating Rule Curve” for Upper Rideau Lake available (atwww.rvca.ca) in the 2014 Rideau�Lakes�Subwatershed�Report sectionon “Water Levels”
• Rideau�Canal�National�Historic�Site�of�Canada�Management�Plan(2005) update establishes the long term strategic direction for themanagement of the Rideau Canal
• Rideau�Canal�World�Heritage�Site�Management�Plan� (2005) specifieshow its world heritage values will be protected for present and futuregenerations
• Rideau�Lake�State�of�the�Lake�Report prepared by the Centre forSustainable Watersheds in 2002
• Much of the shoreline of Upper Rideau Lake is held in private ownership,so that the best opportunity for shoreline restoration/enhancement restswith private landowners. RVCA offers its Shoreline NaturalizationProgram to Rideau Lakes landowners to assist with shoreline re-vegetation (an enhanced delivery program has been put into place inresponse to the 2009�Rideau�Lakes�Watershed�Plan action to “Increasefunding for the RVCA Shoreline Naturalization Program”)

Rideau Lakes Subwatershed Report 2014
Upper Rideau Lake Catchment
4
Rating Index ScoreVery good (Excellent) 95-100
Good 80-94Fair 65-79
Poor (Marginal) 45-64Very poor (Poor) 0-44
Table 1Water Quality Index Ratings for Upper Rideau catchment
Table 2 WQI Ratings and corresponding index scores (RVCA terminology, original WQIcategory names in brackets)
Sampling Site Location 2002-2007 Rating
RVL-37 Upper Rideau Lake (2 deep water sites) NA NA
ADR-01 Adrains Creek at Sunnyside Rd 63 Poor
Sampling Site Location 2008-2013 RatingRVL-37 Upper Rideau Lake (2 deep water sites) 53 Poor
ADR-01 Adrains Creek at Sunnyside Rd 60 Poor
1. Surface Water Quality Conditions
Surface water quality conditions in the Upper Rideau catchment aremonitored by the Rideau Valley Conservation Authority’s (RVCA)Watershed Watch Program and Baseline Water Quality MonitoringProgram. Watershed Watch monitors watershed lakes to assess nutrientconcentrations, water clarity, dissolved oxygen availability and pH. Thebaseline water quality program focuses on streams; data is collected for22 parameters including nutrients (total phosphorus, total Kjeldahlnitrogen and ammonia), E.�coli, metals (like aluminum and copper) andadditional chemical/physical parameters (such as alkalinity, chlorides, pHand total suspended solids). The locations of monitoring sites are shownin Figure 1 and Table 1.
!( !(
!(!(
!(
!(
!(
!(
!(
!(
!(!(
!(!(
ADR-01
03 01 13
05
1009
0602
1104
12
DP1
DP3GR
AD
Y R
D
PE
RT
H R
D N
NA
RR
OW
S LOC
K R
D
MCCANN RD
CA
RL
ET
ON
ST
SUNNYSIDE RDPERTH RD
COUNTY RD 42
UPPER RID
EAU DR
COUNTY RD 420 1.50.75
Kilometres ²!( RVCA Watershed Watch Sites!( RVCA Baseline Sites
Figure 1 Water quality monitoring sites on Adrains Creek and Upper Rideau Lake in theUpper Rideau Lake catchment
The water quality rating for the Upper Rideau catchment is “Poor” (Table 1)as determined by the Canadian Council of Ministers of the Environment(CCME) Water Quality Index. Each parameter is evaluated againstestablished guidelines to determine water quality conditions. Thoseparameters that frequently exceed guidelines are presented below. Thereis limited data available for Upper Rideau Lake prior to 2005; therefore,only the 2008-2013 data is considered in this report. Analysis of the datahas been broken into two periods, 2002 to 2007 and 2008 to 2013, for thestream monitoring site located on Adrains Creek (ADR-01) to examine ifconditions have changed between these periods. Table 1 shows theoverall rating for the monitored surface water quality sites within the UpperRideau catchment and Table 2 outlines the Water Quality Index (WQI)scores and their corresponding ratings.
1) a. Upper Rideau Lake Water Quality
Surface water quality conditions in Upper Rideau Lake have beenmonitored by RVCA’s Watershed Watch Program since 2005. Data fromtwo deep point sites has been used to calculate the WQI rating for UpperRideau Lake, which was determined to be “Poor” (Table 1). Elevatednutrient concentrations, periods of reduced oxygen availability, clear waterand occasionally elevated pH levels contributed to the rating. Thefollowing discussion explains how each of the monitored water qualityparameters contributes to the lake’s water quality.
This report also considers data from 11 additional shoreline sites that areregularly monitored around the lake. These sites have not been includedin the calculation of the CCME WQI rating, as they are not monitored withthe same frequency as deep point sites. However, they do provideimportant information on water quality conditions in the near shore areas.For locations of shoreline sites please see Figure 1.
Previous reports have noted that persistently high nutrient concentrationsare a concern in Upper Rideau Lake1 which has enabled aquatic plantsand algae blooms to flourish. The data presented in this report indicatesthat this continues to be the case and that a proactive program of bestmanagement practices around the lake’s drainage area is critical to ensurethe protection of the lake environment.
1 Rideau Valley Conservation Authority (2009) Rideau Lakes Watershed Plan, Priorities and Recommendations, Manotick, Ontario. (Rideau Lakes Watershed Plan); UpperRideau Lake Association (2010), Water Quality Reports, 2010 Report and Upper Rideau Lake Association (2007) Water Quality Reports, 2006/2007 Report; Rideau ValleyConservation Authority (2006) , State of the Lake Environment Report, Upper Rideau Lake 2005, Manotick, Ontario, (State of the Upper Rideau Lake Report)
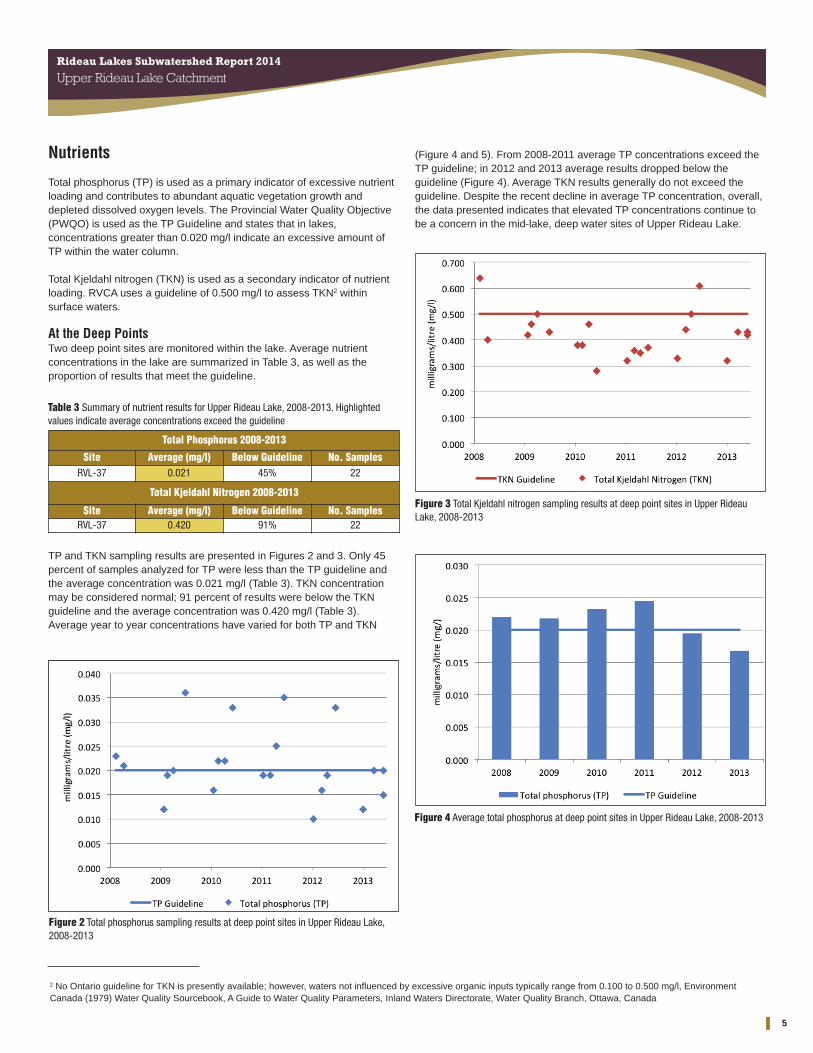
Nutrients
Total phosphorus (TP) is used as a primary indicator of excessive nutrientloading and contributes to abundant aquatic vegetation growth anddepleted dissolved oxygen levels. The Provincial Water Quality Objective(PWQO) is used as the TP Guideline and states that in lakes,concentrations greater than 0.020 mg/l indicate an excessive amount ofTP within the water column.
Total Kjeldahl nitrogen (TKN) is used as a secondary indicator of nutrientloading. RVCA uses a guideline of 0.500 mg/l to assess TKN2 withinsurface waters.
At the Deep PointsTwo deep point sites are monitored within the lake. Average nutrientconcentrations in the lake are summarized in Table 3, as well as theproportion of results that meet the guideline.
TP and TKN sampling results are presented in Figures 2 and 3. Only 45percent of samples analyzed for TP were less than the TP guideline andthe average concentration was 0.021 mg/l (Table 3). TKN concentrationmay be considered normal; 91 percent of results were below the TKNguideline and the average concentration was 0.420 mg/l (Table 3).Average year to year concentrations have varied for both TP and TKN
Rideau Lakes Subwatershed Report 2014
Upper Rideau Lake Catchment
5
Total Phosphorus 2008-2013
Site Average (mg/l) Below Guideline No. SamplesRVL-37 0.021 45% 22
Total Kjeldahl Nitrogen 2008-2013
Site Average (mg/l) Below Guideline No. SamplesRVL-37 0.420 91% 22
Table 3 Summary of nutrient results for Upper Rideau Lake, 2008-2013. Highlightedvalues indicate average concentrations exceed the guideline
2 No Ontario guideline for TKN is presently available; however, waters not influenced by excessive organic inputs typically range from 0.100 to 0.500 mg/l, EnvironmentCanada (1979)Water�Quality�Sourcebook,�A�Guide�to�Water�Quality�Parameters,�Inland Waters Directorate, Water Quality Branch, Ottawa, Canada
Figure 2 Total phosphorus sampling results at deep point sites in Upper Rideau Lake,2008-2013
Figure 3 Total Kjeldahl nitrogen sampling results at deep point sites in Upper RideauLake, 2008-2013
Figure 4 Average total phosphorus at deep point sites in Upper Rideau Lake, 2008-2013
(Figure 4 and 5). From 2008-2011 average TP concentrations exceed theTP guideline; in 2012 and 2013 average results dropped below theguideline (Figure 4). Average TKN results generally do not exceed theguideline. Despite the recent decline in average TP concentration, overall,the data presented indicates that elevated TP concentrations continue tobe a concern in the mid-lake, deep water sites of Upper Rideau Lake.

Around the Lake The average nutrient concentrations at monitored sites around the lakevary from year to year (Figures 6 and 7). Please note that sites 3, 6, and 9are monitored each year while other sites are monitored every fifth year.
Total phosphorous concentrations were above the TP guideline at themajority of sites with the exception of sites 5 and 10; all other sites haveexceeded the guideline in more than one year (Figure 6). Site 6 is the onlysite that consistently exceeds the TP guideline. This site is located at theoutflow of a drainage ditch through a developed portion of the Village ofWestport. Action should be taken to determine what could be done to limitthe impact of nutrient loadings at this site. Sites 3 and 9 reported fewerexceedances, even though concentrations are often high. These sites arelargely located in more natural areas of the lake, but should be furtherinvestigated to determine the underlying, influencing factors. Additionally,the impacts of increased shoreline development, boat traffic and highlevels of recreational use in shallow areas contribute to increased loadingthrough runoff and re-suspension of sediment, which may be contributingto higher TP concentrations.
Rideau Lakes Subwatershed Report 2014
Upper Rideau Lake Catchment
6
Figure 6 Average total phosphorus concentration at shoreline monitoring sites onUpper Rideau Lake, 2008-2013
SummaryWithin Upper Rideau Lake, nutrient concentrations, particularly TPconcentrations, generally do not meet guidelines. TP concentrations arecomparable to the 2005�Upper�Rideau�Lake�State�of�the�Lake�Report(Rideau Valley Conservation Authority, 2006), which noted that themajority of TP results exceeded the PWQO and also that the lake has hadhigh concentrations of nutrients for many years. In 2014 a blue-greenalgae bloom was reported and confirmed in Upper Rideau Lake. While thisoccurrence is outside the data reporting range of this report, it highlightsthe vulnerability of the lake to water quality impairment.
Sites with particularly high results should be further investigated todetermine if sources of nutrient inputs can be reduced through thediversion of runoff and enhanced shoreline buffers. Areas where highconcentrations of nutrients are persistent may exhibit excessive aquaticplant growth, algae blooms and depleted oxygen concentrations.Nutrientexceedances may be partially attributed to the natural aging of a lake andits basin characteristics; the lake is shallow and comprised of areascontaining drowned lands (resulting from the construction of the RideauCanal), which have rich organic soils that hold high levels of phosphorus.
Aging of the lake can be slowed with the help of all catchment residents byreducing nutrient inputs through practices such as proper maintenance ofseptic systems, keeping shorelines natural and using phosphate freesoaps and detergents.
Water ClarityWater clarity is measured using a Secchi disk during each deep pointsample. Table 4 summarizes the recorded depths and shows that allreadings have exceeded the minimum PWQO of two metres, indicatinggood water quality with an average Secchi depth of 4.3 metres. Figure 8shows that no individual reading has been below the guideline andmeasured depths range from 2.5 metres to 7.5 metres. It should also be
Figure 5 Average total Kjeldahl nitrogen at deep point sites in Upper Rideau Lake, 2008-2013
TKN concentrations were below the guideline at the majority of shorelinesites with the exception of site 6. These results provide further evidencethat nutrient loading through the drainage ditch is a problem, which mayresult in abundant plant or algal growth and low oxygen levels, particularlyas both TP and TKN are persistently elevated at this site on the lake.
Figure 7 Average total Kjeldahl nitrogen concentration at shoreline monitoring sites onUpper Rideau Lake, 2008-2013

SummaryThis data indicates that waters are clear and adequate sunlight is able topenetrate the water column to support aquatic life and provide sufficientvisibility for safe recreational use (i.e. boating, swimming).
Fish HabitatTwo other factors, dissolved oxygen/temperature and pH were alsoassessed to provide an overall sense of the health of Upper Rideau Lakefrom a fish habitat perspective.
Dissolved Oxygen and TemperatureThe red bars in Figures 9 and 10 show the depths where suitableconditions exist for warm water fish species (temperature less than 25°Cand dissolved oxygen greater than 4 mg/l) at the two monitored deeppoints. The vertical axis represents the total lake depth at each site wherethe profile is taken. Suitable oxygen temperatures exist over an averagedepth of 10 metres at site RVL-37-DP1 (Figure 9) and 14 metres at siteRVL-37DP3 (Figure 10).
pHpH is a basic water quality parameter used to assess the acidity of water, animportant factor for aquatic life. Figure 11 shows pH concentrations in UpperRideau Lake and Figure 12 summarizes average concentrations by year.
Rideau Lakes Subwatershed Report 2014
Upper Rideau Lake Catchment
7
Secchi depth 2008-2013
Site Average (m) Above Guideline No. Samples
RVL-37 4.3 100% 20
Figure 8 Recorded Secchi depths at deep point sites in Upper Rideau Lake, 2008-2013
Figure 9 Depths suitable for warm water fish species at site RVL-37DP1 in Upper RideauLake, 2008-2013
Figure 10 Depths suitable for warm water fish species at site RVL-37DP3 in UpperRideau Lake, 2008-2013
Table 4 Summary of Secchi depths recorded at deep points in Upper Rideau Lake,2008-2013
noted that Secchi depths in many waterbodies such as Upper Rideau lakehave been influenced by the colonization of zebra mussels, resulting inclearer waters than prior to the introduction of this invasive species.

SummaryOverall the water chemistry data at the deep points describes good habitatconditions for warm water fish species such as pickerel, bass and pike.There is some evidence that the warming of the water column and oxygendepletion in the summer months limits the amount of habitat available andcauses stress to some aquatic communities. pH conditions are typicallywithin the range recommended for the protection of aquatic life, indicatinga healthy environment for aquatic species.
E. coliE.�coli�is sampled at monitored shoreline sites twice each samplingseason. E.�coli data was not used in the calculation of the WQI rating forthe lake due to differences in sampling frequency and site locations. Allsamples were below the E.�coli�guideline of 100 colony forming units(CFU) per 100 ml set by the PWQO. Across the lake the count at thegeometric mean3 was only 4 CFU/100ml (Table 6). Figure 13 shows thatsamples across all sites were well below the guideline.
Rideau Lakes Subwatershed Report 2014
Upper Rideau Lake Catchment
8
Seventy-one percent of samples (Table 5) were within guidelinesestablished by the PWQO which state that pH should be between 6.5 and8.5 to protect aquatic life and prevent irritation for anyone using the watersfor recreational purposes.
pH 2008–2013
Site Average % that meet guideline No. Samples
RVL-37 7.97 71% 17
Table 5 Summary of pH results at the deep points in Upper Rideau Lake, 2008-2013
E. coli 2008–2013
SiteGeometric mean
(CFU/100ml)Below Guideline No. Samples
RVL-37 4 100% 42
Table 6 Summary of E. coli results for Upper Rideau Lake, 2008-2013
Figure 13 Geometric mean of shoreline sites monitored on Upper Rideau Lake, 2008-2013
Figure 11 pH concentrations at the deep points in Upper Rideau Lake, 2008-2013
Figure 12 Average pH concentrations at the deep points in Upper Rideau Lake, 2008-2013
In some areas of the Rideau Lakes subwatershed, surface waters tend tobe a bit more alkaline (higher pH) which can generally be attributed togeology rather than anthropogenic activities; biological activities such asphotosynthesis may also affect pH.
SummaryThe results presented above provide evidence that bacterial contaminationis not a significant concern in Upper Rideau Lake and the water should besafe for recreational use such as swimming and boating.
3 A type of mean or average, which indicates the central tendency or typical value of a set of numbers by using the product of their values (as opposed to the arithmetic meanwhich uses their sum). It is often used to summarize a variable that varies over several orders of magnitude, such as E.�coli�counts

Rideau Lakes Subwatershed Report 2014
Upper Rideau Lake Catchment
9
1) b. Adrains Creek Water Quality There is one stream site on Adrains Creek monitored in the Upper Rideaucatchment (ADR-01, Figure 1). Analysis of the data has been broken intotwo periods, 2002-2007 and 2008-2013, to examine if conditions havechanged within this timeframe. Water quality at this site is reported as “Poor”(Table 1). The score at this site is largely influenced by high nutrientconcentrations, metals and high bacterial counts. For more information onthe CCME WQI, please see the Rideau�Lakes�Subwatershed�Report�2014.
NutrientsTotal phosphorus (TP) is used as a primary indicator of excessive nutrientloading and may contribute to abundant aquatic vegetation growth anddepleted dissolved oxygen levels. The Provincial Water Quality Objective(PWQO) is used as the TP Guideline and states that in streamsconcentrations greater than 0.030 mg/l indicate an excessive amount of TP.
Total Kjeldahl nitrogen (TKN) and ammonia (NH3) are used as secondaryindicators of nutrient loadings. RVCA uses a guideline of 0.500 mg/l toassess TKN4 and the PWQO of 0.020 mg/l to assess ammoniaconcentrations at the monitored site.
Tables 7, 8 and 9 summarize average nutrient concentrations at monitoredsites within the Upper Rideau Lake catchment and show the proportion ofresults that meet the guidelines.
Total Phosphorus 2002–2007
Site Average (mg/l) Below Guideline No. Samples
ADR-01 0.111 7% 29
Total Phosphorus 2008-2013
Site Average (mg/l) Below Guideline No. Samples
ADR-01 0.146 3% 35
Table 7 Summary of total phosphorus results for Adrains Creek in the Upper Rideaucatchment, 2002-2007 and 2008-2013 . Highlighted values indicate averageconcentrations exceed the guideline
Total Kjeldahl Nitrogen 2002–2007
Site Average (mg/l) Below Guideline No. Samples
ADR-01 1.051 0% 29
Total Kjeldahl Nitrogen 2008-2013
Site Average (mg/l) Below Guideline No. Samples
ADR-01 1.355 3% 35
Table 8 Summary of total Kjeldahl nitrogen results for Adrains Creek in the Upper Rideaucatchment from 2002-2007 and 2008-2013. Highlighted values indicate averageconcentrations exceed the guideline
Figure 15 Total phosphorus concentrations in Adrains Creek, 2008-2013
The majority of samples at ADR-01 exceeded the TP guideline; onlyseven percent of samples were below the guideline in the 2002-2007period (Figure 14). This declined to only three percent of samples in the2008-2013 period (Figure 15). The average TP concentration increasedfrom 0.111 mg/l (2002-2007) to 0.146 mg/l (2008-2013).
Ammonia 2002–2007
Site Average (mg/l) Below Guideline No. Samples
ADR-01 0.014 83% 29
Ammonia 2008-2013
Site Average (mg/l) Below Guideline No. Samples
ADR-01 0.023 74% 35
Table 9 Summary of ammonia results for Adrains Creek in the Upper Rideau catchmentfrom 2002-2007 and 2008-2013. Highlighted values indicate average concentrationsexceed the guideline
Figure 14 Total phosphorus concentrations in Adrains Creek, 2002-2007
TKN results show that the bulk of results exceeded the guideline (Figures16 and 17). There were no samples below the guideline in the 2002-2007period; this improved marginally to only three percent in the 2008-2013period. The TKN average concentration was generally elevated andincreased from 1.051 mg/l to 1.355 mg/l.
4 No Ontario guideline for TKN is presently available; however, waters not influenced by excessive organic inputs typically range from 0.100 to 0.500 mg/l, EnvironmentCanada (1979)Water�Quality�Sourcebook,�A�Guide�to�Water�Quality�Parameters,�Inland Waters Directorate, Water Quality Branch, Ottawa, Canada

Rideau Lakes Subwatershed Report 2014
Upper Rideau Lake Catchment
10
Figure 17 Total Kjeldahl nitrogen concentrations in Adrains Creek, 2008-2013
Figure 18 Ammonia concentrations in Adrains Creek, 2002-2007
The trend of elevated nutrients is also observed in NH3 data, as results atthis site were generally above the guideline of 0.020 mg/l (Figures 18 and19). The proportion of samples below the guideline declined from 83 percentto 74 percent. As observed with TP and TKN results, this was accompaniedby an increase in the average concentration from 0.014 mg/l (2002-2007) to0.023 mg/l (2008-2013).
SummaryThe data shows that nutrient enrichment continues to be a concern inAdrains Creek. This creek was previously identified as having high TPconcentrations (Rideau�Lakes�Watershed�Plan, 2009) and elevatedconcentrations across all nutrient parameters, which continues to beobserved. Elevated nutrients may result in nutrient loading to McNallysBay on Upper Rideau Lake. High nutrient concentrations can helpstimulate the growth of algae blooms and other aquatic vegetation in awaterbody, and deplete oxygen levels as the vegetation dies off. Giventhese particularly high results, this site should be further investigated todetermine if sources of nutrient inputs can be reduced to improve waterquality or if natural sources contribute to high background concentrations.Possible strategies to reduce nutrient inputs could include divertingsurface water runoff away from Adrains Creek and enhancing the riparianbuffer along it.
E. coliE.�coli�is used as an indicator of bacterial pollution from human or animalwaste; in elevated concentrations it can pose a risk to human health. ThePWQO of 100 colony forming units/100 milliliters (CFU/100 ml) is used toassess E.�coli. Counts greater than this guideline indicate that bacterialcontamination may be a problem within a watercourse.
Table 10 summarizes the geometric mean5 for the monitored site onAdrains Creek and shows the proportion of samples that meet the E.�coliguideline of 100 CFU/100 ml. The geometric mean with respect to theguideline for the two periods (2002-2007 and 2008-2013) is shown inFigures 20 and 21 respectively.
SummaryThe results indicate that bacterial contamination is a concern in AdrainsCreek. Approximately half of sampled counts exceed the PWQO, and thecount at the geometric mean has increased above the PWQO guideline.
Figure 19 Ammonia concentrations in Adrains Creek, 2008-2013
Figure 16 Total Kjeldahl nitrogen concentrations in Adrains Creek, 2002-2007
5 A type of mean or average, which indicates the central tendency or typical value of a set of numbers by using the product of their values (as opposed to the arithmetic meanwhich uses their sum). It is often used to summarize a variable that varies over several orders of magnitude, such as E.�coli�counts

Rideau Lakes Subwatershed Report 2014
Upper Rideau Lake Catchment
11
Figure 20 E. coli counts in Adrains Creek, 2002-2007
Figure 21 E. coli counts in Adrains Creek, 2008-2013
Figure 22 Average aluminum concentrations in Adrains Creek, 2002-2007
E. coli 2002-2007
SiteGeometric mean
(CFU/100ml)Below Guideline No. Samples
ADR-01 91 45% 29
E. coli 2008-2013
SiteGeometric mean
(CFU/100ml)Below Guideline No. Samples
ADR-01 121 51% 35
Table 10 Summary of E. coli results for Adrains Creek, 2002-2007 and 2008-2013.Highlighted values indicate average concentrations exceed the guideline
Aluminum 2002-2007
Site Average (mg/l) Below Guideline No. Samples
ADR-01 0.299 35% 23
Aluminum 2008-2013
Site Average (mg/l) Below Guideline No. Samples
ADR-01 0.441 43% 14
Table 11 Summary of aluminum results for Adrains Creek in the Upper Rideaucatchment, 2002-2007 and 2008-2013. Highlighted values indicate averageconcentrations exceed the guideline
Iron 2002-2007
Site Average (mg/l) Below Guideline No. Samples
ADR-01 0.897 22% 23
Iron 2008-2013
Site Average (mg/l) Below Guideline No. Samples
ADR-01 1.266 15% 13
Table 12 Summary of iron results for Adrains Creek in the Upper Rideau catchment,2002-2007 and 2008-2013. Highlighted values indicate average concentrations exceedthe guideline
MetalsOf the metals routinely monitored in Adrains Creek, aluminum (Al) and iron (Fe)frequently reported concentrations above their respective PWQOs. In elevatedconcentrations, these metals can have toxic effects on sensitive aquaticspecies. Tables 11 and 12 summarize metal concentrations at the monitoredsite and show the proportion of samples that meet guidelines. Figures 22 to 25show metal concentrations with respect to the guidelines for the two periods ofinterest, 2002–2007 and 2008–2013. For Al, the PWQO is 0.075 mg/l and forFe it is 0.300 mg/l.
Results from ADR-01 shows that Al concentrations were typically elevated; 35 percent of samples were below the guideline in the 2002-2007 period (Figure22). This improved to 43 percent of samples in the 2008-2013 period (Figure23). However, the average Al concentration continues to exceed the guidelineand increased from 0.299 mg/l (2002-2007) to 0.441 mg/l (2008-2013).

Rideau Lakes Subwatershed Report 2014
Upper Rideau Lake Catchment
12
Figure 23 Average aluminum concentrations in Adrains Creek, 2008-2013
Iron concentrations also exceeded guidelines. The proportion of samplesbelow the guideline declined from 22 percent to 15 percent (Figures 24and 25); similarly, the average concentration exceeded the guideline andincreased from 0.897 mg/l (2002-2007) to 1.266 (2008-2013).
Figure 24 Average iron concentrations in Adrains Creek, 2002-2007
Figure 25 Average iron concentrations in Adrains Creek, 2008-2013
SummaryOverall, a general increase in metal concentrations was observedbetween the two periods of interest.
The data indicates that surrounding land uses are likely impacting thesystem and deteriorating water quality; efforts should be made to identifypollution sources and implement agricultural best management practices(i.e., buffer strips, no-till, nutrient/soil management, livestock wastemanagement) to improve overall stream health and lessen downstreamimpacts to Upper Rideau Lake.

Rideau Lakes Subwatershed Report 2014
Upper Rideau Lake Catchment
13
Figure 26 Natural and other riparian land cover around Upper Rideau Lake
PE
RT
H R
D N
GR
AD
Y R
D
NA
RR
OW
S LO
CK
RD
PERTH RD
CA
RL
ET
ON
ST
SALEM RD
SUNNYSIDE RD
COUNTY RD 42
0 21
Kilometres ²Riparian land cover
NaturalOther
2. Riparian Conditions
Shoreline Buffer Land Cover EvaluationThe riparian or shoreline zone is that special area where the land meetsthe water. Well-vegetated shorelines are critically important in protectingwater quality and creating healthy aquatic habitats, lakes and rivers.Natural shorelines intercept sediments and contaminants that couldimpact water quality conditions and harm fish habitat in streams. Wellestablished buffers protect the banks against erosion, improve habitat forfish by shading and cooling the water and provide protection for birds andother wildlife that feed and rear young near water. A recommended target(from Environment Canada’s Guideline: How�Much�Habitat�is�Enough?) isto maintain a minimum 30 metre wide vegetated buffer along at least 75percent of the length of both sides of rivers, creeks and streams.
Figure 26 shows the extent of the naturally vegetated riparian zone in thecatchment, 30 meters along the shoreline of waterbodies andwatercourses. This analysis from the RVCA’s Land Cover ClassificationProgram (derived from 2008 DRAPE imagery) shows that the riparianbuffer (30 m. wide strip) in the catchment is comprised of woodland (52percent), wetland (25 percent), settlement areas (ten percent), crop andpastureland (ten percent) and transportation routes (three percent).
Around Upper Rideau Lake itself, the shoreline buffer is made up ofwoodland (54 percent), settlement areas (34 percent), wetland (fivepercent), transportation routes (four percent) and crop and pastureland(three percent). This can be further broken down as follows: the north(on-Shield) shore is comprised of woodland (69 percent), settlementareas (22 percent), wetland (three percent), transportation routes (threepercent) and crop and pastureland (three percent); in contrast, the south
(off-Shield) shore is comprised of settlement areas (42 percent), woodland (42 percent), transportation routes (six percent), wetland (six percent) andcrop and pastureland (four percent).
Around Westport Pond, the shoreline buffer is made up of wetland (48 percent), settlement areas (28 percent), woodland (15 percent) andtransportation routes (nine percent). Around Drysdale Pond, the shorelinebuffer is made up of woodland (96 percent) and wetland (four percent).
Along streams in the catchment, the riparian buffer is comprised of woodland(44 percent), wetland (32 percent), crop and pastureland (18 percent),settlement areas (three percent) and transportation routes (three percent).
Adrains Creek Overbank ZoneRiparian Buffer Width EvaluationFigure 27 shows buffer conditions along the left and right banks of AdrainsCreek. Using data from the 2013 Stream Characterization Program, AdrainsCreek had a buffer of greater than 30 meters along 82 percent of the rightbank and 83 percent along the left bank.
Figure 27 Riparian buffer evaluation along Adrains Creek

Rideau Lakes Subwatershed Report 2014
Upper Rideau Lake Catchment
14
Figure 29 Erosion along Adrains Creek
COUNTY RD 42
SUNNYSIDE RD UPPER R
IDEAU D
R
ADRAINS CREEK LANE
0 0.60.3
Kilometres ²
Stream erosion levels1 - 20%21 - 40%41 - 60%61 - 80%81 - 100%
Surveyed Stream
Adjacent Land UseThe RVCA’s Stream Characterization Program identifies seven differentland uses beside Adrains Creek (Figure 28). Surrounding land use isconsidered from the beginning to end of the survey section (100m) and upto 100 metres on each side of the creek. Land use outside of this area is notconsidered for the surveys but is nonetheless part of the subwatershed andwill influence the creek. Natural areas made up 85 percent of the stream,characterized by wetland, forest, scrubland and meadow. The remainingland use consisted of pasture, agriculture and infrastructure.
Figure 28 Land use along Adrains Creek
Adrians Creek Shoreline ZoneInstream ErosionErosion is a normal, important stream process and may not affect actualbank stability; however, excessive erosion and deposition of sedimentwithin a stream can have a detrimental effect on important fish andwildlife habitat. Poor bank stability can greatly contribute to the amountof sediment carried in a waterbody as well as loss of bank vegetationdue to bank failure, resulting in trees falling into the stream and thepotential to impact instream migration. Figure 29 shows limited and lowlevels of erosion along Adrains Creek.
Figure 30 Undercut stream banks along Adrains Creek
COUNTY RD 42
SUNNYSIDE RD UPPER R
IDEAU D
R
ADRAINS CREEK LANE
0 0.60.3
Kilometres ²
Undercut streambanklevels
1 - 20%21 - 40%41 - 60%61 - 80%81 - 100%
Surveyed Stream
Undercut Stream BanksUndercut banks are a normal and natural part of stream function and canprovide excellent refuge areas for fish. Figure 30 shows that AdrainsCreek had low levels of undercut banks.

Rideau Lakes Subwatershed Report 2014
Upper Rideau Lake Catchment
15
Stream ShadingGrasses, shrubs and trees all contribute towards shading a stream. Shadeis important in moderating stream temperature, contributing to food supplyand helping with nutrient reduction within a stream. Figure 31 showshighly variable stream shading conditions ranging from low to high levelsalong Adrains Creek.
Figure 31 Stream shading along Adrains Creek
COUNTY RD 42
SUNNYSIDE RD UPPER R
IDEAU D
R
ADRAINS CREEK LANE
0 0.60.3
Kilometres ²
Stream shading levels1 - 20%21 - 40%41 - 60%61 - 80%81 - 100%
Surveyed Stream
Instream Woody DebrisFigure 32 shows that the majority of Adrains Creek had low levels ofinstream woody debris in the form of branches and trees. Instream woodydebris is important for fish and benthic habitat, by providing refuge andfeeding areas.
Figure 32 Instream woody debris along Adrains Creek
COUNTY RD 42
SUNNYSIDE RD UPPER R
IDEAU D
R
ADRAINS CREEK LANE
0 0.50.25
Kilometres ²
Instream WoodyDebris
1 - 20%21 - 40%41 - 60%61 - 80%81 - 100%
Surveyed Stream
Figure 33 Overhanging trees and branches along Adrains Creek
COUNTY RD 42
SUNNYSIDE RD UPPER R
IDEAU D
R
ADRAINS CREEK LANE
0 0.60.3
Kilometres ²
Overhanging WoodyVegetation
1 - 20%21 - 40%41 - 60%61 - 80%81 - 100%
Surveyed Stream
Overhanging Trees and BranchesFigure 33 shows that the majority of Adrains Creek had low levels ofoverhanging branches and trees. Overhanging branches and trees providea food source, nutrients and shade which helps to moderate instream water temperatures

Rideau Lakes Subwatershed Report 2014
Upper Rideau Lake Catchment
16
Anthropogenic AlterationsFigure 34 shows 68 percent of Adrains Creek remains “unaltered” with noanthropogenic alterations. Thirty two percent of Adrains Creek wasclassified as natural with minor anthropogenic changes in the form ofbuffers of less than 15 meters along the banks and road crossings.
Figure 34 Anthropogenic alterations along Adrains Creek
Adrains Creek Instream Aquatic HabitatHabitat ComplexityStreams are naturally meandering systems and move over time; there arevarying degrees of habitat complexity, depending on the creek. Examplesof habitat complexity include variable habitat types such as pools andriffles as well as substrate variability and woody debris structure. A highpercentage of habitat complexity (heterogeneity) typically increases thebiodiversity of aquatic organisms within a system. Sixty-eight percent ofAdrains Creek was considered heterogeneous, as shown in Figure 35.
Figure 35 Habitat complexity along Adrains Creek
Figure 36 Instream substrate along Adrains Creek
COUNTY RD 42
SUNNYSIDE RD UPPER R
IDEAU D
R
ADRAINS CREEK LANE
0 0.60.3
Kilometres ²
Instream cobble/boulderhabitat
CobbleBoulderBoth
Surveyed Stream
Instream SubstrateDiverse substrate is important for fish and benthic invertebrate habitatbecause some species have specific substrate requirements and forexample will only reproduce on certain types of substrate. Boulders createinstream cover and back eddies for large fish to hide and/or rest out of thecurrent. Cobble provides important spawning habitat for certain fishspecies like walleye and shiners who are an important food source forlarger fish. Cobble can also provide habitat conditions for benthicinvertebrates that are a key food source for many fish and wildlife species.Figure 36 shows where cobble and boulder substrate are found in AdrainsCreek.
Rideau Lakes Subwatershed Report 2014
Upper Rideau Lake Catchment
17
Instream MorphologyPools and riffles are important habitat features for fish. Riffles are areas ofagitated water and they contribute higher dissolved oxygen to the streamand act as spawning substrate for some species of fish, such as walleye.Pools provide shelter for fish and can be refuge pools in the summer ifwater levels drop and water temperature in the creek increases. Poolsalso provide important over wintering areas for fish. Runs are usuallymoderately shallow, with unagitated surfaces of water and areas wherethe thalweg (deepest part of the channel) is in the center of the channel.
Figure 37 shows that Adrains Creek is fairly uniform; 96 percent consistsof runs, 2 percent pools and 2 percent riffles.
Figure 37 Instream morphology along Adrains Creek
Figure 38 Vegetation type along Adrains Creek
Vegetation TypeInstream vegetation provides a variety of functions and is a criticalcomponent of the aquatic ecosystem. For example emergent plants alongthe shoreline can provide shoreline protection from wave action andimportant rearing habitat for species of waterfowl. Submerged plants providehabitat for fish to find shelter from predator fish while they feed. Floatingplants such as water lilies shade the water and can keep temperatures coolwhile reducing algae growth. Adrains Creek had moderate levels of diversityof instream vegetation. The dominant vegetation type recorded at forty-ninepercent consisted of narrow leafed emergents. Figure 38 depicts the plantcommunity structure for Adrains Creek.
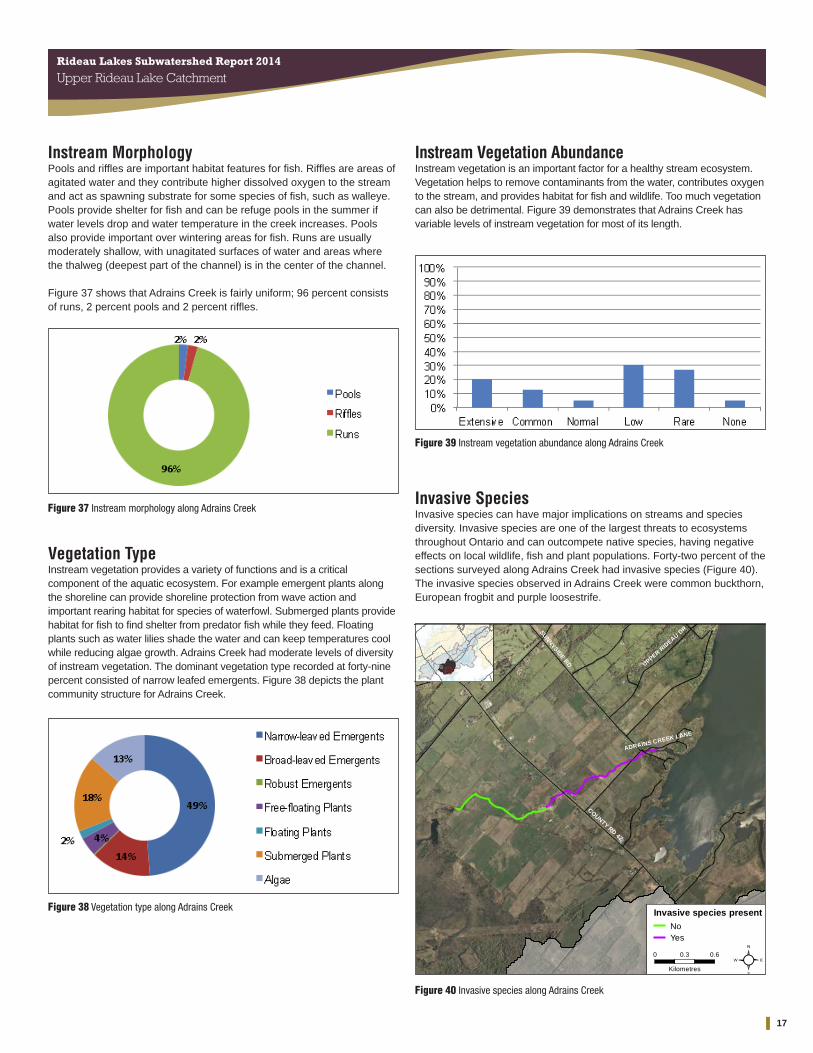
Instream Vegetation AbundanceInstream vegetation is an important factor for a healthy stream ecosystem.Vegetation helps to remove contaminants from the water, contributes oxygento the stream, and provides habitat for fish and wildlife. Too much vegetationcan also be detrimental. Figure 39 demonstrates that Adrains Creek hasvariable levels of instream vegetation for most of its length.
Figure 39 Instream vegetation abundance along Adrains Creek
Invasive SpeciesInvasive species can have major implications on streams and speciesdiversity. Invasive species are one of the largest threats to ecosystemsthroughout Ontario and can outcompete native species, having negativeeffects on local wildlife, fish and plant populations. Forty-two percent of thesections surveyed along Adrains Creek had invasive species (Figure 40).The invasive species observed in Adrains Creek were common buckthorn,European frogbit and purple loosestrife.
Figure 40 Invasive species along Adrains Creek
COUNTY RD 42
SUNNYSIDE RD UPPER R
IDEAU D
R
ADRAINS CREEK LANE
0 0.60.3
Kilometres ²
Invasive species presentNoYes

Rideau Lakes Subwatershed Report 2014
Upper Rideau Lake Catchment
18
Thermal RegimeMany factors can influence fluctuations in stream temperature, includingsprings, tributaries, precipitation runoff, discharge pipes and streamshading from riparian vegetation. Water temperature is used along withthe maximum air temperature (using the Stoneman and Jones method) toclassify a watercourse as either warm water, cool water or cold water.Figure 41 shows the location of temperature loggers at two samplinglocations along Adrains Creek. Analysis of the data collected indicates thatAdrains Creek is classified as a cool water system (Figure 42).
Figure 41 Temperature loggers in Adrains Creek
!.
!.
COUNTY RD 42
SUNNYSIDE RD UPPER RID
EAU DR
0 0.60.3
Kilometres ²
!. Temperature Logger
Surveyed Stream
Stream Network
Open Water (Lake)
Headwaters Drainage Features AssessmentThe RVCA Stream Characterization program assessed HeadwaterDrainage Features for the Rideau Lakes subwatershed in 2013. Thisprotocol measures zero, first and second order headwater drainagefeatures (HDF). It is a rapid assessment method characterizing theamount of water, sediment transport, and storage capacity withinheadwater drainage features (HDF). RVCA is working with TRCA and theMNR to implement the protocol with the goal of providing standarddatasets to support science development and monitoring on both theinterim guideline for headwater drainage features and existing mitigationstrategies. An HDF is a depression in the land that conveys surface flow.Additionally, this module provides a means of characterizing theconnectivity, form and unique features associated with each HDF (OSAPProtocol, 2013). An initiative is underway to evaluate how these data canhelp understand the cumulative contributions of individual headwaterdrainage features on the downstream watershed state (see Stanfield etal., 2013). In 2013 the program sampled 17 sites in the Upper RideauLake catchment area. Figure 43 shows the headwater drainage featuressampling locations in the catchment.
Figure 42 Temperature logger data for two sites on Adrains Creek
Figure 43 Headwater drainage feature sampling locations around Upper Rideau Lake
!
!!
!!
!
!!
!! !
!!!!
!
!
PERTH RD
MCCANN RD
SALEM RD
SUNNYSIDE RD
COUNTY RD 42
COUNTY RD 42
0 21
Kilometres ²
! Headwaters sample site
Stream Network
Open Water (Lake)
Two headwater drainage features sampled in the Upper Rideau Lake catchment
Adrains – Sunny Side Rd
Adrains – County Rd 42
19
Rideau Lakes Subwatershed Report 2014
Upper Rideau Lake Catchment
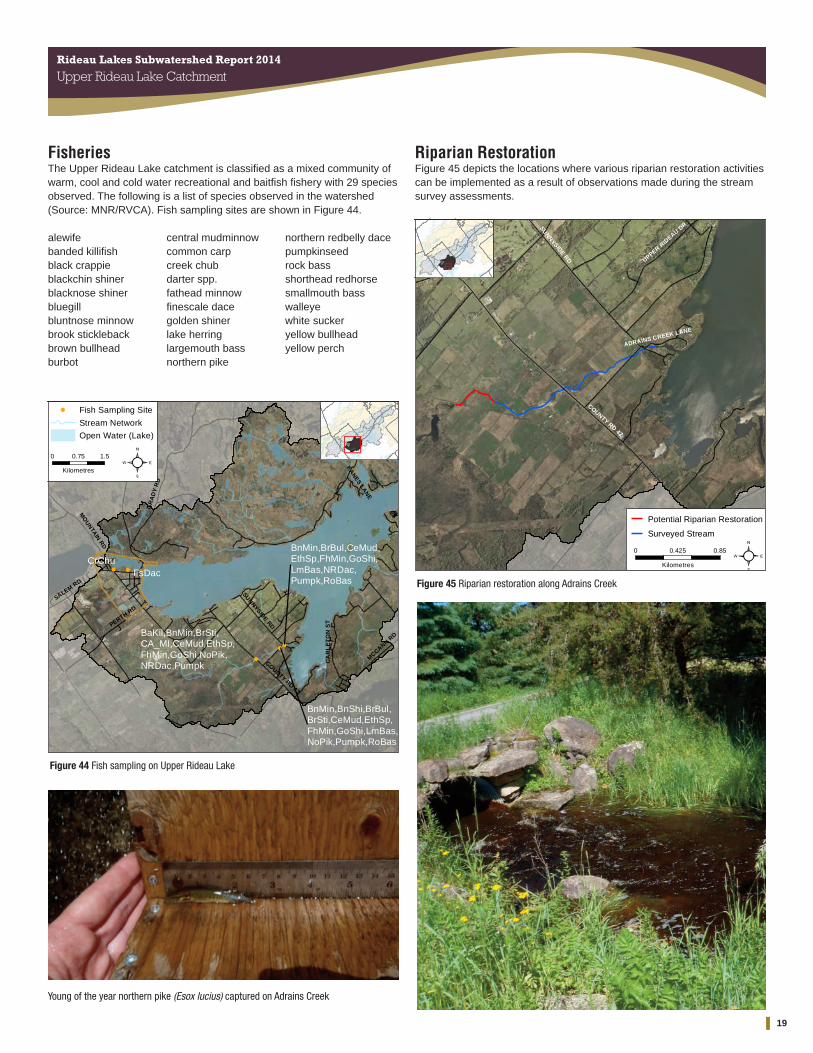
Figure 44 Fish sampling on Upper Rideau Lake
!
!!
!!
CrChuFsDac
BnMin,BrBul,CeMud,EthSp,FhMin,GoShi,LmBas,NRDac,Pumpk,RoBas
BaKil,BnMin,BrSti,CA_MI,CeMud,EthSp,FhMin,GoShi,NoPik,NRDac,Pumpk
BnMin,BnShi,BrBul,BrSti,CeMud,EthSp,FhMin,GoShi,LmBas,NoPik,Pumpk,RoBas
GR
AD
Y R
D
COUNTY RD 42
PE
RT
H R
D N
PERTH RD
MO
UN
TAIN
RD
CA
RL
ET
ON
ST
SALEM RD
SUNNYSIDE RD
MCCANN RD
KA
NES LA
NE
0 1.50.75
Kilometres ²
! Fish Sampling Site
Stream Network
Open Water (Lake)
FisheriesThe Upper Rideau Lake catchment is classified as a mixed community ofwarm, cool and cold water recreational and baitfish fishery with 29 speciesobserved. The following is a list of species observed in the watershed(Source: MNR/RVCA). Fish sampling sites are shown in Figure 44.
alewifebanded killifishblack crappieblackchin shiner blacknose shinerbluegill bluntnose minnow brook sticklebackbrown bullhead burbot
central mudminnowcommon carp creek chubdarter spp.fathead minnowfinescale dacegolden shinerlake herring largemouth bass northern pike
northern redbelly dacepumpkinseedrock bassshorthead redhorse smallmouth bass walleye white sucker yellow bullhead yellow perch
Young of the year northern pike (Esox lucius) captured on Adrains Creek
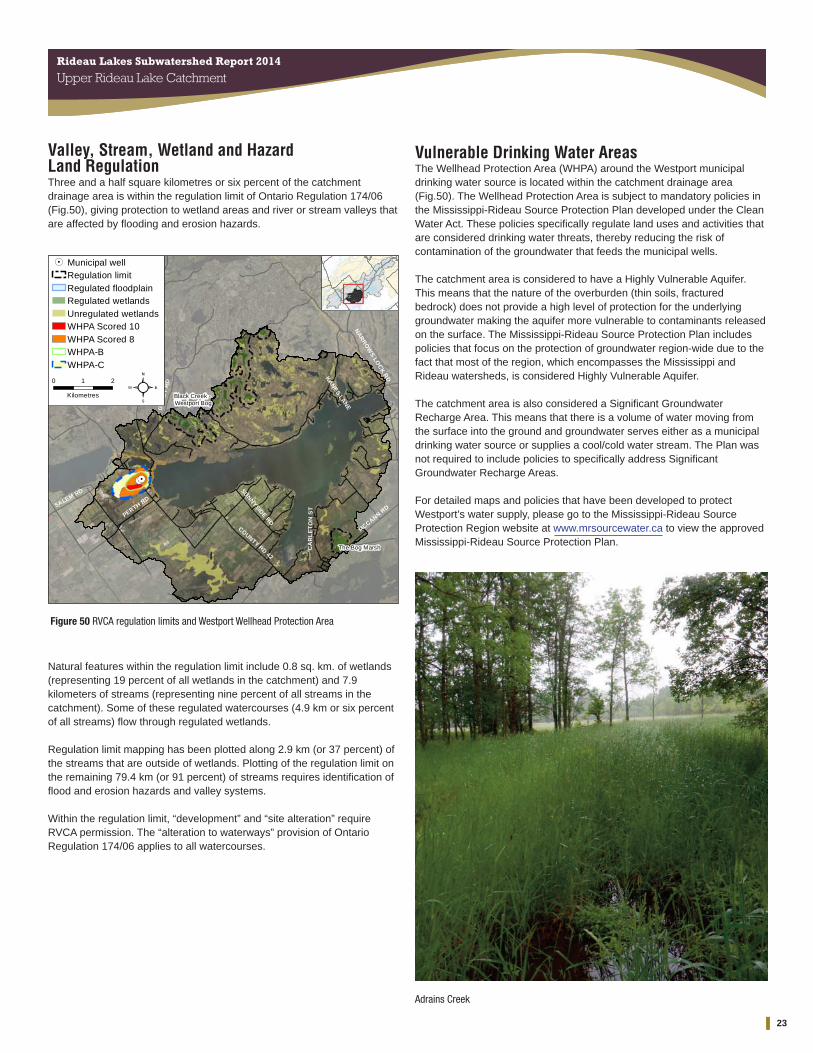
Riparian RestorationFigure 45 depicts the locations where various riparian restoration activitiescan be implemented as a result of observations made during the streamsurvey assessments.
Figure 45 Riparian restoration along Adrains Creek
COUNTY RD 42
SUNNYSIDE RD UPPER R
IDEAU D
R
ADRAINS CREEK LANE
0 0.850.425
Kilometres ²Potential Riparian Restoration
Surveyed Stream

20
Rideau Lakes Subwatershed Report 2014
Upper Rideau Lake Catchment
Migratory ObstructionsIt is important to know the locations of migratory obstructions becausethey can prevent fish from accessing important spawning and rearinghabitat (Figure 46). Migratory obstructions can be natural or manmade,and they can be permanent or seasonal. There was one debris dam onAdrains Creek at the time of the survey.
Figure 46 Migratory obstructions along Adrains Creek
Table 13 Water chemistry in Adrains Creek!(
COUNTY RD 42
SUNNYSIDE RD UPPER R
IDEAU D
R
ADRAINS CREEK LANE
0 0.60.3
Kilometres ²
Migratory Obstructions!( Debris Dam!( Natural Grade!( Perched Culvert
Surveyed Stream
Water ChemistryDuring the stream characterization survey, a YSI probe is used to collectwater chemistry, as follows:
• Dissolved Oxygen is a measure of the amount of oxygen dissolved inwater. The lowest acceptable concentration of dissolved oxygen is 6.0mg/L for early stages of warm water fish and 9.5 mg/L for cold waterfish (CCME, 1999). A saturation value (concentration of oxygen inwater) of 90 percent or above is considered healthy. Saturation levelsabove one hundred percent are not uncommon in sections of streamwhere there are high amounts of algae and other aquatic plants.
• Conductivity is the ability of a substance to transfer electricity. Thismeasure is influenced by the presence of dissolved salts and otherions in the stream.
• pH is a measure of relative acidity or alkalinity, ranging from 1 (mostacidic) to 14 (most alkaline/basic), with 7 occupying a neutral point.2013 data for these four parameters is summarized in Table 13.
Month Range DO (mg/L) DO(%) Conductivity(μs/cm) pH
May 2013 Low 5.6 56.3 194 7.2
High 11.3 113.5 212 7.6
June 2013 Low 3.3 31.5 175 7.2
High 7.0 67.4 198 7.6
Adrains Creek

21
Rideau Lakes Subwatershed Report 2014
Upper Rideau Lake Catchment
3. Land CoverWoodland is the dominant land cover type in the catchment along withwater, as shown in Table 14 and displayed in the map on the front cover ofthe report.
Table 14 Catchment land cover type
Cover Type Area (ha) Area (% of Cover)Woodland* 2,380 39Water 1,556 26
Crop & Pasture 1,174 19
Wetland** 448 8
Settlement 309 5
Transportation 183 3
* Does not include treed swamps ** Includes treed swamps
Woodland CoverThe Upper Rideau Lake catchment contains 2380 hectares of uplandforest and 22 hectares of lowland forest (treed swamps) (Fig.47) thatoccupies 40 percent of the drainage area (versus the 44 percent ofwoodland cover in the Rideau Lakes subwatershed). This figure is greaterthan the 30 percent of woodland area required to sustain forest birds,according to Environment Canada’s Guideline: How�Much�Habitat�IsEnough?�When forest cover declines below 30 percent, forest birds tendto disappear as breeders across the landscape.
One hundred and two (53 percent) of the 194 woodland patches in thecatchment are very small, being less than one hectare in size. Another 74 (38 percent) of the wooded patches ranging from one to less than 20 hectares in size tend to be dominated by edge-tolerant bird species. Theremaining 18 (nine percent of) woodland patches range between 21 and 757 hectares. Fourteen of these patches contain woodland between 20 and100 hectares and may support a few area-sensitive species and some edgeintolerant species, but will be dominated by edge tolerant species.Conversely, four (less than one percent) of the 194 woodland patches in thedrainage area exceed the 100 plus hectare size needed to support mostforest dependent, area sensitive birds and are large enough to supportapproximately 60 percent of edge-intolerant species. Two of these patchestop 200 hectares, which according to the Environment Canada Guideline willsupport 80 percent of edge-intolerant forest bird species (including most areasensitive species) that prefer interior forest habitat conditions.
Forest InteriorThe same 194 woodlands contain 87 forest interior patches (Fig.47) thatoccupy two percent (390 ha.) of the catchment land area (versus the fivepercent of interior forest in the Rideau Lakes subwatershed). This is belowthe ten percent figure referred to in the Environment Canada Guidelinethat is considered to be the minimum threshold for supporting edgeintolerant bird species and other forest dwelling species in the landscape. Most patches (76) have less than 10 hectares of interior forest, 50 ofwhich have small areas of interior forest habitat less than one hectare insize. Another eight patches contain between 10 and 30 hectares of interiorforest. Conversely, three patches have greater than 30 hectares of interiorforest (at 36, 53 and 55 ha).
Figure 47 Catchment woodland cover and forest interioror
NA
RR
OW
S LO
CK
RD
PERTH RD
MCCANN RD
SALEM RD
SUNNYSIDE RD
COUNTY RD 42COUNTY RD 42
0 21
Kilometres ²
Interior Treed Swamps
Interior Forest
Forest
Wetland CoverFigure 48 shows pre-settlement wetland cover (Ducks Unlimited Canada2010) versus current wetland cover (DRAPE 2008) in the catchment.Analysis of these two datasets reveals that there has been a 48 percentloss in the amount of wetland on the landscape through this period; mostof this reported loss has occurred off the Canadian Shield where 68percent of wetlands have been estimated to have been lost.
Figure 48 Catchment wetland cover
PE
RT
H R
D N
GR
AD
Y R
D
PERTH RD
MCCANN RD
CA
RL
ET
ON
ST
SALEM RD
SUNNYSIDE RD
COUNTY RD 42
KA
NES LA
NE
0 1.50.75
Kilometres ²
Wetland CoverPre-SettlementCurrent (2008)
Pre-Settlement data provided by: Ducks Unlimited Canada, 2010. Southern Ontario Wetland Conversion Analysis, http://www.ducks.ca/aboutduc/news/archives/prov2010/pdf/duc_ontariowca.pdf, (March 2010)

22
Tree Planting ProjectsThe location of all tree planting projects is also shown in Figure 49. From2008 to 2013, 10,550 trees were planted at three sites through the RVCATree Planting Program. Project value is $25,769 with $14,765 of thatamount coming from other fundraising sources.
Before that, landowners helped plant 3,400 trees, valued at $7,259, at oneproject site, using the RVCA Tree Planting Program; fundraising dollarsaccounted for $1,919 of that amount.
Shoreline Naturalization ProjectsWith the assistance of the RVCA’s Shoreline Naturalization Program,2,823 trees and shrubs were planted at seven project locations to create 488 metres of shoreline buffer at a total project value of $7,077.
The RVCA also works with the Upper Rideau Lake Association to assist itwith the distribution of native trees and shrubs each spring. Since 2010,3,450 native plant seedlings have been provided through the program at nocharge to the lake community.
Septic System Re-InspectionsFrom 2007 to 2014, the Mississippi Rideau Septic System Officeperformed 63 septic system re-inspections (44 cottages and 19 houses)on Upper Rideau Lake in Rideau Lakes Township. Remedial/maintenancework (i.e. pump outs, baffle replacement, work that generally does notrequire a permit) was recommended for 28 (or 44 percent) of thoseproperties that were inspected, septic system replacements at anotherthree (or five percent of) properties with more information provided to afurther two landowners with identified septic system concerns.
The RVCA and its partners are working to protect and enhanceenvironmental conditions in the Rideau Lakes subwatershed.
Rural Clean Water ProjectsFigure 49 shows the location of all Rural Clean Water Projects in theUpper Rideau Lake drainage area. From 2008 to 2013, landownerscompleted seven projects: three well upgrades, two welldecommissionings, one septic system repair and one erosion controlproject. RVCA contributed $5,572 in grant dollars towards the total projectcost of $25,426.
4. Stewardship and Protection
Figure 49 RVCA stewardship program project locations
UU
U
U
ÔÔÔ
ÔÔ
ÔÔÔÔ
ÔÔ
ÔÔ
ÔÔ
Ô
Ô
U
UU
U
X
X
X
X
X
X
X
ÔÔÔ
#
#
GR
AD
Y R
D
MO
UN
TAIN
RD
SALEM RD SUNNYSIDE RD
0 10.5
Kilometres ²
RVCA Stewardship Projects andConservation Lands:# Conservation Land
Ô Ont. Drinking Water
XShoreline Planting
U Tree Planting
Ô Clean Water
U Butternut Planting
FoleyMountain
Prior to 2008, the RVCA completed ten projects in the area consisting ofthree well upgrades, two septic system repairs, two livestock fencingprojects, one erosion control project, one fuel storage and handling facilityand one well decommissioning. In total, RVCA contributed $16,192 ingrant dollars to projects valued at $86,435.
Ontario Drinking Water Stewardship ProjectsFigure 49 shows the location of all Ontario Drinking Water StewardshipProgram (ODWSP) projects in the Upper Rideau Lake drainage area. ThisMinistry of the Environment funded program has supported three projectsbetween 2008 and 2013. Total project value is $22,146 with landownersreceiving $15,934 to support two septic system repairs/replacements andone fuel handling and storage facility.
23
Rideau Lakes Subwatershed Report 2014
Upper Rideau Lake Catchment
Valley, Stream, Wetland and Hazard Land RegulationThree and a half square kilometres or six percent of the catchmentdrainage area is within the regulation limit of Ontario Regulation 174/06(Fig.50), giving protection to wetland areas and river or stream valleys thatare affected by flooding and erosion hazards.
Figure 50 RVCA regulation limits and Westport Wellhead Protection Area
!.!.
PE
RT
H R
D N
GR
AD
Y R
D
COUNTY RD 42
NA
RR
OW
S LOC
K R
D
PERTH RD
SALEM RD
MCCANN RD
CA
RL
ET
ON
ST
SUNNYSIDE RD
KA
NES LA
NE
0 21
Kilometres ²
!. Municipal wellRegulation limitRegulated floodplainRegulated wetlandsUnregulated wetlandsWHPA Scored 10WHPA Scored 8WHPA-BWHPA-C
Black Creek - Westport Bog
The Bog Marsh
Vulnerable Drinking Water AreasThe Wellhead Protection Area (WHPA) around the Westport municipaldrinking water source is located within the catchment drainage area(Fig.50). The Wellhead Protection Area is subject to mandatory policies inthe Mississippi-Rideau�Source�Protection�Plan developed under the CleanWater�Act. These policies specifically regulate land uses and activities thatare considered drinking water threats, thereby reducing the risk ofcontamination of the groundwater that feeds the municipal wells.
The catchment area is considered to have a Highly Vulnerable Aquifer.This means that the nature of the overburden (thin soils, fracturedbedrock) does not provide a high level of protection for the underlyinggroundwater making the aquifer more vulnerable to contaminants releasedon the surface. The Mississippi-Rideau Source Protection Plan includespolicies that focus on the protection of groundwater region-wide due to thefact that most of the region, which encompasses the Mississippi andRideau watersheds, is considered Highly Vulnerable Aquifer.
The catchment area is also considered a Significant GroundwaterRecharge Area. This means that there is a volume of water moving fromthe surface into the ground and groundwater serves either as a municipaldrinking water source or supplies a cool/cold water stream. The Plan wasnot required to include policies to specifically address SignificantGroundwater Recharge Areas.
For detailed maps and policies that have been developed to protectWestport’s water supply, please go to the Mississippi-Rideau SourceProtection Region website at www.mrsourcewater.ca to view the approvedMississippi-Rideau�Source�Protection�Plan.
Natural features within the regulation limit include 0.8 sq. km. of wetlands(representing 19 percent of all wetlands in the catchment) and 7.9kilometers of streams (representing nine percent of all streams in thecatchment). Some of these regulated watercourses (4.9 km or six percentof all streams) flow through regulated wetlands.
Regulation limit mapping has been plotted along 2.9 km (or 37 percent) ofthe streams that are outside of wetlands. Plotting of the regulation limit onthe remaining 79.4 km (or 91 percent) of streams requires identification offlood and erosion hazards and valley systems.
Within the regulation limit, “development” and “site alteration” requireRVCA permission. The “alteration to waterways” provision of OntarioRegulation 174/06 applies to all watercourses.
Adrains Creek

24
Rideau Lakes Subwatershed Report 2014
Upper Rideau Lake Catchment
5. IssuesWater Quality• Historically, persistent high nutrient concentrations have been a
concern in Upper Rideau Lake from inflows of nutrients (from privateseptic systems, from agricultural/commercial/residential stormwaterrunoff and from sewage lagoon discharge) which has enabled aquaticplants and algae blooms to flourish
• Recent findings from the RVCA’s surface water quality monitoringprogram show that Upper Rideau Lake has a “Poor” surface waterquality rating (for the 2008-2013 period) and is generally characterizedby elevated nutrient concentrations along with a history of algal bloomoccurrences
• Adrains Creek has a “Poor” surface water quality rating (for the 2002-2007 and 2008-2013 periods) due to consistently high nutrient,bacteria and metal concentrations
• RVCA’s 2013 Algae and Aquatic Plant Survey for Eastern OntarioLakes and Rivers notes that a majority of the respondents in theRideau Lakes subwatershed have noticed an increase in algae bloomsand aquatic plants on their lake. During the summer of August 2014,blue-green algae blooms were identified on Upper Rideau Lake. Thishas been followed up with concerns being expressed (via the Townshipof Rideau Lakes) by those who live and recreate on the Upper RideauLake, downstream property owners, local businesses and the widercommunity that run the full spectrum from public health, to ecosystemhealth, to aesthetics, to property values
• Thirty-three (of 63) Rideau Lakes Township septic system voluntary re-inspections conducted from 2007 to 2014 revealed the need for additionalmaintenance/remedial/replacement works to be performed. Thoseproperties with concerns are identified in the yearly report submitted bythe Mississippi Rideau Septic System Office to the Township
Development• Traditional cottage character of the Rideau Lakes is being slowly
altered by the scale of development and the trend toward larger year-round dwellings. This transition is taking place either through re-development of an existing cottage lot or incremental alterations(additions, sleeping cabins, gazebos, decks, sheds, boat houses,garages, lawns, docks)
• Many waterfront properties contain existing non-complying dwellingswith respect to minimum water frontage and lot area and are oftenlocated within 30 metres of the water that require minor variances forexpansion and/or reconstruction of dwellings where standarddevelopment setbacks from water are difficult to achieve. In thesecases, of which there are many, municipal staff and the ConservationAuthority often meet with resistance and push back when attempts aremade to implement standards for development setbacks, vegetatedshorelines and septic systems
• Monitoring implementation of conditions of planning and regulatoryapprovals is challenging due to a lack of resources
• Access to waterfront properties along private roads/right-of-way isbecoming more of a municipal liability for emergency vehicle access(ambulance, fire and police)
Shorelines• Along the south shore of Upper Rideau Lake (off the Canadian Shield),
the majority of the 30 metre wide riparian, shoreline buffer contains (51percent) non-natural land cover (comprised of village/waterfrontsettlement areas, roads and crop and pastureland) and 49 percentnatural land cover (made up of woodland and wetland), which is belowthe recommended 75 percent naturally vegetated riparian, shoreline
buffer target. By comparison, the shoreline cover on the north shore ofUpper Rideau Lake (on the Canadian Shield) is comprised of 75percent natural land cover (made up of woodland and wetland) and 25percent non-natural land cover (comprised of waterfront settlementareas and crop and pastureland)
• Around Westport Pond, the 30 metre wide riparian, shoreline buffercontains (37 percent) non-natural land cover (comprised of waterfrontresidential/commercial properties and roads) and 63 percent naturalland cover (made up of wetland and woodland), which is below therecommended 75 percent naturally vegetated riparian, shorelinebuffer target
• The 1992 Upper Rideau Lake Shoreline Survey revealed that themajority of properties had some type of altered shoreline (229 out of425 properties surveyed)
• Emerald ash borer poses a significant threat to the ecology of thesubwatershed, given the prominence of ash trees along shorelines andin riparian and wetland areas. Many tree stands are predominantly ashand with their anticipated loss, it is unclear what will replace them andthe overall effect of their collective demise on the physical and naturalfunctions/values they provide for erosion, water quality and fish andwildlife habitat protection
Water Levels• Fluctuations above/below the expected/typical range in water levels due to
cool and wet or hot and dry conditions cause concern amongst propertyowners around the Rideau Lakes. Information about water levelmanagement is available on various websites; however, timelycommunication about the manipulation of water level control structuresand specific conditions is not always forthcoming during high water events
Fisheries• There is limited information available about the state of the fisheries
resource in this catchment. Fisheries studies were completed on mostRideau Lakes in the late 1960’s or early 1970’s revealing a diversefishery resource with cold, cool and warm aquatic habitats present.Since then, no other studies have been completed on the local lakeswith the exception of Big Rideau Lake where landscape level, broad-scale, creel surveys are conducted by MNR on a five year cycle
Lake Planning• This report outlines some issues and concerns regarding the health of the
Upper Rideau Lake catchment. However, there is limited knowledge ofthe overall issues and concerns about natural resource management,use and the health of the Upper Rideau Lake and its subwatershed
• The Upper Rideau Lake community might consider working together toundergo the lake planning process. The lake planning process allowsfor valuable information about the current health of the lake and itswatershed, as well as an overview of all the issues and concernsfacing the lake to be collected together. The lake planning processrequires involvement and input from the whole lake community whichincludes lake residents, users, businesses, municipalities, non-governmental organizations, agency partners and other stakeholders.The process ensures that the lake community’s issues and concernsare gathered into one action-oriented document, which can guide themany stakeholders that care about Upper Rideau Lake to help tacklelake health concerns in partnership
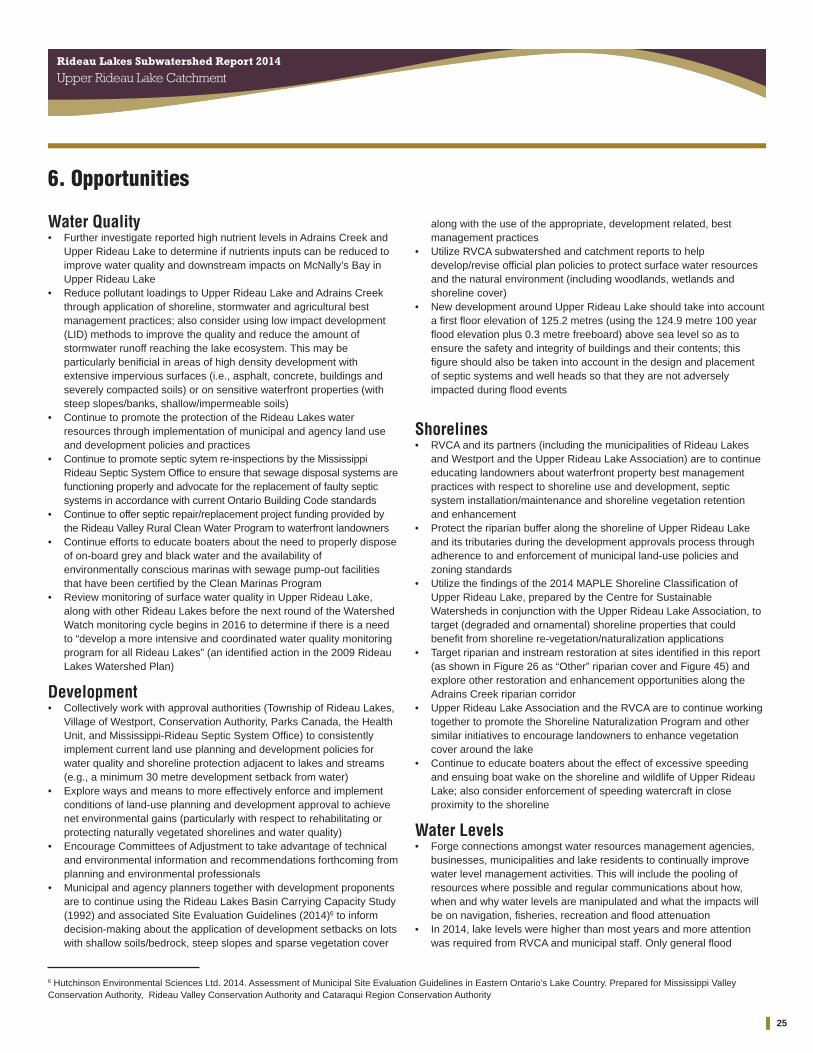
25
Rideau Lakes Subwatershed Report 2014
Upper Rideau Lake Catchment
6. Opportunities
Water Quality• Further investigate reported high nutrient levels in Adrains Creek and
Upper Rideau Lake to determine if nutrients inputs can be reduced toimprove water quality and downstream impacts on McNally’s Bay inUpper Rideau Lake
• Reduce pollutant loadings to Upper Rideau Lake and Adrains Creekthrough application of shoreline, stormwater and agricultural bestmanagement practices; also consider using low impact development(LID) methods to improve the quality and reduce the amount ofstormwater runoff reaching the lake ecosystem. This may beparticularly benificial in areas of high density development withextensive impervious surfaces (i.e., asphalt, concrete, buildings andseverely compacted soils) or on sensitive waterfront properties (withsteep slopes/banks, shallow/impermeable soils)
• Continue to promote the protection of the Rideau Lakes waterresources through implementation of municipal and agency land useand development policies and practices
• Continue to promote septic sytem re-inspections by the MississippiRideau Septic System Office to ensure that sewage disposal systems arefunctioning properly and advocate for the replacement of faulty septicsystems in accordance with current Ontario�Building�Code�standards
• Continue to offer septic repair/replacement project funding provided bythe Rideau Valley Rural Clean Water Program to waterfront landowners
• Continue efforts to educate boaters about the need to properly disposeof on-board grey and black water and the availability ofenvironmentally conscious marinas with sewage pump-out facilitiesthat have been certified by the Clean Marinas Program
• Review monitoring of surface water quality in Upper Rideau Lake,along with other Rideau Lakes before the next round of the WatershedWatch monitoring cycle begins in 2016 to determine if there is a needto “develop a more intensive and coordinated water quality monitoringprogram for all Rideau Lakes” (an identified action in the 2009 RideauLakes Watershed Plan)
Development• Collectively work with approval authorities (Township of Rideau Lakes,
Village of Westport, Conservation Authority, Parks Canada, the HealthUnit, and Mississippi-Rideau Septic System Office) to consistentlyimplement current land use planning and development policies forwater quality and shoreline protection adjacent to lakes and streams(e.g., a minimum 30 metre development setback from water)
• Explore ways and means to more effectively enforce and implementconditions of land-use planning and development approval to achievenet environmental gains (particularly with respect to rehabilitating orprotecting naturally vegetated shorelines and water quality)
• Encourage Committees of Adjustment to take advantage of technicaland environmental information and recommendations forthcoming fromplanning and environmental professionals
• Municipal and agency planners together with development proponentsare to continue using the Rideau�Lakes�Basin�Carrying�Capacity�Study(1992) and associated Site�Evaluation�Guidelines (2014)6 to informdecision-making about the application of development setbacks on lotswith shallow soils/bedrock, steep slopes and sparse vegetation cover
along with the use of the appropriate, development related, bestmanagement practices
• Utilize RVCA subwatershed and catchment reports to helpdevelop/revise official plan policies to protect surface water resourcesand the natural environment (including woodlands, wetlands andshoreline cover)
• New development around Upper Rideau Lake should take into accounta first floor elevation of 125.2 metres (using the 124.9 metre 100 yearflood elevation plus 0.3 metre freeboard) above sea level so as toensure the safety and integrity of buildings and their contents; thisfigure should also be taken into account in the design and placementof septic systems and well heads so that they are not adverselyimpacted during flood events
Shorelines• RVCA and its partners (including the municipalities of Rideau Lakes
and Westport and the Upper Rideau Lake Association) are to continueeducating landowners about waterfront property best managementpractices with respect to shoreline use and development, septicsystem installation/maintenance and shoreline vegetation retention and enhancement
• Protect the riparian buffer along the shoreline of Upper Rideau Lakeand its tributaries during the development approvals process throughadherence to and enforcement of municipal land-use policies andzoning standards
• Utilize the findings of the 2014 MAPLE Shoreline Classification ofUpper Rideau Lake, prepared by the Centre for SustainableWatersheds in conjunction with the Upper Rideau Lake Association, totarget (degraded and ornamental) shoreline properties that couldbenefit from shoreline re-vegetation/naturalization applications
• Target riparian and instream restoration at sites identified in this report(as shown in Figure 26 as “Other” riparian cover and Figure 45) andexplore other restoration and enhancement opportunities along theAdrains Creek riparian corridor
• Upper Rideau Lake Association and the RVCA are to continue workingtogether to promote the Shoreline Naturalization Program and othersimilar initiatives to encourage landowners to enhance vegetationcover around the lake
• Continue to educate boaters about the effect of excessive speedingand ensuing boat wake on the shoreline and wildlife of Upper RideauLake; also consider enforcement of speeding watercraft in closeproximity to the shoreline
Water Levels• Forge connections amongst water resources management agencies,
businesses, municipalities and lake residents to continually improvewater level management activities. This will include the pooling ofresources where possible and regular communications about how,when and why water levels are manipulated and what the impacts willbe on navigation, fisheries, recreation and flood attenuation
• In 2014, lake levels were higher than most years and more attentionwas required from RVCA and municipal staff. Only general flood
6 Hutchinson Environmental Sciences Ltd. 2014.�Assessment�of�Municipal�Site�Evaluation�Guidelines�in�Eastern�Ontario’s�Lake�Country. Prepared for Mississippi ValleyConservation Authority, Rideau Valley Conservation Authority and Cataraqui Region Conservation Authority

26
Rideau Lakes Subwatershed Report 2014
Upper Rideau Lake Catchment
Upper Rideau Lake
information was available for Tay Valley Township and the Township ofRideau Lakes to address landowner concerns. In response, a review ofthe RVCA Flood Forecasting and Warning Program in the UpperRideau Valley is underway to address this need
Lake Planning
A Lake Plan:• Is an action plan developed by a lake community (which includes
lake residents, users, businesses, municipalities, non-governmentalorganizations, agency partners and other stakeholders) thatidentifies and preserves the natural and social characteristics thatare valued by the lake community for future generations
• Helps to promote community discussion, education and action• Sets goals and objectives for the protection and enhancement of
the lake• Recommends land use policies/practices that influence
development on the lake
• Promotes stewardship actions to improve the environmentalconditions of a lake so it can be enjoyed by future generations
Consider the need for a community-driven lake management plan forUpper Rideau Lake that can:
• Bring the lake community together• Engage the community beyond the lake residents and lake
association members and develop partnerships• Identify and bring together common values and concerns• Provide a baseline of data on water quality, land-use activities,
shoreline development, fisheries management, etc., that can helpto inform water resources management, land use planning andstewardship actions
• Range in complexity from a comprehensive living document to asimplified list of priorities that can be carried out by the lakecommunity to protect the lake environment