
RICK SHOULER - BWF
58
Transcript of RICK SHOULER - BWF
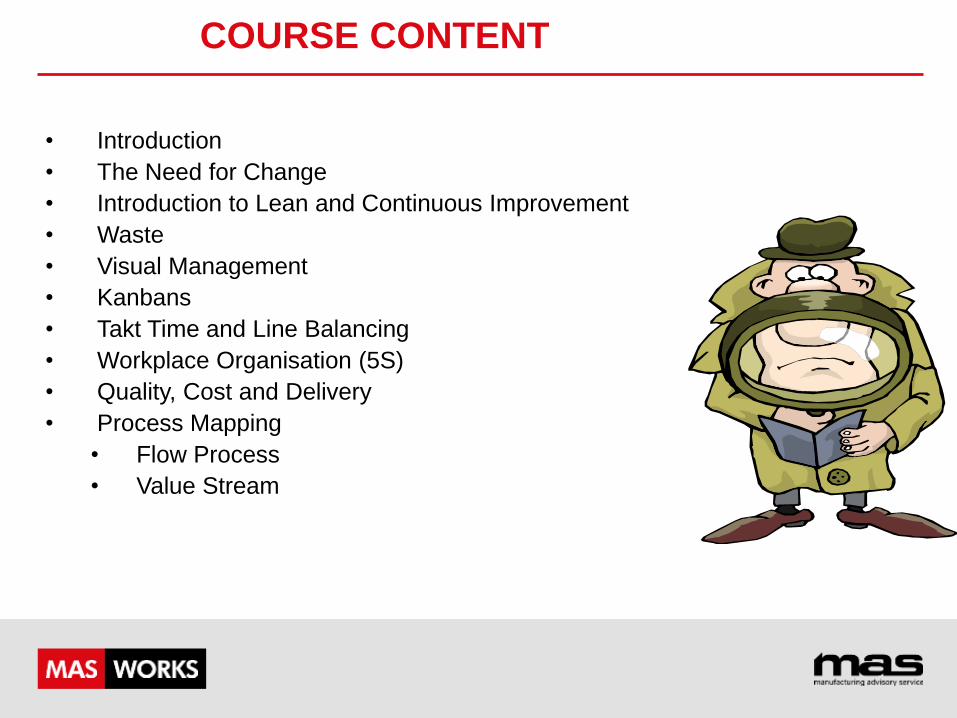
COURSE CONTENT
• Introduction
• The Need for Change
• Introduction to Lean and Continuous Improvement
• Waste
• Visual Management
• Kanbans
• Takt Time and Line Balancing
• Workplace Organisation (5S)
• Quality, Cost and Delivery
• Process Mapping
• Flow Process
• Value Stream
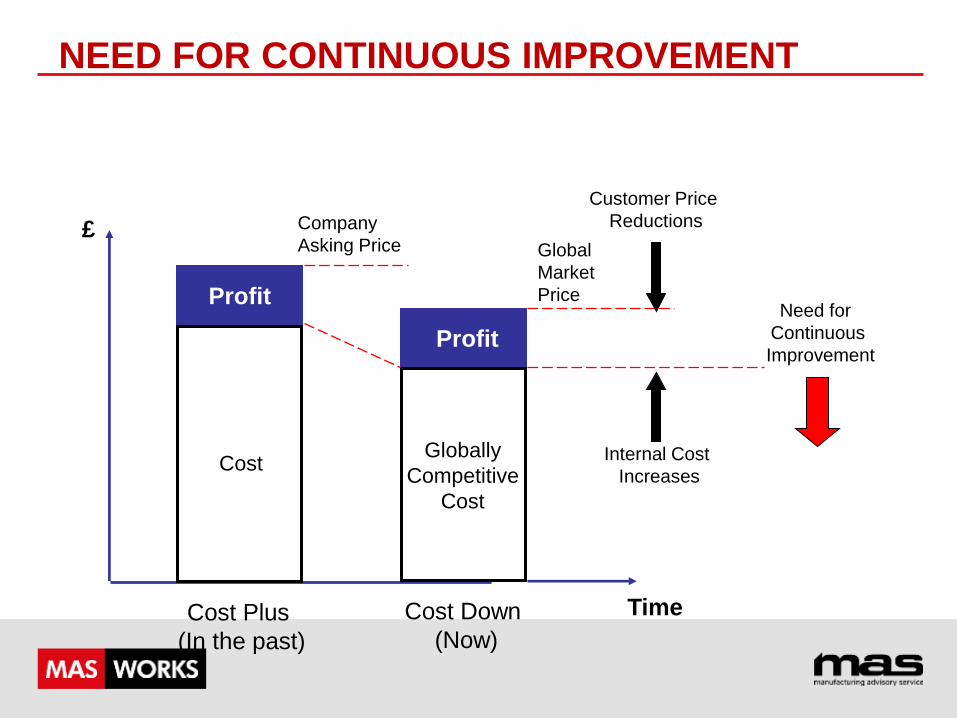
Time
£
Profit
Cost Plus
(In the past)
Cost
Company
Asking Price Global
Market
Price
Cost Down
(Now)
Profit
Globally
Competitive
Cost
Customer Price
Reductions
Internal Cost
Increases
Need for
Continuous
Improvement
NEED FOR CONTINUOUS IMPROVEMENT
INTRODUCTION TO LEAN
WHAT IS LEAN ?
Doing more and more with less and
less by working smarter, not harder
LEAN IS A BUSINESS IMPROVEMENT
TECHNIQUE FOCUSED ON DELIVERING
VALUE TO THE CUSTOMER
WHAT IS CONTINUOUS IMPROVEMENT AND LEAN?
Definition of continuous improvement:
“the elimination of waste through continuous improvement activities”
Overall aim of Lean:
“To provide goods or services demanded by the customer, using only those resources that are absolutely necessary.”
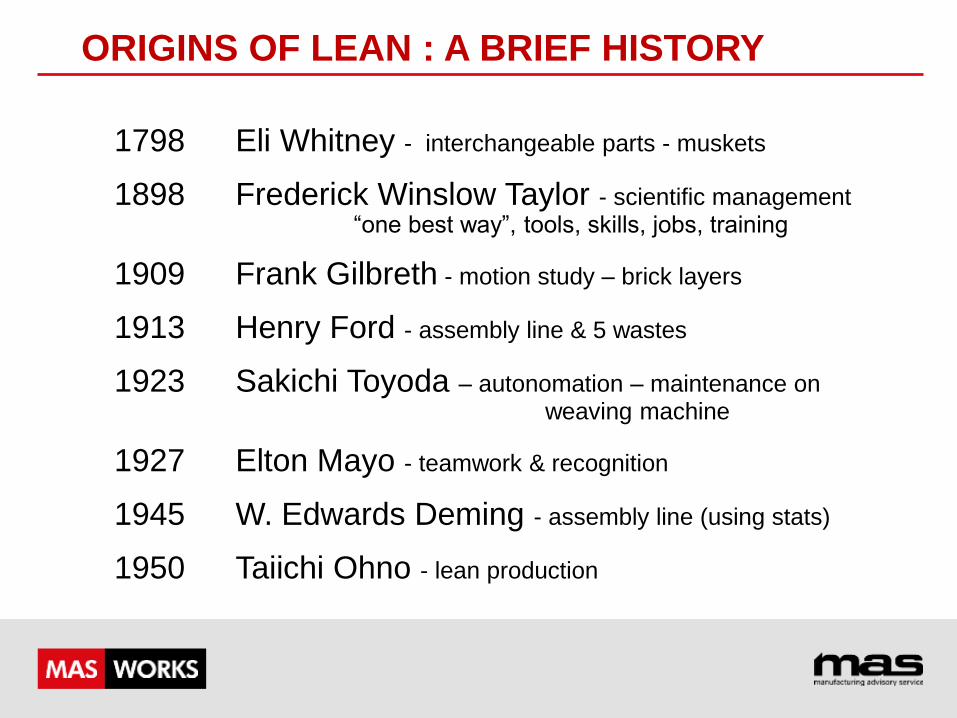
1798 Eli Whitney - interchangeable parts - muskets
1898 Frederick Winslow Taylor - scientific management “one best way”, tools, skills, jobs, training
1909 Frank Gilbreth - motion study – brick layers
1913 Henry Ford - assembly line & 5 wastes
1923 Sakichi Toyoda – autonomation – maintenance on weaving machine
1927 Elton Mayo - teamwork & recognition
1945 W. Edwards Deming - assembly line (using stats)
1950 Taiichi Ohno - lean production
A Brief History of Operations Management
ORIGINS OF LEAN ORIGINS OF LEAN : A BRIEF HISTORY
Kaizen
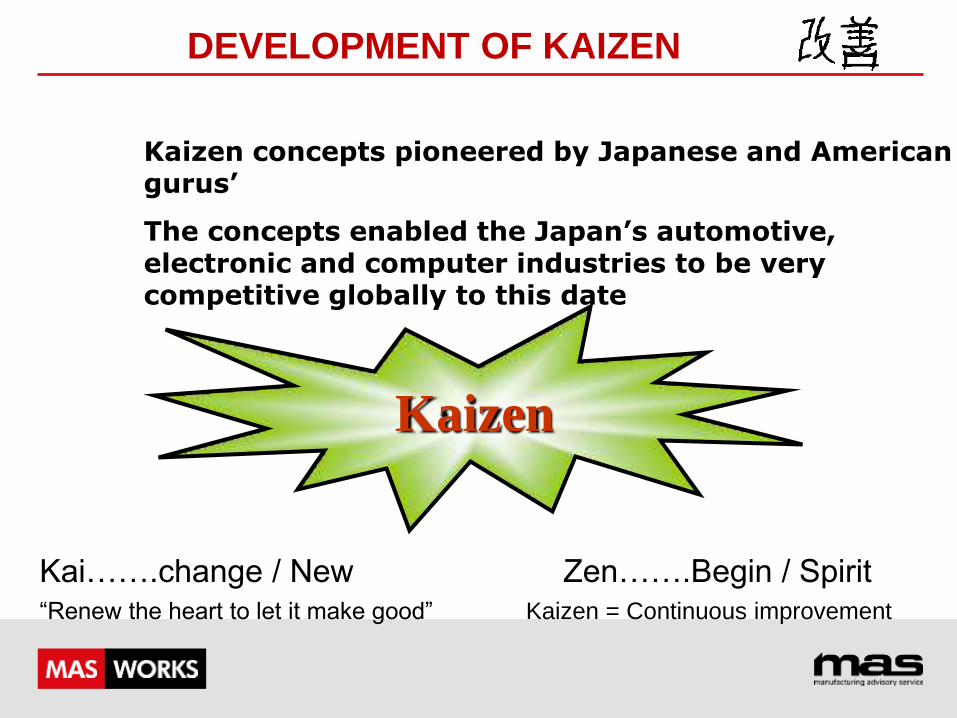
DEVELOPMENT OF KAIZEN
Kaizen concepts pioneered by Japanese and American gurus’
The concepts enabled the Japan’s automotive, electronic and computer industries to be very competitive globally to this date
Kai…….change / New Zen…….Begin / Spirit “Renew the heart to let it make good” Kaizen = Continuous improvement
DEFINITION OF KAIZEN
• A philosophy that emphasize that way of life be it working life, social life or home life need to be constantly improved
• A management tool adopted by Japanese industries to manage continuous improvement for the organization
• An improvement activity – an ongoing improvement involving everyone, including both managers and workers
PURPOSE AND BENEFITS OF KAIZEN
• Improvement is continuous, there’s always change
for the better as there is no end to improvement
• As a result, QCD (Quality, Cost, Delivery) measures
get better and becomes competitive
• All levels of employees are involved in contributing
and participating in Kaizen activities
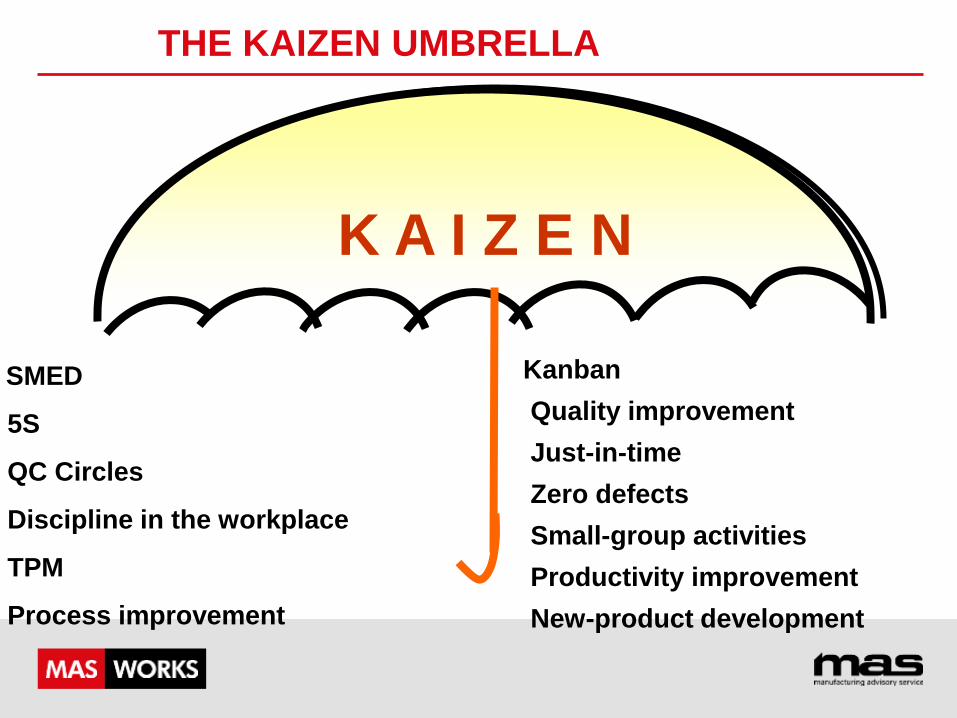
THE KAIZEN UMBRELLA
SMED
5S
QC Circles
Discipline in the workplace
TPM
Process improvement
Kanban
Quality improvement
Just-in-time
Zero defects
Small-group activities
Productivity improvement
New-product development
K A I Z E N
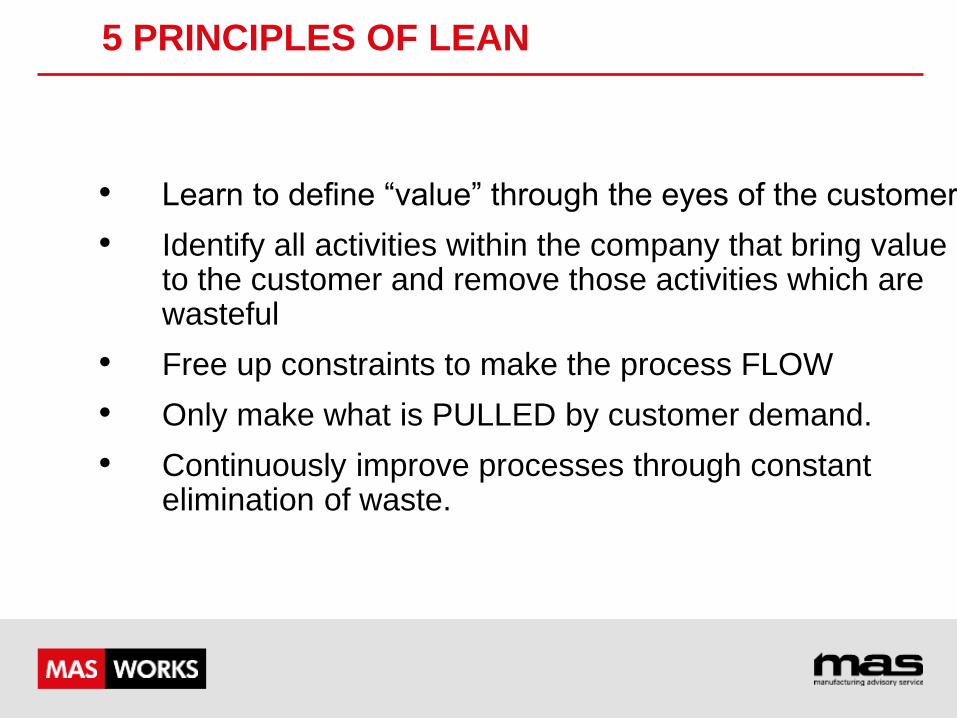
5 PRINCIPLES OF LEAN
• Learn to define “value” through the eyes of the customer
• Identify all activities within the company that bring value to the customer and remove those activities which are wasteful
• Free up constraints to make the process FLOW
• Only make what is PULLED by customer demand.
• Continuously improve processes through constant elimination of waste.
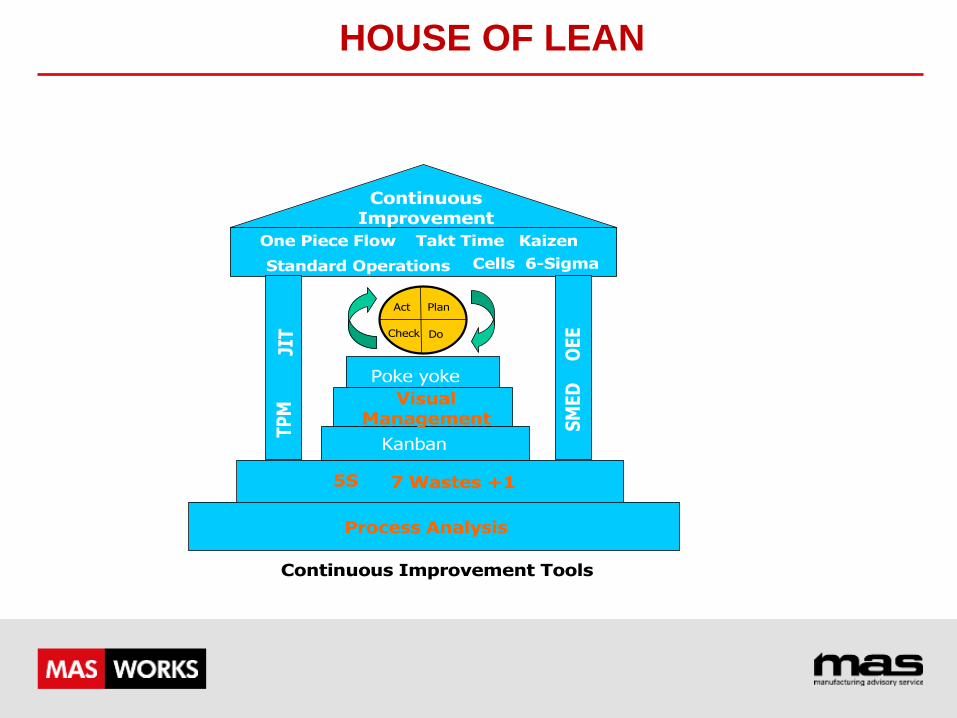
Standard Operations
Visual Management
7 Wastes +15S
Continuous Improvement Tools
Process Analysis
Plan
DoCheck
Act
Continuous Improvement
TP
M
SM
ED
Kanban
OE
E
JIT
Poke yoke
One Piece Flow Kaizen
Cells 6-Sigma
Takt Time
HOUSE OF LEAN
• Produce More Efficiently.
• Remove Unnecessary Cost.
• Improve Customer Lead Times.
• Control Inventory Better.
• Optimise Layout & Space.
• Deliver Better Quality & Service.
BENEFITS TO THE ORGANISATION
A low cost approach to improvement that
allows companies to:
MAIN BENEFITS OF CONTINUOUS IMPROVEMENT
• Low cost solutions based on data and common
sense
• Results measured against Quality, Cost and
delivery (QCD) indicators
• Improvements are continuous
• Employee involvement
• Immediate ROI
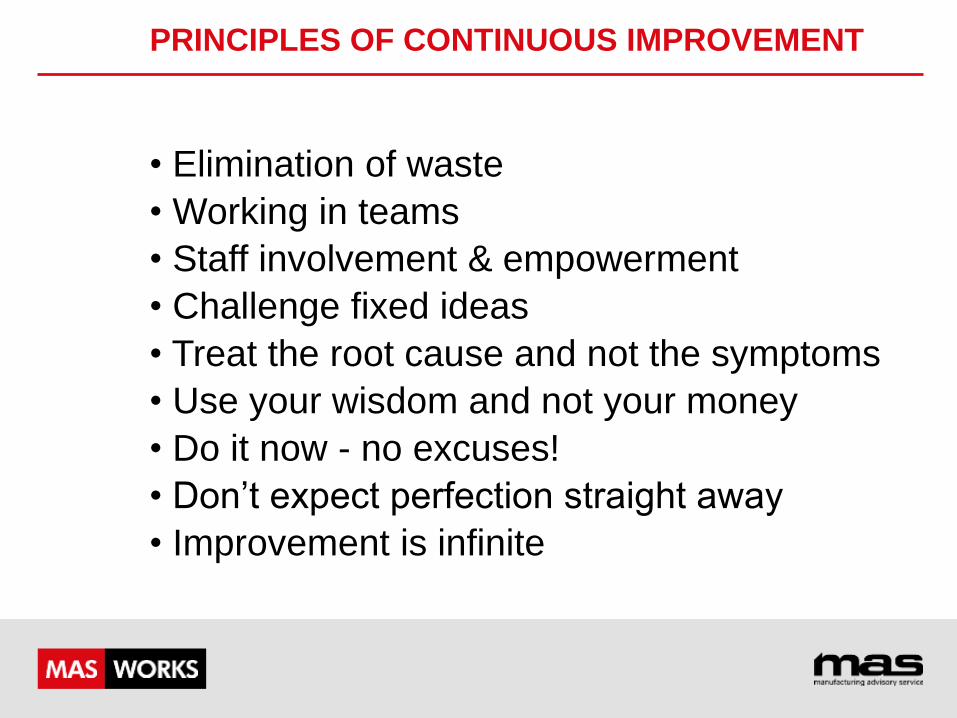
PRINCIPLES OF CONTINUOUS IMPROVEMENT
• Elimination of waste
• Working in teams
• Staff involvement & empowerment
• Challenge fixed ideas
• Treat the root cause and not the symptoms
• Use your wisdom and not your money
• Do it now - no excuses!
• Don’t expect perfection straight away
• Improvement is infinite
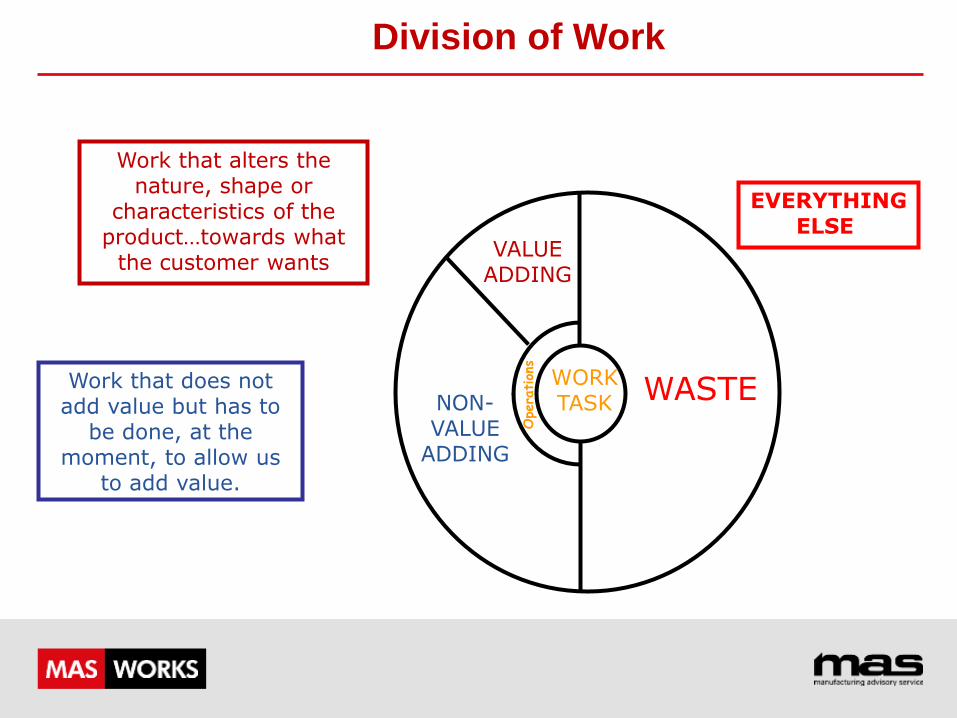
Division of Work
NON- VALUE
ADDING
VALUE ADDING
WASTE
Ope
ration
s
WORK TASK
Work that alters the nature, shape or
characteristics of the product…towards what
the customer wants
Work that does not add value but has to
be done, at the moment, to allow us
to add value.
EVERYTHING ELSE
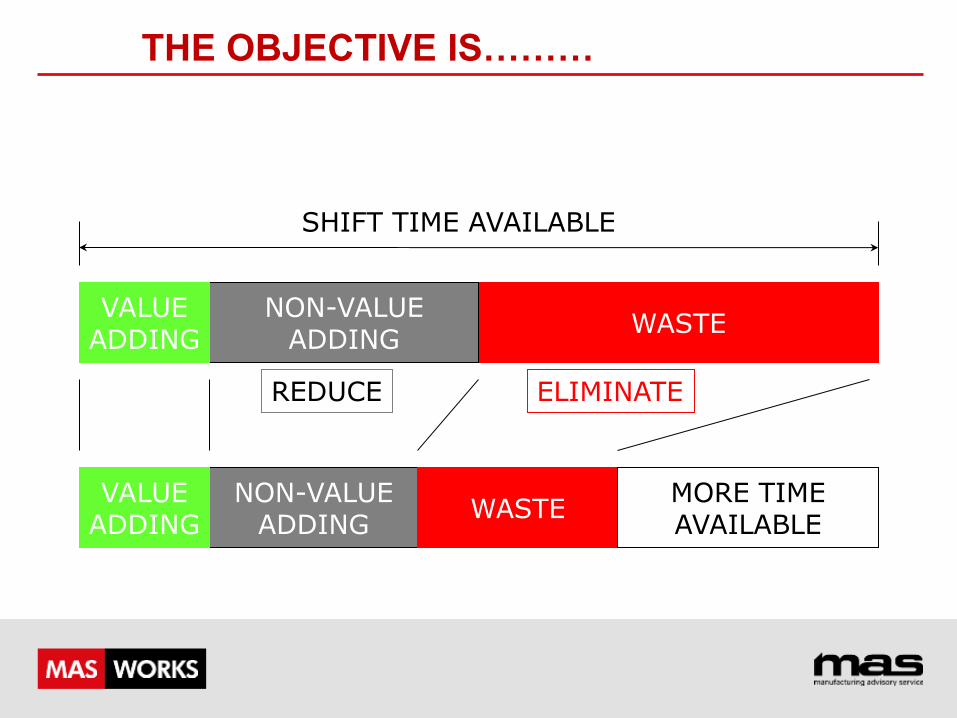
WASTE NON-VALUE
ADDING
NON-VALUE ADDING
VALUE ADDING
WASTE VALUE
ADDING MORE TIME AVAILABLE
SHIFT TIME AVAILABLE
REDUCE ELIMINATE
THE OBJECTIVE IS………
“Understanding & identifying waste is the first
step to reducing or eliminating waste”
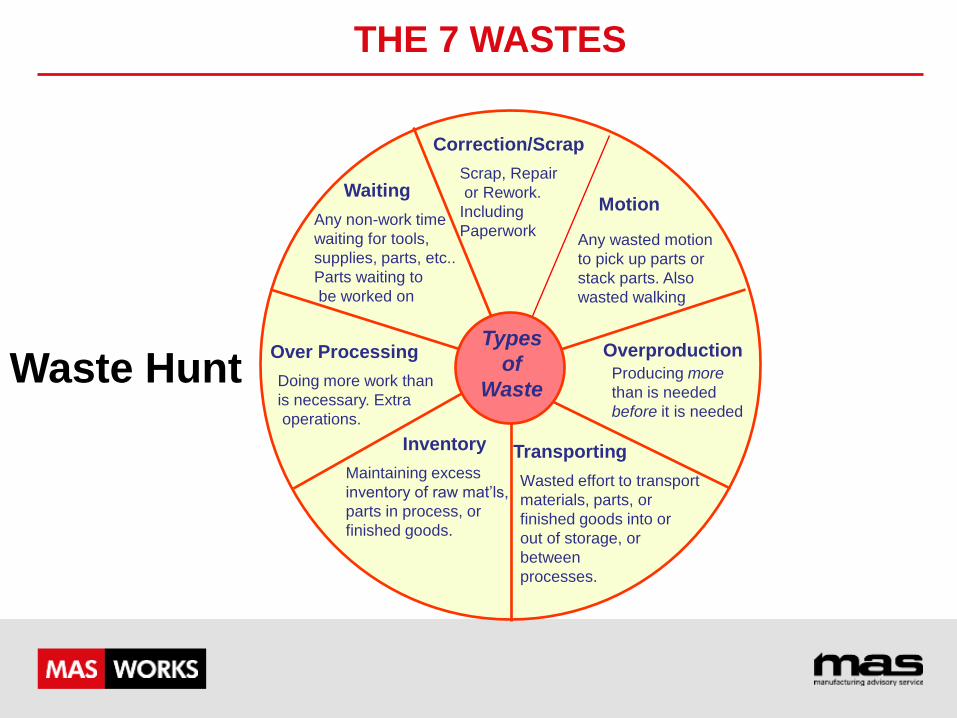
THE 7 WASTES
THE 7 WASTES
Correction/Scrap
Waiting
Over Processing
Motion
Inventory Transporting
Overproduction
Scrap, Repair
or Rework.
Including
Paperwork Any wasted motion
to pick up parts or
stack parts. Also
wasted walking
Wasted effort to transport
materials, parts, or
finished goods into or
out of storage, or
between
processes.
Producing more
than is needed
before it is needed
Maintaining excess
inventory of raw mat’ls,
parts in process, or
finished goods.
Doing more work than
is necessary. Extra
operations.
Any non-work time
waiting for tools,
supplies, parts, etc..
Parts waiting to
be worked on
Types
of
Waste Waste Hunt

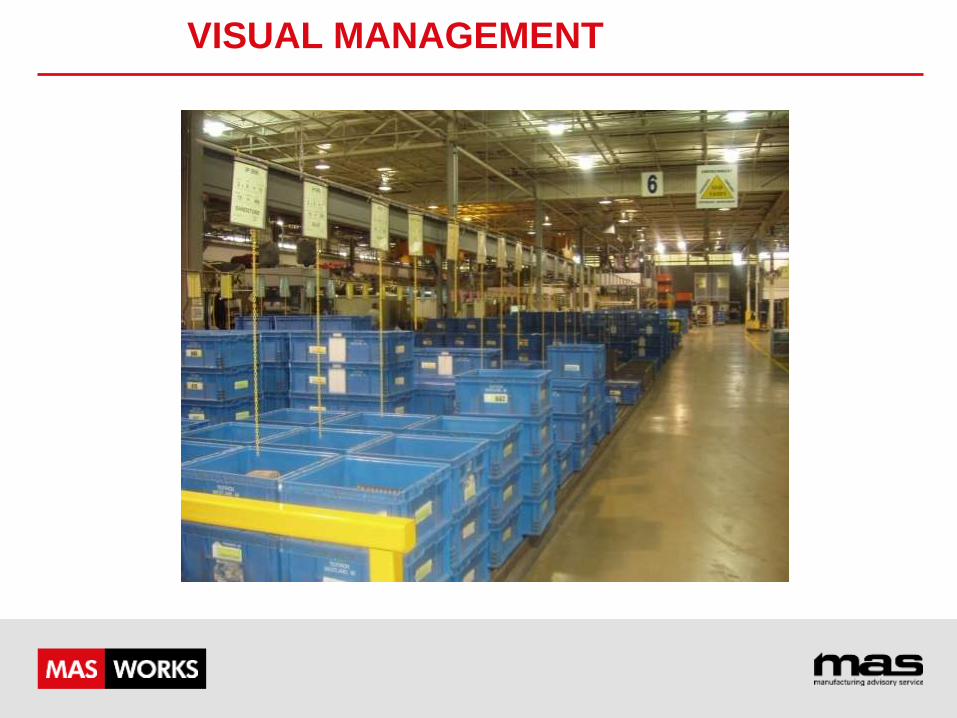
VISUAL MANAGEMENT
“Make your workplace into a showcase that can be easily understood by anyone at a glance” Taiichi Ohno
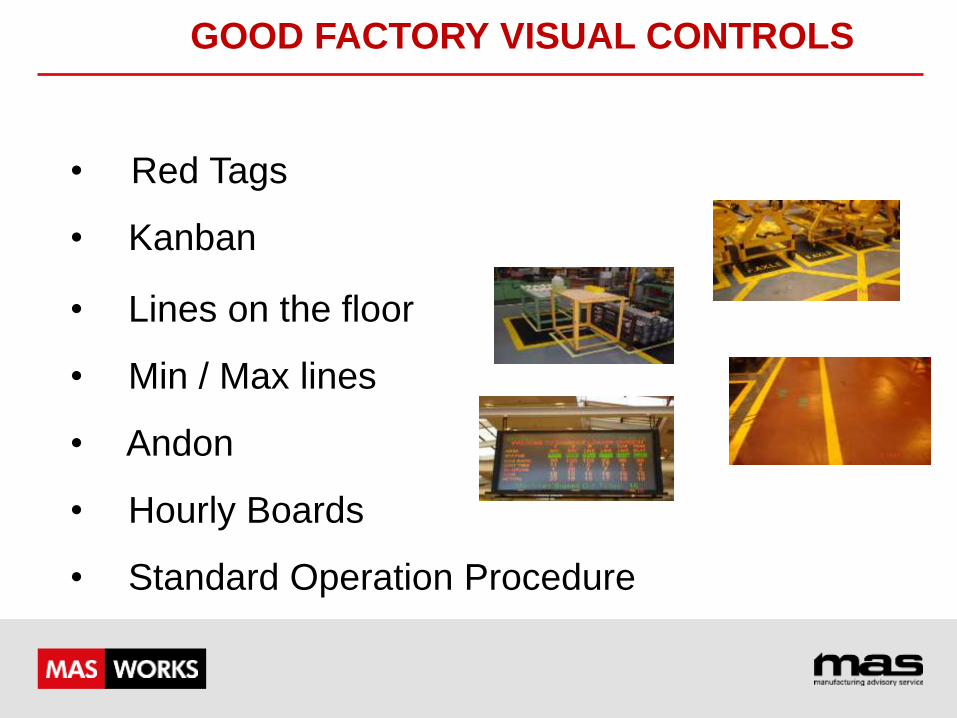
GOOD FACTORY VISUAL CONTROLS
• Red Tags
• Kanban
• Lines on the floor
• Min / Max lines
• Andon
• Hourly Boards
• Standard Operation Procedure
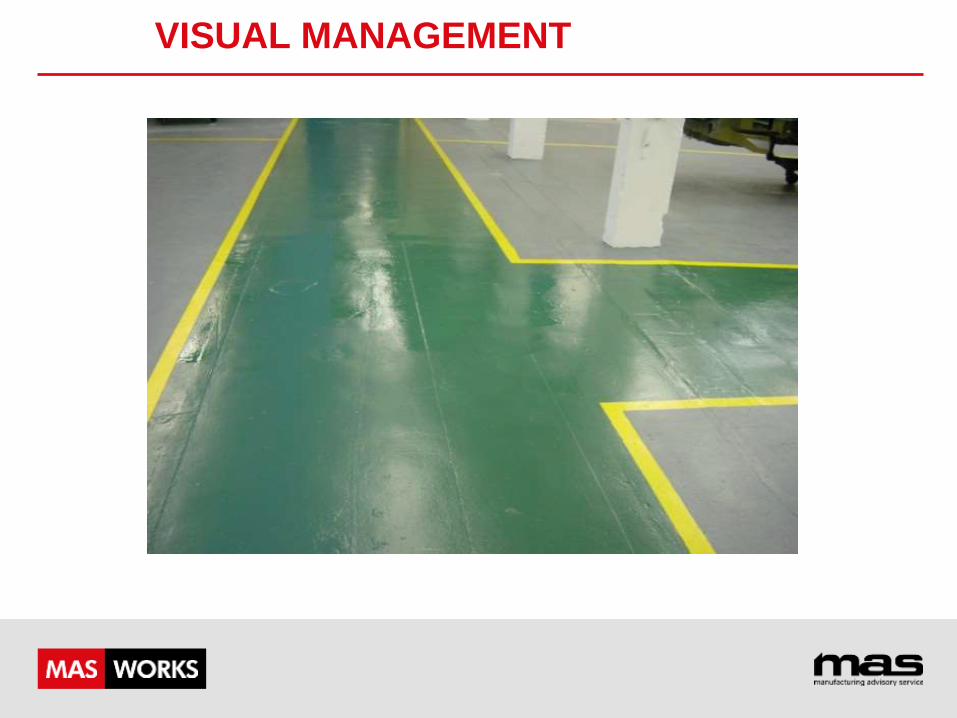
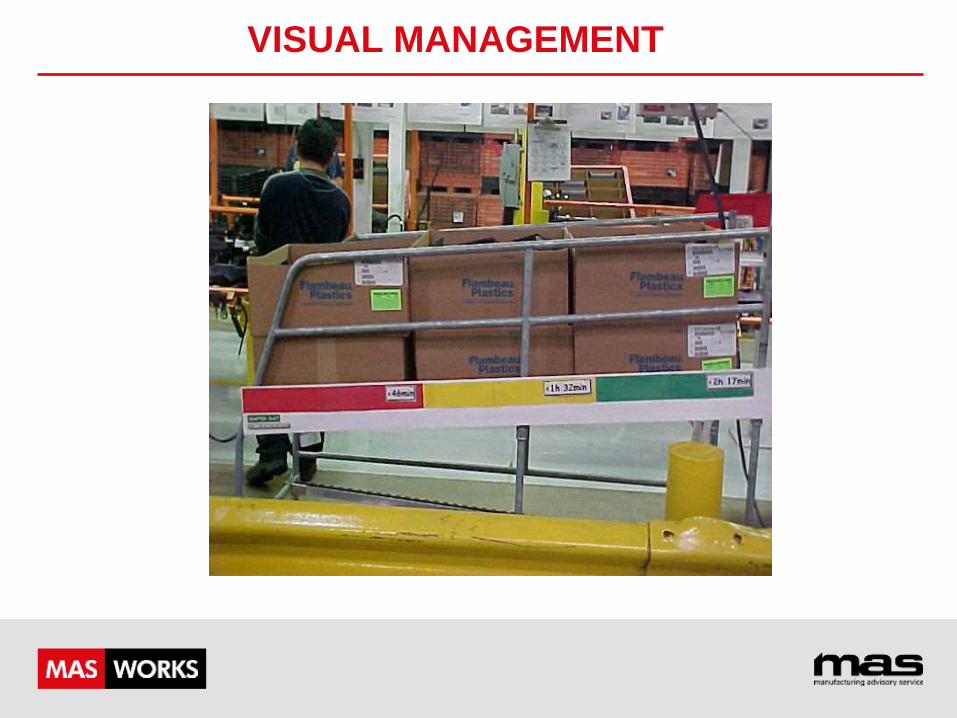
VISUAL MANAGEMENT
VISUAL MANAGEMENT
VISUAL MANAGEMENT
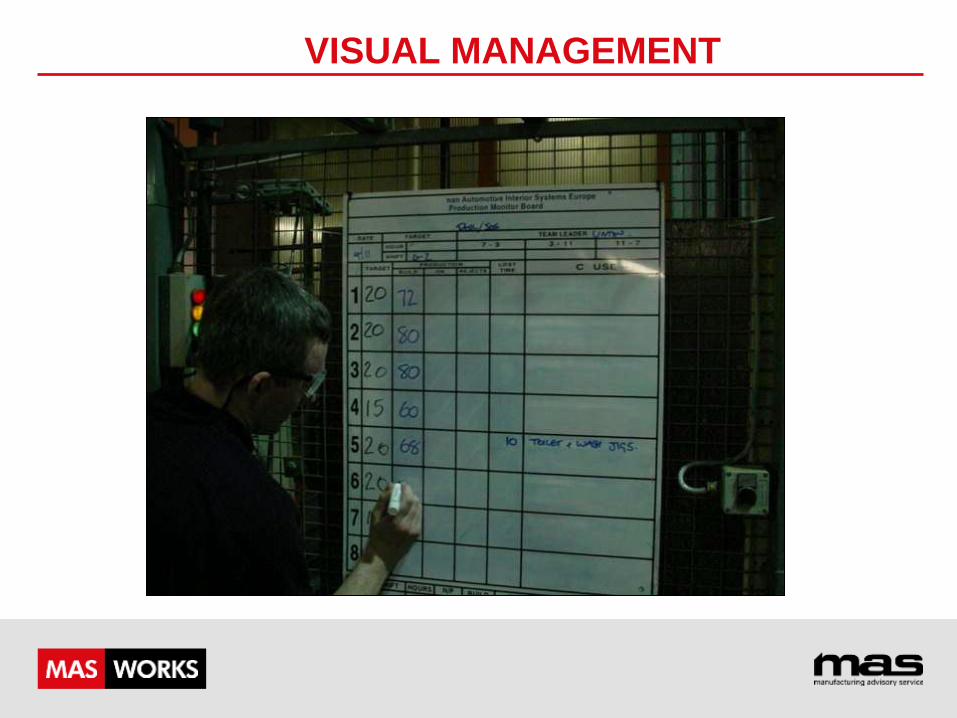
VISUAL MANAGEMENT
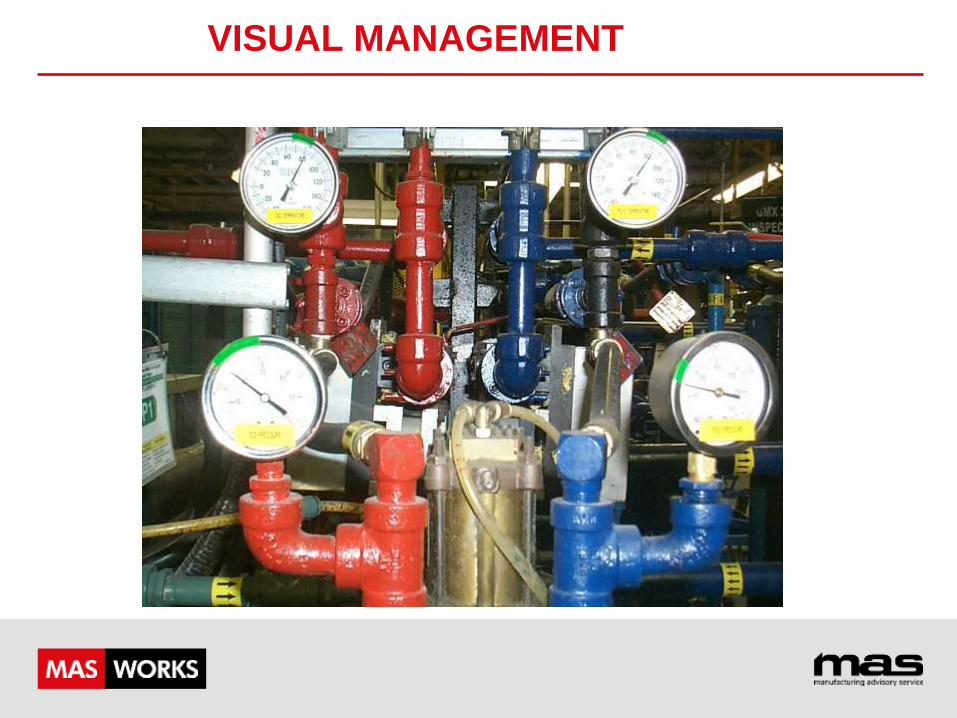
VISUAL MANAGEMENT
VISUAL MANAGEMENT
Beware :
Visual Management can be mis-interpreted
KANBAN
What is Kanban?
A simple, clear, visual method of:
Delivering WHAT is required.
Exactly WHEN required.
In the QUANTITY required.
A tool that:
• Supports Just In Time thinking.
• Is known as a PULL system.
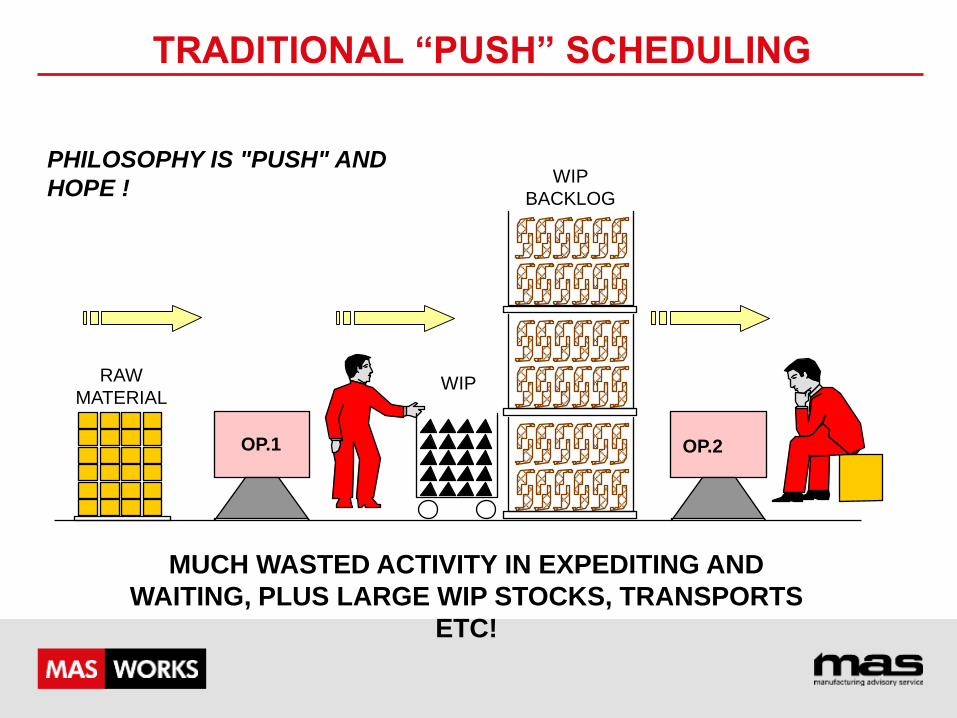
OP.1
RAW
MATERIAL WIP
WIP
BACKLOG
PHILOSOPHY IS "PUSH" AND
HOPE !
OP.2
TRADITIONAL “PUSH” SCHEDULING
MUCH WASTED ACTIVITY IN EXPEDITING AND
WAITING, PLUS LARGE WIP STOCKS, TRANSPORTS
ETC!
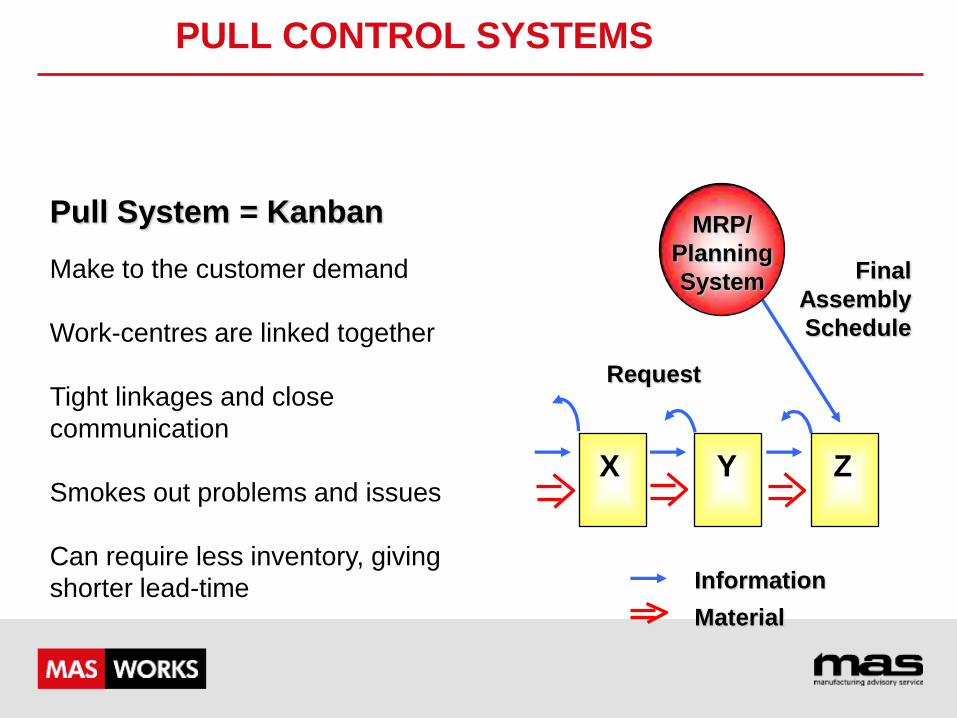
PULL CONTROL SYSTEMS
Information
Material
Pull System = Kanban
Make to the customer demand
Work-centres are linked together
Tight linkages and close
communication
Smokes out problems and issues
Can require less inventory, giving
shorter lead-time
X Y Z
Final
Assembly
Schedule
Request
MRP/
Planning
System
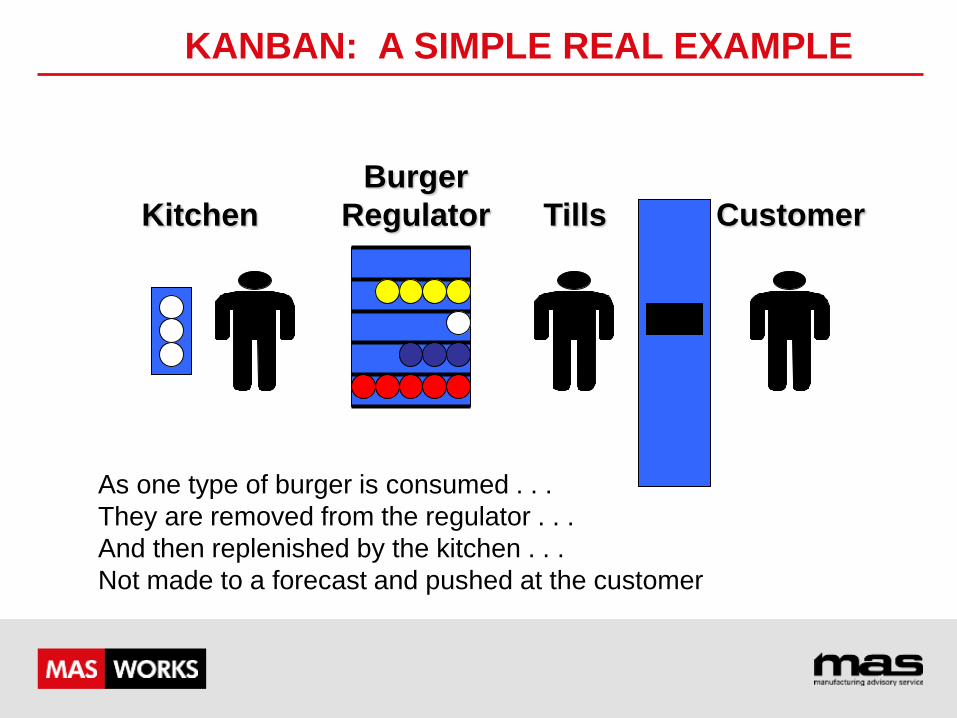
KANBAN: A SIMPLE REAL EXAMPLE
Customer Tills
Burger
Regulator Kitchen
As one type of burger is consumed . . .
They are removed from the regulator . . .
And then replenished by the kitchen . . .
Not made to a forecast and pushed at the customer
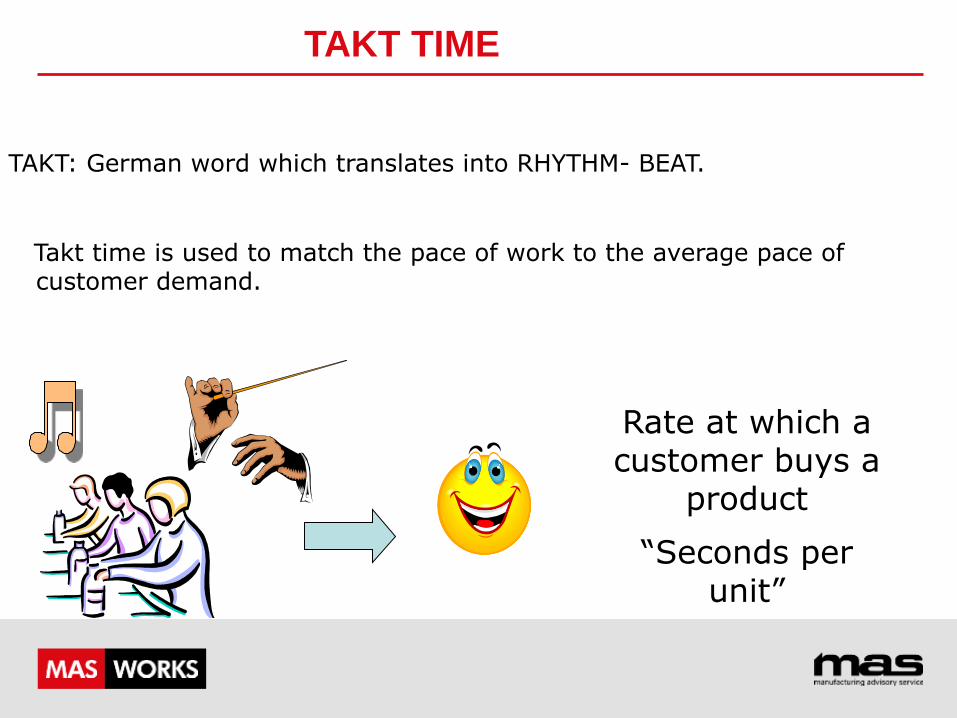
TAKT TIME
TAKT: German word which translates into RHYTHM- BEAT.
Takt time is used to match the pace of work to the average pace of customer demand.
Rate at which a customer buys a
product
“Seconds per unit”
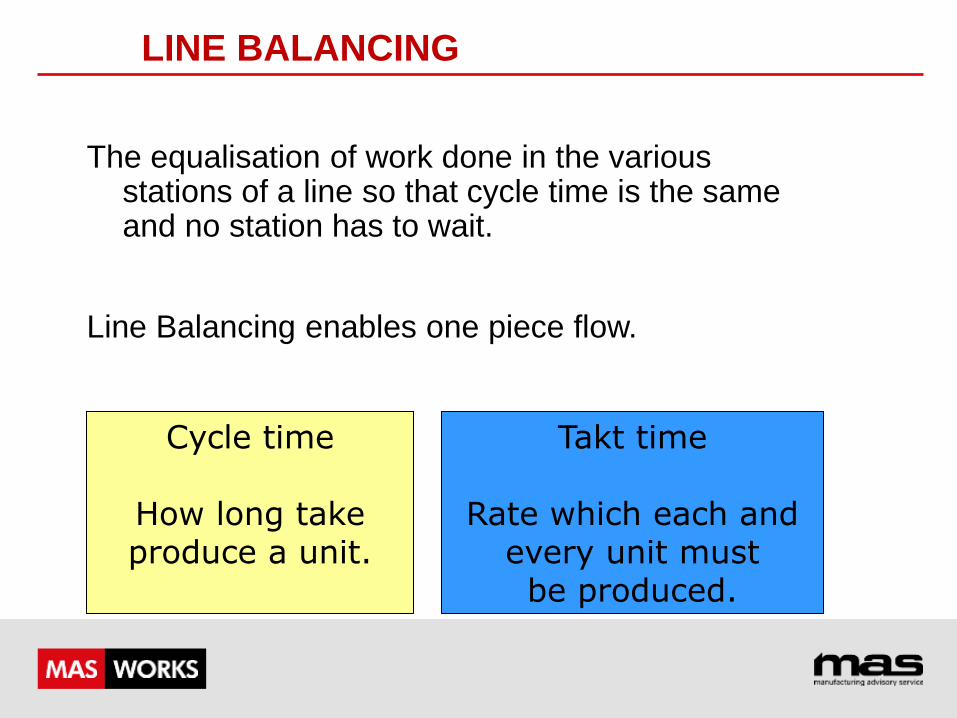
LINE BALANCING
The equalisation of work done in the various stations of a line so that cycle time is the same and no station has to wait.
Line Balancing enables one piece flow.
Cycle time
How long take produce a unit.
Takt time
Rate which each and every unit must be produced.
LINE BALANCING
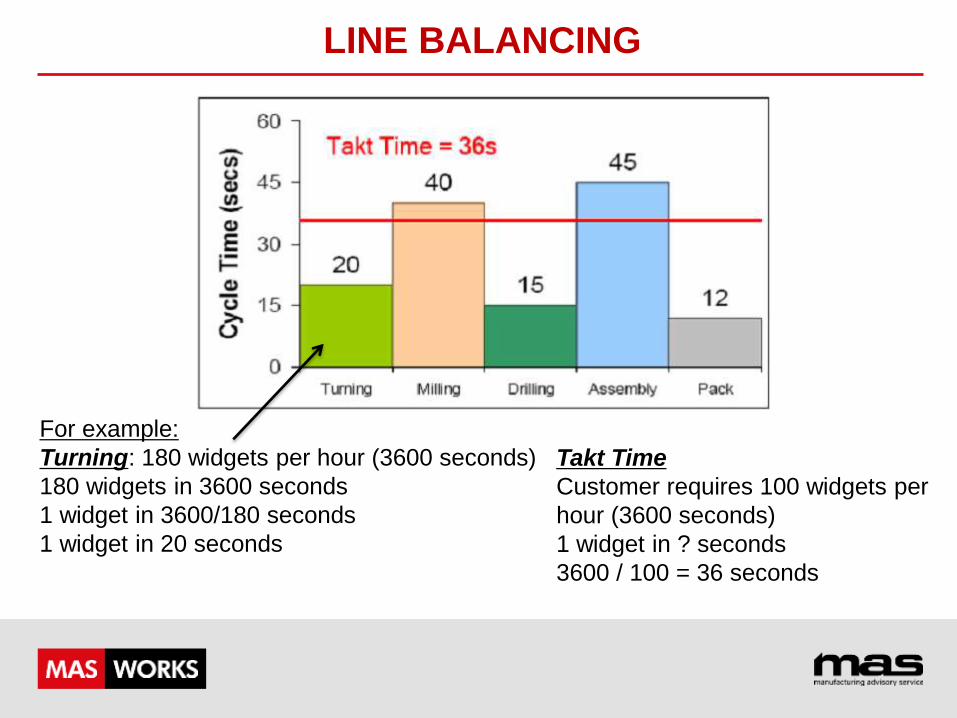
LINE BALANCING
For example:
Turning: 180 widgets per hour (3600 seconds)
180 widgets in 3600 seconds
1 widget in 3600/180 seconds
1 widget in 20 seconds
Takt Time
Customer requires 100 widgets per
hour (3600 seconds)
1 widget in ? seconds
3600 / 100 = 36 seconds
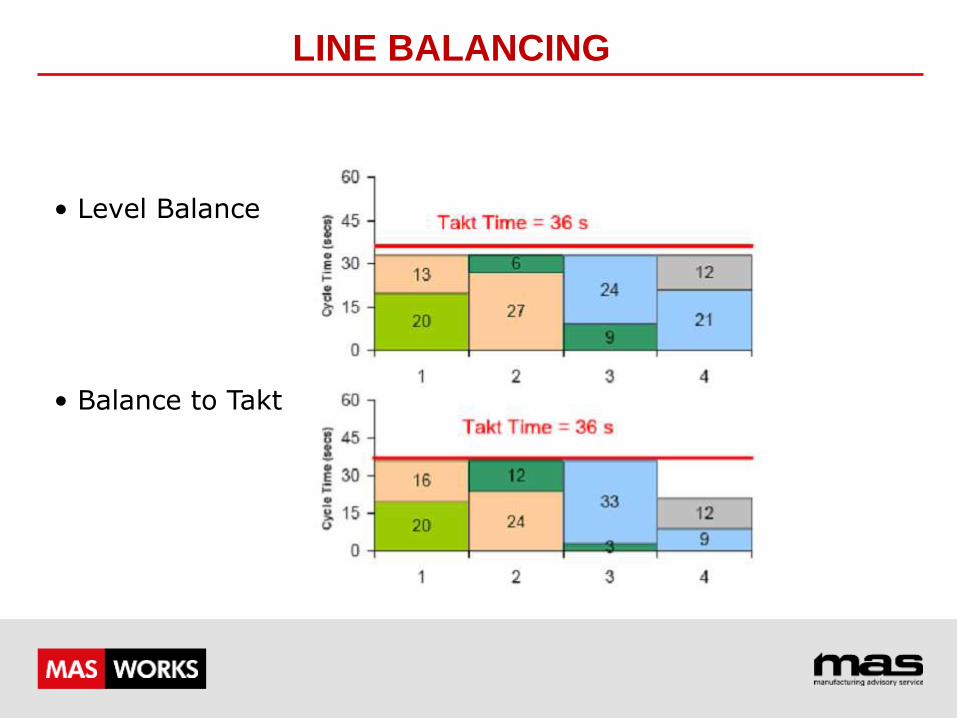
• Level Balance
• Balance to Takt
LINE BALANCING
• Eliminate waste • Re-sequence Operations • Change Layout – where necessary • Balance Line • This is a continuous cycle to achieve Customer and Cost requirements
SUMMARY
OVERVIEW OF WORKPLACE ORGANISATION
“A place for everything, and everything in its place”
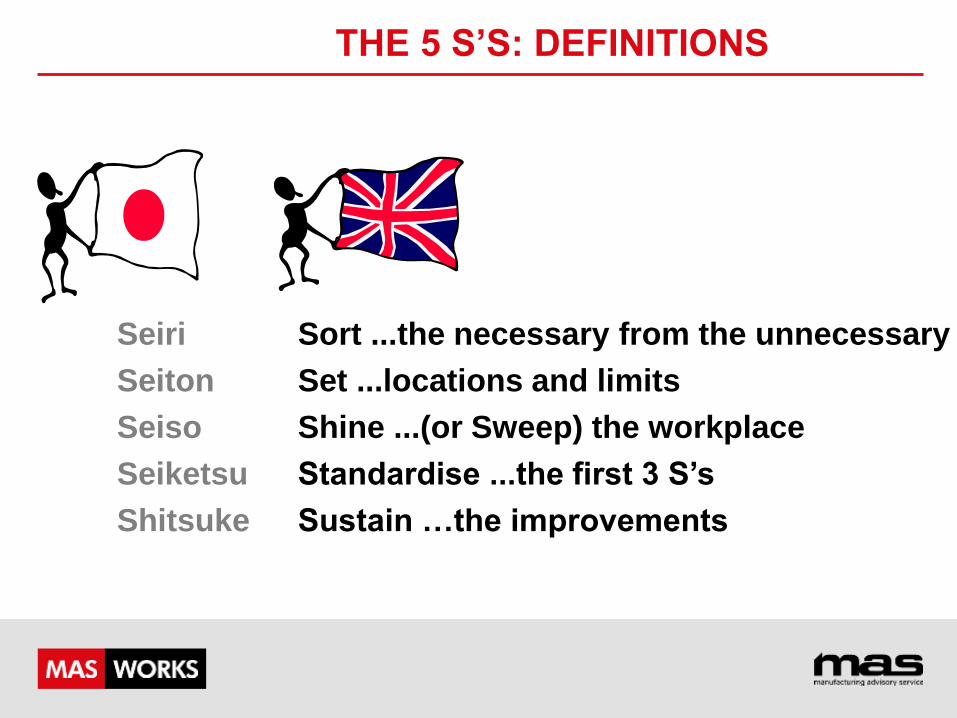
THE 5 S’S: DEFINITIONS
Seiri
Seiton
Seiso
Seiketsu
Shitsuke
Sort ...the necessary from the unnecessary
Set ...locations and limits
Shine ...(or Sweep) the workplace
Standardise ...the first 3 S’s
Sustain …the improvements
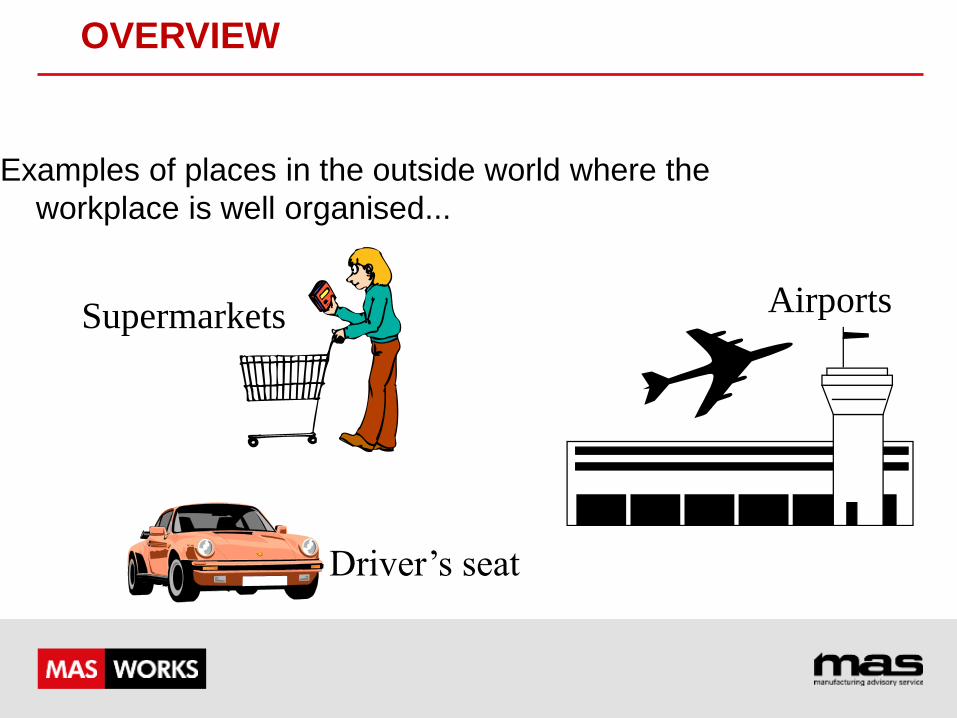
OVERVIEW
Examples of places in the outside world where the
workplace is well organised...
Airports Supermarkets
Driver’s seat
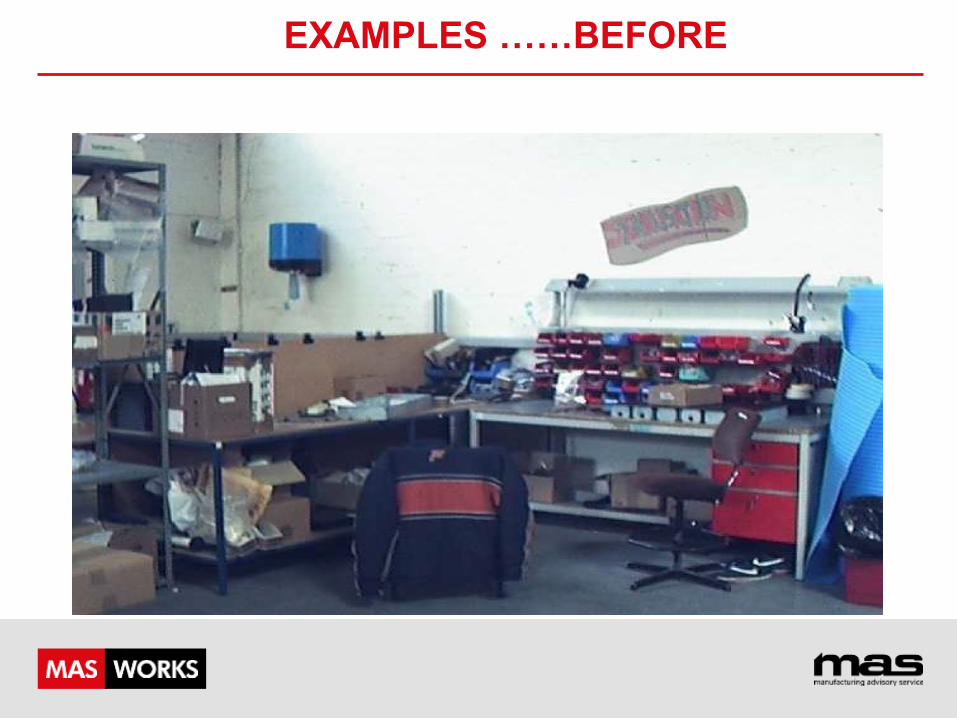
EXAMPLES ……BEFORE
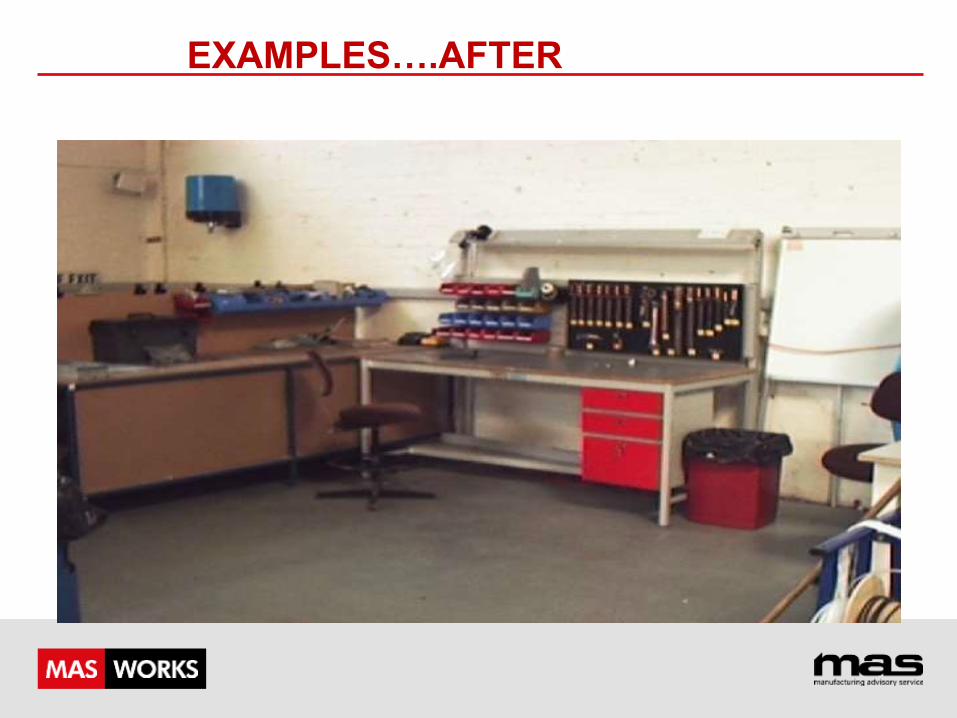
EXAMPLES….AFTER
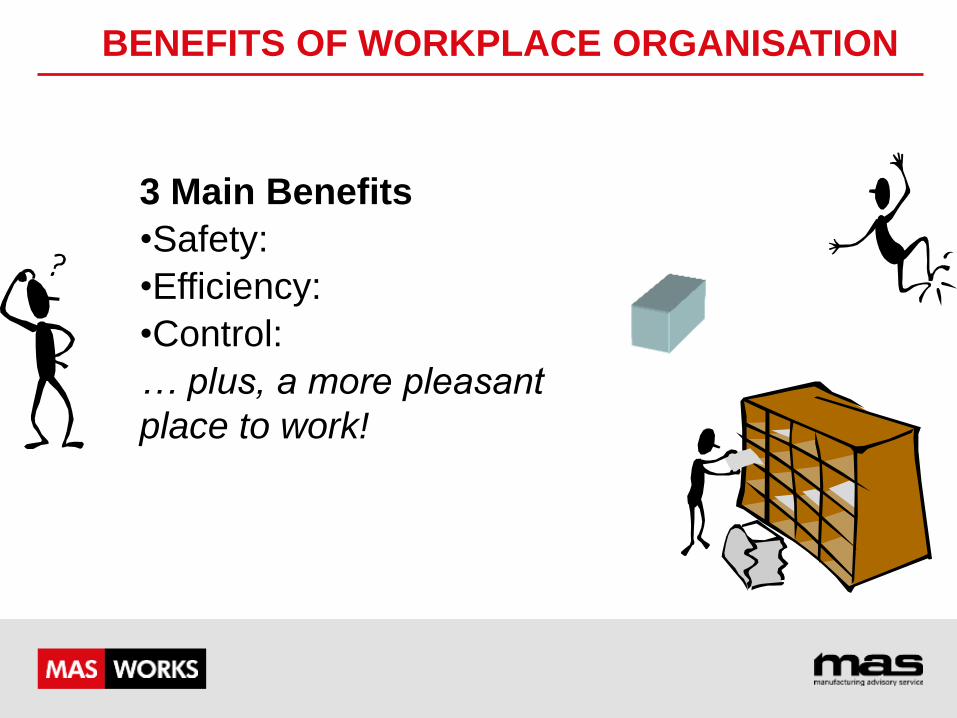
BENEFITS OF WORKPLACE ORGANISATION
3 Main Benefits
•Safety:
•Efficiency:
•Control:
… plus, a more pleasant
place to work!
•Establishes a standard within the Workplace.
•Better Environment.
•Effective production.
•Encourage Ownership and Teamwork.
•Customer Satisfaction & Peace of Mind.
WHY DO WE WANT 5S ?
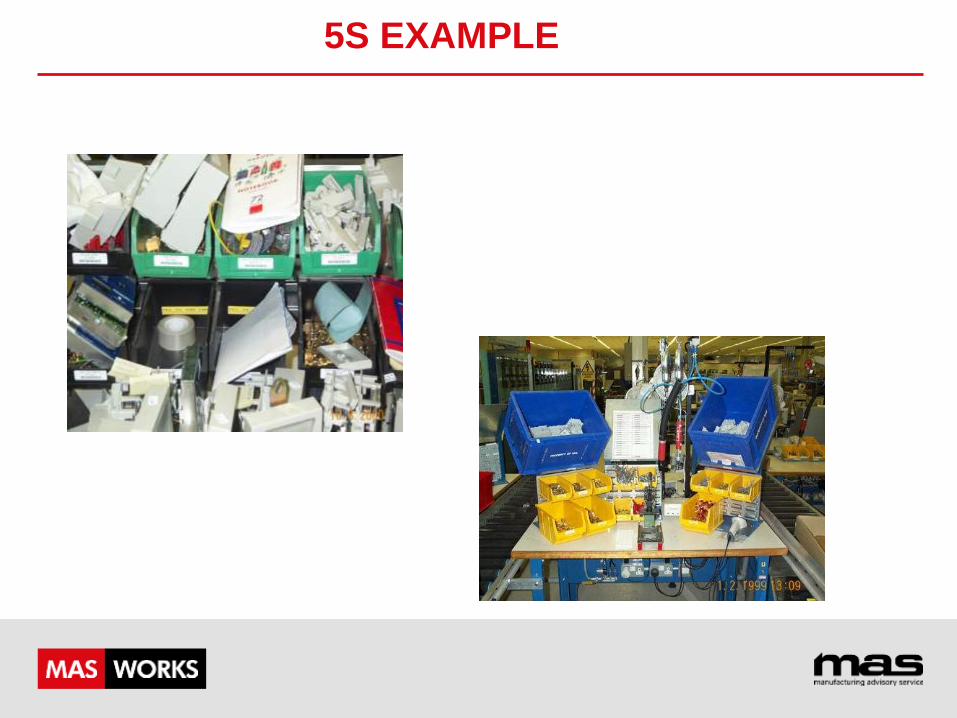
5S EXAMPLE
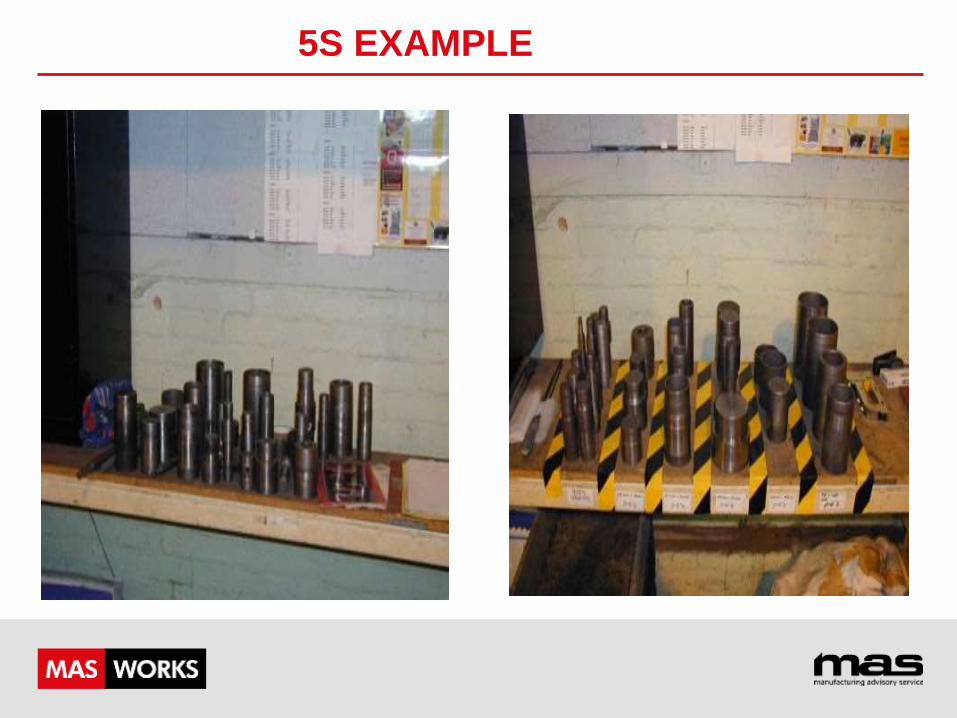
5S EXAMPLE
QUALITY, COST AND DELIVERY
Key Performance Indicators for an Organisation
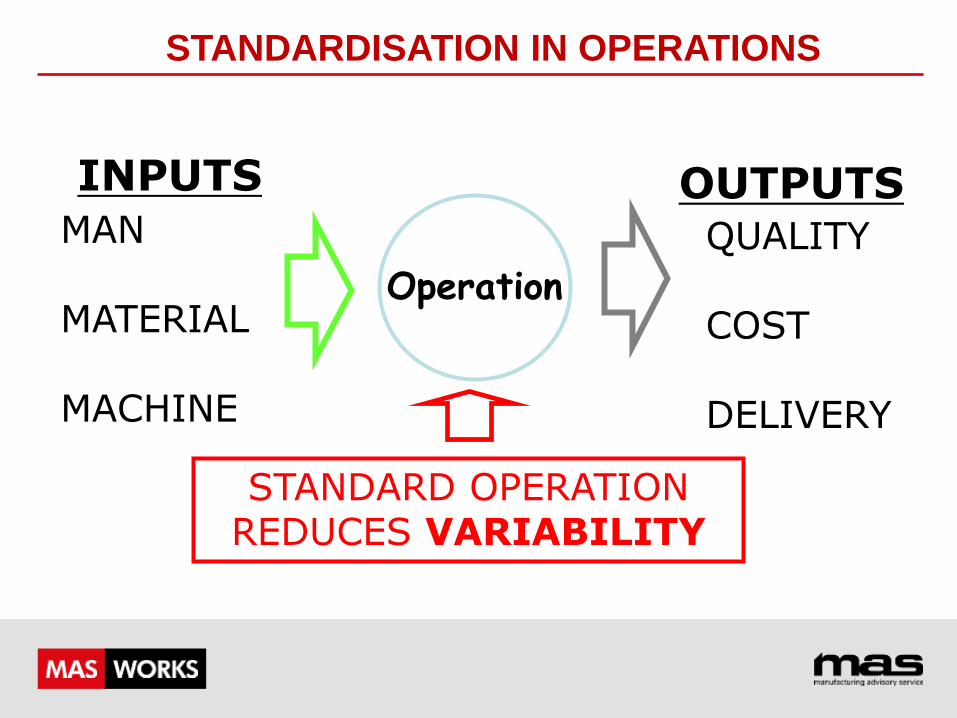
INPUTS OUTPUTS MAN MATERIAL MACHINE
QUALITY COST DELIVERY
Operation
STANDARD OPERATION REDUCES VARIABILITY
STANDARDISATION IN OPERATIONS
DATA ANALYSIS
DATA ANALYSIS, WHY ?
• Measure where we are now.
• Identify the focus for Improvement.
• Monitor the impact of improvement.
SPEAK WITH DATA !
KEY PERFORMANCE – 7 MEASURES OF QCD
Not Right First Time (NRFT)
Delivery Schedule Achievement (DSA)
People Productivity (PP)
Stock Turns (ST)
Overall Equipment Effectiveness (OEE)
Value Added Per Person (VAPP)
Floor Space Utilisation (FSU)
“A set of inter-related activities
through which specific inputs
and tasks produce
specific outputs.”
“PROCESS”
PROCESS MAPPING
Value Map •View the process from order to customer delivery
Process Map •Work on a level of detail within a box of the value map
Workload Map •This is the real in- depth detail. Observation forms, work load analysis and understanding the full timing data
•
HIERACHY OF MAPPING
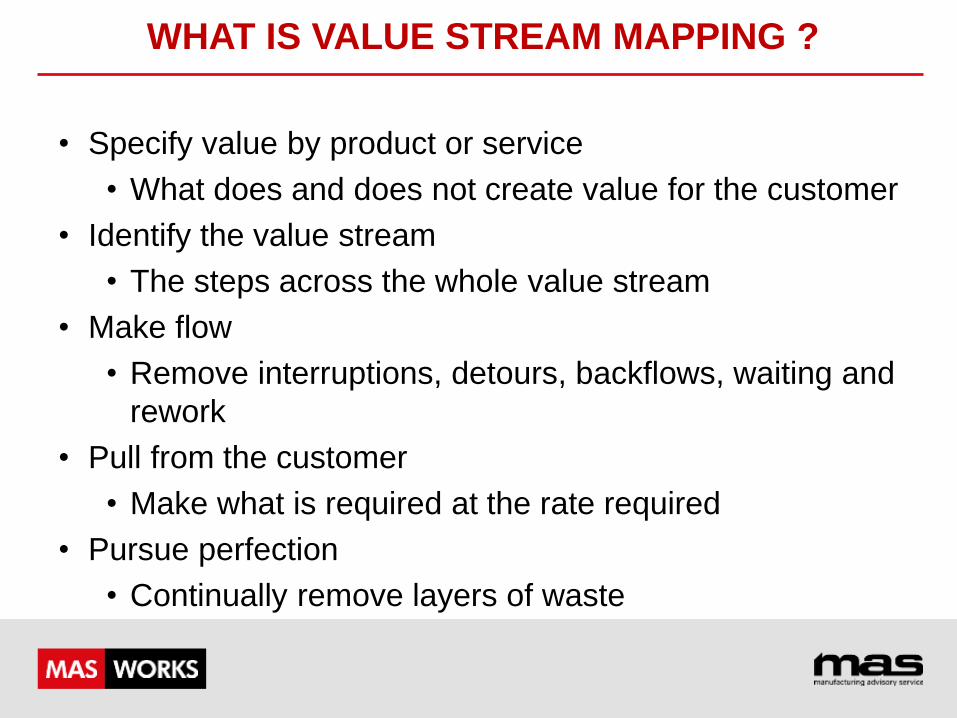
WHAT IS VALUE STREAM MAPPING ?
• Specify value by product or service
• What does and does not create value for the customer
• Identify the value stream
• The steps across the whole value stream
• Make flow
• Remove interruptions, detours, backflows, waiting and
rework
• Pull from the customer
• Make what is required at the rate required
• Pursue perfection
• Continually remove layers of waste
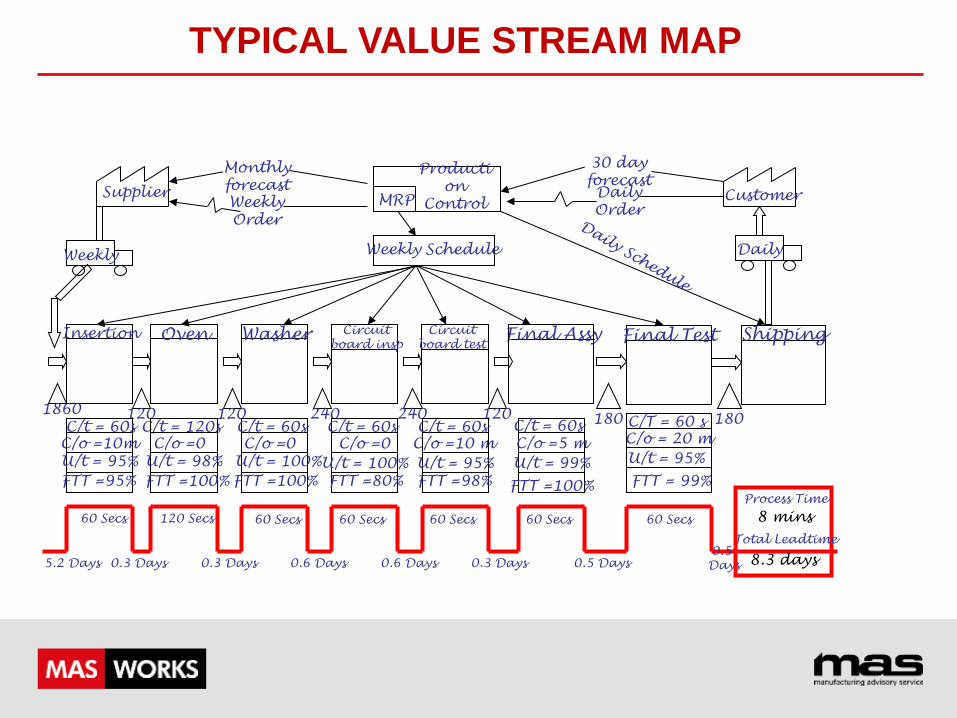
Shipping Final Test
C/T = 60 s
C/o = 20 m
U/t = 95%
FTT = 99%
Final Assy
180
Circuit
board test
Circuit
board insp
Washer Oven Insertion
120 240 240 120 120
C/t = 60s
C/o =5 m
U/t = 99%
FTT =100%
C/o =10 m
C/t = 60s
U/t = 95%
FTT =98%
C/t = 60s
C/o =0
U/t = 100%
FTT =80%
C/t = 60s
C/o =0
U/t = 100%
FTT =100%
C/t = 120s
C/o =0
U/t = 98%
FTT =100%
C/o =10m
C/t = 60s
U/t = 95%
FTT =95%
180
1860
Producti
on
Control MRP
Weekly Schedule
Customer
30 day
forecast
Daily
Order
Supplier
Weekly
Order
Monthly
forecast
Weekly Daily
5.2 Days 0.3 Days 0.3 Days 0.6 Days 0.6 Days 0.3 Days 0.5 Days
0.5
Days
60 Secs 120 Secs 60 Secs 60 Secs 60 Secs 60 Secs 60 Secs
Process Time
Total Leadtime
8 mins
8.3 days
TYPICAL VALUE STREAM MAP
FLOW PROCESS ANALYSIS
Is a diagnostic tool which visually illustrates
the flow of product or information through a
process.
It provides a visual overview of the
process – establishes the Current State.
It breaks the process down into 5
categories highlighting which activities
are Value Adding, Non-Value Adding and
Waste.
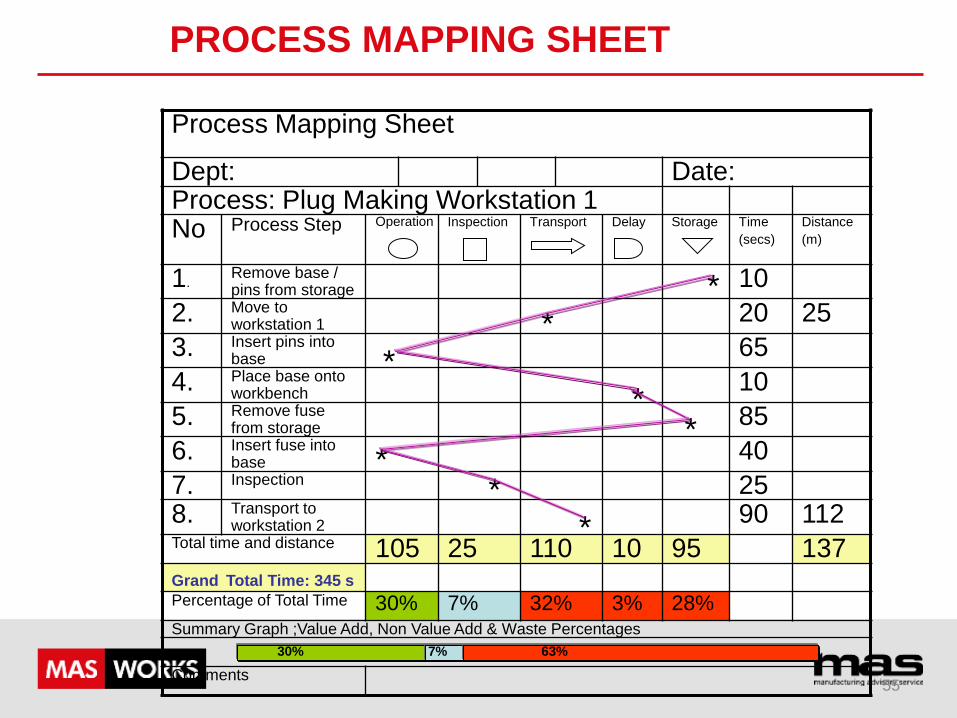
PROCESS MAPPING SHEET
Process Mapping Sheet
Dept: Date: Process: Plug Making Workstation 1 No Process Step Inspection
Transport
Delay
Storage
Time
(secs)
Distance
(m)
1. Remove base / pins from storage
10
2. Move to workstation 1
20 25
3. Insert pins into base
65
4. Place base onto workbench
10
5. Remove fuse from storage
85
6. Insert fuse into base
40
7. Inspection 25 8. Transport to
workstation 2 90 112
Total time and distance 105 25 110 10 95 137 Grand Total Time: 345 s
Percentage of Total Time 30% 7% 32% 3% 28% Summary Graph ;Value Add, Non Value Add & Waste Percentages
Comments
Operation
30% 7% 63%
*
*
*
* *
* *
*
55
IDENTIFYING IMPROVEMENT OPPORTUNITIES
Review the Process Mapping Sheet
• Look at the 3 categories of Waste: Delay, Transportation and Storage.
• Using Problem Solving Tools and Techniques determine the Root Cause of why these Wastes are occurring and generate improvement ideas.
• Identify whether there are any opportunities to reduce the Non-Value Adding element of Inspection.
BENEFITS OF LEAN ADOPTION
• Creates a better working environment
• Reduced turn round times
• Reduced work in progress
• Improved productivity
• Reduced floor space requirements
• Can be achieved with little capital investment
THANK YOU
for manufacturers
If you wish to book a review or to find out further
information about our workshops please come
and speak with me now…