Seth Wilkinson, President & Restoration Ecologist Wilkinson Ecological Design, Inc.
Upload
lamar-tateCategory
view
20download
1description

1
Richard WilkinsonEmeritus Professor of Social Epidemiology
University of Nottingham
&
Kate PickettProfessor of Epidemiology
University of York
http://www.equalitytrust.org.uk

2
Income per head and life-expectancy: rich & poor countries
Source: Wilkinson & Pickett, The Spirit Level (2009) www.equalitytrust.org.uk

3
Among the rich countries life expectancy is not related to national differences in average income
Source: Wilkinson & Pickett, The Spirit Level (2009) www.equalitytrust.org.uk

4
…but life expectancy is related to income within rich societies
Source: Wilkinson & Pickett, The Spirit Level (2009)
70
71
72
73
74
75
76
77
78
79
80
Electoral wards in England & Wales by deprivation score
Life
exp
ecta
ncy
(yea
rs)
www.equalitytrust.org.uk

5
How much richer are the richest 20% than the poorest 20%?
www.equalitytrust.org.ukSource: Wilkinson & Pickett, The Spirit Level (2009)

6

7
Index of: • Life expectancy• Math & Literacy • Infant mortality• Homicides• Imprisonment• Teenage births • Trust• Obesity• Mental illness – incl.
drug & alcohol addiction
• Social mobility
Health and Social Problems are Worse in More Unequal Countries
Source: Wilkinson & Pickett, The Spirit Level (2009) www.equalitytrust.org.uk

8
Health and Social Problems are not Related to Average Income in Rich Countries
Index of: • Life expectancy• Math & Literacy • Infant mortality• Homicides• Imprisonment• Teenage births • Trust• Obesity• Mental illness – incl.
drug & alcohol addiction
• Social mobility
Source: Wilkinson & Pickett, The Spirit Level (2009) www.equalitytrust.org.uk

9
Child Well-being is Better in More Equal Rich Countries
Source: Wilkinson & Pickett, The Spirit Level (2009) www.equalitytrust.org.uk

10
Child-Wellbeing is Unrelated to Average Incomes in Rich Countries
Source: Wilkinson & Pickett, The Spirit Level (2009) www.equalitytrust.org.uk

11
Levels of Trust are Higher in More Equal Rich Countries
Source: Wilkinson & Pickett, The Spirit Level (2009)

12
Levels of Trust are Higher in More Equal US States
Source: Wilkinson & Pickett, The Spirit Level (2009) www.equalitytrust.org.uk
13
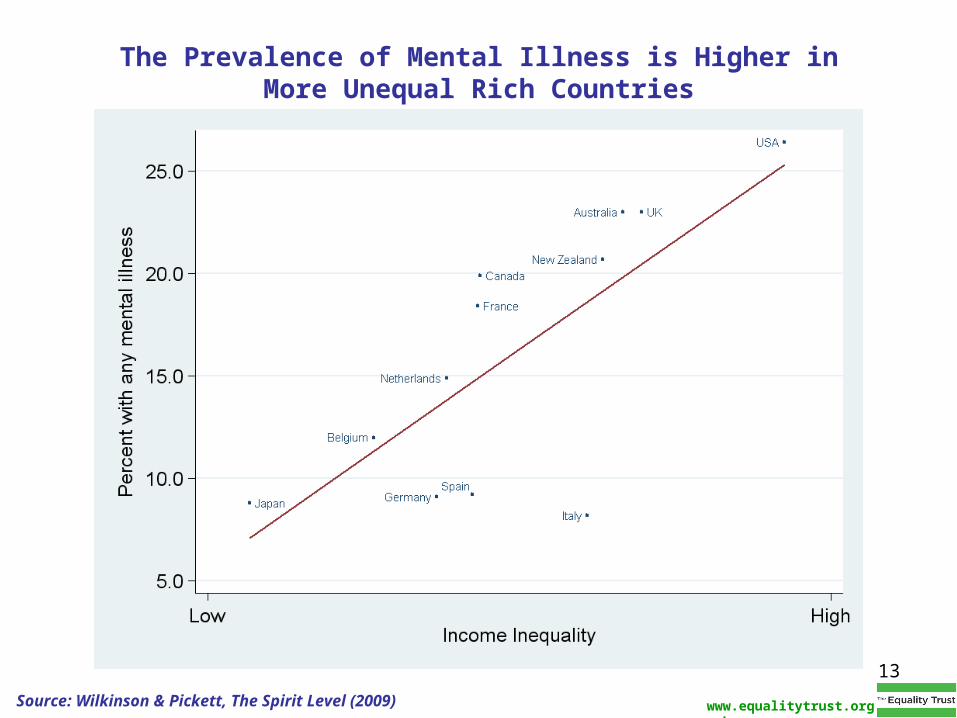
The Prevalence of Mental Illness is Higher in More Unequal Rich Countries
Source: Wilkinson & Pickett, The Spirit Level (2009) www.equalitytrust.org.uk

14
Drug Use is More Common in More Unequal Countries
Source: Wilkinson & Pickett, The Spirit Level (2009)
Index of use of: opiates, cocaine, cannabis, ecstasy, amphetamines
www.equalitytrust.org.uk

15
Infant Mortality Rates are Higher in More Unequal Countries
Source: Wilkinson & Pickett, The Spirit Level (2009) www.equalitytrust.org.uk
16
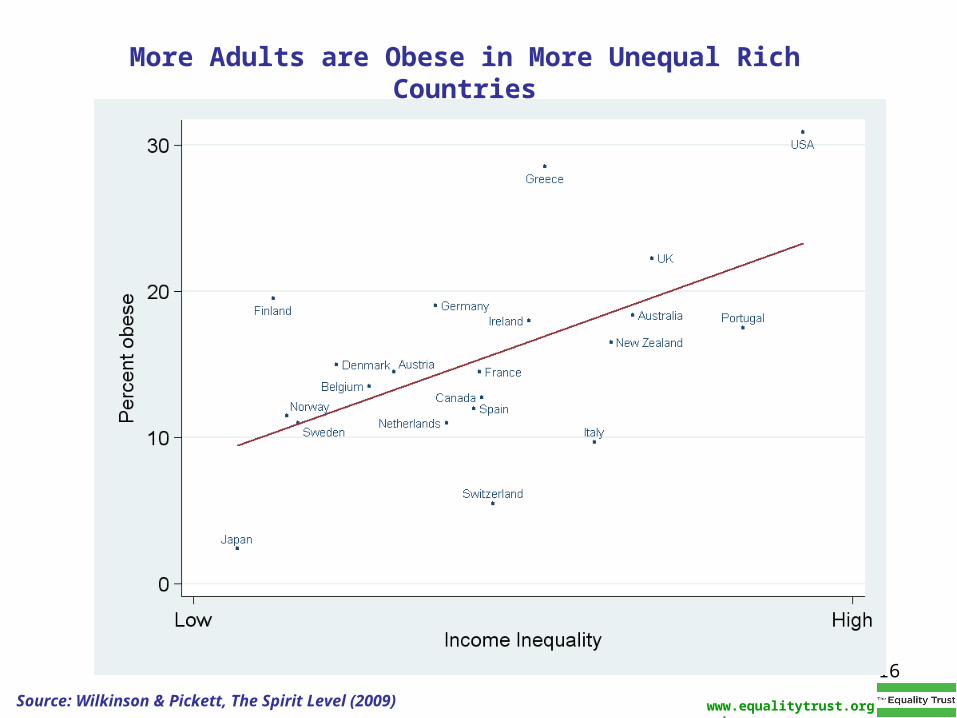
More Adults are Obese in More Unequal Rich Countries
Source: Wilkinson & Pickett, The Spirit Level (2009) www.equalitytrust.org.uk
17
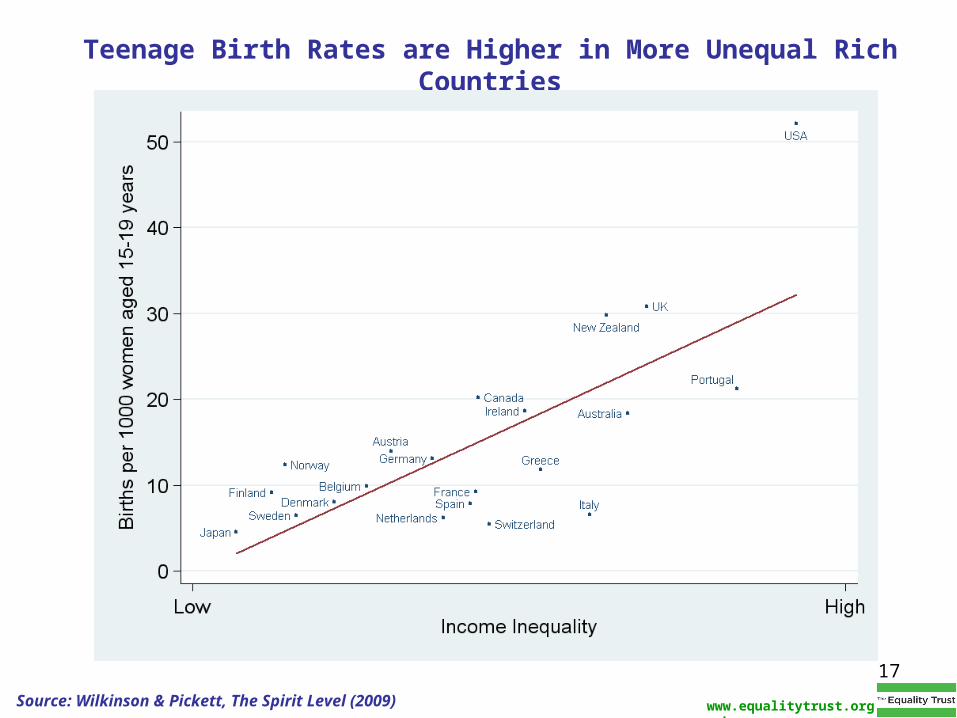
Teenage Birth Rates are Higher in More Unequal Rich Countries
Source: Wilkinson & Pickett, The Spirit Level (2009) www.equalitytrust.org.uk

18
Homicide and income inequality: US States and Canadian Provinces
0
30
60
90
120
150
180
0.35 0.38 0.41 0.44 0.47
Income Inequality (Gini)
Ho
mic
ide
s p
er
mill
ion
pe
op
le
More equal More unequal
Source: Daly M, Wilson M, Vasdev S. Income inequality and homicide rates in Canada and the United States. Canadian Journal of Criminology 2001; 43: 219-36.
19
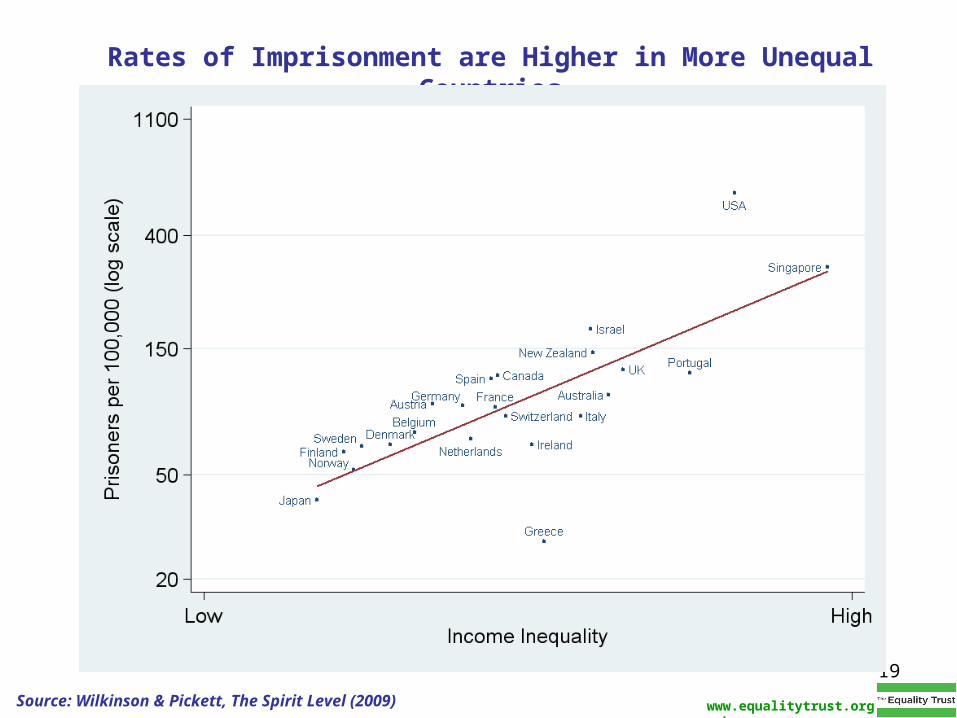
Rates of Imprisonment are Higher in More Unequal Countries
Source: Wilkinson & Pickett, The Spirit Level (2009) www.equalitytrust.org.uk
20
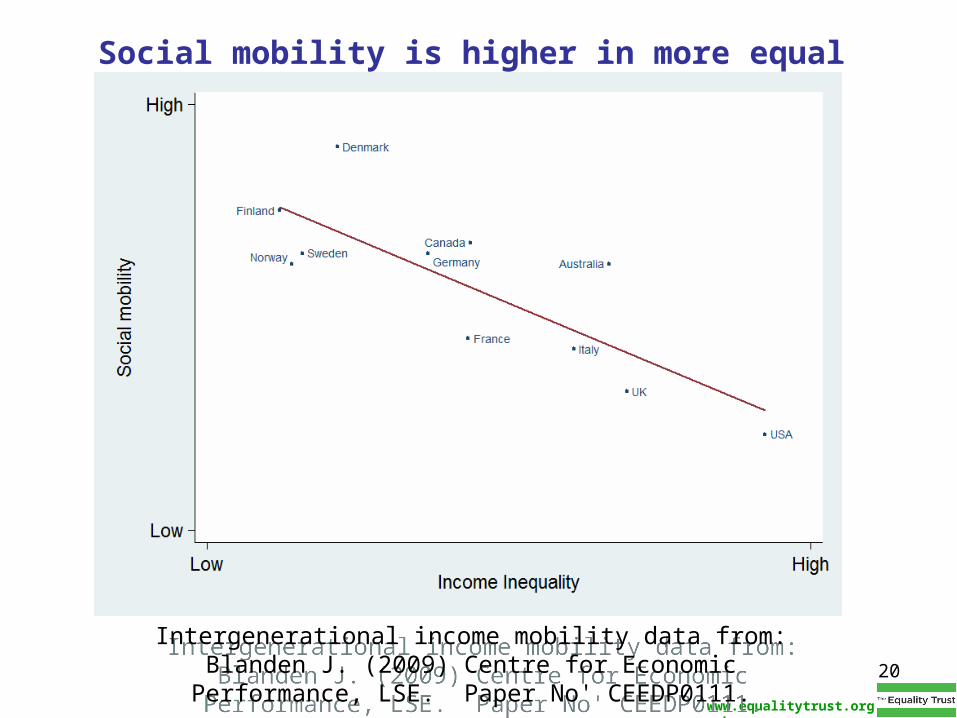
Social mobility is higher in more equal countries
www.equalitytrust.org.uk
Intergenerational income mobility data from: Blanden J. (2009) Centre for Economic Performance, LSE. Paper No' CEEDP0111.
Intergenerational income mobility data from: Blanden J. (2009) Centre for Economic Performance, LSE. Paper No' CEEDP0111.

21
Almost everyone benefits from greater equality.
Usually the benefits are greatest among the poor but extend to the majority of the population

22
Infant Mortality by Social Class: Sweden and England & Wales
0
2
4
6
8
10
12
14
16
18
I II IIIN IIIM IV V SinglePrnt
Unclass.
E & W
Sweden
Source: Leon DA, Vagero D, Olausson PO. BMJ 1992; 305; 687-91
Infa
nt
Mo
rta
lity
rate

23
Literacy Scores of 16-25 year olds by Parents' Education
-1.5
-1
-0.5
0
0.5
1
2 3 4 5 6 7 8 9 10 11 12 13 14 15 16 17
Parents' Education (years)
Lit
era
cy
sc
ore
Sweden
Canada
United States
Source: Willms JD. 1997. Data from OECD Programme for International Student Assessment.

24
Index of: • Life expectancy• Math & Literacy • Infant mortality• Homicides• Imprisonment• Teenage births • Trust• Obesity• Mental illness – incl.
drug & alcohol addiction
• Social mobility
Health and Social Problems are Worse in More Unequal Countries
Source: Wilkinson & Pickett, The Spirit Level (2009) www.equalitytrust.org.uk
25
Why are we so sensitive to inequality?
26
Psychosocial risk factors for ill health
Low social status
Weak social affiliations
Stress in early life (pre- and postnatally)

27
ACTH
Cortisol
Tasks with both social-evaluative
threat and uncontrollability
Other tasks
Eff
ect
size
Source: Dickerson SS & Kemeny ME. Psychological Bulletin 2004; 130(3): 355-91
What kind of stress most reliably raises cortisol levels?

28
Stereotype Threat
The effect of caste identity on children's performance
Caste Unannounced
Caste Announced
0
1
2
3
4
5
6
High Caste
Low Caste
Num
ber
of m
azes
sol
ved
Source: Hoff K, Pandey P, World Bank Policy Research Working Paper 3351, June 2004

29
Gilligan J. Violence: Our Deadly Epidemic and its Causes. (G .P. Putnam 1996)
" ...the prison inmates I work with have told me repeatedly, when I asked them why they had assaulted someone, that it was because 'he disrespected me', or 'he disrespected my visit' (meaning 'visitor'). The word 'disrespect' is central in the vocabulary, moral value system, and psychodynamics of these chronically violent men that they have abbreviated it into the slang term, 'he dis'ed me." p.106
A few pages further on Gilligan continues:- "I have yet to see a serious act of violence that was not provoked by the experience of feeling shamed and humiliated, disrespected and ridiculed, and that did not represent the attempt to prevent or undo this "loss of face " - no matter how severe the punishment, even if it includes death." p.110

30
Source: Bowles S, Park Y. Economic Journal 2005; 115 (507): F397–F412. 2005.
Working hours are longer in more unequal countries

31
More equal countries are more generous foreign aid donors
32
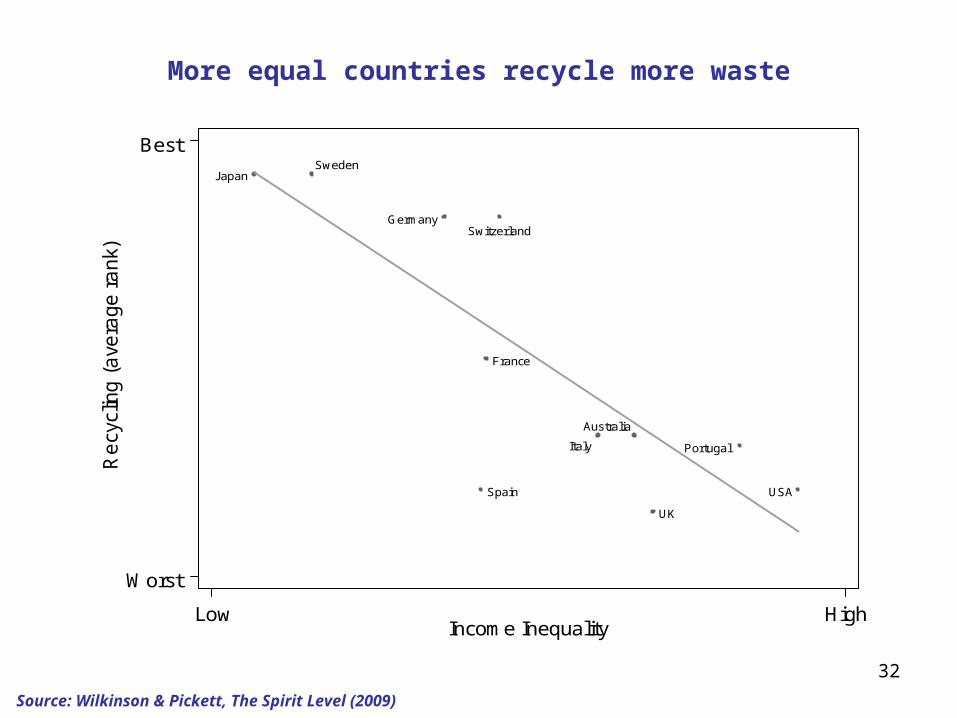
More equal countries recycle more waste
Source: Wilkinson & Pickett, The Spirit Level (2009)
Australia
France
Germany
Italy
Japan
Portugal
Spain
Sweden
Switzerland
UK
USA
Best
Worst
Re
cycl
ing
(a
vera
ge
ra
nk)
Low HighIncome Inequality
33
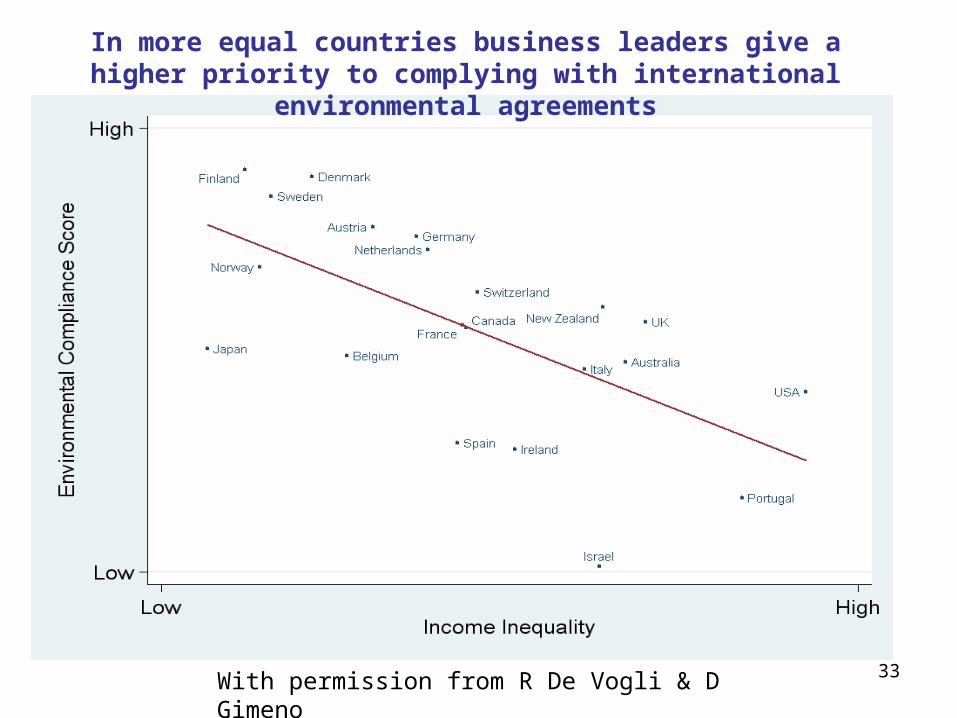
In more equal countries business leaders give a higher priority to complying with international environmental agreements
With permission from R De Vogli & D Gimeno

34
35
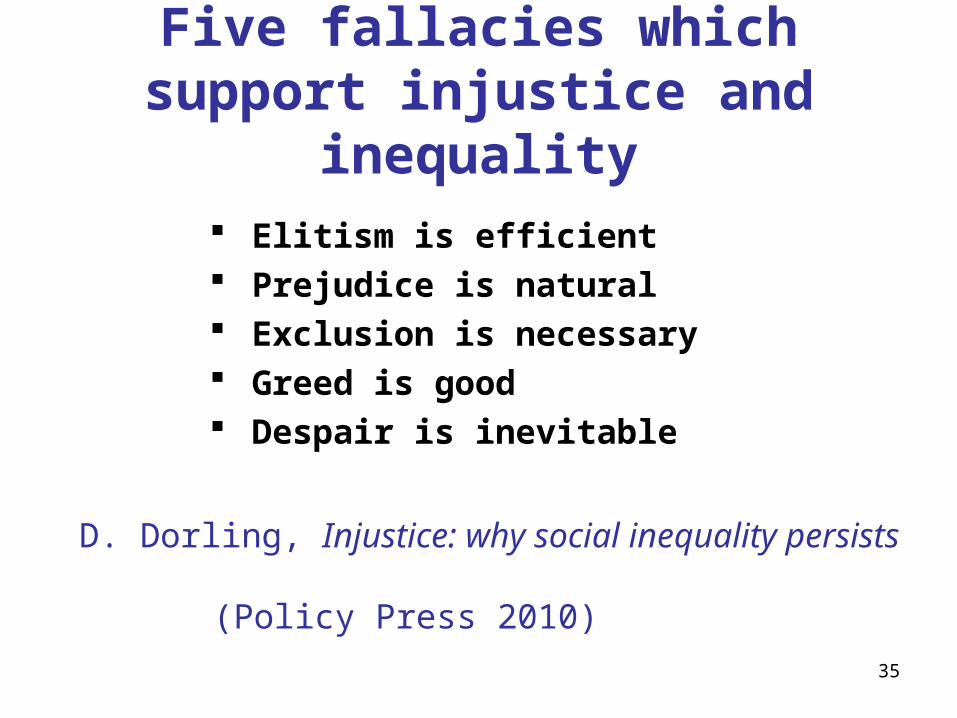
Five fallacies which support injustice and inequality
Elitism is efficient Prejudice is natural Exclusion is necessary Greed is good Despair is inevitable
D. Dorling, Injustice: why social inequality persists (Policy Press 2010)
36
http://www.equalitytrust.org.uk
For more information:
… a book
and a website…

37
Australia
Austria
Belgium Canada
Denmark
Finland
France
Germany
Greece
Ireland
Israel
Italy
Japan
Netherlands
New Zealand
Norway
Portugal
Spain
Sweden
UK
USA
Worse
Better
UN
ICE
F in
dex
of c
hild
wel
l-bei
ng
0 10 20 30Lone parents as % of all households with dependent children
Single parents and child wellbeing
38
The effects of inequality - a two stage process
1. adult experience of inequality
2. passed on to children – epigenetics?
39
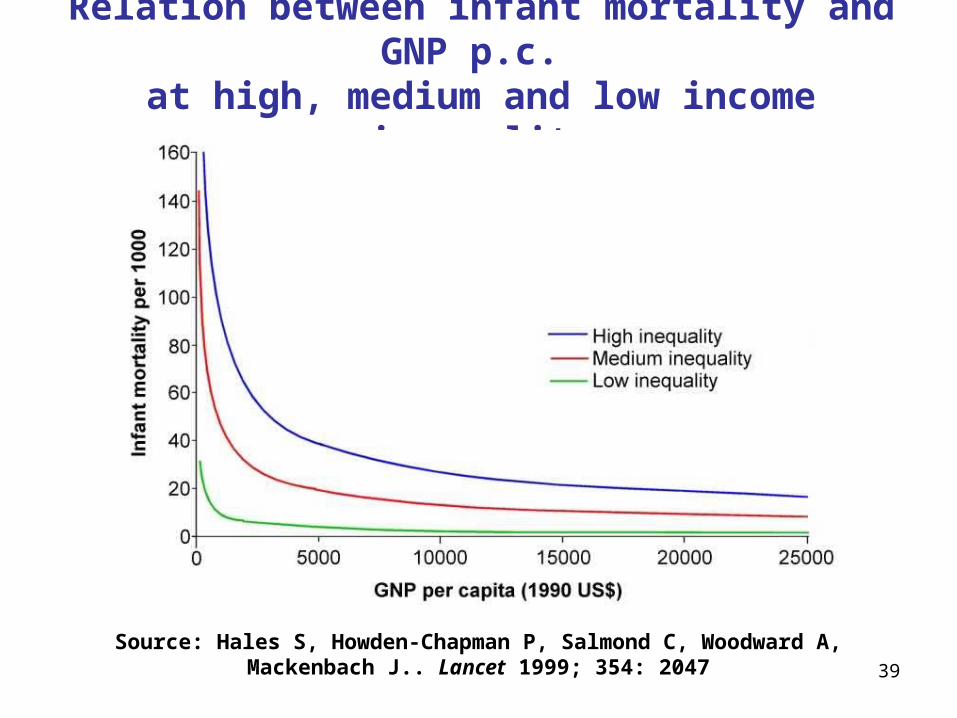
Relation between infant mortality and GNP p.c. at high, medium and low income inequality
Source: Hales S, Howden-Chapman P, Salmond C, Woodward A, Mackenbach J.. Lancet 1999; 354: 2047

40Source: Bagehot, On equality. The Economist, 19th August 2010

41
Causality?
• Not a big causal leap: - problems related to social status get worse when status differences increase
• Problems move together - a common cause
• Reverse causality?
• Many of the causal pathways are known

42
Trends in income inequality 1979-2005/6 (Gini coefficient, Great Britain.)
Brewer M, Goodman A, Muriel A, Sibieta L. Poverty and Inequality in the UK: 2007. Institute of Fiscal Studies, London.